Innovation and financial liberalization James B. Ang ⇑ Division of Economics, Nanyang Technological University, Singapore article info Article history: Received 19 September 2013 Accepted 8 July 2014 Available online 18 July 2014 JEL classification: O30 O40 O53 Keywords: Financial liberalization Schumpeterian growth Innovative activity abstract This paper attempts to shed some light on the role of financial sector policies in generating new knowledge, drawing on the experience of one of the fastest growing and largest developing countries. Using time series data for India over the period 1963–2005, the results indicate that interest rate restraints help generate ideas. Other financial repressionist policies, in the form of high reserve and liquidity requirements, as well as significant directed credit controls, appear to have a dampening effect on ideas production. These results lend some support to the argument that some form of financial sector reforms may help stimulate economic growth via increasing technological innovation. Ó 2014 Elsevier B.V. All rights reserved. 1. Introduction The importance of finance in the process of technological inno- vation can be traced to the early work of Schumpeter (1911), who argues that adequate credit is required to facilitate the widespread adoption of new technologies. Hence, the availability of financial instruments, services and institutions is closely related to the course of technological change. Recent developments in the theo- retical growth literature have continued to emphasize the impor- tance of finance in explaining innovative growth. In the models developed by Blackburn and Hung (1998), Aghion et al. (2005) and Aghion and Howitt (2009), the relationship between finance and growth is analyzed in the context of innovation-based growth models. These models predict that financial restrictions lead to higher monitoring costs or lower costs of hiding successful inven- tions. Financial reforms remove these restrictions and therefore tend to stimulate innovative production. However, despite the important role of finance in facilitating the diffusion of new technologies and in the generation of new ideas, as illustrated by the theoretical contributions of the studies cited above, the issue of what kind of financial policies contribute to ideas production has not yet received much attention. The objective of this paper is to fill this gap in the literature by providing an empirical assessment of the influence of various financial sector policies on the generation of new ideas with a case study of a large developing country. While the literature tends to focus on the overall financial liberalization (see, e.g., Levine, 2001; Hermes and Lensink, 2008; Ang, 2010d, 2011a, 2011b; Demetriades et al., 2013), a more satisfactory approach to assess- ing the effect of financial reforms would explicitly account for each component of the reform program. This would provide a more complete analysis of the costs and benefits associated with finan- cial repression and liberalization. This study is more closely related to Ang (2010b) who examines the long-run impact of financial reforms, financial deepening and intellectual property protection on the accumulation of knowledge (or the stock of ideas) in India. His findings suggest that better pat- ent protection is associated with higher knowledge accumulation. Moreover, while financial deepening facilitates the accumulation of ideas, the implementation of a series of financial liberalization policies is found to have a non-linear effect, implying that financial liberalization will exert a beneficial impact on technological deep- ening only if the financial system is adequately liberalized. The above study, however, does not consider how each component of the reform or repressionist program affects knowledge. Given that the overall effectiveness of the entire reform program would depend on each policy type, analysis performed at the disaggregat- ed level is more satisfactory as it helps identify an appropriate mix of financial liberalization and repressionist policies that is effective at stimulating ideas production. http://dx.doi.org/10.1016/j.jbankfin.2014.07.007 0378-4266/Ó 2014 Elsevier B.V. All rights reserved. ⇑ Address: Division of Economics, School of Humanities & Social Sciences, Nanyang Technological University, 14 Nanyang Drive, Singapore 637332, Singapore. Tel.: +65 65927534. E-mail address: [email protected] Journal of Banking & Finance 47 (2014) 214–229 Contents lists available at ScienceDirect Journal of Banking & Finance journal homepage: www.elsevier.com/locate/jbf

Welcome message from author
This document is posted to help you gain knowledge. Please leave a comment to let me know what you think about it! Share it to your friends and learn new things together.
Transcript
Journal of Banking & Finance 47 (2014) 214–229
Contents lists available at ScienceDirect
Journal of Banking & Finance
journal homepage: www.elsevier .com/locate / jbf
Innovation and financial liberalization
http://dx.doi.org/10.1016/j.jbankfin.2014.07.0070378-4266/� 2014 Elsevier B.V. All rights reserved.
⇑ Address: Division of Economics, School of Humanities & Social Sciences,Nanyang Technological University, 14 Nanyang Drive, Singapore 637332, Singapore.Tel.: +65 65927534.
E-mail address: [email protected]
James B. Ang ⇑Division of Economics, Nanyang Technological University, Singapore
a r t i c l e i n f o
Article history:Received 19 September 2013Accepted 8 July 2014Available online 18 July 2014
JEL classification:O30O40O53
Keywords:Financial liberalizationSchumpeterian growthInnovative activity
a b s t r a c t
This paper attempts to shed some light on the role of financial sector policies in generating newknowledge, drawing on the experience of one of the fastest growing and largest developing countries.Using time series data for India over the period 1963–2005, the results indicate that interest raterestraints help generate ideas. Other financial repressionist policies, in the form of high reserve andliquidity requirements, as well as significant directed credit controls, appear to have a dampening effecton ideas production. These results lend some support to the argument that some form of financial sectorreforms may help stimulate economic growth via increasing technological innovation.
� 2014 Elsevier B.V. All rights reserved.
1. Introduction
The importance of finance in the process of technological inno-vation can be traced to the early work of Schumpeter (1911), whoargues that adequate credit is required to facilitate the widespreadadoption of new technologies. Hence, the availability of financialinstruments, services and institutions is closely related to thecourse of technological change. Recent developments in the theo-retical growth literature have continued to emphasize the impor-tance of finance in explaining innovative growth. In the modelsdeveloped by Blackburn and Hung (1998), Aghion et al. (2005)and Aghion and Howitt (2009), the relationship between financeand growth is analyzed in the context of innovation-based growthmodels. These models predict that financial restrictions lead tohigher monitoring costs or lower costs of hiding successful inven-tions. Financial reforms remove these restrictions and thereforetend to stimulate innovative production.
However, despite the important role of finance in facilitatingthe diffusion of new technologies and in the generation of newideas, as illustrated by the theoretical contributions of the studiescited above, the issue of what kind of financial policies contributeto ideas production has not yet received much attention. Theobjective of this paper is to fill this gap in the literature by
providing an empirical assessment of the influence of variousfinancial sector policies on the generation of new ideas with a casestudy of a large developing country. While the literature tends tofocus on the overall financial liberalization (see, e.g., Levine,2001; Hermes and Lensink, 2008; Ang, 2010d, 2011a, 2011b;Demetriades et al., 2013), a more satisfactory approach to assess-ing the effect of financial reforms would explicitly account for eachcomponent of the reform program. This would provide a morecomplete analysis of the costs and benefits associated with finan-cial repression and liberalization.
This study is more closely related to Ang (2010b) who examinesthe long-run impact of financial reforms, financial deepening andintellectual property protection on the accumulation of knowledge(or the stock of ideas) in India. His findings suggest that better pat-ent protection is associated with higher knowledge accumulation.Moreover, while financial deepening facilitates the accumulationof ideas, the implementation of a series of financial liberalizationpolicies is found to have a non-linear effect, implying that financialliberalization will exert a beneficial impact on technological deep-ening only if the financial system is adequately liberalized. Theabove study, however, does not consider how each component ofthe reform or repressionist program affects knowledge. Given thatthe overall effectiveness of the entire reform program woulddepend on each policy type, analysis performed at the disaggregat-ed level is more satisfactory as it helps identify an appropriate mixof financial liberalization and repressionist policies that is effectiveat stimulating ideas production.
J.B. Ang / Journal of Banking & Finance 47 (2014) 214–229 215
Using annual time series data for more than four decades, thepresent study attempts to address the question of how governmentintervention in the financial system (including interest rate con-trols, directed credit programs and reserve and liquidity require-ments) affects the evolution of knowledge production in India.We focus our analysis on India for several reasons. First, empiricalresearch on endogenous growth models has focused mainly on theU.S. and other OECD countries due to the lack of adequate and reli-able R&D data for developing countries (see, e.g., Ha and Howitt,2007; Ulku, 2007; Venturini, 2012a,b). With some exceptions suchas Ang (2010c) and Madsen et al. (2010b), so far there has been lit-tle case study evidence documented for developing countries.
Second, India provides an ideal ground for further analysis giventhat it has recently emerged as one of the fastest growing develop-ing nations, and has also undergone significant financial sectorreforms. Finally, the availability of long time series data on R&Dgoing as far back as the 1950s provides an added incentive for thisresearch, given that R&D data for developing countries are partic-ularly scant. In this connection, it is worth noting that a majorityof OECD countries have data starting only from 1965. The availabil-ity of a set of sufficiently long time series data allows for a mean-ingful time series investigation. This is important given thateconomic growth is a long-run phenomenon, which necessitatesanalyzing the evolution of the relevant variables over time in orderto relate the findings to policy designs.
The remainder of this paper is organized as follows. The nextsection describes the experience of technological developmentand financial liberalization in India. Section 3 sets out the innova-tion-driven endogenous growth framework. It is augmented totake into consideration the influence of financial sector policiesin producing knowledge. Data and construction of variables arediscussed in Section 4. Section 5 describes the econometric tech-niques employed in this study. The results are presented and ana-lysed in Section 6. Some robustness checks are provided inSection 7, and the last section concludes.
2. Innovative production and financial reforms in India
After achieving independence in 1947, India’s technology policywas focused on acquiring better technology from abroad, pavingthe way for rapid industrial growth over the following few dec-ades. Motivated by the profitability of independent technologicalwork, there was a shift in preference from foreign to indigenoustechnology in the 1960s and 1970s. As a result, inflows of technol-ogy were arranged through licensing that was subject to strict con-trols. MNCs were allowed to participate only in sectors in whichlocal technology was unavailable. Emphasis has been placed onthe effective absorption and adaptation of imported technologythrough the encouragement of more investment in engineeringand in-house R&D activities. This is reflected by the granting ofgenerous fiscal incentives and the establishment of R&D centers,which increased substantially, from 106 in 1973 to 930 in 1986(Sahu, 1998). Science and technology personnel increased mark-edly from about 0.2 million in 1950 to more than 3.8 million in1990. R&D expenditure as a percentage of GDP increased consider-ably from just 0.05% in 1950 to 0.8% in 1990. While these figuresmay seem small compared to some of the OECD countries, theyare nonetheless very impressive for a developing nation. Some lib-eralization efforts in industrial licensing and capital goods importswere initiated in the late 1980s to facilitate inflows of foreign tech-nology. Between 1950 and 1990 over 140,000 foreign collaborationproposals were approved by the government. India’s growing tech-nological capability has subsequently enabled it to become a keyplayer in the generation of industrial technology exports amongthe NICs.
Alongside the technological development, there has also beensignificant growth in the financial sector. The provision of financefor investments in local R&D has significantly enhanced the levelsof absorptive and adaptive capacities in the technological sector,allowing the effective assimilation of foreign technology. The num-ber of scheduled commercial banks rose sharply, thus providingsignificant financial resources to fuel industrial growth. Rapidexpansion in bank branches has also facilitated the mobilizationof savings, contributing to a tremendous increase in intermediaryactivity. In terms of financial policy, the Reserve Bank of India grad-ually imposed more controls over the financial system by introduc-ing interest rate controls in the 1960s. The statutory liquidity ratiowas raised from 25% in 1966 to 38% in 1989, and the cash reserveratio increased considerably from 3% to 15% during the same per-iod. These requirements enabled the Reserve Bank to purchasegovernment securities at low cost. The extent of directed creditprograms has also increased markedly since the nationalizationof the 14 largest private banks in 1969. A number of priority lend-ing rates were set at levels well below those that would prevail inthe free market. This process culminated in the late 1980s whendirected lending was more than 40% of the total.
The major phase of financial liberalization was undertaken in1991 as part of the broader economic reform in response to thebalance of payments crisis of 1990–91. The objective was to redi-rect the entire orientation of India’s financial development strategytowards a more open system in order to provide a greater role formarkets in price determination and resource allocation. Conse-quently, interest rates were gradually liberalized and reserve andliquidity ratios were significantly reduced. The industrial licensingrequirements that restricted entry and expansion of both domesticand foreign firms were relaxed in the same year. The equity marketwas formally liberalized in 1992, allowing foreign investors toaccess the domestic equity market directly. The formerly restric-tive capital account regime has also become more open. The regu-latory framework was also significantly strengthened. In addition,entry restrictions were reduced in 1993, resulting in the establish-ment of more private and foreign banks. Regulations on portfolioand direct investment have since been eased. The exchange ratewas unified in 1993 and most restrictions on current accounttransactions were eliminated in 1994.
These liberalization measures have significantly reducedrestrictions in the financial system. Increased access to credit hasencouraged more investment in education, providing a large poolof scientific and technical personnel to the technological sector.Since liberalization, R&D personnel have grown by more than two-fold over the period 1991–2005. The transfer of technology hasbeen greatly facilitated in recent years following India’s accessionto the WTO, where minimum standards of patent protection aremandated by the Agreement on Trade Related Aspects of Intellec-tual Property Rights (TRIPS) that came into force in 1995.
3. Analytical framework
3.1. The R&D-based endogenous growth models
In this section, we present the analytical framework underlyingour modeling strategy. Assuming a standard neoclassical produc-tion function with constant returns, we can write the aggregateoutput at time t, Yt, as:
Yt ¼ Atf ðKt; LtÞ ð1Þ
where At is the stock of knowledge or ideas, Kt is the capital stockand Lt is the number of workers. The R&D-based endogenousgrowth literature (see, e.g., Romer, 1990) suggests that the rate of

216 J.B. Ang / Journal of Banking & Finance 47 (2014) 214–229
ideas production (gA) depends on the growth rate of the R&D stockof knowledge:
gA ¼_At
At¼ q
_SKt
SKtð2Þ
where SKt is the stock of R&D knowledge. For low rates of depreci-ation of the R&D stock of knowledge, we can write Eq. (2) as:
_At ¼ vAtXQ
� �t
ð3Þ
where Xt is R&D input and Qt is product variety or the number ofproduct lines. The ratio, (X/Q)t, is commonly referred to as researchintensity. R&D input is divided by product variety since the effec-tiveness of R&D is diluted due to the proliferation of products whenan economy expands (see, e.g., Howitt, 1999; Ha and Howitt, 2007;Madsen et al., 2010a; Ang and Madsen, 2011; Madsen and Ang,2014). In the literature it is common to relate product variety tothe labor force. For example, the fully-endogenous model ofAghion and Howitt (1998) predicts that product variety is propor-tional to the labor force in the long run due to the fact that a largerlabor force allows more people to enter an industry with a newproduct. This results in more horizontal innovations, diluting thebeneficial effect of R&D input.
3.2. Financial sector policies and knowledge production
McKinnon (1973) and Shaw (1973) noted that financial repres-sion was largely accountable for the poor economic performanceof developing countries in the 1960s, where low saving and creditrationing were widely observed. Investment suffered both in termsof quantity and quality as funds were allocated at the discretion ofpolicy makers. They challenged the financial repression ideologyand provided a new paradigm in the design of financial sector pol-icies. Their theories proposed that distortions in the financial sys-tem, such as loans issued at artificially low interest rates, directedcredit programs and high reserve requirements would reduce sav-ing, retard capital accumulation and prevent efficient resource allo-cation. The elimination of these distortions would significantlydeepen financial systems and therefore foster economic growth.
Recent developments in the theories of endogenous growth thatconsider financial factors are in agreement with the McKinnon-Shaw financial liberalization thesis. Financial sector reforms facili-tate ideas production for a number of reasons. Using a productvariety model, Blackburn and Hung (1998) propose that firms haveincentives to hide successful R&D projects to avoid repaying theirloans. Such a problem of moral hazard gives rise to the enforce-ment of incentive-compatible loan contracts through costly moni-toring systems. In their model, financial liberalization allowsfinancial intermediaries to diversify among a large number of pro-jects, thus significantly reducing delegation costs. The lower costsof monitoring spur technological development and ideas produc-tion (see also Aghion and Howitt, 2009). More recently, in the inno-vation-based growth model developed by Aghion et al. (2005), it isalso argued that firms can conceal the results of successful innova-tions and thereby avoid repaying their creditors. A low degree ofcreditor protection, which is often associated with financial repres-sion, makes fraud an inexpensive option, thus retarding the pro-duction of new ideas. In contrast, financial liberalization tends toincrease the hiding costs by providing better laws and institutions,thus encouraging innovative entrepreneurs to produce and patentmore new ideas.
However, some counter arguments suggest that financialreforms may not necessarily lead to higher ideas production. Forinstance, the neostructuralist contributions of van Wijnbergen(1982) and Taylor (1983) suggest that the impact of lower taxation
on financial systems may reduce the flow of credit to the privatesector. Since the formal financial systems are subject to reserverequirements, which involve a leakage in the intermediation pro-cess, the neostructuralists argue that curb (unorganized) marketsperform more efficiently in intermediating savers and investors.A rise in bank deposit rates following financial liberalizationinduces households to substitute curb market loans for bankdeposits, resulting in a fall in the supply of loanable funds. Thus,in the presence of efficient curb markets, removing interest raterestraints tends to discourage lending to the private sector, therebyresulting in a lower level of ideas production.
Stiglitz (1994) also argues that interest rate restraints may leadto higher financial saving when good governance is present infinancial systems. When depositors perceive restrictions as policiesaimed at enhancing the stability of the financial system, they maywell be more willing to keep their savings in the form of bankdeposits, thereby providing more resources for innovative invest-ment in the absence of perfect capital mobility. Hellmann et al.(1996) show that in a competitive equilibrium, banks have noincentive to attract new customers and deepen market penetrationsince their profit margin on deposits is zero due to intense compe-tition. However, if the government imposed a deposit rate ceiling,banks can make positive returns and therefore have an incentive toattract more depositors, as long as the market is not fully pene-trated. This reasoning suggests that deposit rate controls caninduce banks to spend more resources on attracting deposits, thusenabling more ideas to be produced. Moreover, using a dynamicstochastic oligopoly model, Stadler (1992) shows that the optimalinnovative output is inversely related to interest rates. This resultis intuitive given that a reduction in interest rate restraints gener-ally results in higher costs of capital, thereby retarding innovativeproduction in the technological sector.
In the case of reserve requirements, Courakis (1984) shows thatunder the condition where the demand for loanable funds is notperfectly inelastic, higher reserve requirements may increase theprofit-maximization deposit rate and hence the volume of loanablefunds. Using a general equilibrium model, Bencivenga and Smith(1992) show that the optimal degree of financial repressiondepends on the size of government deficits. In the presence of largegovernment deficits, it will be desirable to impose higher reserverequirements. Their model also implies that financial liberalizationwill not increase innovative output, since savings in the formal sec-tor translate into lower investment compared to savings in theinformal sector, due to the absence of reserve requirements.
The implementation of directed credit programs generallyinvolves the administered allocation of loans to priority sectors,in India’s case mainly agriculture and small-scale industry (ratherthan the knowledge sector). Without such interventions, banksgenerally will not fund those activities with low returns. Althoughthe McKinnon-Shaw thesis advocates the removal of directedcredit programs since they displace investment projects withpotentially higher returns, Stiglitz and Weiss (1981) show thatfinancial liberalization is unlikely to result in allocative efficiency.This is because, under asymmetric information, banks will practicecredit rationing and be reluctant to raise interest rates in responseto higher demand for loans, due to adverse selection problems.According to Schwarz (1992), directed credit programs may leadto increased investments in the targeted sectors. If more fundsare allocated to the high-tech sector, an economy-wide increasein innovative output will be expected. However, the allocation offunds involving the government in developing countries may besubject to the risk of biased assessments and corruption, and oftenresults in sub-optimal outcomes. Given the above, it appears thatthe impact of each of these financial sector policies on ideas pro-duction is theoretically ambiguous. It is therefore ultimately anempirical issue.

J.B. Ang / Journal of Banking & Finance 47 (2014) 214–229 217
The discussion above also highlights that there are several waysthrough which financial reforms can impact on the production ofnew ideas. In particular, according to the models of Blackburnand Hung (1998), Aghion et al. (2005) and Aghion and Howitt(2009), financial liberalization spurs knowledge creation directlydue to either reduced monitoring costs or increased hiding costs.On the other hand, van Wijnbergen (1982), Taylor (1983) andStiglitz (1994) argue that interest rate controls can have a signifi-cant effect on domestic savings, implying that financial reformscan also affect ideas production indirectly via the channel of sav-ings. In this paper, we will focus on testing the direct effect offinancial reforms on ideas production. However, the indirect effecton knowledge creation through the channel of domestic savingswill also be examined to shed further light on the results.
To test the direct effect of financial reforms on ideas productionwe augment the standard knowledge production function to con-sider the role of finance, so that the empirical relationship betweenknowledge production and financial sector policies can be charac-terized as follows:
ln _At ¼ aþ blnAt þ c ln ðX=QÞt þ d1IRRt þ d2DCPt þ d3RLRt þ et ð4Þ
where _At is the amount of new knowledge or ideas produced, At
measures the stock of knowledge or ideas, (X/Q)t is research inten-sity and et is Gaussian errors. The empirical specification of theknowledge production function in Eq. (4) considers how each typeof financial repressionist policy, namely interest rate restraints(IRRt), directed credit programs (DCPt) and reserve and liquidityrequirements (RLRt), impacts on the production of knowledge inIndia’s economy.1 While both b and c are expected to carry a positivevalue, the expected signs for d’s cannot be determined a priori sincethe impact of each policy type on ideas production is theoreticallyambiguous.
Eq. (4) will be estimated using annual data from 1963 to 2005.Although all data used in this study are available from 1950, wechoose to commence the estimation period from 1963 due to thefact that the financial policy environment in India before 1963was subject to little change. In particular, the cash reserve ratioand the statutory liquidity ratio had remained largely intact at3.5% and 20%, respectively, over the period 1950–1962. Interestrate controls were first imposed by the Reserve Bank of India in1963. The extent of directed credit controls was also negligible,at an average rate of only 2.4% over the same period. In one ofthe robustness checks carried out in Section 7.5, we demonstratethat the main results prevail even if the full sample period wasused.
4. Data and construction of variables
This section describes the data sources, the construction of vari-ables and some measurement issues. The descriptive statistics ofthe key variables used in the paper are presented in Table A1 inthe Appendix A.
4.1. Patent data
As suggested by Kortum (1993), the amount of patenting activ-ity can be used as a proxy for the extent of innovation activity.Hence, we use the number of domestic patents applied for ( _At) asthe measure of the amount of new ideas or knowledge. The domes-tic stock of ideas or knowledge (At) is constructed using the perpet-ual inventory method with a depreciation rate of 10%. Data over
1 The empirical estimates are consistent when interest rate restraints (IRRt)directed credit programs (DCPt) and reserve and liquidity requirements (RLRt) areexpressed in logs.
,
the period 1919–1963 are used to obtain a measure of the initialknowledge stock in 1963. The initial knowledge stock is set equalto the number of patents in 1919 divided by the depreciation rateplus the average growth in patents over the period 1919–1963,which is the steady-state capital stock in standard neoclassicalgrowth models. The patent data are obtained from the World Intel-lectual Property Organization (WIPO). The patent statisticsreported in WIPO are based on information provided by the patentoffices. The data are publicly available over a very large time span.Continuous patent data for India are available annually althoughthere are some missing years for which we interpolate the data.While the WIPO data may be subject to heterogeneity in the differ-ent patent systems, rendering patent counts not comparable acrosscountries, this does not pose any significant issue for case studiessuch as the present one.
The use of patent data as a measure of innovation, however, isnot free from criticism. For instance, as highlighted by Eatonet al. (2004), the data provide no information regarding whetherthe patents filed in different offices reflect the same invention.Moreover, the number of patent applications may changefollowing a radical reform in the patent laws, but this does not nec-essarily translate into a change in innovative production. Otherproblems which have been highlighted in the literature include:only a fraction of invention is patented, patent applications aremade due to strategic reasons, an increase in patent applicationsis associated with the advent of computerized search, and thesteady increase in patent counts reflects additional modificationsbuilt on existing innovations rather than new independent inven-tions. Thus, it appears that patent counts are, at best, a noisy indi-cator for innovative production. Nevertheless, in the absence of aperfect indicator, patent statistics remain one of the most com-monly used measures of inventive output, As Griliches (1990)notes, despite all the difficulties associated with the use of patentdata, they remain an important source for the analysis of the pro-cess of innovation.
4.2. Measures of R&D activity
R&D labor (Nt) is used as the measure for R&D input (Xt). Itrefers to the number of scientists and technicians engaged inR&D activity. The data are collected from various publications of‘‘R&D Statistics’’ by the Department of Science and Technologyand Planning Commission, Government of India. Some missingdata between years are interpolated. Product variety (Qt) is mea-sured by number of workers (Lt) due to the prediction of thefully-endogenous model of Aghion and Howitt (1998) that productvariety is proportional to the labor force in the long run. Someadjustments for the measure of product variety is necessary, giventhat there is a tendency for decreasing returns to R&D due to theincreasing complexity of innovations (Ha and Howitt, 2007). Thus,we also consider the following three additional measures ofresearch intensity: Nt/htLt, Nt/atLt and Nt/athtLt, where at is total fac-tor productivity and ht is an index of human capital. These addi-tional measures therefore account for productivity or humancapital adjustments or both.
Total factor productivity (at) is computed as Yt=Kpt L1�p
t . We usegross domestic product at constant prices as the measure of realoutput (Yt). Real capital stock (Kt) is computed using the perpetualinventory method. A depreciation rate of 10% and the growth rateof gross capital formation at constant prices during the sample per-iod 1963–2005 are used to obtain the initial stock for the year1963. Following the established practice in the literature, capital’sshare of income (p) is assumed to be 0.3. These data are obtaineddirectly from the National Accounts Statistics published by theGovernment of India. Data for number of workers (Lt) are compiledfrom the Penn World Table. Human capital (ht) is computed using
218 J.B. Ang / Journal of Banking & Finance 47 (2014) 214–229
the Mincerian approach, i.e., ht ¼ ehst . The data for average years ofschooling for the population over 25 years old (st) are taken fromthe Barro-Lee data set. h is set to 0.048, following the estimate ofPsacharopoulos (1994) for India.
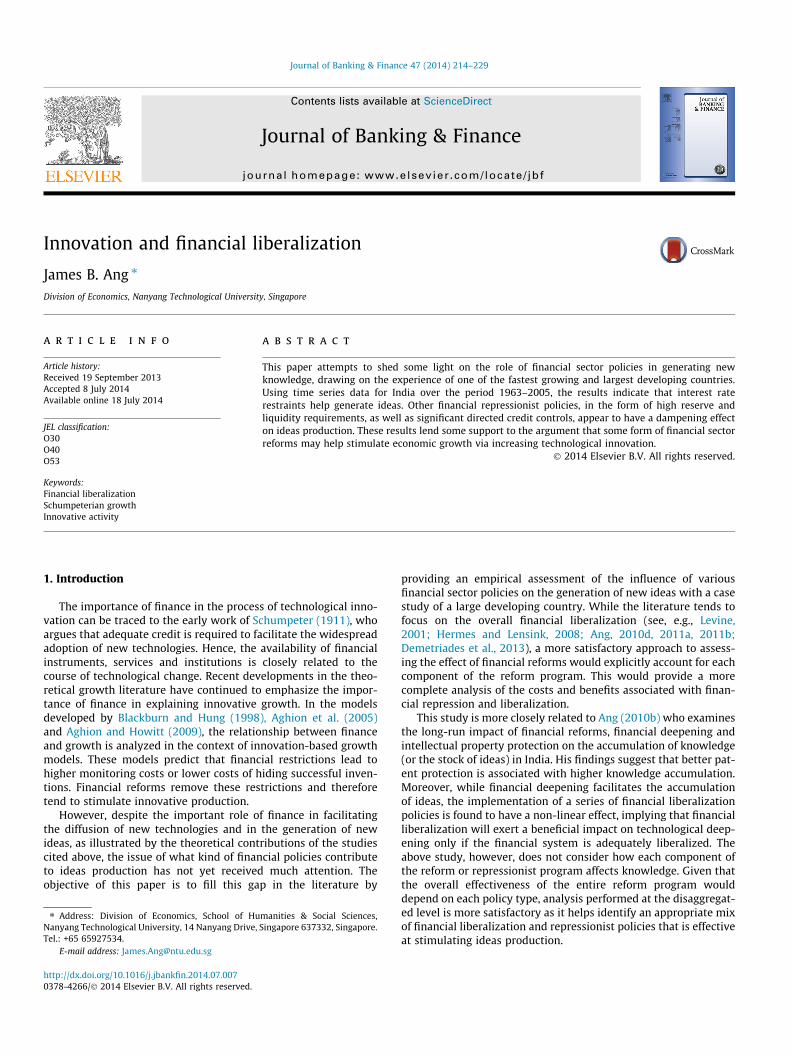
Fig. 1 shows the number of patents filed by domestic residentsin India over the period 1963–2005. While patenting activityincreased rapidly in the 1960s, there was little variation in theamount of inventive output recorded over the next two decades.However, it is evident that the number of patents filed hasincreased significantly since the early 1990s, coinciding with thelaunch of a series of financial liberalization programs.
4.3. Measures of financial sector policies
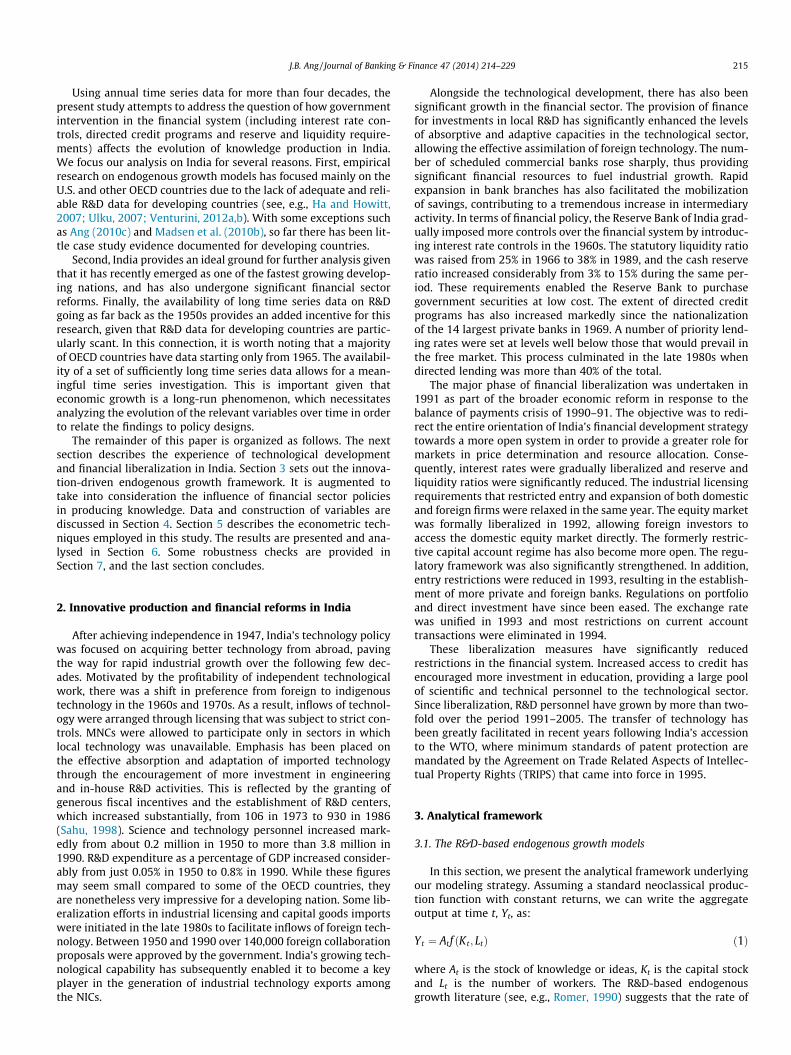
As illustrated in Eq. (4), we consider three types of financial sec-tor policies: (1) interest rate restraints; (2) directed credit pro-grams; and (3) reserve and liquidity requirements. Thesefinancial policy measures are directly obtained or compiled fromthe Annual Report and the Report on Currency and Finance of theReserve Bank of India. To provide a measure of the interest raterestraints (IRRt), we collect six interest rate repressionist policiesimposed on the Indian financial system. These include a fixeddeposit rate, a deposit rate ceiling, a deposit rate floor, a fixed lend-ing rate, a lending rate ceiling and a lending rate floor. An overallsummary measure of interest rate restraints is obtained usingthe method of principal component analysis by considering thefirst three principal components for which their eigenvalues aregreater than one. They can jointly account for 85% of the totalvariation.
The resulting index is presented in Fig. 2. The financial systemin India prior to 1963 was quite liberal, since no interest rate
2.8
3.0
3.2
3.4
3.6
3.8
4.0
1963 1966 1969 1972 1975 1978 1981 198
Logs
Fig. 1. Number of patents filed by domestic residents (ln _At). Notes: The diagram reflectperiod 1963–2005 (in logarithmic scales). The data source is World Intellectual Propert
0.0
0.5
1.0
1.5
2.0
2.5
3.0
1963 1966 1969 1972 1975 1978 1981 198
Index (2005 = 1)
Fig. 2. Index of interest rate restraints (IRRt). Notes: The summary index of interesteigenvalues > 1) of the following six interest rate policy dummies: a fixed deposit rate, a da lending rate floor. The data are rescaled using 2005 as the base year (2005 = 1). The soBank of India.
controls were imposed during that period. The first restrictionwas introduced in 1963 in the form of a maximum lending rate.After this, the index follows an upward trend reaching a peak dur-ing the period 1975–1980. In the early 1980s, it moves down-wards, following the introduction of some deregulationmeasures, before bouncing back again in 1987. 1988 saw anotherpeak, coinciding with the imposition of various interest rate con-trols. A major reform in interest rate policy occurred in the early1990s when the Reserve Bank allowed banks to determine theirown interest rates. In recent years, the extent of interest raterestraints was further moderated, towards the level of the late1960s, and has remained fairly stable since then.
Unlike Malaysia, for which the priority sector target lendingrates are directly available (see Ang and McKibbin, 2007), Indiahas no direct de jure measure of directed credit programs (DCPt).Therefore, we use a de facto measure, which involves measuringthe share of actual directed credit in total non-food credit extendedby large commercial banks. Fig. 3 shows that the Reserve Bank pro-gressively imposed more directed credit controls over the financialsystem from the early 1960s, providing subsidized credit to certainpriority sectors, mainly agriculture and small-scale manufacturing.The extent of these programs reached its peak in the late 1980s.Although efforts were made to reduce directed credit controls fol-lowing liberalization, it is evident that significant restrictions stillremain in place.
The measure for reserve and liquidity requirements (RLRt) isgiven by the sum of the cash reserve ratio and the statutory liquid-ity ratio. The former requires banks to hold part of their deposits inthe form of cash balances at the Reserve Bank, whereas the latterimposes a requirement for banks to keep a share of their assetsin government securities at below-market interest rates. Fig. 4
4 1987 1990 1993 1996 1999 2002 2005
s the number of patents applications filed by domestic residents in India over they Organization (WIPO).
4 1987 1990 1993 1996 1999 2002 2005
rate restraints is constructed using the first three principal components (witheposit rate ceiling, a deposit rate floor, a fixed lending rate, a lending rate ceiling andurces are the Annual Report and the Report on Currency and Finance of the Reserve

0.0
0.1
0.2
0.3
0.4
0.5
1963 1966 1969 1972 1975 1978 1981 1984 1987 1990 1993 1996 1999 2002 2005
Ratio
Fig. 3. Directed credit programs (DCPt). Notes: The extent of directed credit programs is measured by the ratio of actual directed credit (priority loans to agriculture, small-scale industries, and other sectors) to total non-food credit of scheduled commercial banks. The sources are the Annual Report and the Report on Currency and Finance of theReserve Bank of India.
0.0
0.1
0.2
0.3
0.4
0.5
0.6
1963 1968 1973 1978 1983 1988 1993 1998 2003
cash reserve ratio
reserve & liquidity requirements
statutory liquidity ratio
Ratio
Fig. 4. Reserve and liquidity requirements (RLRt). Notes: The measure of reserve and liquidity requirements is given by the sum of the cash reserve ratio (requirements forbanks to hold part of their deposits in the form of cash balances at the Reserve Bank) and the statutory liquidity ratio (the requirement for banks to keep a share of their assetsin government securities at below-market interest rates). The sources are the Annual Report and the Report on Currency and Finance of the Reserve Bank of India.
J.B. Ang / Journal of Banking & Finance 47 (2014) 214–229 219
shows how reserve and liquidity requirements have evolved overtime. Historically, the cash reserve ratio was kept low, at 3% duringthe 1960s. The ratio was gradually raised to 15% in 1990 toincrease cash balances. Similarly, the statutory liquidity require-ment was raised from 20% in the early 1960s to 38.5% in 1990,enabling the government to obtain cheap finance. Both require-ments have fallen significantly following the liberalization initi-ated in 1991. Currently, the cash reserve ratio and statutoryliquidity requirement stand at 5% and 25% of bank deposits,respectively.
5. Estimation techniques
The dynamic adjustment of the ideas generation process can becharacterized by a conditional error-correction model (ECM),which can be used to test for the existence of a long-run relation-ship using the ARDL (Autoregressive Distributed Lag) bounds testdeveloped by Pesaran et al. (2001) and the ECM (error-correctionmodel) test of Banerjee et al. (1998). The former involves a stan-dard F-test whereas the latter is a simple t-test. Accordingly, theunderlying error-correction model can be formulated as:
Dln _At ¼ a0 þ b0ln _At�1 þXk
j¼1
bjDETj;t�1 þXp
i¼1
c0iDln _At�i
þXp
i¼0
Xk
j¼1
cjiDDETj;t�1 þ et ð5Þ
where _At is the number of patents applied for by domestic residentsand DETt is a vector of the determinants of ideas production, whichincludes lnAt, ln(X/Q)t, IRRt, DCPt and RLRt .
The above can be estimated by OLS. Pesaran and Shin (1998)show that the OLS estimators of the short-run parameters are
consistent and the ARDL-based estimators of the long-run coeffi-cients are super-consistent in small sample sizes. Hence, validinferences on the long-run parameters can be made using standardnormal asymptotic theory. The main advantage of this approach isthat it can be applied to the model regardless of whether theunderlying variables are I(0) or I(1).
Specifically, two separate statistics are employed to test for theexistence of a long-run relationship in Eq. (5): (1) an F-test for thejoint significance of coefficients of lagged levels terms of the condi-tional ECM (H0:b0 = b1 = � � � = bk = 0), and (2) a t-test for the signifi-cance of the coefficient associated with ln _At�1 (H0:b0 = 0). The testfor cointegration is provided by two asymptotic critical valuebounds when the independent variables are either I(0) or I(1).The lower bound assumes all the independent variables are I(0),and the upper bound assumes they are I(1). If the test statisticsexceed their respective upper critical values, the null is rejectedand we can conclude that a long-run relationship exists. The aboveconditional ECM can be re-parameterized to yield an Autoregres-sive Distributed Lag model, which provides a convenient step toderive the long-run estimates and short-run dynamics for the ideasproduction function (see Pesaran and Shin (1998) for discussion).
6. Empirical results
6.1. Integration and cointegration analyses
We employ three unit root tests to assess the order of integrationof the underlying variables – the Augmented Dickey–Fuller (ADF),Phillips–Perron (PP), and Kwiatkowiski–Phillips–Schmidt–Shin(KPSS) tests. The ADF and PP test the null of a unit root against thealternative of stationarity whereas the KPSS tests the null ofstationarity against the alternative of a unit root. The results, which

220 J.B. Ang / Journal of Banking & Finance 47 (2014) 214–229
are not reported here to conserve space but are available uponrequest, show that all variables appear to be either stationary, i.e.I(0), or integrated at order one, i.e., I(1). Given that none of the vari-ables appears to be integrated at an order higher than one, thisallows legitimate use of the cointegration procedures proposedabove.
The cointegration tests on the knowledge production equationare performed by regressing the conditional error-correctionmodel in Eq. (5). To ascertain the existence of a level relationshipbetween the variables, this requires satisfying both the F- andthe t-tests. Table 1 gives the F-statistics for the ARDL bounds tests,t-statistics for the ECM test, model selection criteria AIC and SBC,and several diagnostic test statistics for the model up to two lags.The table contains four columns, where each column correspondsto the estimation results using different measures of researchintensity, (X/Q)t .
The results indicate that the null hypothesis of no level knowl-edge production equation is rejected at the 5% significance level inmost cases, irrespective of the lag length and measures of researchintensity chosen. This provides strong support for the existence ofa long-run relationship between knowledge production and itsdeterminants. No evidence of cointegration is found when othervariables are used as the dependent variables, suggesting that thesevariables can be interpreted as long-run forcing variables explainingln _At . Except for two cases for which some evidence of non-normalityis detected, we do not find any evidence of serial correlation, autore-gressive conditional heteroskedasticity, or functional misspecifica-tion at the conventional significance levels, when the lag length ischosen to be two across all models. However, the choice of a moreparsimonious dynamic structure of one lag leads to some problemsof serial correlations. We will therefore choose a richer dynamicstructure of two lags for the remaining analyses, as also suggestedby the Akaike information criterion.
6.2. Long-run estimates and short-run dynamics
Table 2 presents the results for the knowledge productionmodel estimated using the ARDL procedure. It is evident that the
Table 1Cointegration tests (1963–2005).
Model A Model B(X/Q)t = (N/L)t (X/Q)t = (
p = 1 p = 2 p = 1
ARDL bounds test Pesaran et al. (2001) 4.468** 4.226** 4.584*
ECM test Banerjee et al. (1998) �4.805*** �3.557 �4.845*
Akaike information criterion (AIC) �4.004 �4.284 �4.015Schwarz Bayesian criterion (SBC) �3.252 �3.270 �3.263NORMAL 1.175 9.462*** 1.171
(0.555) (0.008) (0.556)SERIAL(1) 7.595** 0.231 7.922*
(0.012) (0.637) (0.011)SERIAL(2) 3.721** 0.605 3.872*
(0.041) (0.559) (0.037)ARCH 0.003 0.323 0.002
(0.959) (0.573) (0.961)WHITE 0.657 0.248 0.639
(0.811) (0.998) (0.825)
Notes: (X/Q) is research intensity where X refers to R&D input and Q refers to product varieby the number of workers (L). Product variety is adjusted for total factor productivity (a)more complex over time. p is the lag length. The test statistics of the cointegration teestimation allows for an unrestricted intercept and no trend. The 10%, 5% and 1% criticalt-test are (�2.57, �3.86), (�2.86, �4.19) and (�3.43, �4.79), respectively. NORMAL refersare Breusch-Godfrey LM test statistics for no first and second-order serial relationshipheteroskedasticity, and WHITE denotes the White’s test statistic to test for homoskedas
** Indicates 5% levels of significance.*** Indicates 1% levels of significance.
stock of knowledge enters the long-run knowledge productionequation significantly at the 1% level with the expected sign. Spe-cifically, the coefficients of the stock of knowledge variables arefound to be in the range of 0.788–0.981. The measures of researchintensity are found to have an economically and statistically signif-icant effect on knowledge production. The effect is found to begreatest when the labor force is adjusted for productive efficiency.
Interestingly, financial sector policies appear to have mixedeffects on knowledge creation. In particular, an increase in interestrate restraints is found to have a significant positive impact oninnovative production. The coefficients do not differ widely acrossmodels, ranging only from 0.028 to 0.038. With regard to directedcredit programs, our results suggest that an increase in the extentof directed credit controls tends to discourage innovative produc-tion, although the effect of directed credit programs is found tobe statistically significant only in Models C and D. The estimatesare found to be �0.609 and �0.645, respectively. Finally, theresults also suggest that higher reserve and liquidity requirementstend to discourage knowledge production, with negative long-runestimates in the range of 0.477–0.524. This effect is found to be sig-nificant at least at the 5% level across all models.
Turning to the short-run dynamics, the regression results forthe conditional ECM of Dln _At reported in panel II of Table 2 showseveral important features. In particular, most coefficients are sta-tistically significant at the conventional levels, although the statis-tical correlations between the long-run variables are somewhatstronger. In first-differenced form, all coefficients have signs con-sistent with the long-run estimates. The short-run coefficients ofresearch intensity are consistently insignificant, and therefore thisvariable is dropped from the estimations. Interestingly, except forthe coefficients of Dln _At , all coefficients have magnitudes (in abso-lute terms) smaller than their long-run counterparts, suggestingthat knowledge creation in the long run depends more criticallyon research intensity and financial sector policies. Furthermore,the coefficients of ECTt-1 (error-correction term), which measurethe speed of adjustment back to the long-run equilibrium value,are statistically significant at the 1% level and are correctly signed,i.e., negative. This implies that an error-correction mechanism
Model C Model DN/hL)t (X/Q)t = (N/aL)t (X/Q)t = (N/ahL)t
p = 2 p = 1 p = 2 p = 1 p = 2
* 4.416** 5.126*** 5.601*** 5.417*** 6.298***
** �3.641 �4.893*** �4.265** �4.995*** �4.529**
�4.306 �4.031 �4.328 �4.062 �4.406�3.293 �3.279 �3.315 �3.310 �3.39210.161*** 0.889 1.476 1.112 2.393(0.006) (0.640) (0.477) (0.573) (0.302)
* 0.249 10.865*** 0.389 12.724*** 0.709(0.624) (0.003) (0.541) (0.002) (0.412)
* 0.612 5.235** 1.076 6.128*** 1.300(0.556) (0.014) (0.367) (0.008) (0.303)0.309 0.121 0.029 0.113 0.055
(0.581) (0.729) (0.865) (0.737) (0.814)0.243 0.555 0.233 0.486 0.234
(0.998) (0.891) (0.999) (0.934) (0.999)
ty. R&D input is measured using R&D labor (N) whereas product variety is measuredand human capital (h) to account for the fact that innovations become increasingly
sts are compared against the critical values reported in Pesaran et al. (2001). Thevalue bounds for the F-test are (2.26, 3.35), (2.62, 3.79) and (3.41, 4.68), and for theto the Jarque–Bera statistic of the test for normal residuals, SERIAL(1) and SERIAL(2), respectively, ARCH is the Engle’s test statistic for no autoregressive conditional
tic errors. Numbers in parentheses indicate p-values.

Table 2ARDL estimates of the augmented knowledge production function (1963–2005).
Model A (X/Q)t = (N/L)t Model B (X/Q)t = (N/hL)t Model C (X/Q)t = (N/aL)t Model D (X/Q)t = (N/ahL)t
Coeff. p-value Coeff. p-value Coeff. p-value Coeff. p-value
I. The long-run relationship ðDep:Var: ¼ ln _At)Intercept 0.491 0.476 0.497 0.463 �0.495 0.276 �0.499 0.255lnAt 0.788*** 0.000 0.797*** 0.000 0.962*** 0.000 0.981*** 0.000ln(X/Q)t 0.133*** 0.000 0.145*** 0.000 0.223*** 0.000 0.251*** 0.000IRRt 0.038*** 0.007 0.037*** 0.007 0.030*** 0.003 0.028*** 0.005DCPt �0.081 0.593 �0.093 0.531 �0.609*** 0.000 �0.645*** 0.000RLRt �0.477** 0.022 �0.487** 0.018 �0.524*** 0.001 �0.503*** 0.001
II. The short�run dynamics (Dep:Var: ¼ Dln _At)Intercept 0.008 0.177 0.008 0.178 0.007 0.302 0.007 0.306ECTt-1 �0.839*** 0.000 �0.845*** 0.000 �0.942*** 0.000 �0.948*** 0.000DlnAt 5.631*** 0.000 5.628*** 0.000 5.303*** 0.000 5.314*** 0.000DIRRt 0.023* 0.086 0.022* 0.091 0.009 0.544 0.006 0.658DDCPt �0.082 0.588 �0.090 0.549 �0.292* 0.089 �0.308* 0.075DRLRt �0.399* 0.070 �0.393* 0.072 �0.153 0.526 �0.108 0.657
III. Diagnostic checksTest-stat. p-value Test-stat. p-value Test-stat. p-value Test-stat. p-value
NORMAL 0.961 0.617 1.053 0.591 2.291 0.317 2.105 0.349SERIAL(1) 0.431 0.515 0.479 0.493 0.303 0.585 0.186 0.668SERIAL(2) 0.546 0.583 0.517 0.601 0.147 0.863 0.128 0.880ARCH 0.001 0.983 0.002 0.963 1.232 0.273 1.749 0.193WHITE 1.511 0.211 1.509 0.211 0.575 0.718 0.561 0.728
Notes: ARDL stands for Autoregressive Distributed Lag. (X/Q) is research intensity where X refers to R&D input and Q refers to product variety. R&D input is measured usingR&D labor (N), whereas product variety is measured by the number of workers (L). Product variety is adjusted for total factor productivity (a) and human capital (h) to accountfor the fact that innovations become increasingly more complex over time. A maximum lag length of two was used, following the results of the cointegration tests. Theoptimal lag structure for the resulting ARDL model was chosen using the Akaike information criterion. NORMAL refers to the Jarque–Bera statistic of the test for normalresiduals, SERIAL(1) and SERIAL(2) are Breusch-Godfrey LM test statistics for no first and second-order serial relationship, respectively, ARCH is the Engle’s test statistic for noautoregressive conditional heteroskedasticity, and WHITE denotes the White’s test statistic to test for homoskedastic errors. Numbers in parentheses indicate p-values.
* Indicates 10% levels of significance.** Indicates 5% levels of significance.
*** Indicates 1% levels of significance.
2 The results are consistent if interest rate restraints were measured using the firsprincipal component of the deposit rate policy dummies, namely a fixed deposit ratea deposit rate ceiling, and a deposit rate floor.
J.B. Ang / Journal of Banking & Finance 47 (2014) 214–229 221
exists so that the deviation from long-run equilibrium has a signif-icant impact on the growth rate of ideas production. The resultsfurther support the finding of a cointegrated relationship betweenthe variables reported earlier in Table 1.
Overall, our results highlight the importance of reducing theextent of directed credit controls as well as reserve and liquidityrequirements in order to facilitate knowledge production. How-ever, financial restraint in the form of interest rate controls appearsto be an effective device enabling entrepreneurs to obtain externalfinance and initiate knowledge creation. The results thereforehighlight the importance of considering each component of finan-cial reforms separately in the analysis of the impact of financial lib-eralization or repression on innovative production.
6.3. Interest rate restraints and savings
The finding that interest rate restraints in India have a positiveeffect on ideas production is intriguing and invites more discus-sion. Although financial restraint, in the form of deposit rate con-trols, can directly encourage innovative production in theindustrial sector of a developing country, it is also plausible thatinterest rate restraints may encourage it indirectly via the channelof savings (see van Wijnbergen, 1982; Taylor, 1983; Stiglitz, 1994).In principle, savings and patenting activity are positively relatedsince greater mobilization of savings increases the total amountof funds available for the generation of innovative output. Theseinsights invite further analysis and therefore an empirical test ofwhether the indirect effect of interest rate restraints on innovationvia savings is operative in India is warranted.
The effect of interest rate restraints on savings is examinedusing both the life cycle model and the permanent income hypoth-esis. The specifications include the share of agricultural output intotal production to account for structural changes that have taken
place in the economy of India. The results reported in columns (1)–(3) of Table 3 show that interest rate restraints exert a positive andsignificant effect on the savings rate. The estimates, however, pro-vide little support for the use of a life cycle framework, given thatthe coefficients of income growth and age dependency are barelysignificant. Estimates based on the permanent income hypothesisreported in columns (4) and (5) give similar findings, that savingsrates respond positively to interest rate controls. However, itshould be highlighted that household savings may be discouragedif bank deposit rates are suppressed to a very low level. On thewhole, our results suggest that interest rate restraints have bothdirect and indirect positive effects on ideas production in India.2
6.4. Further discussion of results
How could the above results be interpreted within the specificcontext of India? Firstly, our results indicate that interest rate con-trols have a positive effect on stimulating ideas production in India.This finding is not surprising given that the deregulation of lendingrates may increase the cost of borrowing and the removal ofdeposit interest floors may discourage savings. The formerincreases the cost of capital for innovative entrepreneurs whereasthe latter reduces the amount of credit available to them. Theextent of interest rate restraints in India rose sharply followingthe direct intervention of the Reserve Bank of India in the settingof interest rates in 1963. Despite these regulations the ratio ofM3 to GDP increased significantly, from 24% to 51%, during the per-iod 1963–1988. This process of saving mobilization was muchquicker than in many other developing countries during the same
t,

Table 3The effect of interest rate restraints on savings rates (1963–2005).
(1) (2) (3) (4) (5)
I. The long-run relationship (Dep.Var. = log(gross domestic savings/GDP))Intercept 3.344 2.929 �3.079 �0.018 �7.621***
(0.493) (0.547) (0.642) (0.997) (0.000)Real GDP growth per capita 0.016 0.020* 0.018*
(0.175) (0.073) (0.066)Age dependency �0.715 �0.604
(0.637) (0.690)Young age dependency �0.035
(0.980)Old age dependency 1.362
(0.259)Real interest rate 0.002
(0.606)Per capita real income 0.073 0.663***
(0.813) (0.000)Agriculture output (% GDP) �0.641 �0.664 �0.387 �0.744
(0.193) (0.178) (0.438) (0.126)Interest rate restraints (IRRt) 0.198*** 0.199*** 0.165*** 0.200*** 0.177***
(0.000) (0.000) (0.000) (0.000) (0.000)
II. Cointegration testsARDL bounds test 3.936** 4.253** 3.923** 4.224* 3.009ECM test �3.705 �3.476 �3.195 �3.295 �2.487
Notes: the dependent variable is the ratio of gross domestic saving to GDP (logs). Young dependents refer to population with ages 0–14 and old age dependents are thepopulation with ages 65 and above. Age dependency refers to the number of young and old depen (X/Q)t = (N/ahL)t dents to the working-age population with ages 15–64. Thereal interest rate is the bank deposit rate minus the rate of inflation. The maximum lag length allowed for is two. Figures in parenthesis are p-values. The test statistics of thecointegration tests are compared against the critical values reported in Pesaran et al. (2001). The estimation allows for an unrestricted intercept and no trend. The criticalvalue bounds for the F-test and t-test vary according to the number of variables included in the estimations. For more details refer to Table CI(iii) (for the F-statistic) andTable CII(iii) (for the t-statistic) of Pesaran et al. (2001).
* Indicates 10% levels of significance.** Indicates 5% levels of significance.
*** Indicates 1% levels of significance.
222 J.B. Ang / Journal of Banking & Finance 47 (2014) 214–229
period, and reflected a high propensity to save and confidence inthe banking system. Given India’s closed capital account regime,high saving mobilization has provided ample domestic resourcesto facilitate inventive production. Moreover, the imposition ofinterest rate ceilings from the 1960s to 1980s ensured that innova-tive entrepreneurs who lacked funding were able to obtain creditat a reasonably low cost. The introduction of these interest ratecontrols also helped stabilizing the financial system, providingmore confidence for innovative firms to invent.
Another implication is that directed credit programs tend toretard ideas production. These findings are highly plausible forIndia.3 Due to the nationalization of banks in 1969, the allocationof credit has been mainly performed by government banks, whichare often less efficient and subject to the risks of biased assessments.There is in fact evidence suggesting that finance in India has beensubject to political interference. For instance, using data for the per-iod 1992–1999, Cole (2009) finds that directed lending by govern-ment-owned banks increases significantly in election years and thesurge is most prominent in highly contested districts. Given thatthe provision of capital to industrial firms for ideas productionmay be rather discretionary, as it depends largely on general politicalobjectives, it is unsurprising that these programs have been found tohave negative or no impact on the amount of innovative output.
Moreover, although the allocation of credit under the directionof the central bank has benefited some farmers and small tradersby allowing them to have adequate access to finance, this mayhave also discouraged household savings and hence reduced fundsavailable for knowledge creation. An important component offinancial liberalization is the easing of priority sector loans.Although the actual share of directed loans in total lending hasremained high in recent years, bank compliance with these targets
3 A previous study by Odedokun (1996), for instance, has also found that directedcredit programs have resulted in inefficient allocation of resources in developingcountries.
reduced sharply after financial liberalization, following a change inthe priority sector definition to include many other activities. As aresult, most banks have avoided lending to innovative entrepre-neurs who are deemed less creditworthy, thereby depriving theinnovators of institutional lending for investing in patenting activ-ity. Given that government intervention in credit allocation has notcreated new sources of innovative entrepreneurship, our resultspoint to the importance of eliminating these distortionary policiesso that funds can be allocated efficiently to fuel innovativeproduction.
Finally, our results also suggest that higher reserve and liquidityrequirements have a detrimental effect on knowledge productionin India. High reserve requirements before liberalization have pro-vided the Reserve Bank of India with funds to buy governmentsecurities at low cost, leaving insufficient funds to finance innova-tive projects. However, a significant reduction in the ratios ofreserve and liquidity requirements after the liberalization hasgreatly expanded the amount of loanable funds, which contributedto an economic boom during the 1990s. Therefore, it appears thatlowering these requirements can provide significantly more loan-able funds, enabling the production of more ideas. Consequently,our results support a policy of deregulation in the financial systemby way of reducing reserve and liquidity requirements in order toboost innovative production.
Nevertheless, unrestricted financial liberalization may induceinstability. While financial repression may not be desirable, theevidence presented in this paper does provide some support forthe argument that some form of financial restraint may promoteinnovative production in developing countries. However, as notedby Honohan and Stiglitz (2001), both financial liberalization andfinancial restraint are more likely to work well in environmentswith strong regulatory capacity. Although the legal system in Indiawas originally based on the British model that emphasizes protec-tion of property rights, India ended up with a much less effectiveinstitutional framework since the legal system was modified in a

J.B. Ang / Journal of Banking & Finance 47 (2014) 214–229 223
way that benefited the small number of Europeans that settled inand ran the economy. This highlights the importance of strength-ening the institutional framework so that financial policies canbe effectively implemented to deepen technological development(see, e.g., Law et al., 2013).
7. Robustness
7.1. Diagnostic checks
The results reported in panel III of Table 2 show that the regres-sion specifications fit remarkably well. All models pass the diag-nostic tests against non-normal residuals, serial correlation,heteroskedasticity and autoregressive conditional heteroskedastic-ity. The structural stability of the knowledge production equationis examined using the cumulative sum (CUSUM) tests on the recur-sive residuals. The tests are able to detect systematic changes inthe regression coefficients. The results (not reported) indicate thatthe test statistics lie within the 5% confidence interval bands,
Table 4Alternative single-equation time series estimators (1963–2005).
Dep:Var: ¼ ln _At Model A Model B(X/Q)t = (N/L)t (X/Q)t = (N/hL)t
Coeff. p-value Coeff. p-
I. Fully modified ordinary least squares (FM-OLS)Intercept 1.080 0.206 1.418** 0.0lnAt 0.956*** 0.000 0.948*** 0.0ln(X/Q)t 0.337*** 0.000 0.376*** 0.0IRRt 0.044** 0.025 0.044*** 0.0DCPt �0.305* 0.098 �0.255* 0.0RLRt �2.779*** 0.000 �2.856*** 0.0
II. Fully modified unrestricted error-correction model (FM-UECM)Intercept 0.923*** 0.004 1.023*** 0.0lnAt 0.968*** 0.000 0.979*** 0.0ln(X/Q)t 0.324*** 0.000 0.354*** 0.0IRRt 0.021*** 0.005 0.021*** 0.0DCPt �0.336*** 0.000 �0.346*** 0.0RLRt �2.711*** 0.000 �2.709*** 0.0
III. Dynamic ordinary least squares (DOLS)Intercept 0.602 0.461 0.676 0.3lnAt 0.832*** 0.000 0.841*** 0.0ln(X/Q)t 0.199*** 0.002 0.221*** 0.0IRRt 0.073*** 0.004 0.073*** 0.0DCPt �0.449** 0.018 �0.454** 0.0RLRt �0.792** 0.044 �0.810** 0.0
Notes: (X/Q) is research intensity where X refers to R&D input and Q refers to product varieby the number of workers (L). Product variety is adjusted for total factor productivity (a)more complex over time.
* Indicates 10% levels of significance.** Indicates 5% levels of significance.
*** Indicates 1% levels of significance.
Table 5Alternative estimates based on the vector-error correction model (1963–2005).
Dep:Var: ¼ ln _At Model A Model B(X/Q)t = (N/L)t (X/Q)t = (N/hL)t
Coeff. Std. err. Coeff. Std
lnAt 0.883*** 0.048 0.894*** 0.0ln(X/Q)t 0.214*** 0.027 0.224*** 0.0IRRt 0.038*** 0.012 0.039*** 0.0DCPt �0.706*** 0.120 �0.695*** 0.1RLRt �0.291 0.183 �0.293* 0.1
Notes: (X/Q) is research intensity where X refers to R&D input and Q refers to product varieby the number of workers (L). Product variety is adjusted for total factor productivity (a)more complex over time. An intercept but no deterministic trend is included in the esti
* Indicates 10% levels of significance.*** Indicates 1% levels of significance.
suggesting that there is no structural instability in the residualsof the knowledge production equation.
7.2. Alternative estimators
While the ARDL approach is used to derive the main results, toprovide a sensitivity check we also consider three other single-equation estimators, namely the fully modified ordinary leastsquares (FM-OLS) procedure, the fully modified unrestrictederror-correction model (FM-UECM) estimator and the dynamicordinary least squares (DOLS) procedure. Since our focus is onthe long-run results, the short-run dynamics of each estimatorare not reported here for brevity. In general, these approaches givequite similar results compared to those estimated using the ARDLapproach.
As we can see from Table 4, all variables enter the long-run equa-tion significantly at the conventional levels in most cases. Althoughthe magnitude of the coefficients shows some small variations, thequalitative aspects of the results are, by and large, consistent with
Model C Model D(X/Q)t = (N/aL)t (X/Q)t = (N/ahL)t
value Coeff. p-value Coeff. p-value
36 0.496 0.143 0.234 0.31400 1.077*** 0.000 1.130*** 0.00000 0.452*** 0.000 0.486*** 0.00004 0.025*** 0.001 0.018*** 0.00174 �0.492*** 0.000 �0.591*** 0.00000 �2.694*** 0.000 �2.582*** 0.000
02 �0.104 0.764 �0.288 0.73700 1.122*** 0.000 1.178*** 0.00000 0.419*** 0.000 0.479*** 0.00005 0.001 0.973 0.001 0.95500 �0.591*** 0.000 �0.804*** 0.00000 �2.458*** 0.000 �2.313*** 0.000
89 1.275* 0.094 1.348** 0.04200 0.859*** 0.000 0.895*** 0.00001 0.377*** 0.000 0.442*** 0.00003 0.059*** 0.001 0.056*** 0.00014 �0.565*** 0.002 �0.619*** 0.00333 �0.934*** 0.009 �0.968** 0.042
ty. R&D input is measured using R&D labor (N) whereas product variety is measuredand human capital (h) to account for the fact that innovations become increasingly
Model C Model D(X/Q)t = (N/aL)t (X/Q)t = (N/ahL)t
. err. Coeff. Std. err. Coeff. Std. err.
44 0.875*** 0.042 0.907*** 0.03528 0.220*** 0.046 0.286*** 0.04511 0.034*** 0.010 0.035*** 0.00812 �0.760*** 0.114 �0.777*** 0.09872 0.162 0.175 �0.053 0.149
ty. R&D input is measured using R&D labor (N) whereas product variety is measuredand human capital (h) to account for the fact that innovations become increasingly
mations. The estimations involve two lags.

224 J.B. Ang / Journal of Banking & Finance 47 (2014) 214–229
those obtained using the ARDL estimator. The main theme is that,with very few exceptions, the R&D intensity measures and financialsector policies continue to be highly significant. Hence, we concludethat our main results are insensitive to the choice of estimators.
Given that the approaches considered so far are all single-equa-tion time series techniques, we also consider a dynamic systemapproach that treats all underlying variables as endogenous,namely the vector-error correction model (VECM). The estimatespresented in Table 5 clearly show our results are by and large sim-ilar even if endogeneity is allowed for. It should be noted, however,that while this approach allows for the possibility of reverse cau-sality it does not deal with omitted variable bias, an issue we willaddress in the next sub-section.
Table 6Controlling for the effects of patent protection and technology transfer (1963–2005).
(1) Control forintellectual propertyrights protection
(2) Control for internationalknowledge spillovers
(3) Cocollab
I. The long-run relationship ðDep:Var: ¼ ln _At)Intercept �1.323 �0.211 0.00
(0.215) (0.726) (0.98lnAt 0.983*** 0.874*** 0.85
(0.000) (0.000) (0.00ln(N/L)t 0.093*** 0.125*** 0.13
(0.006) (0.000) (0.00IRRt 0.028* 0.031** 0.04
(0.081) (0.036) (0.00DCPt �0.384* �0.267 �0.27
(0.055) (0.111) (0.06RLRt �0.477** �0.519*** �0.51
(0.010) (0.007) (0.00lnIPRt �0.157*
(0.067)lnSPIt �0.133
(0.325)lnCOLt �0.01
(0.37lnDTFt
II. The short-run dynamics (Dep:Var: ¼ Dln _At)Intercept 0.019*** 0.010* 0.00
(0.002) (0.086) (0.14ECTt-1 �0.881*** �0.893*** �0.88
(0.000) (0.000) (0.00DlnAt 5.719*** 5.550*** 5.57
(0.000) (0.000) (0.00DIRRt 0.007 0.012 0.01
(0.562) (0.358) (0.18DDCPt �0.337** �0.252* �0.28
(0.027) (0.095) (0.04DRLRt �0.398* �0.473** �0.47
(0.056) (0.026) (0.02DlnIPR �0.194
(0.128)DlnSPIt �0.216*
(0.072)DlnCOLt 0.01
(0.29DlnDTFt
III. Cointegration testsARDL bounds test 5.356*** 4.983*** 3.401ECM test �5.562*** �5.184*** �3.75
Notes: (N/L) is research intensity measured using the ratio of R&D workers to the totalspillovers of R&D international stocks (SPIt), the number of technological collaborations wto India’s TFP (DTFt). The maximum lag length allowed for is two. Figures in parenthesiscritical values reported in Pesaran et al. (2001). The estimation allows for an unrestrictcolumns), the 10%, 5% and 1% critical value bounds for the F-test are (2.72, 3.77), (3.23, 4.�4.37), respectively. For the case with nine explanatory variables (the last column), the(2.65, 3.97), and for the t-test are (�2.57, �4.56), (�2.86, �4.88) and (�3.42, �5.54), re
* Indicates 10% levels of significance.** Indicates 5% levels of significance.
*** Indicates 1% levels of significance.
7.3. Control variables
This section addresses the issue regarding whether the previousresults are robust to the inclusion of control variables, especiallythose that may have a crucial effect on inventive production. Thefollowing control variables are considered: intellectual propertyprotection, international knowledge spillovers, technical collabora-tions, and technological gap between India and the global frontier.First, the number of patent applications may be affected by a sig-nificant change in patent laws. A strengthening patent protectionframework may prevent the free flow of ideas and retard techno-logical development. But on the other hand, it may enhance theinnovators’ ability to recoup expensive R&D costs, thereby
ntrol for technicalorations
(4) Control for distance tothe technological frontier
(5) Control for all effects(columns (1) to (4))
8 0.117 �0.1518) (0.892) (0.927)9*** 0.834*** 0.931***
0) (0.000) (0.000)6*** 0.119*** 0.145*
0) (0.000) (0.050)1*** 0.036*** 0.0165) (0.008) (0.370)5* �0.161 �0.472**
2) (0.249) (0.014)1*** �0.549** �0.490**
8) (0.010) (0.021)�0.072(0.634)0.008
(0.966)2 �0.0324) (0.259)
�0.031 �0.121(0.820) (0.448)
8 0.006 �0.281***
7) (0.278) (0.000)6*** �0.881*** �0.933***
0) (0.000) (0.000)9*** 5.617*** 5.505***
0) (0.000) (0.000)6 0.022* �0.0027) (0.099) (0.888)4** �0.157 �0.439***
7) (0.292) (0.004)2** �0.504** �0.425**
2) (0.020) (0.034)0.107
(0.412)�0.154(0.208)
6 0.0136) (0.379)
0.072 0.043(0.566) (0.721)
* 3.307* 2.2938 �4.531** �3.478
labor force. The control variables are intellectual property rights protection (IPRt),ith foreign firms (COLt), and distance to the technological frontier or US’s TFP relativeare p-values. The test statistics of the cointegration tests are compared against the
ed intercept and no trend. In the case with six explanatory variables (the first four35) and (4.29, 5.61), and for the t-test are (�2.57, �3.46), (�2.86, �3.78) and (�3.43,10%, 5% and 1% critical value bounds for the F-test are (1.88, 2.99), (2.14, 3.30) and
spectively.

Table 7Controlling for the effects of other reforms (1963–2005).
(1) Control fortrade reforms
(2) Control forindustrial reforms
(3) Control for otherfinancial deregulations
(4) Control for productmarket reforms
(5) Control for all effects(columns (1) to (4))
I. The long-run relationship ðDep:Var: ¼ ln _At)Intercept �0.068 0.145 0.530 1.425 0.668
(0.909) (0.818) (0.466) (0.178) (0.402)lnAt 0.844*** 0.863*** 0.859*** 0.687*** 0.878***
(0.000) (0.000) (0.000) (0.000) (0.000)ln(N/L)t 0.112*** 0.174*** 0.220*** 0.143*** 0.262***
(0.000) (0.000) (0.005) (0.000) (0.000)IRRt 0.034** 0.037*** 0.050*** 0.048*** 0.035**
(0.025) (0.006) (0.002) (0.006) (0.037)DCPt �0.166 �0.287* �0.326** �0.001 �0.279**
(0.225) (0.096) (0.032) (0.996) (0.035)RLRt �0.483** �0.457** �0.901*** �0.456** �0.702**
(0.028) (0.019) (0.007) (0.031) (0.013)lnTRt 0.023 0.073*
(0.615) (0.099)lnIRt 0.096 �0.199***
(0.198) (0.003)FDt �0.015 �0.013
(0.167) (0.157)PMt 0.206 0.087
(0.178) (0.817)
II. The short-run dynamics (Dep:Var: ¼ Dln _At)Intercept 0.005 0.007 0.009 0.009 0.009
(0.382) (0.228) (0.180) (0.143) (0.135)ECTt-1 �0.881*** �0.905*** �0.915*** �0.830*** �0.995***
(0.000) (0.000) (0.000) (0.000) (0.000)DlnAt 5.601*** 5.497*** 5.561*** 5.586*** 5.433***
(0.000) (0.000) (0.000) (0.000) (0.000)DIRRt 0.021 0.017 0.024* 0.026** 0.017
(0.104) (0.172) (0.060) (0.040) (0.140)DDCPt �0.174 �0.165 �0.259* �0.088 �0.312**
(0.239) (0.249) (0.080) (0.549) (0.020)DRLRt �0.480** �0.339 �0.808*** �0.451* �0.776***
(0.027) (0.101) (0.006) (0.036) (0.003)DlnTRt �0.030 �0.018
(0.548) (0.692)DlnIRt 0.053 0.013
(0.534) (0.874)DFDt �0.021* �0.019*
(0.056) (0.062)DPMt 0.226** 0.068
(0.024) (0.413)
III. Cointegration testsARDL bounds test 3.917* 6.052*** 3.941* 3.277 3.272*
ECM test �4.478*** �6.115*** �4.658*** �4.174** �4.243
Notes: (N/L) is research intensity measured using the ratio of R&D workers to the total labor force. The control variables include: (1) trade reforms, defined as one minus thetariff rate (TRt); (2) industrial reforms, measured by the sum of six industrial policy dummies (IRt); (3) other financial deregulations, including deregulations in entry barriers(pro-competition measures), banking supervision, privatization, openness to international capital flows, and security markets reforms (FDt); and (4) product market reforms,including deregulation in the electricity and telecommunication sectors (PMt). The maximum lag length allowed for is two. Figures in parenthesis are p-values. The teststatistics of the cointegration tests are compared against the critical values reported in Pesaran et al. (2001). The estimation allows for an unrestricted intercept and no trend.In the case with six explanatory variables (the first four columns), the 10%, 5% and 1% critical value bounds for the F-test are (2.72, 3.77), (3.23, 4.35) and (4.29, 5.61), and forthe t-test are (�2.57, �3.46), (�2.86, �3.78) and (�3.43, �4.37), respectively. For the case with nine explanatory variables (the last column), the 10%, 5% and 1% critical valuebounds for the F-test are (1.88, 2.99), (2.14, 3.30) and (2.65, 3.97), and for the t-test are (�2.57, �4.56), (�2.86, �4.88) and (�3.42, �5.54), respectively.
* Indicates 10% levels of significance.** Indicates 5% levels of significance.
*** Indicates 1% levels of significance.
J.B. Ang / Journal of Banking & Finance 47 (2014) 214–229 225
encouraging further innovation. The intellectual property rightsindex (IRRt) constructed by Park (2008) is used to capture theextent of patent protection. The missing years are interpolated.4
4 The updated dataset of Park (2008) provides data on the patent protection indexover the period 1960–2010. As the data are only available in five-year intervalsmissing data between years are interpolated to obtain an annualized series. Thecomplete set of data can be accessed at: http://nw08.american.edu/~wgp/. Althoughthe degree of patent protection does not tend to fluctuate from year to year unlessthere is a drastic policy change, interpolating the data severely undermines the valueadded of this robustness exercise since data presented at a lower frequency may noprovide sufficient variation to track the changes in patenting output closely. Theestimates are therefore unable to fully capture the association between patent righprotection and patenting activity.
,
t
t
Second, there is an established literature arguing that innova-tive output is positively associated with international R&D spill-overs (see, e.g., Coe and Helpman, 1995; Ang and Madsen, 2013).Our measure of knowledge spillovers via the channel of imports(SPIt) follows the approach of Lichtenberg and van Pottelsberghede la Potterie (1998). It considers bilateral trade between Indiaand 20 OECD countries.
Third, technology transfer in India may have occurredthrough foreign investment. Although the ratio of FDI to GDPmay be an appropriate measure to capture this effect, data forFDI are only available from 1970. Therefore, we consider thenumber of technical collaborations (COLt) between domesticfirms and their foreign partners as a possible channel through

Table 8The effects of individual repressionist policy and overall financial repression (1963–2005).
(1) (2) (3) (4)
I. The long-run relationship ðDep:Var: ¼ ln _At)Intercept 0.429 �1.157** �0.138 �0.544
(0.437) (0.031) (0.758) (0.290)lnAt 0.750*** 0.917*** 0.834*** 0.841***
(0.000) (0.000) (0.000) (0.000)ln(N/L)t 0.098*** 0.053** 0.089*** 0.054**
(0.001) (0.011) (0.002) (0.032)IRRt 0.034**
(0.045)DCPt �0.285*
(0.054)RLRt �0.387**
(0.042)FRt �0.367
(0.716)
II. The short-run dynamics (Dep:Var: ¼ Dln _At)Intercept 0.012* 0.005 0.004 0.296***
(0.084) (0.460) (0.565) (0.001)ECTt-1 �0.755*** �0.850*** �0.845*** �0.325***
(0.000) (0.000) (0.000) (0.000)DlnAt 5.930*** 5.782*** 5.595*** 2.852***
(0.000) (0.000) (0.000) (0.000)DIRRt 0.018
(0.171)DDCPt �0.149
(0.331)DRLR �0.493**
(0.023)DFRt �0.112**
(0.032)
III. Cointegration testsARDL bounds test 6.652*** 6.349*** 5.578** 5.528**
ECM test �4.653*** �4.732*** �4.379*** �4.735***
Notes: (N/L) is research intensity measured using the ratio of R&D workers to thetotal labor force. FR is a summary index of financial repression, which is obtainedbased on the first principal component of the standardized values of IRR, DCP, andRLR. The maximum lag length allowed for is two. Figures in parenthesis are p-values. The test statistics of the cointegration tests are compared against the criticalvalues reported in Pesaran et al. (2001). The estimation allows for an unrestrictedintercept and no trend. The 10%, 5% and 1% critical value bounds for the F-test are(2.72, 3.77), (3.23, 4.35) and (4.29, 5.61), and for the t-test are (�2.57, �3.46),(�2.86, �3.78) and (�3.43, �4.37), respectively.
* Indicates 10% levels of significance.** Indicates 5% levels of significance.
*** Indicates 1% levels of significance.
226 J.B. Ang / Journal of Banking & Finance 47 (2014) 214–229
which foreign technology and know-how can be transmitted toIndia.
Fourth, technology can also flow freely across borders, indepen-dent of any channels. To allow for this possibility, we include a dis-tance to the technological frontier (DTFt) measure in thespecification. It is measured by the US’s TFP over India’s TFP toallow for the possibility that the ability of a developing countryto tap into the frontier’s technology depends on their technologicalgap in that technology flows more easily if their gap is wider due tothe lower adoption costs.
These additional control variables are included separately aswell as jointly in the specifications. In all remaining analyses, theestimates are derived based on Model A using only the ARDL esti-mator since our previous results show that the results are not sen-sitive to the way research intensity is measured. Moreover, forspace reasons, only the long-run estimates, short-run dynamicsand cointegration test statistics are reported. The diagnostic statis-tics, which are not reported, do not suggest any major econometricissues.
It should be noted, however, that although innovative produc-tion may also depend on the depth of the financial system, theinclusion of an indicator of financial development in the specifica-tion may pose some difficulties. There is now an established liter-ature arguing that financial development is crucially shaped byfinancial sector policies (see, e.g., Ang and McKibbin, 2007). Assuch, the inclusion of both an indicator of financial developmentand measures of financial policy as regressors in the same specifi-cation may pose some conceptual and econometric problems.Moreover, in a study that examines the effect of finance on incomeinequality in India, Ang (2010a) highlights the fact that despiteattention having been paid to mitigate any problems associatedwith multicollinearity, entering both financial development andfinancial policy variables in the income inequality equation yieldsunsatisfactory econometric results. Our specification thereforeexcludes the indicators of financial development.
The estimates reported in Table 6 show that our core resultsremain robust to the inclusion of these control variables. Exceptfor the patent protection index (column (1)), for which a negativeand mildly significant effect is found, all control variables turn outto have insignificant effects on ideas production. The short-runestimates also provide consistent findings in terms of how interestrate controls and directed credit as well as reserve and liquidityrequirements are related to patenting activity. Similar to theirlong-run counterparts, the short-run effects of these control vari-ables are found to be insignificant. Importantly, we continue to findfairly strong evidence of cointegration in all regressions. Taken as awhole, consistent findings with those obtained earlier, in Table 2,suggest that our results are not sensitive to the inclusion of thesecontrol variables and hence are unlikely to be driven by omittedvariable bias.
The correlations found between patent applications and finan-cial sector policies may be driven by the failure to account for otherreforms undertaken in the economy, given that financial sectorreforms may occur simultaneously with these reforms (Bekaertet al., 2006). This concern is particularly pertinent for India giventhat the financial sector reforms in the early 1990s were part of alarger package of economic reforms aimed at enhancing growth.To ensure that other policy reforms have not been responsiblefor the observed relationship between financial sector policiesand innovative production, the following variables are added sin-gly as well as jointly to the specification as an attempt to deal withendogeneity bias: trade reforms, industrial reforms, other financialderegulations (excluding interest controls, directed credit, andreserve requirements), and product market reforms.
First, to capture the effects of trade reforms (TRt), we measurethe degree of liberalization in the trade sector using one minus
the tariff rate (the ratio of import duties to total imports) wherebyan increase in the value of this index reflects greater relaxation oftrade barriers.
Second, the extent of reform in the industrial sector (IRt) is cap-tured by six policy dummy variables, including the Industrial Pol-icy Resolutions of 1948 and 1956, the Industrial Policy Statementsof 1973, 1977 and 1980, and the 1991 Industrial Policy 1991. Thesepolicies were introduced over the last few decades with an aim ofincreasing the role of the private sector in market activities to fuelindustrial growth. A value of one is assigned for the years followingthe introduction of an industrial policy. An overall summary mea-sure reflecting the degree of industrial policy deregulation isobtained by summing up all six policy variables. The resultingindex is then normalized so that its highest value is one.
Third, a variable that considers several additional financialderegulation measures (FDt) is constructed by considering deregu-lations in entry barriers (pro-competition measures), bankingsupervision, privatization in the banking sector, openness to inter-national capital flows, and security market reforms. These data areobtained from Abiad et al. (2010). For each dimension a value of 0,1, 2 or 3 is assigned, where a larger value indicates a higher degree
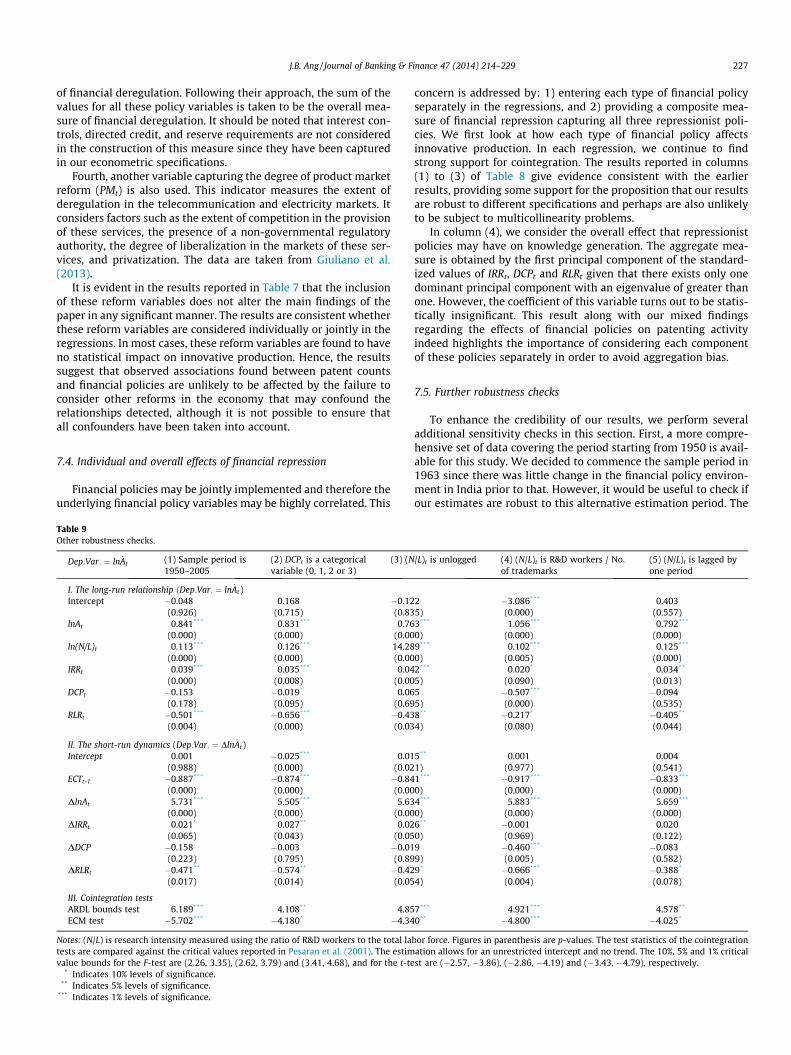
J.B. Ang / Journal of Banking & Finance 47 (2014) 214–229 227
of financial deregulation. Following their approach, the sum of thevalues for all these policy variables is taken to be the overall mea-sure of financial deregulation. It should be noted that interest con-trols, directed credit, and reserve requirements are not consideredin the construction of this measure since they have been capturedin our econometric specifications.
Fourth, another variable capturing the degree of product marketreform (PMt) is also used. This indicator measures the extent ofderegulation in the telecommunication and electricity markets. Itconsiders factors such as the extent of competition in the provisionof these services, the presence of a non-governmental regulatoryauthority, the degree of liberalization in the markets of these ser-vices, and privatization. The data are taken from Giuliano et al.(2013).
It is evident in the results reported in Table 7 that the inclusionof these reform variables does not alter the main findings of thepaper in any significant manner. The results are consistent whetherthese reform variables are considered individually or jointly in theregressions. In most cases, these reform variables are found to haveno statistical impact on innovative production. Hence, the resultssuggest that observed associations found between patent countsand financial policies are unlikely to be affected by the failure toconsider other reforms in the economy that may confound therelationships detected, although it is not possible to ensure thatall confounders have been taken into account.
7.4. Individual and overall effects of financial repression
Financial policies may be jointly implemented and therefore theunderlying financial policy variables may be highly correlated. This
Table 9Other robustness checks.
Dep:Var: ¼ ln _At (1) Sample period is1950–2005
(2) DCPt is a categoricalvariable (0, 1, 2 or 3)
(3) (N
I. The long-run relationship ðDep:Var: ¼ ln _At)Intercept �0.048 0.168 �0.12
(0.926) (0.715) (0.83lnAt 0.841*** 0.831*** 0.76
(0.000) (0.000) (0.00ln(N/L)t 0.113*** 0.126*** 14.28
(0.000) (0.000) (0.00IRRt 0.039*** 0.035*** 0.04
(0.000) (0.008) (0.00DCPt �0.153 �0.019* 0.06
(0.178) (0.095) (0.69RLRt �0.501*** �0.656*** �0.43
(0.004) (0.000) (0.03
II. The short-run dynamics (Dep:Var: ¼ Dln _At)Intercept 0.001 �0.025*** 0.01
(0.988) (0.000) (0.02ECTt-1 �0.887*** �0.874*** �0.84
(0.000) (0.000) (0.00DlnAt 5.731*** 5.505*** 5.63
(0.000) (0.000) (0.00DIRRt 0.021* 0.027** 0.02
(0.065) (0.043) (0.05DDCP �0.158 �0.003 �0.01
(0.223) (0.795) (0.89DRLRt �0.471** �0.574** �0.42
(0.017) (0.014) (0.05
III. Cointegration testsARDL bounds test 6.189*** 4.108** 4.85ECM test �5.702*** �4.180* �4.34
Notes: (N/L) is research intensity measured using the ratio of R&D workers to the total latests are compared against the critical values reported in Pesaran et al. (2001). The estimvalue bounds for the F-test are (2.26, 3.35), (2.62, 3.79) and (3.41, 4.68), and for the t-te
* Indicates 10% levels of significance.** Indicates 5% levels of significance.
*** Indicates 1% levels of significance.
concern is addressed by: 1) entering each type of financial policyseparately in the regressions, and 2) providing a composite mea-sure of financial repression capturing all three repressionist poli-cies. We first look at how each type of financial policy affectsinnovative production. In each regression, we continue to findstrong support for cointegration. The results reported in columns(1) to (3) of Table 8 give evidence consistent with the earlierresults, providing some support for the proposition that our resultsare robust to different specifications and perhaps are also unlikelyto be subject to multicollinearity problems.
In column (4), we consider the overall effect that repressionistpolicies may have on knowledge generation. The aggregate mea-sure is obtained by the first principal component of the standard-ized values of IRRt, DCPt and RLRt given that there exists only onedominant principal component with an eigenvalue of greater thanone. However, the coefficient of this variable turns out to be statis-tically insignificant. This result along with our mixed findingsregarding the effects of financial policies on patenting activityindeed highlights the importance of considering each componentof these policies separately in order to avoid aggregation bias.
7.5. Further robustness checks
To enhance the credibility of our results, we perform severaladditional sensitivity checks in this section. First, a more compre-hensive set of data covering the period starting from 1950 is avail-able for this study. We decided to commence the sample period in1963 since there was little change in the financial policy environ-ment in India prior to that. However, it would be useful to check ifour estimates are robust to this alternative estimation period. The
/L)t is unlogged (4) (N/L)t is R&D workers / No.of trademarks
(5) (N/L)t is lagged byone period
2 �3.086*** 0.4035) (0.000) (0.557)3*** 1.056*** 0.792***
0) (0.000) (0.000)9*** 0.102*** 0.125***
0) (0.005) (0.000)2*** 0.020* 0.034**
5) (0.090) (0.013)5 �0.507*** �0.0945) (0.000) (0.535)8** �0.217* �0.405**
4) (0.080) (0.044)
5** 0.001 0.0041) (0.977) (0.541)1*** �0.917*** �0.833***
0) (0.000) (0.000)4*** 5.883*** 5.659***
0) (0.000) (0.000)6** �0.001 0.0200) (0.969) (0.122)9 �0.460*** �0.0839) (0.005) (0.582)9* �0.666*** �0.388*
4) (0.004) (0.078)
7*** 4.921*** 4.578**
0** �4.800*** �4.025*
bor force. Figures in parenthesis are p-values. The test statistics of the cointegrationation allows for an unrestricted intercept and no trend. The 10%, 5% and 1% criticalst are (�2.57, �3.86), (�2.86, �4.19) and (�3.43, �4.79), respectively.

228 J.B. Ang / Journal of Banking & Finance 47 (2014) 214–229
first column in Table 9 reports the estimates for the period 1950–2005. They are largely consistent with the previous findings.
Second, while we have chosen to measure the extent of directedcredit programs using the share of actual directed credit in total(non-food) credit, it is more common in the literature to capturethis repressionist policy using a categorical variable. In column(2), we provide results based on this alternative approach whereDCPt is measured by 0, 1, 2 and 3 when the programs cover; zero,up to 20%, 21% to 40%, and more than 40%, respectively, of totalbank loans (see, e.g., Abiad et al., 2010; Ang, 2010a for thisapproach). It is evident that our results remain insensitive to thisconsideration. This is unsurprising since our measure of directedcredit programs and this categorical variable shows a rather highcorrelation structure of 0.81.
Next, we consider an alternative expression of the researchintensity measure without taking logs, to allow for the possibilitythat the functional relationship between the rate of patenting( _At=At) and research intensity can be a non-linear one. The results,however, are largely invariant to this consideration (see column(3)).
Fourth, we use trademarks as the alternative measure of prod-uct variety. Gao and Hitt (2004) argue that trademarks containmore useful information about product differentiation that is notincluded in other measures of product variety such as incomeand labor force. Moreover, they reflect non-trivial variation amongproducts. It is evident that the qualitative aspects of our estimatesdo not show any variations (see column (4)). This finding providesadditional confidence that our estimates are not sensitive to theway product variety is measured.
Finally, our estimates may be subject to specification bias giventhat the R&D activity may be driven by the extent of credit con-straint, which in turn depends on financial regulation (see de laFuente and Marín, 1996). We address this issue by considering alagged measure of R&D intensity ((N/L)t-1) since the decision toconduct research activity is unlikely to be driven by future finan-cial regulation, which is often hard to predict. The results reportedin the last column show that our findings regarding how each typeof financial policy affects patenting activity are in line with thosereported earlier in Table 2, suggesting that potential specificationbias associated with R&D may not be an issue.
8. Conclusions
Financial repression or restraint, which is prevalent in manydeveloping countries, may impede the development or adoptionof new production techniques, thereby retarding technologicaldeepening. Greater availability of financial resources, which canbe achieved through financial reforms, offers the opportunitiesfor the utilization of existing technologies and the development
Table A1Summary statistics (1963–2005).
Variables
Number of patent applications filed by domestic residents ( _At)The stock of patent applications filed by domestic residents (At)Research intensity (Nt/Lt)Research intensity adjusted for human capital (Nt/htLt)Research intensity adjusted for productivity (Nt/atLt)Research intensity adjusted for both human capital and productivity (Nt/athtLt)Index of interest rate restraints (IRRt)Ratio of directed credit to total non-food credit (DCPt)Ratio of reserve and liquidity requirements (RLRt)Ratio of gross domestic savings to GDP
Notes: the total number of observations is 43. R&D input is measured using R&D labor (N)is adjusted for total factor productivity (a) and human capital (h) to account for the fac
of new techniques. The stimulus to innovation is therefore a resultof decreasing financial constraints faced by firms, and at thebroader level, a reduction of restraints in the financial system.Financial liberalization lifts restrictions in financial systems andincreases the costs associated with hiding successful innovationsby improving the monitoring system, thus spurring technologicalinnovation. Thus, the crucial role of finance in the analysis of tech-nological development cannot be understated.
While recent endogenous growth theories have highlighted theimportant role of finance in facilitating ideas production, so farthere has been little effort attempting to explore this issue empir-ically. If innovation is to be encouraged, which type of financialsector policy should be formulated to facilitate it? This study con-tributes to the literature by providing fresh evidence on how eachtype of financial sector policy, including interest rate controls,directed credit programs and reserve and liquidity requirements,influences the evolution of knowledge creation, using India asthe case study. An understanding of how inventive productionreacts to each type of financial policy provides policy makers withsome guidance in undertaking the institutional reform of financialmarkets and intermediaries.
Employing the ARDL and ECM cointegration tests, the empiricalevidence shows a significant long-run relationship betweenknowledge production and its determinants. After documentingthese basic cointegration results, we derive the long-run estimatesusing several different estimators. The qualitative aspects of theresults are insensitive to the choice of estimators and measuresof research intensity. The results are also robust to the consider-ation of other reforms in the economy, the inclusion of intellectualproperty rights protection and cross-border technological spillovervariables.
The estimated results based on annual data for over four dec-ades suggest that knowledge creation critically depends on thestock of knowledge and R&D input, providing strong support forthe use of an innovation-based growth framework in the analysis.The results also highlight the important role of formulating appro-priate financial policies in order to ease the acquisition of technicalknow-how and in stimulating innovation. Our findings indicatethat financial sector policies appear to have mixed effects onknowledge creation. Specifically, financial repressionist policies,in the form of the significant presence of directed credit controlsand high reserve requirements, appear to have retarded knowledgecreation through preventing the adoption of improved machinerywith embodied technological change. However, the results do notprovide full support for the financial liberalization thesis, giventhat policy intervention in the form of interest rate restraintsappears to be an effective device for enhancing knowledge crea-tion. There is also some evidence suggesting that, in addition tothis direct effect, interest rate restraints may encourage innovativeproduction indirectly via the channel of savings.
Mean Median Min. Max. Std. Dev.
1813 1210 878 7180 1523
12236 10711 5820 33658 58790.010 0.007 0.003 0.020 0.0060.008 0.006 0.003 0.015 0.0040.010 0.009 0.004 0.015 0.0030.008 0.008 0.004 0.012 0.0021.518 1.453 0.390 2.409 0.5560.298 0.326 0.041 0.431 0.1010.382 0.380 0.230 0.535 0.0840.219 0.217 0.127 0.356 0.055
whereas product variety is measured by the number of workers (L). Product varietyt that innovations become increasingly complex over time.

J.B. Ang / Journal of Banking & Finance 47 (2014) 214–229 229
Acknowledgements
Comments and suggestions received from a referee of thisjournal and participants of the 14th Malaysian Finance AssociationConference as well as the Economic Growth Center seminar at theNanyang Technological University are gratefully acknowledged. Inparticular, I would like to thank Yew-Kwang Ng, Joseph Alba, LauraWu, Guang-Zhen Sun, Giovanni Ko, Satyendra Kumar Gupta andSiong Hook Law for their very insightful comments.
Appendix A.
(See Table A1)
References
Abiad, A., Detragiache, E., Tressel, T., 2010. A new database of financial reforms. IMFStaff Papers 57, 281–302.
Aghion, P., Howitt, P., 1998. Endogenous growth theory. MIT Press, Cambridge.Aghion, P., Howitt, P., 2009. The Economics of Growth. The MIT Press, Cambridge,
Massachusetts.Aghion, P., Howitt, P., Mayer-Foulkes, D., 2005. The effect of financial development
on convergence: theory and evidence. Quarterly Journal of Economics 120, 173–222.
Ang, J.B., 2010a. Does foreign aid promote growth? Exploring the role of financialliberalization. Review of Development Economics 14, 197–212.
Ang, J.B., 2010b. Finance and inequality: the case of India. Southern EconomicJournal 76, 738–761.
Ang, J.B., 2010c. Financial sector reforms, patent protection and knowledgeaccumulation in India. World Development 38, 1070–1081.
Ang, J.B., 2010d. Research, technological change and financial liberalization in SouthKorea. Journal of Macroeconomics 32, 457–468.
Ang, J.B., 2011a. Finance and consumption volatility: evidence from india. Journal ofInternational Money and Finance 30, 947–964.
Ang, J.B., 2011b. Financial development, liberalization and technological deepening.European Economic Review 55, 688–701.
Ang, J.B., Madsen, J., 2013. International R&D spillovers and productivity trends inthe Asian miracle economies. Economic Inquiry 51, 1523–1541.
Ang, J.B., Madsen, J.B., 2011. Can second-generation endogenous growth modelsexplain productivity trends and knowledge production in the Asian miracleeconomies? Review of Economics and Statistics 93, 1360–1373.
Ang, J.B., McKibbin, W.J., 2007. Financial liberalization, financial sector developmentand growth: evidence from Malaysia. Journal of Development Economics 84,215–233.
Banerjee, A., Dolado, J., Mestre, R., 1998. Error-correction mechanism tests forcointegration in a single-equation framework. Journal of Time Series Analysis19, 267–283.
Bekaert, G., Harvey, C.R., Lundblad, C., 2006. Growth volatility and financialliberalization. Journal of International Money and Finance 25, 370–403.
Bencivenga, V.R., Smith, B.D., 1992. Deficits, inflation, and the banking system indeveloping countries: the optimal degree of financial repression. OxfordEconomic Papers 44, 767–790.
Blackburn, K., Hung, V.T.Y., 1998. A theory of growth, financial development andtrade. Economica 65, 107–124.
Coe, D.T., Helpman, E., 1995. International R&D spillovers. European EconomicReview 39, 859–897.
Cole, S., 2009. Fixing market failures or fixing elections? Elections, banks andagricultural lending in India. American Economic Journal: Applied Economics 1,219–250.
Courakis, A.S., 1984. Constraints on bank choices and financial repression in lessdeveloped countries. Oxford Bulletin of Economics and Statistics 46, 341–370.
de la Fuente, A., Marín, J.M., 1996. Innovation, bank monitoring, and endogenousfinancial development. Journal of Monetary Economics 38, 269–301.
Demetriades, P., Costantini, M., James, G., Lee, K., 2013. Financial restraints andprivate investment: evidence from a nonstationary panel. Economic Inquiry 51,248–259.
Eaton, J., Kortum, S., Lerner, J., 2004. International patenting and the europeanpatent office: A quantitative assessment. In: Patents, Innovation and EconomicPerformance: OECD Conference Proceedings, Organization for EconomicCooperation and Development, Paris.
Gao, G., Hitt, L.M., 2004. Information technology and product variety: evidence frompanel data. International Conference on Information Systems, Washington, DC.
Giuliano, P., Mishra, P., Spilimbergo, A., 2013. Democracy and reforms: evidencefrom a new dataset. American Economic Journal: Macroeconomics 5, 179–204.
Griliches, Z., 1990. Patent statistics as economic indicators: a survey. Journal ofEconomic Literature 28, 1661–1707.
Ha, J., Howitt, P., 2007. Accounting for trends in productivity and R&D: aschumpeterian critique of semi-endogenous growth theory. Journal of Money,Credit and Banking 39, 733–774.
Hellmann, T.F., Murdock, K.C., Stiglitz, J.E., 1996. Deposit mobilisation throughfinancial restraint. In: Hermes, N., Lensink, R. (Eds.), Financial Development andEconomic Growth: Theory and Experiences from Developing Countries.Routledge, London.
Hermes, N., Lensink, R., 2008. Does financial liberalization influence saving,investment and economic growth? Evidence from 25 emerging marketeconomies, 1973-1996. In: Khasnobis, B.G., Mavratos, G. (Eds.), FinancialDevelopment, Institutions, Growth and Poverty Reduction. PalgraveMacmillan, New York, pp. 1973–1996.
Honohan, P., Stiglitz, J.E., 2001. Robust financial restraint. In: Caprio, G., Honohan, P.,Stiglitz, J.E. (Eds.), Financial Liberalization: How Far, How Fast? CambridgeUniversity Press, Cambridge.
Howitt, P., 1999. Steady endogenous growth with population and R&D inputsgrowing. Journal of Political Economy 107, 715–730.
Kortum, S., 1993. Equilibrium R&D and the patent-R&D ratio: US evidence.American Economic Review 83, 450–457.
Law, S.H., Azman-Saini, W.N.W., Ibrahim, M.H., 2013. Institutional qualitythresholds and the finance–growth nexus. Journal of Banking and Finance 37,5373–5381.
Levine, R., 2001. International financial liberalization and economic growth. Reviewof International Economics 9, 688–702.
Lichtenberg, F.R., van Pottelsberghe de la Potterie, B., 1998. International R&Dspillovers: a comment. European Economic Review 42, 1483–1491.
Madsen, J., Ang, J.B., 2014. Finance-led growth in the OECD since the 19th century:How does financial development transmit to growth. Review of Economics andStatistics, forthcoming.
Madsen, J.B., Islam, M.R., Ang, J.B., 2010a. Catching up to the technology frontier: thedichotomy between innovation and imitation. Canadian Journal of Economics43, 1389–1411.
Madsen, J.B., Saxena, S., Ang, J.B., 2010b. The Indian growth miracle and endogenousgrowth. Journal of Development Economics 93, 37–48.
McKinnon, R.I., 1973. Money and Capital in Economic Development. BrookingsInstitution, Washington, D.C..
Odedokun, M.O., 1996. International evidence on the effects of directed creditprogrammes on efficiency of resource allocation in developing countries: thecase of development bank lendings. Journal of Development Economics 48,449–460.
Park, W.G., 2008. International patent protection: 1960–2005. Research Policy 37,761–766.
Pesaran, M.H., Shin, Y., 1998. An autoregressive distributed-lag modelling approachto cointegration analysis. In: Strom, S. (Ed.), Econometrics and Economic Theoryin the Twentieth Century: The Ragnar Frisch Centennial Symposium. CambridgeUniversity Press, Cambridge.
Pesaran, M.H., Shin, Y., Smith, R.J., 2001. Bounds testing approaches to the analysisof level relationships. Journal of Applied Econometrics 16, 289–326.
Psacharopoulos, G., 1994. Returns to investment in education: a global update.World Development 22, 1325–1343.
Romer, P.M., 1990. Endogenous technological change. Journal of Political Economy98, S71–102.
Sahu, S., 1998. Technology Transfer, Dependence, and Self-Reliant Development inthe Third World: The Pharmaceutical and Machine Tool Industries in India.Praeger, Wesport, Connecticut.
Schumpeter, J.A., 1911. The Theory of Economic Development. Oxford UniversityPress, Oxford.
Schwarz, A.M., 1992. How effective are directed credit policies in the united states?A literature survey. The World Bank Policy Research Working Paper Series No.:1019.
Shaw, E.S., 1973. Financial Deepening in Economic Development. Oxford UniversityPress, New York.
Stadler, M., 1992. Determinants of innovative activity in oligopolistic markets.Journal of Economics 56, 137–156.
Stiglitz, J.E., 1994. The role of the state in financial markets. In: Bruno, M., Pleskovic,B. (Eds.), Proceedings of the World Bank Annual Conference on DevelopmentEconomics, 1993: Supplement to the World Bank Economic Review and theWorld Bank Research Observer. World Bank, Washington, D.C.
Stiglitz, J.E., Weiss, A., 1981. Credit rationing in markets with imperfect information.American Economic Review 71, 393–410.
Taylor, L., 1983. Structuralist Macroeconomics: Applicable Models for the ThirdWorld. Basic Books, New York.
Ulku, H., 2007. R&D, innovation, and growth: evidence from four manufacturingsectors in OECD countries. Oxford Economic Papers 59, 513–535.
van Wijnbergen, S., 1982. Stagflationary effects of monetary stabilization policies: aquantitative analysis of South Korea. Journal of Development Economics 10,133–169.
Venturini, F., 2012a. Looking into the black-box of the schumpeterian growththeories: an empirical assessment of R&D races. European Economic Review 56,1530–1545.
Venturini, F., 2012b. Product variety, product quality, and evidence ofschumpeterian endogenous growth: a note. Economics Letters 117, 74–77.
Related Documents