Welcome message from author
This document is posted to help you gain knowledge. Please leave a comment to let me know what you think about it! Share it to your friends and learn new things together.
Transcript

i
NORTH-WEST UNIVERSITY POTCHEFSTROOM CAMPUS PRIVATE BAG X6001 POTCHEFSTROOM 2520
Tel +27 18 299 1810 Fax +27 18 299 4140
E-mail: [email protected]
Dr Martinette Kruger, Mr Marco Scholtz, Prof Melville Saayman & Prof Andrea Saayman
Copyright © 2012 Tourism Research in Economic Environs & Society
ii
Acknowledgements
The authors would like to thank the following individuals and institutions:
Ms Sandra Jacobs of Innibos management for her help in providing us with
quality information and support.
All the festinos for their participation and cooperation in completing the
questionnaires.
The NRF for co-funding.
Philna Scholtz for organising accommodation for the fieldworkers.
Ms S Oberholzer for managing the collation of the data.
The following students from the North-West University for the distribution of the
questionnaires:
Ms D Venter
Ms N Jacobs
Ms M Benade
Ms B Niemand
Ms B Swanepoel
Ms Cecile van Zyl for the language editing.
iii
Table of contents 1. INTRODUCTION 1 2. RESEARCH AIM 1 3. METHOD OF RESEARCH 3 4. PROFILE OF VISITORS TO INNIBOS ARTS FESTIVAL 4 4.1 Gender 4
4.2 Age groups 5
4.3 Language 6 4.4
4.5
Occupation
Annual gross income
6
6
4.6 Province of residence 7
4.7 Number of people in travelling group 8 4.8 Number of people paid for 9
4.9 Days spent at the Festival 9
4.10 Nights in Nelspruit 10 4.11 Type of accommodation 10
4.12 Expenditure per group 12
4.13 Number of tickets purchased for shows 13
4.14 Preferred type of shows 14 4.15 Festival as main reason for visit to Nelspruit 14
4.16 Other festivals attended 15
4.17
4.17.1 4.17.2
Decisions to attend Festival
Type of decision Initiator of trip
16
16 16
4.18 Sponsors associated with Innibos 17
4.19 Number of visits to the Festival 18
4.20 Motivation to attend the Festival 18 4.21 Types of media 19
4.22 Repeat visits to Festival 20
4.23 Factors that classify national arts festivals 21
4.24 Degree of exposure to the arts during childhood 23 4.25 Perception of Innibos’ contribution to the arts 24
4.25.1 Innibos’ contribution to the arts 24
4.25.2 Perceptions of Innibos’ contribution to the arts 28
4.25.3 Personal involvement in the arts 29
iv
List of figures
5. ECONOMIC CONTRIBUTION 30
5.1 The number of visitors and length of stay 30
5.2 The magnitude of spending 31
5.3 Economic contribution 31
6. CONCLUSIONS AND RECOMMENDATIONS 34
6.1 Profile of visitors 34
6 6.1 6.2 6.3
CONCLUSIONS AND RECOMMENDATIONS Profile of the visitors Conclusions Recommendations
25 25 26 27
Figure 1: Gender 4 Figure 2: Figure 3:
Occupation Annual gross income
6 7
Figure 4: Festival as main reason for visit to Nelspruit 15 Figure 5: Other festivals attended 15 Figure 6: Figure 7:
Decision to attend Festival Initiator of attendance
16 17
Figure 8: Repeat visits to Festival 21 Figure 9: Exposure 23
v
List of tables
Table 1: Ticket sales in 2005-2012 1 Table 2: Comparison between studies done 2004-2012: Gender 4 Table 3: Comparison between studies done 2004-2012: Age groups 5 Table 4: Language 5 Table 5: Province of residence 7 Table 6: Number of people in travelling group 8 Table 7: Size of the travelling party 2004-2012 8 Table 8: Number of people paid for (2011 & 2012) 9 Table 9: Comparison between surveys 2004-2012: Number of days spent at
the Festival 9
Table 10: Comparison between surveys 2004-2012: Number of days spent at the Festival
10
Table 11: Type of accommodation 10 Table 12: Expenditure per group 11 Table 13: Comparison of expenditure per group 2004-2012 12 Table 14: Number of tickets purchased for shows 13 Table 15: Preferred types of shows 13 Table 16: Number of visits to the Festival 18 Table 17: Motivation to attend the Festival 18 Table 18: Types of media 20 Table 19: Factors classifying Festival 22 Table 20: The degree in which Innibos contribution towards the promotion of
the performing arts 24
Table 21:
The degree to which Innibos contributes towards the promotion of the visual arts
26
Table 22: Perception of Innibos’ contribution to the arts 28
Table 23: Personal involvement in the arts 29
Table 24: Profile of an average Innibos visitor 2011 & 2012 32
1
1. Introduction
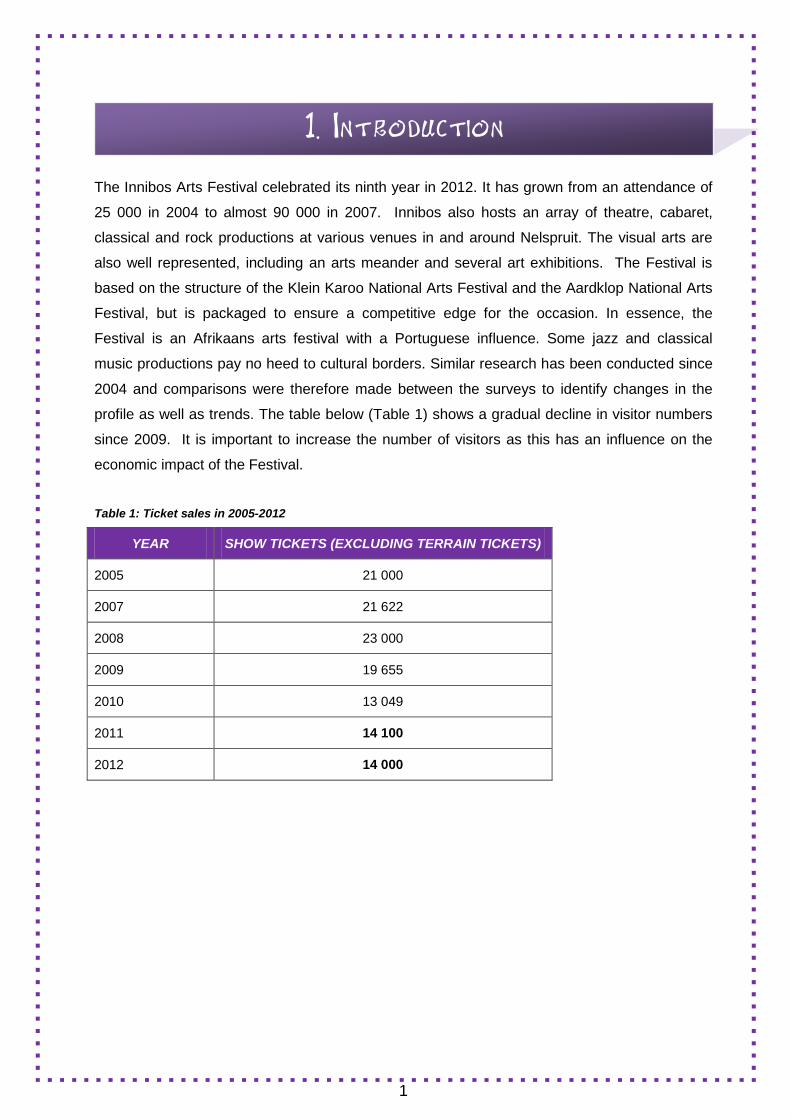
The Innibos Arts Festival celebrated its ninth year in 2012. It has grown from an attendance of
25 000 in 2004 to almost 90 000 in 2007. Innibos also hosts an array of theatre, cabaret,
classical and rock productions at various venues in and around Nelspruit. The visual arts are
also well represented, including an arts meander and several art exhibitions. The Festival is
based on the structure of the Klein Karoo National Arts Festival and the Aardklop National Arts
Festival, but is packaged to ensure a competitive edge for the occasion. In essence, the
Festival is an Afrikaans arts festival with a Portuguese influence. Some jazz and classical
music productions pay no heed to cultural borders. Similar research has been conducted since
2004 and comparisons were therefore made between the surveys to identify changes in the
profile as well as trends. The table below (Table 1) shows a gradual decline in visitor numbers
since 2009. It is important to increase the number of visitors as this has an influence on the
economic impact of the Festival.
Table 1: Ticket sales in 2005-2012
YEAR SHOW TICKETS (EXCLUDING TERRAIN TICKETS)
2005 21 000
2007 21 622
2008 23 000
2009 19 655
2010 13 049
2011 14 100
2012 14 000

2
2. Research aim
Arts festivals have become important in the South African society because of a growing need
among the broader public for various forms of art. These festivals in general are important for
many reasons, some of which are:
to sustain different forms of art;
to contribute to the livelihood of artists;
to grow regional and local economies;
to promote specific destinations; and
to create specific images of these destinations.
Continuous growth of festivals in South Africa is ensured as government supports and
promotes them as part of its strategy for economic development. However, the sustainability of
the festivals has become questionable as many of these festivals compete for similar tourism
markets. Does the same group of people attend one festival after another, or is it a different
group of people attending different festivals? These are the questions that contributed to this
survey and needed answering. This survey is one in a series that was undertaken by Tourism
Research in Economic Environs and Society (TREES) at the North-West University. As
mentioned above, it has become important to unlock information pertaining to the profile of
festinos, as well as the impact of the Festival on the economy of Nelspruit and the Mbombela
Area. This information can contribute to the sustainability of the Festival, especially in terms of
its marketing value. The profile can help organisers focus on a specific market instead of using
a shotgun approach.
This research focused on the following objectives:
To determine the profile of visitors/tourists to Innibos Arts Festival:
o Who visits the Festival?
o Where do the visitors come from?
o How much money is spent at the Festival?
o What is the size of the travel group?
o In which activities do visitors participate and what is the frequency of
participation?
To determine the economic value of the Festival for Nelspruit:
o What are the spending patterns of the visitors?

3
3. Method of research
In order to determine the profile of festinos as well as the economic impact of Innibos Arts
Festival, a questionnaire was used. In total, 471 questionnaires were completed by means of
availability sampling over three days of the Festival (27 to 30 June 2012). Questionnaires were
distributed among the different venues and main festival grounds to ensure that all festinos had
an equal opportunity to participate. Questionnaires were also completed at the main festival
grounds and venues where fieldworkers moved around in order to minimise bias. During the
survey, fieldworkers approached the respondents and explained the goal of the survey as well
as the questionnaire. Hereafter the profile of the visitors to the Festival will be discussed.

4
4. Profile of visitors to the Innibos Arts Festival
This section focuses on analysing the profile of visitors to Innibos Arts Festival. The profile can
be useful in determining marketing strategies and programme planning.
DEMOGRAPHIC PROFILE
4.1 Gender
Figure 1: Gender
According to Figure 1, 64% of respondents were female, while 36% were male. This
corresponds well with previous surveys where females were also the majority (Table 2).
Table 2: Comparison between studies done 2004-2012: Gender
GENDER 2004 2005 2006 2007 2008 2009 2010 2011 2012
Male 48% 41% 41% 45% 35% 40% 37% 42% 36%
Female 52% 59% 59% 55% 65% 60% 63% 58% 64%
36%
64%
Male Female
5
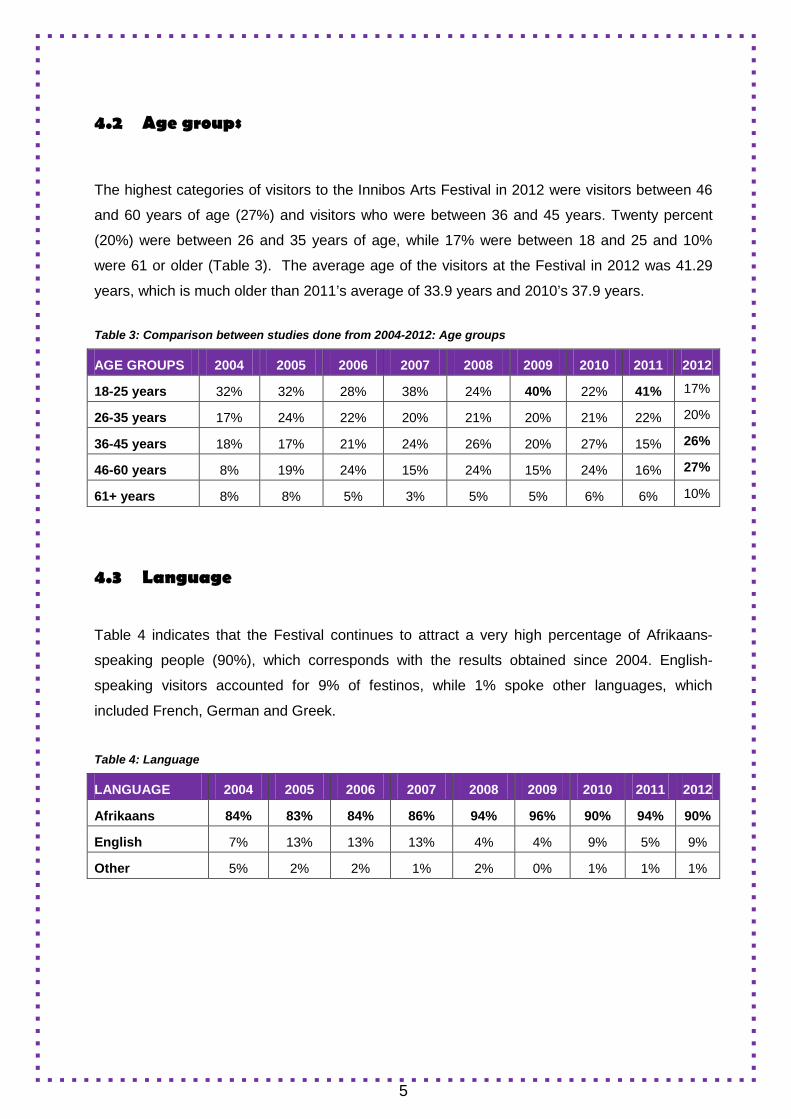
4.2 Age groups
The highest categories of visitors to the Innibos Arts Festival in 2012 were visitors between 46
and 60 years of age (27%) and visitors who were between 36 and 45 years. Twenty percent
(20%) were between 26 and 35 years of age, while 17% were between 18 and 25 and 10%
were 61 or older (Table 3). The average age of the visitors at the Festival in 2012 was 41.29
years, which is much older than 2011’s average of 33.9 years and 2010’s 37.9 years. Table 3: Comparison between studies done from 2004-2012: Age groups
AGE GROUPS 2004 2005 2006 2007 2008 2009 2010 2011 2012
18-25 years 32% 32% 28% 38% 24% 40% 22% 41% 17%
26-35 years 17% 24% 22% 20% 21% 20% 21% 22% 20%
36-45 years 18% 17% 21% 24% 26% 20% 27% 15% 26%
46-60 years 8% 19% 24% 15% 24% 15% 24% 16% 27%
61+ years 8% 8% 5% 3% 5% 5% 6% 6% 10%
4.3 Language
Table 4 indicates that the Festival continues to attract a very high percentage of Afrikaans-
speaking people (90%), which corresponds with the results obtained since 2004. English-
speaking visitors accounted for 9% of festinos, while 1% spoke other languages, which
included French, German and Greek.
Table 4: Language
LANGUAGE 2004 2005 2006 2007 2008 2009 2010 2011 2012
Afrikaans 84% 83% 84% 86% 94% 96% 90% 94% 90%
English 7% 13% 13% 13% 4% 4% 9% 5% 9%
Other 5% 2% 2% 1% 2% 0% 1% 1% 1%
6
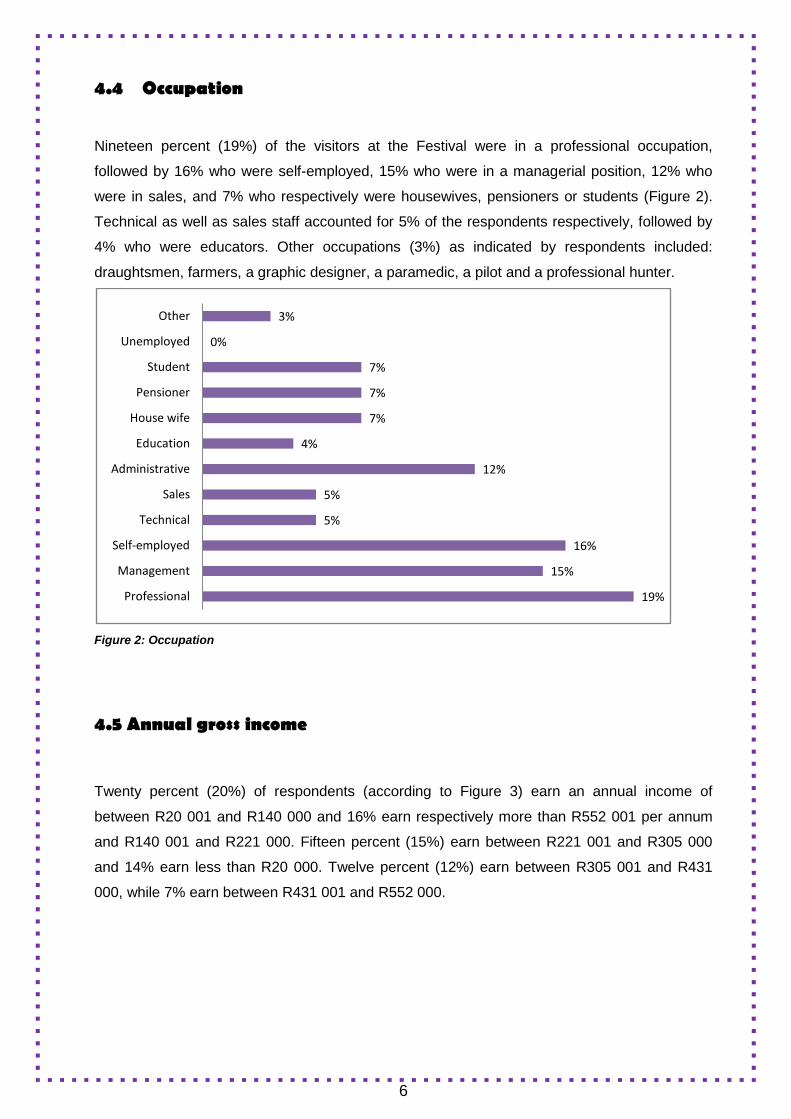
4.4 Occupation
Nineteen percent (19%) of the visitors at the Festival were in a professional occupation,
followed by 16% who were self-employed, 15% who were in a managerial position, 12% who
were in sales, and 7% who respectively were housewives, pensioners or students (Figure 2).
Technical as well as sales staff accounted for 5% of the respondents respectively, followed by
4% who were educators. Other occupations (3%) as indicated by respondents included:
draughtsmen, farmers, a graphic designer, a paramedic, a pilot and a professional hunter.
Figure 2: Occupation
4.5 Annual gross income
Twenty percent (20%) of respondents (according to Figure 3) earn an annual income of
between R20 001 and R140 000 and 16% earn respectively more than R552 001 per annum
and R140 001 and R221 000. Fifteen percent (15%) earn between R221 001 and R305 000
and 14% earn less than R20 000. Twelve percent (12%) earn between R305 001 and R431
000, while 7% earn between R431 001 and R552 000.
19%
15%
16%
5%
5%
12%
4%
7%
7%
7%
0%
3%
Professional
Management
Self-employed
Technical
Sales
Administrative
Education
House wife
Pensioner
Student
Unemployed
Other

7
Figure 3: Annual gross income
4.6 Province of residence
Forty-eight percent (48%) of the respondents were from Mpumalanga, with the second highest
number of visitors travelling from Gauteng (35%) (see Table 5). Five percent (5%) travelled
from the Limpopo Province, 4% from the North West Province and 3% from KwaZulu-Natal.
Respondents from the Free State and Western Cape accounted for 2% each, while only 1% of
respondents were from the Northern Cape. There were no respondents from the Eastern Cape.
Less than 1% was foreign visitors. When comparing the results with those from previous years,
Mpumalanga and Gauteng remain the Festival’s main target market.
Table 5: Province of residence
PROVINCE 2004 2005 2006 2007 2008 2009 2010 2011 2012
Mpumalanga 48% 56% 65% 67% 65% 53% 55% 43% 48%
Gauteng 31% 29% 24% 19% 26% 33% 30% 34% 35%
North West 6% 3% 2% 3% 2% 3% 3% 6% 4%
Free State 4% 2% 1% 3% 2% 3% 3% 3% 2%
KwaZulu-Natal 3.5% 2% 0.5% 2% 1% 2% 2% 6% 3%
Western Cape 3% 4% 2% 2% 1% 1% 1% 2% 2%
Limpopo 3% 3% 4% 2.5% 3% 3% 5% 5% 5%
Eastern Cape 0.6% 0.7% 0.8% 0.5% 0% 1% 0% 0% 0%
Northern Cape 0.3% 0.3% 0.5% 0.5% 0% 0% 0% 0% 1%
Outside RSA 0.6% 1% 0.2% 0.5% 0% 1% 1% 1% 0%
14%
20%
16%
15%
12%
7%
16%
<= R20 000
R20 001-R140 000
R140 001-R221 000
R221 001-R305 000
R305 001-R431 000
R431 001-R552 000
>= R552 001
8
ECONOMIC PROFILE
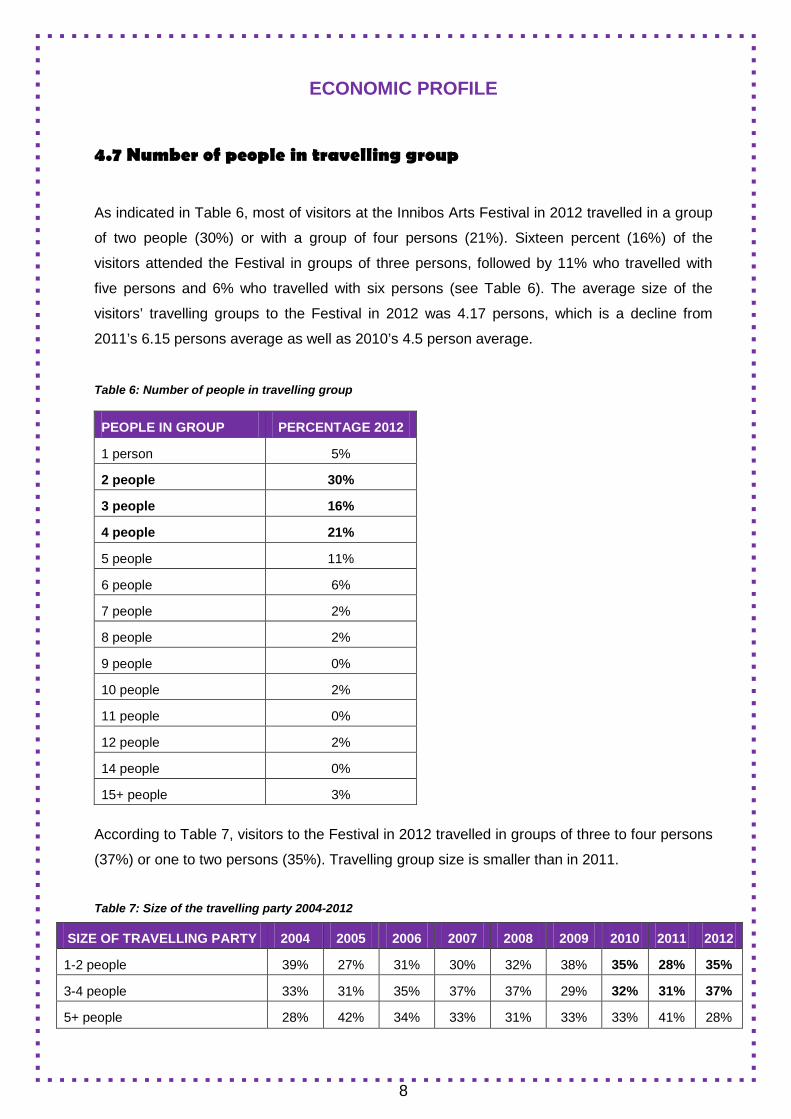
4.7 Number of people in travelling group
As indicated in Table 6, most of visitors at the Innibos Arts Festival in 2012 travelled in a group
of two people (30%) or with a group of four persons (21%). Sixteen percent (16%) of the
visitors attended the Festival in groups of three persons, followed by 11% who travelled with
five persons and 6% who travelled with six persons (see Table 6). The average size of the
visitors’ travelling groups to the Festival in 2012 was 4.17 persons, which is a decline from
2011’s 6.15 persons average as well as 2010’s 4.5 person average.
Table 6: Number of people in travelling group
According to Table 7, visitors to the Festival in 2012 travelled in groups of three to four persons
(37%) or one to two persons (35%). Travelling group size is smaller than in 2011.
Table 7: Size of the travelling party 2004-2012
SIZE OF TRAVELLING PARTY 2004 2005 2006 2007 2008 2009 2010 2011 2012
1-2 people 39% 27% 31% 30% 32% 38% 35% 28% 35%
3-4 people 33% 31% 35% 37% 37% 29% 32% 31% 37%
5+ people 28% 42% 34% 33% 31% 33% 33% 41% 28%
PEOPLE IN GROUP PERCENTAGE 2012
1 person 5%
2 people 30%
3 people 16%
4 people 21%
5 people 11%
6 people 6%
7 people 2%
8 people 2%
9 people 0%
10 people 2%
11 people 0%
12 people 2%
14 people 0%
15+ people 3%
9
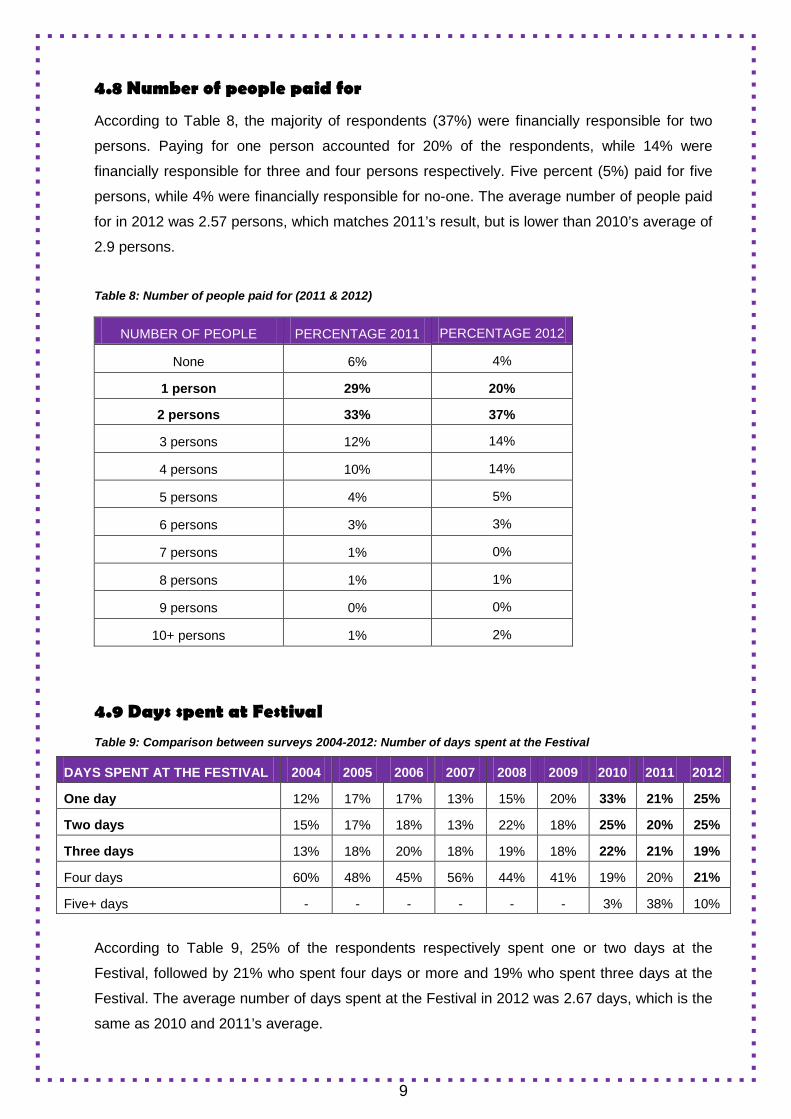
4.8 Number of people paid for
According to Table 8, the majority of respondents (37%) were financially responsible for two
persons. Paying for one person accounted for 20% of the respondents, while 14% were
financially responsible for three and four persons respectively. Five percent (5%) paid for five
persons, while 4% were financially responsible for no-one. The average number of people paid
for in 2012 was 2.57 persons, which matches 2011’s result, but is lower than 2010’s average of
2.9 persons.
Table 8: Number of people paid for (2011 & 2012)
4.9 Days spent at Festival Table 9: Comparison between surveys 2004-2012: Number of days spent at the Festival
DAYS SPENT AT THE FESTIVAL 2004 2005 2006 2007 2008 2009 2010 2011 2012
One day 12% 17% 17% 13% 15% 20% 33% 21% 25%
Two days 15% 17% 18% 13% 22% 18% 25% 20% 25%
Three days 13% 18% 20% 18% 19% 18% 22% 21% 19%
Four days 60% 48% 45% 56% 44% 41% 19% 20% 21%
Five+ days - - - - - - 3% 38% 10%
According to Table 9, 25% of the respondents respectively spent one or two days at the
Festival, followed by 21% who spent four days or more and 19% who spent three days at the
Festival. The average number of days spent at the Festival in 2012 was 2.67 days, which is the
same as 2010 and 2011’s average.
NUMBER OF PEOPLE PERCENTAGE 2011 PERCENTAGE 2012
None 6% 4%
1 person 29% 20%
2 persons 33% 37%
3 persons 12% 14%
4 persons 10% 14%
5 persons 4% 5%
6 persons 3% 3%
7 persons 1% 0%
8 persons 1% 1%
9 persons 0% 0%
10+ persons 1% 2%
10
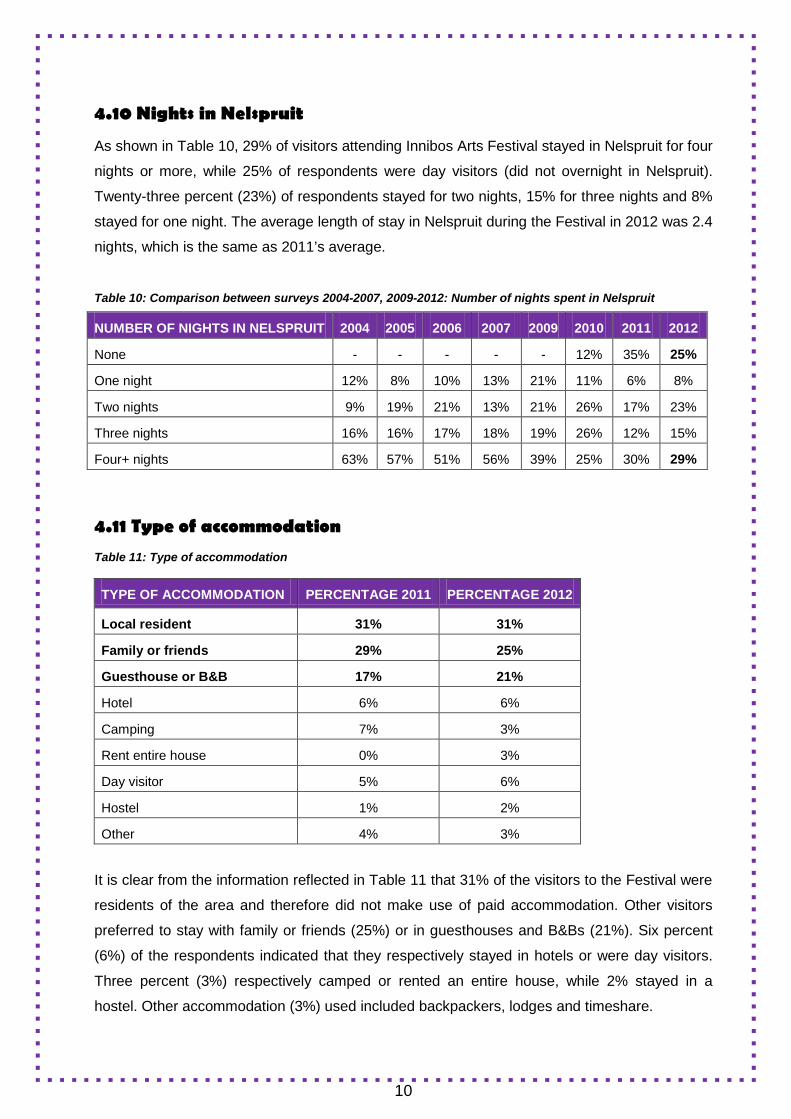
4.10 Nights in Nelspruit
As shown in Table 10, 29% of visitors attending Innibos Arts Festival stayed in Nelspruit for four
nights or more, while 25% of respondents were day visitors (did not overnight in Nelspruit).
Twenty-three percent (23%) of respondents stayed for two nights, 15% for three nights and 8%
stayed for one night. The average length of stay in Nelspruit during the Festival in 2012 was 2.4
nights, which is the same as 2011’s average.
Table 10: Comparison between surveys 2004-2007, 2009-2012: Number of nights spent in Nelspruit
NUMBER OF NIGHTS IN NELSPRUIT 2004 2005 2006 2007 2009 2010 2011 2012
None - - - - - 12% 35% 25%
One night 12% 8% 10% 13% 21% 11% 6% 8%
Two nights 9% 19% 21% 13% 21% 26% 17% 23%
Three nights 16% 16% 17% 18% 19% 26% 12% 15%
Four+ nights 63% 57% 51% 56% 39% 25% 30% 29%
4.11 Type of accommodation Table 11: Type of accommodation
It is clear from the information reflected in Table 11 that 31% of the visitors to the Festival were
residents of the area and therefore did not make use of paid accommodation. Other visitors
preferred to stay with family or friends (25%) or in guesthouses and B&Bs (21%). Six percent
(6%) of the respondents indicated that they respectively stayed in hotels or were day visitors.
Three percent (3%) respectively camped or rented an entire house, while 2% stayed in a
hostel. Other accommodation (3%) used included backpackers, lodges and timeshare.
TYPE OF ACCOMMODATION PERCENTAGE 2011 PERCENTAGE 2012
Local resident 31% 31%
Family or friends 29% 25%
Guesthouse or B&B 17% 21%
Hotel 6% 6%
Camping 7% 3%
Rent entire house 0% 3%
Day visitor 5% 6%
Hostel 1% 2%
Other 4% 3%
11
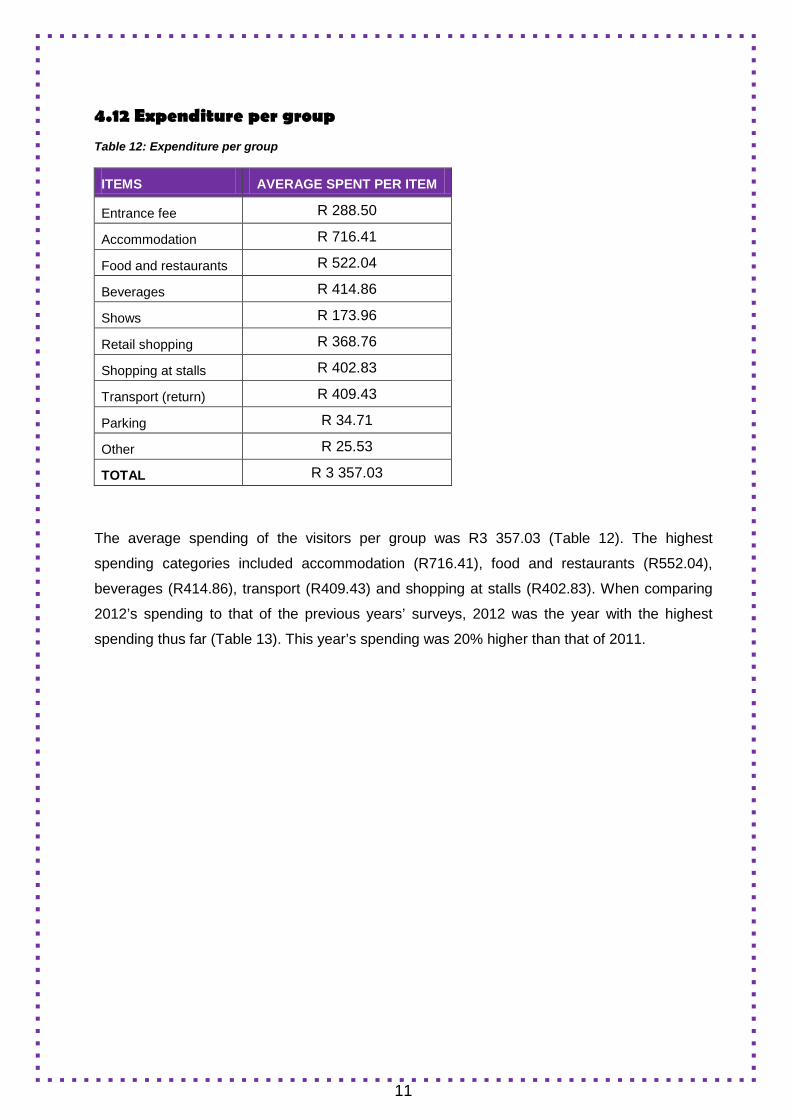
4.12 Expenditure per group Table 12: Expenditure per group
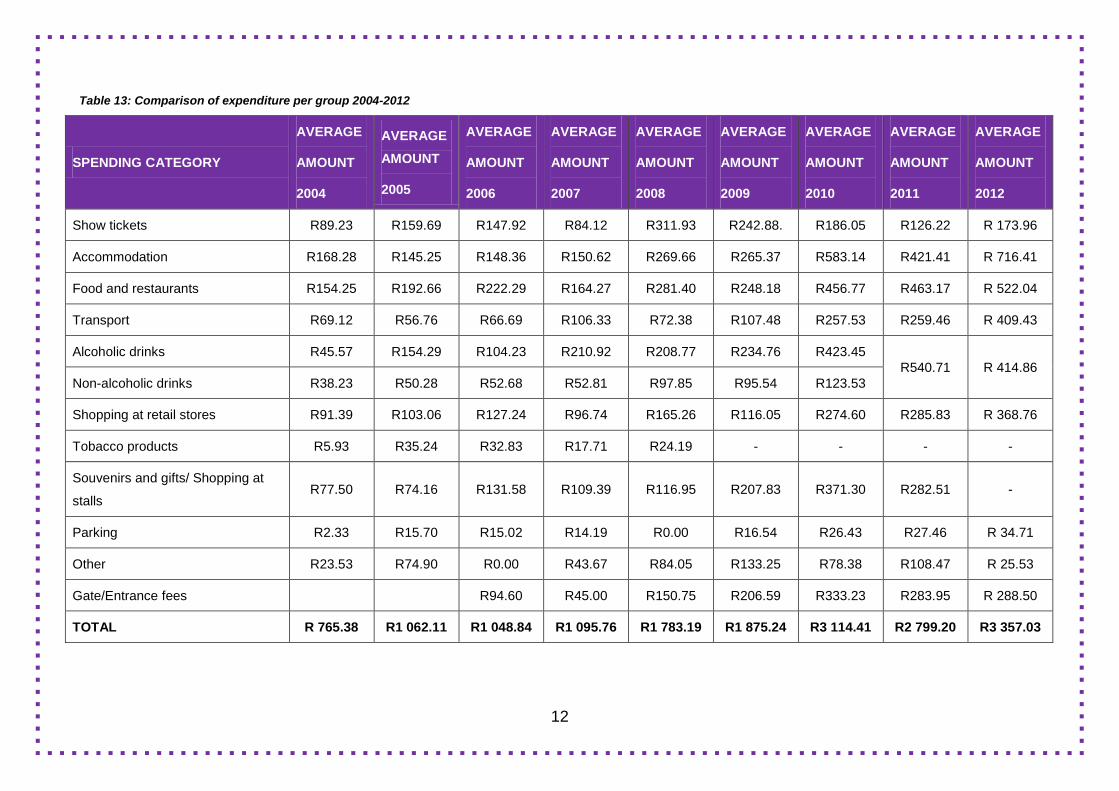
The average spending of the visitors per group was R3 357.03 (Table 12). The highest
spending categories included accommodation (R716.41), food and restaurants (R552.04),
beverages (R414.86), transport (R409.43) and shopping at stalls (R402.83). When comparing
2012’s spending to that of the previous years’ surveys, 2012 was the year with the highest
spending thus far (Table 13). This year’s spending was 20% higher than that of 2011.
ITEMS AVERAGE SPENT PER ITEM
Entrance fee R 288.50
Accommodation R 716.41
Food and restaurants R 522.04
Beverages R 414.86
Shows R 173.96
Retail shopping R 368.76
Shopping at stalls R 402.83
Transport (return) R 409.43
Parking R 34.71
Other R 25.53
TOTAL R 3 357.03
12
Table 13: Comparison of expenditure per group 2004-2012
SPENDING CATEGORY
AVERAGE
AMOUNT
2004
AVERAGE AMOUNT
2005
AVERAGE
AMOUNT
2006
AVERAGE
AMOUNT
2007
AVERAGE
AMOUNT
2008
AVERAGE
AMOUNT
2009
AVERAGE
AMOUNT
2010
AVERAGE
AMOUNT
2011
AVERAGE
AMOUNT
2012
Show tickets R89.23 R159.69 R147.92 R84.12 R311.93 R242.88. R186.05 R126.22 R 173.96
Accommodation R168.28 R145.25 R148.36 R150.62 R269.66 R265.37 R583.14 R421.41 R 716.41
Food and restaurants R154.25 R192.66 R222.29 R164.27 R281.40 R248.18 R456.77 R463.17 R 522.04
Transport R69.12 R56.76 R66.69 R106.33 R72.38 R107.48 R257.53 R259.46 R 409.43
Alcoholic drinks R45.57 R154.29 R104.23 R210.92 R208.77 R234.76 R423.45 R540.71 R 414.86
Non-alcoholic drinks R38.23 R50.28 R52.68 R52.81 R97.85 R95.54 R123.53
Shopping at retail stores R91.39 R103.06 R127.24 R96.74 R165.26 R116.05 R274.60 R285.83 R 368.76
Tobacco products R5.93 R35.24 R32.83 R17.71 R24.19 - - - -
Souvenirs and gifts/ Shopping at
stalls R77.50 R74.16 R131.58 R109.39 R116.95 R207.83 R371.30 R282.51 -
Parking R2.33 R15.70 R15.02 R14.19 R0.00 R16.54 R26.43 R27.46 R 34.71
Other R23.53 R74.90 R0.00 R43.67 R84.05 R133.25 R78.38 R108.47 R 25.53
Gate/Entrance fees R94.60 R45.00 R150.75 R206.59 R333.23 R283.95 R 288.50
TOTAL R 765.38 R1 062.11 R1 048.84 R1 095.76 R1 783.19 R1 875.24 R3 114.41 R2 799.20 R3 357.03
11
13
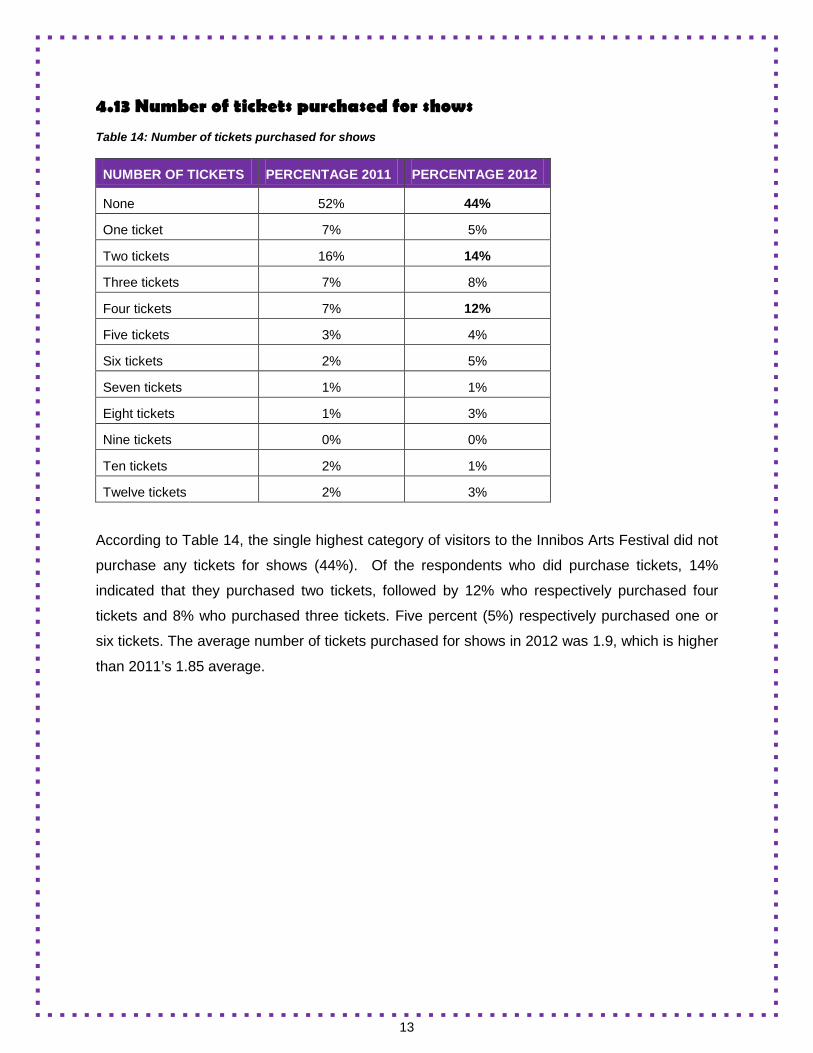
4.13 Number of tickets purchased for shows Table 14: Number of tickets purchased for shows
According to Table 14, the single highest category of visitors to the Innibos Arts Festival did not
purchase any tickets for shows (44%). Of the respondents who did purchase tickets, 14%
indicated that they purchased two tickets, followed by 12% who respectively purchased four
tickets and 8% who purchased three tickets. Five percent (5%) respectively purchased one or
six tickets. The average number of tickets purchased for shows in 2012 was 1.9, which is higher
than 2011’s 1.85 average.
NUMBER OF TICKETS PERCENTAGE 2011 PERCENTAGE 2012
None 52% 44%
One ticket 7% 5%
Two tickets 16% 14%
Three tickets 7% 8%
Four tickets 7% 12%
Five tickets 3% 4%
Six tickets 2% 5%
Seven tickets 1% 1%
Eight tickets 1% 3%
Nine tickets 0% 0%
Ten tickets 2% 1%
Twelve tickets 2% 3%
14
CONSUMER PROFILE
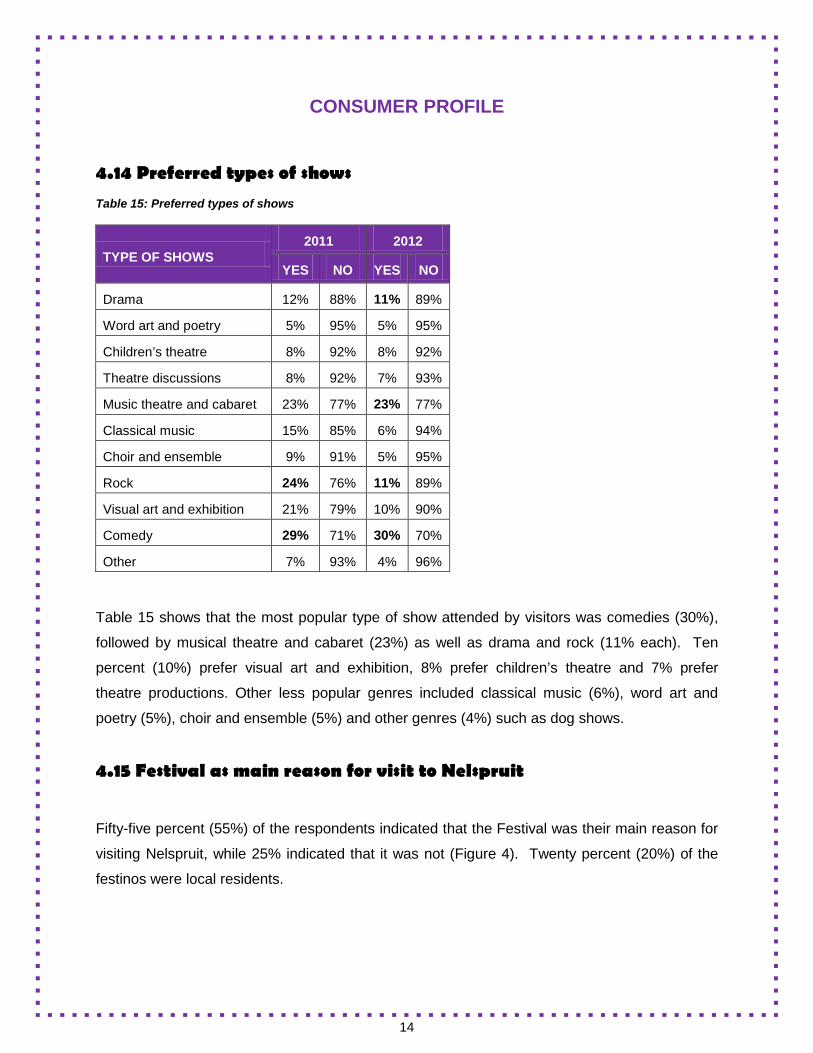
4.14 Preferred types of shows Table 15: Preferred types of shows
Table 15 shows that the most popular type of show attended by visitors was comedies (30%),
followed by musical theatre and cabaret (23%) as well as drama and rock (11% each). Ten
percent (10%) prefer visual art and exhibition, 8% prefer children’s theatre and 7% prefer
theatre productions. Other less popular genres included classical music (6%), word art and
poetry (5%), choir and ensemble (5%) and other genres (4%) such as dog shows.
4.15 Festival as main reason for visit to Nelspruit
Fifty-five percent (55%) of the respondents indicated that the Festival was their main reason for
visiting Nelspruit, while 25% indicated that it was not (Figure 4). Twenty percent (20%) of the
festinos were local residents.
TYPE OF SHOWS 2011 2012
YES NO YES NO
Drama 12% 88% 11% 89%
Word art and poetry 5% 95% 5% 95%
Children’s theatre 8% 92% 8% 92%
Theatre discussions 8% 92% 7% 93%
Music theatre and cabaret 23% 77% 23% 77%
Classical music 15% 85% 6% 94%
Choir and ensemble 9% 91% 5% 95%
Rock 24% 76% 11% 89%
Visual art and exhibition 21% 79% 10% 90%
Comedy 29% 71% 30% 70%
Other 7% 93% 4% 96%

15
Figure 4: Festival as main reason for visit to Nelspruit
4.16 Other festivals attended
Visitors indicated that they also attend the Aardklop National Arts Festival (33%), followed by
the KKNK (18%) (see Figure 5). Eight percent (8%) of the visitors indicated that they attended
other festivals such as Oppikoppi and the Crayfish festival. Four percent (4%) of respondents
also attended Vryfees and 3% attended the Grahamstown Arts Festival.
Figure 5: Other festivals attended
Yes55%
No25%
Local20%
18%
3% 4%
33%
8%
KKNK Grahamstown Vryfees Aardklop Other

16
4.17 Decision to attend Festival
In this section, respondents were asked when the decision was taken to visit the Festival, as
well as who initiated the trip to Nelspruit.
4.17.1 Type of decision
Figure 6: Decision to attend Festival
According to Figure 6, the majority of visitors (43%) to the Innibos Arts Festival made their
decision to attend the Festival more than a month ago. Thirty-one percent (31%) indicated that
it was a spontaneous decision, while 15% made their decision to attend less than a month ago.
Eleven percent (11%) (Other) indicated that they made their decision right after last years’
festival and that it was an annual commitment.
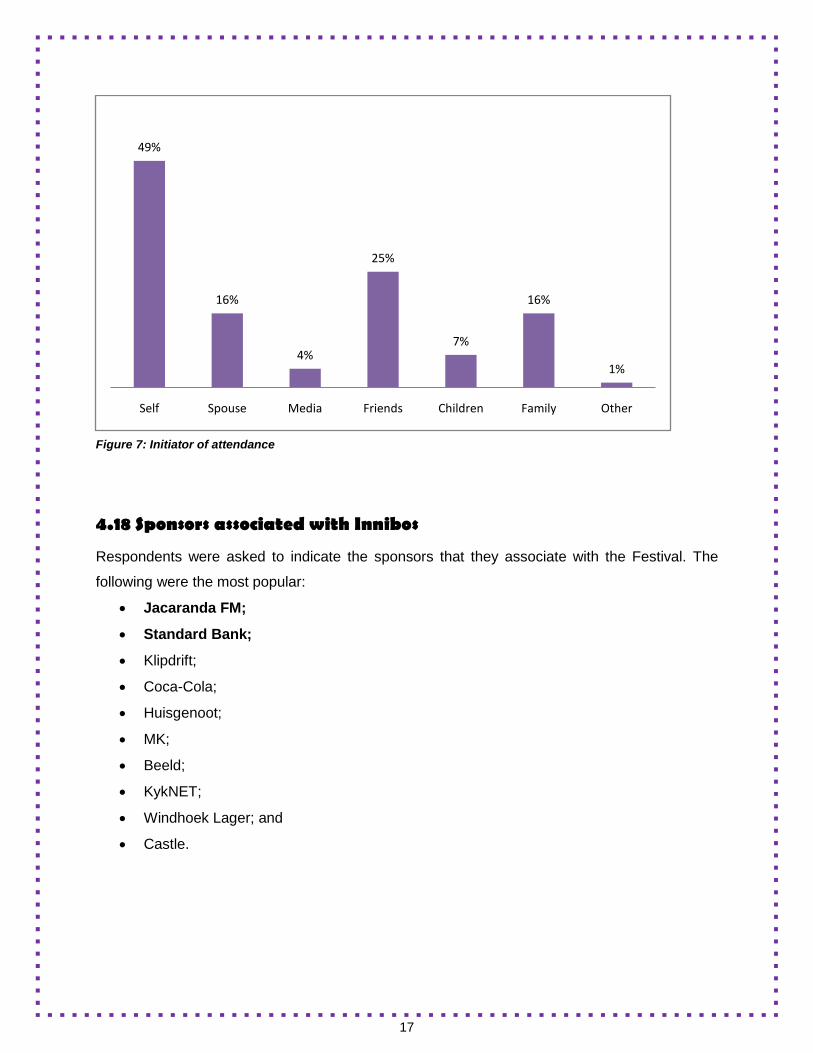
4.17.2 Initiator of trip
It is clear from Figure 7 that the majority of respondents (49%) at the Innibos National Arts
Festival in Nelspruit in 2012 initiated the trip to the Festival themselves, followed by friends
(25%), spouses or family (25% each) and media (4%) who initiated the trip. One percent (1%) of
trips was initiated by respondents’ boyfriends or girlfriends.
31%
15%
43%
11%
Spontaneous decision
Less than a month ago
More than a month ago
Other
17
Figure 7: Initiator of attendance
4.18 Sponsors associated with Innibos
Respondents were asked to indicate the sponsors that they associate with the Festival. The
following were the most popular:
• Jacaranda FM;
• Standard Bank;
• Klipdrift;
• Coca-Cola;
• Huisgenoot;
• MK;
• Beeld;
• KykNET;
• Windhoek Lager; and
• Castle.
49%
16%
4%
25%
7%
16%
1%
Self Spouse Media Friends Children Family Other

18
4.19 Number of visits to Festival
Even though this Festival was nine years old in 2012, it is interesting to note that it still attracts a
high number of first-time visitors (33%). Sixteen percent (16%) of the visitors have attended this
Festival twice and 13% have been attending the Festival since it started nine years ago. Twelve
percent (12%) attended the Festival for the third time, 8% for the fourth time and 6% for the fifth
time (Table 16). The average number of times that the visitors have attended this Festival was
3.63 times, which is more than 2011’s average of 2.52 times and 2010’s 2.6 times.
Table 16: Number of visits to the Festival
NUMBER OF VISITS 2011 2012
First time 31% 33%
Twice 17% 16%
3 Times 17% 12%
4 Times 11% 8%
5 Times 12% 6%
6 Times 6% 3%
7 Times 3% 3%
8 Times 3% 5%
9 Times - 13%
4.20 Motivation to attend the Festival
This question focused on the motivating factors for attending the Innibos Arts Festival. This
information can be used when developing marketing strategies for specific markets.
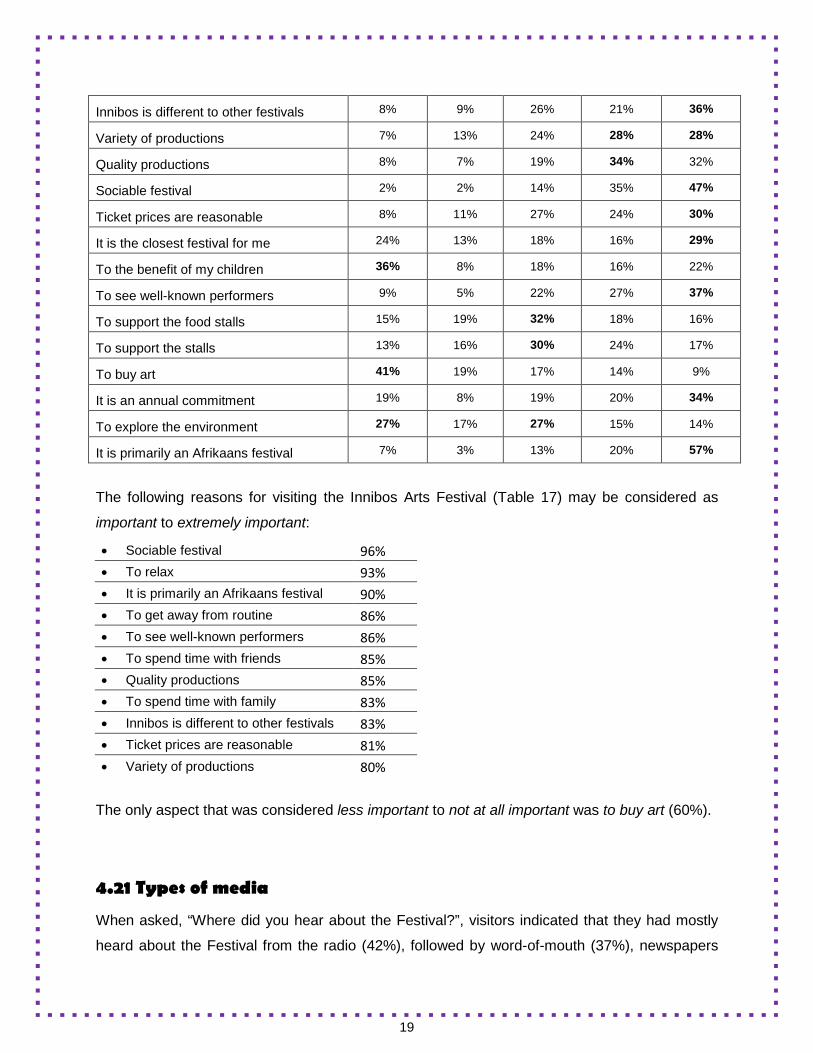
Table 17: Motivation to attend the Festival
MOTIVATIONAL FACTORS Not at all
important
Less
important Important Very
important Extremely important
To get away from routine 7% 7% 23% 20% 43%
To relax 4% 3% 15% 28% 50%
To spend time with family 9% 8% 16% 24% 43%
To spend time with friends 7% 8% 18% 28% 39%
To meet new people 26% 21% 23% 14% 16%
19
Innibos is different to other festivals 8% 9% 26% 21% 36%
Variety of productions 7% 13% 24% 28% 28%
Quality productions 8% 7% 19% 34% 32%
Sociable festival 2% 2% 14% 35% 47%
Ticket prices are reasonable 8% 11% 27% 24% 30%
It is the closest festival for me 24% 13% 18% 16% 29%
To the benefit of my children 36% 8% 18% 16% 22%
To see well-known performers 9% 5% 22% 27% 37%
To support the food stalls 15% 19% 32% 18% 16%
To support the stalls 13% 16% 30% 24% 17%
To buy art 41% 19% 17% 14% 9%
It is an annual commitment 19% 8% 19% 20% 34%
To explore the environment 27% 17% 27% 15% 14%
It is primarily an Afrikaans festival 7% 3% 13% 20% 57%
The following reasons for visiting the Innibos Arts Festival (Table 17) may be considered as
important to extremely important:
• Sociable festival 96% • To relax 93% • It is primarily an Afrikaans festival 90% • To get away from routine 86% • To see well-known performers 86% • To spend time with friends 85% • Quality productions 85% • To spend time with family 83% • Innibos is different to other festivals 83% • Ticket prices are reasonable 81% • Variety of productions 80%
The only aspect that was considered less important to not at all important was to buy art (60%).
4.21 Types of media
When asked, “Where did you hear about the Festival?”, visitors indicated that they had mostly
heard about the Festival from the radio (42%), followed by word-of-mouth (37%), newspapers
20
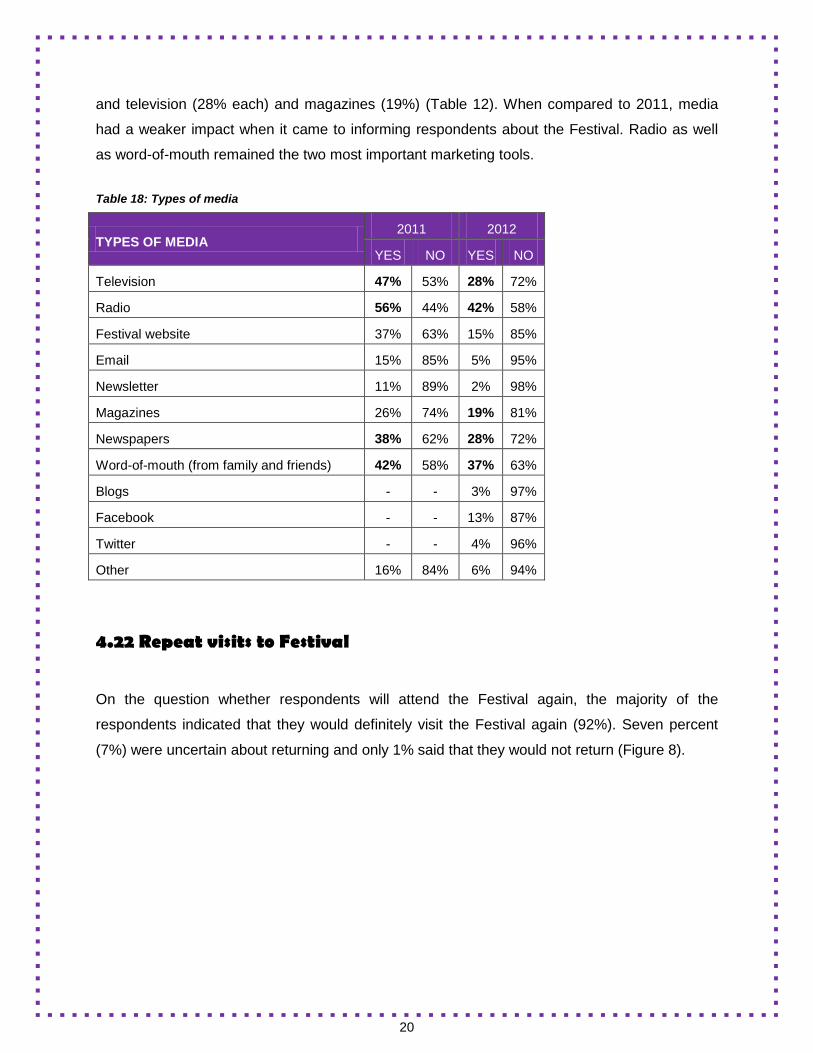
and television (28% each) and magazines (19%) (Table 12). When compared to 2011, media
had a weaker impact when it came to informing respondents about the Festival. Radio as well
as word-of-mouth remained the two most important marketing tools.
Table 18: Types of media
TYPES OF MEDIA 2011 2012
YES NO YES NO
Television 47% 53% 28% 72%
Radio 56% 44% 42% 58%
Festival website 37% 63% 15% 85%
Email 15% 85% 5% 95%
Newsletter 11% 89% 2% 98%
Magazines 26% 74% 19% 81%
Newspapers 38% 62% 28% 72%
Word-of-mouth (from family and friends) 42% 58% 37% 63%
Blogs - - 3% 97%
Facebook - - 13% 87%
Twitter - - 4% 96%
Other 16% 84% 6% 94%
4.22 Repeat visits to Festival
On the question whether respondents will attend the Festival again, the majority of the
respondents indicated that they would definitely visit the Festival again (92%). Seven percent
(7%) were uncertain about returning and only 1% said that they would not return (Figure 8).

21
Figure 8: Repeat visits to Festival
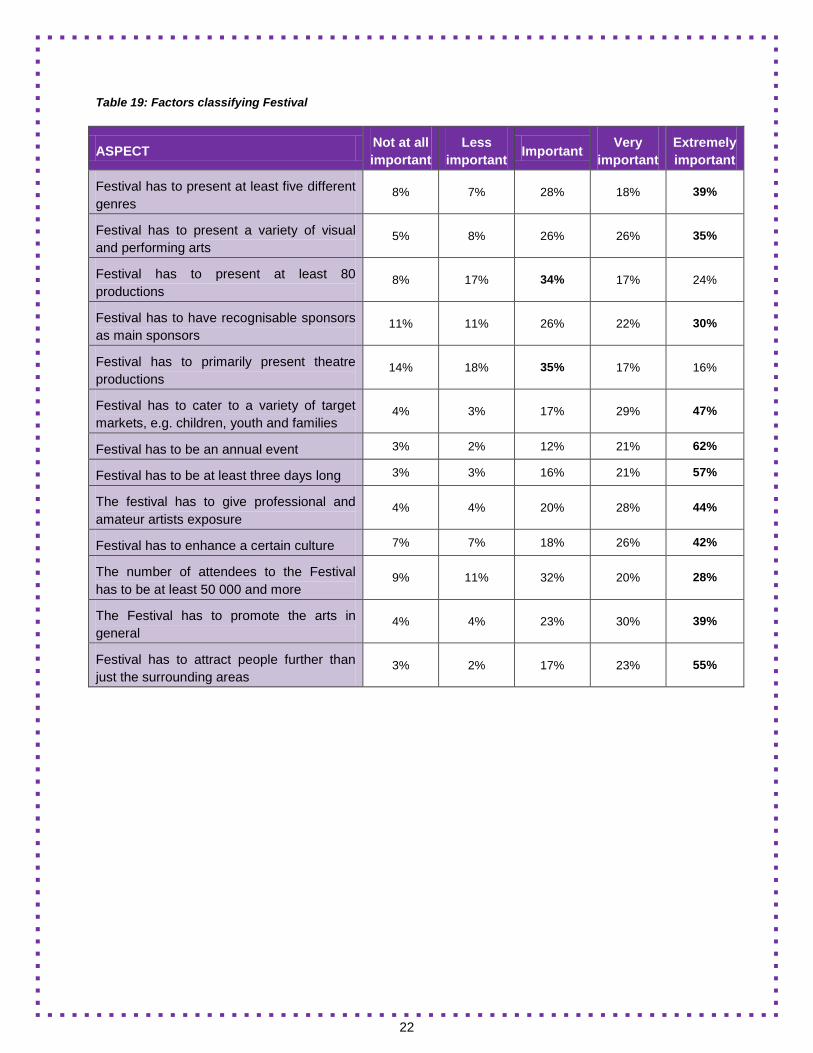
4.23 Factors that classify national arts festivals
Respondents were asked to indicate how important certain aspects are when classifying a
national arts festival. The respondents rated the following aspects as important to extremely
important:
• Festival has to attract people further than just the surrounding areas 95%
• Festival has to be an annual event 95%
• Festival has to be at least three days long 94%
• Festival has to cater to a variety of target markets, e.g. children, youth and families 93%
• The festival has to give professional and amateur artists exposure 92%
• The Festival has to promote the arts in general 92%
Respondents felt that all aspects were important for the classification of an arts festival.
Yes, definitely92%
No, definitely not1%
Perhaps7%
22
Table 19: Factors classifying Festival
ASPECT Not at all important
Less important Important Very
important Extremely important
Festival has to present at least five different genres
8% 7% 28% 18% 39%
Festival has to present a variety of visual and performing arts
5% 8% 26% 26% 35%
Festival has to present at least 80 productions
8% 17% 34% 17% 24%
Festival has to have recognisable sponsors as main sponsors
11% 11% 26% 22% 30%
Festival has to primarily present theatre productions
14% 18% 35% 17% 16%
Festival has to cater to a variety of target markets, e.g. children, youth and families
4% 3% 17% 29% 47%
Festival has to be an annual event 3% 2% 12% 21% 62%
Festival has to be at least three days long 3% 3% 16% 21% 57%
The festival has to give professional and amateur artists exposure
4% 4% 20% 28% 44%
Festival has to enhance a certain culture 7% 7% 18% 26% 42%
The number of attendees to the Festival has to be at least 50 000 and more
9% 11% 32% 20% 28%
The Festival has to promote the arts in general
4% 4% 23% 30% 39%
Festival has to attract people further than just the surrounding areas
3% 2% 17% 23% 55%
23
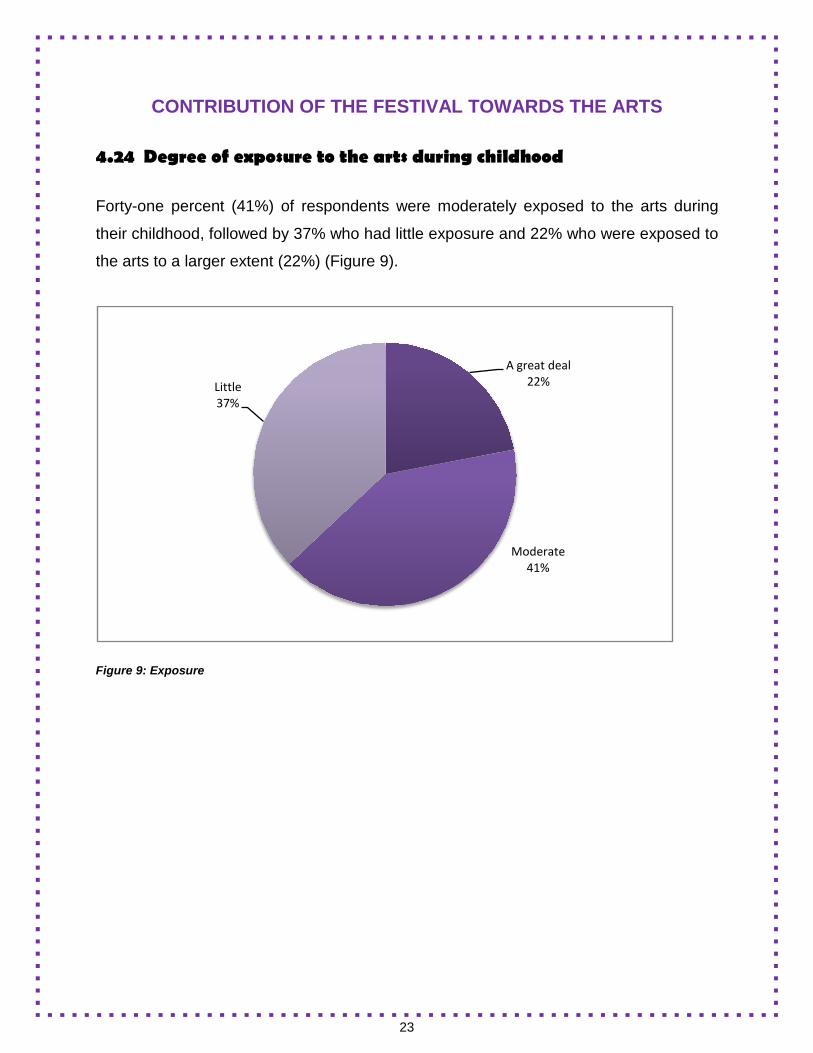
CONTRIBUTION OF THE FESTIVAL TOWARDS THE ARTS 4.24 Degree of exposure to the arts during childhood
Forty-one percent (41%) of respondents were moderately exposed to the arts during
their childhood, followed by 37% who had little exposure and 22% who were exposed to
the arts to a larger extent (22%) (Figure 9).
Figure 9: Exposure
A great deal22%
Moderate41%
Little37%
24
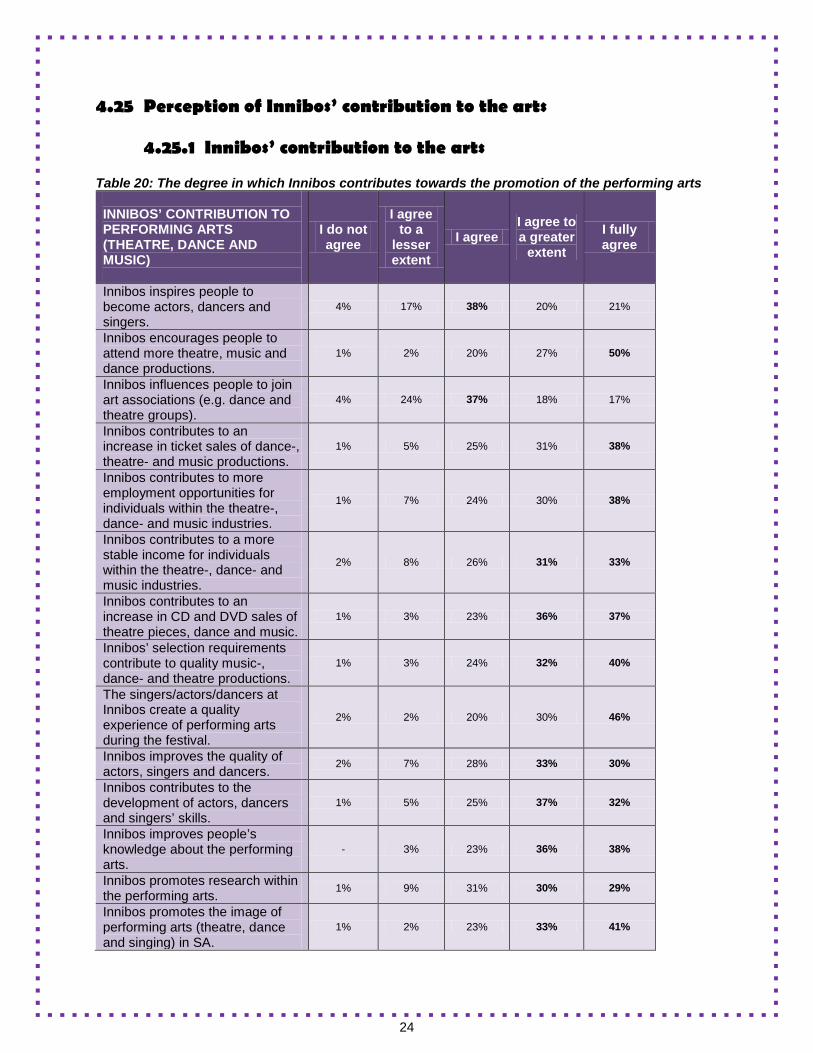
4.25 Perception of Innibos’ contribution to the arts
4.25.1 Innibos’ contribution to the arts Table 20: The degree in which Innibos contributes towards the promotion of the performing arts INNIBOS’ CONTRIBUTION TO PERFORMING ARTS (THEATRE, DANCE AND MUSIC)
I do not agree
I agree to a
lesser extent
I agree I agree to a greater
extent
I fully agree
Innibos inspires people to become actors, dancers and singers.
4% 17% 38% 20% 21%
Innibos encourages people to attend more theatre, music and dance productions.
1% 2% 20% 27% 50%
Innibos influences people to join art associations (e.g. dance and theatre groups).
4% 24% 37% 18% 17%
Innibos contributes to an increase in ticket sales of dance-, theatre- and music productions.
1% 5% 25% 31% 38%
Innibos contributes to more employment opportunities for individuals within the theatre-, dance- and music industries.
1% 7% 24% 30% 38%
Innibos contributes to a more stable income for individuals within the theatre-, dance- and music industries.
2% 8% 26% 31% 33%
Innibos contributes to an increase in CD and DVD sales of theatre pieces, dance and music.
1% 3% 23% 36% 37%
Innibos’ selection requirements contribute to quality music-, dance- and theatre productions.
1% 3% 24% 32% 40%
The singers/actors/dancers at Innibos create a quality experience of performing arts during the festival.
2% 2% 20% 30% 46%
Innibos improves the quality of actors, singers and dancers. 2% 7% 28% 33% 30%
Innibos contributes to the development of actors, dancers and singers’ skills.
1% 5% 25% 37% 32%
Innibos improves people’s knowledge about the performing arts.
- 3% 23% 36% 38%
Innibos promotes research within the performing arts. 1% 9% 31% 30% 29%
Innibos promotes the image of performing arts (theatre, dance and singing) in SA.
1% 2% 23% 33% 41%
25
The marketing of Innibos makes people more aware of the productions in the country in general.
2% 2% 15% 34% 47%
Innibos markets well-known as well as new artists within the performing arts.
1% 2% 20% 36% 41%
Innibos establishes networking opportunities for performing artists.
1% 2% 24% 37% 36%
Due to Innibos, the number and variety of productions in SA have increased.
1% 5% 27% 33% 34%
Innibos’ existence has led to the development of other arts festivals in SA.
4% 12% 29% 26% 29%
Innibos contributes to an increase in the production of production/music CDs and DVDs.
1% 6% 32% 33% 28%
Because of Innibos, there are a growing number of actors, dancers and singers that have entered the market.
1% 11% 34% 27% 27%
Innibos’ financial support contributes to an increase in productions.
1% 4% 32% 30% 33%
Innibos develops infrastructure for theatre, dance and music productions.
1% 5% 31% 33% 30%
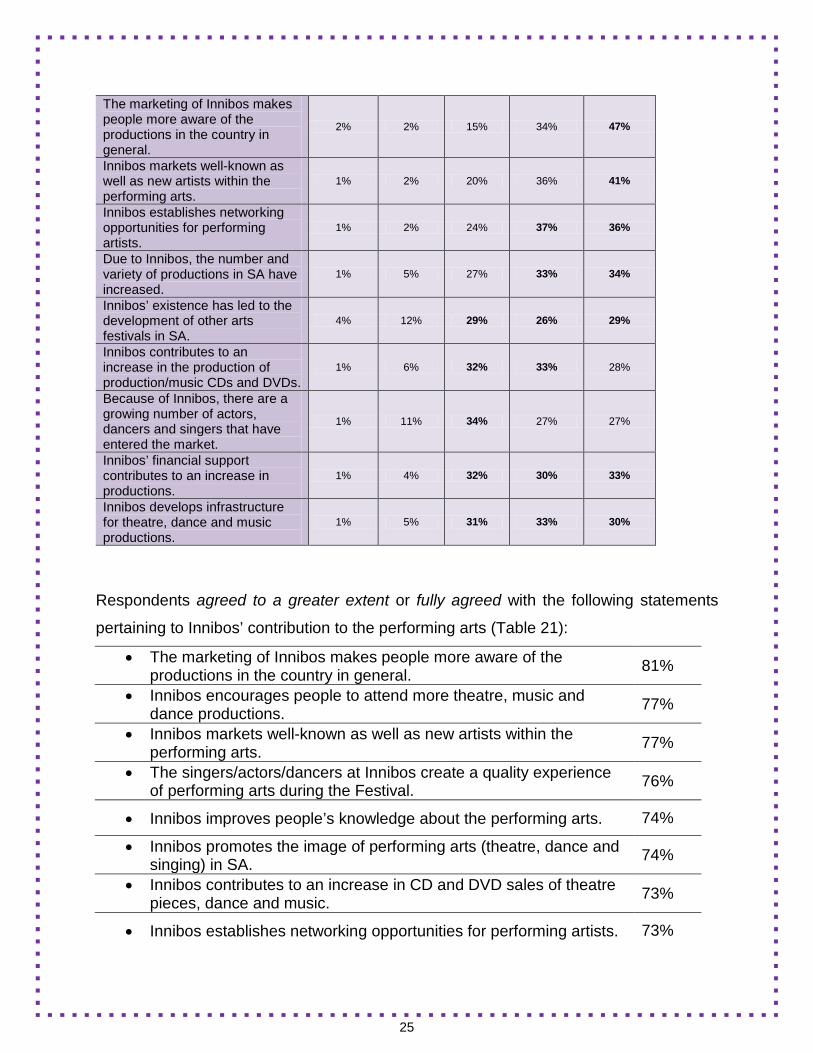
Respondents agreed to a greater extent or fully agreed with the following statements
pertaining to Innibos’ contribution to the performing arts (Table 21):
• The marketing of Innibos makes people more aware of the productions in the country in general. 81%
• Innibos encourages people to attend more theatre, music and dance productions. 77%
• Innibos markets well-known as well as new artists within the performing arts. 77%
• The singers/actors/dancers at Innibos create a quality experience of performing arts during the Festival. 76%
• Innibos improves people’s knowledge about the performing arts. 74%
• Innibos promotes the image of performing arts (theatre, dance and singing) in SA. 74%
• Innibos contributes to an increase in CD and DVD sales of theatre pieces, dance and music. 73%
• Innibos establishes networking opportunities for performing artists. 73%
26
• Innibos’ selection requirements contribute to quality music-, dance- and theatre productions.
72%
Respondents agreed to a lesser extent or did not agree at all with the following
statements pertaining to Innibos’ contribution to the visual arts (Table 23):
• Innibos influences people to join art associations (e.g. dance and theatre groups). 28%
• Innibos inspires people to become actors, dancers and singers. 21%
• Innibos’ existence has led to the development of other arts festivals in SA. 16%
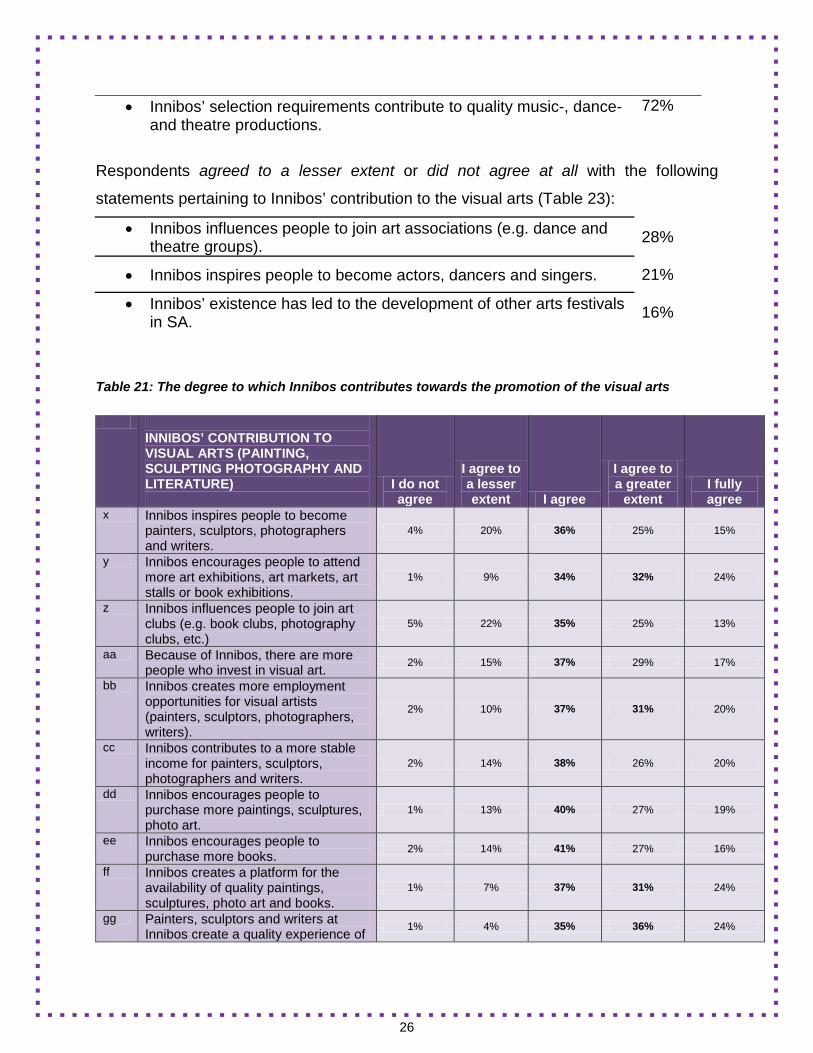
Table 21: The degree to which Innibos contributes towards the promotion of the visual arts
INNIBOS’ CONTRIBUTION TO VISUAL ARTS (PAINTING, SCULPTING PHOTOGRAPHY AND LITERATURE)
I do not agree
I agree to a lesser extent I agree
I agree to a greater
extent I fully agree
x Innibos inspires people to become painters, sculptors, photographers and writers.
4% 20% 36% 25% 15%
y Innibos encourages people to attend more art exhibitions, art markets, art stalls or book exhibitions.
1% 9% 34% 32% 24%
z Innibos influences people to join art clubs (e.g. book clubs, photography clubs, etc.)
5% 22% 35% 25% 13%
aa Because of Innibos, there are more people who invest in visual art. 2% 15% 37% 29% 17%
bb Innibos creates more employment opportunities for visual artists (painters, sculptors, photographers, writers).
2% 10% 37% 31% 20%
cc Innibos contributes to a more stable income for painters, sculptors, photographers and writers.
2% 14% 38% 26% 20%
dd Innibos encourages people to purchase more paintings, sculptures, photo art.
1% 13% 40% 27% 19%
ee Innibos encourages people to purchase more books. 2% 14% 41% 27% 16%
ff Innibos creates a platform for the availability of quality paintings, sculptures, photo art and books.
1% 7% 37% 31% 24%
gg Painters, sculptors and writers at Innibos create a quality experience of 1% 4% 35% 36% 24%
27
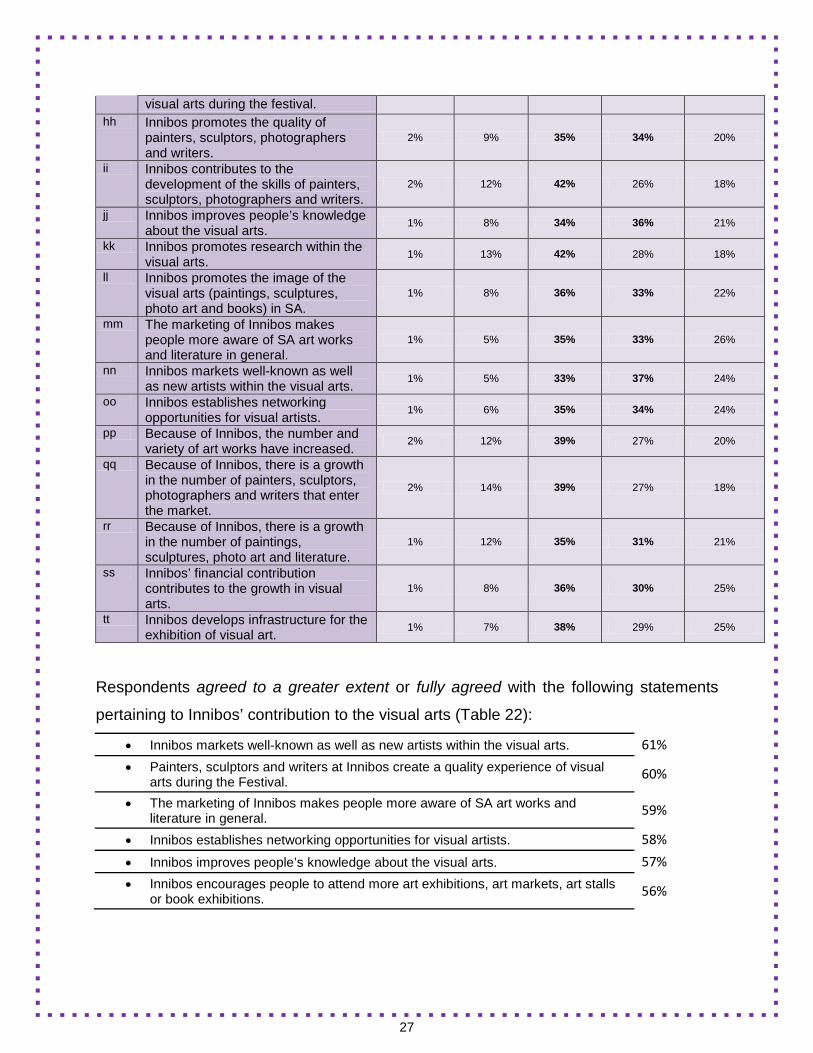
visual arts during the festival. hh Innibos promotes the quality of
painters, sculptors, photographers and writers.
2% 9% 35% 34% 20%
ii Innibos contributes to the development of the skills of painters, sculptors, photographers and writers.
2% 12% 42% 26% 18%
jj Innibos improves people’s knowledge about the visual arts. 1% 8% 34% 36% 21%
kk Innibos promotes research within the visual arts. 1% 13% 42% 28% 18%
ll Innibos promotes the image of the visual arts (paintings, sculptures, photo art and books) in SA.
1% 8% 36% 33% 22%
mm The marketing of Innibos makes people more aware of SA art works and literature in general.
1% 5% 35% 33% 26%
nn Innibos markets well-known as well as new artists within the visual arts. 1% 5% 33% 37% 24%
oo Innibos establishes networking opportunities for visual artists. 1% 6% 35% 34% 24%
pp Because of Innibos, the number and variety of art works have increased. 2% 12% 39% 27% 20%
qq Because of Innibos, there is a growth in the number of painters, sculptors, photographers and writers that enter the market.
2% 14% 39% 27% 18%
rr Because of Innibos, there is a growth in the number of paintings, sculptures, photo art and literature.
1% 12% 35% 31% 21%
ss Innibos’ financial contribution contributes to the growth in visual arts.
1% 8% 36% 30% 25%
tt Innibos develops infrastructure for the exhibition of visual art. 1% 7% 38% 29% 25%
Respondents agreed to a greater extent or fully agreed with the following statements
pertaining to Innibos’ contribution to the visual arts (Table 22):
• Innibos markets well-known as well as new artists within the visual arts. 61%
• Painters, sculptors and writers at Innibos create a quality experience of visual arts during the Festival. 60%
• The marketing of Innibos makes people more aware of SA art works and literature in general. 59%
• Innibos establishes networking opportunities for visual artists. 58%
• Innibos improves people’s knowledge about the visual arts. 57%
• Innibos encourages people to attend more art exhibitions, art markets, art stalls or book exhibitions. 56%
28
Respondents agreed to a lesser extent or did not agree at all with no aspects named
(Table 22).
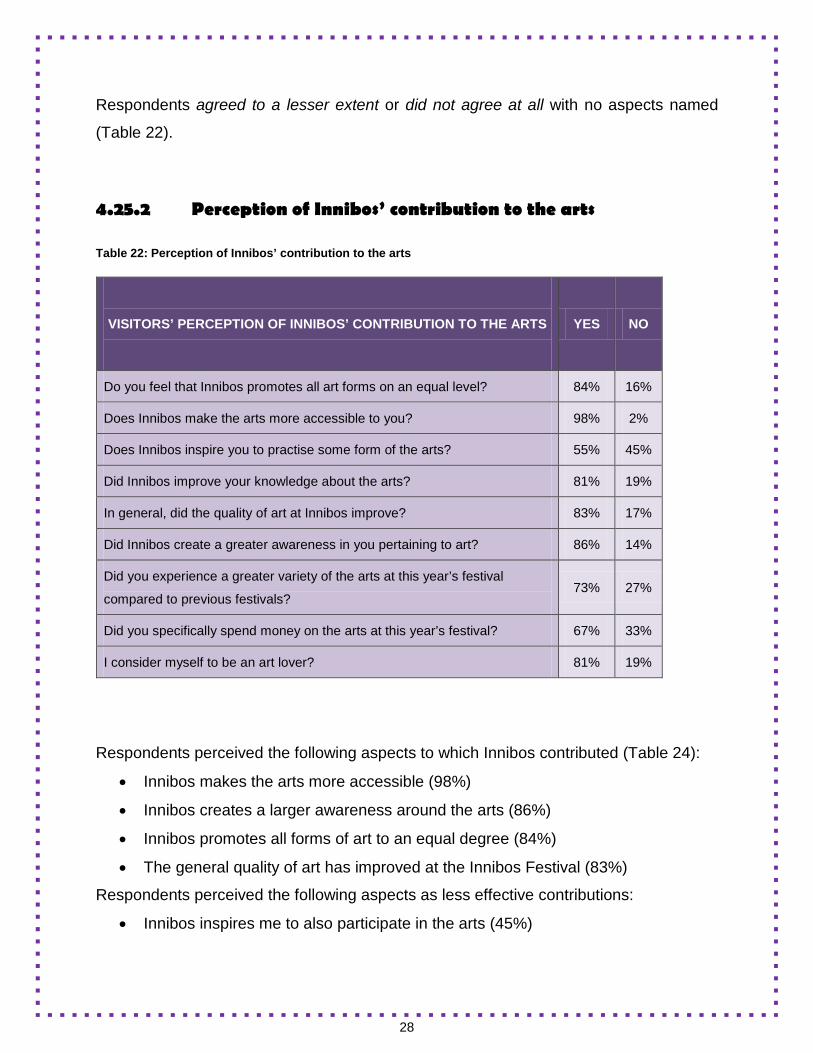
4.25.2 Perception of Innibos’ contribution to the arts
Table 22: Perception of Innibos’ contribution to the arts
Respondents perceived the following aspects to which Innibos contributed (Table 24):
• Innibos makes the arts more accessible (98%)
• Innibos creates a larger awareness around the arts (86%)
• Innibos promotes all forms of art to an equal degree (84%)
• The general quality of art has improved at the Innibos Festival (83%)
Respondents perceived the following aspects as less effective contributions:
• Innibos inspires me to also participate in the arts (45%)
VISITORS’ PERCEPTION OF INNIBOS’ CONTRIBUTION TO THE ARTS
YES NO
Do you feel that Innibos promotes all art forms on an equal level? 84% 16%
Does Innibos make the arts more accessible to you? 98% 2%
Does Innibos inspire you to practise some form of the arts? 55% 45%
Did Innibos improve your knowledge about the arts? 81% 19%
In general, did the quality of art at Innibos improve? 83% 17%
Did Innibos create a greater awareness in you pertaining to art? 86% 14%
Did you experience a greater variety of the arts at this year’s festival
compared to previous festivals? 73% 27%
Did you specifically spend money on the arts at this year’s festival? 67% 33%
I consider myself to be an art lover? 81% 19%
29
• Did you specifically spend money on art during your visit to the Festival? (33%)
• Have you experienced a larger amount of art at this year’s Festival, compared to
previous years (27%)
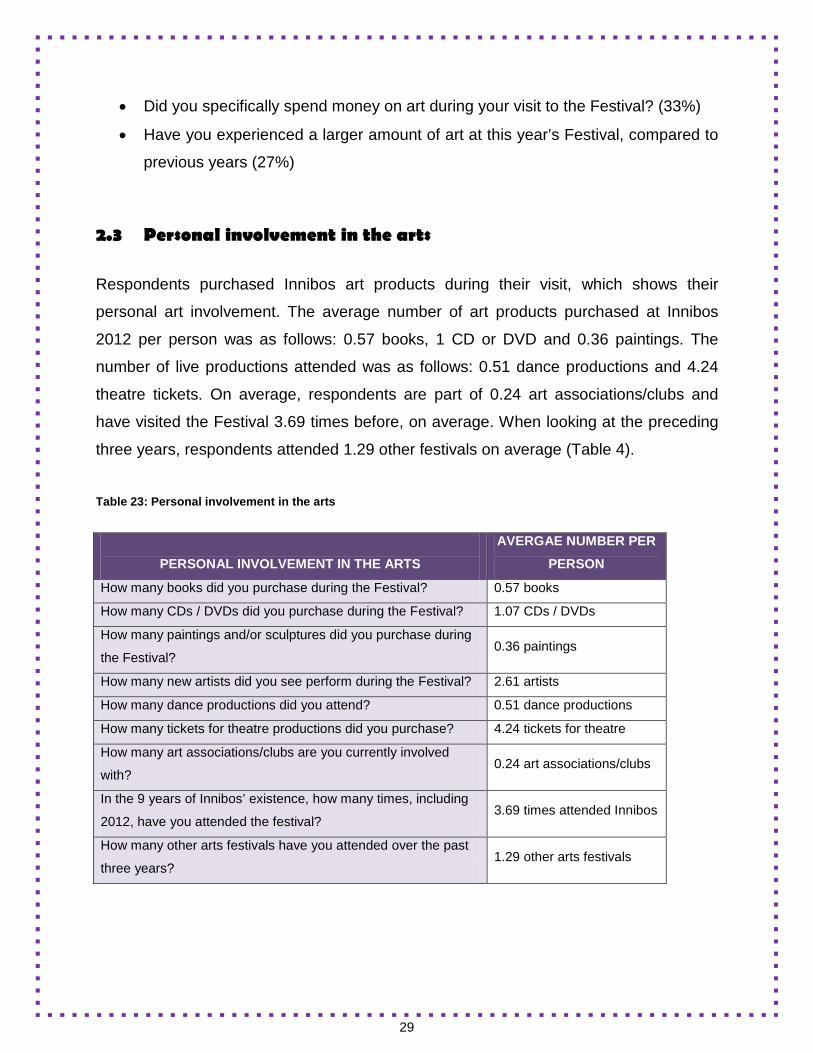
2.3 Personal involvement in the arts
Respondents purchased Innibos art products during their visit, which shows their
personal art involvement. The average number of art products purchased at Innibos
2012 per person was as follows: 0.57 books, 1 CD or DVD and 0.36 paintings. The
number of live productions attended was as follows: 0.51 dance productions and 4.24
theatre tickets. On average, respondents are part of 0.24 art associations/clubs and
have visited the Festival 3.69 times before, on average. When looking at the preceding
three years, respondents attended 1.29 other festivals on average (Table 4).
Table 23: Personal involvement in the arts
PERSONAL INVOLVEMENT IN THE ARTS
AVERGAE NUMBER PER
PERSON
How many books did you purchase during the Festival? 0.57 books
How many CDs / DVDs did you purchase during the Festival? 1.07 CDs / DVDs
How many paintings and/or sculptures did you purchase during
the Festival? 0.36 paintings
How many new artists did you see perform during the Festival? 2.61 artists
How many dance productions did you attend? 0.51 dance productions
How many tickets for theatre productions did you purchase? 4.24 tickets for theatre
How many art associations/clubs are you currently involved
with? 0.24 art associations/clubs
In the 9 years of Innibos’ existence, how many times, including
2012, have you attended the festival? 3.69 times attended Innibos
How many other arts festivals have you attended over the past
three years? 1.29 other arts festivals
30
5. Economic contribution
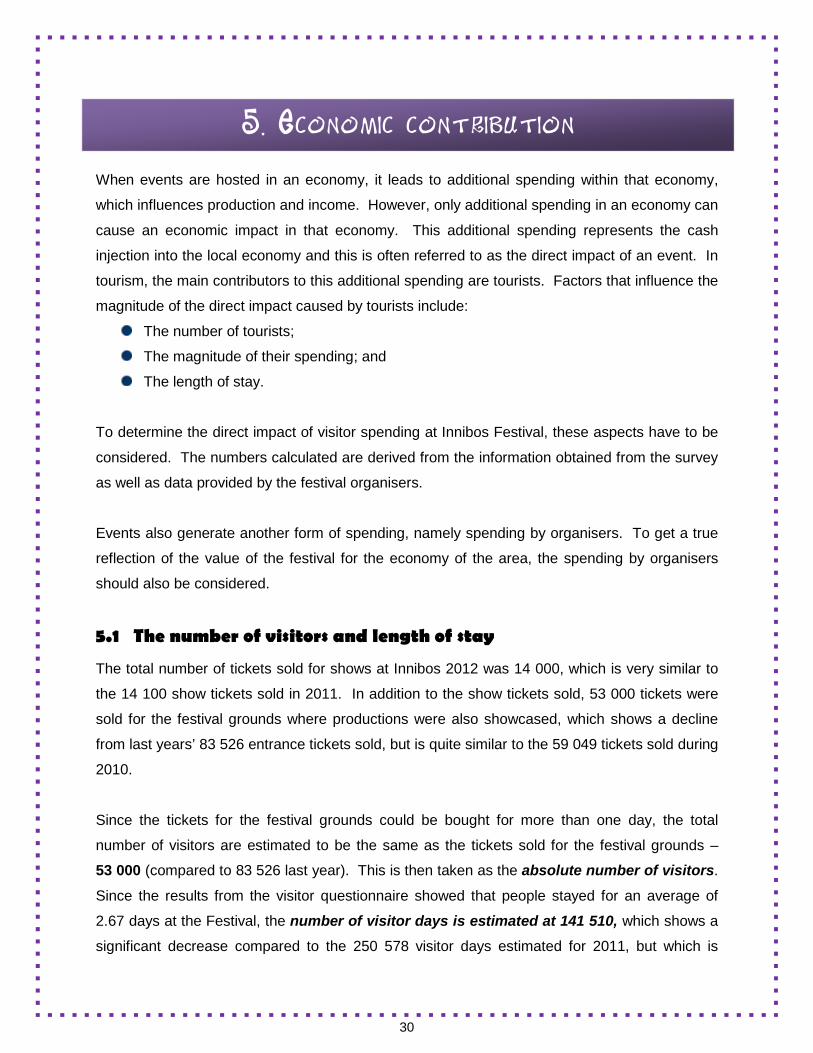
When events are hosted in an economy, it leads to additional spending within that economy,
which influences production and income. However, only additional spending in an economy can
cause an economic impact in that economy. This additional spending represents the cash
injection into the local economy and this is often referred to as the direct impact of an event. In
tourism, the main contributors to this additional spending are tourists. Factors that influence the
magnitude of the direct impact caused by tourists include:
The number of tourists;
The magnitude of their spending; and
The length of stay.
To determine the direct impact of visitor spending at Innibos Festival, these aspects have to be
considered. The numbers calculated are derived from the information obtained from the survey
as well as data provided by the festival organisers.
Events also generate another form of spending, namely spending by organisers. To get a true
reflection of the value of the festival for the economy of the area, the spending by organisers
should also be considered.
5.1 The number of visitors and length of stay
The total number of tickets sold for shows at Innibos 2012 was 14 000, which is very similar to
the 14 100 show tickets sold in 2011. In addition to the show tickets sold, 53 000 tickets were
sold for the festival grounds where productions were also showcased, which shows a decline
from last years’ 83 526 entrance tickets sold, but is quite similar to the 59 049 tickets sold during
2010.
Since the tickets for the festival grounds could be bought for more than one day, the total
number of visitors are estimated to be the same as the tickets sold for the festival grounds –
53 000 (compared to 83 526 last year). This is then taken as the absolute number of visitors.
Since the results from the visitor questionnaire showed that people stayed for an average of
2.67 days at the Festival, the number of visitor days is estimated at 141 510, which shows a
significant decrease compared to the 250 578 visitor days estimated for 2011, but which is
31
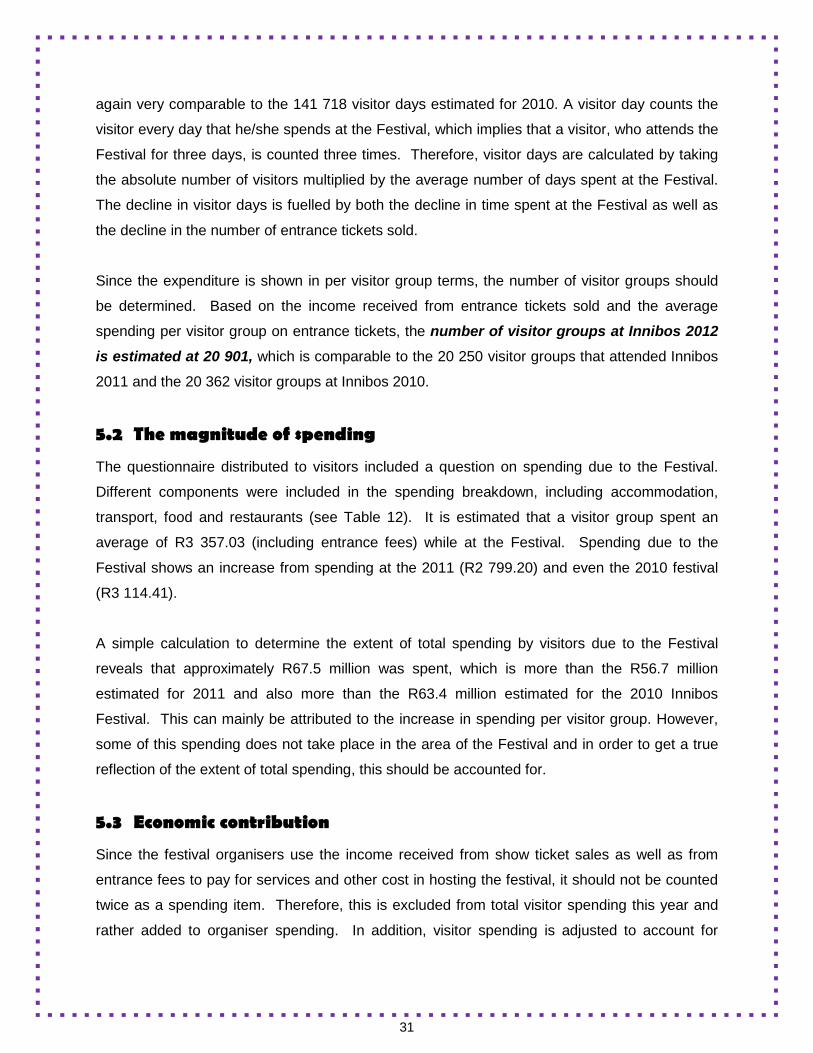
again very comparable to the 141 718 visitor days estimated for 2010. A visitor day counts the
visitor every day that he/she spends at the Festival, which implies that a visitor, who attends the
Festival for three days, is counted three times. Therefore, visitor days are calculated by taking
the absolute number of visitors multiplied by the average number of days spent at the Festival.
The decline in visitor days is fuelled by both the decline in time spent at the Festival as well as
the decline in the number of entrance tickets sold.
Since the expenditure is shown in per visitor group terms, the number of visitor groups should
be determined. Based on the income received from entrance tickets sold and the average
spending per visitor group on entrance tickets, the number of visitor groups at Innibos 2012 is estimated at 20 901, which is comparable to the 20 250 visitor groups that attended Innibos
2011 and the 20 362 visitor groups at Innibos 2010.
5.2 The magnitude of spending
The questionnaire distributed to visitors included a question on spending due to the Festival.
Different components were included in the spending breakdown, including accommodation,
transport, food and restaurants (see Table 12). It is estimated that a visitor group spent an
average of R3 357.03 (including entrance fees) while at the Festival. Spending due to the
Festival shows an increase from spending at the 2011 (R2 799.20) and even the 2010 festival
(R3 114.41).
A simple calculation to determine the extent of total spending by visitors due to the Festival
reveals that approximately R67.5 million was spent, which is more than the R56.7 million
estimated for 2011 and also more than the R63.4 million estimated for the 2010 Innibos
Festival. This can mainly be attributed to the increase in spending per visitor group. However,
some of this spending does not take place in the area of the Festival and in order to get a true
reflection of the extent of total spending, this should be accounted for.
5.3 Economic contribution
Since the festival organisers use the income received from show ticket sales as well as from
entrance fees to pay for services and other cost in hosting the festival, it should not be counted
twice as a spending item. Therefore, this is excluded from total visitor spending this year and
rather added to organiser spending. In addition, visitor spending is adjusted to account for

32
transport costs, which do not accrue to the local area (an adjustment of 50% is made).
Furthermore, not all of the exhibitors and food vendors at the Festival stem from the local area
and spending on souvenirs and food should therefore also be adjusted to reflect this. The
adjustments made are based on the distribution of stalls between locals and non-locals (same
distribution as 2011 was used). After these adjustments, the spending by the festinos
(excluding spending on entrance and shows) amounts to R45.1 million, which is similar to the
spending by festinos (including entrance and show tickets) during 2011’s Innibos Festival.
While visitor spending is by far the greatest contributor to the additional spending in the area,
the spending by festival organisers and exhibitors also takes place in the local economy. This
should also be accounted for to derive a realistic economic impact. The cost to host the Festival
(in terms of venues, contractors etc.) that accrued to local institutions and people is estimated
as a percentage of the ticket sales, entrance fees, sponsorships, stall rental and other income
received. Based on the cost items spent on, this percentage that remains in the local area is
estimated on 67% of total festival organiser spending and this amounts to R7.9 million.
Table 24: Economic impact
2010:
Scenario 1
2010:
Scenario 2
2011:
Scenario 1
2011:
Scenario 2
2012
Scenario 1
2012
Scenario 2
Visitor spending
(including tickets)
R51 069 804 R51 069 804 R45 123 222 R45 123 222
Visitor spending
(excluding tickets)
R45 128 292 R45 128 292
Organiser spending
(excluding tickets)
R 3 484 469 R 3 484 469 R 3 267 353 R 3 267 353
Organiser spending
(including tickets)
R7 908 000 R7 908 000
Total direct spending
R54 554 273 R54 554 273 R48 390 575 R48 390 575 R53 036 292 R53 036 292
Multiplier 1.5 1.3 1.5 1.3 1.5 1.3
Indirect impact R27 277 137 R16 366 282 R24 195 287 R14 517 172 R26 518 146 R15 910 888
Total impact R81 831 410 R70 920 555 R72 585 862 R62 907 747 R79 554 438 R68 947 180
Table 22 summarises the total spending by each of the categories. By adding the different
components, a direct impact estimate can be derived, which is estimated at R53 million
(compared to R48.4 million in 2010 and R54.6 million in 2009). When money is spent in an
area, it provides additional income to those individuals and institutions that use the additional
33
money to spend on other items. For example, businesses will pay suppliers for additional stock
and pay employees, while individuals will use the income to buy additional products. This
causes some businesses and individuals to receive additional income, which leads to an
increase in their spending and so the process continues. This process is captured by the
multiplier and represents the indirect impact of the event.
In order to draw a comparison, two scenarios are again presented. Scenario 1 uses a multiplier
of 1.5 (as in previous years), while Scenario 2 is based on the average multiplier of the business
surveys of 2008 and 2009, which is 1.3. This is reflected in Table 22, and the total impact of the
Festival is estimated at R79.6 million under Scenario 1 (multiplier of 1.5) and R68.95 million
under Scenario 2 (multiplier of 1.3). Scenario 1 can therefore be viewed as the “most optimistic”
scenario, while Scenario 2 may present a more realistic picture of the value of the Innibos
Festival.
34
6. Conclusions and recommendations The following conclusions can be made with regard to the survey:
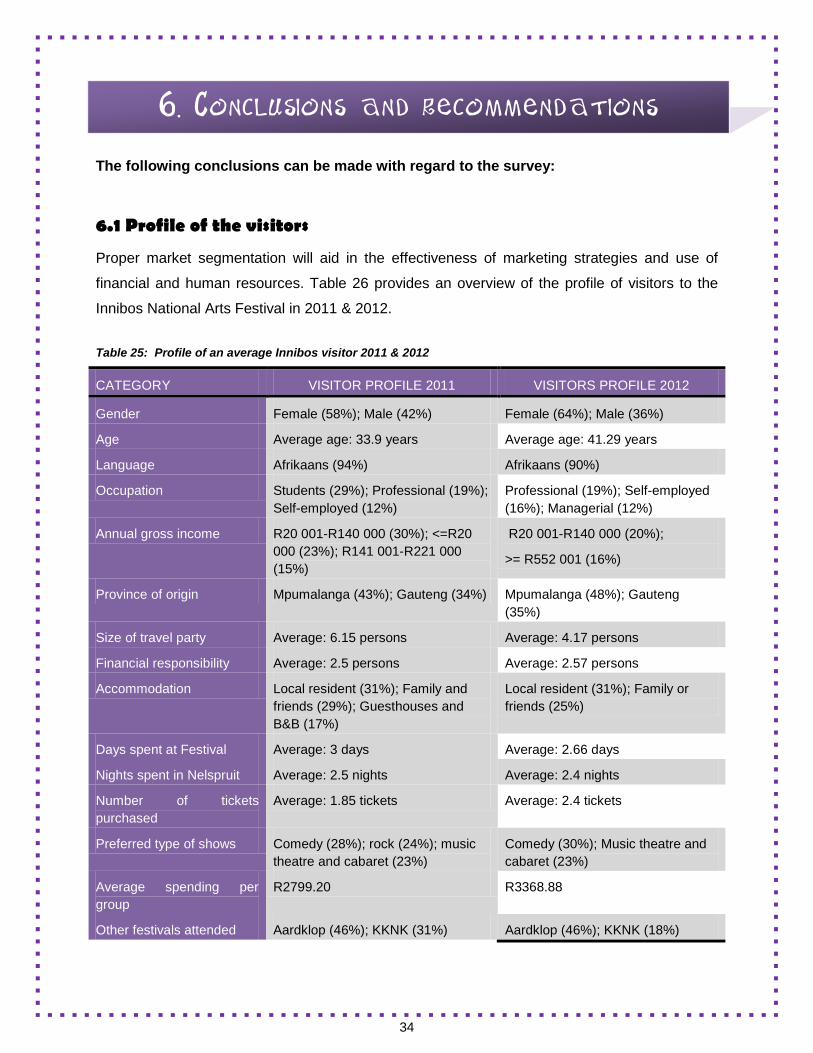
6.1 Profile of the visitors
Proper market segmentation will aid in the effectiveness of marketing strategies and use of
financial and human resources. Table 26 provides an overview of the profile of visitors to the
Innibos National Arts Festival in 2011 & 2012.
Table 25: Profile of an average Innibos visitor 2011 & 2012
CATEGORY VISITOR PROFILE 2011 VISITORS PROFILE 2012
Gender Female (58%); Male (42%) Female (64%); Male (36%)
Age Average age: 33.9 years Average age: 41.29 years
Language Afrikaans (94%) Afrikaans (90%)
Occupation Students (29%); Professional (19%); Self-employed (12%)
Professional (19%); Self-employed (16%); Managerial (12%)
Annual gross income R20 001-R140 000 (30%); <=R20 000 (23%); R141 001-R221 000 (15%)
R20 001-R140 000 (20%);
>= R552 001 (16%)
Province of origin Mpumalanga (43%); Gauteng (34%) Mpumalanga (48%); Gauteng (35%)
Size of travel party Average: 6.15 persons Average: 4.17 persons
Financial responsibility Average: 2.5 persons Average: 2.57 persons
Accommodation Local resident (31%); Family and friends (29%); Guesthouses and B&B (17%)
Local resident (31%); Family or friends (25%)
Days spent at Festival Average: 3 days Average: 2.66 days
Nights spent in Nelspruit Average: 2.5 nights Average: 2.4 nights
Number of tickets purchased
Average: 1.85 tickets Average: 2.4 tickets
Preferred type of shows Comedy (28%); rock (24%); music theatre and cabaret (23%)
Comedy (30%); Music theatre and cabaret (23%)
Average spending per group
R2799.20 R3368.88
Other festivals attended Aardklop (46%); KKNK (31%) Aardklop (46%); KKNK (18%)

35
Decision to attend Festival More than a month ago (43%); spontaneous decision (32%)
More than a month ago (43%); Spontaneous decision (31%)
Initiation of trip Self (60%); Friends (34%); Family (16%)
Self (49%); Friends (25%); Family (16%); Spouse (16%)
Preferred information source
Radio (56%); Television (47%); word-of-mouth (42%)
Radio (42%); Word-of-mouth (37%)
Number of visits to Festival Average: 2.52 times Average: 3.63 times
Main reason for attending the Festival
To relax (70%); Sociable event (70%); To spend time with friends (68%)
Sociable event (96%); To relax (93%); It is primarily an Afrikaans festival (90%)
Next year’s attendance 83% would definitely attend again Yes, definitely (92%)
Associated sponsors 94.2 Jakaranda; Standard Bank, Beeld
Jacaranda FM, Standard Bank, Beeld
Evaluation of the Festival Arts festivals such as Innibos make a contribution towards the arts in general (81%); It provides exposure to art forms/genres that generally do not get exposure (80); Arts festivals led to the number of artists increasing dramatically
Festival has to attract people further than just the surrounding areas (95%); Festival has to be an annual event (95%); Festival has to be at least three days long (94%); Festival has to cater to a variety of target markets, e.g. children, youth and families (93%)
THE FOLLOWING CONCLUSIONS CAN BE DRAWN FROM THE RESEARCH
COMPLETED AT THE INNIBOS NATIONAL ARTS FESTIVAL WITH REGARD TO THE
VISITOR PROFILE AND ECONOMIC IMPACT
• The majority of respondents to Innibos Arts Festival 2012 were Afrikaans-speaking females
in their early forties.
• Respondents were in a professional position at work, self-employed or in a managerial
position, where they earn either between R20 001 and R140 000 per annum, R140 001 and
R221 000 or more than R552 001.
• Respondents travelled from Mpumalanga or Gauteng in groups of four people, two to three
for whom they were financially responsible.
• The respondents travelling from far preferred to stay with family or friends in Nelspruit.
• An average of two tickets was purchased during the three days and respondents spent two
nights in the area.
• Comedy as well as musical theatre and cabaret were their preferred types of shows.

36
• Respondents are also of the view that the Festival makes a clear contribution to the growth
of arts in South Africa.
• Respondents mainly heard about the Festival on the radio or through word-of-mouth and
made the decision to visit the Festival for themselves more than a month before the Festival
started.
• Respondents visited this Festival four times on average, but they also indicated that they
attend other festivals, such as Aardklop National Arts Festival and KKNK.
• They will visit this Festival again.
• Innibos Arts Festival was attended because it is seen as a sociable event where visitors
can relax and enjoy everything that is Afrikaans.
• The main sponsors that were respondents recognised as part of the Festival was
Jacaranda FM, Standard Bank and Beeld.
• The festival generates approximately R70 million for the region.
• From the respondents’ point of view, a national arts festival should offer a variety of genres
(minimum five), based on at least 80 productions on an annual basis and the festival should
be at least three days long and attract 50 000 or more visitors.
• Most respondents had some degree of exposure to the arts during childhood, which
highlights the importance of children productions on the one hand, but also the importance
of parents taking children to such shows on the other hand.
THE FOLLOWING RECOMMENDATIONS WERE MADE BY THE FESTINOS
• Improve organisation at ticket sales
• Improve parking system
• Cheaper entrance fees
• Get a larger venue for the Festival
• Cheaper access and shows for children and pensioners
• Special smoking areas
• Improve signage at venues
• Improve management of dust
• More toilets
Related Documents