Copyright © 2008 ICIC -0-

Welcome message from author
This document is posted to help you gain knowledge. Please leave a comment to let me know what you think about it! Share it to your friends and learn new things together.
Transcript
Copyright © 2008 ICIC- 0 -

Copyright © 2008 ICIC- 1 -
Agenda
• Performance of Inner City Economies
• Federal Policy and Inner City Economic Development
• Policy Area I: Workforce Training
• Policy Area II: Infrastructure
• Policy Area III: Capital Access
• Policy Area IV: Cluster Development
Copyright © 2008 ICIC- 2 -
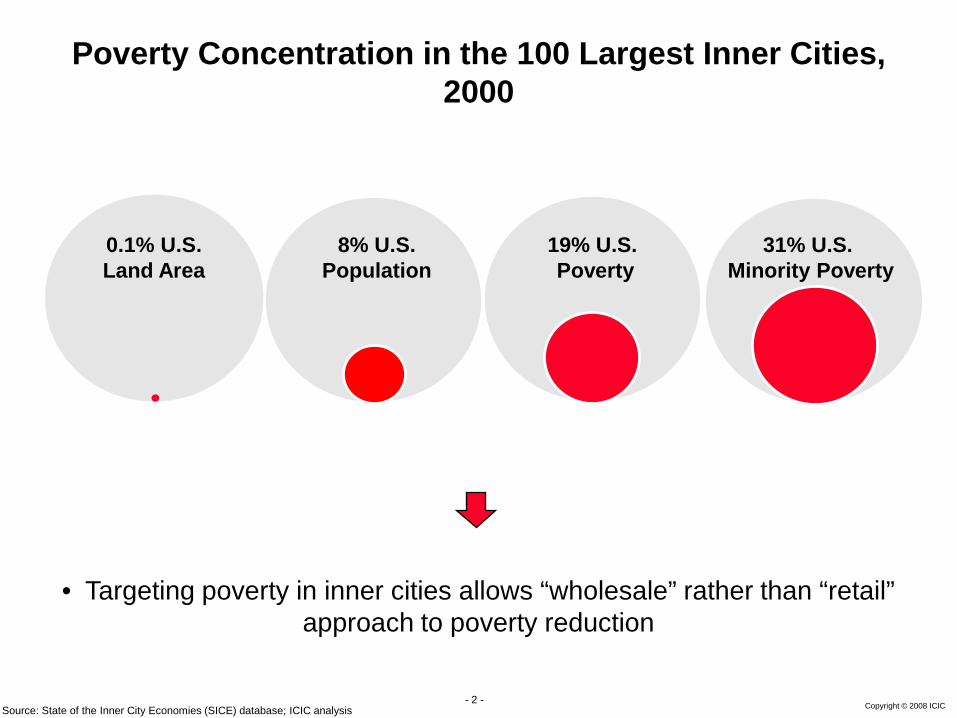
Poverty Concentration in the 100 Largest Inner Cities, 2000
0.1% U.S.Land Area
31% U.S. Minority Poverty
19% U.S. Poverty
8% U.S.Population
Source: State of the Inner City Economies (SICE) database; ICIC analysis
• Targeting poverty in inner cities allows “wholesale” rather than “retail” approach to poverty reduction
Copyright © 2008 ICIC- 3 -
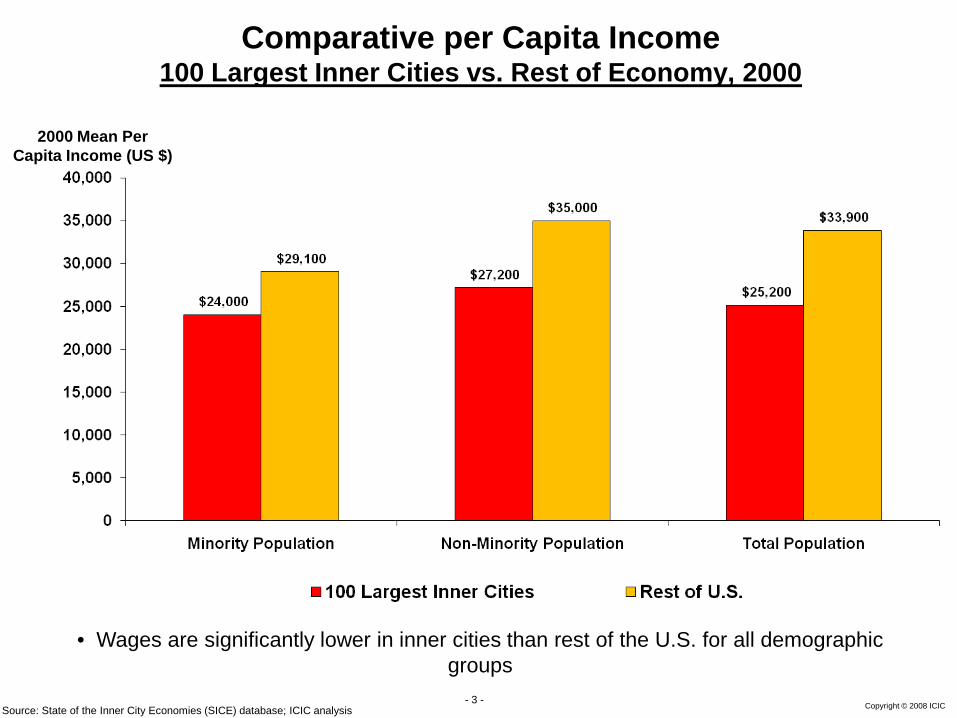
Comparative per Capita Income100 Largest Inner Cities vs. Rest of Economy, 2000
2000 Mean Per Capita Income (US $)
Source: State of the Inner City Economies (SICE) database; ICIC analysis
• Wages are significantly lower in inner cities than rest of the U.S. for all demographic groups
Copyright © 2008 ICIC- 4 -
Cen
tral
City
Pov
erty
Rat
e, %
Cha
nge
2000
-200
7
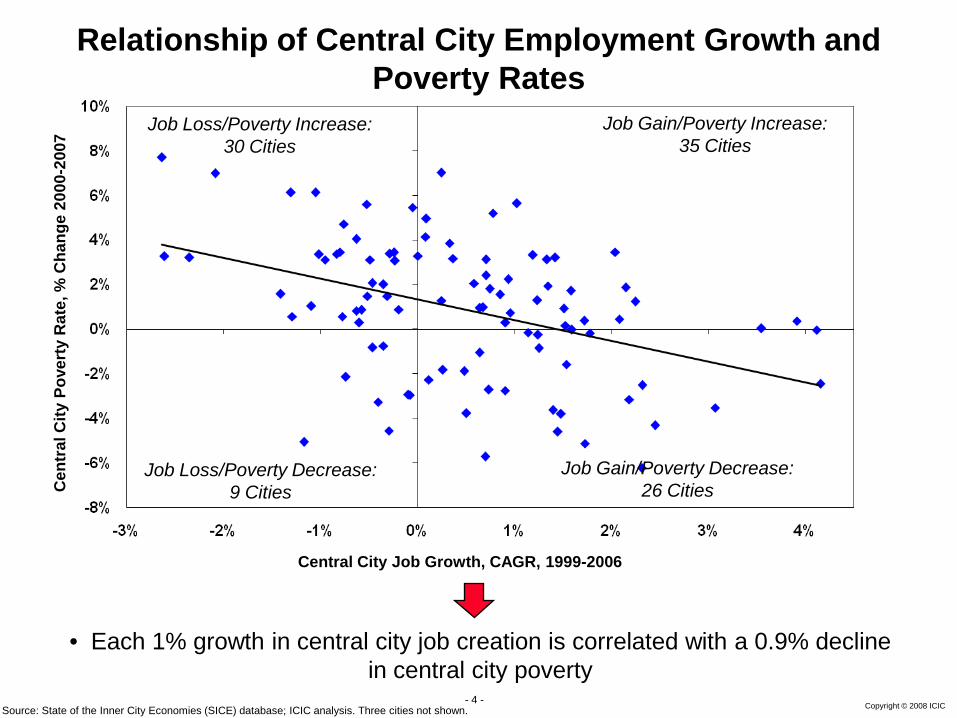
Central City Job Growth, CAGR, 1999-2006
Job Loss/Poverty Increase:30 Cities
Job Gain/Poverty Increase:35 Cities
Job Gain/Poverty Decrease: 26 Cities
Job Loss/Poverty Decrease:9 Cities
Source: State of the Inner City Economies (SICE) database; ICIC analysis. Three cities not shown.
• Each 1% growth in central city job creation is correlated with a 0.9% decline in central city poverty
Relationship of Central City Employment Growth and Poverty Rates
Copyright © 2008 ICIC- 5 -
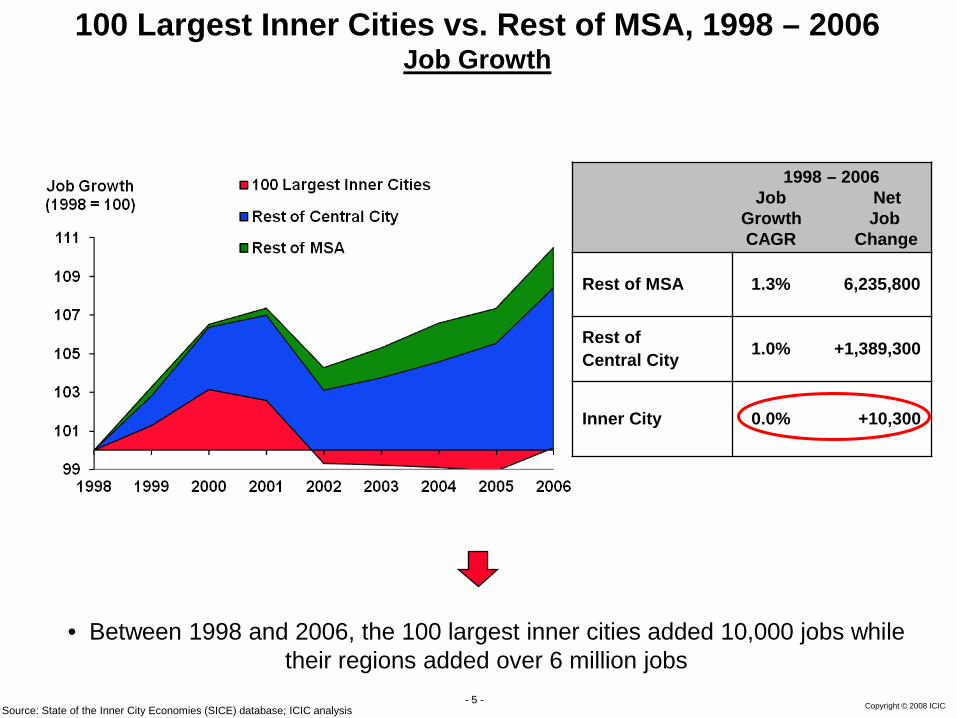
100 Largest Inner Cities vs. Rest of MSA, 1998 – 2006Job Growth
1998 – 2006Job Net
Growth JobCAGR Change
Rest of MSA 1.3% 6,235,800
Rest of Central City 1.0% +1,389,300
Inner City 0.0% +10,300
Source: State of the Inner City Economies (SICE) database; ICIC analysis
• Between 1998 and 2006, the 100 largest inner cities added 10,000 jobs while their regions added over 6 million jobs
Copyright © 2008 ICIC- 6 -
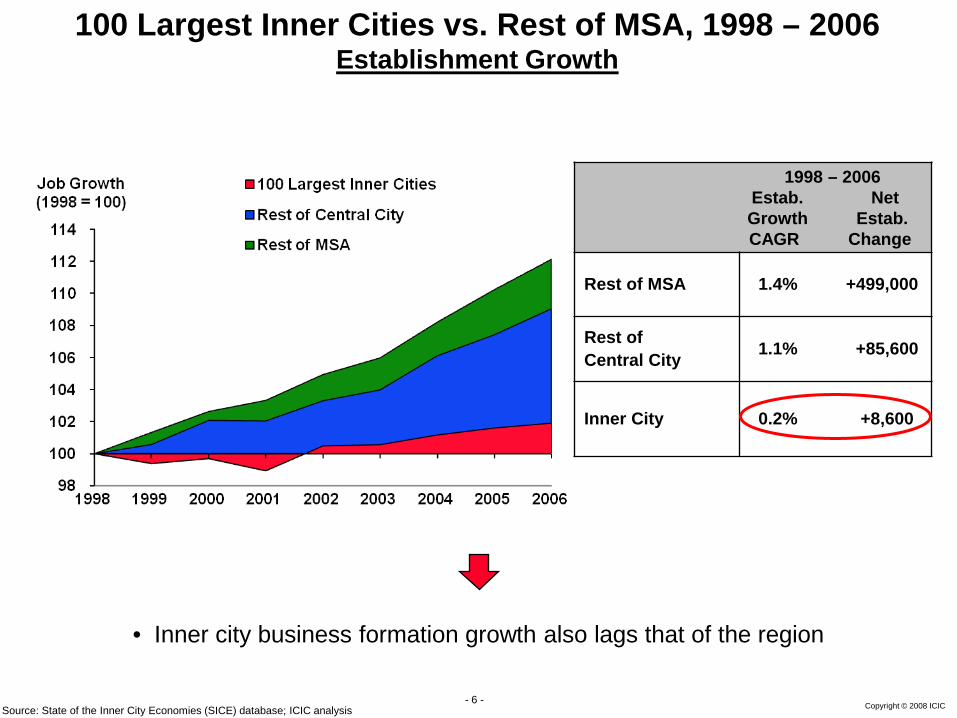
1998 – 2006Estab. NetGrowth Estab.CAGR Change
Rest of MSA 1.4% +499,000
Rest of Central City 1.1% +85,600
Inner City 0.2% +8,600
100 Largest Inner Cities vs. Rest of MSA, 1998 – 2006Establishment Growth
Source: State of the Inner City Economies (SICE) database; ICIC analysis
• Inner city business formation growth also lags that of the region
Copyright © 2008 ICIC- 7 -
Inne
r City
Em
ploy
men
t Gro
wth
, CAG
R 1
998-
2006
Rest of MSA Employment Growth, CAGR 1998-2006
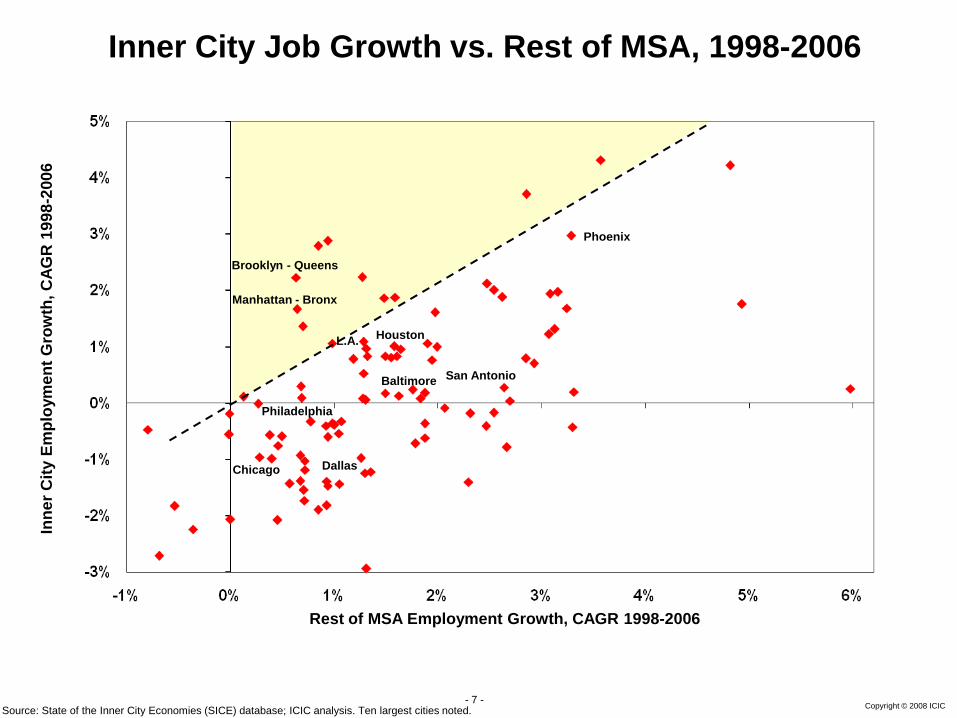
Inner City Job Growth vs. Rest of MSA, 1998-2006
Source: State of the Inner City Economies (SICE) database; ICIC analysis. Ten largest cities noted.
Manhattan - Bronx
L.A.
Brooklyn - Queens
Phoenix
Philadelphia
DallasChicago
Baltimore
Houston
San Antonio
Copyright © 2008 ICIC- 8 -
Range of MSA Growth
Number ofMSAs
Average Annual MSA
Growth
Average Annual InnerCity Growth
Percent ofInner Cities that Grew
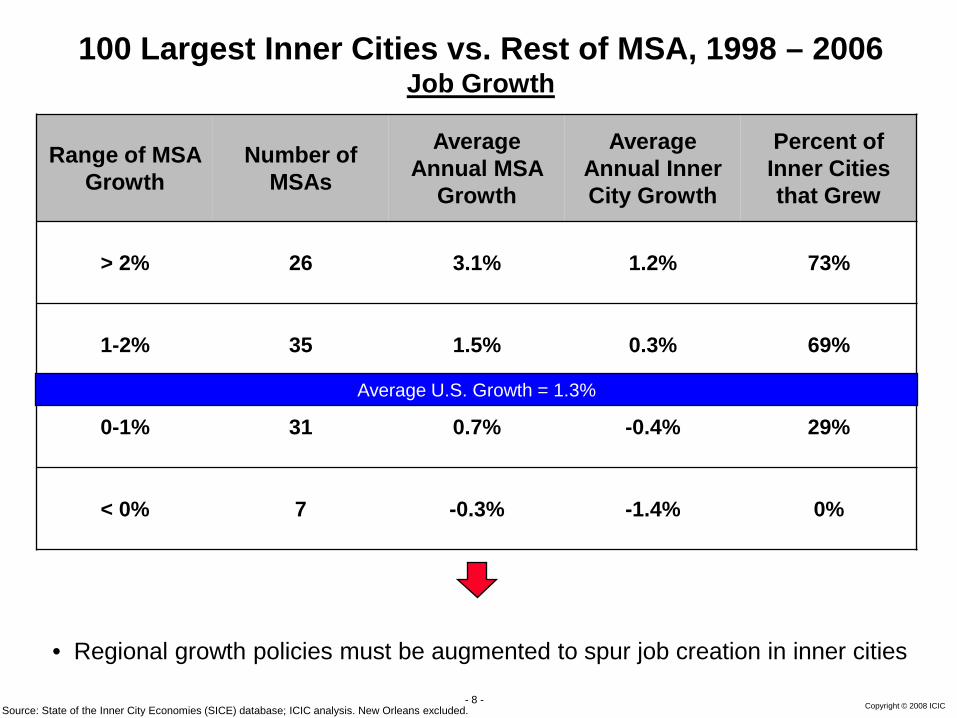
> 2% 26 3.1% 1.2% 73%
1-2% 35 1.5% 0.3% 69%
0-1% 31 0.7% -0.4% 29%
< 0% 7 -0.3% -1.4% 0%
Source: State of the Inner City Economies (SICE) database; ICIC analysis. New Orleans excluded.
100 Largest Inner Cities vs. Rest of MSA, 1998 – 2006Job Growth
Average U.S. Growth = 1.3%
• Regional growth policies must be augmented to spur job creation in inner cities
Copyright © 2008 ICIC- 9 -
Agenda
• Performance of Inner City Economies
• Federal Policy and Inner City Economic Development
• Policy Area I: Workforce Training
• Policy Area II: Infrastructure
• Policy Area III: Capital Access
• Policy Area IV: Cluster Development
Copyright © 2008 ICIC- 10 -
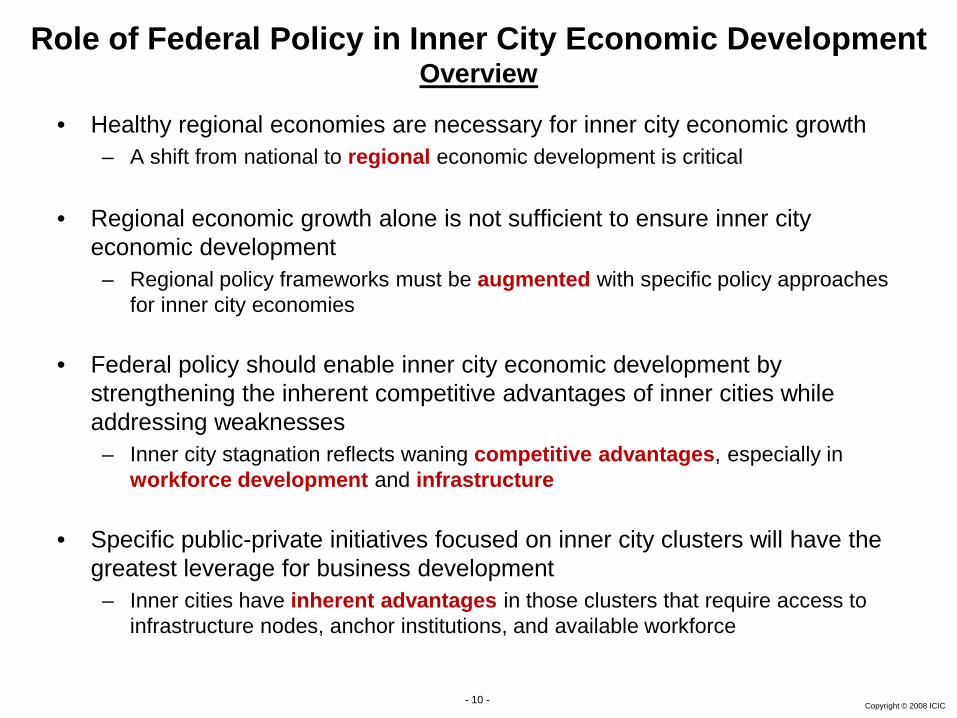
Role of Federal Policy in Inner City Economic DevelopmentOverview
• Healthy regional economies are necessary for inner city economic growth– A shift from national to regional economic development is critical
• Regional economic growth alone is not sufficient to ensure inner city economic development– Regional policy frameworks must be augmented with specific policy approaches
for inner city economies
• Federal policy should enable inner city economic development by strengthening the inherent competitive advantages of inner cities while addressing weaknesses– Inner city stagnation reflects waning competitive advantages, especially in
workforce development and infrastructure
• Specific public-private initiatives focused on inner city clusters will have the greatest leverage for business development– Inner cities have inherent advantages in those clusters that require access to
infrastructure nodes, anchor institutions, and available workforce
Copyright © 2008 ICIC- 11 -
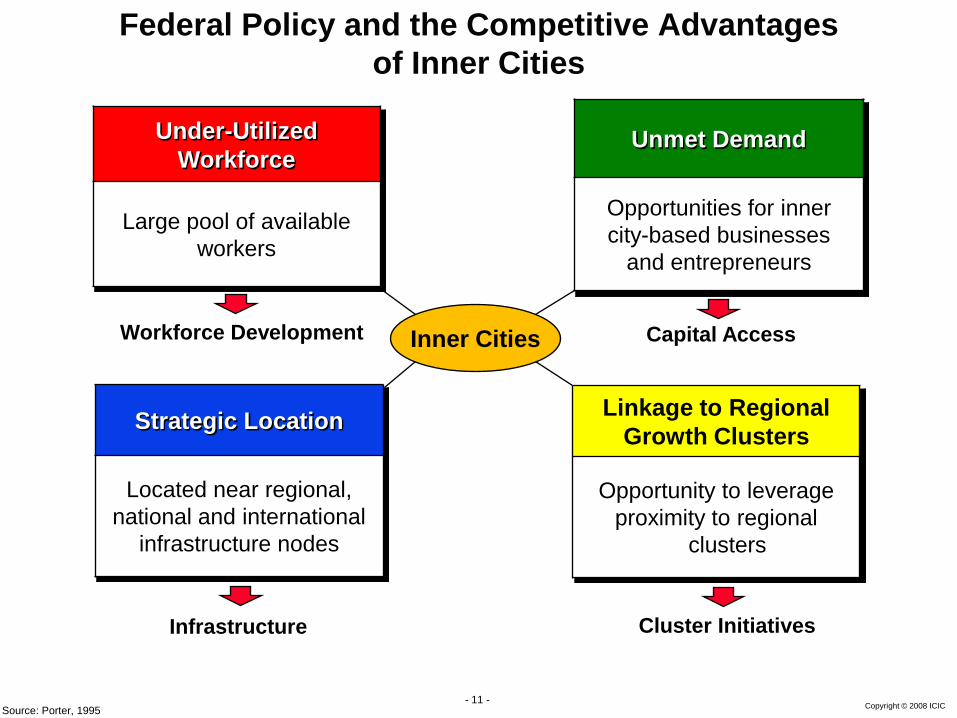
Strategic Location
Located near regional,national and international
infrastructure nodes
Federal Policy and the Competitive Advantages of Inner Cities
Linkage to RegionalGrowth Clusters
Opportunity to leverage proximity to regional
clusters
Under-Utilized Workforce
Large pool of available workers
Unmet Demand
Opportunities for inner city-based businesses
and entrepreneurs
Workforce Development Capital Access
Infrastructure Cluster Initiatives
Inner Cities
Source: Porter, 1995
Copyright © 2008 ICIC- 12 -
Agenda
• Performance of Inner City Economies
• Federal Policy and Inner City Economic Development
• Policy Area I: Workforce Training
• Policy Area II: Infrastructure
• Policy Area III: Capital Access
• Policy Area IV: Cluster Development
Copyright © 2008 ICIC- 13 -
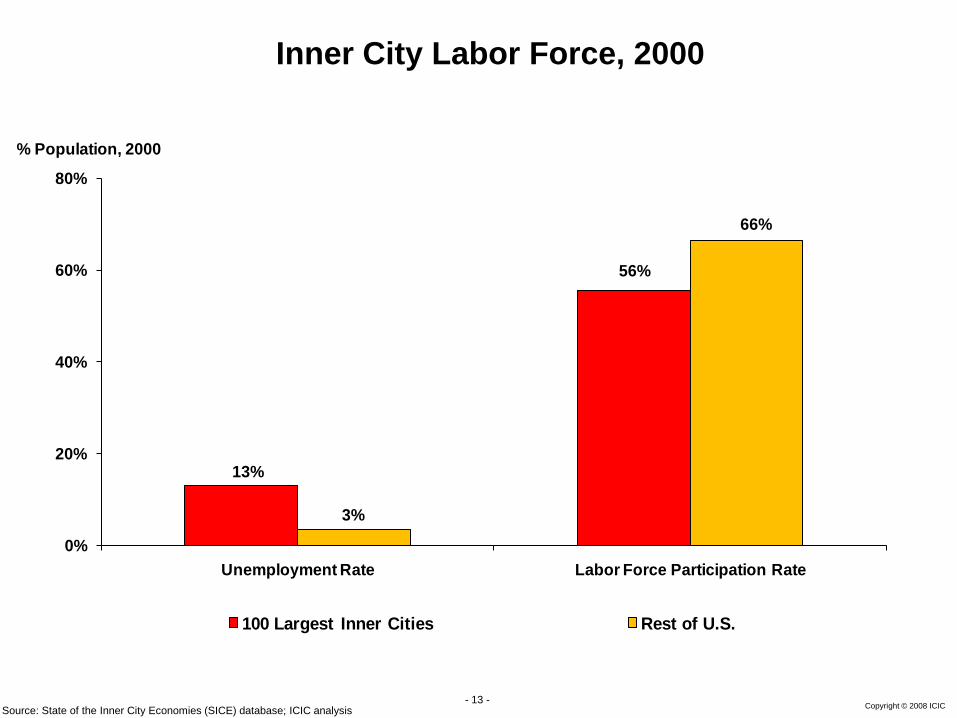
Inner City Labor Force, 2000
13%
56%
3%
66%
0%
20%
40%
60%
80%
Unemployment Rate Labor Force Participation Rate
% Population, 2000
100 Largest Inner Cities Rest of U.S.
Source: State of the Inner City Economies (SICE) database; ICIC analysis
Copyright © 2008 ICIC- 14 -
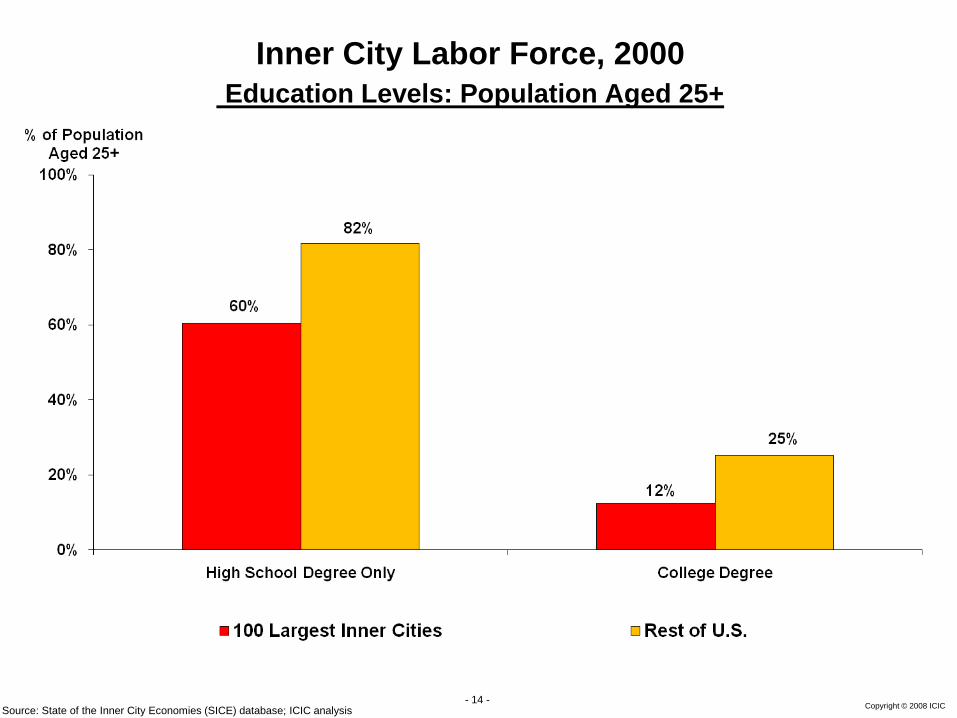
Inner City Labor Force, 2000Education Levels: Population Aged 25+
Source: State of the Inner City Economies (SICE) database; ICIC analysis
Copyright © 2008 ICIC- 15 -
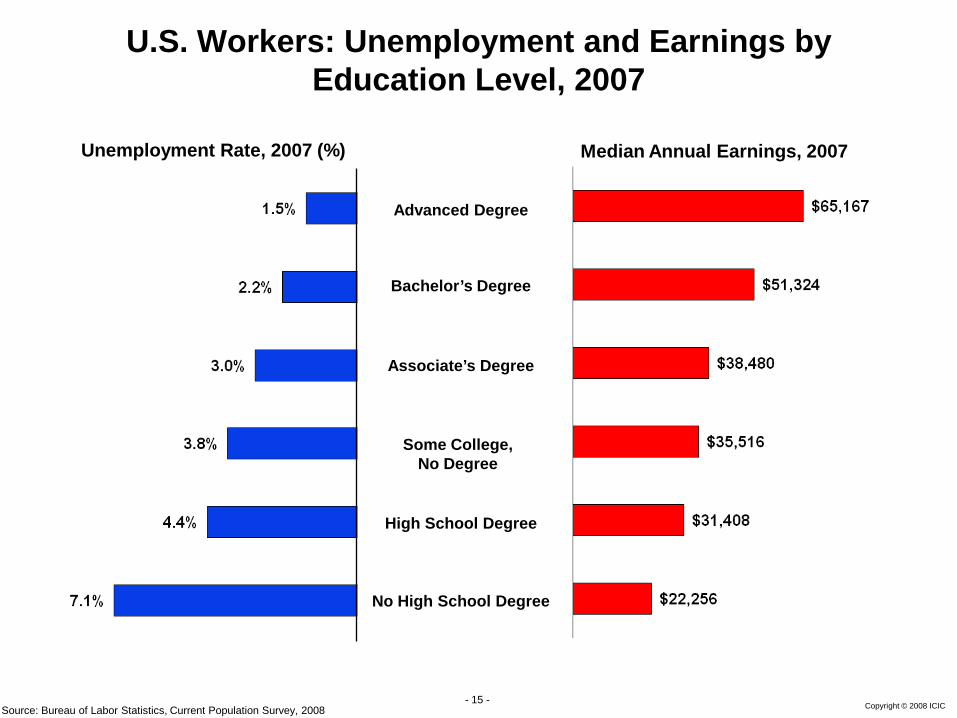
Advanced Degree
Bachelor’s Degree
Associate’s Degree
Some College, No Degree
High School Degree
No High School Degree
Median Annual Earnings, 2007Unemployment Rate, 2007 (%)
Source: Bureau of Labor Statistics, Current Population Survey, 2008
U.S. Workers: Unemployment and Earnings by Education Level, 2007
Copyright © 2008 ICIC- 16 -
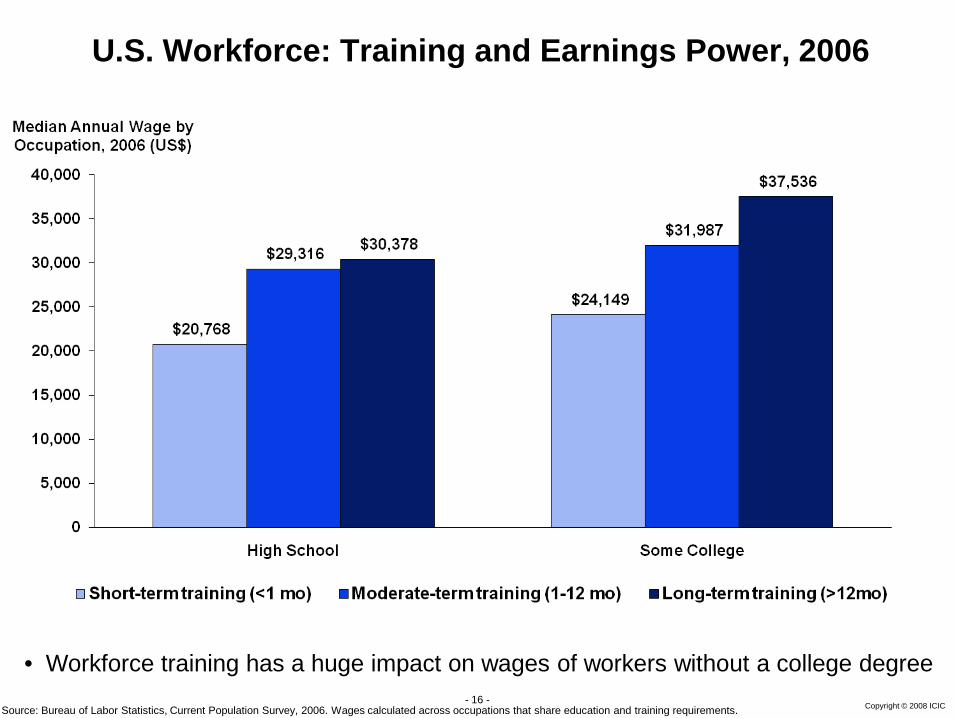
U.S. Workforce: Training and Earnings Power, 2006
Source: Bureau of Labor Statistics, Current Population Survey, 2006. Wages calculated across occupations that share education and training requirements.
• Workforce training has a huge impact on wages of workers without a college degree
Copyright © 2008 ICIC- 17 -
35%
21%
15%
0%
10%
20%
30%
40%
Recruiting Qualified Employees Access to Capital Building Corporate Infrastructure
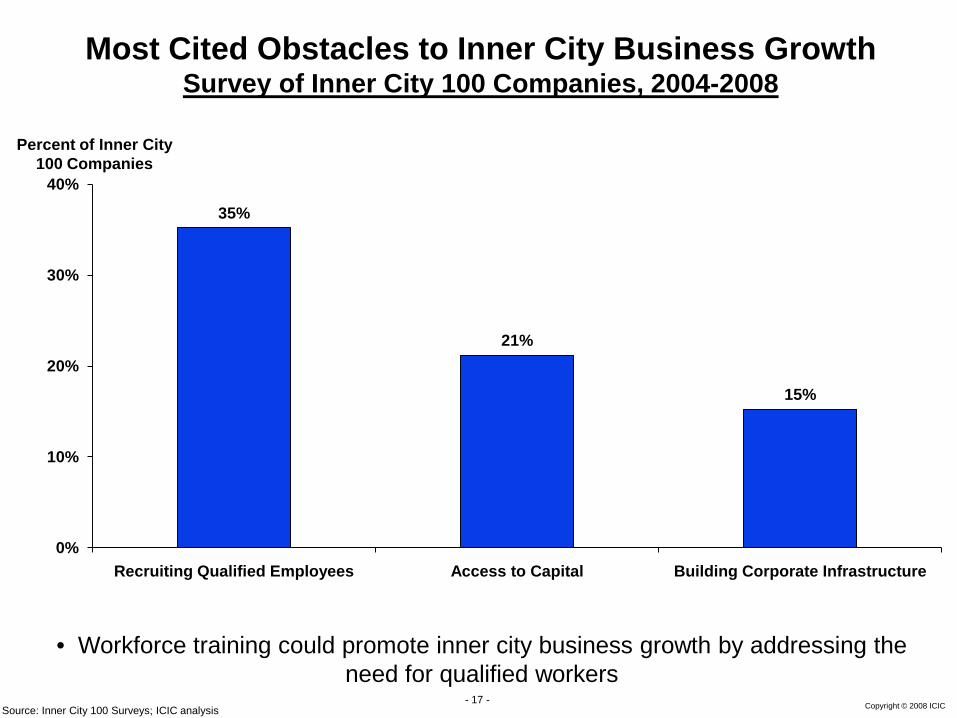
Most Cited Obstacles to Inner City Business GrowthSurvey of Inner City 100 Companies, 2004-2008
Percent of Inner City 100 Companies
Source: Inner City 100 Surveys; ICIC analysis
• Workforce training could promote inner city business growth by addressing the need for qualified workers
Copyright © 2008 ICIC- 18 -
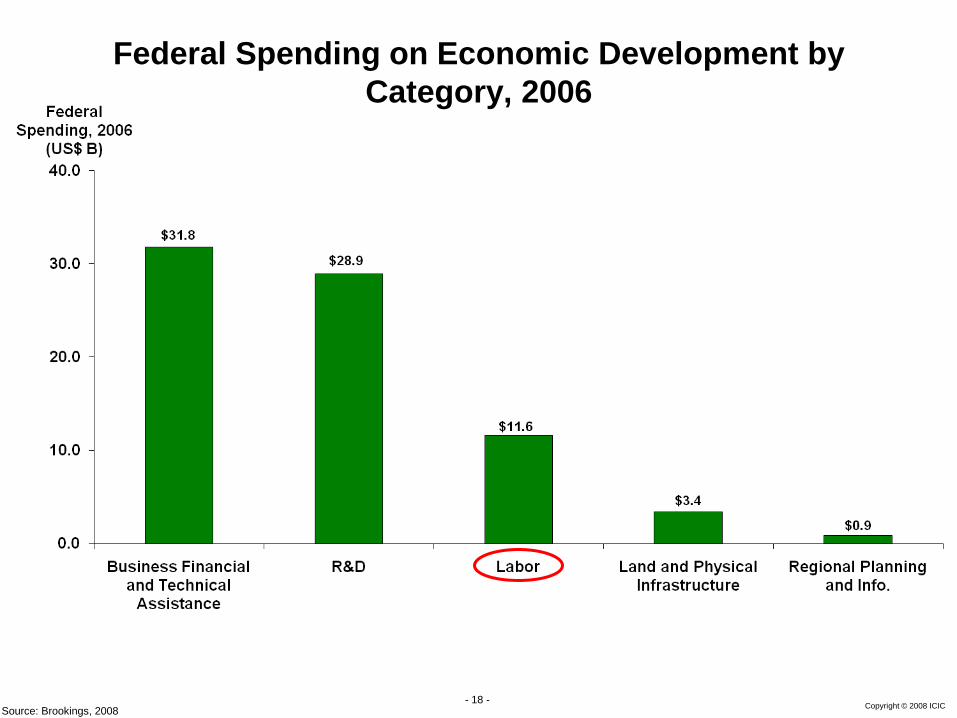
Federal Spending on Economic Development by Category, 2006
Source: Brookings, 2008
Copyright © 2008 ICIC- 19 -
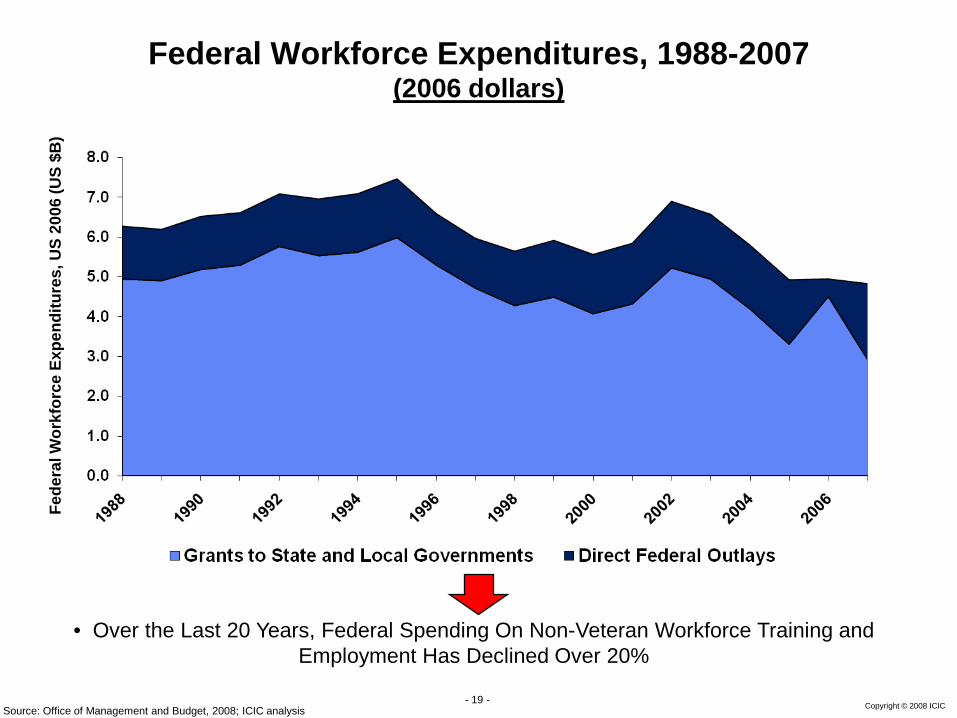
Federal Workforce Expenditures, 1988-2007 (2006 dollars)
Source: Office of Management and Budget, 2008; ICIC analysis
• Over the Last 20 Years, Federal Spending On Non-Veteran Workforce Training and Employment Has Declined Over 20%
Fede
ral W
orkf
orce
Exp
endi
ture
s, U
S 20
06 (U
S $B
)

Copyright © 2008 ICIC- 20 -
Federal Programs Supporting Skills Training and Education
• Department of Education– Pell Grant Program– Carl D. Perkins Career and
Technical Education Act– Adult Education and Family
Literacy Act– Vocational Rehabilitation State
Grants
• Department of Health and Human Services– Temporary Assistance for Needy
Families– Social Services Block Grant– Community Services Block Grant– Food Stamp Employment and
Training Program
Source: Workforce Alliance, 2007; Baider, 2008
• There is a morass of programs and agencies at the federal level. This is exacerbated by the large number of state and local programs
• Department of Labor- Workforce Investment Act- Wagner-Peyser Act- Trade Adjustment Assistance
• Department of Housing and Urban Development– Community Development Block
Grant
• Department of the Treasury– Tax Credits and Deductions for
Education and Training
Copyright © 2008 ICIC- 21 -
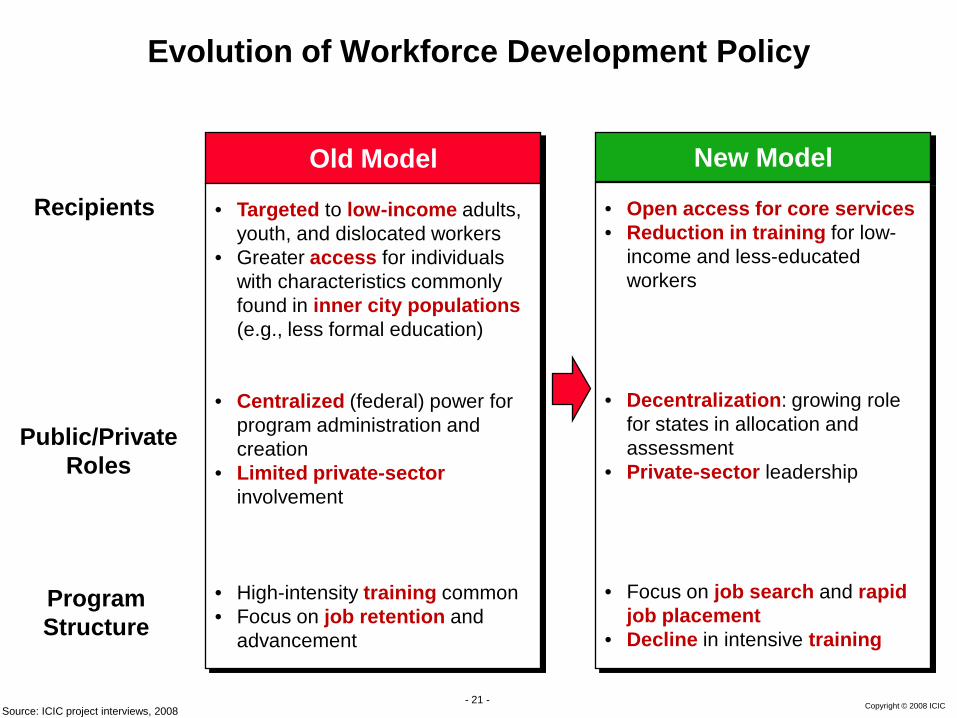
Evolution of Workforce Development Policy
Old Model
• Targeted to low-income adults, youth, and dislocated workers
• Greater access for individuals with characteristics commonly found in inner city populations (e.g., less formal education)
• Centralized (federal) power for program administration and creation
• Limited private-sectorinvolvement
• High-intensity training common • Focus on job retention and
advancement
New Model
• Open access for core services• Reduction in training for low-
income and less-educated workers
• Decentralization: growing role for states in allocation and assessment
• Private-sector leadership
• Focus on job search and rapid job placement
• Decline in intensive training
Recipients
Public/PrivateRoles
ProgramStructure
Source: ICIC project interviews, 2008
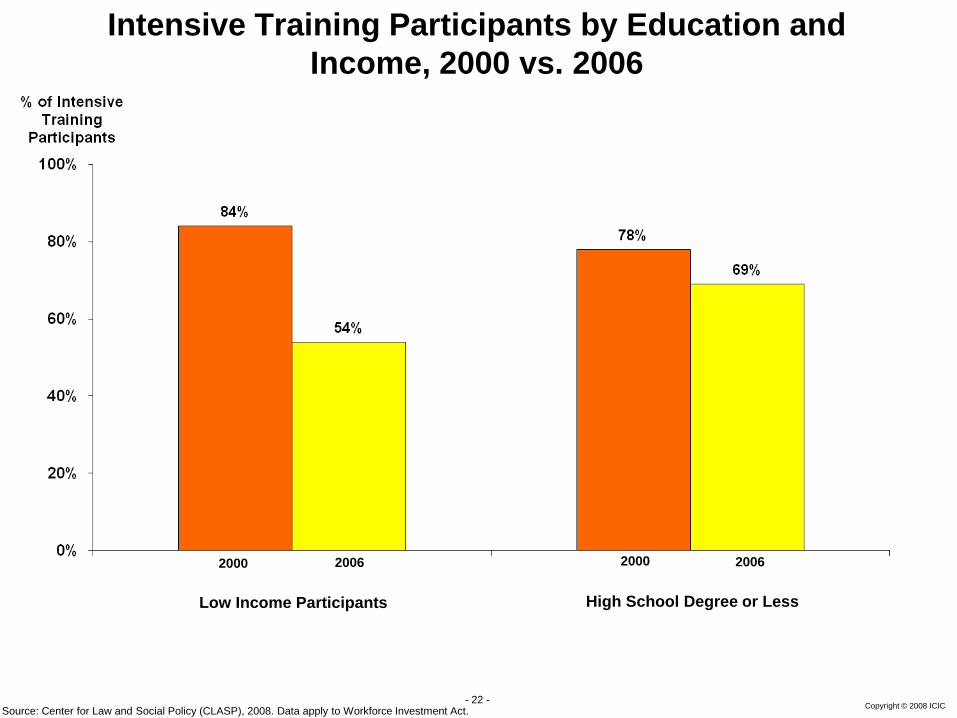
Copyright © 2008 ICIC- 22 -
Intensive Training Participants by Education and Income, 2000 vs. 2006
Source: Center for Law and Social Policy (CLASP), 2008. Data apply to Workforce Investment Act.
2000 2000 20062006
Low Income Participants High School Degree or Less
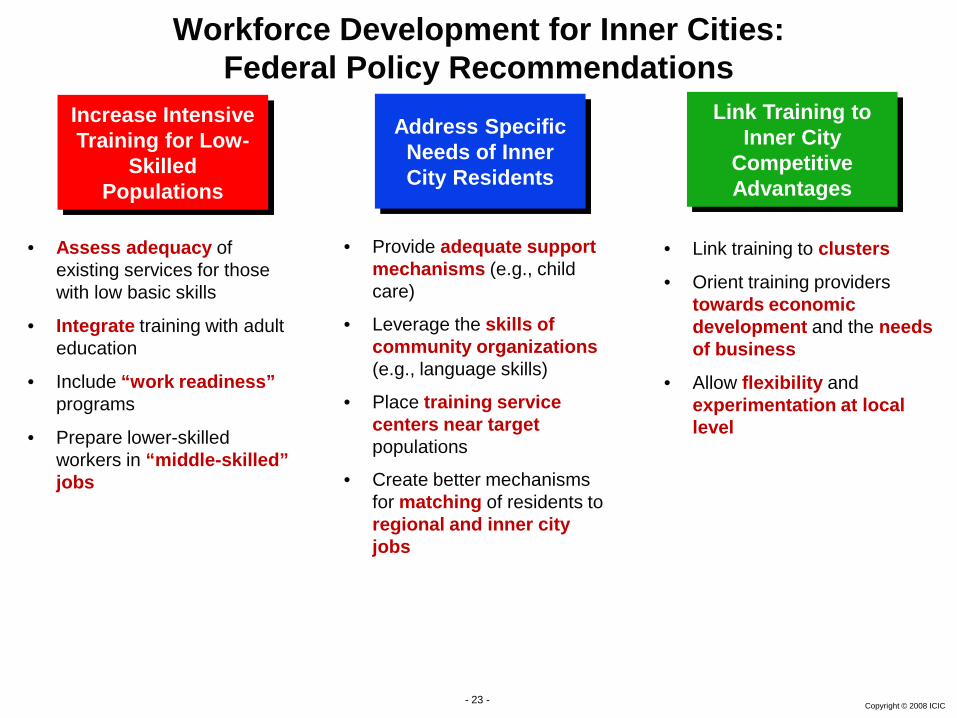
Copyright © 2008 ICIC- 23 -
Increase Intensive Training for Low-
Skilled Populations
Link Training to Inner City
Competitive Advantages
• Assess adequacy of existing services for those with low basic skills
• Integrate training with adult education
• Include “work readiness” programs
• Prepare lower-skilled workers in “middle-skilled” jobs
Address Specific Needs of Inner City Residents
Workforce Development for Inner Cities: Federal Policy Recommendations
• Provide adequate support mechanisms (e.g., child care)
• Leverage the skills of community organizations (e.g., language skills)
• Place training service centers near target populations
• Create better mechanisms for matching of residents to regional and inner city jobs
• Link training to clusters
• Orient training providers towards economic development and the needs of business
• Allow flexibility and experimentation at local level
Copyright © 2008 ICIC- 24 -
Agenda
• Performance of Inner City Economies
• Federal Policy and Inner City Economic Development
• Policy Area I: Workforce Training
• Policy Area II: Infrastructure
• Policy Area III: Capital Access
• Policy Area IV: Cluster Development

Copyright © 2008 ICIC- 25 - Copyright © 2008 ICIC- 25 -
Concentration of U.S. Infrastructure in Inner Cities, 2007
Source: Bureau of Transportation Statistics, 2008; State of the Inner City Economies (SICE) database; ICIC analysis
6%
9%
14%
15%
0%
2%
4%
6%
8%
10%
12%
14%
16%
Business Establishments Ports 50 Largest Airports Intermodal Facilities
% T
otal
U.S
. Inf
rast
ruct
ure
in th
e 10
0 La
rges
t Inn
er
Citi
es
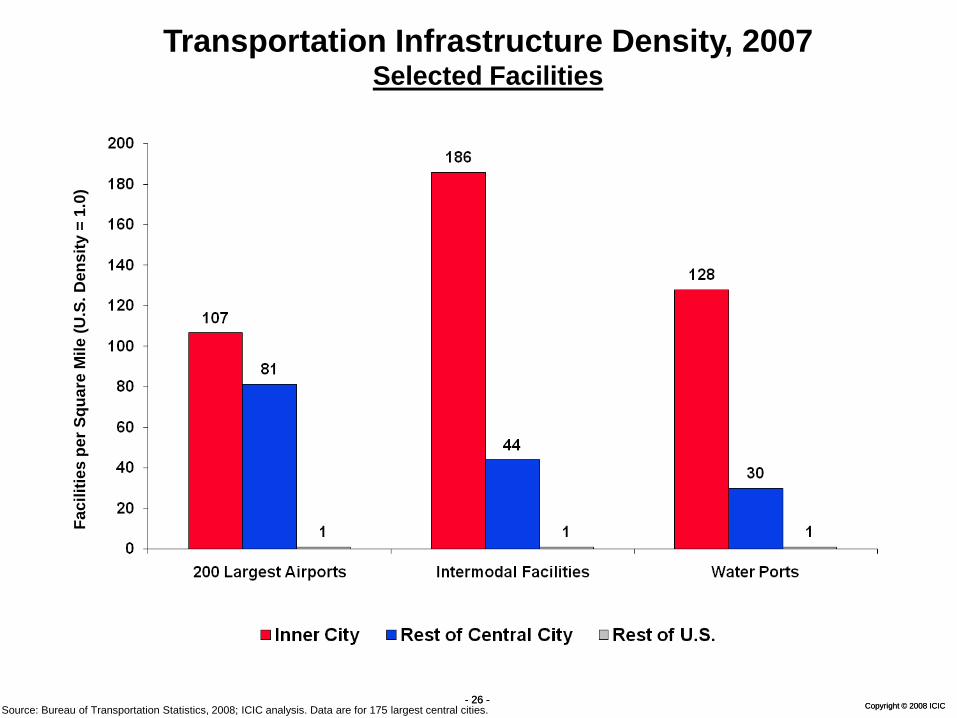
Copyright © 2008 ICIC- 26 - Copyright © 2008 ICIC- 26 -
Transportation Infrastructure Density, 2007Selected Facilities
Source: Bureau of Transportation Statistics, 2008; ICIC analysis. Data are for 175 largest central cities.
Faci
litie
s pe
r Squ
are
Mile
(U.S
. Den
sity
= 1
.0)
Copyright © 2008 ICIC- 27 -
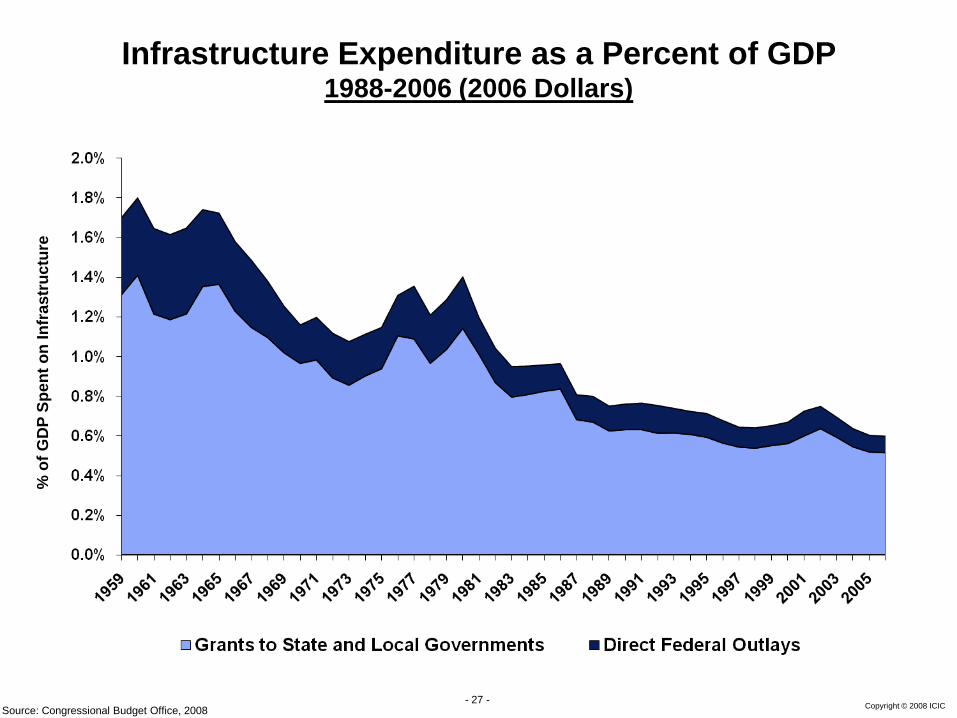
Infrastructure Expenditure as a Percent of GDP 1988-2006 (2006 Dollars)
% o
f GD
P Sp
ent o
n In
fras
truc
ture
Source: Congressional Budget Office, 2008
Copyright © 2008 ICIC- 28 -
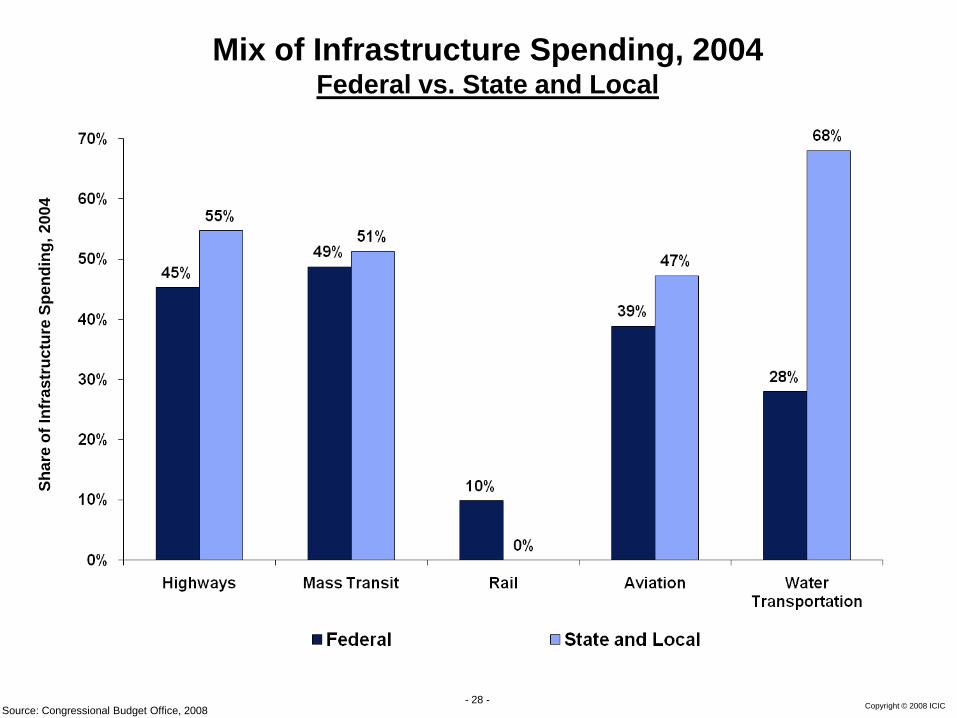
Mix of Infrastructure Spending, 2004Federal vs. State and Local
Source: Congressional Budget Office, 2008
Shar
e of
Infr
astr
uctu
re S
pend
ing,
200
4
Copyright © 2008 ICIC- 29 -
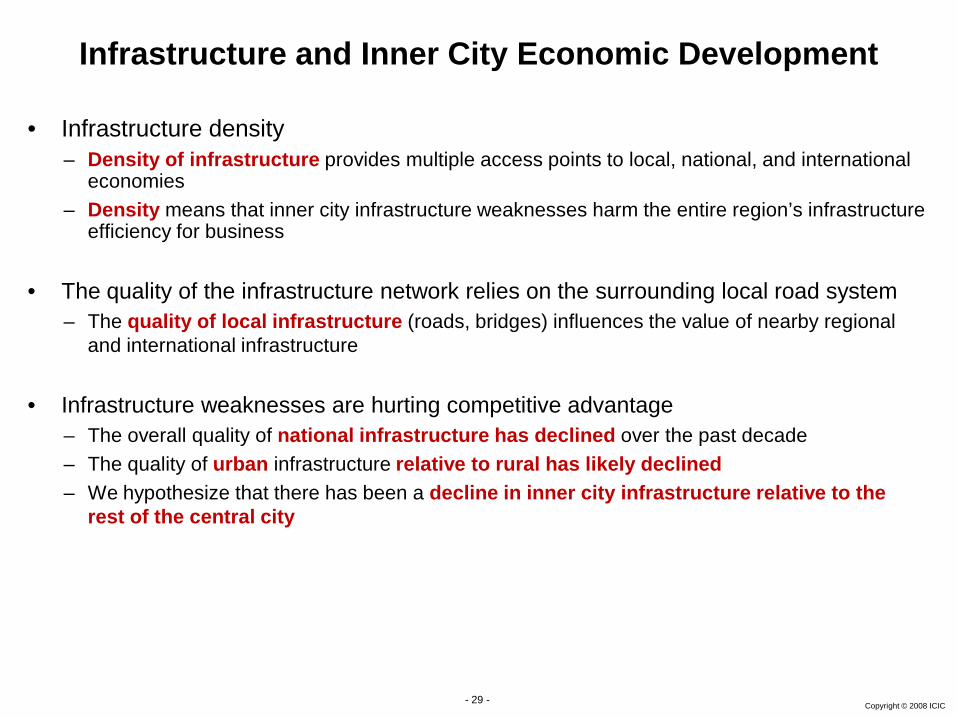
Infrastructure and Inner City Economic Development
• Infrastructure density – Density of infrastructure provides multiple access points to local, national, and international
economies– Density means that inner city infrastructure weaknesses harm the entire region’s infrastructure
efficiency for business
• The quality of the infrastructure network relies on the surrounding local road system– The quality of local infrastructure (roads, bridges) influences the value of nearby regional
and international infrastructure
• Infrastructure weaknesses are hurting competitive advantage– The overall quality of national infrastructure has declined over the past decade– The quality of urban infrastructure relative to rural has likely declined– We hypothesize that there has been a decline in inner city infrastructure relative to the
rest of the central city
Copyright © 2008 ICIC- 30 - Copyright © 2008 ICIC- 30 -
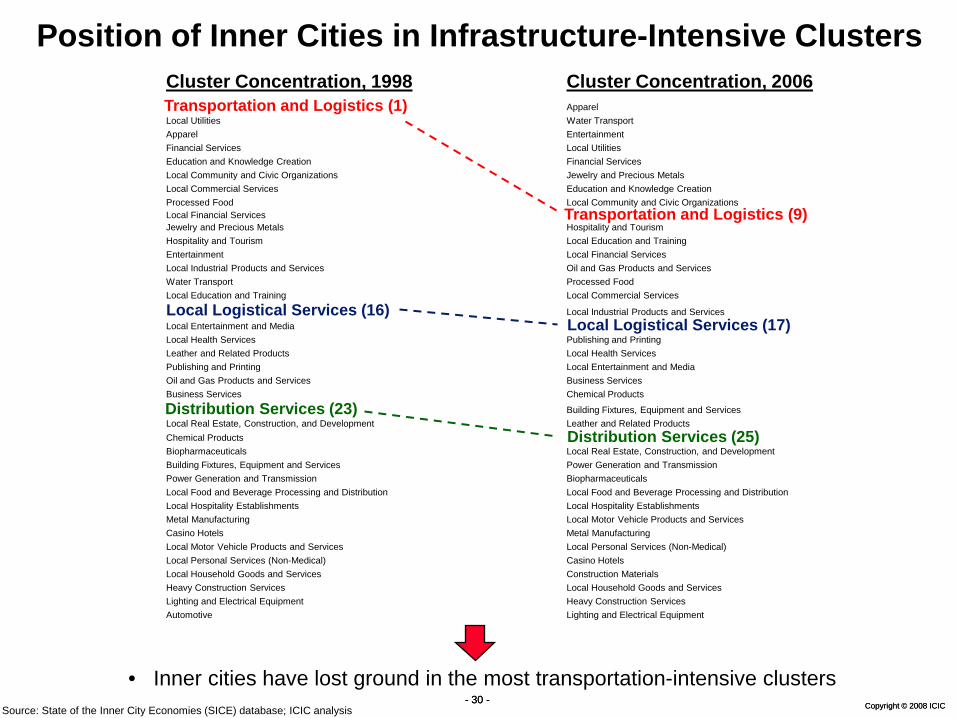
Position of Inner Cities in Infrastructure-Intensive ClustersCluster Concentration, 1998 Cluster Concentration, 2006
ApparelLocal Utilities Water TransportApparel EntertainmentFinancial Services Local UtilitiesEducation and Knowledge Creation Financial ServicesLocal Community and Civic Organizations Jewelry and Precious MetalsLocal Commercial Services Education and Knowledge CreationProcessed Food Local Community and Civic OrganizationsLocal Financial ServicesJewelry and Precious Metals Hospitality and TourismHospitality and Tourism Local Education and TrainingEntertainment Local Financial ServicesLocal Industrial Products and Services Oil and Gas Products and ServicesWater Transport Processed FoodLocal Education and Training Local Commercial Services
Local Industrial Products and ServicesLocal Entertainment and MediaLocal Health Services Publishing and PrintingLeather and Related Products Local Health ServicesPublishing and Printing Local Entertainment and MediaOil and Gas Products and Services Business ServicesBusiness Services Chemical Products
Building Fixtures, Equipment and ServicesLocal Real Estate, Construction, and Development Leather and Related ProductsChemical ProductsBiopharmaceuticals Local Real Estate, Construction, and DevelopmentBuilding Fixtures, Equipment and Services Power Generation and TransmissionPower Generation and Transmission BiopharmaceuticalsLocal Food and Beverage Processing and Distribution Local Food and Beverage Processing and DistributionLocal Hospitality Establishments Local Hospitality EstablishmentsMetal Manufacturing Local Motor Vehicle Products and ServicesCasino Hotels Metal ManufacturingLocal Motor Vehicle Products and Services Local Personal Services (Non-Medical)Local Personal Services (Non-Medical) Casino HotelsLocal Household Goods and Services Construction MaterialsHeavy Construction Services Local Household Goods and ServicesLighting and Electrical Equipment Heavy Construction ServicesAutomotive Lighting and Electrical Equipment
Source: State of the Inner City Economies (SICE) database; ICIC analysis
• Inner cities have lost ground in the most transportation-intensive clusters
Distribution Services (25)
Distribution Services (23)
Local Logistical Services (16)Local Logistical Services (17)
Transportation and Logistics (1)
Transportation and Logistics (9)
Copyright © 2008 ICIC- 31 - Copyright © 2008 ICIC- 31 -
Faci
litie
s pe
r Squ
are
Mile
(U.S
. Den
sity
= 1
.0)
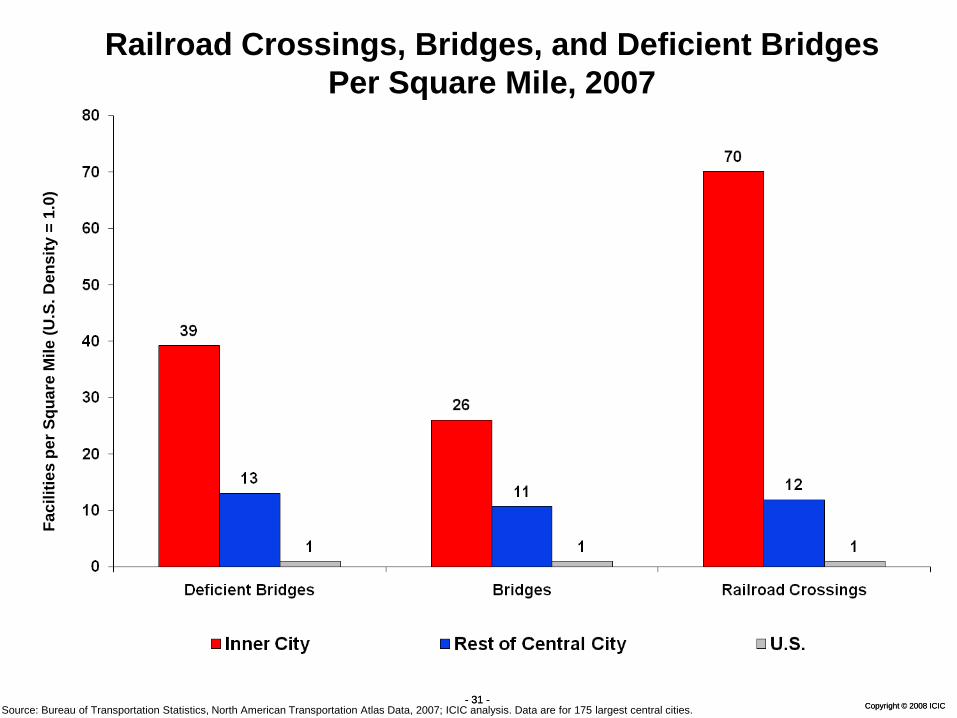
Railroad Crossings, Bridges, and Deficient Bridges Per Square Mile, 2007
Source: Bureau of Transportation Statistics, North American Transportation Atlas Data, 2007; ICIC analysis. Data are for 175 largest central cities.
Copyright © 2008 ICIC- 32 - Copyright © 2008 ICIC- 32 -
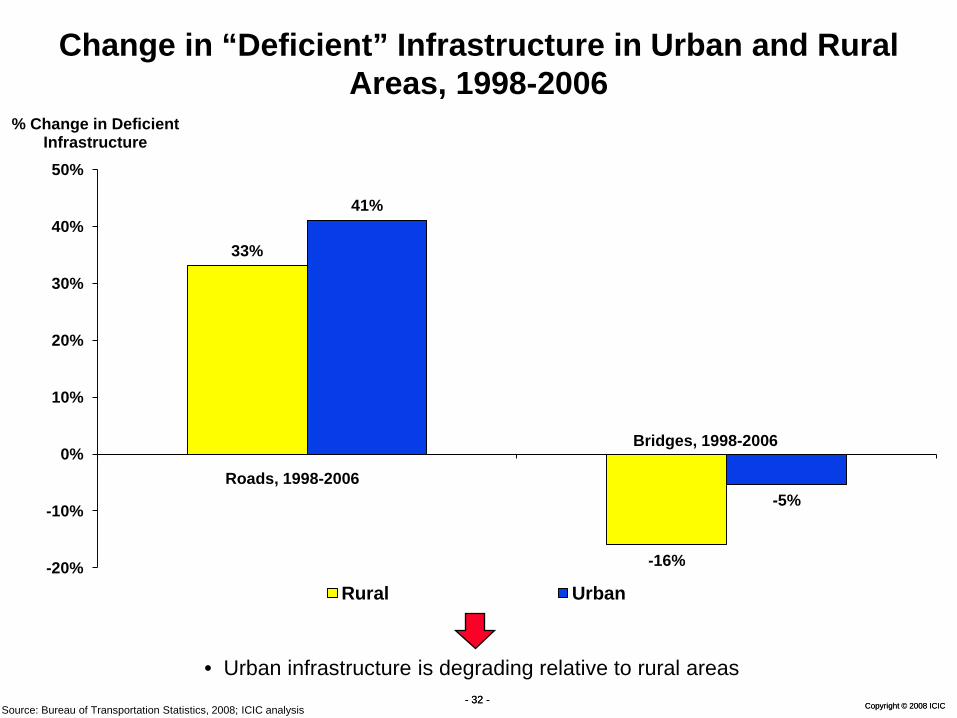
Change in “Deficient” Infrastructure in Urban and Rural Areas, 1998-2006
Source: Bureau of Transportation Statistics, 2008; ICIC analysis
33%
-16%
41%
-5%
-20%
-10%
0%
10%
20%
30%
40%
50%
% Change in Deficient Infrastructure
Rural Urban
Bridges, 1998-2006
Roads, 1998-2006
• Urban infrastructure is degrading relative to rural areas
Copyright © 2008 ICIC- 33 -
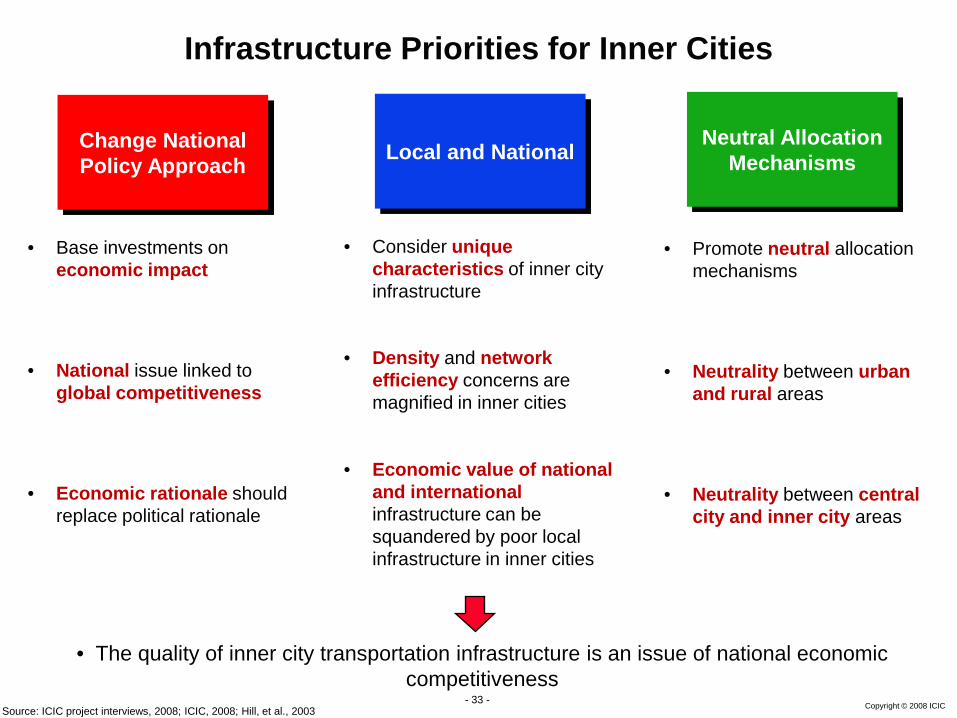
Change National Policy Approach
Neutral Allocation Mechanisms
• Base investments on economic impact
• National issue linked to global competitiveness
• Economic rationale should replace political rationale
Local and National
Infrastructure Priorities for Inner Cities
• Consider unique characteristics of inner city infrastructure
• Density and network efficiency concerns are magnified in inner cities
• Economic value of national and internationalinfrastructure can be squandered by poor local infrastructure in inner cities
• Promote neutral allocation mechanisms
• Neutrality between urban and rural areas
• Neutrality between central city and inner city areas
• The quality of inner city transportation infrastructure is an issue of national economic competitiveness
Source: ICIC project interviews, 2008; ICIC, 2008; Hill, et al., 2003
Copyright © 2008 ICIC- 34 -
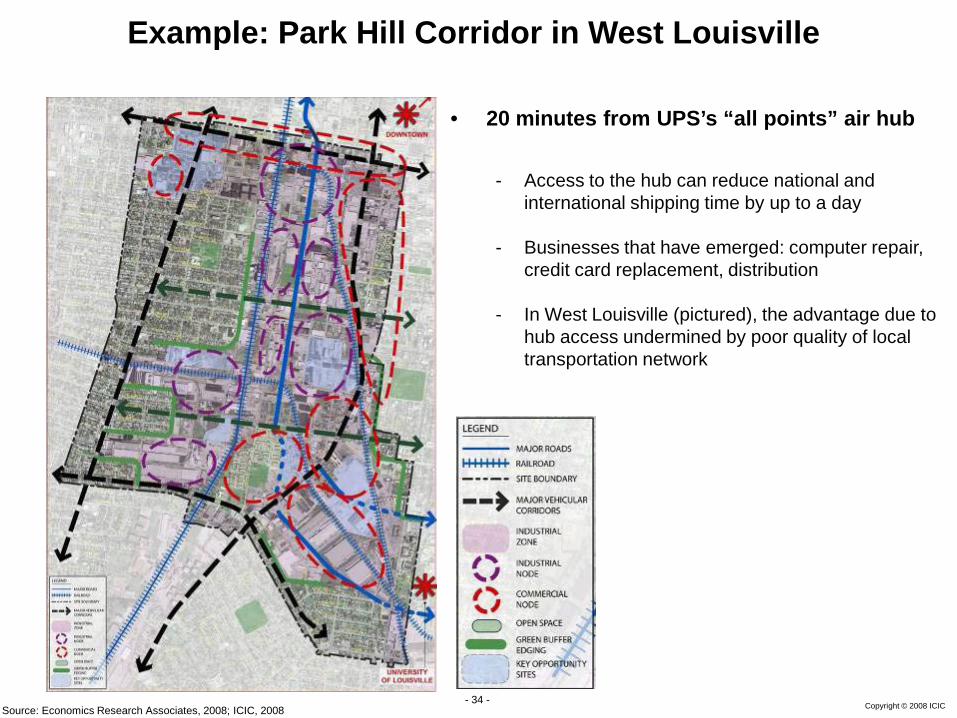
Example: Park Hill Corridor in West Louisville
• 20 minutes from UPS’s “all points” air hub
- Access to the hub can reduce national and international shipping time by up to a day
- Businesses that have emerged: computer repair, credit card replacement, distribution
- In West Louisville (pictured), the advantage due to hub access undermined by poor quality of local transportation network
Source: Economics Research Associates, 2008; ICIC, 2008
Copyright © 2008 ICIC- 35 -
Agenda
• Performance of Inner City Economies
• Federal Policy and Inner City Economic Development
• Policy Area I: Workforce Training
• Policy Area II: Infrastructure
• Policy Area III: Capital Access
• Policy Area IV: Cluster Development
Copyright © 2008 ICIC- 36 -
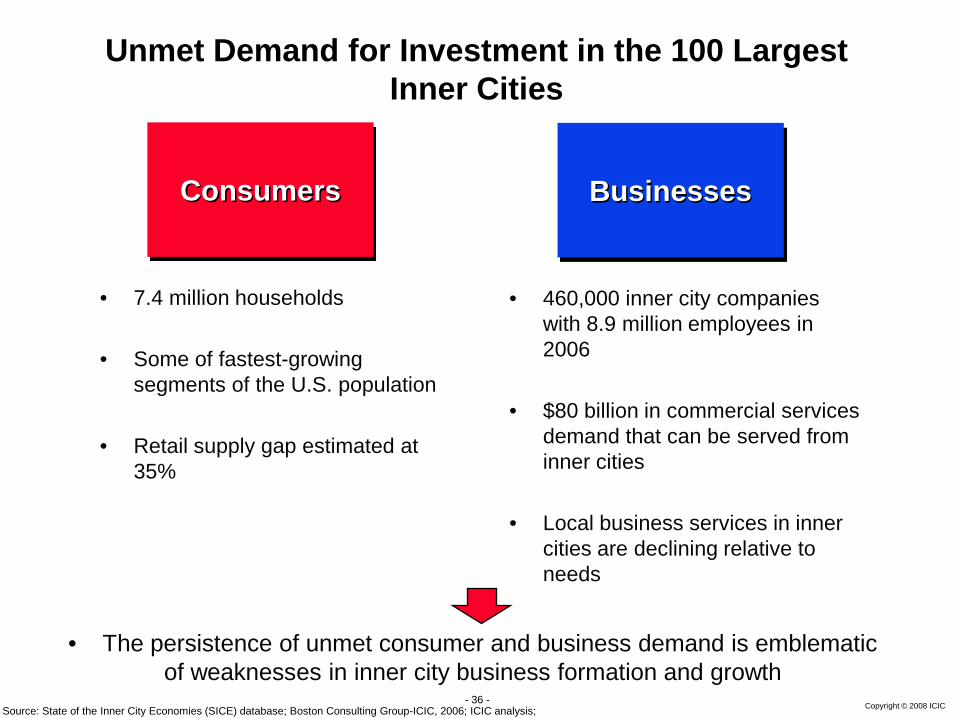
Unmet Demand for Investment in the 100 Largest Inner Cities
Consumers Businesses
• 7.4 million households
• Some of fastest-growing segments of the U.S. population
• Retail supply gap estimated at 35%
• 460,000 inner city companies with 8.9 million employees in 2006
• $80 billion in commercial services demand that can be served from inner cities
• Local business services in inner cities are declining relative to needs
Source: State of the Inner City Economies (SICE) database; Boston Consulting Group-ICIC, 2006; ICIC analysis;
• The persistence of unmet consumer and business demand is emblematic of weaknesses in inner city business formation and growth
Copyright © 2008 ICIC- 37 -
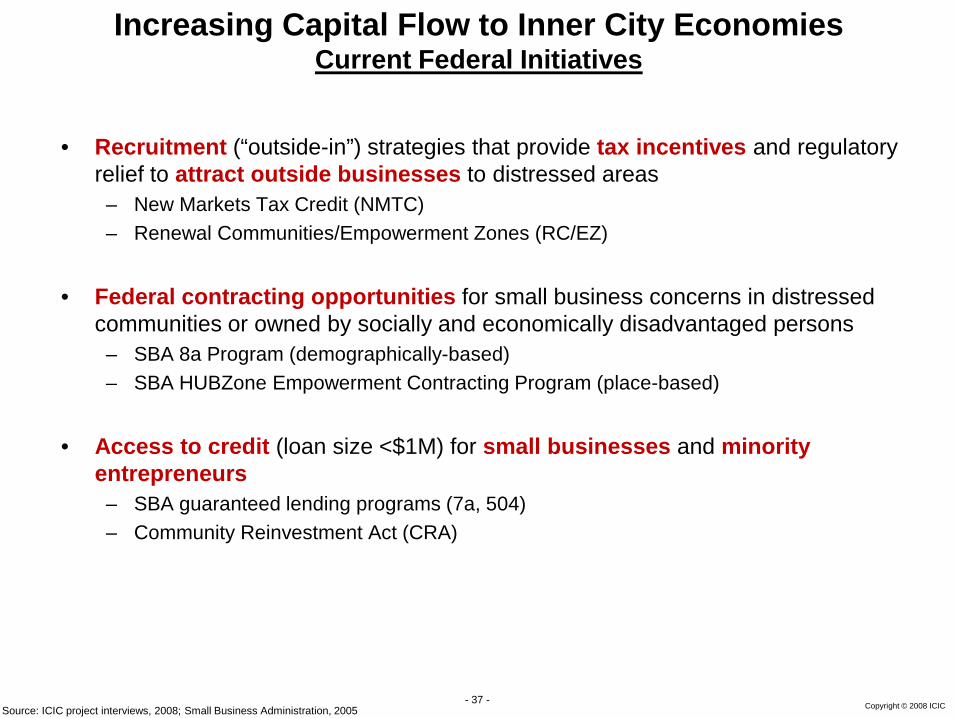
• Recruitment (“outside-in”) strategies that provide tax incentives and regulatory relief to attract outside businesses to distressed areas
– New Markets Tax Credit (NMTC)– Renewal Communities/Empowerment Zones (RC/EZ)
• Federal contracting opportunities for small business concerns in distressed communities or owned by socially and economically disadvantaged persons
– SBA 8a Program (demographically-based)– SBA HUBZone Empowerment Contracting Program (place-based)
• Access to credit (loan size <$1M) for small businesses and minority entrepreneurs
– SBA guaranteed lending programs (7a, 504)– Community Reinvestment Act (CRA)
Increasing Capital Flow to Inner City EconomiesCurrent Federal Initiatives
Source: ICIC project interviews, 2008; Small Business Administration, 2005
Copyright © 2008 ICIC- 38 -
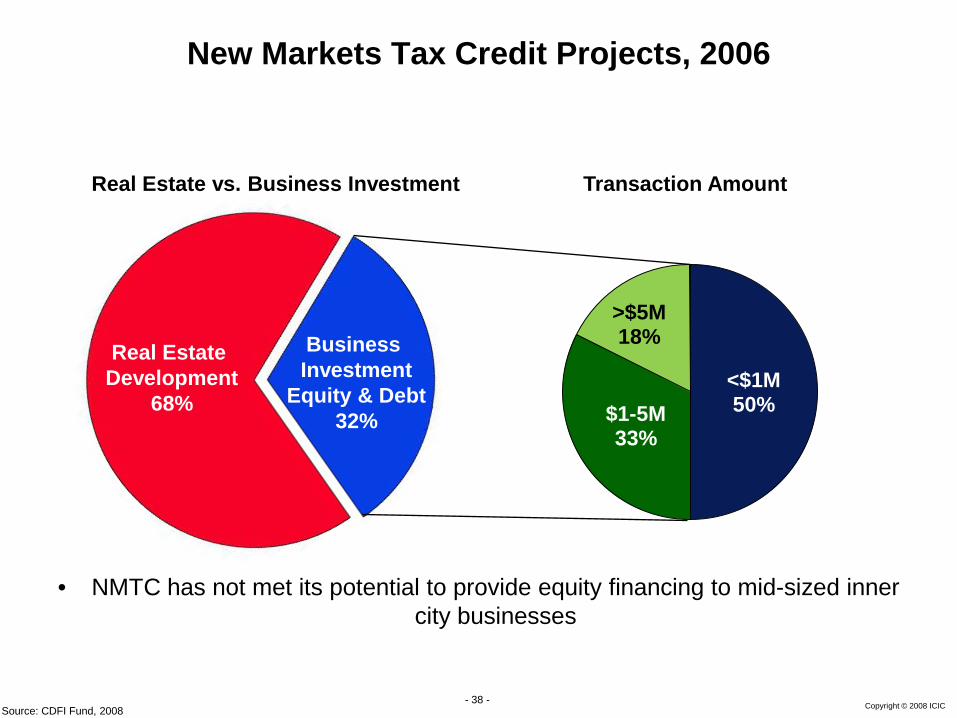
New Markets Tax Credit Projects, 2006
<$1M50%$1-5M
33%
>$5M18%
Source: CDFI Fund, 2008
Transaction Amount
• NMTC has not met its potential to provide equity financing to mid-sized inner city businesses
Real Estate vs. Business Investment
Real Estate Development
68%
Business Investment
Equity & Debt32%
Copyright © 2008 ICIC- 39 -
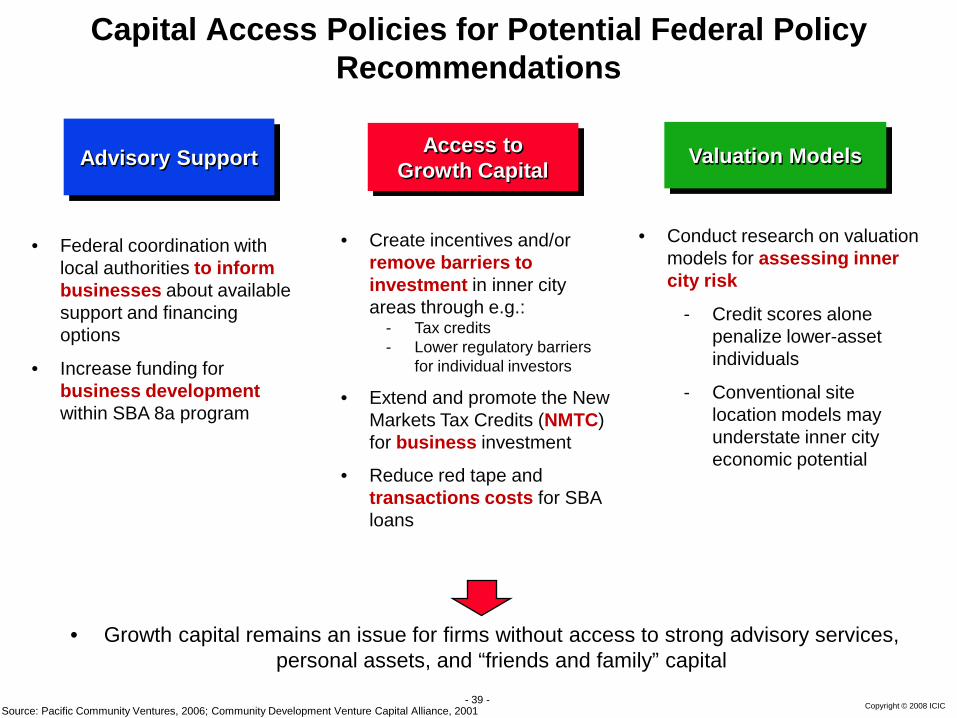
• Federal coordination with local authorities to inform businesses about available support and financing options
• Increase funding for business development within SBA 8a program
Advisory Support
Capital Access Policies for Potential Federal Policy Recommendations
Access to Growth Capital
• Create incentives and/or remove barriers to investment in inner city areas through e.g.:
- Tax credits- Lower regulatory barriers
for individual investors
• Extend and promote the New Markets Tax Credits (NMTC) for business investment
• Reduce red tape and transactions costs for SBA loans
Valuation Models
• Conduct research on valuation models for assessing inner city risk
- Credit scores alone penalize lower-asset individuals
- Conventional site location models may understate inner city economic potential
• Growth capital remains an issue for firms without access to strong advisory services, personal assets, and “friends and family” capital
Source: Pacific Community Ventures, 2006; Community Development Venture Capital Alliance, 2001
Copyright © 2008 ICIC- 40 -
Agenda
• Performance of Inner City Economies
• Federal Policy and Inner City Economic Development
• Policy Area I: Workforce Training
• Policy Area II: Infrastructure
• Policy Area III: Capital Access
• Policy Area IV: Cluster Development
Copyright © 2008 ICIC- 41 -
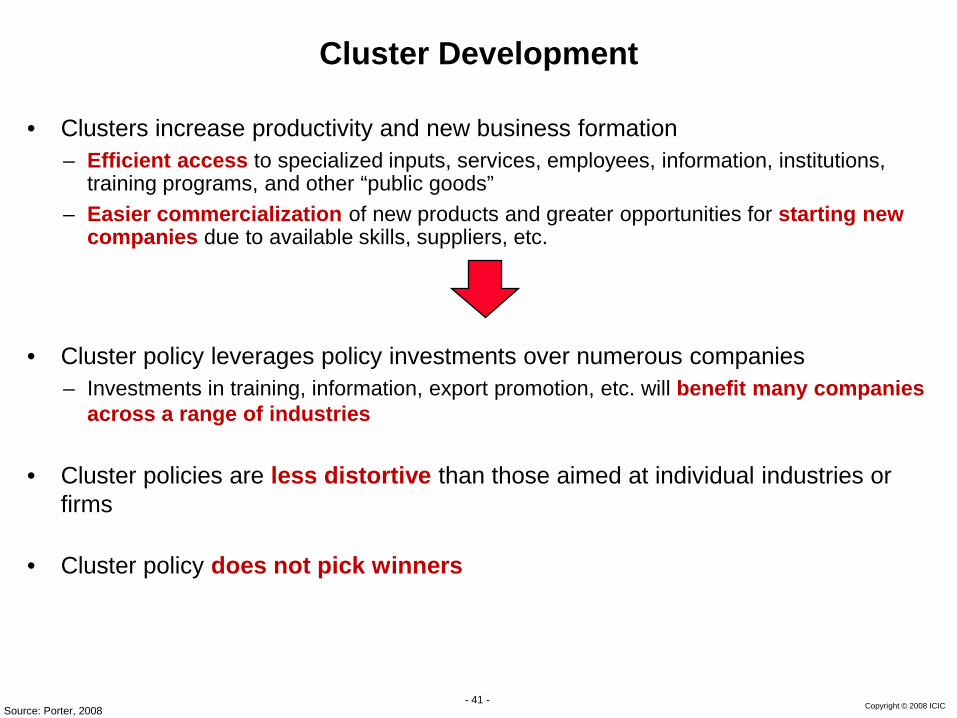
Cluster Development
• Clusters increase productivity and new business formation– Efficient access to specialized inputs, services, employees, information, institutions,
training programs, and other “public goods” – Easier commercialization of new products and greater opportunities for starting new
companies due to available skills, suppliers, etc.
• Cluster policy leverages policy investments over numerous companies– Investments in training, information, export promotion, etc. will benefit many companies
across a range of industries
• Cluster policies are less distortive than those aimed at individual industries or firms
• Cluster policy does not pick winners
Source: Porter, 2008

Copyright © 2008 ICIC- 42 -
Clusters and Federal Economic Development StrategyCurrent Initiatives
• The current state of Federal cluster policy is weak– “U.S. federal government has been almost entirely absent from the realm of
cluster initiative programs” (Mills, et al. 2008) – In 2006, only $565 million out of $76 billion in federal spending on economic
development supported collaboration and clusters– Some exceptions:
• WIRED: Collaborative approach to regional development; many efforts, e.g., West Louisville, are organized around clusters
• SECTORS (July, 2008): “Strengthening Employment Clusters to Organize Regional Success”; DOL; training skilled worker to address shortages; “grantees are required to identify targeted industry clusters”
• However, there is growing role of cluster thinking in economic development
Source: Mills, 2008
Copyright © 2008 ICIC- 43 -
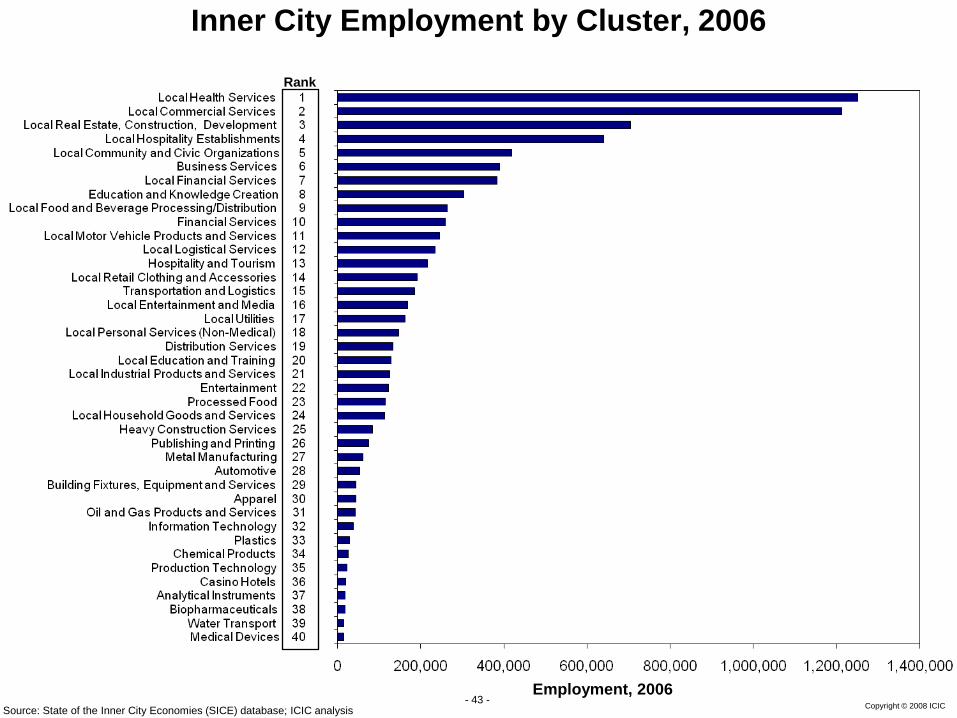
Inner City Employment by Cluster, 2006
Employment, 2006
Rank
Source: State of the Inner City Economies (SICE) database; ICIC analysis
Copyright © 2008 ICIC- 44 -
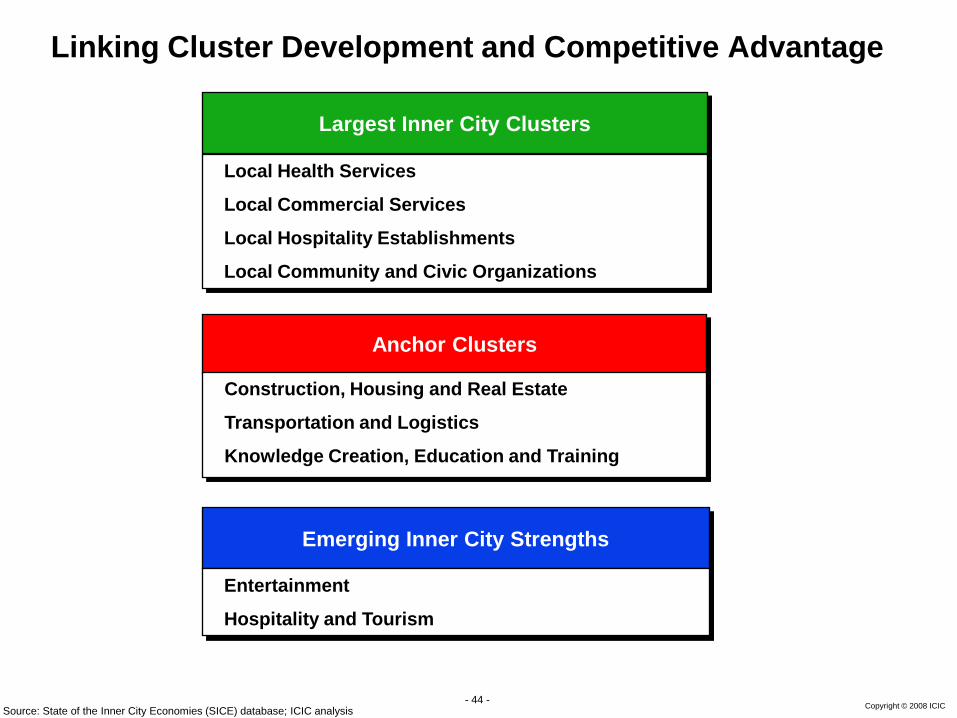
Anchor Clusters
Emerging Inner City Strengths
Construction, Housing and Real Estate
Transportation and Logistics
Knowledge Creation, Education and Training
Largest Inner City Clusters
Linking Cluster Development and Competitive Advantage
Source: State of the Inner City Economies (SICE) database; ICIC analysis
Local Health Services
Local Commercial Services
Local Hospitality Establishments
Local Community and Civic Organizations
Entertainment
Hospitality and Tourism
Related Documents