“CAPACITY AUGMENTATION OF NATIONAL WATERWAY.1” (Jal Marg Vikas Project) ENVIRONMENTAL IMPACT ASSESSMENT REPORTS VOLUME - 3A: DESCRIPTION OF ENVIRONMENT (Baseline Part of Volume 3) May 2016 (Revised September 2016) IRG Systems South Asia Pvt. Ltd. Abnaki Infrastructure Applications & Integrated Development Pvt. Ltd. INLAND WATERWAYS AUTHORITY OF INDIA Ministry of Shipping, Government of India EQMS India Pvt. Ltd. In JV with SFG2231 V2 Public Disclosure Authorized Public Disclosure Authorized Public Disclosure Authorized Public Disclosure Authorized Public Disclosure Authorized Public Disclosure Authorized Public Disclosure Authorized Public Disclosure Authorized

Welcome message from author
This document is posted to help you gain knowledge. Please leave a comment to let me know what you think about it! Share it to your friends and learn new things together.
Transcript
“CAPACITY AUGMENTATION OF NATIONAL WATERWAY.1”
(Jal Marg Vikas Project)
ENVIRONMENTAL IMPACT ASSESSMENT REPORTS
VOLUME - 3A: DESCRIPTION OF ENVIRONMENT
(Baseline Part of Volume 3)
May 2016 (Revised September 2016)
IRG Systems South Asia Pvt. Ltd. Abnaki Infrastructure Applications &
Integrated Development Pvt. Ltd.
INLAND WATERWAYS AUTHORITY OF INDIA
Ministry of Shipping, Government of India
EQMS India Pvt. Ltd. In JV with
SFG2231 V2P
ublic
Dis
clos
ure
Aut
horiz
edP
ublic
Dis
clos
ure
Aut
horiz
edP
ublic
Dis
clos
ure
Aut
horiz
edP
ublic
Dis
clos
ure
Aut
horiz
edP
ublic
Dis
clos
ure
Aut
horiz
edP
ublic
Dis
clos
ure
Aut
horiz
edP
ublic
Dis
clos
ure
Aut
horiz
edP
ublic
Dis
clos
ure
Aut
horiz
ed
Consolidated Environmental Impact Assessment Report of National Waterways-1: Volume-3A
2
Table of Contents
Chapter 1. INTRODUCTION......................................................................................................... 12 1.1. Project Background............................................................................................................. 12 1.2. Brief Project Description ..................................................................................................... 12 1.3. Environmental Impact Assessment Process ...................................................................... 15 1.4. Anticipated Environmental Impacts and Mitigation Measures ........................................... 16 1.5. Environment Management Plan ......................................................................................... 16 1.6. Institutional Framework of IWAI.......................................................................................... 18 1.7. Reporting requirement ........................................................................................................ 19 1.8. Training and Capacity Building Programme....................................................................... 19 1.9. Conclusion .......................................................................................................................... 19 Chapter 2. DESCRIPTION OF THE ENVIRONMENT ................................................................. 20 2.1. General................................................................................................................................ 20 2.2. Baseline Analysis, Study Area and Salient Environmental Features ................................ 20 2.2.1. Baseline Data Collection and Study Area .......................................................................... 20 2.2.2. Environmental Setting and Salient Environmental Features of the Project Area ............. 21 2.2.3. Primary Data Collection: Monitoring Plan and Quality Assurance Procedures ................ 23 2.3. Physical Environment ......................................................................................................... 24 2.3.1. Topography......................................................................................................................... 24 2.3.2. Drainage Pattern (Ganga River) ........................................................................................ 25 2.3.3. Drainage pattern NW-1 ...................................................................................................... 26 2.3.4. Land use Pattern ................................................................................................................ 28 2.3.5. Land use pattern along NW-1 ............................................................................................ 28 2.3.6. Cropping Pattern ................................................................................................................ 31 2.3.7. Major Habitation along the NW-1 ....................................................................................... 31 2.3.8. Geology .............................................................................................................................. 31 2.3.9. Volcanic activity .................................................................................................................. 32 2.3.10. Seismicity............................................................................................................................ 32 2.3.11. Soil ...................................................................................................................................... 33 2.3.12. Meteorological Data (30 years avg.) .................................................................................. 37 2.3.13. Water Environment............................................................................................................. 44 2.3.14. Ganga River Water Quality in NW-1 Stretch ..................................................................... 51 2.3.15. River Water Quality at dredging locations ......................................................................... 60 2.3.16. River Sediment Analysis. ................................................................................................... 64 2.3.17. Air Environment .................................................................................................................. 76 2.3.18. Ambient Noise Quality ........................................................................................................ 83 2.4. Biological Environment (NW-1) .......................................................................................... 87 2.4.1. Ecological Profile - Biogeographic Zone ............................................................................ 87 2.4.2. Forest type .......................................................................................................................... 88 2.4.3. Critical Environmental Resources in Project Area (NW-1) ................................................ 90 2.4.4. Important Bird Area within 10 km area of the NW-1 .......................................................... 94 2.4.5. Terrestrial biodiversity along NW-1 stretch of River Ganga .............................................. 98 2.4.6. Aquatic Biodiversity in NW-1 .............................................................................................. 99 2.4.7. Primary Data analysis ...................................................................................................... 102 2.4.8. Breeding and Spawning ................................................................................................... 106 2.4.9. Terrestrial and Aquatic biodiversity around Finalised intervention sites of NW-1........... 109 2.5. Socio-economic Environment ........................................................................................... 113 2.5.1. Demography ..................................................................................................................... 113
Consolidated Environmental Impact Assessment Report of National Waterways-1: Volume-3A
3
2.5.2. Population Distribution in Major Cities along NW-1 ......................................................... 113 2.5.3. Scheduled Caste and Schedule Tribe Population in Major cities/Town along NW-1 ..... 115 2.5.4. Literacy Level in Major cities/towns along NW-1 ............................................................. 116 2.5.5. Workers Scenario and Livelihood Pattern of the community along NW-1 ...................... 118 2.5.6. Livelihood Pattern of the community Depending on the river .......................................... 120 2.5.7. Fishing and Livelihood Generation along NW-1 .............................................................. 120 2.5.8. Infrastructure Facilities along NW-1 ................................................................................. 122 2.5.9. Cultural Activities and Religiously Important Places along NW-1and Important
Festivals............................................................................................................................ 140 2.5.10. Tourism ............................................................................................................................. 141 2.5.11. Existing Waste Management Facilities along NW-1 ........................................................ 142 2.5.12. Water Born Diseases ....................................................................................................... 143 2.5.13. Archeologically Protected structures (within 300 m of NW-1) ......................................... 144
List of Tables
Table 1.1 : Traffic Forecast for Planned Navigational Infrastructural Facilities ........................... 13 Table 1.2 : Salient Features of Jal Marg Vikas Project ................................................................ 14 Table 2.1 : Salient Environmental Features along NW-1 Alignment ........................................... 21 Table 2.2 : Summary of Monitoring Plan and Methodologies Adopted for Primary Data
Collection ............................................................................................................................... 23 Table 2.3 : Ganga river Basin Catchment Area ........................................................................... 25 Table 2.4 Distribution of the Drainage Area of Ganga River in India........................................... 26 Table 2.5 : Overview of Land use in the States traversed by NW-1 ............................................ 28 Table 2.6 : Land use of the Study Area ........................................................................................ 28 Table 2.7 : Soil Quality along NW-1 (near Proposed Terminal Locations) .................................. 35 Table 2.8 : Soil Quality along NW-1 (Near Existing Ro-Ro / Jetty / Floating Terminal Locations)
............................................................................................................................................... 36 Table 2.9 : Meteorological Data (Period 1961-1990) ................................................................... 39 Table 2.10 : Meteorological Data (Period 1961-1990) ................................................................. 39 Table 2.11 : Meteorological Data.................................................................................................. 43 Table 2.12 : Overview of Ground water uses Pattern in States Traversed by NW-1 .................. 44 Table 2.13 : State wise Ground water resources in NW-1 (2008) ............................................... 45 Table 2.14 : Ground Water Sampling Locations along NW-1 ...................................................... 45 Table 2.15 : Ground Water Quality at Proposed Terminals/Lock area........................................ 48 Table 2.16 : Ground Water Quality at Major Habitation area along NW-1 .................................. 50 Table 2.17 : CPCB Best Designated Use Standard (source: CPCB) .......................................... 51 Table 2.18 : River Water Quality at Different cities along NW-1.................................................. 52 Table 2.19 : Name of Surface Water Sampling Locations ........................................................... 55 Table 2.20 : Ganga Water Quality NW-1 (near proposed and planned Terminal Site location) . 57 Table 2.21 : Ganga Water Quality Along NW-1 (near Existing Ro-Ro/Jetty/Floating Terminal
sites)....................................................................................................................................... 58 Table 2.22 : Ganga Water Quality near sensitive locations along NW-1 .................................... 59 Table 2.23 : Ganga Water Quality NW-1 (U/S and D/S of the Dredging Machine at Farakka
Location) ................................................................................................................................ 61 Table 2.24 : Ganga Water Quality NW-1 (U/S and D/S of the Dredging Machine at Gaighat
Patna Dredger No-1) ............................................................................................................. 62 Table 2.25 Ganga Water Quality NW-1 (U/S and D/S of the Dredging Machine at Gaighat Patna
Dredger No-2) ........................................................................................................................ 62 Table 2.26 : Summary of River Bed Sediment Quality ................................................................ 69 Table 2.27 : Ambient Air Quality results for PM2.5 and PM10 (24-hour average) along NW-1.. 76
Consolidated Environmental Impact Assessment Report of National Waterways-1: Volume-3A
4
(at Proposed Terminal Locations) ................................................................................................ 76 Table 2.28 : Ambient Air Quality Monitoring Results for SOx, NOx (24-h avg.) along NW-1 (at
Proposed Terminal Locations) .............................................................................................. 77 Table 2.29 : Ambient Air Quality results for PM2.5 and PM10 (24-hour average)along NW-1 (at
RO-RO Jetty/ Floating Terminals) ......................................................................................... 77 Table 2.30 : Ambient Air Quality Monitoring Results for SOx, NOx and CO (24-h avg.) along
NW-1(at RO-RO Jetty/ Floating Terminals) .......................................................................... 78 Table 2.31 : Ambient Noise level along NW-1 and proposed intervention locations .................. 83 Table 2.32 : Ambient Noise level along NW-1 near Sensitive Ecosystems ................................ 85 Table 2.33 : State-wise Forest and Tree Cover in study area and State Traversed by NW-1.... 89 Table 2.34 : Salient features of Wild life Sanctuaries present within NW-1 ................................ 90 Table 2.35 : Turtle species in Sanctuary Area ............................................................................. 91 Table 2.36 : Location of the Hilsa Sanctuary and their stretch .................................................... 94 Table 2.37 : Important Bird Area within 10 km area of the NW-1 ................................................ 95 Table 2.38 : List of the Birds Visiting Udhwa Lake sanctuary ...................................................... 97 Table 2.39 : Phytoplankton observed at Sanctuary Area along NW-1 ...................................... 103 Table 2.40 : Zooplanktons observed at Sanctuary Area along NW-1 ....................................... 105 Table 2.41 : Nesting and hatching season of turtle species ...................................................... 108 Table 2.42 : Population of Major City & Towns along with NW-1 .............................................. 114 Table 2.43 : Caste wise (SC & ST) Population breakup in cities/towns along NW-1................ 115 Table 2.44 : Literate and Illiterate Population breakup in cities/towns along NW-1 .................. 117 Table 2.45 : Working and Non-Working Population breakup in cities/towns along NW-1 ........ 118 Table 2.46 : Wastewater Generation and Treatment Capacity.................................................. 122 Table 2.47 : Sewage Generation of class Cities-I in River Ganga ............................................ 122 Table 2.48 : Culturally and Religiously Important Places with Fair and Festivals ..................... 140 Table 2.49 : Epidemiological status of Malaria in 2010 and 2011 in the States Traversed by NW-
1 ........................................................................................................................................... 143 Table 2.50 : State-Wise Dengue Cases and Deaths in the States Traversed by NW-1 ........... 143 Table 2.51 : Kala-azar cases and deaths in the States Traversed by NW-1............................. 144 Table 2.52 : AES/JE (Viral) Cases and Deaths (2006 – 2011) in the States Traversed by NW-1
............................................................................................................................................. 144 Table 2.53 : Archeologically Protected area around 300 m of NW-1 ........................................ 144
List of Figures
Figure 1.1 : Location Map of NW-1............................................................................................... 15 Figure 2.1 : Study Area Map (NW-1) ............................................................................................ 21 Figure 2.2 : DEM of NW-1 ............................................................................................................ 25 Figure 2.3 : Drainage Map of 2 Km radius of NW-1 ..................................................................... 27 Figure 2.4 : Line Diagram of Ganga and its tributaries ................................................................ 27 Figure 2.5 : Land use Map (Allahabad to Patna) ......................................................................... 29 Figure 2.6 : Land use Map (Patna to Katwa) ............................................................................... 30 Figure 2.7 : Land use Map (Katwa to Haldia)............................................................................... 31 Figure 2.8 : Geological Map of India............................................................................................. 32 Figure 2.9 : Seismic of Zones Map of India.................................................................................. 33 Figure 2.10 : Wind Speed at different IMD stations along NW-1 ................................................. 40 Figure 2.11 : Monthly Rainfall ....................................................................................................... 40 Figure 2.12 : Monthly Relative Humidity....................................................................................... 41 Figure 2.13 : Monthly Temperature .............................................................................................. 42 Figure 2.14 : Wind Rose Diagram ................................................................................................ 43 Figure 2.15 : Cyclone Prone Area Map of India showing NW-1 .................................................. 44
Consolidated Environmental Impact Assessment Report of National Waterways-1: Volume-3A
5
Figure 2.16 : Ground Water Sampling Locations ......................................................................... 47 Figure 2.17 : Graphical representation of Ganga River water quality at Different Locations ...... 53 Figure 2.18 : Graphical representation of Ganga Water Quality at Different Cities along NW-1 54 Figure 2.19 : Surface Water Sampling Locations......................................................................... 56 Figure 2.20 : View of Dredging Operations at Farakka ................................................................ 60 Figure 2.21 : Dredging and Bore hole locations along NW-1 ...................................................... 64 Figure 2.22 : River Bed Sediment Analysis between Allahabad to Varanasi Stretch ................. 65 Figure 2.23 : River Bed Sediment Analysis between Varanasi to Buxar Stretch ........................ 66 Figure 2.24 : River Bed Sediment Analysis between Buxar to Patna Stretch ............................ 67 Figure 2.25 : River Bed Sediment Analysis between Patna to Farakka Stretch ......................... 68 Figure 2.26 : Surface and Ground Water Sampling (in- situ testing) at Different Locations along
NW-1 ...................................................................................................................................... 74 Figure 2.27 Surface and Ground Water Sampling at Different Locations along NW-1 ............... 75 Figure 2.28 : AAQ Monitoring Location Map ................................................................................ 76 Figure 2.29 : Graphical Representation of AAQ monitoring results around Proposed Terminal
and Lock Locations ................................................................................................................ 80 Figure 2.30 : Graphical Representation of AAQ Monitoring Results at RO-RO and Floating Jetty
Locations................................................................................................................................ 81 Figure 2.31 : Photographs of AAQ Monitoring Along NW-1 ........................................................ 82 Figure 2.32 : Noise Monitoring Location Map .............................................................................. 83 Figure 2.33 : Photographs of Noise Monitoring along NW-1 ....................................................... 86 Figure 2.34 : Biogeographic zone and provinces falling in NW-1 ................................................ 88 Figure 2.35 : Reserve Forest Map of States Traversed by NW-1 ............................................... 89 Figure 2.36 : Location of Kashi Turtle Sanctuary in NW-1........................................................... 91 Figure 2.37 : Location of VGDS in NW-1 ..................................................................................... 93 Figure 2.38 : Location of Hilsa Sanctuaries in NW-1 ................................................................... 94 Figure 2.39 : Location of Udhwa Bird Sanctuaries ....................................................................... 96 Figure 2.40 : Photographs of Udhwa Lake Sanctuary ................................................................. 97 Figure 2.41 : Fish Breeding and Spawning Grounds along NW-1 (Haldia to Baidyapur Stretch)
............................................................................................................................................. 107 Figure 2.42 : Fish Breeding and Spawning Grounds along NW-1 (Baidyapur to Sahibganj
Stretch)................................................................................................................................. 107 Figure 2.43 : Fish Breeding and Spawning Grounds along NW-1 (Sahibganj to Patna Stretch)
............................................................................................................................................. 107 Figure 2.44 : Fish Breeding and Spawning Grounds along NW-1 (Patna to Allahabad Stretch)
............................................................................................................................................. 108 Figure 2.45 : Location of proposed terminal, TWS and study area/NW-1 ................................. 112 Figure 2.46 : Graphical Presentation of Male-Female Wise Population.................................... 115 Figure 2.47 : Graphical representation of SC, ST and General Population .............................. 116 Figure 2.48 : Graphical representation of literate and Illiterate Population ............................... 118 Figure 2.49 : Graphical representation of Working and Non-working Population ..................... 119 Figure 2.50 : Classification of Main Working Population in cities/town along NW-1 ................. 119 Figure 2.51 : Infrastructural Mapping along 500 m area of NW-1 (Chainage 0-80 km) ............ 124 Figure 2.52 : Infrastructural Mapping along 500 m area of NW-1 (Chainage 80-197 km) ........ 125 Figure 2.53 : Infrastructural Mapping along 500 m area of NW-1 (Chainage 197-377 km) ...... 126 Figure 2.54 : Infrastructural Mapping along 500 m area of NW-1 (Chainage 377- 447 km) ..... 127 Figure 2.55 : Infrastructural Mapping along 500 m area of NW-1 (Chainage 447-553 km) ...... 128 Figure 2.56 : Infrastructural Mapping along 500 m area of NW-1 (Chainage 553-627 km) ...... 129 Figure 2.57 : Infrastructural Mapping along 500 m area of NW-1 (Chainage 627-750 km) ...... 130 Figure 2.58 : Infrastructural Mapping along 500 m area of NW-1 (Chainage 750-887 km) ...... 131 Figure 2.59 : Infrastructural Mapping along 500 m area of NW-1 (Chainage 887-1007 km) .... 132 Figure 2.60 : Infrastructural Mapping along 500 m area of NW-1 (Chainage 1007-1147 km) .. 133
Consolidated Environmental Impact Assessment Report of National Waterways-1: Volume-3A
6
Figure 2.61 : Infrastructural Mapping along 500 m area of NW-1 (Chainage 1147-1267 km) .. 134 Figure 2.62 : Infrastructural Mapping along 500 m area of NW-1 (Chainage 1267-1342 km) .. 135 Figure 2.63 : Infrastructural Mapping along 500 m area of NW-1 (Chainage 1342-1392 km) .. 136 Figure 2.64 : Infrastructural Mapping along 500 m area of NW-1 (Chainage 1392-1465 km) .. 137 Figure 2.65 : Infrastructural Mapping along 500 m area of NW-1 (Chainage 1465-1526 km) .. 138 Figure 2.66 : Infrastructural Mapping along 500 m area of NW-1 (Chainage 1526- km) .......... 139 Figure 2.67 : Photographs of Archaeological& Cultural sites within 300 m of NW-1 ................ 146
List of Annexure
Annexure 3.1: List Flora and Fauna observed Along NW-1 (Allahabad to Haldia) ................... 148
Consolidated Environmental Impact Assessment Report of National Waterways-1: Volume-3A
7
Abbreviations
µg/m3 Microgram per cubic metre
A Ampere
AAQ Ambient Air Quality
AD Amphibian Dredger
amsl above men sea level
APHA American Public Health Association
AWPCPL Allahabad Waste Processing Company Pvt. Ltd
BCM Billion Cubic Microns
BDU Below Detection Unit
BDU Best Designated Unit
BHDs Backhoe Dredgers
BHU Banaras Hindu University
BOD Biochemical Oxygen Demand
BOQ Bill of Quantity
BTKM Billion Tonne Kilometres
BUIDCO Bihar Urban infrastructure development Corporation Ltd.
BWE Ballast Water Exchange
BWMP Ballast Water Management Plan
BWP Ballast Water Performance
CBWTF Common Bio Medical Waste Treatment Facility
CEC Cation Exchange Capacity
CERs Critical Environmental Resources
CGWA Central Ground Water Authority
CGWB Central Ground Water Board
CIFRI Central Inland Fisheries Research Institute
CIWTC Central Inland Water Corporation Limited
cm centimetre
CNG Compressed Natural Gas
CO Carbon Monoxide
COD Chemical Oxygen Demand
CPCB Central Pollution Control Board
Cr Crore
CRZ Coastal Regulation Zone
CSD Cutter Section Dredgers
CTE Consent to Establish
CTO Consent to Operate
cum cubic metre
dBs Decibels
DEAC District Environmental Impact Assessment Committee
DEIAA District Environmental Impact Assessment Authority
Consolidated Environmental Impact Assessment Report of National Waterways-1: Volume-3A
8
DEM Digital Elevation Model
DFO District Forests Officer
DFR Detailed Feasibility Report
DG Diesel Generators
DGPS Differential Global Positioning System
DO Dissolved Oxygen
DWT Dry Weight Tonnage
DWT Dead Weight Tonnage
E East
EC Electrical Conductivity
EIA Environmental Impact Assessment
EMoP Environmental Monitoring Plan
EMP Environment Management Plan
EPC Engineering Procurement Contractor
ESAs Ecologically Sensitive Areas
ESC Environment and Social Cell
ESS Electrical Sub stations
FBP Farakka Barrage Project
GHG Green House Gases
GIS Geographical Information Systems
gm Gram
GoI Government of India
GPS Global Positioning System
GRB Ganga River Basin
GW Ground Water
ha Hectare
HAD Haldia Development Authority
HC Horizontal Clearance
HDC Haldia Dock Complex
HDPE High Density Poly Ethylene
HFL Highest Flood Level
hpa Hectopascal
HPC Name of a Consultant
hrs hours
HSD Hydraulic Surface Dredger
IARI Indian Agricultural Research Institute
IBA Important Bird Areas
IESWM Institute of Environmental Studies & Wetland Management
IITs Indian Institute of Technology
IMD India Meteorological Department
IMDG-code International Maritime Dangerous Goods Code
IMO International Maritime Organization
Consolidated Environmental Impact Assessment Report of National Waterways-1: Volume-3A
9
INTACH Indian National Trust for Art and Cultural Heritage
IRS Indian Remote Sensing Satellite
IS Indian Standards Published by Bureau of Indian Standards
ISRO Indian Space Research Organization
IUCN International Union for Conservation of Nature
IWAI Inland Waterways Authority of India
IWC International Whaling Commission
IWT Inland Waterway Transport
JNNURM Jawaharlal Nehru National Urban Renewal Mission
kgs Kilograms
KLD Kilolitre per Day
km kilometre
KMC Kolkata Municipal Corporation
kmph Kilometre per Hour
KoPT Kolkatta Port Trust
KoPT Kolkata Port Trust
KW Kilo watt
LAD Least Available Draft
LC Level Crossing
Leq Equivalent continuous sound pressure level in dB
LPG Liquid Petroleum Gas
m Metre
MARPOL International Convention for the Prevention of Pollution from Ships
meq Milli equivalent
mg/l Milligram per litre
mg/l Milligram per litre
3 Microgram per cubic metre
mL Millilitre
MLD Millions of Litres Per Day
mmhos/cm Mili mho/ centimetre
MoEF&CC Ministry of Environment & Forests & Climate Change
mpn/100 ml Most Probable Number/100 millilitre
MSIHC Manufacture Storage import of Hazardous Chemicals
MSW Municipal Solid Waste
MSW Municipal solid Waste
MT Metric Tonnes
MTPA Million Tonne Per Annum
N North
NAAQS National Ambient Air Quality Standards
NABL National Accreditation Board for Testing and Calibration Laboratories
NCAER National Council of Applied Economic Research
NGBRA National Ganga Basin River Authority
Consolidated Environmental Impact Assessment Report of National Waterways-1: Volume-3A
10
NGO Non-Government Organization
NH National Highway
NMCG National Mission for Clean Ganga
NOC No Objection Certificate
Nox Oxides of Nitrogen
NRCD National River Conservation Directorate
NTPC National Transport Policy Committee
NTU Nephelometric Turbidity Unit
NW National Waterways
NW North West
ºC Degree Celsius
PCC Portland Cement Concrete
PCCF Principle Chief Conservator of Forests
PIANC World Association for Waterborne Transport Infrastructure
PM Particulate Matter
PMC Patna Municipal Corporation
PMU Project Management Unit
ppb parts per billion
ppm parts per million
PPP Public Private Partnership
PWD Public Works Department
QA/QC Quality Assurance/Quality Check
RCC Reinforced Cement Concrete
RET Rare Endangered and Threatened Species
RIS River Information System
RITES Name of Govt. Consultancy Organisation
ROB Rail Over Bridge
RO-RO Roll on and Roll Over
RWH Rain Water Harvesting
S South
SAV Submerged Aquatic Vegetation
SC Schedule Caste
SE South East
SEAC State Expert Appraisal Committee
SEIAA State Environmental Impact Assessment Authority
SH State Highway
SO2 Sulphur Dioxide
SPCB State Pollution Control Board
Sq.km Square kilometre
ST Schedule Tribe
STP Sewage Treatment Plant
SW Surface Water
Consolidated Environmental Impact Assessment Report of National Waterways-1: Volume-3A
11
SWDS Solid Waste Disposal Site
TDS Total Dissolved Solids
TKM Tonne Kilometres
TPD Tonnes per Day
TPP Thermal Power Plant
TSDF Treatment Storage and Disposal Facilities
TSHDs Trailer Suction Hopper Dredger
UNDP United Nations Development Programme
UP Uttar Pradesh
USA United States of America
USDA United States Department of Agriculture
USEPA United State Environment Protection Authority
VBREC Vikramshila Biodiversity Research and Education Centre
VC Vertical Clearance
VMC Varanasi Municipal Corporation
W West
WB CZMA West Bengal Coastal Zone Management Authority
WDSC Whale and Dolphin Conservation Society
WHC Water Holding Capacity
WNW West North West
WWF World Wide Fund for NGO
Consolidated Environmental Impact Assessment Report of National Waterways-1: Volume-3A
12
CHAPTER 1. INTRODUCTION
1.1. Project Background
The cargo movement through waterway is considered one of the cheapest mode of
transportation internationally which is very low in India compared to the international
scenario. To augment the capacity of waterways transportation in India, Govt. of India
has constituted Inland Waterways Authority of India (IWAI) in 1985. IWAI has identified 5
river stretches as National priority and notified these stretches as National Waterways 1
to 5. Amongst the five notified waterways, the national waterways on Ganga (NW-1
between Haldia to Allahabad) is the longest waterways and is of prime importance
considering its locational advantages. IWAI since long has been maintaining the least
available depth (LAD) of 3m between Haldia and Farakka (560km), 2.5m in Farakka –
Barh (400km), 2m between Barh – Ghazipur (290km) and 1.2 to 1.5m in Ghazipur –
Allahabad (370km). Even currently this waterway (NW-1) is being used for various cargo
movements, as well as tourists. Already good amount of cargo movement is taking place
between Haldia and Farakka (e.g. 3 million metric tonne of imported coal from Haldia to
NTPC plant near Farakka is being transported since October 2013 through 20 barges of
2000 dwt capacity each). Considering such a large potential and demands, IWAI has
initiated the project of “Capacity Augmentation of National Waterway-1” between Haldia
and Allahabad named as “Jal Marg Vikas Project”. However, considering the available
LAD and cargo demand scenario, IWAI is focusing on the stretch between Haldia to
Varanasi at present.
The capacity augmentation of this magnitude under this project warrants additional
infrastructural components such as river terminals of appropriate cargo handling
capacity, provision of navigation aids; river information system; RO-RO jetties; bank
protection / slope protection works; river training works; inland vessels; survey vessels,
survey equipment and dredging facilities which are required to be developed in a phased
and programmatic manner. Certain facilities are already planned such as multi-mode
terminal at Ramnagar (Varanasi), Sahibganj and Haldia and new navigation lock at
Farakka. Other developments are under finalization stages. Environmental and Social
impact assessment studies have been carried out separately for each of already
identified above four facilities, maintenance dredging and barge operation activities. A
consolidated environmental impact assessment report is prepared for various above
components and likely other developments proposed under feasibility report of Jal Marg
Vikas Project being funded by World Bank.
1.2. Brief Project Description
Inland Waterway Transport (IWT) offers a comparatively low cost and environmentally
sound alternative to road and rail transportation especially for bulk and containerized
cargo. Infrastructure requirements of IWT in comparison to road and rail transport are
also relatively low, although some investments are essential such as in port/terminal
facilities, connecting road/rail infrastructure, navigation aid and dredging facilities etc.
Consolidated Environmental Impact Assessment Report of National Waterways-1: Volume-3A
13
Proposed Project-Jal Marg Vikas aims at improvement of navigation in entire stretch of
1620 km. of NW-1 (Haldia to Allahabad).NW-1 is the Ganga - Bhagirathi - Hooghly river
system. NW-1 is being fed by various tributaries at different locations. Major tributaries to
NW-1 between Haldia to Allahabad are Tons, Gomti, Ghagra, Son, Gandak, Punpun and
Kosi. The following interventions have been proposed and planned under the Jal Marg
Vikas Project.
Maintenance dredging to provide LAD in waterway/channel and the terminal facility
Improved Navigation Infrastructure & Navigation Aids
o Construction of 5 Ro-Ro crossings & ferry passenger jetties. Locations of these
jetties are yet to be identified.
o Construction of 6 terminals: Site identification and planning for 3 terminals sites
at Sahibganj, Varanasi and Haldia is completed. 2 more potential sites for
development of terminals are identified at Ghazipur and Kalughat. These two
sites are still under consideration for finalization and planning of design at initial
stage only. One more terminal site along NW-1 is being identified.
o Construction of one Navigation Lock at Farakka, West Bengal.
o Provision for tow barges, inland vessels, survey vessels including rescue boats
and survey equipment. Development of low draught vessels.
o Development of navigation aids along NW-1 for facilitation of day & night time
navigation.
Development of efficient River Information System with all hardware & software.
Provision for bank protection / slope protection and river training works for critical
locations.
The project also envisages the creation and improvement of integration opportunities
with other surface transport modes such as roads and railways, so as to improve the
overall efficiency of the logistics chain by linking the waterways through various well
equipped terminals and jetties.
Cargo being transported in NW-1 includes cement, fly ash, iron ore, iron ore fines, coal,
steel shed, tyres, iron fines, iron ingots, Galvanized steel plain sheets, stone chips,
furnace oil, high Speed diesel, lube oil, boulders, pulses, aluminium block, sand, chips,
ship block, food grains, Manganese ore, Petroleum, Coke, Cooking coal, Rock
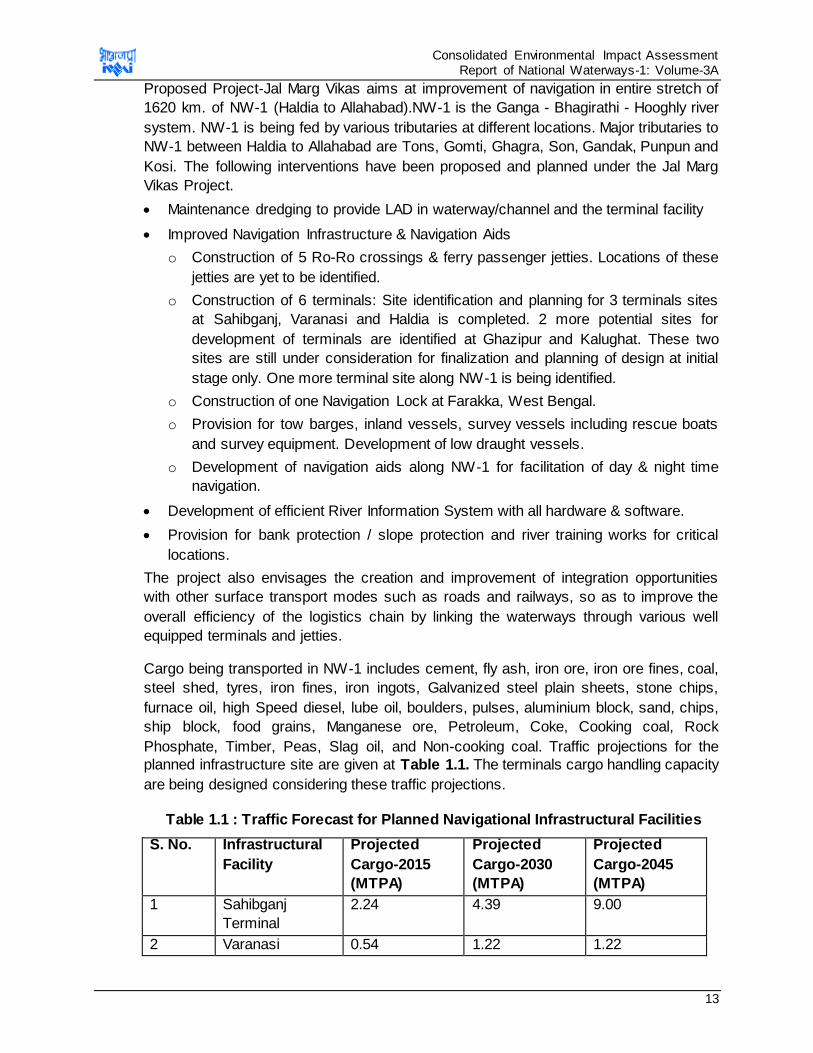
Phosphate, Timber, Peas, Slag oil, and Non-cooking coal. Traffic projections for the
planned infrastructure site are given at Table 1.1. The terminals cargo handling capacity
are being designed considering these traffic projections.
Table 1.1 : Traffic Forecast for Planned Navigational Infrastructural Facilities
S. No. Infrastructural
Facility
Projected
Cargo-2015
(MTPA)
Projected
Cargo-2030
(MTPA)
Projected
Cargo-2045
(MTPA)
1 Sahibganj
Terminal
2.24 4.39 9.00
2 Varanasi 0.54 1.22 1.22
Consolidated Environmental Impact Assessment Report of National Waterways-1: Volume-3A
14
Terminal (with
current land)
3 Haldia Terminal 3.18 MTPA
Source: HOWE Engineering Projects (India) Pvt. Ltd. (Design Consultant)
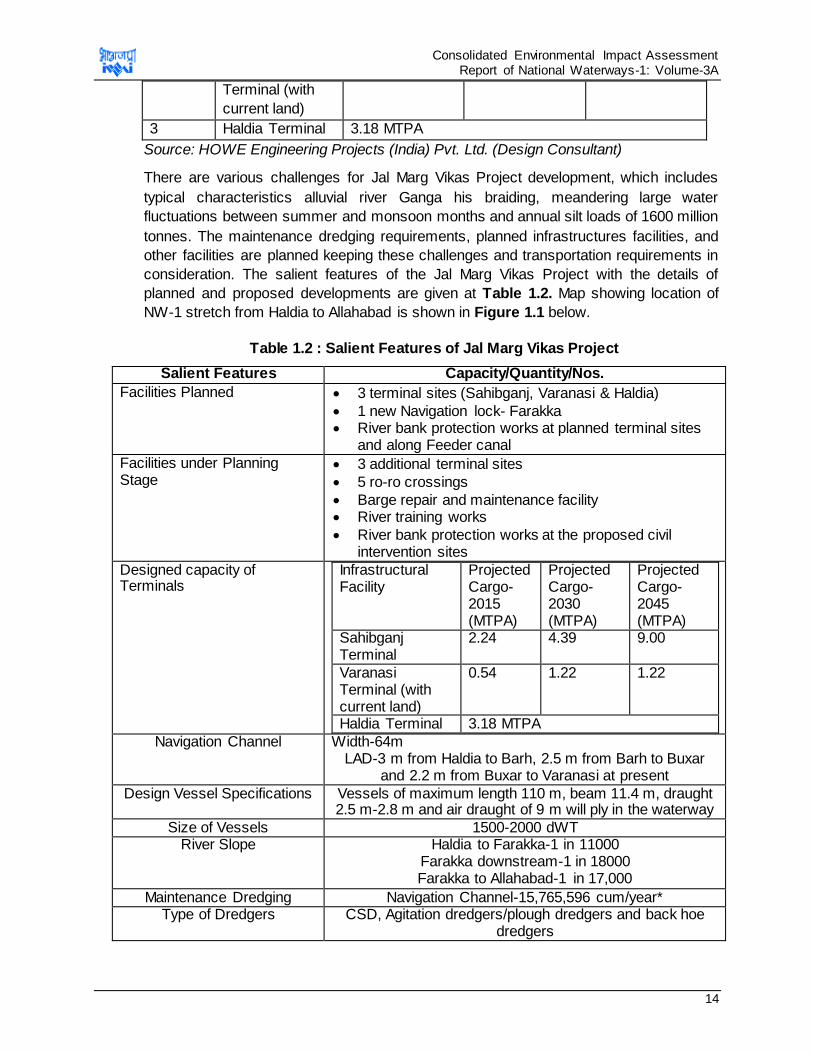
There are various challenges for Jal Marg Vikas Project development, which includes
typical characteristics alluvial river Ganga his braiding, meandering large water
fluctuations between summer and monsoon months and annual silt loads of 1600 million
tonnes. The maintenance dredging requirements, planned infrastructures facilities, and
other facilities are planned keeping these challenges and transportation requirements in
consideration. The salient features of the Jal Marg Vikas Project with the details of
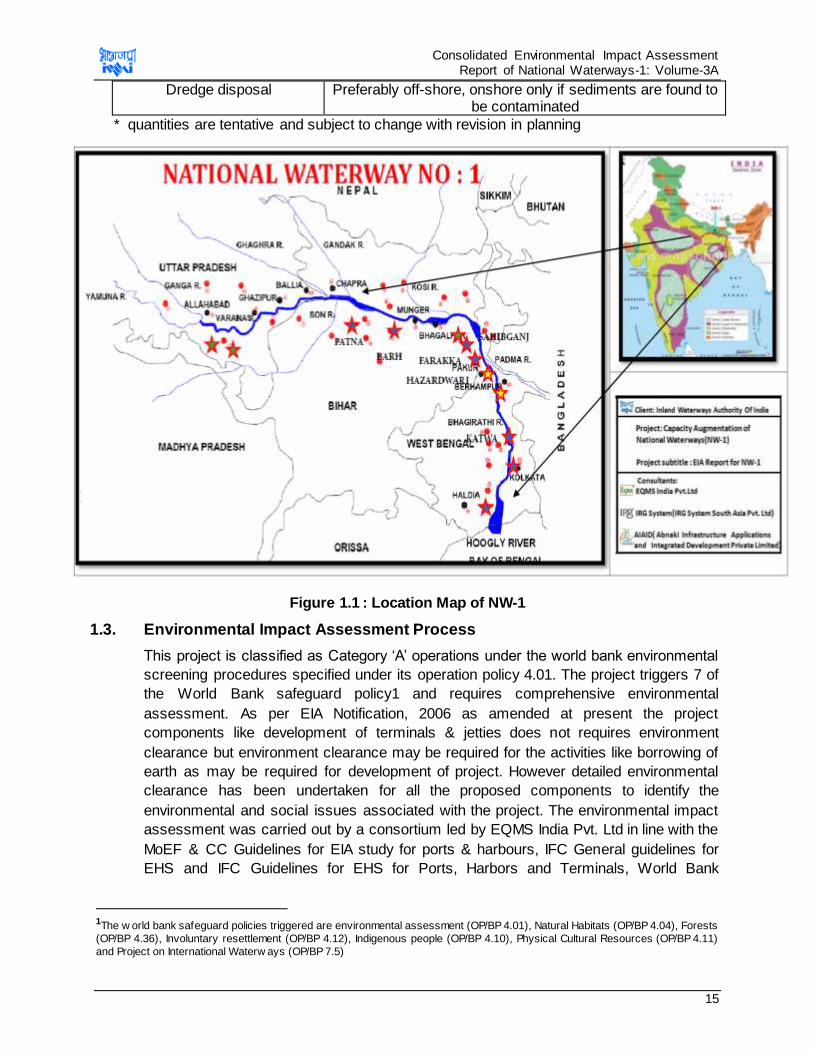
planned and proposed developments are given at Table 1.2. Map showing location of
NW-1 stretch from Haldia to Allahabad is shown in Figure 1.1 below.
Table 1.2 : Salient Features of Jal Marg Vikas Project
Salient Features Capacity/Quantity/Nos.
Facilities Planned 3 terminal sites (Sahibganj, Varanasi & Haldia)
1 new Navigation lock- Farakka River bank protection works at planned terminal sites
and along Feeder canal
Facilities under Planning Stage
3 additional terminal sites
5 ro-ro crossings
Barge repair and maintenance facility River training works
River bank protection works at the proposed civil intervention sites
Designed capacity of Terminals
Infrastructural Facility
Projected Cargo-2015 (MTPA)
Projected Cargo-2030 (MTPA)
Projected Cargo-2045 (MTPA)
Sahibganj Terminal
2.24 4.39 9.00
Varanasi Terminal (with current land)
0.54 1.22 1.22
Haldia Terminal 3.18 MTPA
Navigation Channel
Width-64m LAD-3 m from Haldia to Barh, 2.5 m from Barh to Buxar
and 2.2 m from Buxar to Varanasi at present
Design Vessel Specifications Vessels of maximum length 110 m, beam 11.4 m, draught 2.5 m-2.8 m and air draught of 9 m will ply in the waterway
Size of Vessels 1500-2000 dWT River Slope Haldia to Farakka-1 in 11000
Farakka downstream-1 in 18000 Farakka to Allahabad-1 in 17,000
Maintenance Dredging Navigation Channel-15,765,596 cum/year* Type of Dredgers CSD, Agitation dredgers/plough dredgers and back hoe
dredgers
Consolidated Environmental Impact Assessment Report of National Waterways-1: Volume-3A
15
Dredge disposal Preferably off-shore, onshore only if sediments are found to be contaminated
* quantities are tentative and subject to change with revision in planning
Figure 1.1 : Location Map of NW-1
1.3. Environmental Impact Assessment Process
This project is classified as Category ‘A’ operations under the world bank environmental
screening procedures specified under its operation policy 4.01. The project triggers 7 of
the World Bank safeguard policy1 and requires comprehensive environmental
assessment. As per EIA Notification, 2006 as amended at present the project
components like development of terminals & jetties does not requires environment
clearance but environment clearance may be required for the activities like borrowing of
earth as may be required for development of project. However detailed environmental
clearance has been undertaken for all the proposed components to identify the
environmental and social issues associated with the project. The environmental impact
assessment was carried out by a consortium led by EQMS India Pvt. Ltd in line with the
MoEF & CC Guidelines for EIA study for ports & harbours, IFC General guidelines for
EHS and IFC Guidelines for EHS for Ports, Harbors and Terminals, World Bank
1The w orld bank safeguard policies triggered are environmental assessment (OP/BP 4.01), Natural Habitats (OP/BP 4.04), Forests
(OP/BP 4.36), Involuntary resettlement (OP/BP 4.12), Indigenous people (OP/BP 4.10), Physical Cultural Resources (OP/BP 4.11)
and Project on International Waterw ays (OP/BP 7.5)
Consolidated Environmental Impact Assessment Report of National Waterways-1: Volume-3A
16
Operational Policies, Findings of CIA and Standalone EIA studies carried out for civil
interventions.
1.4. Anticipated Environmental Impacts and Mitigation Measures
Environmental impacts have been assessed considering present environmental setting
of the project area, nature, and extent of the proposed activities. Suitable qualitative and
quantitative approach was followed for identification of likely impact on each value
components of environment for design construction and operation stage. The impacts
were analysed under three broad categories namely (i) Impacts due to dredging
operations (ii) Impacts due to barge operations (iii) Impacts due to civil interventions.
Additionally, impact was analysed for climate change and riparian issues. Impacts due to
land acquisition are covered under separate Social impact assessment and
Rehabilitation Action Plan report and not included under this summary.
Maintenance dredging & dredge disposal will be carried out during the operational phase
of the project to maintain continued navigability throughout the year from Haldia to
Varanasi in NW-1. Dredging of 14.85 million cubic meter will be undertaken from Haldia
to Varanasi to maintain LAD of 3 m upto Barh, 2.5 m upto Ghazipur& 2.2 m upto
Varanasi. Impacts of the dredging are analysed for Physical Environment: on water
quality and land, Ecological Environment: on aquatic ecology and avi-fauna (6 Important
bird areas, VGDS, Kashi turtle sanctuary & Hilsa sanctuary), and Socio-Economic
Environment: cultural (Ghats at Patna & Varanasi), archaeological (9 nos.) and livelihood
of fishing community
IWT mode though is safest and most environmental friendly mode of transportation, may
have impact valued/critical environmental components. Barge movement may impact the
water quality, river bank & bank structures, air quality, noise level, aquatic ecology,
health & safety, livelihood of fishermen and socio-cultural aspects.
The civil interventions will have largely construction and operation related impacts.
Impacts are summarised based on the impact assessment carried out for Varanasi,
Sahibganj and Haldia terminals and Farakka navigational lock. The impacts identified for
these four sites are likely to be the similar for other interventions sites barring few site
specific issues related to tree cutting, land acquisition, muck disposal and construction
material sourcing.
The impacts are assessed both qualitatively and quantitatively and are given in detail in
the Volume 1.
1.5. Environment Management Plan
The Environmental Management Plan (EMP) is a plan of actions for avoidance,
mitigation and management of the negative impacts of the project and enhancement of
positive impacts. EMP includes the environment management plans for the various
activities, environmental monitoring plan (specifying the parameters, frequency and
responsibilities of monitoring), institutional framework, reporting requirements, auditing
requirements, training awareness and capacity building programme, grievance redress
mechanism and environmental budge. Detailed EMP is given in chapter 6 of the Volume
1.
Consolidated Environmental Impact Assessment Report of National Waterways-1: Volume-3A
17
However, the detailed intervention and activity specific plans for Maintenance dredging,
barge operations, civil interventions are presented in this report. Standalone EMPs are
prepared for each of the planned civil intervention, i.e. Sahibganj, Varanasi & Haldia
Terminals and Farakka Navigational lock and are presented in this report as well.
Environment Health & Safety (EHS) Policy and Management System: An effective
environmental health and safety policy is essentially to demonstrate top management
commitment for environmental protection and occupational health and safety. The policy
shall be communicated to all stakeholders including workers and shall be freely available
to them on demand.
For effective and systematic implementation of the project, it is desirable that IWAI (The
EA) develops its Environmental and Social management systems which is auditable and
effectively enforceable. Parallel can be drawn from the experience of National Highway
Authority of India or Delhi Metro Rail Corporation and adopt EHS system on the similar
lines. Each contractor should be contractually bound to follow such system and must
have EHS management system in line with EA’s management system. IWAI should also
develop its standard technical guidelines for Environmental Assessment, Management
and Reporting. Training and awareness will be an essential component of the EMP and
EHS management system. It shall include use of posters, bill boards/glow boards around
project site and barge NW-1 alignment in Hindi, English & Regional language so as the
workforce and community can understand it as well. Some of the important days
celebrations such as Environment Day (June 5), Red Cross Month (March), Emergency
Preparedness Week (May 1-7), National safety day (4th April), National Health Day (7th
April), Fire safety day (14th April), 20th April (Earth day) can be planned for spreading the
awareness for Environment Protection, Cleanliness and safety among work force and
community through campaigning.
Emergency Response and Preparedness Plan and Contingency Response Plan:
Risks and hazards are associated with every construction site as it involves usage of
heavy machinery and equipment. Similarly, risks are also associated with the operation
phase are listed below:
Vessel Accidents and spillage of commodities (especially oil)
Leakage or spillage of oil from ships and barges at terminal/jetty
Drowning in River during material handling and vessel movement
Hazard to Fishing vessels/gears
It is proposed that IWAI must equipped itself with guidelines and equipment for handling
the emergencies. PMU shall evolve its environmental, Occupational health and safety
guidelines and performance protocol. Budgetary provision has been made under
environmental budget. The same shall be developed with the help of reputed institutions
and organisation of repute. It should also follow the system of emergency response and
suggested emergency response and management plan is included in the report.
Responsible Carrier Programme of IWAI2: It is proposed that IWAI develops Indian
Waterways Operations Responsible Carrier Programme which should be developed as
2Reference is draw n to the successful similar programme of American Waterw ays Organization’s Responsible Carrier Programme.
http://w w w .americanw aterw ays.com/rcp-2016.
Consolidated Environmental Impact Assessment Report of National Waterways-1: Volume-3A
18
part of its EHS Management System and Emergency Response Plan and Protocols
Development. The programme shall have the following components as well:
Protocol for speed control, monitoring, and vessel tracking
Protocol of waste management for barge operations and terminals management.
(including zero discharges and waste disposal to river by barges and terminals.
This protocol shall also define about waste handling facilities at barges and
waste disposal facilities at terminals for maintain zero discharge concept.
Biodiversity protection including accident reporting with Aquatic mammals
(dolphin)
Oil spills reporting and control and remediation
Near-miss reporting/lessons learned and corrective actions program
Risk assessment procedures to assess and manage risks to personnel, vessels
and the environment
Identification of critical or essential equipment/systems
Authority of the master, crew and shoreside personnel
Addition of document control procedures
Tracking of number and volume of spills in performance measurement
requirements
Internal and external audit procedures and frequency
1.6. Institutional Framework of IWAI
IWAI has set up a project management unit which is staffed with Environmental and
Social specialists. These specialists would work as an environment and social cell (ESC)
within PMU. It is proposed that each field unit will have one designated officer
responsible for environment and social aspects who will also coordinate with ESC. The
responsibility of ESC will be (i) development of mechanism to ensure implementation of
suggestive management plans and to integrate this at policy level so as the measures
can be made mandate to be followed during respective project stage (ii) to review,
monitor and inspect implementation of the EMP during design, construction and
operation stages; (iv) implementation of the environmental capacity building and
awareness programme; (v) coordinating with field units(iv) Reviewing and ensuring
effective implementation of EMP and regulatory compliance by contractor, and IWAI and
(v) managing the environmental reporting, and audit process. Contractor will be
responsible for implementation of Environmental Management Plan and ensuring health
and safety of the construction workers at site during pre-construction & construction
phase of the project
Environment & Safety Compliance and Monitoring Responsibility-Project design
and implementation stage: The respective contractors shall be liable for
implementation of suggestive EMPs and IWAI will be responsible to monitor the
contractor’s performance and adequacy of implementation of EMPs directly or through
third party (PMC).
Consolidated Environmental Impact Assessment Report of National Waterways-1: Volume-3A
19
Environment & Safety Compliance and Monitoring Responsibility-Operation Phase
and Emergency Situations: IWAI shall be solely responsible for implementation of the
EMP and emergency response. IWAI shall be liable to ensure that suggestive mitigation
measures are taken up by the shippers, dredgers and other stakeholders in time and
adequately. IWAI shall develop the mechanism so as to ensure the adherence and
compliance of the EMP. It is proposed that IWAI will have dedicated department
adequately staffed and equippedwith speed monitoring, vessel positioning, and
emergency response equipemnts like oil spills control and remediation systems. IWAI
may also adopt mechanism of involving Barge operators on the line of Responsible
Carrier Programme of Americans Waterways Operators.
1.7. Reporting requirement
Contractor would be required to submit monthly and six monthly reports containing the
status of environment, health & safety at site to PMC (Project management consultant) &
PMU of IWAI. PMC will be responsible for construction supervision and ensuring
effective implementation of EMP by the contractor. PMC shall report to PMU monthly
about the performance and effectiveness of the EMP implemented by contractor on site
and coordinate with filed units and PMU for necessary corrective actions as may be
required. IWAI will also organise an independent Environment Audit which will be
submitted to Bank within 3 months of completion of the second and fourth year of
implementation period.
1.8. Training and Capacity Building Programme
IWAI has already taken actions to augment the capacity of project management unit
(PMU). A capacity building and training programme has been prepared which includes
training of staff of Environmental and Social cell of PMU, contractor’s staff (labours &
engineers), PMC staff and IWAI staff on environmental management, regulatory
compliance and safety aspects.
1.9. Conclusion
IWAI has already taken actions to augment the capacity of project management unit
(PMU). A capacity building and training programme has been prepared which includes
training
Consolidated Environmental Impact Assessment Report of National Waterways-1: Volume-3A
Chapter 2. DESCRIPTION OF THE ENVIRONMENT
2.1. General
NW-1 traverse through the state of West Bengal, Jharkhand, Bihar and Uttar Pradesh. The
terrain throughout the stretch of NW-1 is flat with primarily agriculture land use in the
surrounding area.
The natural environment comprises of physical (air, noise, water, topographical, geological,
land, soil and climate aspects), biological (terrestrial and aquatic floral and faunal aspects)
and socio-economic aspects. It is sensitive to any developmental activity, so adequate
preventive measures are taken and environmental conditions are maintained within defined
environmental parameters. Thus, it is imperative to study the existing environmental
condition not only to establish maintain the present physical, biological and socio-economic
conditions but also in order to predict future impacts owing to construction and operation of
the project. The baselineconditions have been studied based on secondary and primary
data collection and analysis.
2.2. Baseline Analysis, Study Area and Salient Environmental Features
2.2.1. Baseline Data Collection and Study Area
Analysis of environmental baseline of the project area is an important phase of
Environmental Impact Assessment process for understanding the prevailing environmental
conditions in and around project area/alignment. The environmental conditions of NW-1 and
its intervention areas were established through extensive literature search, field monitoring,
laboratory analysis, stakeholder consultation and data interpretation.
Secondary data from literature search were obtained from various Government and non-
government sources such as Meteorological Departments, CPCB publications, National
River Ganga Basin Authority, IIT consortium reports and other agencies.
The primary data generation was carried out from 15th September, 2015 to 28thFebruary,
2016 for different period and frequency at different locations covering the entire stretch of
NW-1, finalised intervention areas3, likely intervention areas, likely maintenance dredging
areas4, select existing RO-RO jetty locations, selected existing passenger ferry locations
and environmental sensitive areas. Being a linear project, the 500m radius5 on either side of
the bank is considered as core zone; 2 Km radius as immediate influence zone and 10 Km
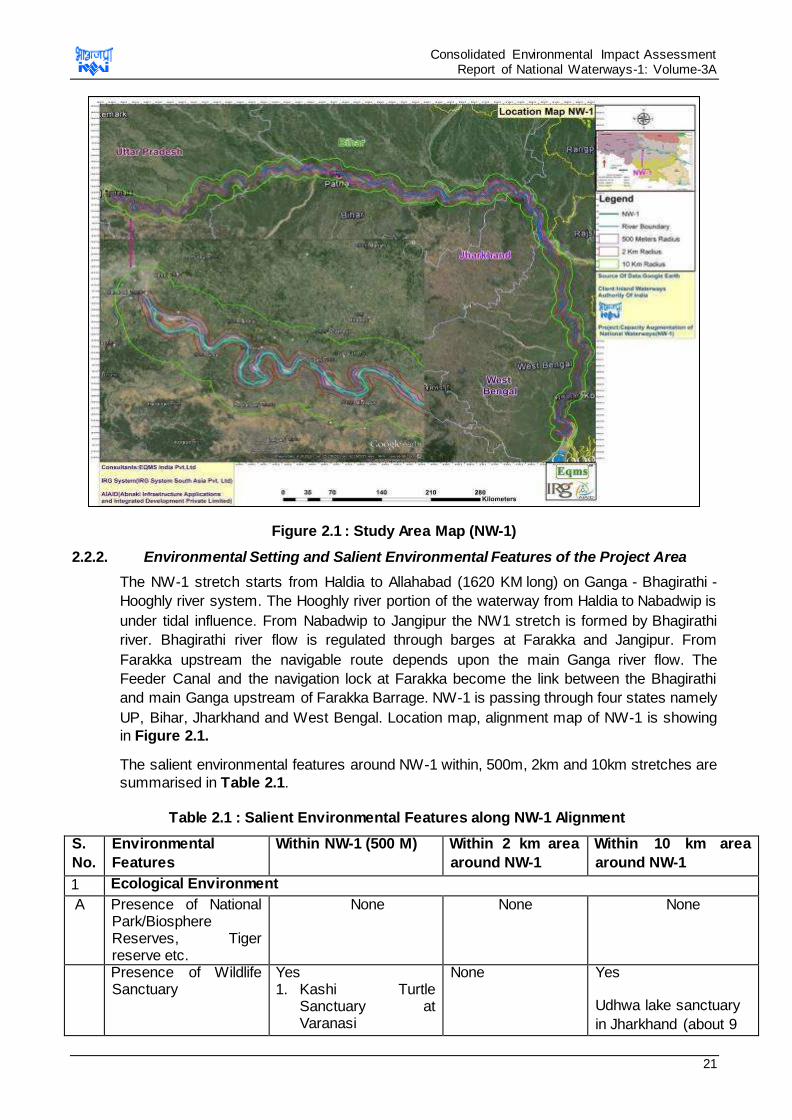
radius as extended buffer zone all along the NW-1 stretch and intervention areas. (refer
Figure 2.1 for study area map).
3The finalised intervention areas include terminals at Varanasi, Sahibganj and Haldia and navigation lock at Farakkha.
4River bed sampling (dredge sampling) has been carried out upto the depth of 3 m below river bed level at varying location depending on
the intensity of the dredging in a particular stretch for assessing contamination level if any in the dredge material 5Being a liner project impacts are likely to be confined to w ithin 100m but w e have considered 500m as core zone. Focus of primary data
collection has been more on this core zone and immediate buffer zone of 2Km.
Consolidated Environmental Impact Assessment Report of National Waterways-1: Volume-3A
21
Figure 2.1 : Study Area Map (NW-1)
2.2.2. Environmental Setting and Salient Environmental Features of the Project Area
The NW-1 stretch starts from Haldia to Allahabad (1620 KM long) on Ganga - Bhagirathi -
Hooghly river system. The Hooghly river portion of the waterway from Haldia to Nabadwip is
under tidal influence. From Nabadwip to Jangipur the NW1 stretch is formed by Bhagirathi
river. Bhagirathi river flow is regulated through barges at Farakka and Jangipur. From
Farakka upstream the navigable route depends upon the main Ganga river flow. The
Feeder Canal and the navigation lock at Farakka become the link between the Bhagirathi
and main Ganga upstream of Farakka Barrage. NW-1 is passing through four states namely
UP, Bihar, Jharkhand and West Bengal. Location map, alignment map of NW-1 is showing
in Figure 2.1.
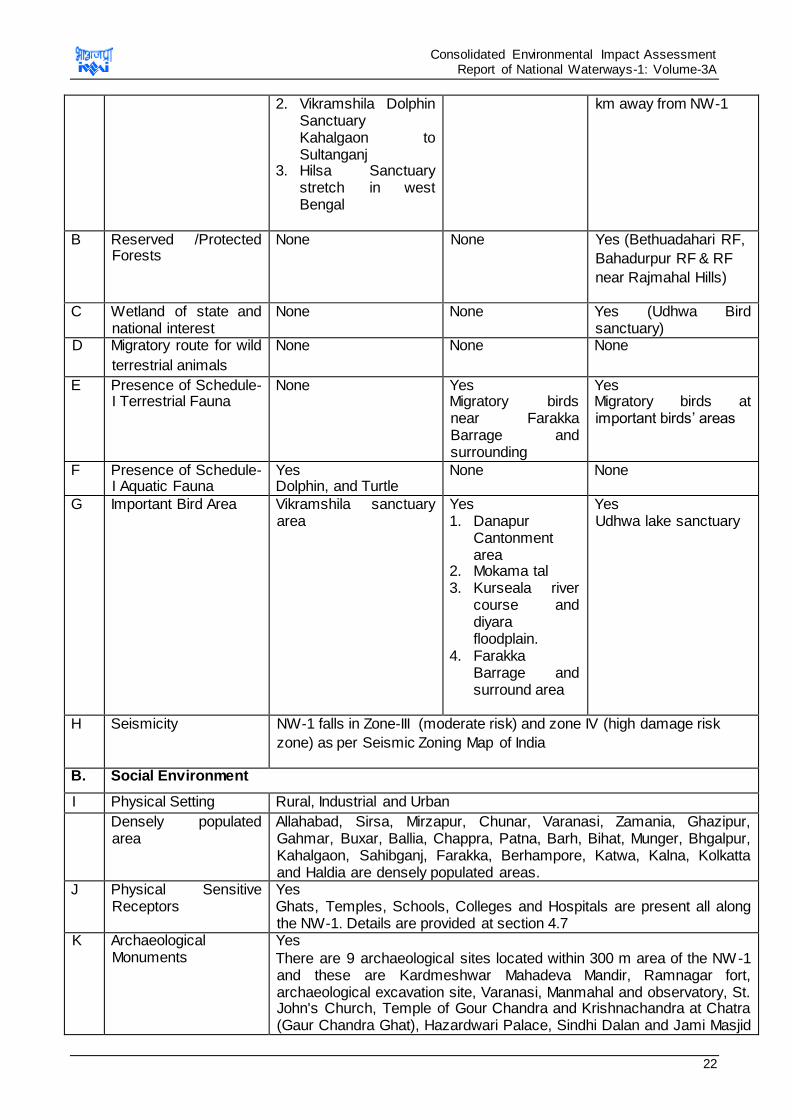
The salient environmental features around NW-1 within, 500m, 2km and 10km stretches are
summarised in Table 2.1.
Table 2.1 : Salient Environmental Features along NW-1 Alignment
S.
No.
Environmental
Features
Within NW-1 (500 M) Within 2 km area
around NW-1
Within 10 km area
around NW-1
1 Ecological Environment
A Presence of National Park/Biosphere Reserves, Tiger reserve etc.
None
None None
Presence of Wildlife Sanctuary
Yes 1. Kashi Turtle
Sanctuary at Varanasi
None Yes
Udhwa lake sanctuary
in Jharkhand (about 9
Consolidated Environmental Impact Assessment Report of National Waterways-1: Volume-3A
22
2. Vikramshila Dolphin Sanctuary Kahalgaon to Sultanganj
3. Hilsa Sanctuary stretch in west Bengal
km away from NW-1
B Reserved /Protected Forests
None None Yes (Bethuadahari RF,
Bahadurpur RF & RF
near Rajmahal Hills)
C Wetland of state and national interest
None None Yes (Udhwa Bird sanctuary)
D Migratory route for wild
terrestrial animals
None None None
E Presence of Schedule-I Terrestrial Fauna
None Yes Migratory birds near Farakka Barrage and surrounding
Yes Migratory birds at important birds’ areas
F
Presence of Schedule-I Aquatic Fauna
Yes Dolphin, and Turtle
None None
G Important Bird Area Vikramshila sanctuary area
Yes 1. Danapur
Cantonment area
2. Mokama tal 3. Kurseala river
course and diyara floodplain.
4. Farakka Barrage and surround area
Yes Udhwa lake sanctuary
H Seismicity NW-1 falls in Zone-III (moderate risk) and zone IV (high damage risk
zone) as per Seismic Zoning Map of India
B. Social Environment
I Physical Setting Rural, Industrial and Urban
Densely populated area
Allahabad, Sirsa, Mirzapur, Chunar, Varanasi, Zamania, Ghazipur, Gahmar, Buxar, Ballia, Chappra, Patna, Barh, Bihat, Munger, Bhgalpur, Kahalgaon, Sahibganj, Farakka, Berhampore, Katwa, Kalna, Kolkatta and Haldia are densely populated areas.
J Physical Sensitive Receptors
Yes Ghats, Temples, Schools, Colleges and Hospitals are present all along the NW-1. Details are provided at section 4.7
K Archaeological Monuments
Yes
There are 9 archaeological sites located within 300 m area of the NW-1 and these are Kardmeshwar Mahadeva Mandir, Ramnagar fort, archaeological excavation site, Varanasi, Manmahal and observatory, St. John's Church, Temple of Gour Chandra and Krishnachandra at Chatra (Gaur Chandra Ghat), Hazardwari Palace, Sindhi Dalan and Jami Masjid
Consolidated Environmental Impact Assessment Report of National Waterways-1: Volume-3A
23
Details provided in Section 4.7.
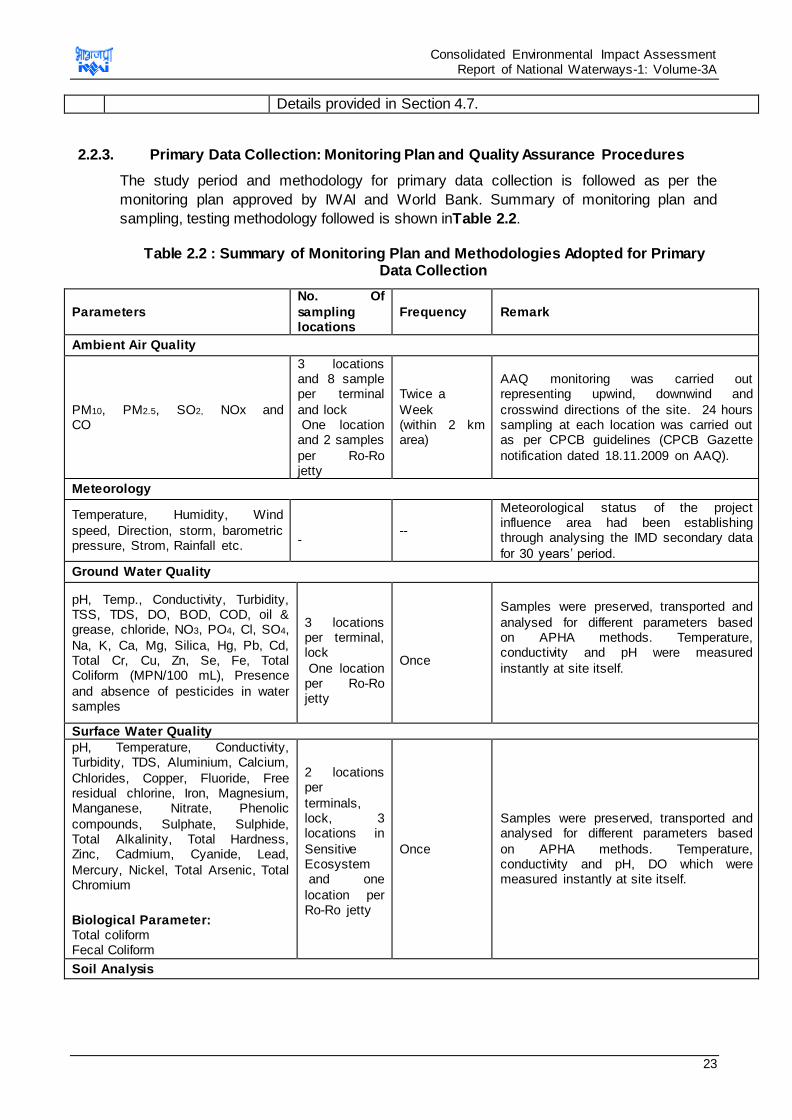
2.2.3. Primary Data Collection: Monitoring Plan and Quality Assurance Procedures
The study period and methodology for primary data collection is followed as per the
monitoring plan approved by IWAI and World Bank. Summary of monitoring plan and
sampling, testing methodology followed is shown inTable 2.2.
Table 2.2 : Summary of Monitoring Plan and Methodologies Adopted for Primary Data Collection
Parameters
No. Of
sampling locations
Frequency Remark
Ambient Air Quality
PM10, PM2.5, SO2, NOx and CO
3 locations and 8 sample per terminal
and lock One location and 2 samples
per Ro-Ro jetty
Twice a
Week (within 2 km area)
AAQ monitoring was carried out representing upwind, downwind and
crosswind directions of the site. 24 hours sampling at each location was carried out as per CPCB guidelines (CPCB Gazette
notification dated 18.11.2009 on AAQ).
Meteorology
Temperature, Humidity, Wind
speed, Direction, storm, barometric pressure, Strom, Rainfall etc.
-
--
Meteorological status of the project influence area had been establishing through analysing the IMD secondary data
for 30 years’ period.
Ground Water Quality
pH, Temp., Conductivity, Turbidity, TSS, TDS, DO, BOD, COD, oil & grease, chloride, NO3, PO4, Cl, SO4,
Na, K, Ca, Mg, Silica, Hg, Pb, Cd, Total Cr, Cu, Zn, Se, Fe, Total Coliform (MPN/100 mL), Presence
and absence of pesticides in water samples
3 locations per terminal, lock
One location per Ro-Ro jetty
Once
Samples were preserved, transported and
analysed for different parameters based on APHA methods. Temperature, conductivity and pH were measured
instantly at site itself.
Surface Water Quality
pH, Temperature, Conductivity, Turbidity, TDS, Aluminium, Calcium,
Chlorides, Copper, Fluoride, Free residual chlorine, Iron, Magnesium, Manganese, Nitrate, Phenolic
compounds, Sulphate, Sulphide, Total Alkalinity, Total Hardness, Zinc, Cadmium, Cyanide, Lead,
Mercury, Nickel, Total Arsenic, Total Chromium
Biological Parameter: Total coliform Fecal Coliform
2 locations per
terminals, lock, 3 locations in
Sensitive Ecosystem and one
location per Ro-Ro jetty
Once
Samples were preserved, transported and analysed for different parameters based
on APHA methods. Temperature, conductivity and pH, DO which were measured instantly at site itself.
Soil Analysis
Consolidated Environmental Impact Assessment Report of National Waterways-1: Volume-3A
24
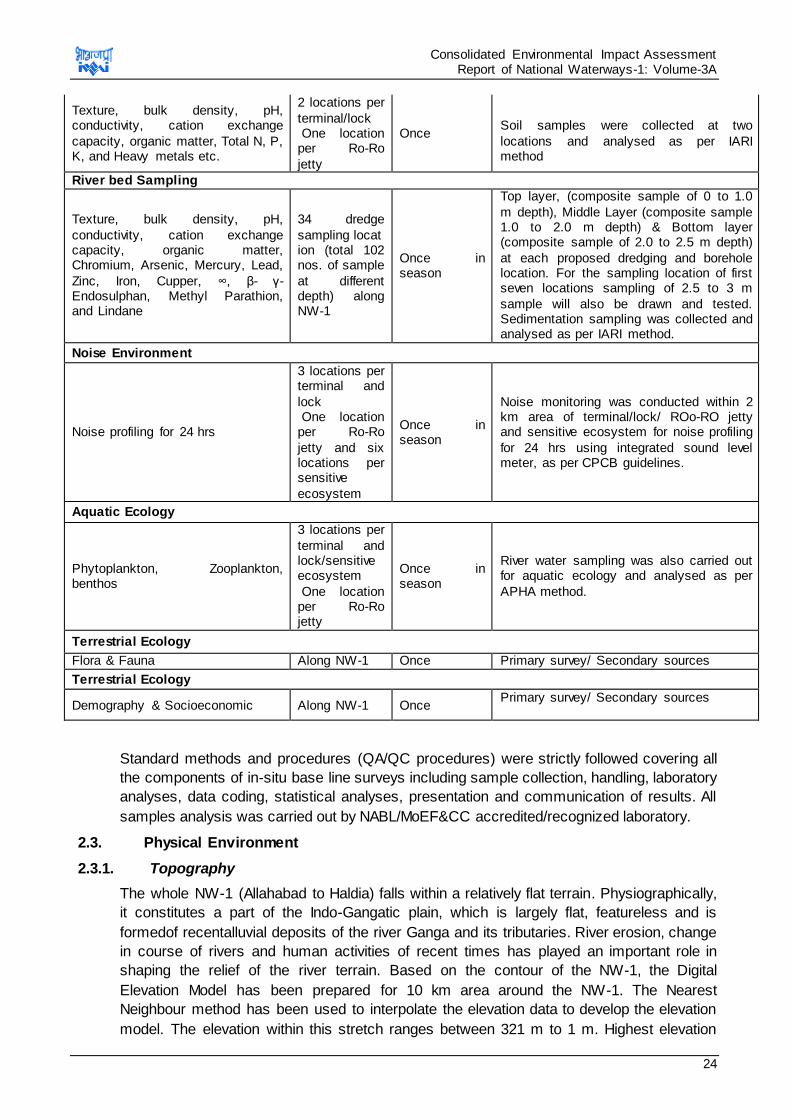
Texture, bulk density, pH, conductivity, cation exchange
capacity, organic matter, Total N, P, K, and Heavy metals etc.
2 locations per
terminal/lock One location per Ro-Ro
jetty
Once
Soil samples were collected at two
locations and analysed as per IARI method
River bed Sampling
Texture, bulk density, pH,
conductivity, cation exchange capacity, organic matter, Chromium, Arsenic, Mercury, Lead,
Zinc, Iron, Cupper, ∞, β- γ-Endosulphan, Methyl Parathion, and Lindane
34 dredge
sampling location (total 102 nos. of sample
at different depth) along NW-1
Once in season
Top layer, (composite sample of 0 to 1.0
m depth), Middle Layer (composite sample 1.0 to 2.0 m depth) & Bottom layer (composite sample of 2.0 to 2.5 m depth)
at each proposed dredging and borehole location. For the sampling location of first seven locations sampling of 2.5 to 3 m
sample will also be drawn and tested. Sedimentation sampling was collected and analysed as per IARI method.
Noise Environment
Noise profiling for 24 hrs
3 locations per terminal and
lock One location per Ro-Ro
jetty and six locations per sensitive
ecosystem
Once in season
Noise monitoring was conducted within 2 km area of terminal/lock/ ROo-RO jetty and sensitive ecosystem for noise profiling
for 24 hrs using integrated sound level meter, as per CPCB guidelines.
Aquatic Ecology
Phytoplankton, Zooplankton, benthos
3 locations per
terminal and lock/sensitive ecosystem
One location per Ro-Ro jetty
Once in season
River water sampling was also carried out for aquatic ecology and analysed as per
APHA method.
Terrestrial Ecology
Flora & Fauna Along NW-1 Once Primary survey/ Secondary sources
Terrestrial Ecology
Demography & Socioeconomic Along NW-1 Once Primary survey/ Secondary sources
Standard methods and procedures (QA/QC procedures) were strictly followed covering all
the components of in-situ base line surveys including sample collection, handling, laboratory
analyses, data coding, statistical analyses, presentation and communication of results. All
samples analysis was carried out by NABL/MoEF&CC accredited/recognized laboratory.
2.3. Physical Environment
2.3.1. Topography
The whole NW-1 (Allahabad to Haldia) falls within a relatively flat terrain. Physiographically,
it constitutes a part of the Indo-Gangatic plain, which is largely flat, featureless and is
formedof recentalluvial deposits of the river Ganga and its tributaries. River erosion, change
in course of rivers and human activities of recent times has played an important role in
shaping the relief of the river terrain. Based on the contour of the NW-1, the Digital
Elevation Model has been prepared for 10 km area around the NW-1. The Nearest
Neighbour method has been used to interpolate the elevation data to develop the elevation
model. The elevation within this stretch ranges between 321 m to 1 m. Highest elevation

Consolidated Environmental Impact Assessment Report of National Waterways-1: Volume-3A
25
was observed at Sahibganj area (Jharkhand), because of presence of hillocks in this area.
The map shown below depicts clearly that the elevation of waterways declines from western
to eastern part towards Haldia. Digital Elevation Model of study area is shown in Figure 2.2.
Figure 2.2 : DEM of NW-1
2.3.2. Drainage Pattern (Ganga River)
The Ganga River (about 2525 km long) is fed by runoff from a vast catchment area bounded
by the snow peaks of the Himalaya on one side in the north and the peninsular highlands
and the Vindhya Range on the other side in the south. The basin encompasses an area of
more than a million square kilometres (1,186,000 Sq. km) spread over four countries: India,
Nepal, Bangladesh and China. With 861,404 Sq.km within India itself, the Ganga basin is
the largest river basin in India and covers approximately 25 percent of India‘s total
geographical area. The catchment area, length, total utilizable water of Ganga river basins
within India and the states that they cover is shown in Table 2.3. State wise distribution of
drainage area of Ganga river is mentioned in Table 2.4.
Table 2.3 : Ganga river Basin Catchment Area
S. No. Length (km.) Catchment Area (Sq. km.) Total utilizable water
1 2525 861404 (1186000) 420.99
Source: Status paper on river Ganga, NERD, MoEF, 2009
Consolidated Environmental Impact Assessment Report of National Waterways-1: Volume-3A
26
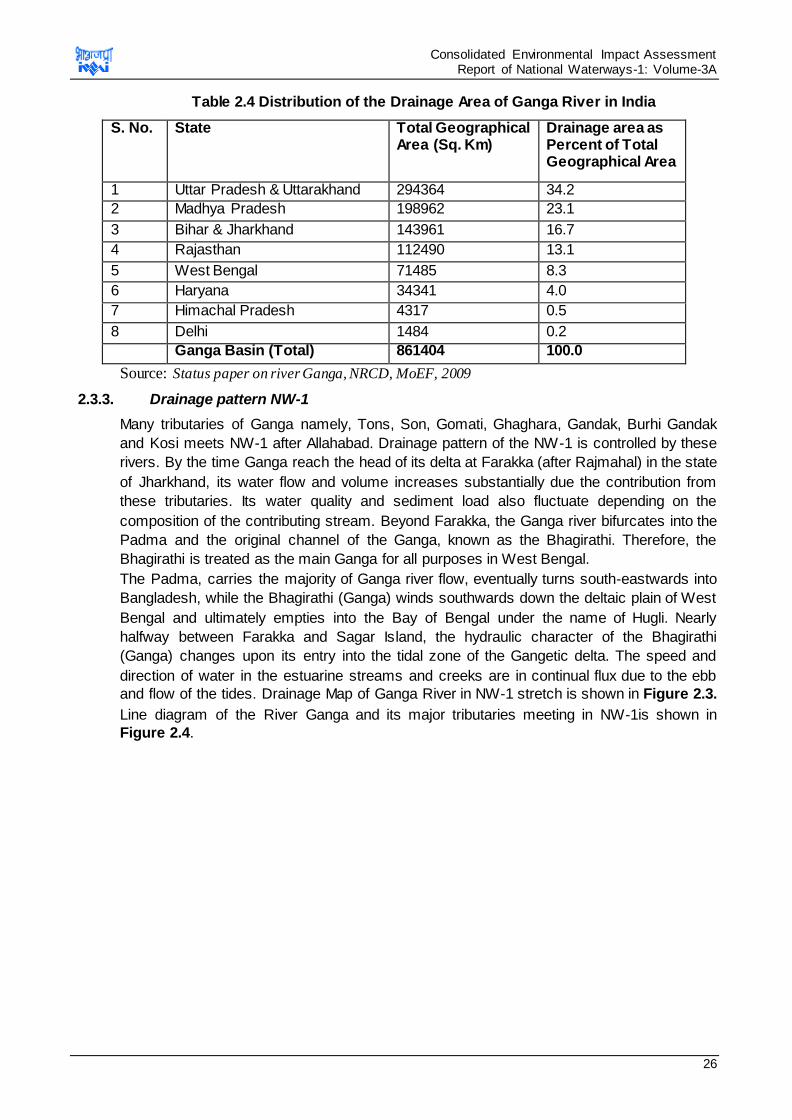
Table 2.4 Distribution of the Drainage Area of Ganga River in India
S. No. State Total Geographical Area (Sq. Km)
Drainage area as Percent of Total Geographical Area
1 Uttar Pradesh & Uttarakhand 294364 34.2
2 Madhya Pradesh 198962 23.1
3 Bihar & Jharkhand 143961 16.7
4 Rajasthan 112490 13.1
5 West Bengal 71485 8.3
6 Haryana 34341 4.0
7 Himachal Pradesh 4317 0.5
8 Delhi 1484 0.2
Ganga Basin (Total) 861404 100.0
Source: Status paper on river Ganga, NRCD, MoEF, 2009
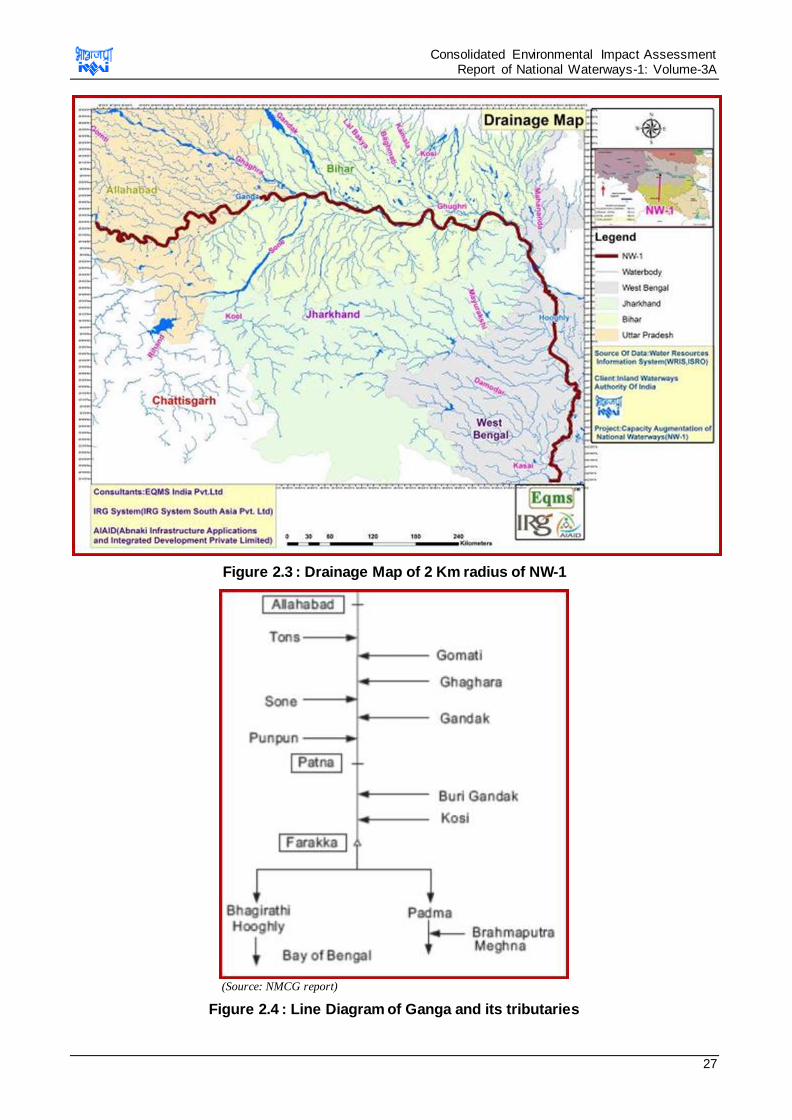
2.3.3. Drainage pattern NW-1
Many tributaries of Ganga namely, Tons, Son, Gomati, Ghaghara, Gandak, Burhi Gandak
and Kosi meets NW-1 after Allahabad. Drainage pattern of the NW-1 is controlled by these
rivers. By the time Ganga reach the head of its delta at Farakka (after Rajmahal) in the state
of Jharkhand, its water flow and volume increases substantially due the contribution from
these tributaries. Its water quality and sediment load also fluctuate depending on the
composition of the contributing stream. Beyond Farakka, the Ganga river bifurcates into the
Padma and the original channel of the Ganga, known as the Bhagirathi. Therefore, the
Bhagirathi is treated as the main Ganga for all purposes in West Bengal.
The Padma, carries the majority of Ganga river flow, eventually turns south-eastwards into
Bangladesh, while the Bhagirathi (Ganga) winds southwards down the deltaic plain of West
Bengal and ultimately empties into the Bay of Bengal under the name of Hugli. Nearly
halfway between Farakka and Sagar Island, the hydraulic character of the Bhagirathi
(Ganga) changes upon its entry into the tidal zone of the Gangetic delta. The speed and
direction of water in the estuarine streams and creeks are in continual flux due to the ebb
and flow of the tides. Drainage Map of Ganga River in NW-1 stretch is shown in Figure 2.3.
Line diagram of the River Ganga and its major tributaries meeting in NW-1is shown in
Figure 2.4.
Consolidated Environmental Impact Assessment Report of National Waterways-1: Volume-3A
27
Figure 2.3 : Drainage Map of 2 Km radius of NW-1
(Source: NMCG report)
Figure 2.4 : Line Diagram of Ganga and its tributaries
Consolidated Environmental Impact Assessment Report of National Waterways-1: Volume-3A
28
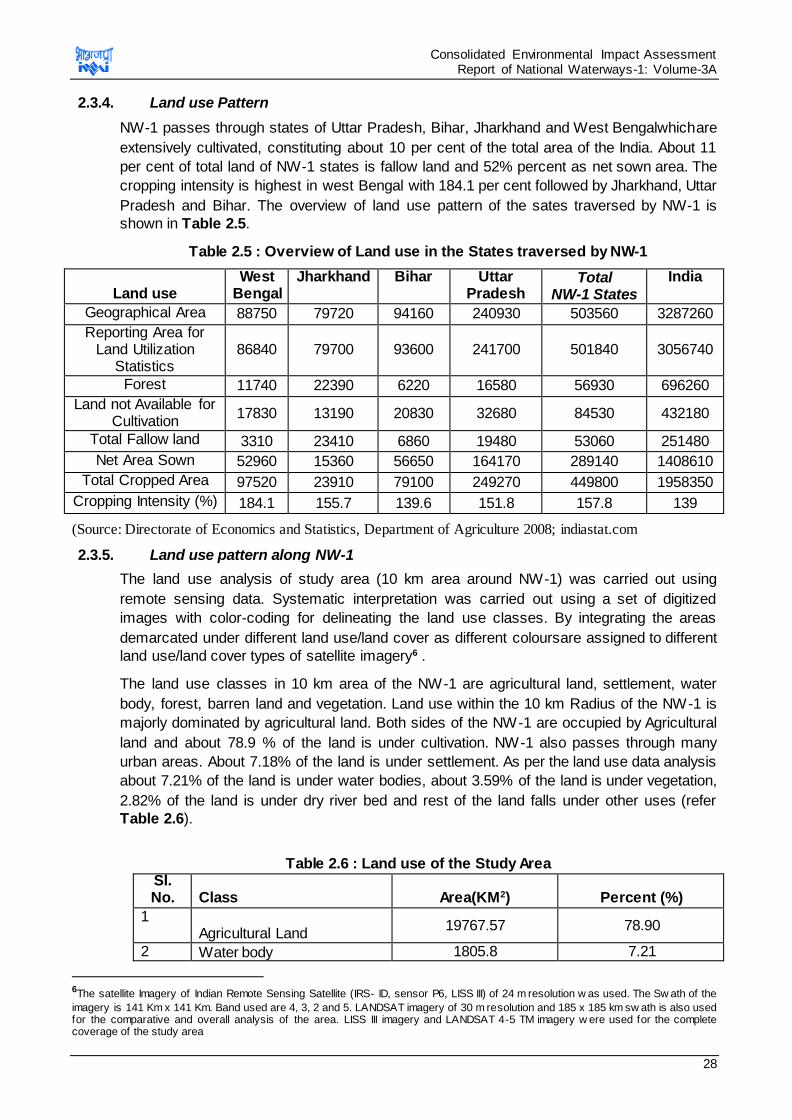
2.3.4. Land use Pattern
NW-1 passes through states of Uttar Pradesh, Bihar, Jharkhand and West Bengalwhichare
extensively cultivated, constituting about 10 per cent of the total area of the India. About 11
per cent of total land of NW-1 states is fallow land and 52% percent as net sown area. The
cropping intensity is highest in west Bengal with 184.1 per cent followed by Jharkhand, Uttar
Pradesh and Bihar. The overview of land use pattern of the sates traversed by NW-1 is
shown in Table 2.5.
Table 2.5 : Overview of Land use in the States traversed by NW-1
Land use West
Bengal Jharkhand Bihar Uttar
Pradesh Total
NW-1 States
India
Geographical Area 88750 79720 94160 240930 503560 3287260
Reporting Area for Land Utilization
Statistics 86840 79700 93600 241700 501840 3056740
Forest 11740 22390 6220 16580 56930 696260
Land not Available for Cultivation
17830 13190 20830 32680 84530 432180
Total Fallow land 3310 23410 6860 19480 53060 251480
Net Area Sown 52960 15360 56650 164170 289140 1408610
Total Cropped Area 97520 23910 79100 249270 449800 1958350
Cropping Intensity (%) 184.1 155.7 139.6 151.8 157.8 139
(Source: Directorate of Economics and Statistics, Department of Agriculture 2008; indiastat.com
2.3.5. Land use pattern along NW-1
The land use analysis of study area (10 km area around NW-1) was carried out using
remote sensing data. Systematic interpretation was carried out using a set of digitized
images with color-coding for delineating the land use classes. By integrating the areas
demarcated under different land use/land cover as different coloursare assigned to different
land use/land cover types of satellite imagery6 .
The land use classes in 10 km area of the NW-1 are agricultural land, settlement, water
body, forest, barren land and vegetation. Land use within the 10 km Radius of the NW-1 is
majorly dominated by agricultural land. Both sides of the NW-1 are occupied by Agricultural
land and about 78.9 % of the land is under cultivation. NW-1 also passes through many
urban areas. About 7.18% of the land is under settlement. As per the land use data analysis
about 7.21% of the land is under water bodies, about 3.59% of the land is under vegetation,
2.82% of the land is under dry river bed and rest of the land falls under other uses (refer
Table 2.6).
Table 2.6 : Land use of the Study Area Sl. No. Class Area(KM2) Percent (%)
1 Agricultural Land
19767.57 78.90
2 Water body 1805.8 7.21
6The satellite Imagery of Indian Remote Sensing Satellite (IRS- ID, sensor P6, LISS III) of 24 m resolution w as used. The Sw ath of the
imagery is 141 Km x 141 Km. Band used are 4, 3, 2 and 5. LANDSAT imagery of 30 m resolution and 185 x 185 km sw ath is also used for the comparative and overall analysis of the area. LISS III imagery and LANDSAT 4-5 TM imagery w ere used for the complete coverage of the study area
Consolidated Environmental Impact Assessment Report of National Waterways-1: Volume-3A
29
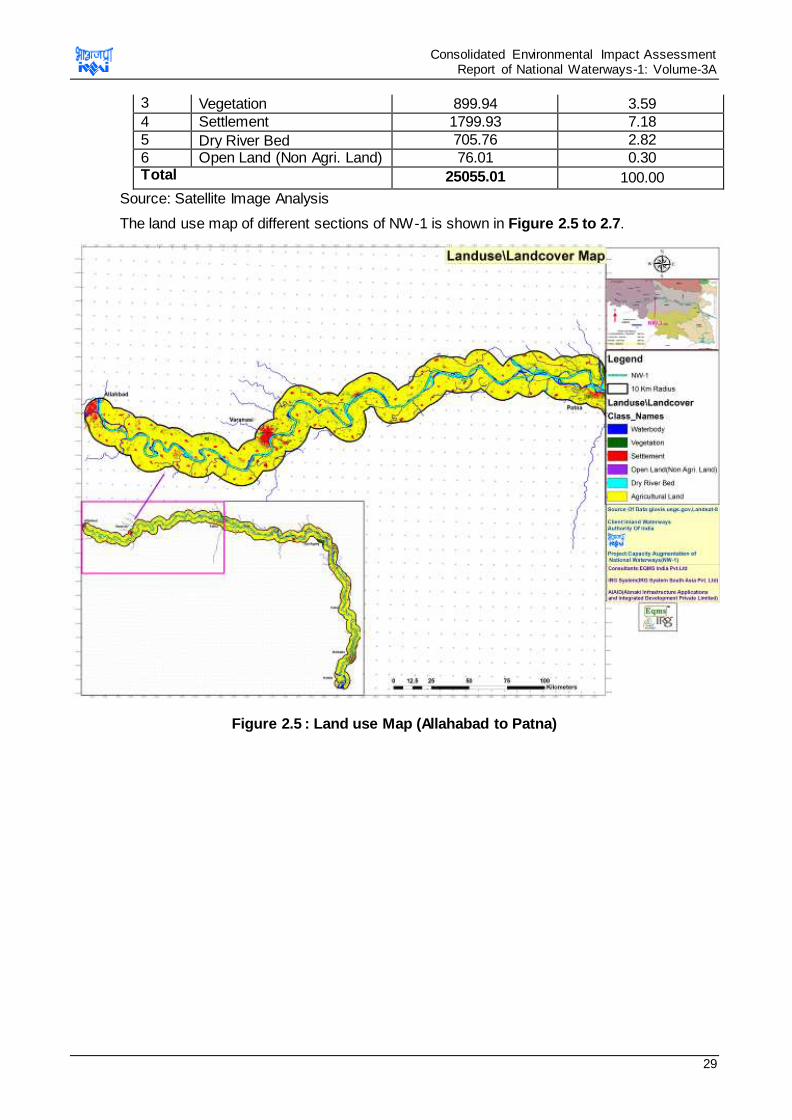
3 Vegetation 899.94 3.59
4 Settlement 1799.93 7.18
5 Dry River Bed 705.76 2.82
6 Open Land (Non Agri. Land) 76.01 0.30 Total 25055.01 100.00
Source: Satellite Image Analysis
The land use map of different sections of NW-1 is shown in Figure 2.5 to 2.7.
Figure 2.5 : Land use Map (Allahabad to Patna)
Consolidated Environmental Impact Assessment Report of National Waterways-1: Volume-3A
30
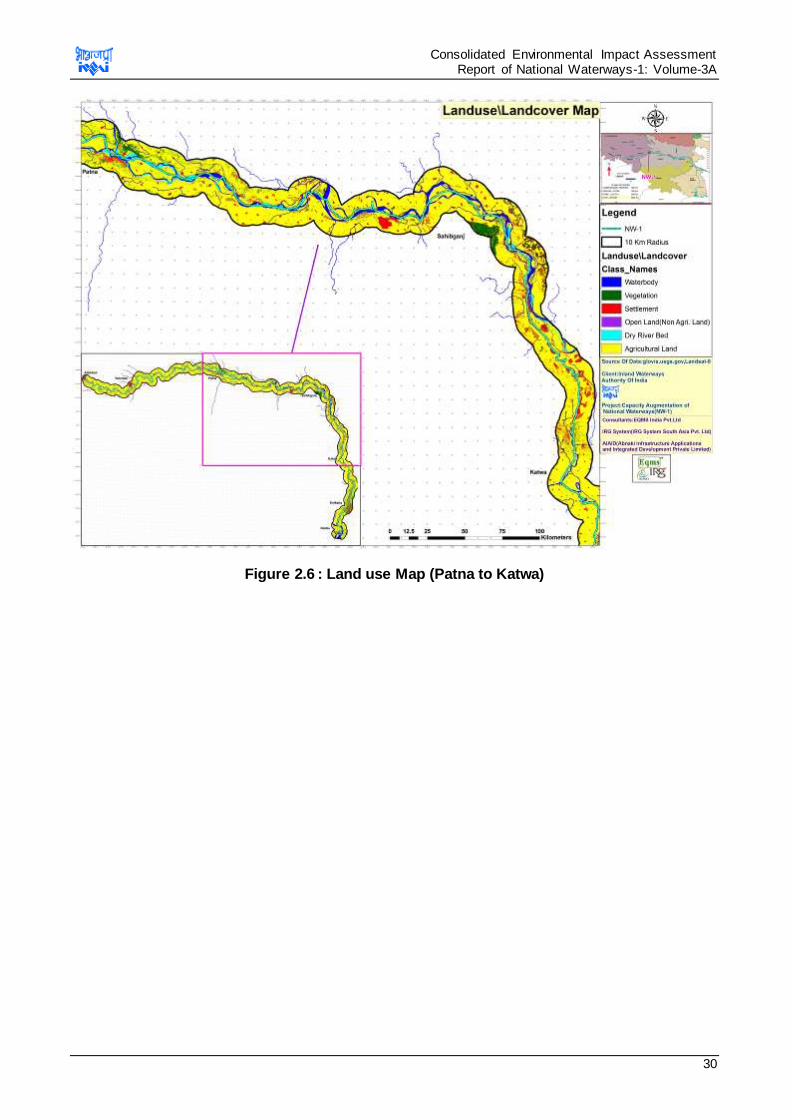
Figure 2.6 : Land use Map (Patna to Katwa)
Consolidated Environmental Impact Assessment Report of National Waterways-1: Volume-3A
31
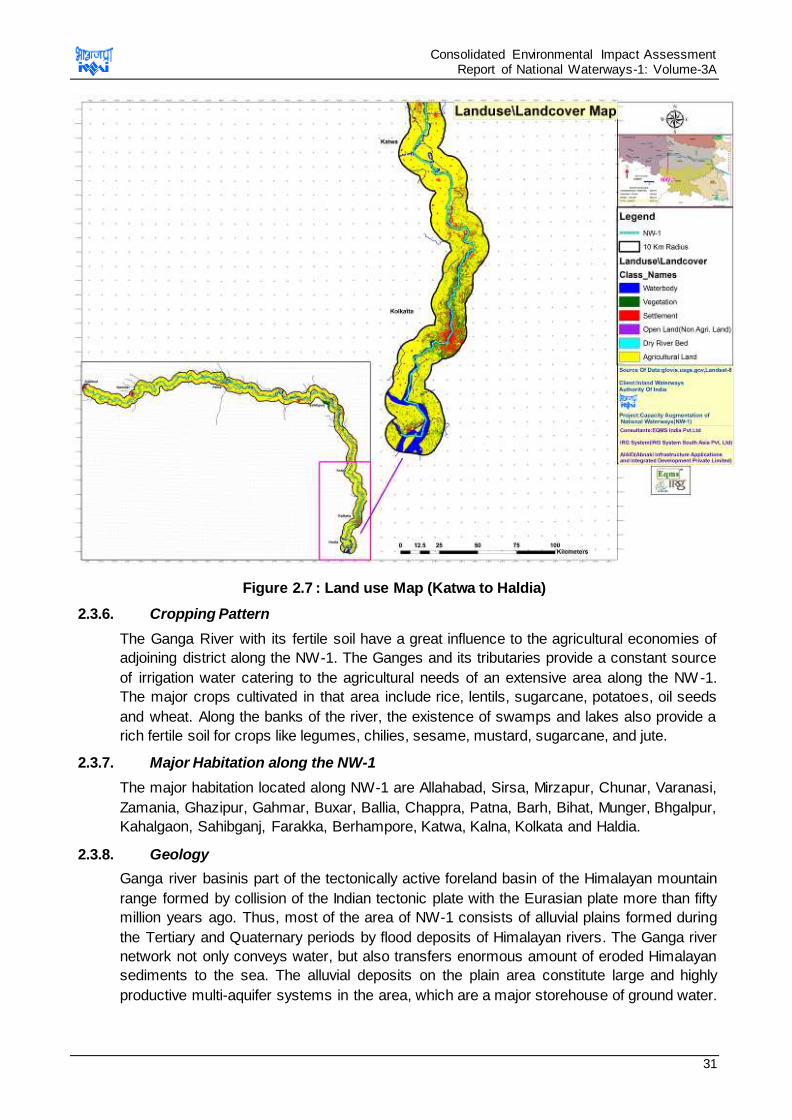
Figure 2.7 : Land use Map (Katwa to Haldia)
2.3.6. Cropping Pattern
The Ganga River with its fertile soil have a great influence to the agricultural economies of
adjoining district along the NW-1. The Ganges and its tributaries provide a constant source
of irrigation water catering to the agricultural needs of an extensive area along the NW-1.
The major crops cultivated in that area include rice, lentils, sugarcane, potatoes, oil seeds
and wheat. Along the banks of the river, the existence of swamps and lakes also provide a
rich fertile soil for crops like legumes, chilies, sesame, mustard, sugarcane, and jute.
2.3.7. Major Habitation along the NW-1
The major habitation located along NW-1 are Allahabad, Sirsa, Mirzapur, Chunar, Varanasi,
Zamania, Ghazipur, Gahmar, Buxar, Ballia, Chappra, Patna, Barh, Bihat, Munger, Bhgalpur,
Kahalgaon, Sahibganj, Farakka, Berhampore, Katwa, Kalna, Kolkata and Haldia.
2.3.8. Geology
Ganga river basinis part of the tectonically active foreland basin of the Himalayan mountain
range formed by collision of the Indian tectonic plate with the Eurasian plate more than fifty
million years ago. Thus, most of the area of NW-1 consists of alluvial plains formed during
the Tertiary and Quaternary periods by flood deposits of Himalayan rivers. The Ganga river
network not only conveys water, but also transfers enormous amount of eroded Himalayan
sediments to the sea. The alluvial deposits on the plain area constitute large and highly
productive multi-aquifer systems in the area, which are a major storehouse of ground water.
Consolidated Environmental Impact Assessment Report of National Waterways-1: Volume-3A
32
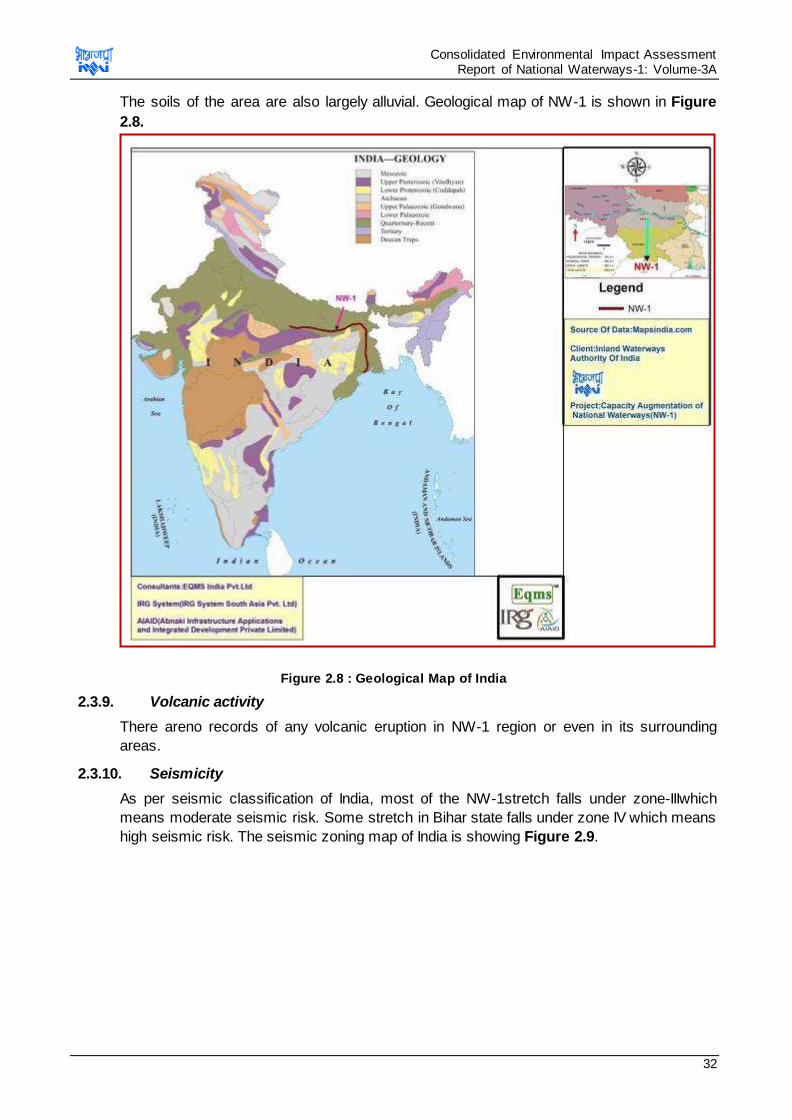
The soils of the area are also largely alluvial. Geological map of NW-1 is shown in Figure
2.8.
Figure 2.8 : Geological Map of India
2.3.9. Volcanic activity
There areno records of any volcanic eruption in NW-1 region or even in its surrounding
areas.
2.3.10. Seismicity
As per seismic classification of India, most of the NW-1stretch falls under zone-IIIwhich
means moderate seismic risk. Some stretch in Bihar state falls under zone IV which means
high seismic risk. The seismic zoning map of India is showing Figure 2.9.
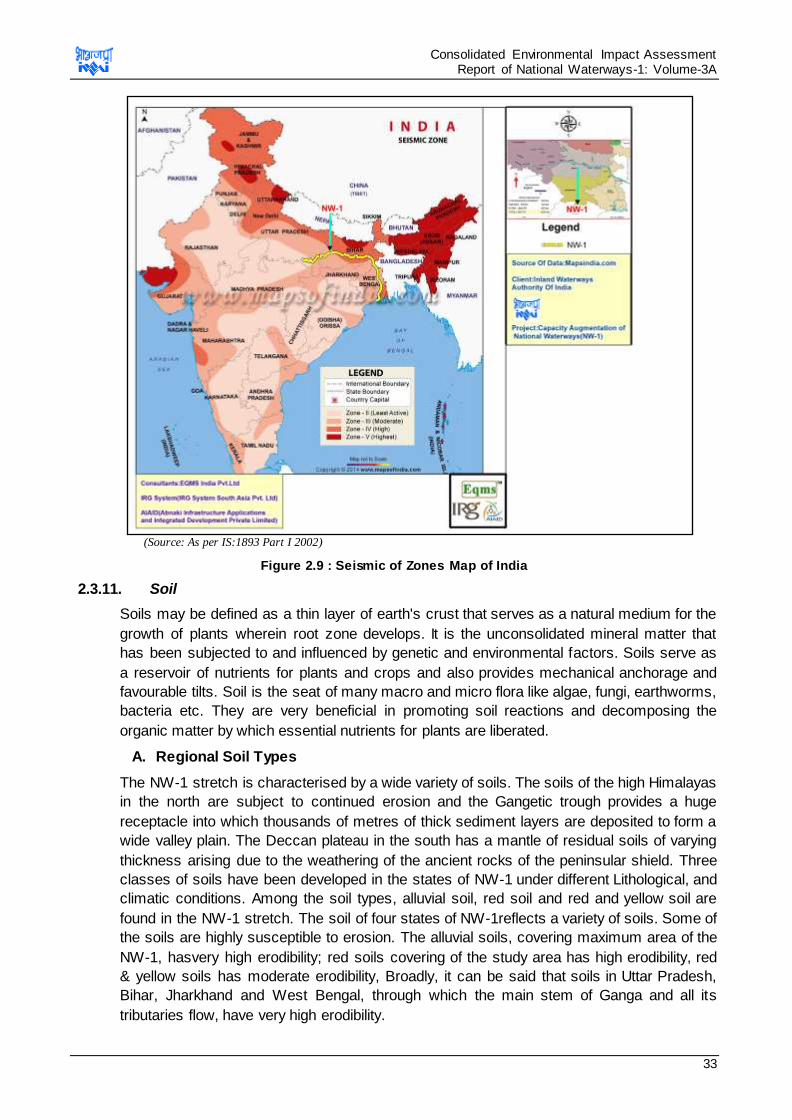
Consolidated Environmental Impact Assessment Report of National Waterways-1: Volume-3A
33
(Source: As per IS:1893 Part I 2002)
Figure 2.9 : Seismic of Zones Map of India
2.3.11. Soil
Soils may be defined as a thin layer of earth's crust that serves as a natural medium for the
growth of plants wherein root zone develops. It is the unconsolidated mineral matter that
has been subjected to and influenced by genetic and environmental factors. Soils serve as
a reservoir of nutrients for plants and crops and also provides mechanical anchorage and
favourable tilts. Soil is the seat of many macro and micro flora like algae, fungi, earthworms,
bacteria etc. They are very beneficial in promoting soil reactions and decomposing the
organic matter by which essential nutrients for plants are liberated.
A. Regional Soil Types
The NW-1 stretch is characterised by a wide variety of soils. The soils of the high Himalayas
in the north are subject to continued erosion and the Gangetic trough provides a huge
receptacle into which thousands of metres of thick sediment layers are deposited to form a
wide valley plain. The Deccan plateau in the south has a mantle of residual soils of varying
thickness arising due to the weathering of the ancient rocks of the peninsular shield. Three
classes of soils have been developed in the states of NW-1 under different Lithological, and
climatic conditions. Among the soil types, alluvial soil, red soil and red and yellow soil are
found in the NW-1 stretch. The soil of four states of NW-1reflects a variety of soils. Some of
the soils are highly susceptible to erosion. The alluvial soils, covering maximum area of the
NW-1, hasvery high erodibility; red soils covering of the study area has high erodibility, red
& yellow soils has moderate erodibility, Broadly, it can be said that soils in Uttar Pradesh,
Bihar, Jharkhand and West Bengal, through which the main stem of Ganga and all its
tributaries flow, have very high erodibility.
Consolidated Environmental Impact Assessment Report of National Waterways-1: Volume-3A
34
Most of the NW-1 stretch is dominated by alluvial soil type. The entire alluvial formation is
endowed with rich soil nutrients. The alluvial deposits of the Ganga and its tributaries,
coming down the Himalaya and the peninsular foreland, have yielded annual harvests of
crops for the past thousands of years with little significant deterioration. Besides paddy, this
tract produces a wide variety of crops including wheat, jowar, bajra, small millets, pulses of
different kinds, maize, cotton, jute and many other food and commercial crops.
B. Study, Sampling and Analysis
The physicochemical characteristics of soils within the study area, soil sample were also
collected from proposed interventions along the NW-1. The physicochemical characteristics
of the soils in the study area, as established from the analysis of the soil samples are
presented in Table 2.7 and 2.8.
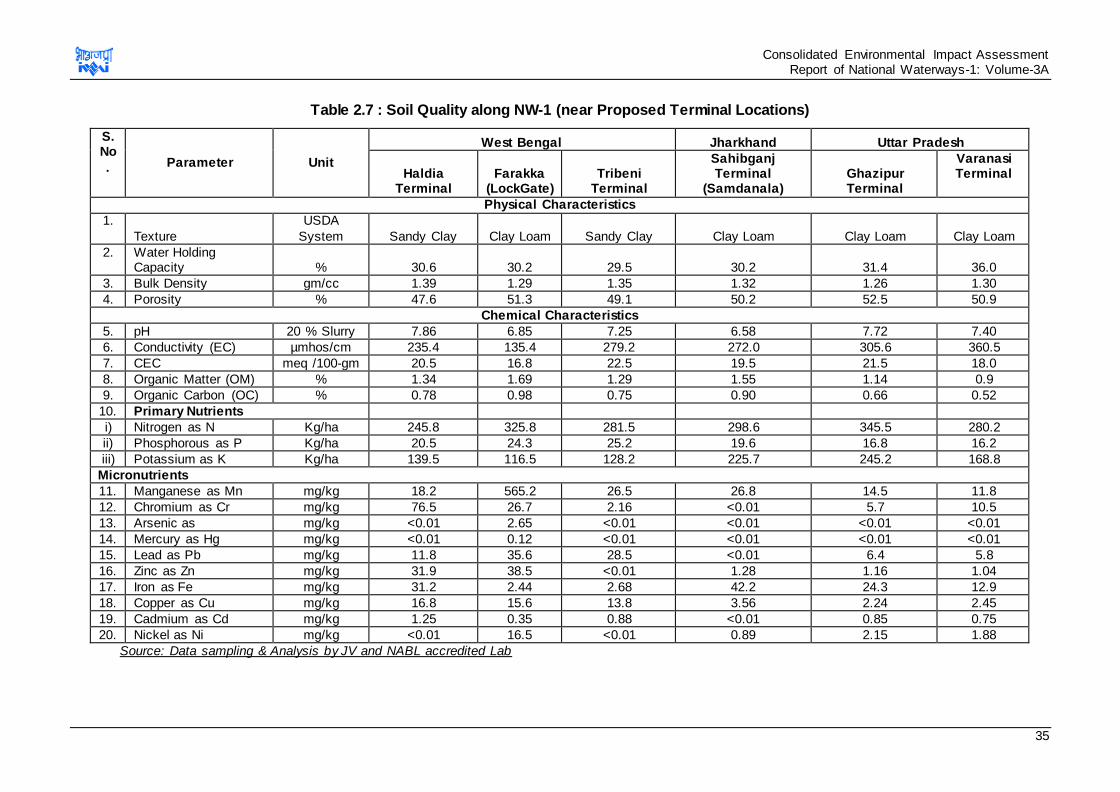
Consolidated Environmental Impact Assessment Report of National Waterways-1: Volume-3A
35
Table 2.7 : Soil Quality along NW-1 (near Proposed Terminal Locations)
S. No
. Parameter Unit
West Bengal Jharkhand Uttar Pradesh
Haldia Terminal
Farakka (LockGate)
Tribeni Terminal
Sahibganj Terminal
(Samdanala) Ghazipur Terminal
Varanasi Terminal
Physical Characteristics
1.
Texture
USDA
System Sandy Clay Clay Loam Sandy Clay Clay Loam Clay Loam Clay Loam
2. Water Holding Capacity % 30.6 30.2 29.5 30.2 31.4 36.0
3. Bulk Density gm/cc 1.39 1.29 1.35 1.32 1.26 1.30
4. Porosity % 47.6 51.3 49.1 50.2 52.5 50.9
Chemical Characteristics
5. pH 20 % Slurry 7.86 6.85 7.25 6.58 7.72 7.40
6. Conductivity (EC) µmhos/cm 235.4 135.4 279.2 272.0 305.6 360.5
7. CEC meq /100-gm 20.5 16.8 22.5 19.5 21.5 18.0
8. Organic Matter (OM) % 1.34 1.69 1.29 1.55 1.14 0.9
9. Organic Carbon (OC) % 0.78 0.98 0.75 0.90 0.66 0.52
10. Primary Nutrients
i) Nitrogen as N Kg/ha 245.8 325.8 281.5 298.6 345.5 280.2
ii) Phosphorous as P Kg/ha 20.5 24.3 25.2 19.6 16.8 16.2
iii) Potassium as K Kg/ha 139.5 116.5 128.2 225.7 245.2 168.8
Micronutrients
11. Manganese as Mn mg/kg 18.2 565.2 26.5 26.8 14.5 11.8
12. Chromium as Cr mg/kg 76.5 26.7 2.16 <0.01 5.7 10.5
13. Arsenic as mg/kg <0.01 2.65 <0.01 <0.01 <0.01 <0.01
14. Mercury as Hg mg/kg <0.01 0.12 <0.01 <0.01 <0.01 <0.01
15. Lead as Pb mg/kg 11.8 35.6 28.5 <0.01 6.4 5.8
16. Zinc as Zn mg/kg 31.9 38.5 <0.01 1.28 1.16 1.04
17. Iron as Fe mg/kg 31.2 2.44 2.68 42.2 24.3 12.9
18. Copper as Cu mg/kg 16.8 15.6 13.8 3.56 2.24 2.45
19. Cadmium as Cd mg/kg 1.25 0.35 0.88 <0.01 0.85 0.75
20. Nickel as Ni mg/kg <0.01 16.5 <0.01 0.89 2.15 1.88
Source: Data sampling & Analysis by JV and NABL accredited Lab
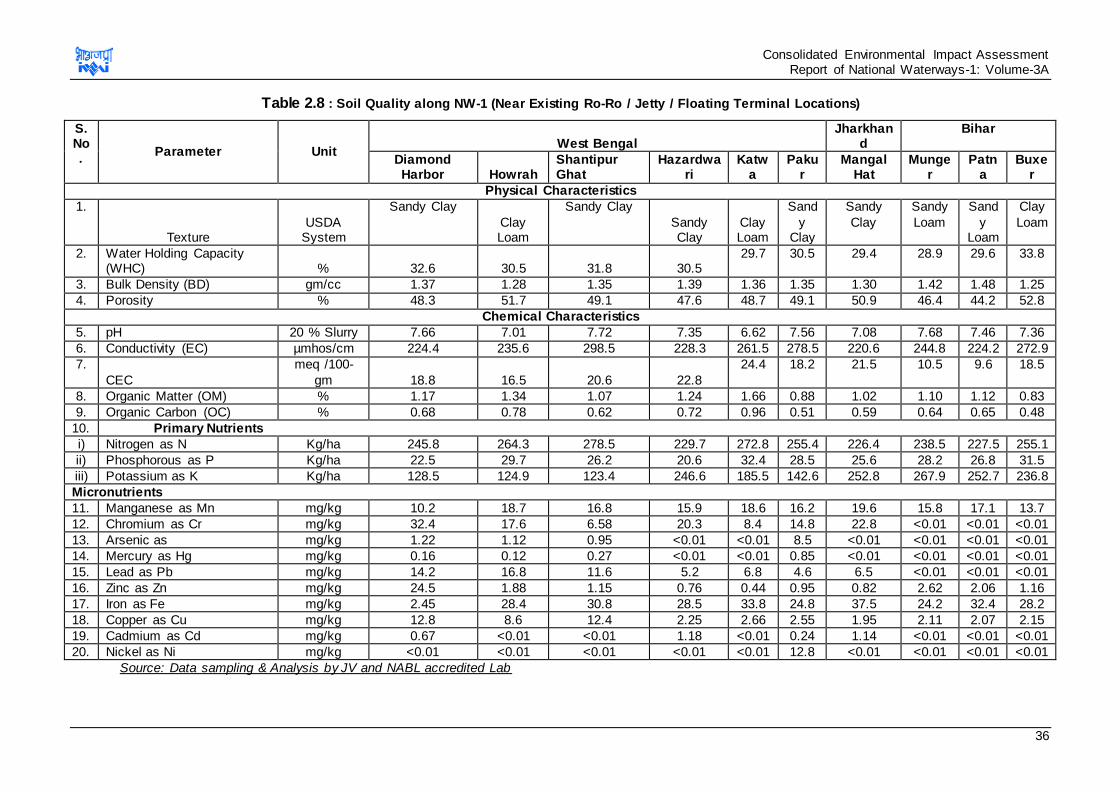
Consolidated Environmental Impact Assessment Report of National Waterways-1: Volume-3A
36
Table 2.8 : Soil Quality along NW-1 (Near Existing Ro-Ro / Jetty / Floating Terminal Locations)
S. No.
Parameter Unit West Bengal
Jharkhand
Bihar
Diamond Harbor Howrah
Shantipur Ghat
Hazardwari
Katwa
Pakur
Mangal Hat
Munger
Patna
Buxer
Physical Characteristics
1.
Texture USDA
System
Sandy Clay
Clay Loam
Sandy Clay
Sandy Clay
Clay Loam
Sand
y Clay
Sandy
Clay
Sandy
Loam
Sand
y Loam
Clay
Loam
2. Water Holding Capacity (WHC) % 32.6 30.5 31.8 30.5
29.7 30.5 29.4 28.9 29.6 33.8
3. Bulk Density (BD) gm/cc 1.37 1.28 1.35 1.39 1.36 1.35 1.30 1.42 1.48 1.25
4. Porosity % 48.3 51.7 49.1 47.6 48.7 49.1 50.9 46.4 44.2 52.8
Chemical Characteristics
5. pH 20 % Slurry 7.66 7.01 7.72 7.35 6.62 7.56 7.08 7.68 7.46 7.36
6. Conductivity (EC) µmhos/cm 224.4 235.6 298.5 228.3 261.5 278.5 220.6 244.8 224.2 272.9
7.
CEC
meq /100-
gm 18.8 16.5 20.6 22.8
24.4 18.2 21.5 10.5 9.6 18.5
8. Organic Matter (OM) % 1.17 1.34 1.07 1.24 1.66 0.88 1.02 1.10 1.12 0.83
9. Organic Carbon (OC) % 0.68 0.78 0.62 0.72 0.96 0.51 0.59 0.64 0.65 0.48
10. Primary Nutrients
i) Nitrogen as N Kg/ha 245.8 264.3 278.5 229.7 272.8 255.4 226.4 238.5 227.5 255.1
ii) Phosphorous as P Kg/ha 22.5 29.7 26.2 20.6 32.4 28.5 25.6 28.2 26.8 31.5
iii) Potassium as K Kg/ha 128.5 124.9 123.4 246.6 185.5 142.6 252.8 267.9 252.7 236.8
Micronutrients
11. Manganese as Mn mg/kg 10.2 18.7 16.8 15.9 18.6 16.2 19.6 15.8 17.1 13.7
12. Chromium as Cr mg/kg 32.4 17.6 6.58 20.3 8.4 14.8 22.8 <0.01 <0.01 <0.01
13. Arsenic as mg/kg 1.22 1.12 0.95 <0.01 <0.01 8.5 <0.01 <0.01 <0.01 <0.01
14. Mercury as Hg mg/kg 0.16 0.12 0.27 <0.01 <0.01 0.85 <0.01 <0.01 <0.01 <0.01
15. Lead as Pb mg/kg 14.2 16.8 11.6 5.2 6.8 4.6 6.5 <0.01 <0.01 <0.01
16. Zinc as Zn mg/kg 24.5 1.88 1.15 0.76 0.44 0.95 0.82 2.62 2.06 1.16
17. Iron as Fe mg/kg 2.45 28.4 30.8 28.5 33.8 24.8 37.5 24.2 32.4 28.2
18. Copper as Cu mg/kg 12.8 8.6 12.4 2.25 2.66 2.55 1.95 2.11 2.07 2.15
19. Cadmium as Cd mg/kg 0.67 <0.01 <0.01 1.18 <0.01 0.24 1.14 <0.01 <0.01 <0.01
20. Nickel as Ni mg/kg <0.01 <0.01 <0.01 <0.01 <0.01 12.8 <0.01 <0.01 <0.01 <0.01
Source: Data sampling & Analysis by JV and NABL accredited Lab
Consolidated Environmental Impact Assessment Report of National Waterways-1: Volume-3A
37
C. Soil Characteristics
Physical Properties
The physical characteristics examined include colour, texture, bulk density, porosity and
water holding capacity. The soil along the NW-1 is alluvial type. As per ‘USDA’ Triangular
Classification System, overall soils of all the sampling locations along NW-1 can be
described as Sandy Clay, Sandy Loam and Clay Loam type. Soils having larger particles
usually have higher Bulk Density than those of smaller particles. Bulk Density of soils along
NW-1 was found in the range of 1.25 to 1.48-gm/cc. Porosity of soils wereobserved
between 44.2 to 52.8%. Water Holding Capacity (WHC) of the soils varied between 28.9-
33.8%.
Chemical Characteristics
The analysis reflected that the soils are generally neutral to slightly alkaline nature with pH
ranging from 6.62-7.86 at all locations along with NW-1”. Electrical Conductivity (EC) was
found varying between 135.4-360.5-µmhos/cm and found with acceptable range.
Nitrogen is an integral component of many compounds including chlorophyll and enzyme
essential for plant growth. Available nitrogen content in the surface soils along NW-1 stretch
ranges between 244.48 & 345.5-kg/ha thereby, indicates that soils are low to medium for
available nitrogen content.
Phosphorous take part in important functions like photosynthesis, nitrogen fixation, crop
maturation, root development, strengthening straw in cereal crops etc. Available
phosphorus content ranged between 16.2-32.4-kg/ha thereby indicating that soils are low in
phosphorus in Jharkhand zone, medium in Uttar Pradesh and is on higher side in the soils
of West Bengal.
Potassium is an activator of various enzymes responsible for plant processes like energy
metabolism, starch synthesis, nitrate reduction and sugar degradation. It is also important in
grain formation and tuber development and encourages crop resistance for certain fungal
and bacterial diseases. Available potassium content in these soils at sampling locations
ranged between 116.5-267.9-kg/ha thereby indicating that the all sampled soils were
medium category of available potassium.
Cation Exchange Capacity (CEC) was found in the range of 9.6 to 24.4-meq/100-gm at all
locations along with NW-1. Range of copper, zinc, Chromium, Lead and other
micronutrients were observed in normal range.
Thus, the overall soil along the NW-1 area is moderately fertile and not expected to be
detrimental to the growth of agricultural and forest crops. Above description based on
physicochemical properties reveals that the soils fall within medium fertility levels in the
entire stretch of NW-1 (Haldia to Allahabad).
2.3.12. Meteorological Data (30 years avg.)
The main climatic factors of concern are temperature, sunlight and precipitation. In India,
there are four-temperature zones namely tropical, sub-tropical, temperate and alpine.
Among these, the tropical zone (Humid, sub-tropical and Tropical wet and dry) is most
predominant in the entire NW-1 stretch.
Consolidated Environmental Impact Assessment Report of National Waterways-1: Volume-3A
38
The meteorological parameters also play a vital role in transport and dispersion of pollutants
in the atmosphere. Historical meteorological data were obtained from climatological tables
pertaining to different IMD stations all along the NW-1. The met data of the nearest
representative IMD stations all along the NW-1(period 1961-1990) is summarized in Table
2.9 and 2.10.
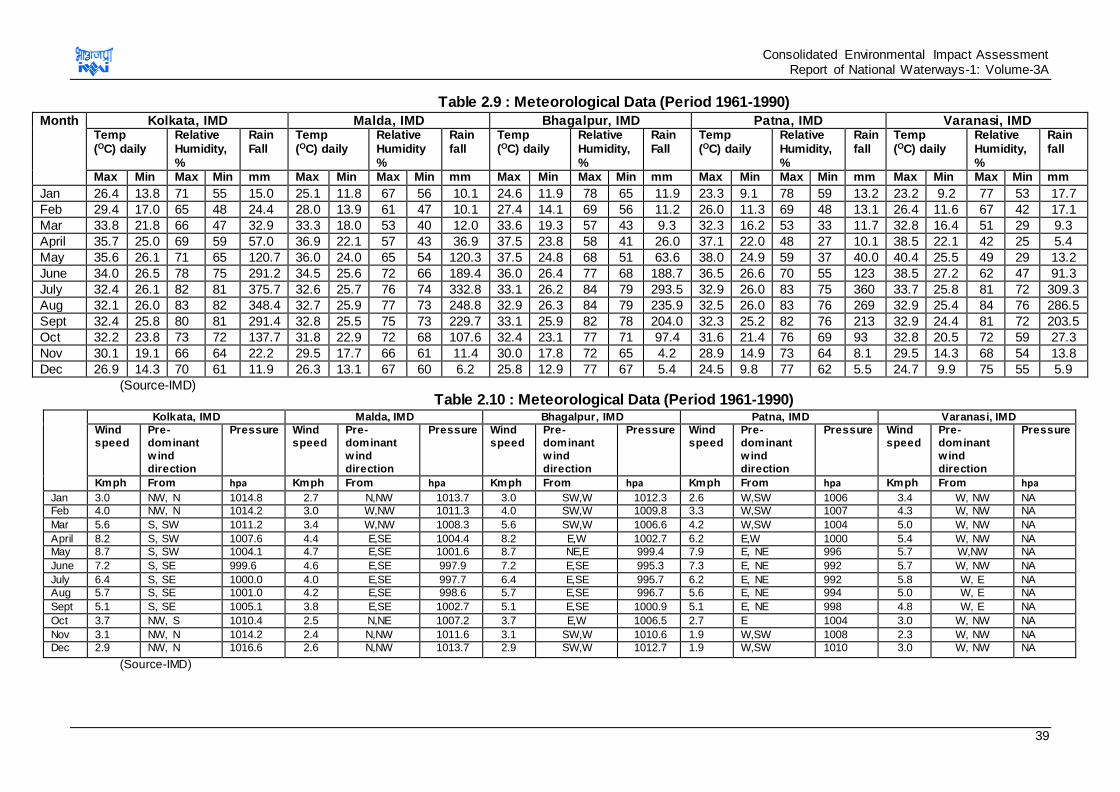
Consolidated Environmental Impact Assessment Report of National Waterways-1: Volume-3A
39
Table 2.9 : Meteorological Data (Period 1961-1990)
Month Kolkata, IMD Malda, IMD Bhagalpur, IMD Patna, IMD Varanasi, IMD Temp (OC) daily
Relative Humidity, %
Rain Fall
Temp (OC) daily
Relative Humidity %
Rain fall
Temp (OC) daily
Relative Humidity, %
Rain Fall
Temp (OC) daily
Relative Humidity, %
Rain fall
Temp (OC) daily
Relative Humidity, %
Rain fall
Max Min Max Min mm Max Min Max Min mm Max Min Max Min mm Max Min Max Min mm Max Min Max Min mm
Jan 26.4 13.8 71 55 15.0 25.1 11.8 67 56 10.1 24.6 11.9 78 65 11.9 23.3 9.1 78 59 13.2 23.2 9.2 77 53 17.7
Feb 29.4 17.0 65 48 24.4 28.0 13.9 61 47 10.1 27.4 14.1 69 56 11.2 26.0 11.3 69 48 13.1 26.4 11.6 67 42 17.1
Mar 33.8 21.8 66 47 32.9 33.3 18.0 53 40 12.0 33.6 19.3 57 43 9.3 32.3 16.2 53 33 11.7 32.8 16.4 51 29 9.3
April 35.7 25.0 69 59 57.0 36.9 22.1 57 43 36.9 37.5 23.8 58 41 26.0 37.1 22.0 48 27 10.1 38.5 22.1 42 25 5.4
May 35.6 26.1 71 65 120.7 36.0 24.0 65 54 120.3 37.5 24.8 68 51 63.6 38.0 24.9 59 37 40.0 40.4 25.5 49 29 13.2
June 34.0 26.5 78 75 291.2 34.5 25.6 72 66 189.4 36.0 26.4 77 68 188.7 36.5 26.6 70 55 123 38.5 27.2 62 47 91.3
July 32.4 26.1 82 81 375.7 32.6 25.7 76 74 332.8 33.1 26.2 84 79 293.5 32.9 26.0 83 75 360 33.7 25.8 81 72 309.3
Aug 32.1 26.0 83 82 348.4 32.7 25.9 77 73 248.8 32.9 26.3 84 79 235.9 32.5 26.0 83 76 269 32.9 25.4 84 76 286.5
Sept 32.4 25.8 80 81 291.4 32.8 25.5 75 73 229.7 33.1 25.9 82 78 204.0 32.3 25.2 82 76 213 32.9 24.4 81 72 203.5
Oct 32.2 23.8 73 72 137.7 31.8 22.9 72 68 107.6 32.4 23.1 77 71 97.4 31.6 21.4 76 69 93 32.8 20.5 72 59 27.3
Nov 30.1 19.1 66 64 22.2 29.5 17.7 66 61 11.4 30.0 17.8 72 65 4.2 28.9 14.9 73 64 8.1 29.5 14.3 68 54 13.8
Dec 26.9 14.3 70 61 11.9 26.3 13.1 67 60 6.2 25.8 12.9 77 67 5.4 24.5 9.8 77 62 5.5 24.7 9.9 75 55 5.9
(Source-IMD) Table 2.10 : Meteorological Data (Period 1961-1990)
Kolkata, IMD Malda, IMD Bhagalpur, IMD Patna, IMD Varanasi, IMD
Wind
speed
Pre-
dominant
w ind
direction
Pressure
Wind
speed
Pre-
dominant
w ind
direction
Pressure
Wind
speed
Pre-
dominant
w ind
direction
Pressure
Wind
speed
Pre-
dominant
w ind
direction
Pressure
Wind
speed
Pre-
dominant
w ind
direction
Pressure
Kmph From hpa Kmph From hpa Kmph From hpa Kmph From hpa Kmph From hpa
Jan 3.0 NW, N 1014.8 2.7 N,NW 1013.7 3.0 SW,W 1012.3 2.6 W,SW 1006 3.4 W, NW NA
Feb 4.0 NW, N 1014.2 3.0 W,NW 1011.3 4.0 SW,W 1009.8 3.3 W,SW 1007 4.3 W, NW NA
Mar 5.6 S, SW 1011.2 3.4 W,NW 1008.3 5.6 SW,W 1006.6 4.2 W,SW 1004 5.0 W, NW NA
April 8.2 S, SW 1007.6 4.4 E,SE 1004.4 8.2 E,W 1002.7 6.2 E,W 1000 5.4 W, NW NA
May 8.7 S, SW 1004.1 4.7 E,SE 1001.6 8.7 NE,E 999.4 7.9 E, NE 996 5.7 W,NW NA
June 7.2 S, SE 999.6 4.6 E,SE 997.9 7.2 E,SE 995.3 7.3 E, NE 992 5.7 W, NW NA
July 6.4 S, SE 1000.0 4.0 E,SE 997.7 6.4 E,SE 995.7 6.2 E, NE 992 5.8 W, E NA
Aug 5.7 S, SE 1001.0 4.2 E,SE 998.6 5.7 E,SE 996.7 5.6 E, NE 994 5.0 W, E NA
Sept 5.1 S, SE 1005.1 3.8 E,SE 1002.7 5.1 E,SE 1000.9 5.1 E, NE 998 4.8 W, E NA
Oct 3.7 NW, S 1010.4 2.5 N,NE 1007.2 3.7 E,W 1006.5 2.7 E 1004 3.0 W, NW NA
Nov 3.1 NW, N 1014.2 2.4 N,NW 1011.6 3.1 SW,W 1010.6 1.9 W,SW 1008 2.3 W, NW NA
Dec 2.9 NW, N 1016.6 2.6 N,NW 1013.7 2.9 SW,W 1012.7 1.9 W,SW 1010 3.0 W, NW NA
(Source-IMD)
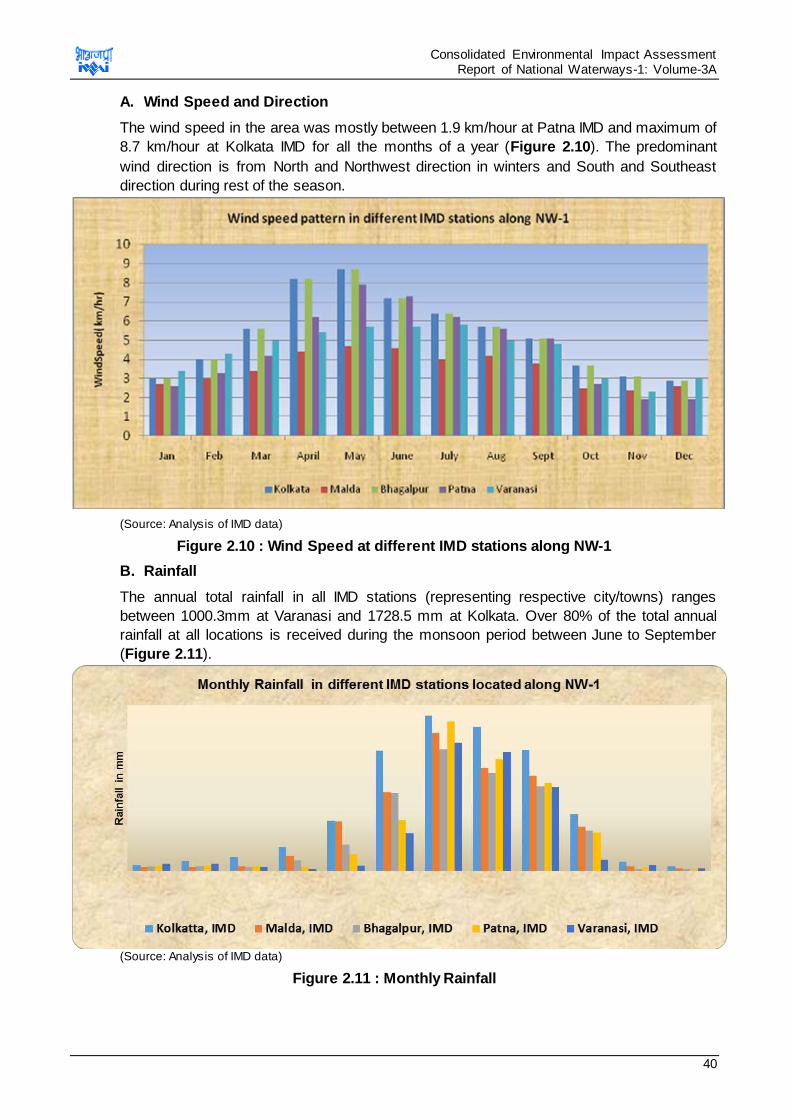
Consolidated Environmental Impact Assessment Report of National Waterways-1: Volume-3A
40
A. Wind Speed and Direction
The wind speed in the area was mostly between 1.9 km/hour at Patna IMD and maximum of
8.7 km/hour at Kolkata IMD for all the months of a year (Figure 2.10). The predominant
wind direction is from North and Northwest direction in winters and South and Southeast
direction during rest of the season.
(Source: Analysis of IMD data)
Figure 2.10 : Wind Speed at different IMD stations along NW-1
B. Rainfall
The annual total rainfall in all IMD stations (representing respective city/towns) ranges
between 1000.3mm at Varanasi and 1728.5 mm at Kolkata. Over 80% of the total annual
rainfall at all locations is received during the monsoon period between June to September
(Figure 2.11).
(Source: Analysis of IMD data)
Figure 2.11 : Monthly Rainfall
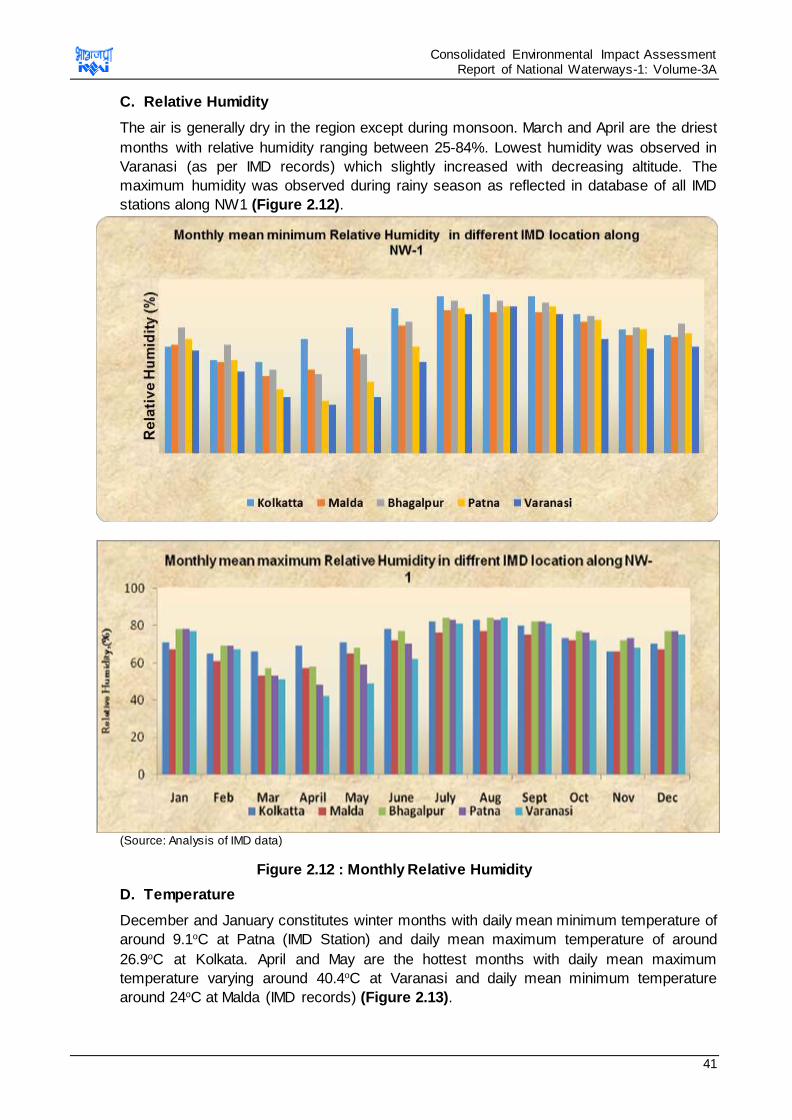
Consolidated Environmental Impact Assessment Report of National Waterways-1: Volume-3A
41
C. Relative Humidity
The air is generally dry in the region except during monsoon. March and April are the driest
months with relative humidity ranging between 25-84%. Lowest humidity was observed in
Varanasi (as per IMD records) which slightly increased with decreasing altitude. The
maximum humidity was observed during rainy season as reflected in database of all IMD
stations along NW1 (Figure 2.12).
(Source: Analysis of IMD data)
Figure 2.12 : Monthly Relative Humidity
D. Temperature
December and January constitutes winter months with daily mean minimum temperature of
around 9.1oC at Patna (IMD Station) and daily mean maximum temperature of around
26.9oC at Kolkata. April and May are the hottest months with daily mean maximum
temperature varying around 40.4oC at Varanasi and daily mean minimum temperature
around 24oC at Malda (IMD records) (Figure 2.13).
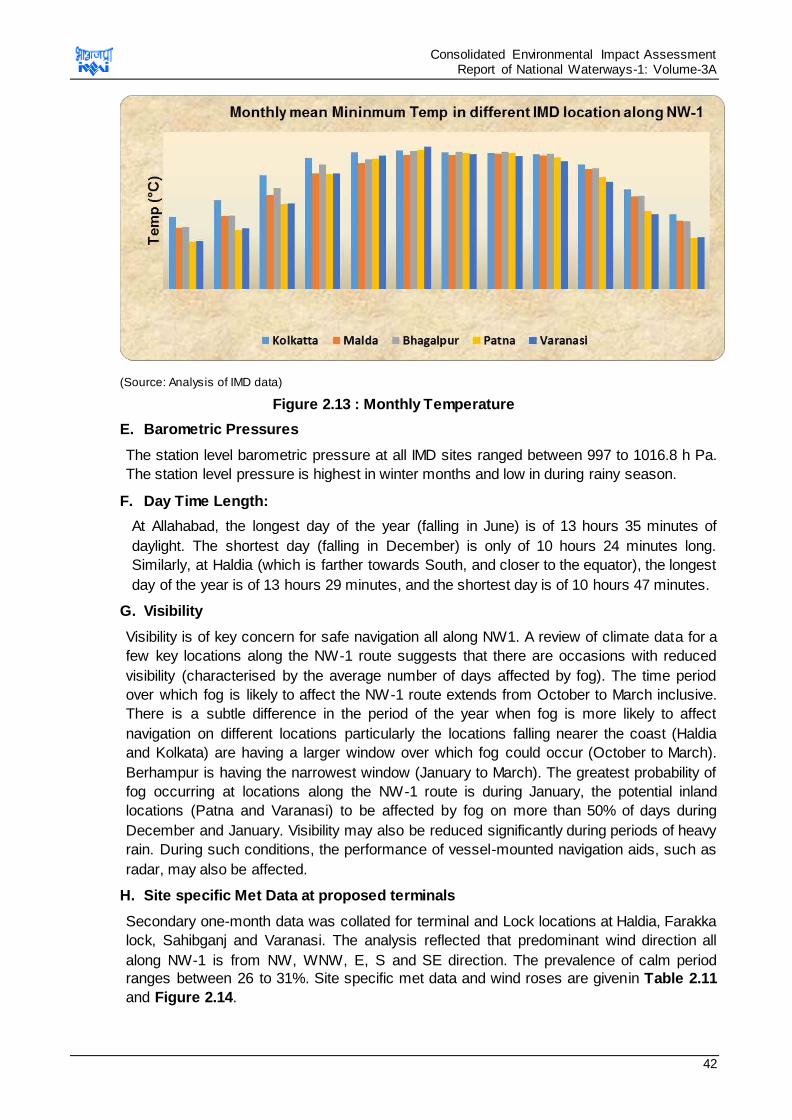
Consolidated Environmental Impact Assessment Report of National Waterways-1: Volume-3A
42
(Source: Analysis of IMD data)
Figure 2.13 : Monthly Temperature
E. Barometric Pressures
The station level barometric pressure at all IMD sites ranged between 997 to 1016.8 h Pa.
The station level pressure is highest in winter months and low in during rainy season.
F. Day Time Length:
At Allahabad, the longest day of the year (falling in June) is of 13 hours 35 minutes of
daylight. The shortest day (falling in December) is only of 10 hours 24 minutes long.
Similarly, at Haldia (which is farther towards South, and closer to the equator), the longest
day of the year is of 13 hours 29 minutes, and the shortest day is of 10 hours 47 minutes.
G. Visibility
Visibility is of key concern for safe navigation all along NW1. A review of climate data for a
few key locations along the NW-1 route suggests that there are occasions with reduced
visibility (characterised by the average number of days affected by fog). The time period
over which fog is likely to affect the NW-1 route extends from October to March inclusive.
There is a subtle difference in the period of the year when fog is more likely to affect
navigation on different locations particularly the locations falling nearer the coast (Haldia
and Kolkata) are having a larger window over which fog could occur (October to March).
Berhampur is having the narrowest window (January to March). The greatest probability of
fog occurring at locations along the NW-1 route is during January, the potential inland
locations (Patna and Varanasi) to be affected by fog on more than 50% of days during
December and January. Visibility may also be reduced significantly during periods of heavy
rain. During such conditions, the performance of vessel-mounted navigation aids, such as
radar, may also be affected.
H. Site specific Met Data at proposed terminals
Secondary one-month data was collated for terminal and Lock locations at Haldia, Farakka
lock, Sahibganj and Varanasi. The analysis reflected that predominant wind direction all
along NW-1 is from NW, WNW, E, S and SE direction. The prevalence of calm period
ranges between 26 to 31%. Site specific met data and wind roses are givenin Table 2.11
and Figure 2.14.
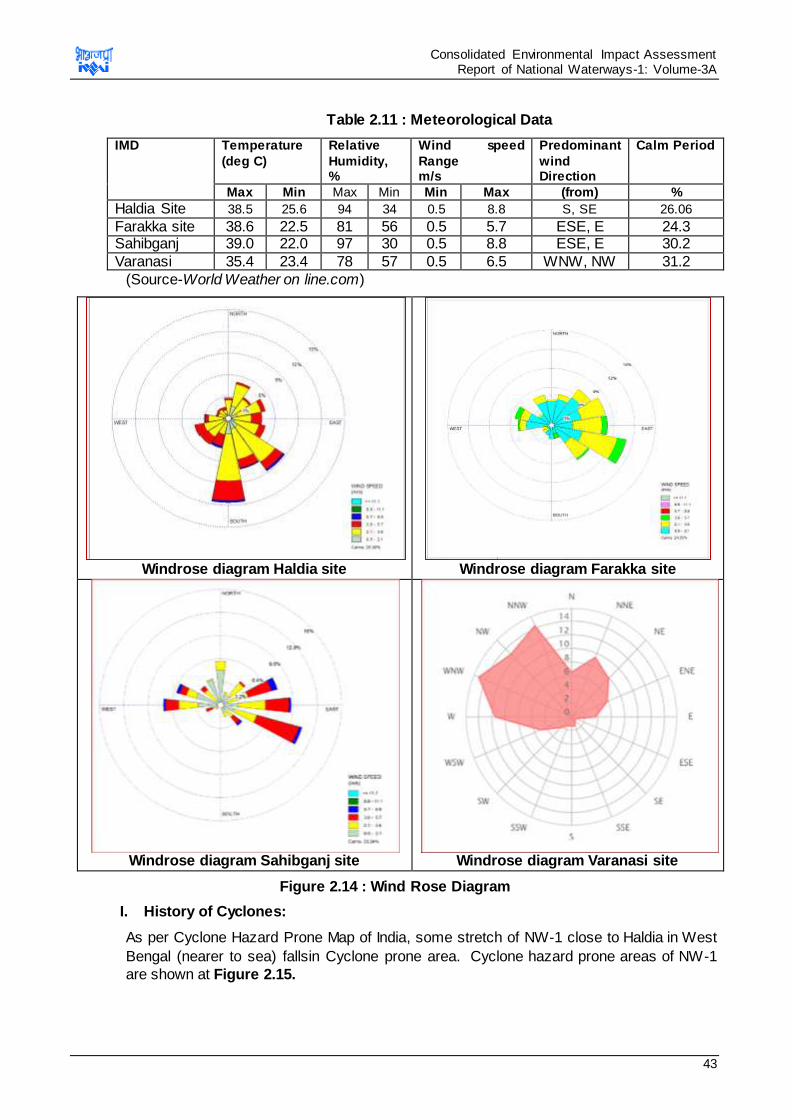
Consolidated Environmental Impact Assessment Report of National Waterways-1: Volume-3A
43
Table 2.11 : Meteorological Data
IMD Temperature
(deg C)
Relative
Humidity, %
Wind speed
Range m/s
Predominant
wind Direction
Calm Period
Max Min Max Min Min Max (from) %
Haldia Site 38.5 25.6 94 34 0.5 8.8 S, SE 26.06
Farakka site 38.6 22.5 81 56 0.5 5.7 ESE, E 24.3 Sahibganj 39.0 22.0 97 30 0.5 8.8 ESE, E 30.2
Varanasi 35.4 23.4 78 57 0.5 6.5 WNW, NW 31.2
(Source-World Weather on line.com)
Windrose diagram Haldia site
Windrose diagram Farakka site
Windrose diagram Sahibganj site
Windrose diagram Varanasi site
Figure 2.14 : Wind Rose Diagram
I. History of Cyclones:
As per Cyclone Hazard Prone Map of India, some stretch of NW-1 close to Haldia in West
Bengal (nearer to sea) fallsin Cyclone prone area. Cyclone hazard prone areas of NW-1
are shown at Figure 2.15.
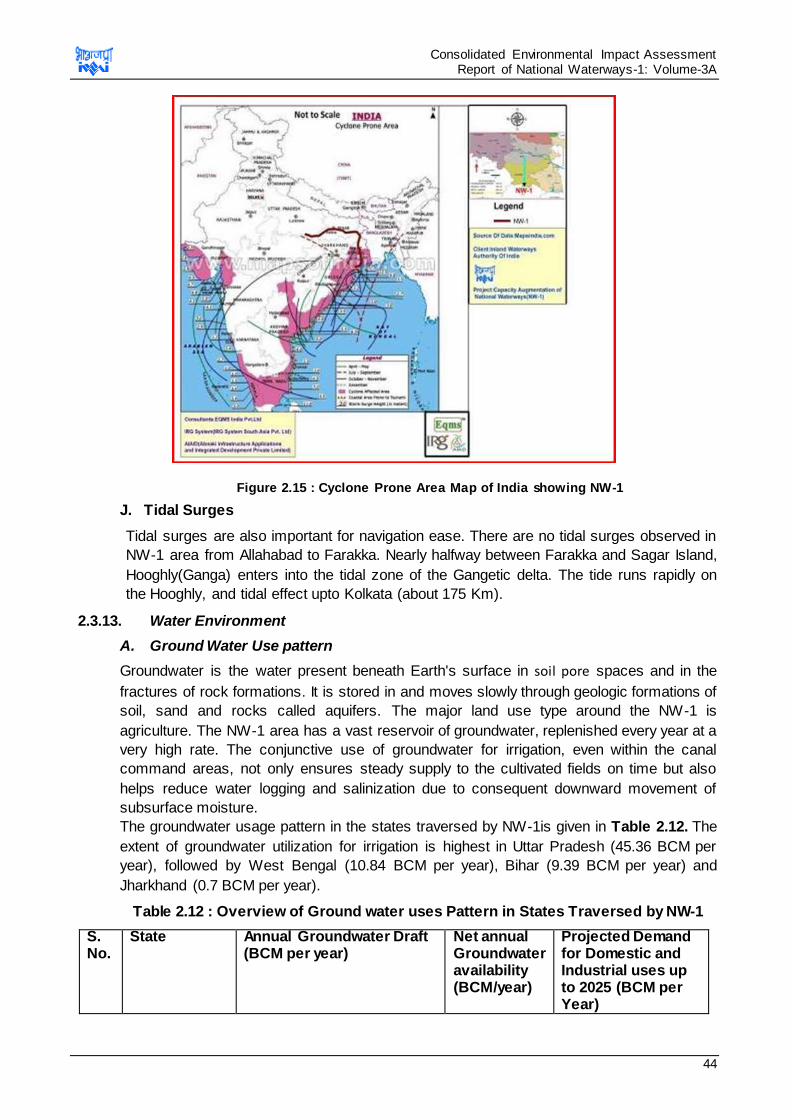
Consolidated Environmental Impact Assessment Report of National Waterways-1: Volume-3A
44
Figure 2.15 : Cyclone Prone Area Map of India showing NW-1
J. Tidal Surges
Tidal surges are also important for navigation ease. There are no tidal surges observed in
NW-1 area from Allahabad to Farakka. Nearly halfway between Farakka and Sagar Island,
Hooghly(Ganga) enters into the tidal zone of the Gangetic delta. The tide runs rapidly on
the Hooghly, and tidal effect upto Kolkata (about 175 Km).
2.3.13. Water Environment
A. Ground Water Use pattern
Groundwater is the water present beneath Earth's surface in soil pore spaces and in the
fractures of rock formations. It is stored in and moves slowly through geologic formations of
soil, sand and rocks called aquifers. The major land use type around the NW-1 is
agriculture. The NW-1 area has a vast reservoir of groundwater, replenished every year at a
very high rate. The conjunctive use of groundwater for irrigation, even within the canal
command areas, not only ensures steady supply to the cultivated fields on time but also
helps reduce water logging and salinization due to consequent downward movement of
subsurface moisture.
The groundwater usage pattern in the states traversed by NW-1is given in Table 2.12. The
extent of groundwater utilization for irrigation is highest in Uttar Pradesh (45.36 BCM per
year), followed by West Bengal (10.84 BCM per year), Bihar (9.39 BCM per year) and
Jharkhand (0.7 BCM per year).
Table 2.12 : Overview of Ground water uses Pattern in States Traversed by NW-1
S. No.
State Annual Groundwater Draft (BCM per year)
Net annual Groundwater availability (BCM/year)
Projected Demand for Domestic and Industrial uses up to 2025 (BCM per Year)
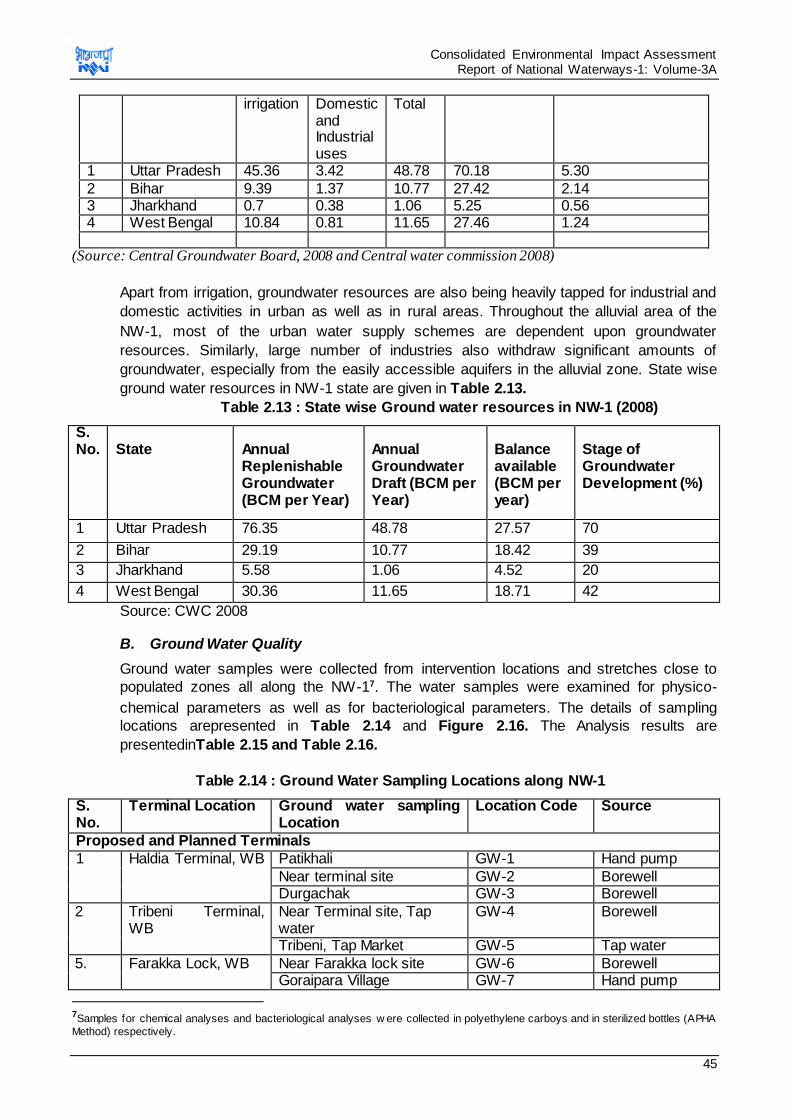
Consolidated Environmental Impact Assessment Report of National Waterways-1: Volume-3A
45
irrigation Domestic and Industrial uses
Total
1 Uttar Pradesh 45.36 3.42 48.78 70.18 5.30
2 Bihar 9.39 1.37 10.77 27.42 2.14 3 Jharkhand 0.7 0.38 1.06 5.25 0.56 4 West Bengal 10.84 0.81 11.65 27.46 1.24
(Source: Central Groundwater Board, 2008 and Central water commission 2008)
Apart from irrigation, groundwater resources are also being heavily tapped for industrial and
domestic activities in urban as well as in rural areas. Throughout the alluvial area of the
NW-1, most of the urban water supply schemes are dependent upon groundwater
resources. Similarly, large number of industries also withdraw significant amounts of
groundwater, especially from the easily accessible aquifers in the alluvial zone. State wise
ground water resources in NW-1 state are given in Table 2.13.
Table 2.13 : State wise Ground water resources in NW-1 (2008)
S. No.
State
Annual Replenishable Groundwater (BCM per Year)
Annual Groundwater Draft (BCM per Year)
Balance available (BCM per year)
Stage of Groundwater Development (%)
1 Uttar Pradesh 76.35 48.78 27.57 70
2 Bihar 29.19 10.77 18.42 39
3 Jharkhand 5.58 1.06 4.52 20
4 West Bengal 30.36 11.65 18.71 42
Source: CWC 2008
B. Ground Water Quality
Ground water samples were collected from intervention locations and stretches close to
populated zones all along the NW-17. The water samples were examined for physico-
chemical parameters as well as for bacteriological parameters. The details of sampling
locations arepresented in Table 2.14 and Figure 2.16. The Analysis results are
presentedinTable 2.15 and Table 2.16.
Table 2.14 : Ground Water Sampling Locations along NW-1
S. No.
Terminal Location Ground water sampling Location
Location Code Source
Proposed and Planned Terminals
1 Haldia Terminal, WB Patikhali GW-1 Hand pump
Near terminal site GW-2 Borewell Durgachak GW-3 Borewell
2 Tribeni Terminal, WB
Near Terminal site, Tap water
GW-4 Borewell
Tribeni, Tap Market GW-5 Tap water
5. Farakka Lock, WB Near Farakka lock site GW-6 Borewell Goraipara Village GW-7 Hand pump
7Samples for chemical analyses and bacteriological analyses w ere collected in polyethylene carboys and in sterilized bottles (APHA
Method) respectively.

Consolidated Environmental Impact Assessment Report of National Waterways-1: Volume-3A
46
Farakka Town GW-8 Hand pump
6. Sahibganj Terminal, Kharkhand
Samda Nala Village GW-9 Hand pump Rampur Village GW-10 Hand pump
Sakrigali GW-11 Hand pump 7. Gazipur Terminal,
Uttar Pradesh Tarighat, Ghazipur GW-12 Hand pump
GW-13 Handpump Kalupur GW-14 Handpump
8. Varanasi Terminal, Uttar Pradesh
Terminal Site GW-15 Borewell Milkipur GW-16 Hand pump
Ralhupur GW-17 Hand pump Tahirpur GW-18 Hand pump
Bhitti GW-19 Hand pump Madarwa GW-20 Hand pump
Populated areas along NW-1
1 West Bengal Diamond Harbour GW-21 Hand pump
2 West Bengal Howrah GW-22 Hand pump 3 West Bengal Katwa GW-23 Hand pump 4 Jharkhand Magalhat GW-24 Hand pump 5 Bihar Bhagalpur GW-25 Hand pump 6 Bihar Buxar GW-26 Hand pump 7 Bihar Munger, GW-27 Hand pump 8 Bihar Patna GW-28 Hand pump
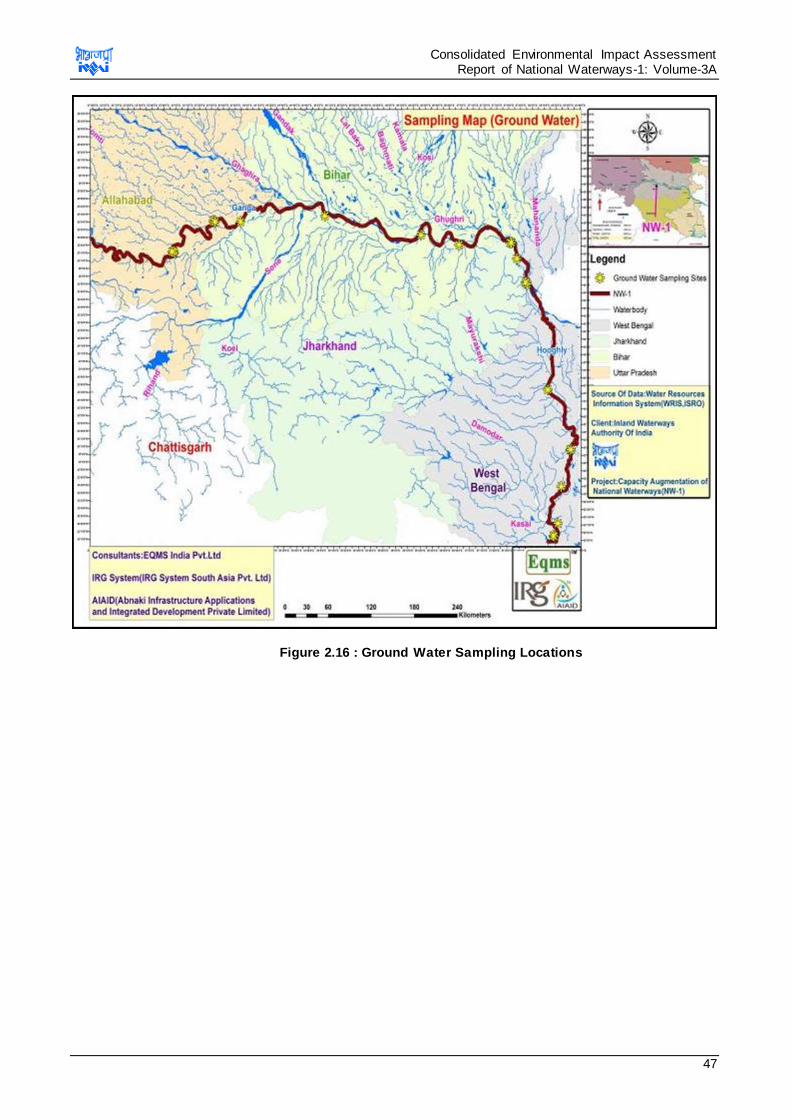
Consolidated Environmental Impact Assessment Report of National Waterways-1: Volume-3A
47
Figure 2.16 : Ground Water Sampling Locations
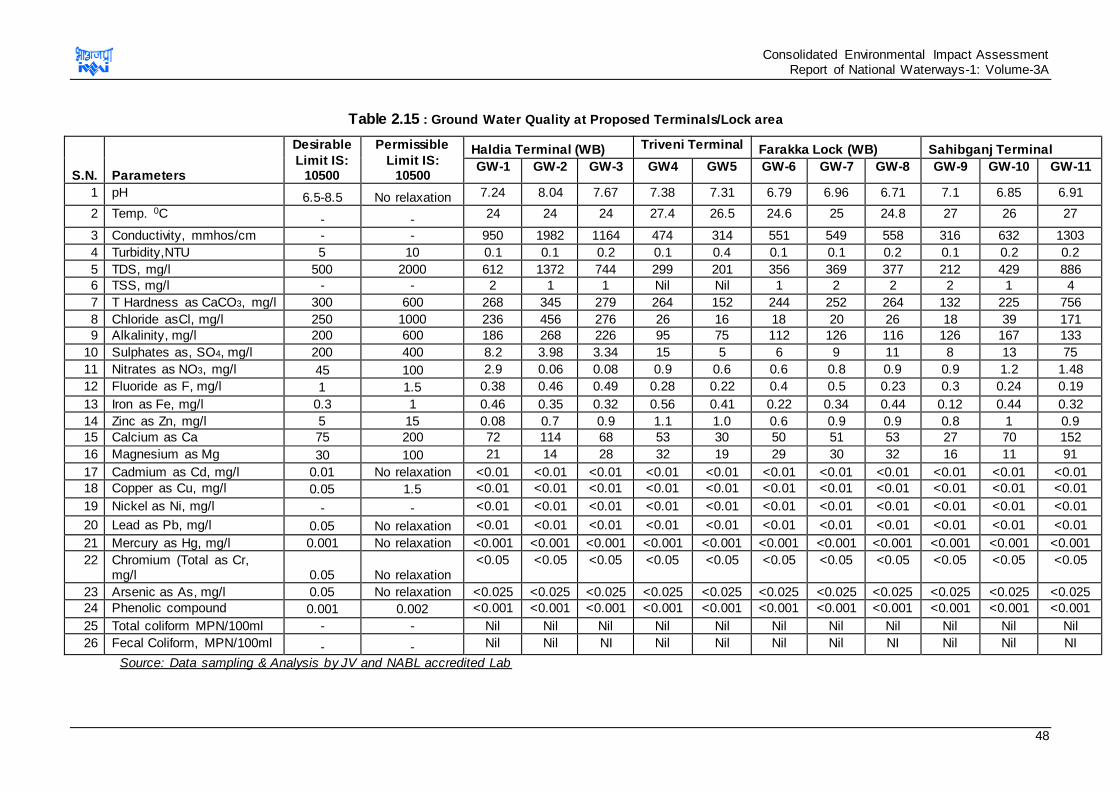
Consolidated Environmental Impact Assessment Report of National Waterways-1: Volume-3A
48
Table 2.15 : Ground Water Quality at Proposed Terminals/Lock area
S.N.
Parameters
Desirable
Limit IS: 10500
Permissible
Limit IS: 10500
Haldia Terminal (WB) Triveni Terminal Farakka Lock (WB) Sahibganj Terminal
GW-1 GW-2 GW-3 GW4 GW5 GW-6 GW-7 GW-8 GW-9 GW-10 GW-11
1 pH 6.5-8.5 No relaxation 7.24 8.04 7.67 7.38 7.31 6.79 6.96 6.71 7.1 6.85 6.91
2 Temp. 0C - - 24 24 24 27.4 26.5 24.6 25 24.8 27 26 27
3 Conductivity, mmhos/cm - - 950 1982 1164 474 314 551 549 558 316 632 1303
4 Turbidity,NTU 5 10 0.1 0.1 0.2 0.1 0.4 0.1 0.1 0.2 0.1 0.2 0.2
5 TDS, mg/l 500 2000 612 1372 744 299 201 356 369 377 212 429 886
6 TSS, mg/l - - 2 1 1 Nil Nil 1 2 2 2 1 4
7 T Hardness as CaCO3, mg/l 300 600 268 345 279 264 152 244 252 264 132 225 756
8 Chloride asCl, mg/l 250 1000 236 456 276 26 16 18 20 26 18 39 171
9 Alkalinity, mg/l 200 600 186 268 226 95 75 112 126 116 126 167 133
10 Sulphates as, SO4, mg/l 200 400 8.2 3.98 3.34 15 5 6 9 11 8 13 75
11 Nitrates as NO3, mg/l 45 100 2.9 0.06 0.08 0.9 0.6 0.6 0.8 0.9 0.9 1.2 1.48
12 Fluoride as F, mg/l 1 1.5 0.38 0.46 0.49 0.28 0.22 0.4 0.5 0.23 0.3 0.24 0.19
13 Iron as Fe, mg/l 0.3 1 0.46 0.35 0.32 0.56 0.41 0.22 0.34 0.44 0.12 0.44 0.32
14 Zinc as Zn, mg/l 5 15 0.08 0.7 0.9 1.1 1.0 0.6 0.9 0.9 0.8 1 0.9
15 Calcium as Ca 75 200 72 114 68 53 30 50 51 53 27 70 152
16 Magnesium as Mg 30 100 21 14 28 32 19 29 30 32 16 11 91
17 Cadmium as Cd, mg/l 0.01 No relaxation <0.01 <0.01 <0.01 <0.01 <0.01 <0.01 <0.01 <0.01 <0.01 <0.01 <0.01
18 Copper as Cu, mg/l 0.05 1.5 <0.01 <0.01 <0.01 <0.01 <0.01 <0.01 <0.01 <0.01 <0.01 <0.01 <0.01
19 Nickel as Ni, mg/l - - <0.01 <0.01 <0.01 <0.01 <0.01 <0.01 <0.01 <0.01 <0.01 <0.01 <0.01
20 Lead as Pb, mg/l 0.05 No relaxation <0.01 <0.01 <0.01 <0.01 <0.01 <0.01 <0.01 <0.01 <0.01 <0.01 <0.01
21 Mercury as Hg, mg/l 0.001 No relaxation <0.001 <0.001 <0.001 <0.001 <0.001 <0.001 <0.001 <0.001 <0.001 <0.001 <0.001
22 Chromium (Total as Cr, mg/l 0.05 No relaxation
<0.05 <0.05 <0.05 <0.05 <0.05 <0.05 <0.05 <0.05 <0.05 <0.05 <0.05
23 Arsenic as As, mg/l 0.05 No relaxation <0.025 <0.025 <0.025 <0.025 <0.025 <0.025 <0.025 <0.025 <0.025 <0.025 <0.025
24 Phenolic compound 0.001 0.002 <0.001 <0.001 <0.001 <0.001 <0.001 <0.001 <0.001 <0.001 <0.001 <0.001 <0.001
25 Total coliform MPN/100ml - - Nil Nil Nil Nil Nil Nil Nil Nil Nil Nil Nil
26 Fecal Coliform, MPN/100ml - - Nil Nil NI Nil Nil Nil Nil NI Nil Nil NI
Source: Data sampling & Analysis by JV and NABL accredited Lab
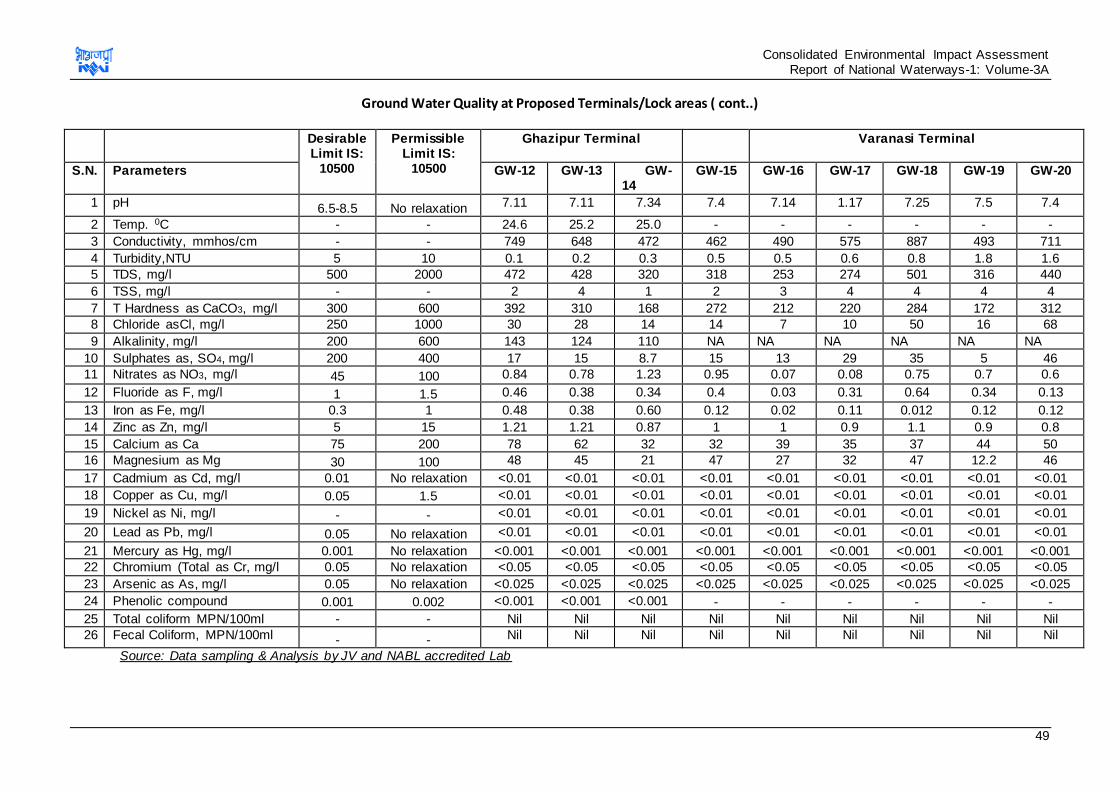
Consolidated Environmental Impact Assessment Report of National Waterways-1: Volume-3A
49
Ground Water Quality at Proposed Terminals/Lock areas ( cont..)
Desirable Limit IS:
10500
Permissible Limit IS:
10500
Ghazipur Terminal
Varanasi Terminal
S.N. Parameters GW-12 GW-13 GW-14
GW-15 GW-16 GW-17 GW-18 GW-19 GW-20
1 pH 6.5-8.5 No relaxation 7.11 7.11 7.34 7.4 7.14 1.17 7.25 7.5 7.4
2 Temp. 0C - - 24.6 25.2 25.0 - - - - - -
3 Conductivity, mmhos/cm - - 749 648 472 462 490 575 887 493 711
4 Turbidity,NTU 5 10 0.1 0.2 0.3 0.5 0.5 0.6 0.8 1.8 1.6
5 TDS, mg/l 500 2000 472 428 320 318 253 274 501 316 440
6 TSS, mg/l - - 2 4 1 2 3 4 4 4 4
7 T Hardness as CaCO3, mg/l 300 600 392 310 168 272 212 220 284 172 312
8 Chloride asCl, mg/l 250 1000 30 28 14 14 7 10 50 16 68
9 Alkalinity, mg/l 200 600 143 124 110 NA NA NA NA NA NA
10 Sulphates as, SO4, mg/l 200 400 17 15 8.7 15 13 29 35 5 46
11 Nitrates as NO3, mg/l 45 100 0.84 0.78 1.23 0.95 0.07 0.08 0.75 0.7 0.6
12 Fluoride as F, mg/l 1 1.5 0.46 0.38 0.34 0.4 0.03 0.31 0.64 0.34 0.13
13 Iron as Fe, mg/l 0.3 1 0.48 0.38 0.60 0.12 0.02 0.11 0.012 0.12 0.12
14 Zinc as Zn, mg/l 5 15 1.21 1.21 0.87 1 1 0.9 1.1 0.9 0.8
15 Calcium as Ca 75 200 78 62 32 32 39 35 37 44 50
16 Magnesium as Mg 30 100 48 45 21 47 27 32 47 12.2 46
17 Cadmium as Cd, mg/l 0.01 No relaxation <0.01 <0.01 <0.01 <0.01 <0.01 <0.01 <0.01 <0.01 <0.01
18 Copper as Cu, mg/l 0.05 1.5 <0.01 <0.01 <0.01 <0.01 <0.01 <0.01 <0.01 <0.01 <0.01
19 Nickel as Ni, mg/l - - <0.01 <0.01 <0.01 <0.01 <0.01 <0.01 <0.01 <0.01 <0.01
20 Lead as Pb, mg/l 0.05 No relaxation <0.01 <0.01 <0.01 <0.01 <0.01 <0.01 <0.01 <0.01 <0.01
21 Mercury as Hg, mg/l 0.001 No relaxation <0.001 <0.001 <0.001 <0.001 <0.001 <0.001 <0.001 <0.001 <0.001
22 Chromium (Total as Cr, mg/l 0.05 No relaxation <0.05 <0.05 <0.05 <0.05 <0.05 <0.05 <0.05 <0.05 <0.05
23 Arsenic as As, mg/l 0.05 No relaxation <0.025 <0.025 <0.025 <0.025 <0.025 <0.025 <0.025 <0.025 <0.025
24 Phenolic compound 0.001 0.002 <0.001 <0.001 <0.001 - - - - - -
25 Total coliform MPN/100ml - - Nil Nil Nil Nil Nil Nil Nil Nil Nil
26 Fecal Coliform, MPN/100ml - - Nil Nil Nil Nil Nil Nil Nil Nil Nil
Source: Data sampling & Analysis by JV and NABL accredited Lab
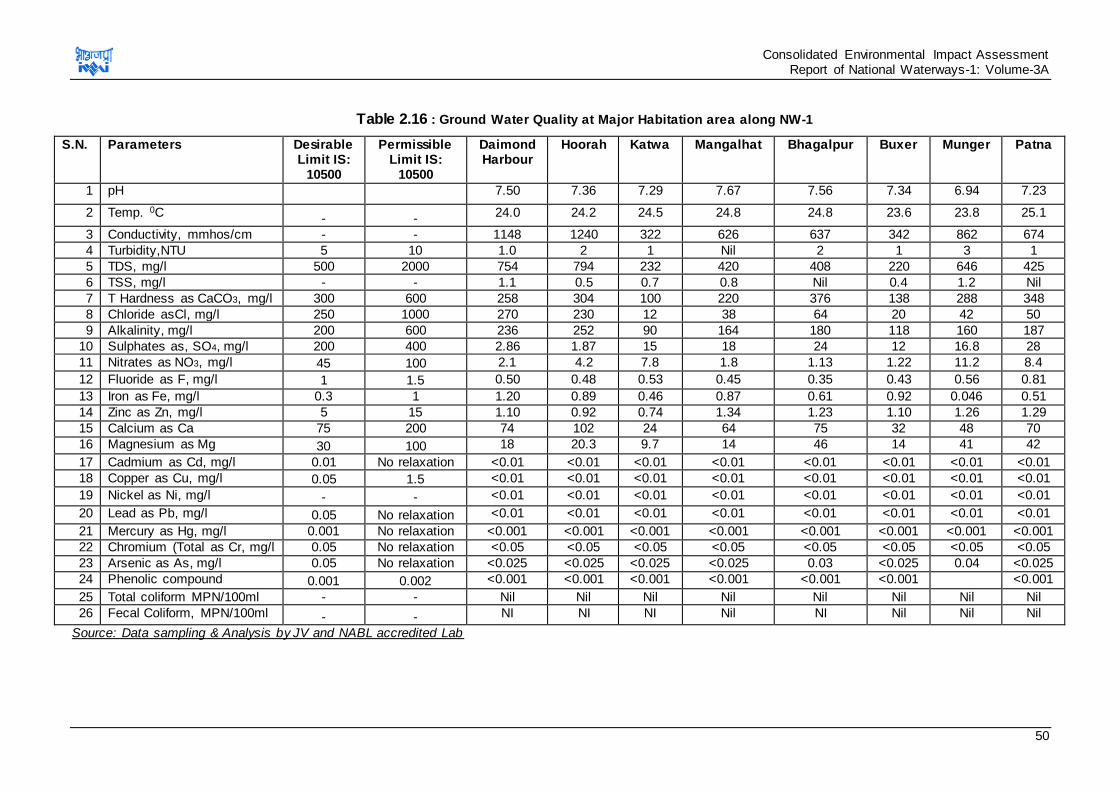
Consolidated Environmental Impact Assessment Report of National Waterways-1: Volume-3A
50
Table 2.16 : Ground Water Quality at Major Habitation area along NW-1
S.N. Parameters Desirable Limit IS:
10500
Permissible Limit IS:
10500
Daimond Harbour
Hoorah Katwa Mangalhat Bhagalpur Buxer Munger Patna
1 pH 7.50 7.36 7.29 7.67 7.56 7.34 6.94 7.23
2 Temp. 0C - - 24.0 24.2 24.5 24.8 24.8 23.6 23.8 25.1
3 Conductivity, mmhos/cm - - 1148 1240 322 626 637 342 862 674
4 Turbidity,NTU 5 10 1.0 2 1 Nil 2 1 3 1
5 TDS, mg/l 500 2000 754 794 232 420 408 220 646 425
6 TSS, mg/l - - 1.1 0.5 0.7 0.8 Nil 0.4 1.2 Nil
7 T Hardness as CaCO3, mg/l 300 600 258 304 100 220 376 138 288 348
8 Chloride asCl, mg/l 250 1000 270 230 12 38 64 20 42 50
9 Alkalinity, mg/l 200 600 236 252 90 164 180 118 160 187
10 Sulphates as, SO4, mg/l 200 400 2.86 1.87 15 18 24 12 16.8 28
11 Nitrates as NO3, mg/l 45 100 2.1 4.2 7.8 1.8 1.13 1.22 11.2 8.4
12 Fluoride as F, mg/l 1 1.5 0.50 0.48 0.53 0.45 0.35 0.43 0.56 0.81
13 Iron as Fe, mg/l 0.3 1 1.20 0.89 0.46 0.87 0.61 0.92 0.046 0.51
14 Zinc as Zn, mg/l 5 15 1.10 0.92 0.74 1.34 1.23 1.10 1.26 1.29
15 Calcium as Ca 75 200 74 102 24 64 75 32 48 70
16 Magnesium as Mg 30 100 18 20.3 9.7 14 46 14 41 42
17 Cadmium as Cd, mg/l 0.01 No relaxation <0.01 <0.01 <0.01 <0.01 <0.01 <0.01 <0.01 <0.01
18 Copper as Cu, mg/l 0.05 1.5 <0.01 <0.01 <0.01 <0.01 <0.01 <0.01 <0.01 <0.01
19 Nickel as Ni, mg/l - - <0.01 <0.01 <0.01 <0.01 <0.01 <0.01 <0.01 <0.01
20 Lead as Pb, mg/l 0.05 No relaxation <0.01 <0.01 <0.01 <0.01 <0.01 <0.01 <0.01 <0.01
21 Mercury as Hg, mg/l 0.001 No relaxation <0.001 <0.001 <0.001 <0.001 <0.001 <0.001 <0.001 <0.001
22 Chromium (Total as Cr, mg/l 0.05 No relaxation <0.05 <0.05 <0.05 <0.05 <0.05 <0.05 <0.05 <0.05
23 Arsenic as As, mg/l 0.05 No relaxation <0.025 <0.025 <0.025 <0.025 0.03 <0.025 0.04 <0.025
24 Phenolic compound 0.001 0.002 <0.001 <0.001 <0.001 <0.001 <0.001 <0.001 <0.001
25 Total coliform MPN/100ml - - Nil Nil Nil Nil Nil Nil Nil Nil
26 Fecal Coliform, MPN/100ml - - NI NI NI Nil NI Nil Nil Nil
Source: Data sampling & Analysis by JV and NABL accredited Lab
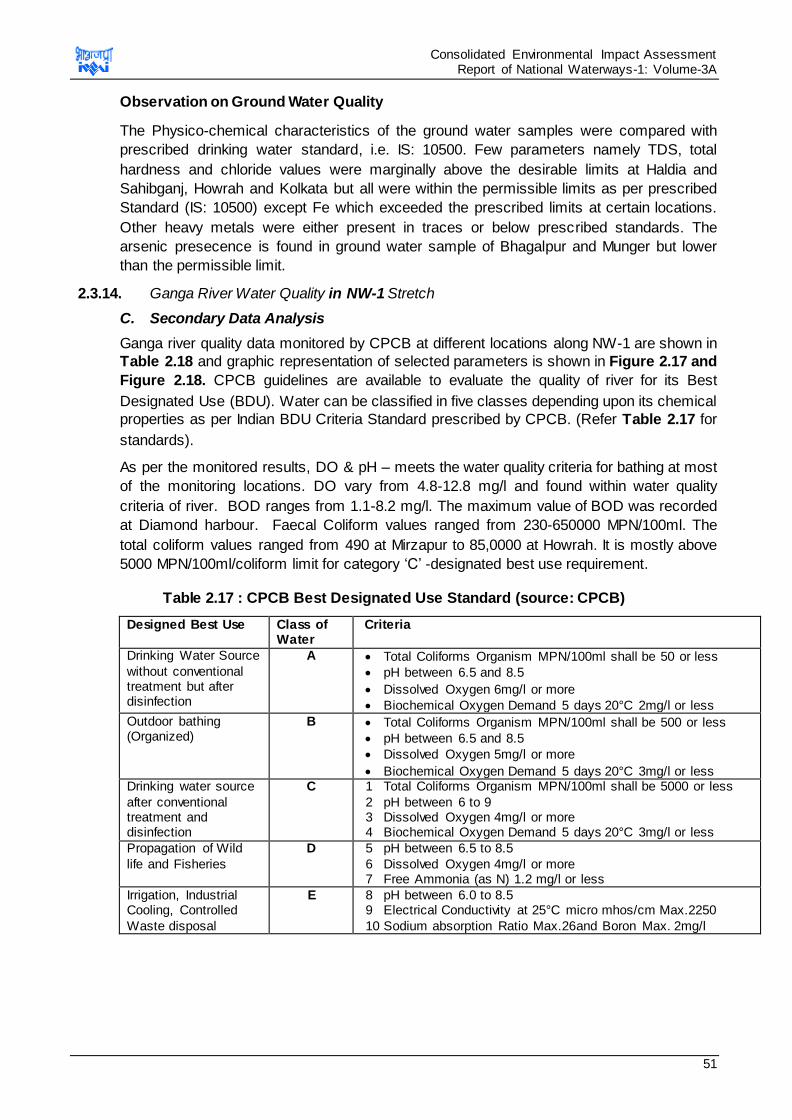
Consolidated Environmental Impact Assessment Report of National Waterways-1: Volume-3A
51
Observation on Ground Water Quality
The Physico-chemical characteristics of the ground water samples were compared with
prescribed drinking water standard, i.e. IS: 10500. Few parameters namely TDS, total
hardness and chloride values were marginally above the desirable limits at Haldia and
Sahibganj, Howrah and Kolkata but all were within the permissible limits as per prescribed
Standard (IS: 10500) except Fe which exceeded the prescribed limits at certain locations.
Other heavy metals were either present in traces or below prescribed standards. The
arsenic presecence is found in ground water sample of Bhagalpur and Munger but lower
than the permissible limit.
2.3.14. Ganga River Water Quality in NW-1 Stretch
C. Secondary Data Analysis
Ganga river quality data monitored by CPCB at different locations along NW-1 are shown in
Table 2.18 and graphic representation of selected parameters is shown in Figure 2.17 and
Figure 2.18. CPCB guidelines are available to evaluate the quality of river for its Best
Designated Use (BDU). Water can be classified in five classes depending upon its chemical
properties as per Indian BDU Criteria Standard prescribed by CPCB. (Refer Table 2.17 for
standards).
As per the monitored results, DO & pH – meets the water quality criteria for bathing at most
of the monitoring locations. DO vary from 4.8-12.8 mg/l and found within water quality
criteria of river. BOD ranges from 1.1-8.2 mg/l. The maximum value of BOD was recorded
at Diamond harbour. Faecal Coliform values ranged from 230-650000 MPN/100ml. The
total coliform values ranged from 490 at Mirzapur to 85,0000 at Howrah. It is mostly above
5000 MPN/100ml/coliform limit for category ‘C’ -designated best use requirement.
Table 2.17 : CPCB Best Designated Use Standard (source: CPCB)
Designed Best Use Class of Water
Criteria
Drinking Water Source
without conventional treatment but after disinfection
A Total Coliforms Organism MPN/100ml shall be 50 or less
pH between 6.5 and 8.5
Dissolved Oxygen 6mg/l or more
Biochemical Oxygen Demand 5 days 20°C 2mg/l or less
Outdoor bathing (Organized)
B Total Coliforms Organism MPN/100ml shall be 500 or less
pH between 6.5 and 8.5
Dissolved Oxygen 5mg/l or more
Biochemical Oxygen Demand 5 days 20°C 3mg/l or less Drinking water source
after conventional treatment and disinfection
C 1 Total Coliforms Organism MPN/100ml shall be 5000 or less
2 pH between 6 to 9 3 Dissolved Oxygen 4mg/l or more 4 Biochemical Oxygen Demand 5 days 20°C 3mg/l or less
Propagation of Wild
life and Fisheries
D 5 pH between 6.5 to 8.5
6 Dissolved Oxygen 4mg/l or more 7 Free Ammonia (as N) 1.2 mg/l or less
Irrigation, Industrial Cooling, Controlled
Waste disposal
E 8 pH between 6.0 to 8.5 9 Electrical Conductivity at 25°C micro mhos/cm Max.2250
10 Sodium absorption Ratio Max.26and Boron Max. 2mg/l
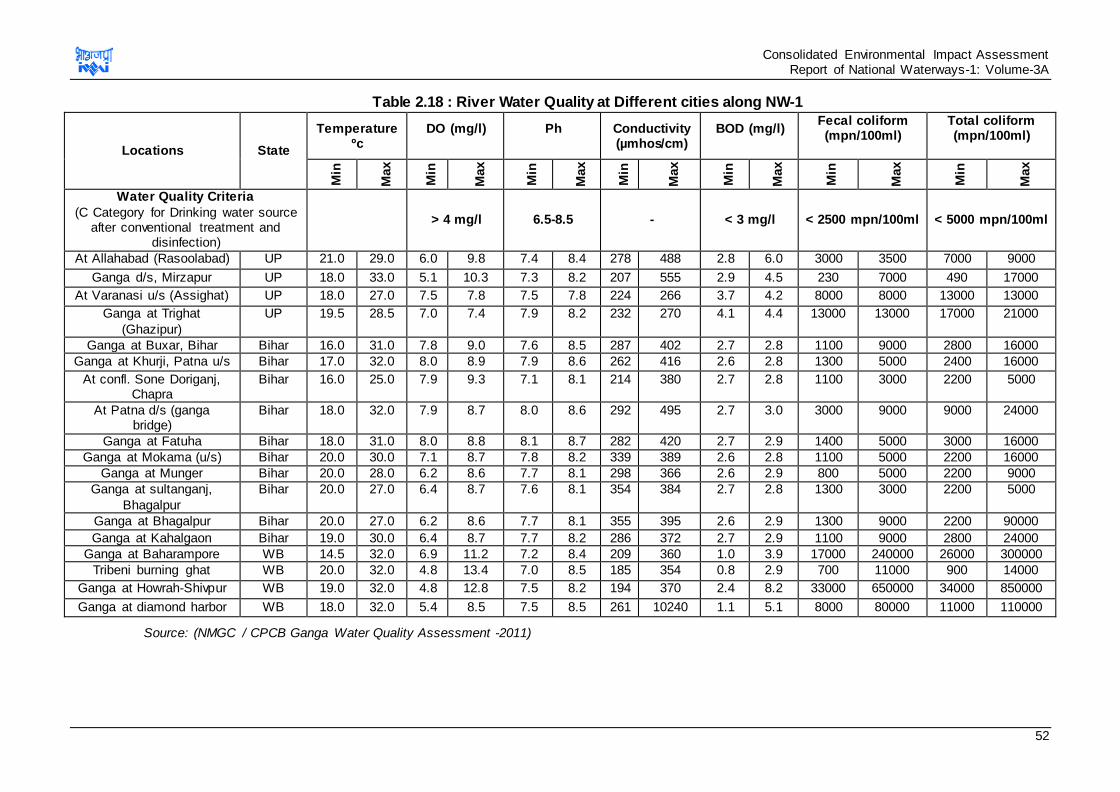
Consolidated Environmental Impact Assessment Report of National Waterways-1: Volume-3A
52
Table 2.18 : River Water Quality at Different cities along NW-1
Locations State
Temperature ºc
DO (mg/l)
Ph
Conductivity (µmhos/cm)
BOD (mg/l)
Fecal coliform (mpn/100ml)
Total coliform (mpn/100ml)
Min
Max
Min
Max
Min
Max
Min
Max
Min
Max
Min
Max
Min
Max
Water Quality Criteria
(C Category for Drinking water source after conventional treatment and
disinfection)
> 4 mg/l 6.5-8.5 - < 3 mg/l < 2500 mpn/100ml < 5000 mpn/100ml
At Allahabad (Rasoolabad) UP 21.0 29.0 6.0 9.8 7.4 8.4 278 488 2.8 6.0 3000 3500 7000 9000
Ganga d/s, Mirzapur UP 18.0 33.0 5.1 10.3 7.3 8.2 207 555 2.9 4.5 230 7000 490 17000
At Varanasi u/s (Assighat) UP 18.0 27.0 7.5 7.8 7.5 7.8 224 266 3.7 4.2 8000 8000 13000 13000
Ganga at Trighat
(Ghazipur)
UP 19.5 28.5 7.0 7.4 7.9 8.2 232 270 4.1 4.4 13000 13000 17000 21000
Ganga at Buxar, Bihar Bihar 16.0 31.0 7.8 9.0 7.6 8.5 287 402 2.7 2.8 1100 9000 2800 16000
Ganga at Khurji, Patna u/s Bihar 17.0 32.0 8.0 8.9 7.9 8.6 262 416 2.6 2.8 1300 5000 2400 16000
At confl. Sone Doriganj, Chapra
Bihar 16.0 25.0 7.9 9.3 7.1 8.1 214 380 2.7 2.8 1100 3000 2200 5000
At Patna d/s (ganga bridge)
Bihar 18.0 32.0 7.9 8.7 8.0 8.6 292 495 2.7 3.0 3000 9000 9000 24000
Ganga at Fatuha Bihar 18.0 31.0 8.0 8.8 8.1 8.7 282 420 2.7 2.9 1400 5000 3000 16000
Ganga at Mokama (u/s) Bihar 20.0 30.0 7.1 8.7 7.8 8.2 339 389 2.6 2.8 1100 5000 2200 16000
Ganga at Munger Bihar 20.0 28.0 6.2 8.6 7.7 8.1 298 366 2.6 2.9 800 5000 2200 9000
Ganga at sultanganj,
Bhagalpur
Bihar 20.0 27.0 6.4 8.7 7.6 8.1 354 384 2.7 2.8 1300 3000 2200 5000
Ganga at Bhagalpur Bihar 20.0 27.0 6.2 8.6 7.7 8.1 355 395 2.6 2.9 1300 9000 2200 90000
Ganga at Kahalgaon Bihar 19.0 30.0 6.4 8.7 7.7 8.2 286 372 2.7 2.9 1100 9000 2800 24000
Ganga at Baharampore WB 14.5 32.0 6.9 11.2 7.2 8.4 209 360 1.0 3.9 17000 240000 26000 300000
Tribeni burning ghat WB 20.0 32.0 4.8 13.4 7.0 8.5 185 354 0.8 2.9 700 11000 900 14000
Ganga at Howrah-Shivpur WB 19.0 32.0 4.8 12.8 7.5 8.2 194 370 2.4 8.2 33000 650000 34000 850000
Ganga at diamond harbor WB 18.0 32.0 5.4 8.5 7.5 8.5 261 10240 1.1 5.1 8000 80000 11000 110000
Source: (NMGC / CPCB Ganga Water Quality Assessment -2011)
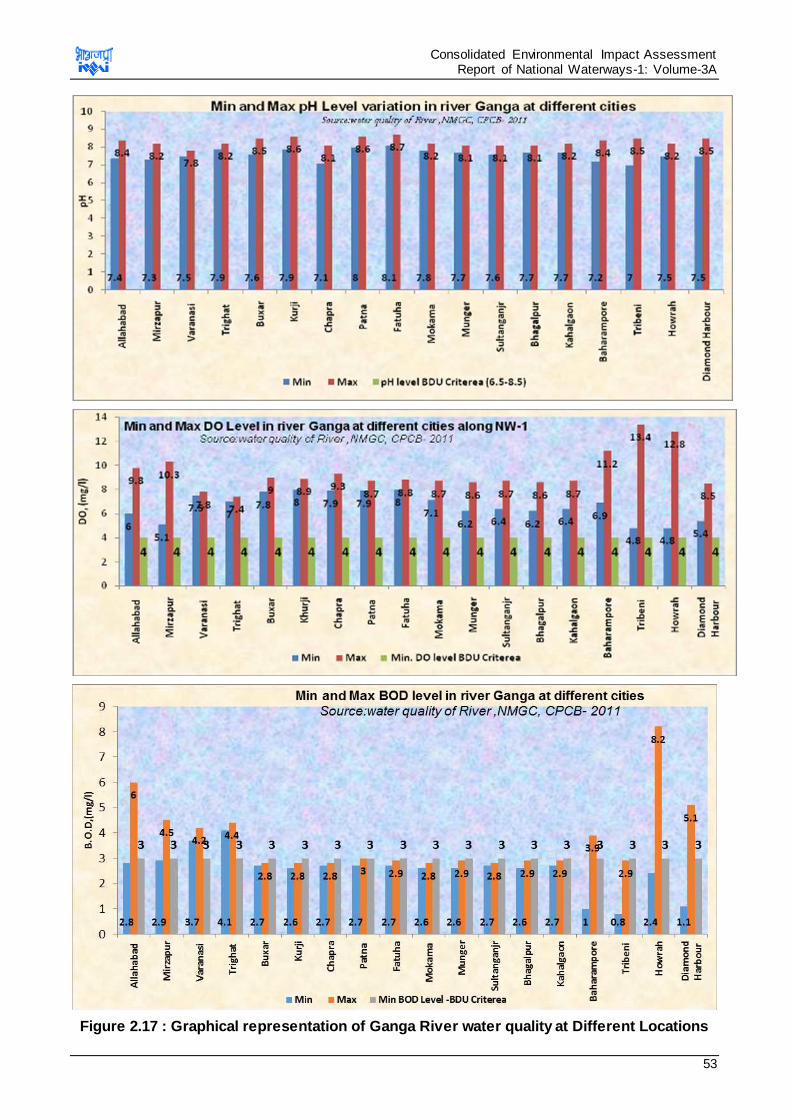
Consolidated Environmental Impact Assessment Report of National Waterways-1: Volume-3A
53
Figure 2.17 : Graphical representation of Ganga River water quality at Different Locations
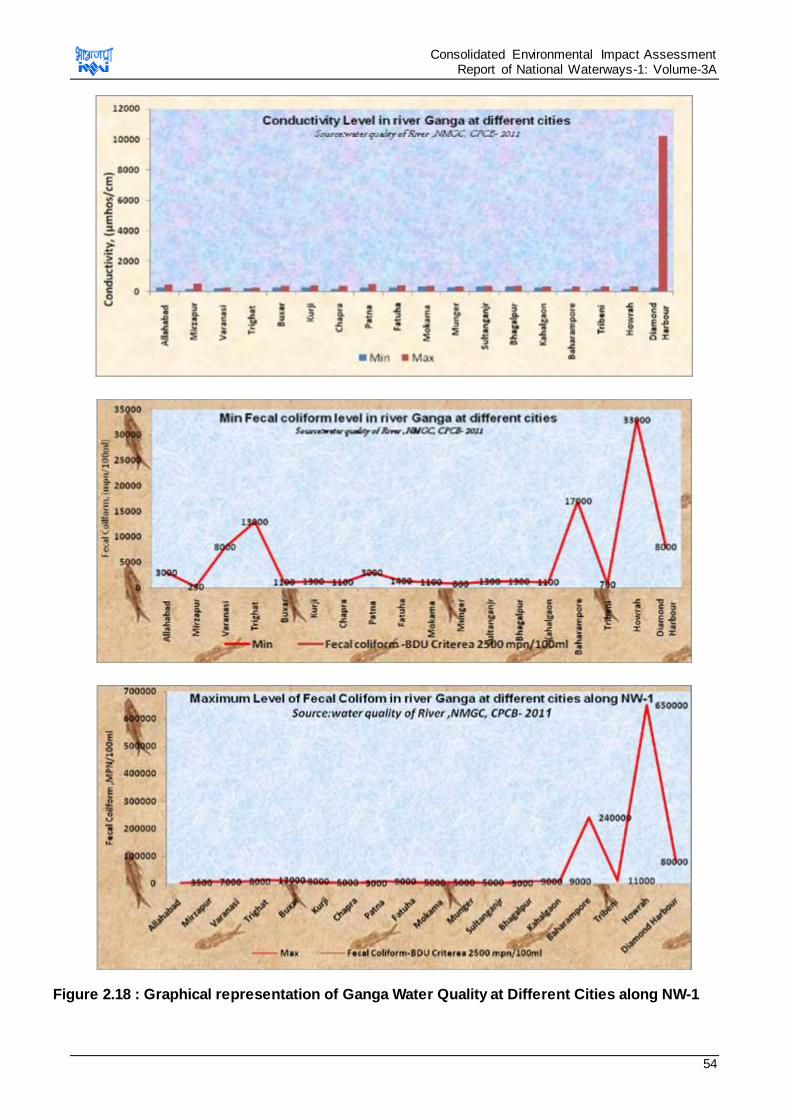
Consolidated Environmental Impact Assessment Report of National Waterways-1: Volume-3A
54
Figure 2.18 : Graphical representation of Ganga Water Quality at Different Cities along NW-1
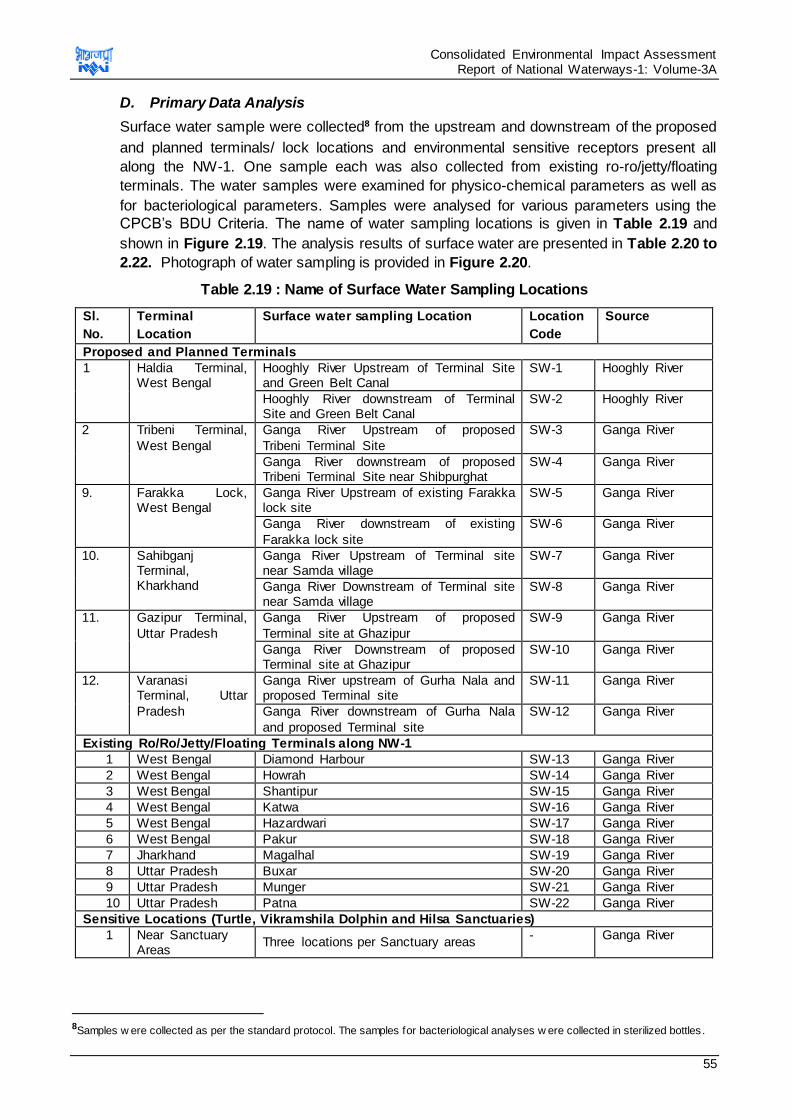
Consolidated Environmental Impact Assessment Report of National Waterways-1: Volume-3A
55
D. Primary Data Analysis
Surface water sample were collected8 from the upstream and downstream of the proposed
and planned terminals/ lock locations and environmental sensitive receptors present all
along the NW-1. One sample each was also collected from existing ro-ro/jetty/floating
terminals. The water samples were examined for physico-chemical parameters as well as
for bacteriological parameters. Samples were analysed for various parameters using the
CPCB’s BDU Criteria. The name of water sampling locations is given in Table 2.19 and
shown in Figure 2.19. The analysis results of surface water are presented in Table 2.20 to
2.22. Photograph of water sampling is provided in Figure 2.20.
Table 2.19 : Name of Surface Water Sampling Locations
Sl.
No.
Terminal
Location
Surface water sampling Location Location
Code
Source
Proposed and Planned Terminals
1 Haldia Terminal, West Bengal
Hooghly River Upstream of Terminal Site and Green Belt Canal
SW-1 Hooghly River
Hooghly River downstream of Terminal Site and Green Belt Canal
SW-2 Hooghly River
2 Tribeni Terminal,
West Bengal
Ganga River Upstream of proposed
Tribeni Terminal Site
SW-3 Ganga River
Ganga River downstream of proposed Tribeni Terminal Site near Shibpurghat
SW-4 Ganga River
9. Farakka Lock, West Bengal
Ganga River Upstream of existing Farakka lock site
SW-5 Ganga River
Ganga River downstream of existing
Farakka lock site
SW-6 Ganga River
10. Sahibganj Terminal, Kharkhand
Ganga River Upstream of Terminal site near Samda village
SW-7 Ganga River
Ganga River Downstream of Terminal site near Samda village
SW-8 Ganga River
11. Gazipur Terminal,
Uttar Pradesh
Ganga River Upstream of proposed
Terminal site at Ghazipur
SW-9 Ganga River
Ganga River Downstream of proposed Terminal site at Ghazipur
SW-10 Ganga River
12. Varanasi Terminal, Uttar
Pradesh
Ganga River upstream of Gurha Nala and proposed Terminal site
SW-11 Ganga River
Ganga River downstream of Gurha Nala
and proposed Terminal site
SW-12 Ganga River
Existing Ro/Ro/Jetty/Floating Terminals along NW-1
1 West Bengal Diamond Harbour SW-13 Ganga River
2 West Bengal Howrah SW-14 Ganga River 3 West Bengal Shantipur SW-15 Ganga River 4 West Bengal Katwa SW-16 Ganga River 5 West Bengal Hazardwari SW-17 Ganga River 6 West Bengal Pakur SW-18 Ganga River 7 Jharkhand Magalhal SW-19 Ganga River 8 Uttar Pradesh Buxar SW-20 Ganga River 9 Uttar Pradesh Munger SW-21 Ganga River 10 Uttar Pradesh Patna SW-22 Ganga River
Sensitive Locations (Turtle, Vikramshila Dolphin and Hilsa Sanctuaries)
1 Near Sanctuary Areas
Three locations per Sanctuary areas - Ganga River
8Samples w ere collected as per the standard protocol. The samples for bacteriological analyses w ere collected in sterilized bottles .
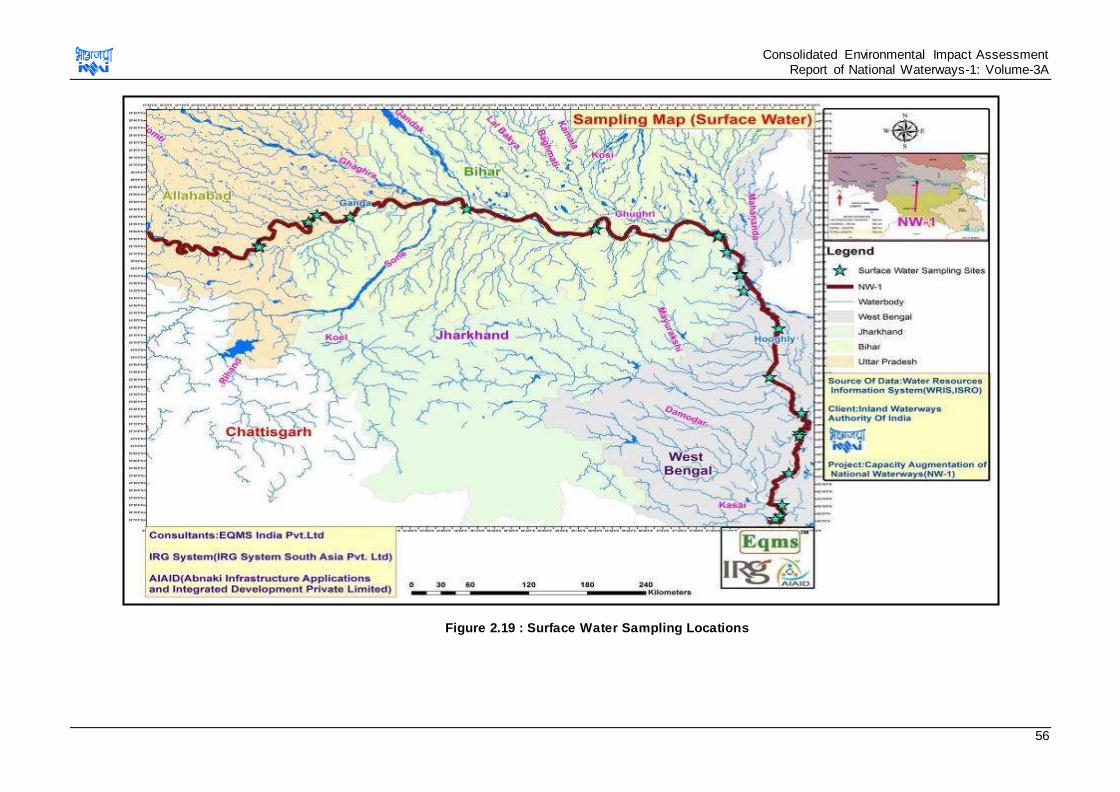
Consolidated Environmental Impact Assessment Report of National Waterways-1: Volume-3A
56
Figure 2.19 : Surface Water Sampling Locations
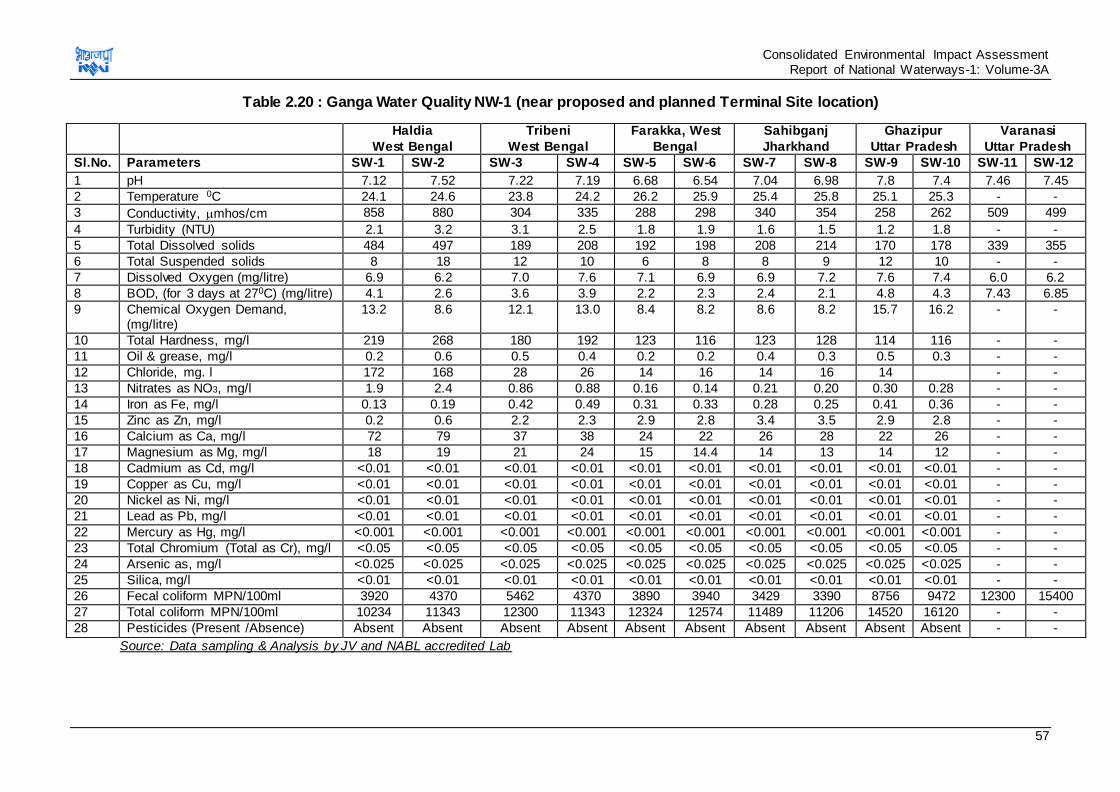
Consolidated Environmental Impact Assessment Report of National Waterways-1: Volume-3A
57
Table 2.20 : Ganga Water Quality NW-1 (near proposed and planned Terminal Site location)
Source: Data sampling & Analysis by JV and NABL accredited Lab
Haldia
West Bengal
Tribeni
West Bengal
Farakka, West
Bengal
Sahibganj
Jharkhand
Ghazipur
Uttar Pradesh
Varanasi
Uttar Pradesh
Sl.No. Parameters SW-1 SW-2 SW-3 SW-4 SW-5 SW-6 SW-7 SW-8 SW-9 SW-10 SW-11 SW-12
1 pH 7.12 7.52 7.22 7.19 6.68 6.54 7.04 6.98 7.8 7.4 7.46 7.45
2 Temperature 0C 24.1 24.6 23.8 24.2 26.2 25.9 25.4 25.8 25.1 25.3 - -
3 Conductivity, mhos/cm 858 880 304 335 288 298 340 354 258 262 509 499
4 Turbidity (NTU) 2.1 3.2 3.1 2.5 1.8 1.9 1.6 1.5 1.2 1.8 - -
5 Total Dissolved solids 484 497 189 208 192 198 208 214 170 178 339 355
6 Total Suspended solids 8 18 12 10 6 8 8 9 12 10 - -
7 Dissolved Oxygen (mg/litre) 6.9 6.2 7.0 7.6 7.1 6.9 6.9 7.2 7.6 7.4 6.0 6.2
8 BOD, (for 3 days at 270C) (mg/litre) 4.1 2.6 3.6 3.9 2.2 2.3 2.4 2.1 4.8 4.3 7.43 6.85
9 Chemical Oxygen Demand, (mg/litre)
13.2 8.6 12.1 13.0 8.4 8.2 8.6 8.2 15.7 16.2 - -
10 Total Hardness, mg/l 219 268 180 192 123 116 123 128 114 116 - -
11 Oil & grease, mg/l 0.2 0.6 0.5 0.4 0.2 0.2 0.4 0.3 0.5 0.3 - -
12 Chloride, mg. l 172 168 28 26 14 16 14 16 14 - -
13 Nitrates as NO3, mg/l 1.9 2.4 0.86 0.88 0.16 0.14 0.21 0.20 0.30 0.28 - -
14 Iron as Fe, mg/l 0.13 0.19 0.42 0.49 0.31 0.33 0.28 0.25 0.41 0.36 - -
15 Zinc as Zn, mg/l 0.2 0.6 2.2 2.3 2.9 2.8 3.4 3.5 2.9 2.8 - -
16 Calcium as Ca, mg/l 72 79 37 38 24 22 26 28 22 26 - -
17 Magnesium as Mg, mg/l 18 19 21 24 15 14.4 14 13 14 12 - -
18 Cadmium as Cd, mg/l <0.01 <0.01 <0.01 <0.01 <0.01 <0.01 <0.01 <0.01 <0.01 <0.01 - -
19 Copper as Cu, mg/l <0.01 <0.01 <0.01 <0.01 <0.01 <0.01 <0.01 <0.01 <0.01 <0.01 - -
20 Nickel as Ni, mg/l <0.01 <0.01 <0.01 <0.01 <0.01 <0.01 <0.01 <0.01 <0.01 <0.01 - -
21 Lead as Pb, mg/l <0.01 <0.01 <0.01 <0.01 <0.01 <0.01 <0.01 <0.01 <0.01 <0.01 - -
22 Mercury as Hg, mg/l <0.001 <0.001 <0.001 <0.001 <0.001 <0.001 <0.001 <0.001 <0.001 <0.001 - -
23 Total Chromium (Total as Cr), mg/l <0.05 <0.05 <0.05 <0.05 <0.05 <0.05 <0.05 <0.05 <0.05 <0.05 - -
24 Arsenic as, mg/l <0.025 <0.025 <0.025 <0.025 <0.025 <0.025 <0.025 <0.025 <0.025 <0.025 - -
25 Silica, mg/l <0.01 <0.01 <0.01 <0.01 <0.01 <0.01 <0.01 <0.01 <0.01 <0.01 - -
26 Fecal coliform MPN/100ml 3920 4370 5462 4370 3890 3940 3429 3390 8756 9472 12300 15400
27 Total coliform MPN/100ml 10234 11343 12300 11343 12324 12574 11489 11206 14520 16120 - -
28 Pesticides (Present /Absence) Absent Absent Absent Absent Absent Absent Absent Absent Absent Absent - -
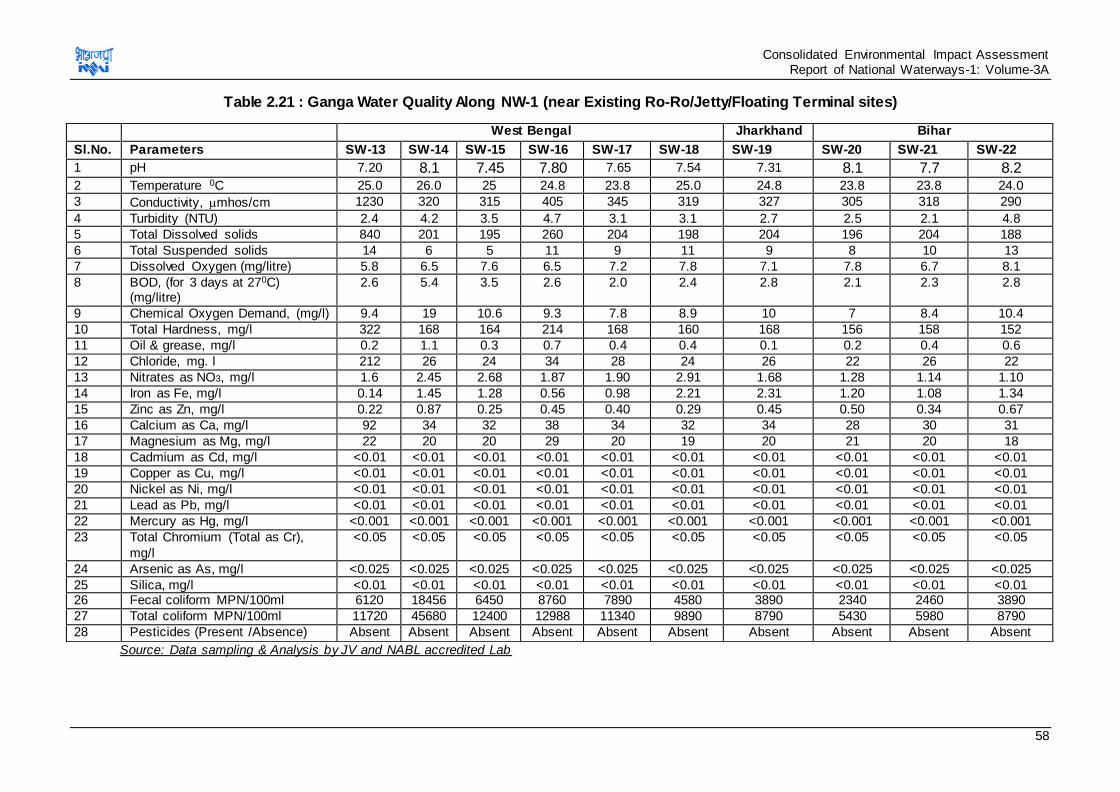
Consolidated Environmental Impact Assessment Report of National Waterways-1: Volume-3A
58
Table 2.21 : Ganga Water Quality Along NW-1 (near Existing Ro-Ro/Jetty/Floating Terminal sites)
Source: Data sampling & Analysis by JV and NABL accredited Lab
West Bengal Jharkhand Bihar
Sl.No. Parameters SW-13 SW-14 SW-15 SW-16 SW-17 SW-18 SW-19 SW-20 SW-21 SW-22
1 pH 7.20 8.1 7.45 7.80 7.65 7.54 7.31 8.1 7.7 8.2 2 Temperature 0C 25.0 26.0 25 24.8 23.8 25.0 24.8 23.8 23.8 24.0
3 Conductivity, mhos/cm 1230 320 315 405 345 319 327 305 318 290
4 Turbidity (NTU) 2.4 4.2 3.5 4.7 3.1 3.1 2.7 2.5 2.1 4.8
5 Total Dissolved solids 840 201 195 260 204 198 204 196 204 188
6 Total Suspended solids 14 6 5 11 9 11 9 8 10 13
7 Dissolved Oxygen (mg/litre) 5.8 6.5 7.6 6.5 7.2 7.8 7.1 7.8 6.7 8.1
8 BOD, (for 3 days at 270C) (mg/litre)
2.6 5.4 3.5 2.6 2.0 2.4 2.8 2.1 2.3 2.8
9 Chemical Oxygen Demand, (mg/l) 9.4 19 10.6 9.3 7.8 8.9 10 7 8.4 10.4
10 Total Hardness, mg/l 322 168 164 214 168 160 168 156 158 152
11 Oil & grease, mg/l 0.2 1.1 0.3 0.7 0.4 0.4 0.1 0.2 0.4 0.6
12 Chloride, mg. l 212 26 24 34 28 24 26 22 26 22
13 Nitrates as NO3, mg/l 1.6 2.45 2.68 1.87 1.90 2.91 1.68 1.28 1.14 1.10
14 Iron as Fe, mg/l 0.14 1.45 1.28 0.56 0.98 2.21 2.31 1.20 1.08 1.34
15 Zinc as Zn, mg/l 0.22 0.87 0.25 0.45 0.40 0.29 0.45 0.50 0.34 0.67
16 Calcium as Ca, mg/l 92 34 32 38 34 32 34 28 30 31
17 Magnesium as Mg, mg/l 22 20 20 29 20 19 20 21 20 18
18 Cadmium as Cd, mg/l <0.01 <0.01 <0.01 <0.01 <0.01 <0.01 <0.01 <0.01 <0.01 <0.01
19 Copper as Cu, mg/l <0.01 <0.01 <0.01 <0.01 <0.01 <0.01 <0.01 <0.01 <0.01 <0.01
20 Nickel as Ni, mg/l <0.01 <0.01 <0.01 <0.01 <0.01 <0.01 <0.01 <0.01 <0.01 <0.01
21 Lead as Pb, mg/l <0.01 <0.01 <0.01 <0.01 <0.01 <0.01 <0.01 <0.01 <0.01 <0.01
22 Mercury as Hg, mg/l <0.001 <0.001 <0.001 <0.001 <0.001 <0.001 <0.001 <0.001 <0.001 <0.001
23 Total Chromium (Total as Cr),
mg/l
<0.05 <0.05 <0.05 <0.05 <0.05 <0.05 <0.05 <0.05 <0.05 <0.05
24 Arsenic as As, mg/l <0.025 <0.025 <0.025 <0.025 <0.025 <0.025 <0.025 <0.025 <0.025 <0.025
25 Silica, mg/l <0.01 <0.01 <0.01 <0.01 <0.01 <0.01 <0.01 <0.01 <0.01 <0.01 26 Fecal coliform MPN/100ml 6120 18456 6450 8760 7890 4580 3890 2340 2460 3890
27 Total coliform MPN/100ml 11720 45680 12400 12988 11340 9890 8790 5430 5980 8790
28 Pesticides (Present /Absence) Absent Absent Absent Absent Absent Absent Absent Absent Absent Absent
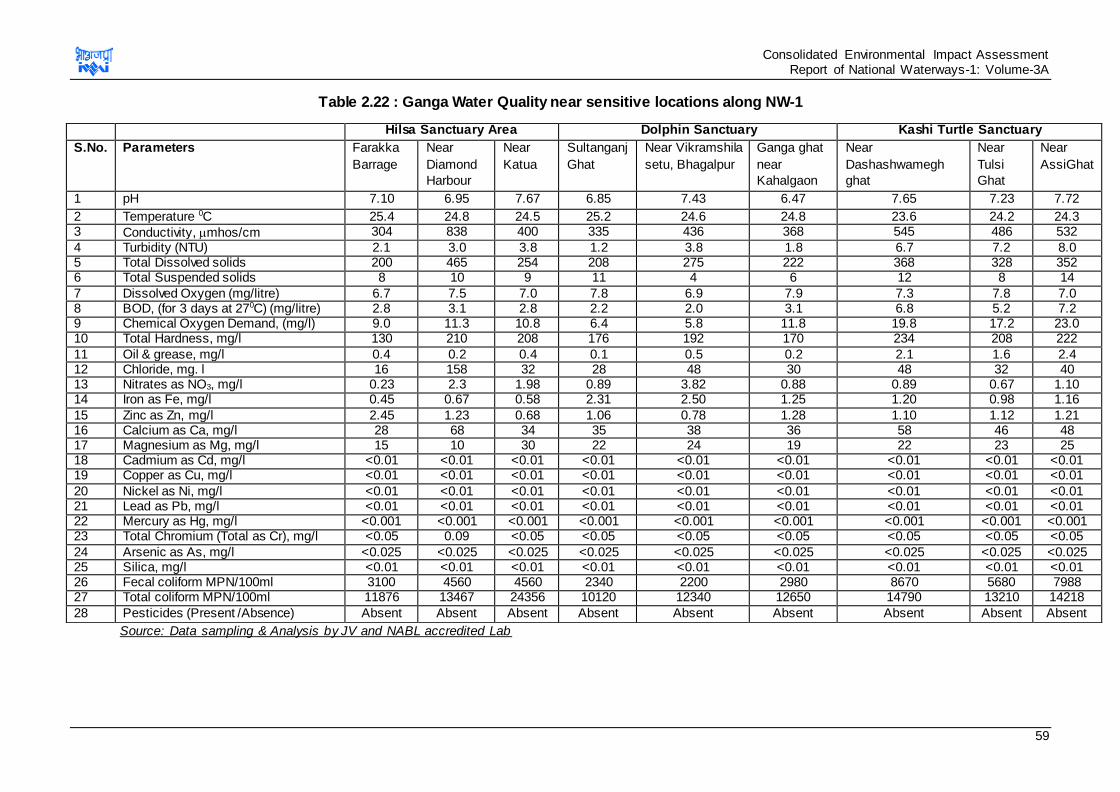
Consolidated Environmental Impact Assessment Report of National Waterways-1: Volume-3A
59
Table 2.22 : Ganga Water Quality near sensitive locations along NW-1
Source: Data sampling & Analysis by JV and NABL accredited Lab
Hilsa Sanctuary Area Dolphin Sanctuary Kashi Turtle Sanctuary
S.No. Parameters Farakka
Barrage
Near
Diamond
Harbour
Near
Katua
Sultanganj
Ghat
Near Vikramshila
setu, Bhagalpur
Ganga ghat
near
Kahalgaon
Near
Dashashwamegh
ghat
Near
Tulsi
Ghat
Near
AssiGhat
1 pH 7.10 6.95 7.67 6.85 7.43 6.47 7.65 7.23 7.72
2 Temperature 0C 25.4 24.8 24.5 25.2 24.6 24.8 23.6 24.2 24.3 3 Conductivity, mhos/cm 304 838 400 335 436 368 545 486 532
4 Turbidity (NTU) 2.1 3.0 3.8 1.2 3.8 1.8 6.7 7.2 8.0 5 Total Dissolved solids 200 465 254 208 275 222 368 328 352 6 Total Suspended solids 8 10 9 11 4 6 12 8 14
7 Dissolved Oxygen (mg/litre) 6.7 7.5 7.0 7.8 6.9 7.9 7.3 7.8 7.0 8 BOD, (for 3 days at 270C) (mg/litre) 2.8 3.1 2.8 2.2 2.0 3.1 6.8 5.2 7.2 9 Chemical Oxygen Demand, (mg/l) 9.0 11.3 10.8 6.4 5.8 11.8 19.8 17.2 23.0 10 Total Hardness, mg/l 130 210 208 176 192 170 234 208 222
11 Oil & grease, mg/l 0.4 0.2 0.4 0.1 0.5 0.2 2.1 1.6 2.4 12 Chloride, mg. l 16 158 32 28 48 30 48 32 40 13 Nitrates as NO3, mg/l 0.23 2.3 1.98 0.89 3.82 0.88 0.89 0.67 1.10 14 Iron as Fe, mg/l 0.45 0.67 0.58 2.31 2.50 1.25 1.20 0.98 1.16
15 Zinc as Zn, mg/l 2.45 1.23 0.68 1.06 0.78 1.28 1.10 1.12 1.21 16 Calcium as Ca, mg/l 28 68 34 35 38 36 58 46 48 17 Magnesium as Mg, mg/l 15 10 30 22 24 19 22 23 25 18 Cadmium as Cd, mg/l <0.01 <0.01 <0.01 <0.01 <0.01 <0.01 <0.01 <0.01 <0.01 19 Copper as Cu, mg/l <0.01 <0.01 <0.01 <0.01 <0.01 <0.01 <0.01 <0.01 <0.01
20 Nickel as Ni, mg/l <0.01 <0.01 <0.01 <0.01 <0.01 <0.01 <0.01 <0.01 <0.01 21 Lead as Pb, mg/l <0.01 <0.01 <0.01 <0.01 <0.01 <0.01 <0.01 <0.01 <0.01 22 Mercury as Hg, mg/l <0.001 <0.001 <0.001 <0.001 <0.001 <0.001 <0.001 <0.001 <0.001 23 Total Chromium (Total as Cr), mg/l <0.05 0.09 <0.05 <0.05 <0.05 <0.05 <0.05 <0.05 <0.05
24 Arsenic as As, mg/l <0.025 <0.025 <0.025 <0.025 <0.025 <0.025 <0.025 <0.025 <0.025 25 Silica, mg/l <0.01 <0.01 <0.01 <0.01 <0.01 <0.01 <0.01 <0.01 <0.01 26 Fecal coliform MPN/100ml 3100 4560 4560 2340 2200 2980 8670 5680 7988 27 Total coliform MPN/100ml 11876 13467 24356 10120 12340 12650 14790 13210 14218
28 Pesticides (Present /Absence) Absent Absent Absent Absent Absent Absent Absent Absent Absent
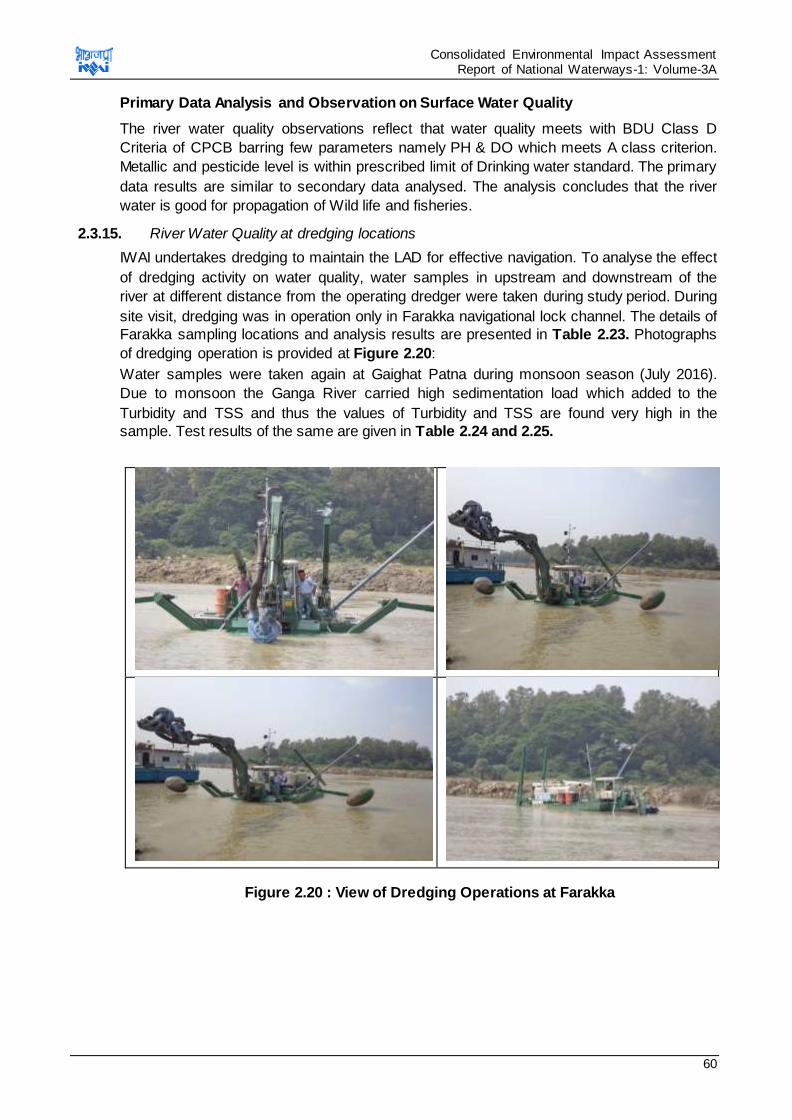
Consolidated Environmental Impact Assessment Report of National Waterways-1: Volume-3A
60
Primary Data Analysis and Observation on Surface Water Quality
The river water quality observations reflect that water quality meets with BDU Class D
Criteria of CPCB barring few parameters namely PH & DO which meets A class criterion.
Metallic and pesticide level is within prescribed limit of Drinking water standard. The primary
data results are similar to secondary data analysed. The analysis concludes that the river
water is good for propagation of Wild life and fisheries.
2.3.15. River Water Quality at dredging locations
IWAI undertakes dredging to maintain the LAD for effective navigation. To analyse the effect
of dredging activity on water quality, water samples in upstream and downstream of the
river at different distance from the operating dredger were taken during study period. During
site visit, dredging was in operation only in Farakka navigational lock channel. The details of
Farakka sampling locations and analysis results are presented in Table 2.23. Photographs
of dredging operation is provided at Figure 2.20:
Water samples were taken again at Gaighat Patna during monsoon season (July 2016).
Due to monsoon the Ganga River carried high sedimentation load which added to the
Turbidity and TSS and thus the values of Turbidity and TSS are found very high in the
sample. Test results of the same are given in Table 2.24 and 2.25.
Figure 2.20 : View of Dredging Operations at Farakka
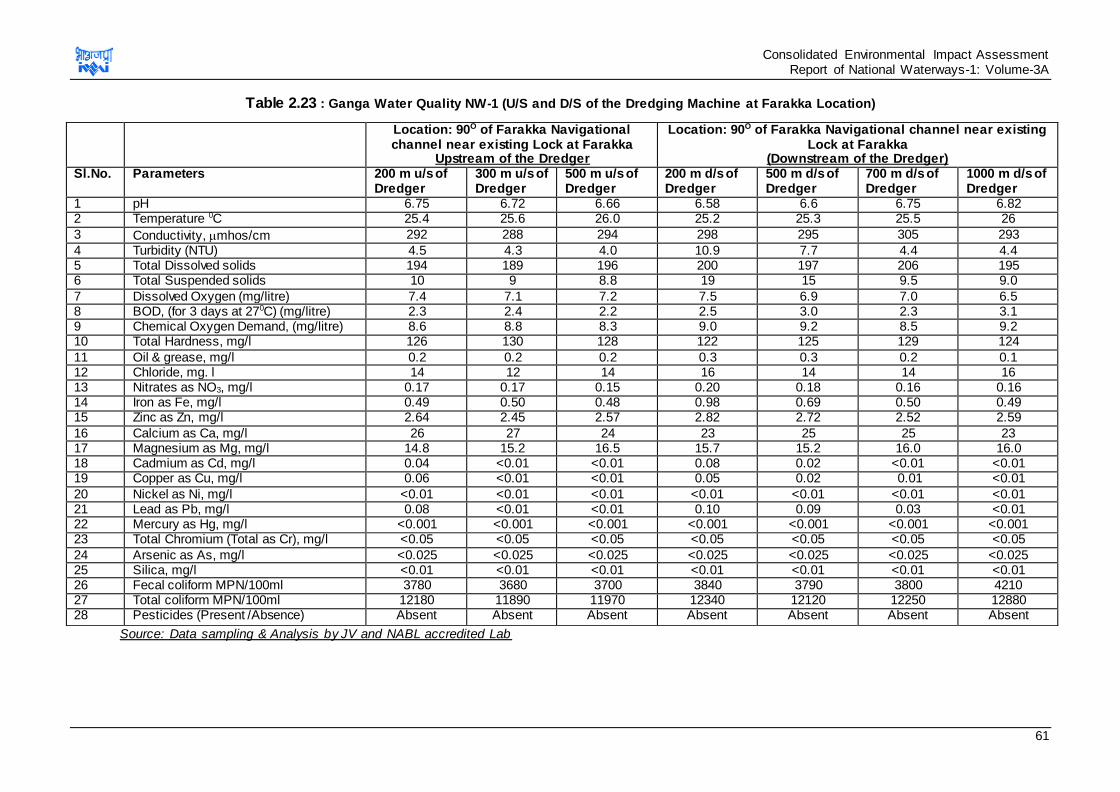
Consolidated Environmental Impact Assessment Report of National Waterways-1: Volume-3A
61
Table 2.23 : Ganga Water Quality NW-1 (U/S and D/S of the Dredging Machine at Farakka Location)
Source: Data sampling & Analysis by JV and NABL accredited Lab
Location: 90O of Farakka Navigational channel near existing Lock at Farakka
Upstream of the Dredger
Location: 90O of Farakka Navigational channel near existing Lock at Farakka
(Downstream of the Dredger) Sl.No. Parameters 200 m u/s of
Dredger 300 m u/s of Dredger
500 m u/s of Dredger
200 m d/s of Dredger
500 m d/s of Dredger
700 m d/s of Dredger
1000 m d/s of Dredger
1 pH 6.75 6.72 6.66 6.58 6.6 6.75 6.82 2 Temperature 0C 25.4 25.6 26.0 25.2 25.3 25.5 26
3 Conductivity, mhos/cm 292 288 294 298 295 305 293
4 Turbidity (NTU) 4.5 4.3 4.0 10.9 7.7 4.4 4.4 5 Total Dissolved solids 194 189 196 200 197 206 195 6 Total Suspended solids 10 9 8.8 19 15 9.5 9.0
7 Dissolved Oxygen (mg/litre) 7.4 7.1 7.2 7.5 6.9 7.0 6.5 8 BOD, (for 3 days at 270C) (mg/litre) 2.3 2.4 2.2 2.5 3.0 2.3 3.1 9 Chemical Oxygen Demand, (mg/litre) 8.6 8.8 8.3 9.0 9.2 8.5 9.2 10 Total Hardness, mg/l 126 130 128 122 125 129 124
11 Oil & grease, mg/l 0.2 0.2 0.2 0.3 0.3 0.2 0.1 12 Chloride, mg. l 14 12 14 16 14 14 16 13 Nitrates as NO3, mg/l 0.17 0.17 0.15 0.20 0.18 0.16 0.16 14 Iron as Fe, mg/l 0.49 0.50 0.48 0.98 0.69 0.50 0.49 15 Zinc as Zn, mg/l 2.64 2.45 2.57 2.82 2.72 2.52 2.59
16 Calcium as Ca, mg/l 26 27 24 23 25 25 23 17 Magnesium as Mg, mg/l 14.8 15.2 16.5 15.7 15.2 16.0 16.0 18 Cadmium as Cd, mg/l 0.04 <0.01 <0.01 0.08 0.02 <0.01 <0.01 19 Copper as Cu, mg/l 0.06 <0.01 <0.01 0.05 0.02 0.01 <0.01
20 Nickel as Ni, mg/l <0.01 <0.01 <0.01 <0.01 <0.01 <0.01 <0.01 21 Lead as Pb, mg/l 0.08 <0.01 <0.01 0.10 0.09 0.03 <0.01 22 Mercury as Hg, mg/l <0.001 <0.001 <0.001 <0.001 <0.001 <0.001 <0.001 23 Total Chromium (Total as Cr), mg/l <0.05 <0.05 <0.05 <0.05 <0.05 <0.05 <0.05
24 Arsenic as As, mg/l <0.025 <0.025 <0.025 <0.025 <0.025 <0.025 <0.025 25 Silica, mg/l <0.01 <0.01 <0.01 <0.01 <0.01 <0.01 <0.01 26 Fecal coliform MPN/100ml 3780 3680 3700 3840 3790 3800 4210 27 Total coliform MPN/100ml 12180 11890 11970 12340 12120 12250 12880 28 Pesticides (Present /Absence) Absent Absent Absent Absent Absent Absent Absent
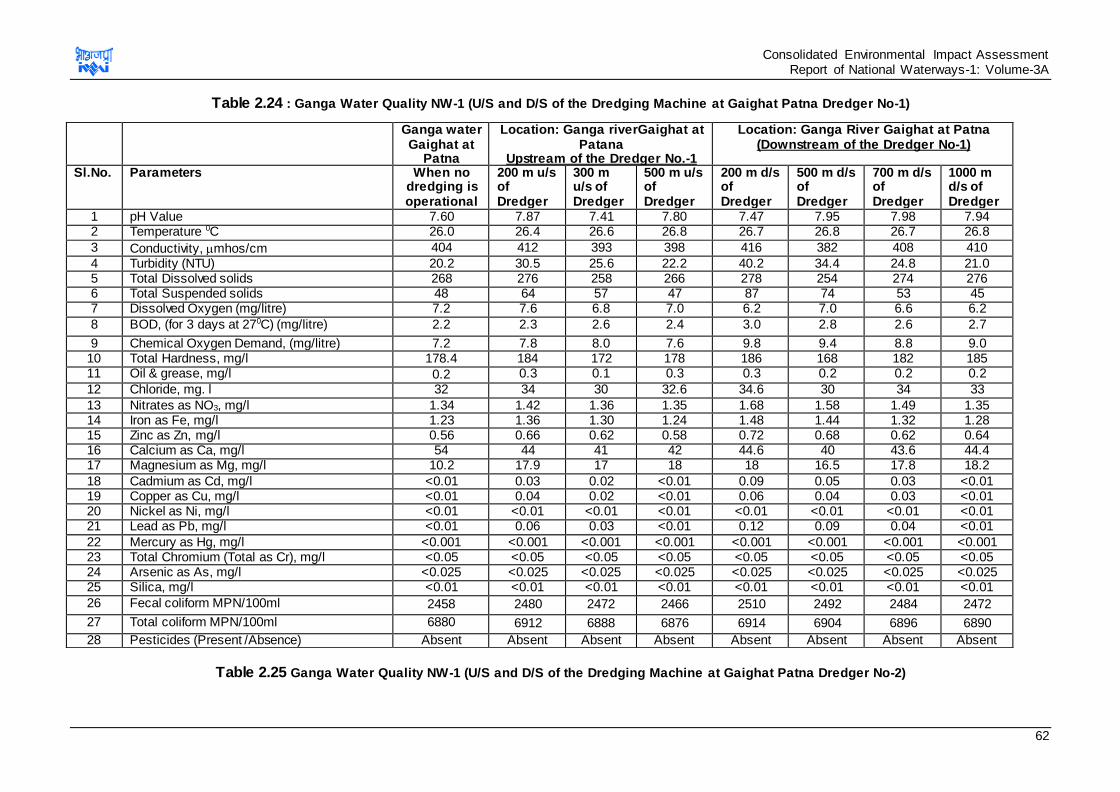
Consolidated Environmental Impact Assessment Report of National Waterways-1: Volume-3A
62
Table 2.24 : Ganga Water Quality NW-1 (U/S and D/S of the Dredging Machine at Gaighat Patna Dredger No-1)
Table 2.25 Ganga Water Quality NW-1 (U/S and D/S of the Dredging Machine at Gaighat Patna Dredger No-2)
Ganga water Gaighat at
Patna
Location: Ganga riverGaighat at Patana
Upstream of the Dredger No.-1
Location: Ganga River Gaighat at Patna (Downstream of the Dredger No-1)
Sl.No. Parameters When no dredging is operational
200 m u/s of Dredger
300 m u/s of Dredger
500 m u/s of Dredger
200 m d/s of Dredger
500 m d/s of Dredger
700 m d/s of Dredger
1000 m d/s of Dredger
1 pH Value 7.60 7.87 7.41 7.80 7.47 7.95 7.98 7.94 2 Temperature 0C 26.0 26.4 26.6 26.8 26.7 26.8 26.7 26.8
3 Conductivity, mhos/cm 404 412 393 398 416 382 408 410
4 Turbidity (NTU) 20.2 30.5 25.6 22.2 40.2 34.4 24.8 21.0 5 Total Dissolved solids 268 276 258 266 278 254 274 276 6 Total Suspended solids 48 64 57 47 87 74 53 45 7 Dissolved Oxygen (mg/litre) 7.2 7.6 6.8 7.0 6.2 7.0 6.6 6.2
8 BOD, (for 3 days at 270C) (mg/litre) 2.2 2.3 2.6 2.4 3.0 2.8 2.6 2.7
9 Chemical Oxygen Demand, (mg/litre) 7.2 7.8 8.0 7.6 9.8 9.4 8.8 9.0 10 Total Hardness, mg/l 178.4 184 172 178 186 168 182 185 11 Oil & grease, mg/l 0.2 0.3 0.1 0.3 0.3 0.2 0.2 0.2
12 Chloride, mg. l 32 34 30 32.6 34.6 30 34 33
13 Nitrates as NO3, mg/l 1.34 1.42 1.36 1.35 1.68 1.58 1.49 1.35 14 Iron as Fe, mg/l 1.23 1.36 1.30 1.24 1.48 1.44 1.32 1.28 15 Zinc as Zn, mg/l 0.56 0.66 0.62 0.58 0.72 0.68 0.62 0.64 16 Calcium as Ca, mg/l 54 44 41 42 44.6 40 43.6 44.4 17 Magnesium as Mg, mg/l 10.2 17.9 17 18 18 16.5 17.8 18.2
18 Cadmium as Cd, mg/l <0.01 0.03 0.02 <0.01 0.09 0.05 0.03 <0.01 19 Copper as Cu, mg/l <0.01 0.04 0.02 <0.01 0.06 0.04 0.03 <0.01 20 Nickel as Ni, mg/l <0.01 <0.01 <0.01 <0.01 <0.01 <0.01 <0.01 <0.01 21 Lead as Pb, mg/l <0.01 0.06 0.03 <0.01 0.12 0.09 0.04 <0.01
22 Mercury as Hg, mg/l <0.001 <0.001 <0.001 <0.001 <0.001 <0.001 <0.001 <0.001 23 Total Chromium (Total as Cr), mg/l <0.05 <0.05 <0.05 <0.05 <0.05 <0.05 <0.05 <0.05 24 Arsenic as As, mg/l <0.025 <0.025 <0.025 <0.025 <0.025 <0.025 <0.025 <0.025 25 Silica, mg/l <0.01 <0.01 <0.01 <0.01 <0.01 <0.01 <0.01 <0.01
26 Fecal coliform MPN/100ml 2458 2480 2472 2466 2510 2492 2484 2472
27 Total coliform MPN/100ml 6880 6912 6888 6876 6914 6904 6896 6890
28 Pesticides (Present /Absence) Absent Absent Absent Absent Absent Absent Absent Absent
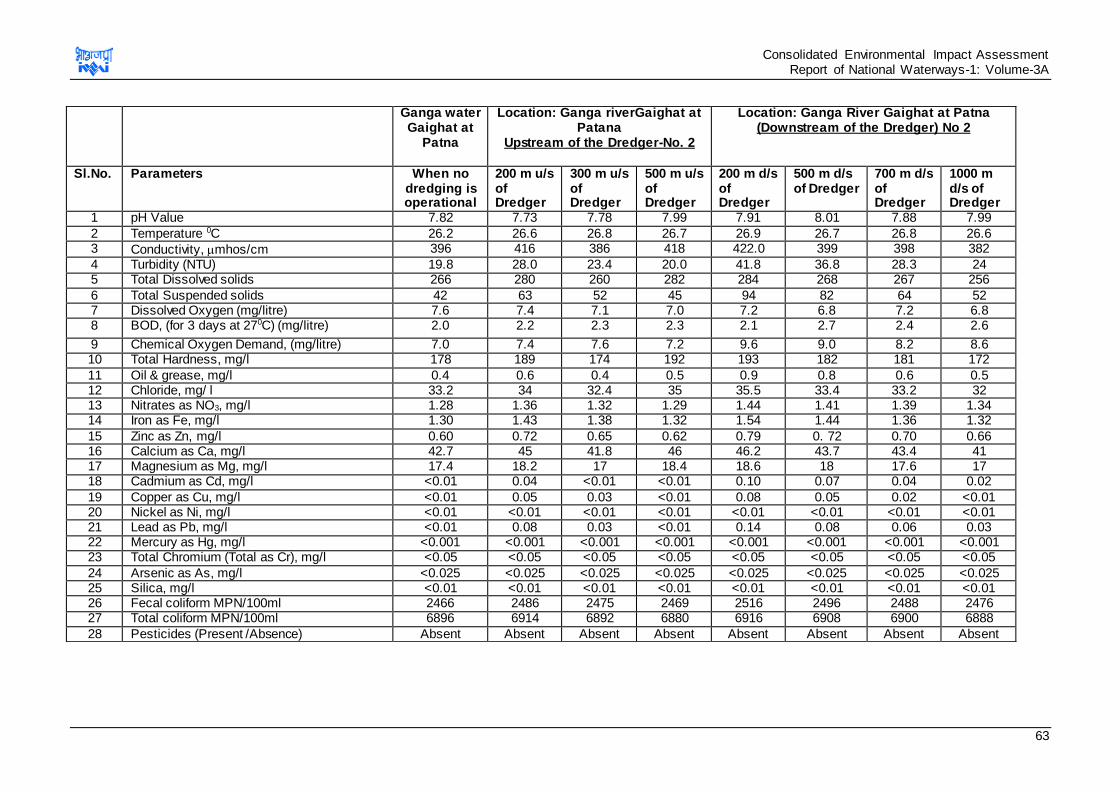
Consolidated Environmental Impact Assessment Report of National Waterways-1: Volume-3A
63
Ganga water Gaighat at
Patna
Location: Ganga riverGaighat at Patana
Upstream of the Dredger-No. 2
Location: Ganga River Gaighat at Patna (Downstream of the Dredger) No 2
Sl.No. Parameters When no dredging is operational
200 m u/s of Dredger
300 m u/s of Dredger
500 m u/s of Dredger
200 m d/s of Dredger
500 m d/s of Dredger
700 m d/s of Dredger
1000 m d/s of Dredger
1 pH Value 7.82 7.73 7.78 7.99 7.91 8.01 7.88 7.99
2 Temperature 0C 26.2 26.6 26.8 26.7 26.9 26.7 26.8 26.6 3 Conductivity, mhos/cm 396 416 386 418 422.0 399 398 382
4 Turbidity (NTU) 19.8 28.0 23.4 20.0 41.8 36.8 28.3 24 5 Total Dissolved solids 266 280 260 282 284 268 267 256
6 Total Suspended solids 42 63 52 45 94 82 64 52 7 Dissolved Oxygen (mg/litre) 7.6 7.4 7.1 7.0 7.2 6.8 7.2 6.8 8 BOD, (for 3 days at 270C) (mg/litre) 2.0 2.2 2.3 2.3 2.1 2.7 2.4 2.6
9 Chemical Oxygen Demand, (mg/litre) 7.0 7.4 7.6 7.2 9.6 9.0 8.2 8.6 10 Total Hardness, mg/l 178 189 174 192 193 182 181 172
11 Oil & grease, mg/l 0.4 0.6 0.4 0.5 0.9 0.8 0.6 0.5 12 Chloride, mg/ l 33.2 34 32.4 35 35.5 33.4 33.2 32 13 Nitrates as NO3, mg/l 1.28 1.36 1.32 1.29 1.44 1.41 1.39 1.34 14 Iron as Fe, mg/l 1.30 1.43 1.38 1.32 1.54 1.44 1.36 1.32
15 Zinc as Zn, mg/l 0.60 0.72 0.65 0.62 0.79 0. 72 0.70 0.66 16 Calcium as Ca, mg/l 42.7 45 41.8 46 46.2 43.7 43.4 41 17 Magnesium as Mg, mg/l 17.4 18.2 17 18.4 18.6 18 17.6 17 18 Cadmium as Cd, mg/l <0.01 0.04 <0.01 <0.01 0.10 0.07 0.04 0.02
19 Copper as Cu, mg/l <0.01 0.05 0.03 <0.01 0.08 0.05 0.02 <0.01 20 Nickel as Ni, mg/l <0.01 <0.01 <0.01 <0.01 <0.01 <0.01 <0.01 <0.01 21 Lead as Pb, mg/l <0.01 0.08 0.03 <0.01 0.14 0.08 0.06 0.03 22 Mercury as Hg, mg/l <0.001 <0.001 <0.001 <0.001 <0.001 <0.001 <0.001 <0.001 23 Total Chromium (Total as Cr), mg/l <0.05 <0.05 <0.05 <0.05 <0.05 <0.05 <0.05 <0.05
24 Arsenic as As, mg/l <0.025 <0.025 <0.025 <0.025 <0.025 <0.025 <0.025 <0.025 25 Silica, mg/l <0.01 <0.01 <0.01 <0.01 <0.01 <0.01 <0.01 <0.01 26 Fecal coliform MPN/100ml 2466 2486 2475 2469 2516 2496 2488 2476 27 Total coliform MPN/100ml 6896 6914 6892 6880 6916 6908 6900 6888
28 Pesticides (Present /Absence) Absent Absent Absent Absent Absent Absent Absent Absent
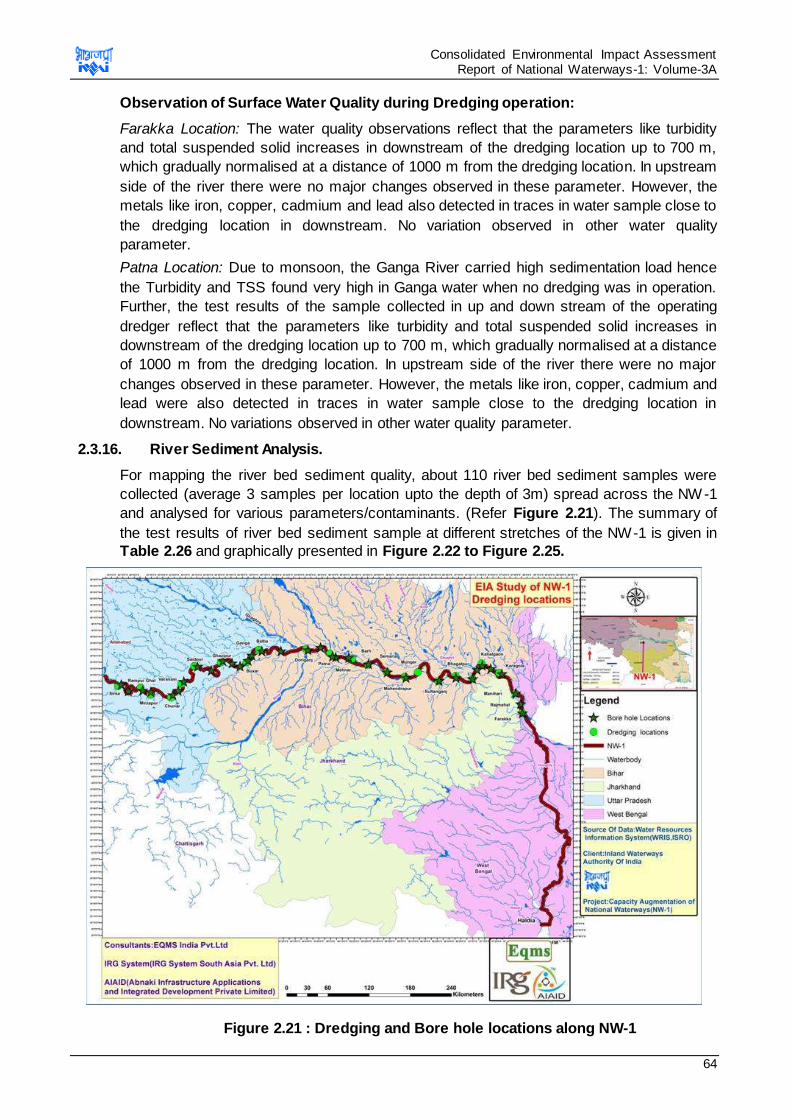
Consolidated Environmental Impact Assessment Report of National Waterways-1: Volume-3A
64
Observation of Surface Water Quality during Dredging operation:
Farakka Location: The water quality observations reflect that the parameters like turbidity
and total suspended solid increases in downstream of the dredging location up to 700 m,
which gradually normalised at a distance of 1000 m from the dredging location. In upstream
side of the river there were no major changes observed in these parameter. However, the
metals like iron, copper, cadmium and lead also detected in traces in water sample close to
the dredging location in downstream. No variation observed in other water quality
parameter.
Patna Location: Due to monsoon, the Ganga River carried high sedimentation load hence
the Turbidity and TSS found very high in Ganga water when no dredging was in operation.
Further, the test results of the sample collected in up and down stream of the operating
dredger reflect that the parameters like turbidity and total suspended solid increases in
downstream of the dredging location up to 700 m, which gradually normalised at a distance
of 1000 m from the dredging location. In upstream side of the river there were no major
changes observed in these parameter. However, the metals like iron, copper, cadmium and
lead were also detected in traces in water sample close to the dredging location in
downstream. No variations observed in other water quality parameter.
2.3.16. River Sediment Analysis.
For mapping the river bed sediment quality, about 110 river bed sediment samples were
collected (average 3 samples per location upto the depth of 3m) spread across the NW -1
and analysed for various parameters/contaminants. (Refer Figure 2.21). The summary of
the test results of river bed sediment sample at different stretches of the NW-1 is given in
Table 2.26 and graphically presented in Figure 2.22 to Figure 2.25.
Figure 2.21 : Dredging and Bore hole locations along NW-1
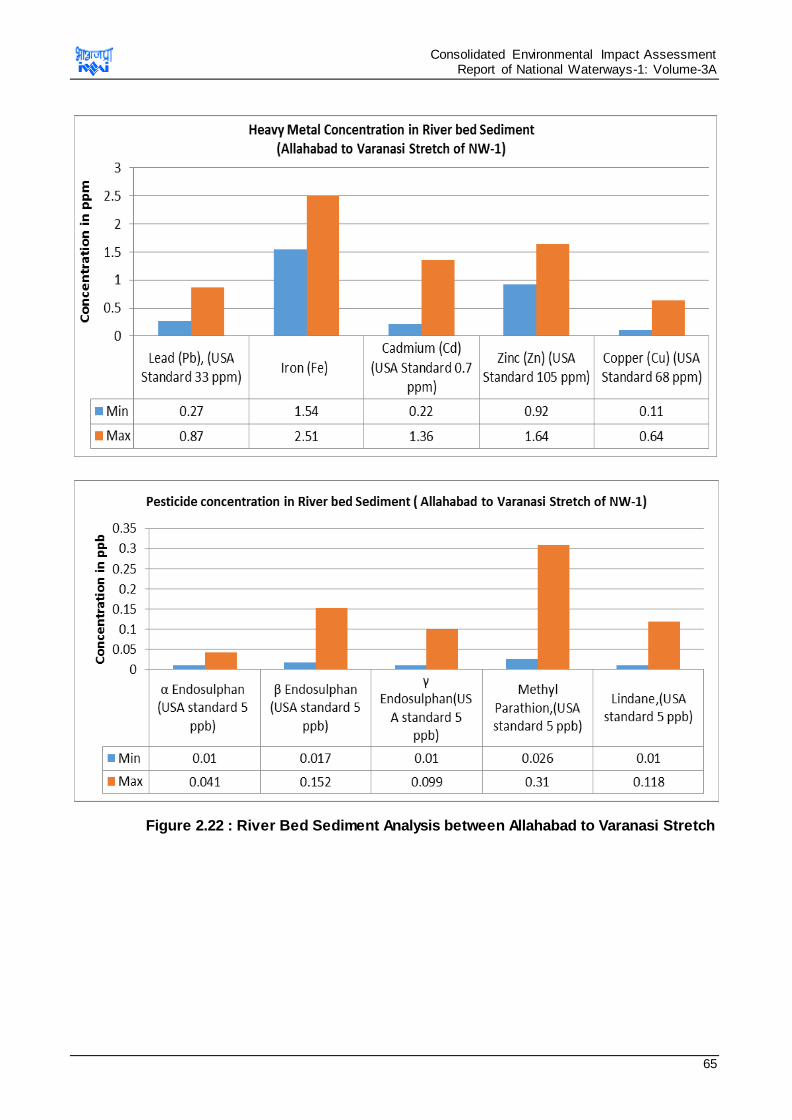
Consolidated Environmental Impact Assessment Report of National Waterways-1: Volume-3A
65
Figure 2.22 : River Bed Sediment Analysis between Allahabad to Varanasi Stretch
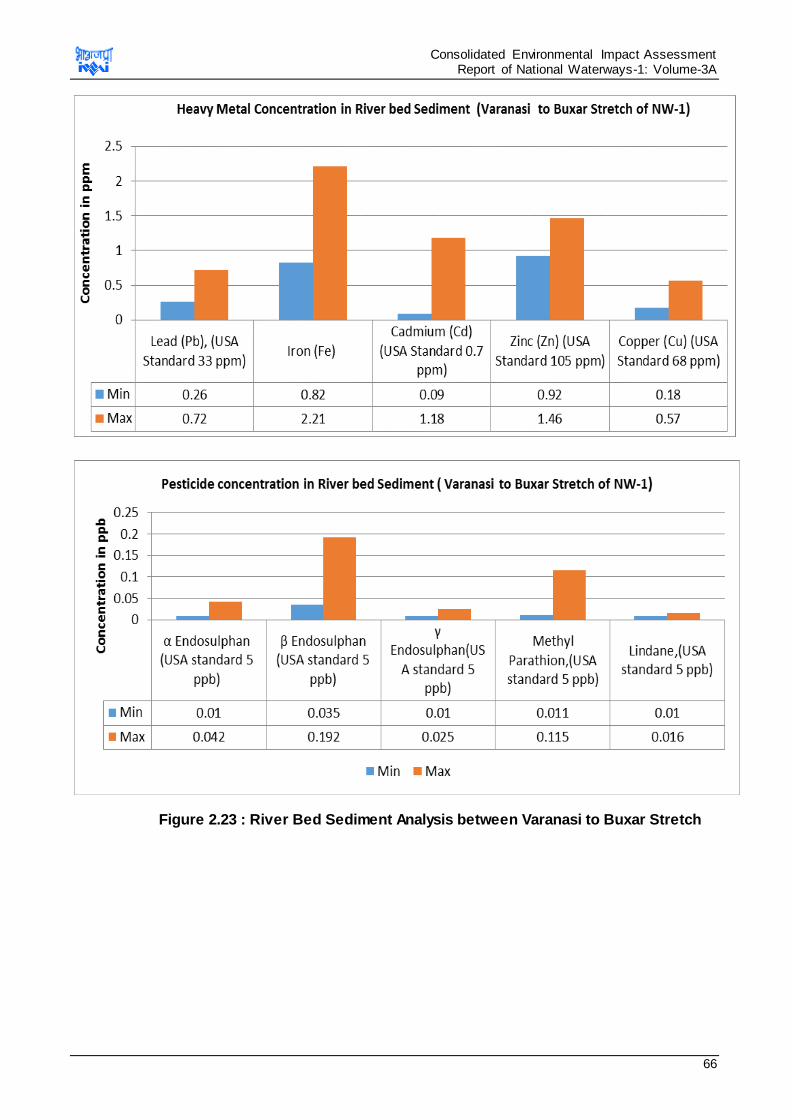
Consolidated Environmental Impact Assessment Report of National Waterways-1: Volume-3A
66
Figure 2.23 : River Bed Sediment Analysis between Varanasi to Buxar Stretch
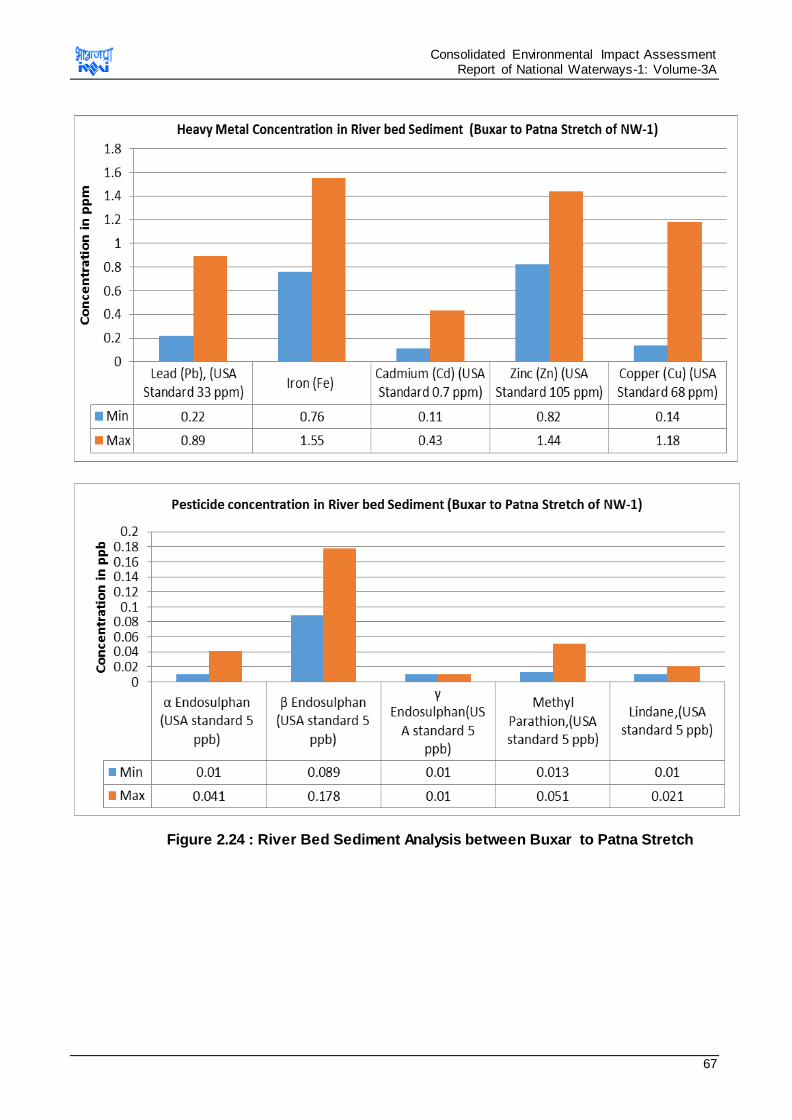
Consolidated Environmental Impact Assessment Report of National Waterways-1: Volume-3A
67
Figure 2.24 : River Bed Sediment Analysis between Buxar to Patna Stretch
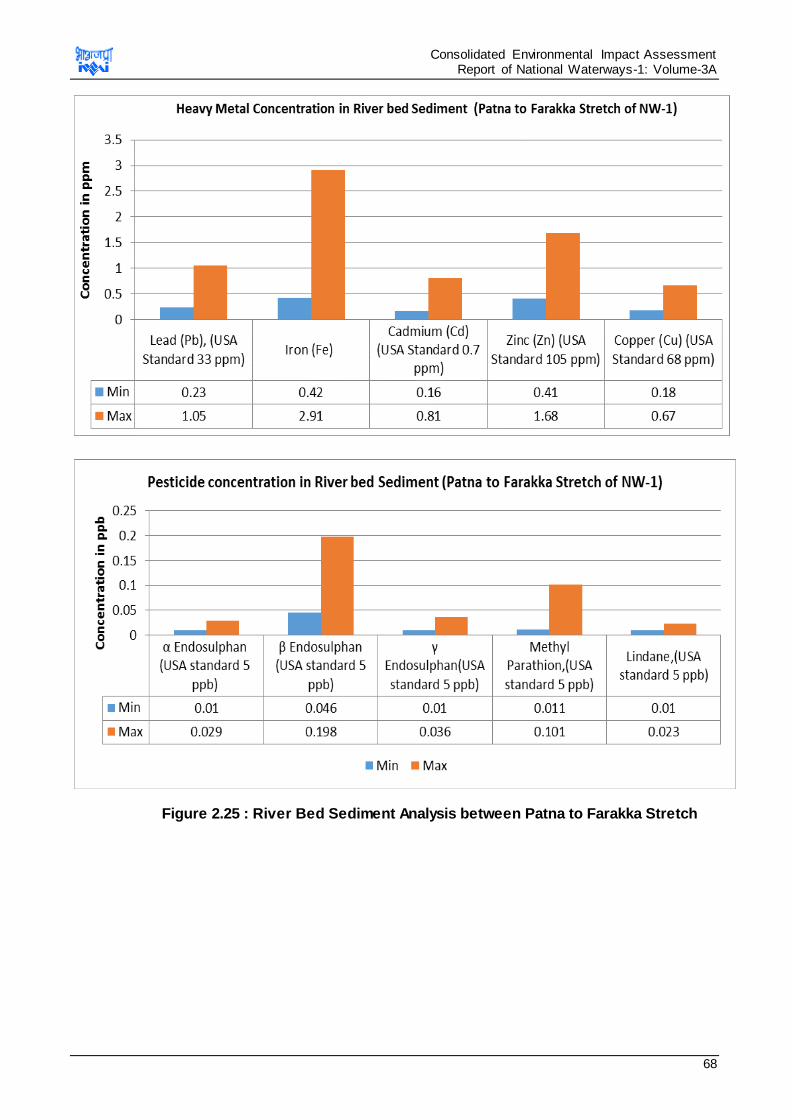
Consolidated Environmental Impact Assessment Report of National Waterways-1: Volume-3A
68
Figure 2.25 : River Bed Sediment Analysis between Patna to Farakka Stretch
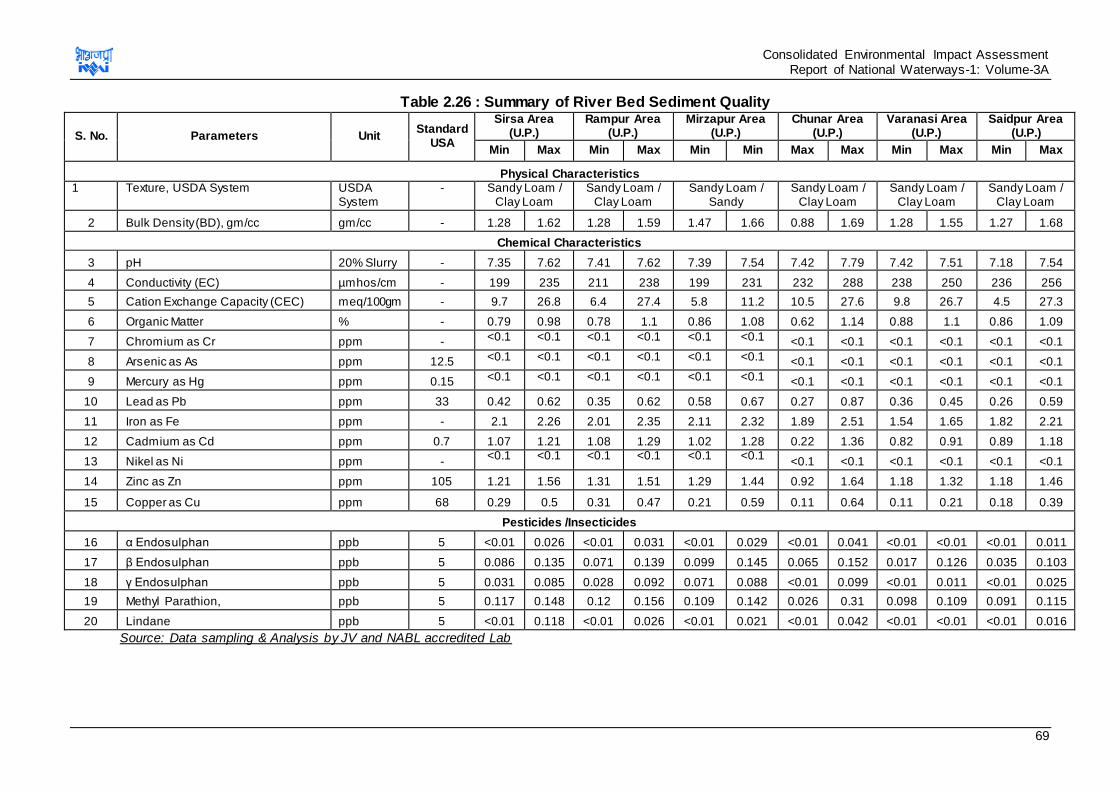
Consolidated Environmental Impact Assessment Report of National Waterways-1: Volume-3A
69
Table 2.26 : Summary of River Bed Sediment Quality
S. No. Parameters Unit Standard
USA
Sirsa Area (U.P.)
Rampur Area (U.P.)
Mirzapur Area (U.P.)
Chunar Area (U.P.)
Varanasi Area (U.P.)
Saidpur Area (U.P.)
Min Max Min Max Min Min Max Max Min Max Min Max
Physical Characteristics 1 Texture, USDA System USDA
System - Sandy Loam /
Clay Loam Sandy Loam /
Clay Loam Sandy Loam /
Sandy Sandy Loam /
Clay Loam Sandy Loam /
Clay Loam Sandy Loam /
Clay Loam
2 Bulk Density (BD), gm/cc gm/cc - 1.28 1.62 1.28 1.59 1.47 1.66 0.88 1.69 1.28 1.55 1.27 1.68
Chemical Characteristics
3 pH 20% Slurry - 7.35 7.62 7.41 7.62 7.39 7.54 7.42 7.79 7.42 7.51 7.18 7.54
4 Conductivity (EC) µmhos/cm - 199 235 211 238 199 231 232 288 238 250 236 256
5 Cation Exchange Capacity (CEC) meq/100gm - 9.7 26.8 6.4 27.4 5.8 11.2 10.5 27.6 9.8 26.7 4.5 27.3
6 Organic Matter % - 0.79 0.98 0.78 1.1 0.86 1.08 0.62 1.14 0.88 1.1 0.86 1.09
7 Chromium as Cr ppm - <0.1 <0.1 <0.1 <0.1 <0.1 <0.1 <0.1 <0.1 <0.1 <0.1 <0.1 <0.1
8 Arsenic as As ppm 12.5 <0.1 <0.1 <0.1 <0.1 <0.1 <0.1 <0.1 <0.1 <0.1 <0.1 <0.1 <0.1
9 Mercury as Hg ppm 0.15 <0.1 <0.1 <0.1 <0.1 <0.1 <0.1 <0.1 <0.1 <0.1 <0.1 <0.1 <0.1
10 Lead as Pb ppm 33 0.42 0.62 0.35 0.62 0.58 0.67 0.27 0.87 0.36 0.45 0.26 0.59
11 Iron as Fe ppm - 2.1 2.26 2.01 2.35 2.11 2.32 1.89 2.51 1.54 1.65 1.82 2.21
12 Cadmium as Cd ppm 0.7 1.07 1.21 1.08 1.29 1.02 1.28 0.22 1.36 0.82 0.91 0.89 1.18
13 Nikel as Ni ppm - <0.1 <0.1 <0.1 <0.1 <0.1 <0.1
<0.1 <0.1 <0.1 <0.1 <0.1 <0.1
14 Zinc as Zn ppm 105 1.21 1.56 1.31 1.51 1.29 1.44 0.92 1.64 1.18 1.32 1.18 1.46
15 Copper as Cu ppm 68 0.29 0.5 0.31 0.47 0.21 0.59 0.11 0.64 0.11 0.21 0.18 0.39
Pesticides /Insecticides
16 α Endosulphan ppb 5 <0.01 0.026 <0.01 0.031 <0.01 0.029 <0.01 0.041 <0.01 <0.01 <0.01 0.011
17 β Endosulphan ppb 5 0.086 0.135 0.071 0.139 0.099 0.145 0.065 0.152 0.017 0.126 0.035 0.103
18 γ Endosulphan ppb 5 0.031 0.085 0.028 0.092 0.071 0.088 <0.01 0.099 <0.01 0.011 <0.01 0.025
19 Methyl Parathion, ppb 5 0.117 0.148 0.12 0.156 0.109 0.142 0.026 0.31 0.098 0.109 0.091 0.115
20 Lindane ppb 5 <0.01 0.118 <0.01 0.026 <0.01 0.021 <0.01 0.042 <0.01 <0.01 <0.01 0.016
Source: Data sampling & Analysis by JV and NABL accredited Lab
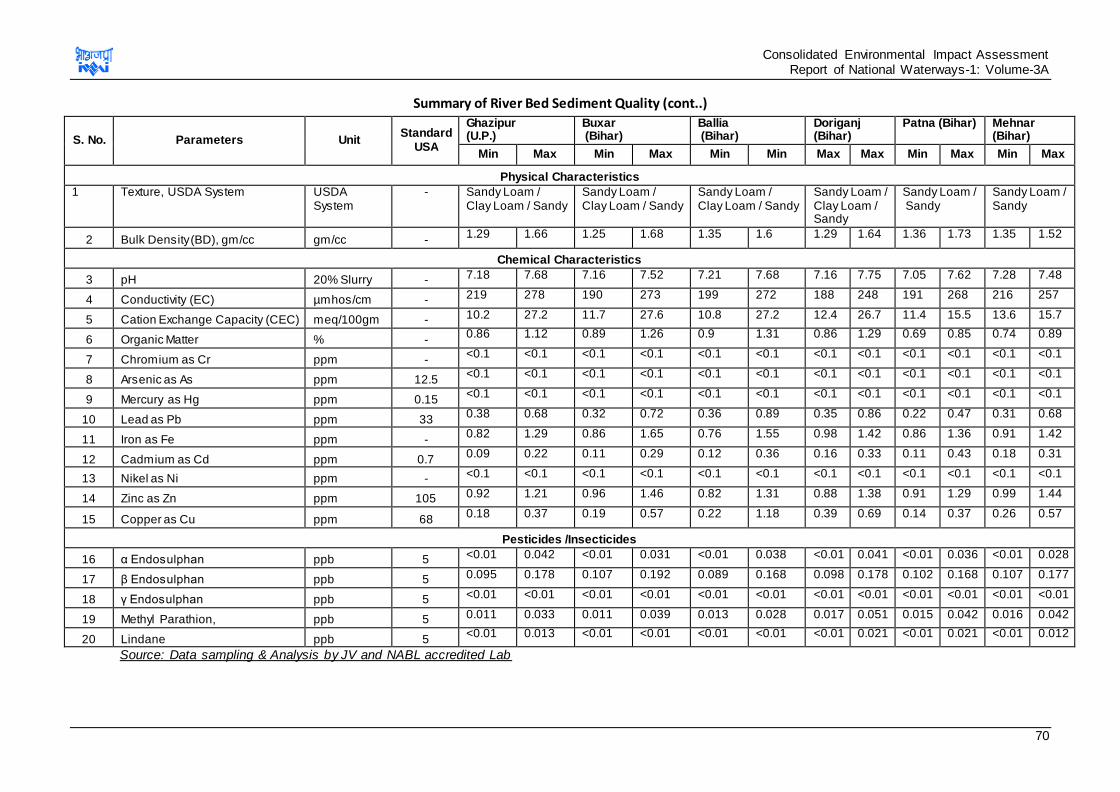
Consolidated Environmental Impact Assessment Report of National Waterways-1: Volume-3A
70
Summary of River Bed Sediment Quality (cont..)
S. No. Parameters Unit Standard
USA
Ghazipur (U.P.)
Buxar (Bihar)
Ballia (Bihar)
Doriganj (Bihar)
Patna (Bihar) Mehnar (Bihar)
Min Max Min Max Min Min Max Max Min Max Min Max
Physical Characteristics
1 Texture, USDA System USDA System
- Sandy Loam / Clay Loam / Sandy
Sandy Loam / Clay Loam / Sandy
Sandy Loam / Clay Loam / Sandy
Sandy Loam / Clay Loam / Sandy
Sandy Loam / Sandy
Sandy Loam / Sandy
2 Bulk Density (BD), gm/cc gm/cc - 1.29 1.66 1.25 1.68 1.35 1.6 1.29 1.64 1.36 1.73 1.35 1.52
Chemical Characteristics
3 pH 20% Slurry - 7.18 7.68 7.16 7.52 7.21 7.68 7.16 7.75 7.05 7.62 7.28 7.48
4 Conductivity (EC) µmhos/cm - 219 278 190 273 199 272 188 248 191 268 216 257
5 Cation Exchange Capacity (CEC) meq/100gm - 10.2 27.2 11.7 27.6 10.8 27.2 12.4 26.7 11.4 15.5 13.6 15.7
6 Organic Matter % - 0.86 1.12 0.89 1.26 0.9 1.31 0.86 1.29 0.69 0.85 0.74 0.89
7 Chromium as Cr ppm - <0.1 <0.1 <0.1 <0.1 <0.1 <0.1 <0.1 <0.1 <0.1 <0.1 <0.1 <0.1
8 Arsenic as As ppm 12.5 <0.1 <0.1 <0.1 <0.1 <0.1 <0.1 <0.1 <0.1 <0.1 <0.1 <0.1 <0.1
9 Mercury as Hg ppm 0.15 <0.1 <0.1 <0.1 <0.1 <0.1 <0.1 <0.1 <0.1 <0.1 <0.1 <0.1 <0.1
10 Lead as Pb ppm 33 0.38 0.68 0.32 0.72 0.36 0.89 0.35 0.86 0.22 0.47 0.31 0.68
11 Iron as Fe ppm - 0.82 1.29 0.86 1.65 0.76 1.55 0.98 1.42 0.86 1.36 0.91 1.42
12 Cadmium as Cd ppm 0.7 0.09 0.22 0.11 0.29 0.12 0.36 0.16 0.33 0.11 0.43 0.18 0.31
13 Nikel as Ni ppm - <0.1 <0.1 <0.1 <0.1 <0.1 <0.1 <0.1 <0.1 <0.1 <0.1 <0.1 <0.1
14 Zinc as Zn ppm 105 0.92 1.21 0.96 1.46 0.82 1.31 0.88 1.38 0.91 1.29 0.99 1.44
15 Copper as Cu ppm 68 0.18 0.37 0.19 0.57 0.22 1.18 0.39 0.69 0.14 0.37 0.26 0.57
Pesticides /Insecticides
16 α Endosulphan ppb 5 <0.01 0.042 <0.01 0.031 <0.01 0.038 <0.01 0.041 <0.01 0.036 <0.01 0.028
17 β Endosulphan ppb 5 0.095 0.178 0.107 0.192 0.089 0.168 0.098 0.178 0.102 0.168 0.107 0.177
18 γ Endosulphan ppb 5 <0.01 <0.01 <0.01 <0.01 <0.01 <0.01 <0.01 <0.01 <0.01 <0.01 <0.01 <0.01
19 Methyl Parathion, ppb 5 0.011 0.033 0.011 0.039 0.013 0.028 0.017 0.051 0.015 0.042 0.016 0.042
20 Lindane ppb 5 <0.01 0.013 <0.01 <0.01 <0.01 <0.01 <0.01 0.021 <0.01 0.021 <0.01 0.012
Source: Data sampling & Analysis by JV and NABL accredited Lab
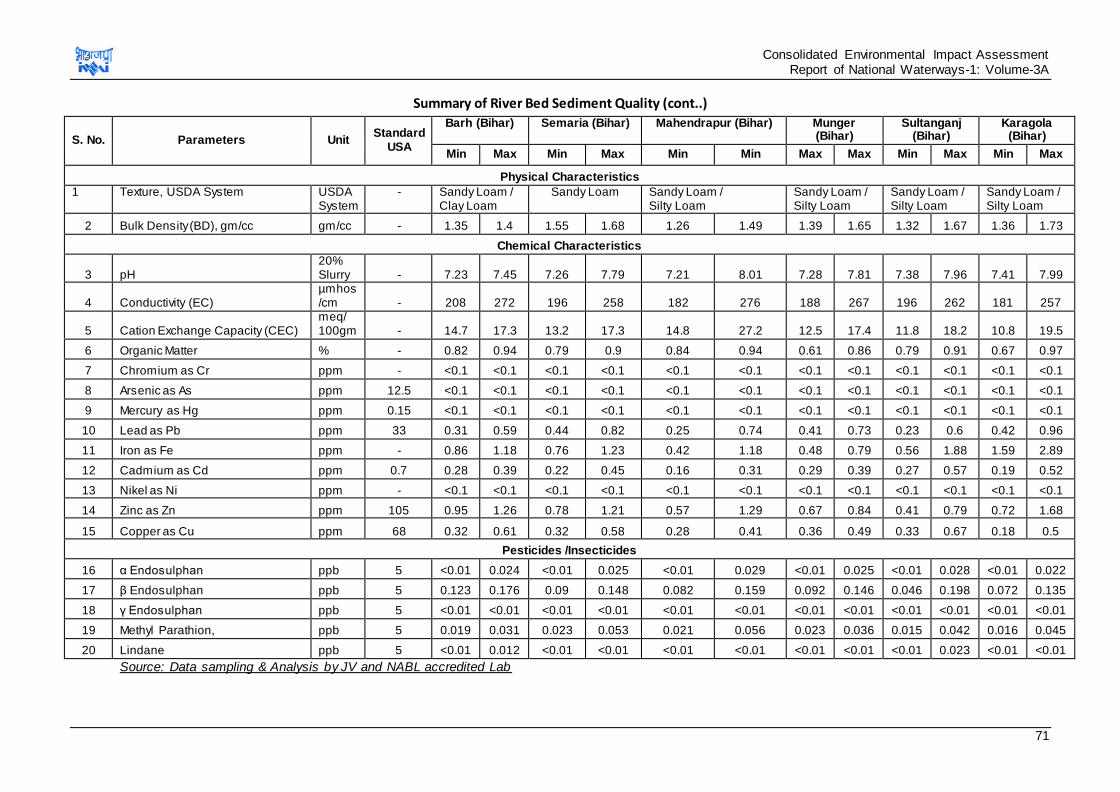
Consolidated Environmental Impact Assessment Report of National Waterways-1: Volume-3A
71
Summary of River Bed Sediment Quality (cont..)
S. No. Parameters Unit Standard
USA
Barh (Bihar) Semaria (Bihar) Mahendrapur (Bihar) Munger (Bihar)
Sultanganj (Bihar)
Karagola (Bihar)
Min Max Min Max Min Min Max Max Min Max Min Max
Physical Characteristics
1 Texture, USDA System USDA System
- Sandy Loam / Clay Loam
Sandy Loam Sandy Loam / Silty Loam
Sandy Loam / Silty Loam
Sandy Loam / Silty Loam
Sandy Loam / Silty Loam
2 Bulk Density (BD), gm/cc gm/cc - 1.35 1.4 1.55 1.68 1.26 1.49 1.39 1.65 1.32 1.67 1.36 1.73
Chemical Characteristics
3 pH 20% Slurry - 7.23 7.45 7.26 7.79 7.21 8.01 7.28 7.81 7.38 7.96 7.41 7.99
4 Conductivity (EC) µmhos /cm - 208 272 196 258 182 276 188 267 196 262 181 257
5 Cation Exchange Capacity (CEC) meq/ 100gm - 14.7 17.3 13.2 17.3 14.8 27.2 12.5 17.4 11.8 18.2 10.8 19.5
6 Organic Matter % - 0.82 0.94 0.79 0.9 0.84 0.94 0.61 0.86 0.79 0.91 0.67 0.97
7 Chromium as Cr ppm - <0.1 <0.1 <0.1 <0.1 <0.1 <0.1 <0.1 <0.1 <0.1 <0.1 <0.1 <0.1
8 Arsenic as As ppm 12.5 <0.1 <0.1 <0.1 <0.1 <0.1 <0.1 <0.1 <0.1 <0.1 <0.1 <0.1 <0.1
9 Mercury as Hg ppm 0.15 <0.1 <0.1 <0.1 <0.1 <0.1 <0.1 <0.1 <0.1 <0.1 <0.1 <0.1 <0.1
10 Lead as Pb ppm 33 0.31 0.59 0.44 0.82 0.25 0.74 0.41 0.73 0.23 0.6 0.42 0.96
11 Iron as Fe ppm - 0.86 1.18 0.76 1.23 0.42 1.18 0.48 0.79 0.56 1.88 1.59 2.89
12 Cadmium as Cd ppm 0.7 0.28 0.39 0.22 0.45 0.16 0.31 0.29 0.39 0.27 0.57 0.19 0.52
13 Nikel as Ni ppm - <0.1 <0.1 <0.1 <0.1 <0.1 <0.1 <0.1 <0.1 <0.1 <0.1 <0.1 <0.1
14 Zinc as Zn ppm 105 0.95 1.26 0.78 1.21 0.57 1.29 0.67 0.84 0.41 0.79 0.72 1.68
15 Copper as Cu ppm 68 0.32 0.61 0.32 0.58 0.28 0.41 0.36 0.49 0.33 0.67 0.18 0.5
Pesticides /Insecticides
16 α Endosulphan ppb 5 <0.01 0.024 <0.01 0.025 <0.01 0.029 <0.01 0.025 <0.01 0.028 <0.01 0.022
17 β Endosulphan ppb 5 0.123 0.176 0.09 0.148 0.082 0.159 0.092 0.146 0.046 0.198 0.072 0.135
18 γ Endosulphan ppb 5 <0.01 <0.01 <0.01 <0.01 <0.01 <0.01 <0.01 <0.01 <0.01 <0.01 <0.01 <0.01
19 Methyl Parathion, ppb 5 0.019 0.031 0.023 0.053 0.021 0.056 0.023 0.036 0.015 0.042 0.016 0.045
20 Lindane ppb 5 <0.01 0.012 <0.01 <0.01 <0.01 <0.01 <0.01 <0.01 <0.01 0.023 <0.01 <0.01
Source: Data sampling & Analysis by JV and NABL accredited Lab
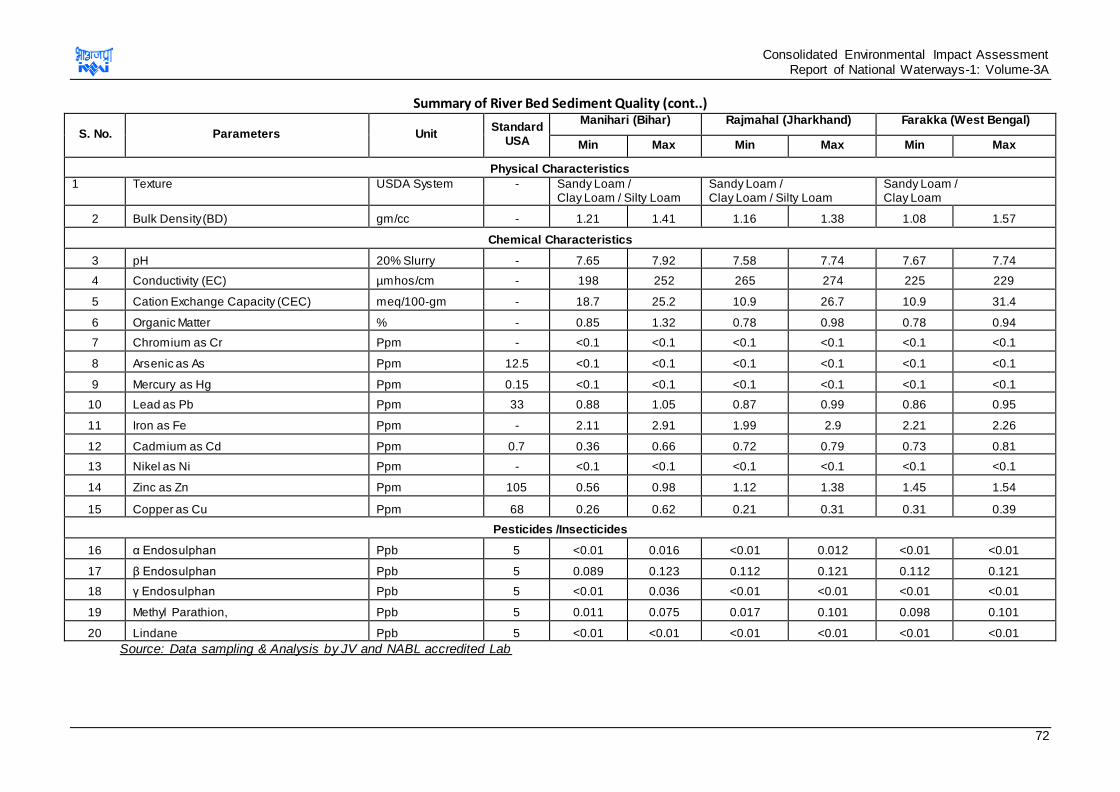
Consolidated Environmental Impact Assessment Report of National Waterways-1: Volume-3A
72
Summary of River Bed Sediment Quality (cont..)
S. No. Parameters Unit Standard
USA
Manihari (Bihar) Rajmahal (Jharkhand) Farakka (West Bengal)
Min Max Min Max Min Max
Physical Characteristics
1 Texture USDA System - Sandy Loam / Clay Loam / Silty Loam
Sandy Loam / Clay Loam / Silty Loam
Sandy Loam / Clay Loam
2 Bulk Density (BD) gm/cc - 1.21 1.41 1.16 1.38 1.08 1.57
Chemical Characteristics
3 pH 20% Slurry - 7.65 7.92 7.58 7.74 7.67 7.74
4 Conductivity (EC) µmhos/cm - 198 252 265 274 225 229
5 Cation Exchange Capacity (CEC) meq/100-gm - 18.7 25.2 10.9 26.7 10.9 31.4
6 Organic Matter % - 0.85 1.32 0.78 0.98 0.78 0.94
7 Chromium as Cr Ppm - <0.1 <0.1 <0.1 <0.1 <0.1 <0.1
8 Arsenic as As Ppm 12.5 <0.1 <0.1 <0.1 <0.1 <0.1 <0.1
9 Mercury as Hg Ppm 0.15 <0.1 <0.1 <0.1 <0.1 <0.1 <0.1
10 Lead as Pb Ppm 33 0.88 1.05 0.87 0.99 0.86 0.95
11 Iron as Fe Ppm - 2.11 2.91 1.99 2.9 2.21 2.26
12 Cadmium as Cd Ppm 0.7 0.36 0.66 0.72 0.79 0.73 0.81
13 Nikel as Ni Ppm - <0.1 <0.1 <0.1 <0.1 <0.1 <0.1
14 Zinc as Zn Ppm 105 0.56 0.98 1.12 1.38 1.45 1.54
15 Copper as Cu Ppm 68 0.26 0.62 0.21 0.31 0.31 0.39
Pesticides /Insecticides
16 α Endosulphan Ppb 5 <0.01 0.016 <0.01 0.012 <0.01 <0.01
17 β Endosulphan Ppb 5 0.089 0.123 0.112 0.121 0.112 0.121
18 γ Endosulphan Ppb 5 <0.01 0.036 <0.01 <0.01 <0.01 <0.01
19 Methyl Parathion, Ppb 5 0.011 0.075 0.017 0.101 0.098 0.101
20 Lindane Ppb 5 <0.01 <0.01 <0.01 <0.01 <0.01 <0.01
Source: Data sampling & Analysis by JV and NABL accredited Lab
Consolidated Environmental Impact Assessment Report of National Waterways-1: Volume-3A
73
Observations on River Bed-Dredge Material Quality
The concentration level of heavy metal was found low in concentration and within
acceptable limit as per standard (Criteria for Off-Shore Dumping of Dredged Material, USA)
except cadmium, which is slightly above the USA standard at some location in UP stretch
that may be due to industrial effluent discharge in this section. Pesticide concentration in all
sample were found far below the USA criteria. The pesticides presence is on expected line
as these are predominantly usedfor various agriculture applications. The source of these
pesticide parathion and endosulphan might be from indiscriminate applications of
insecticides and pesticides for agriculture.
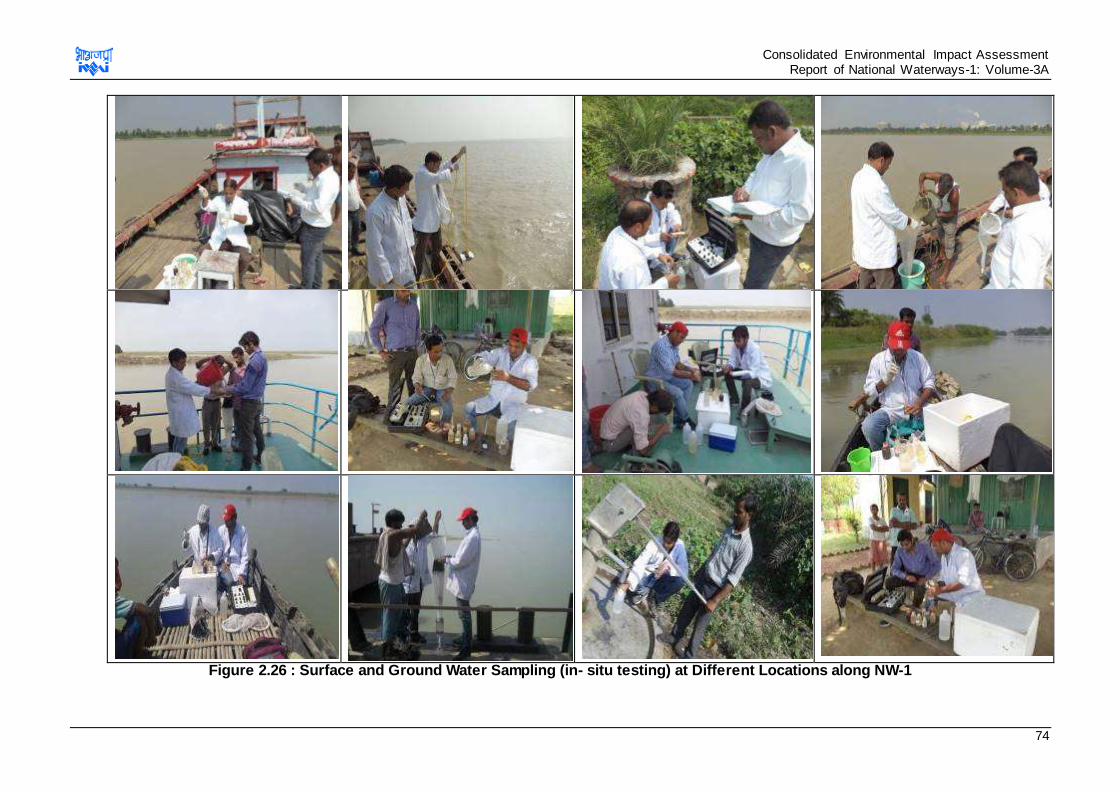
Consolidated Environmental Impact Assessment Report of National Waterways-1: Volume-3A
74
Figure 2.26 : Surface and Ground Water Sampling (in- situ testing) at Different Locations along NW-1
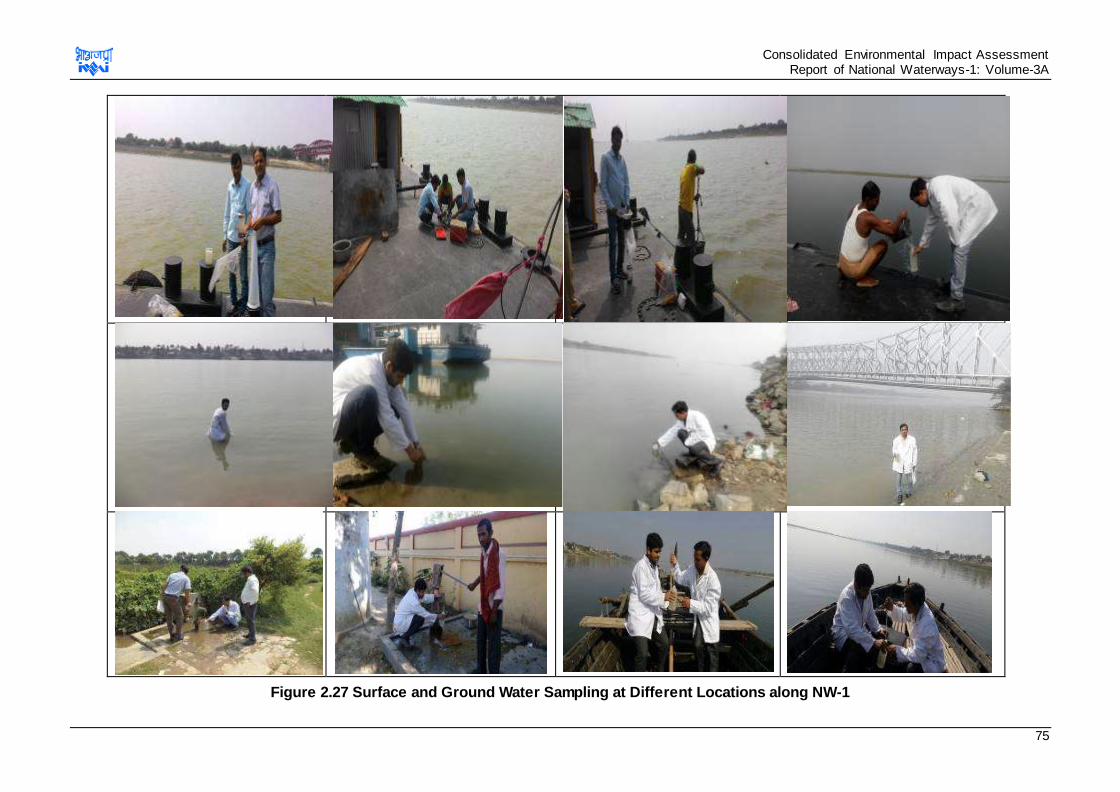
Consolidated Environmental Impact Assessment Report of National Waterways-1: Volume-3A
75
Figure 2.27 Surface and Ground Water Sampling at Different Locations along NW-1
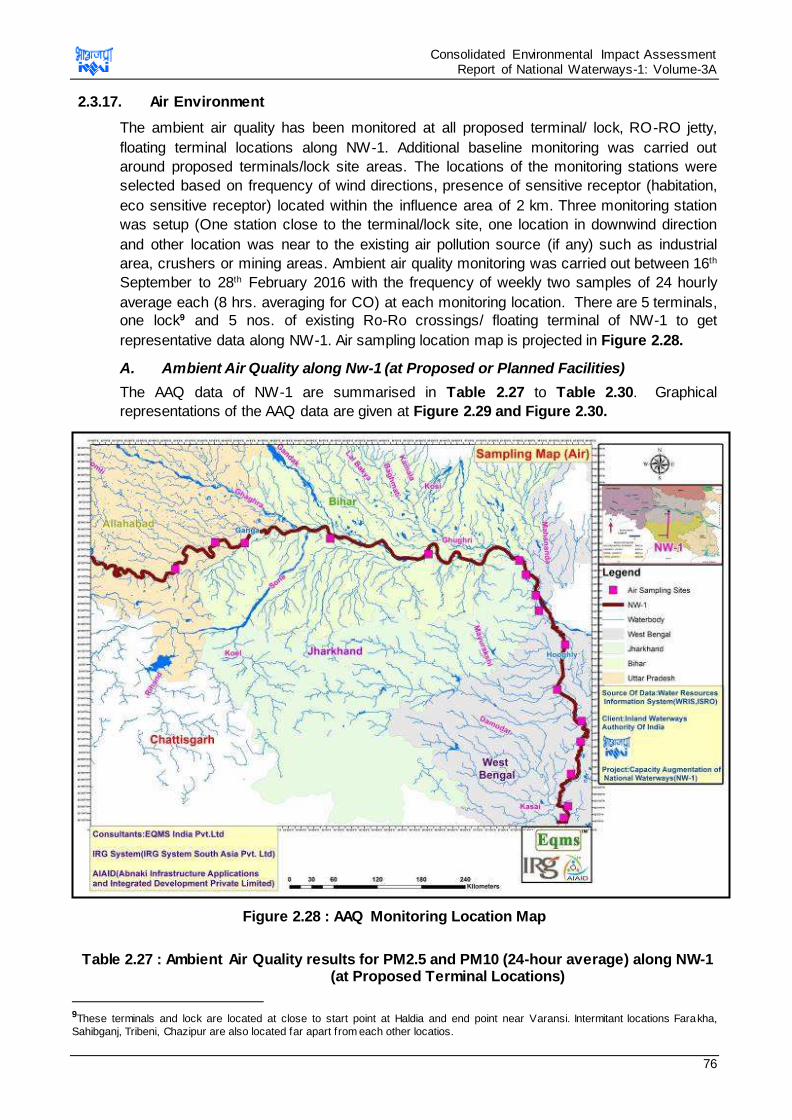
Consolidated Environmental Impact Assessment Report of National Waterways-1: Volume-3A
76
2.3.17. Air Environment
The ambient air quality has been monitored at all proposed terminal/ lock, RO-RO jetty,
floating terminal locations along NW-1. Additional baseline monitoring was carried out
around proposed terminals/lock site areas. The locations of the monitoring stations were
selected based on frequency of wind directions, presence of sensitive receptor (habitation,
eco sensitive receptor) located within the influence area of 2 km. Three monitoring station
was setup (One station close to the terminal/lock site, one location in downwind direction
and other location was near to the existing air pollution source (if any) such as industrial
area, crushers or mining areas. Ambient air quality monitoring was carried out between 16th
September to 28th February 2016 with the frequency of weekly two samples of 24 hourly
average each (8 hrs. averaging for CO) at each monitoring location. There are 5 terminals,
one lock9 and 5 nos. of existing Ro-Ro crossings/ floating terminal of NW-1 to get
representative data along NW-1. Air sampling location map is projected in Figure 2.28.
A. Ambient Air Quality along Nw-1 (at Proposed or Planned Facilities)
The AAQ data of NW-1 are summarised in Table 2.27 to Table 2.30. Graphical
representations of the AAQ data are given at Figure 2.29 and Figure 2.30.
Figure 2.28 : AAQ Monitoring Location Map
Table 2.27 : Ambient Air Quality results for PM2.5 and PM10 (24-hour average) along NW-1
(at Proposed Terminal Locations)
9These terminals and lock are located at close to start point at Haldia and end point near Varansi. Intermitant locations Farakha,
Sahibganj, Tribeni, Chazipur are also located far apart from each other locatios.
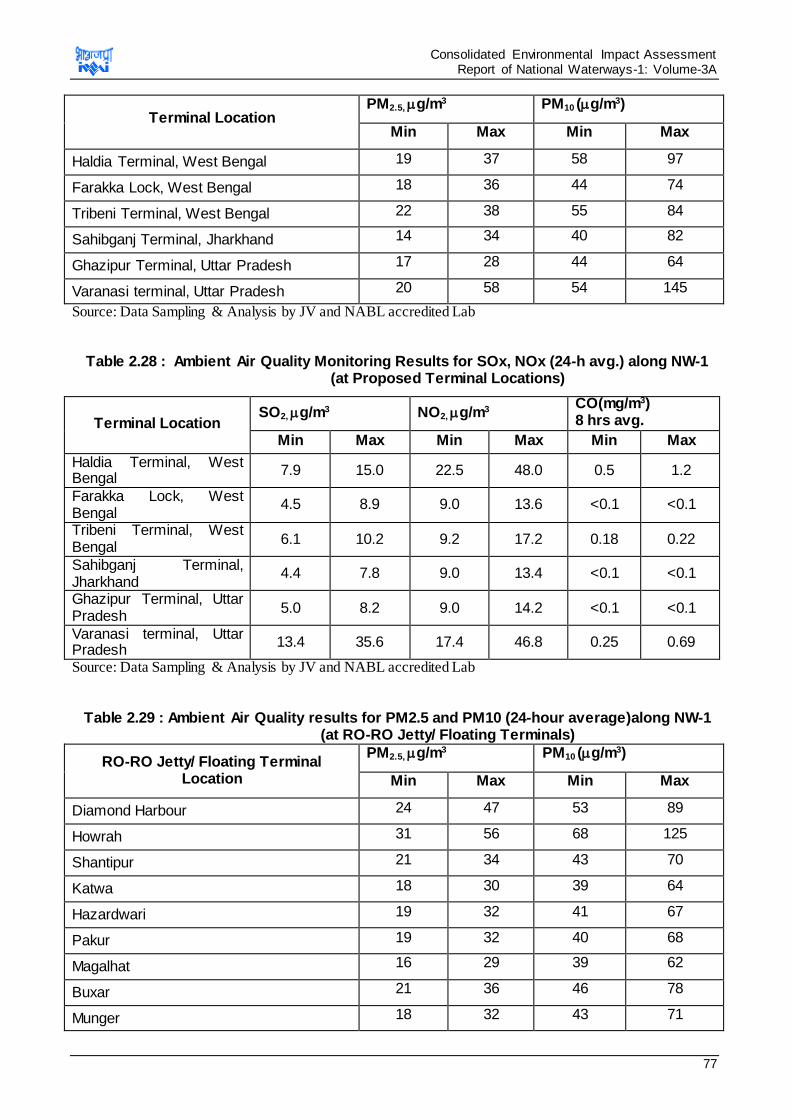
Consolidated Environmental Impact Assessment Report of National Waterways-1: Volume-3A
77
Terminal Location PM2.5, g/m3 PM10 (g/m3)
Min Max Min Max
Haldia Terminal, West Bengal 19 37 58 97
Farakka Lock, West Bengal 18 36 44 74
Tribeni Terminal, West Bengal 22 38 55 84
Sahibganj Terminal, Jharkhand 14 34 40 82
Ghazipur Terminal, Uttar Pradesh 17 28 44 64
Varanasi terminal, Uttar Pradesh 20 58 54 145
Source: Data Sampling & Analysis by JV and NABL accredited Lab
Table 2.28 : Ambient Air Quality Monitoring Results for SOx, NOx (24-h avg.) along NW-1 (at Proposed Terminal Locations)
Terminal Location SO2, g/m3 NO2, g/m3
CO(mg/m3) 8 hrs avg.
Min Max Min Max Min Max
Haldia Terminal, West Bengal
7.9 15.0 22.5 48.0 0.5 1.2
Farakka Lock, West Bengal
4.5 8.9 9.0 13.6 <0.1 <0.1
Tribeni Terminal, West Bengal
6.1 10.2 9.2 17.2 0.18 0.22
Sahibganj Terminal, Jharkhand
4.4 7.8 9.0 13.4 <0.1 <0.1
Ghazipur Terminal, Uttar Pradesh
5.0 8.2 9.0 14.2 <0.1 <0.1
Varanasi terminal, Uttar Pradesh
13.4 35.6 17.4 46.8 0.25 0.69
Source: Data Sampling & Analysis by JV and NABL accredited Lab
Table 2.29 : Ambient Air Quality results for PM2.5 and PM10 (24-hour average)along NW-1 (at RO-RO Jetty/ Floating Terminals)
RO-RO Jetty/ Floating Terminal Location
PM2.5, g/m3 PM10 (g/m3)
Min Max Min Max
Diamond Harbour 24 47 53 89
Howrah 31 56 68 125
Shantipur 21 34 43 70
Katwa 18 30 39 64
Hazardwari 19 32 41 67
Pakur 19 32 40 68
Magalhat 16 29 39 62
Buxar 21 36 46 78
Munger 18 32 43 71
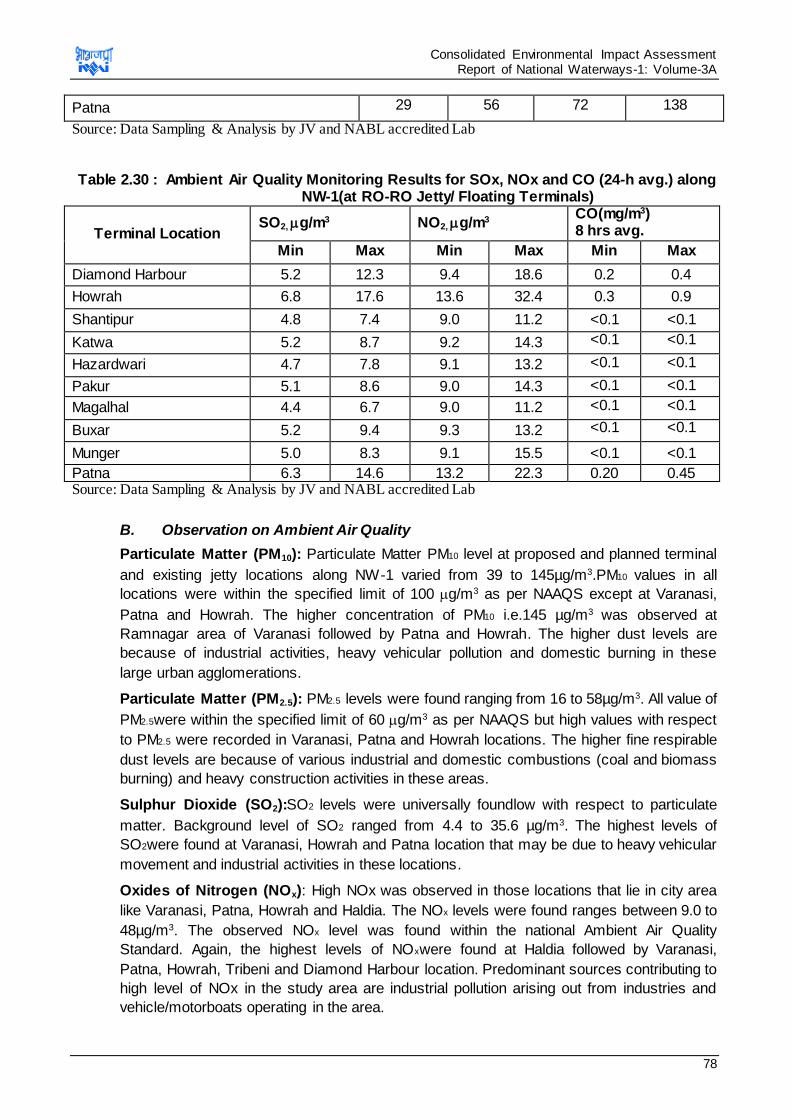
Consolidated Environmental Impact Assessment Report of National Waterways-1: Volume-3A
78
Patna 29 56 72 138
Source: Data Sampling & Analysis by JV and NABL accredited Lab
Table 2.30 : Ambient Air Quality Monitoring Results for SOx, NOx and CO (24-h avg.) along NW-1(at RO-RO Jetty/ Floating Terminals)
Terminal Location SO2, g/m3 NO2, g/m3
CO(mg/m3) 8 hrs avg.
Min Max Min Max Min Max
Diamond Harbour 5.2 12.3 9.4 18.6 0.2 0.4
Howrah 6.8 17.6 13.6 32.4 0.3 0.9
Shantipur 4.8 7.4 9.0 11.2 <0.1 <0.1
Katwa 5.2 8.7 9.2 14.3 <0.1 <0.1
Hazardwari 4.7 7.8 9.1 13.2 <0.1 <0.1
Pakur 5.1 8.6 9.0 14.3 <0.1 <0.1
Magalhal 4.4 6.7 9.0 11.2 <0.1 <0.1
Buxar 5.2 9.4 9.3 13.2 <0.1 <0.1
Munger 5.0 8.3 9.1 15.5 <0.1 <0.1
Patna 6.3 14.6 13.2 22.3 0.20 0.45 Source: Data Sampling & Analysis by JV and NABL accredited Lab
B. Observation on Ambient Air Quality
Particulate Matter (PM10): Particulate Matter PM10 level at proposed and planned terminal
and existing jetty locations along NW-1 varied from 39 to 145µg/m3.PM10 values in all
locations were within the specified limit of 100 g/m3 as per NAAQS except at Varanasi,
Patna and Howrah. The higher concentration of PM10 i.e.145 µg/m3 was observed at
Ramnagar area of Varanasi followed by Patna and Howrah. The higher dust levels are
because of industrial activities, heavy vehicular pollution and domestic burning in these
large urban agglomerations.
Particulate Matter (PM2.5): PM2.5 levels were found ranging from 16 to 58µg/m3. All value of
PM2.5were within the specified limit of 60 g/m3 as per NAAQS but high values with respect
to PM2.5 were recorded in Varanasi, Patna and Howrah locations. The higher fine respirable
dust levels are because of various industrial and domestic combustions (coal and biomass
burning) and heavy construction activities in these areas.
Sulphur Dioxide (SO2):SO2 levels were universally foundlow with respect to particulate
matter. Background level of SO2 ranged from 4.4 to 35.6 µg/m3. The highest levels of
SO2were found at Varanasi, Howrah and Patna location that may be due to heavy vehicular
movement and industrial activities in these locations.
Oxides of Nitrogen (NOx): High NOx was observed in those locations that lie in city area
like Varanasi, Patna, Howrah and Haldia. The NOx levels were found ranges between 9.0 to
48µg/m3. The observed NOx level was found within the national Ambient Air Quality
Standard. Again, the highest levels of NOxwere found at Haldia followed by Varanasi,
Patna, Howrah, Tribeni and Diamond Harbour location. Predominant sources contributing to
high level of NOx in the study area are industrial pollution arising out from industries and
vehicle/motorboats operating in the area.
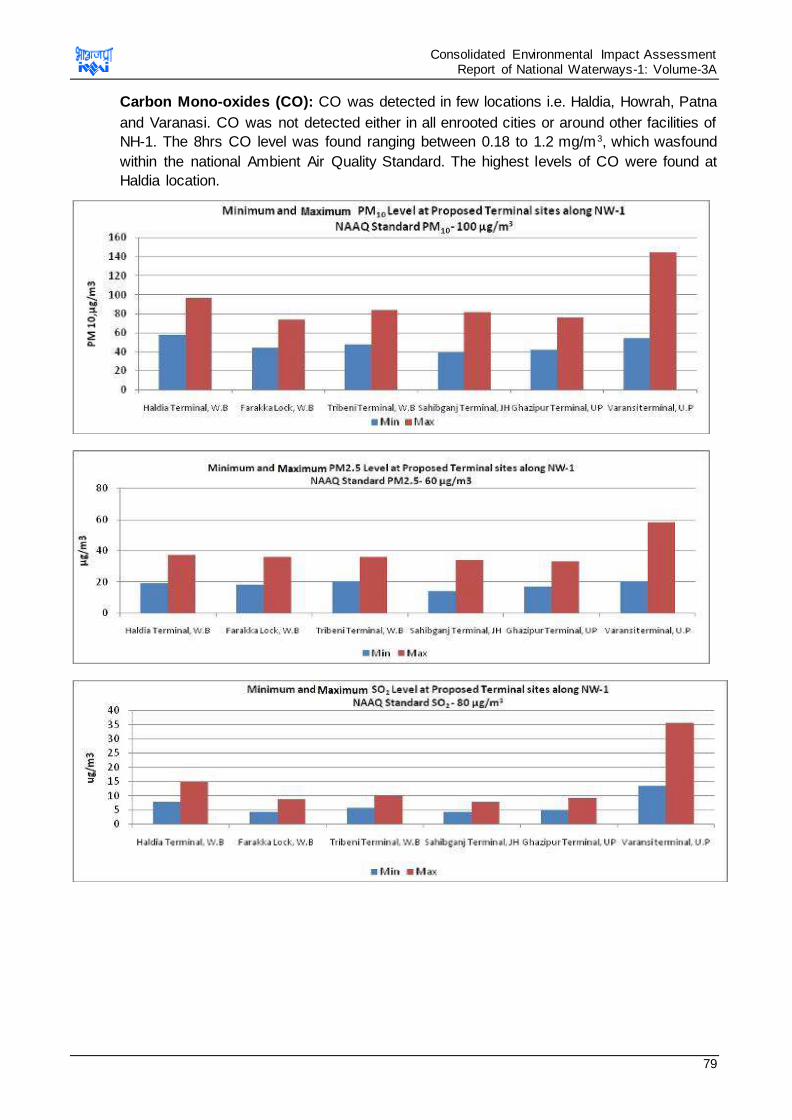
Consolidated Environmental Impact Assessment Report of National Waterways-1: Volume-3A
79
Carbon Mono-oxides (CO): CO was detected in few locations i.e. Haldia, Howrah, Patna
and Varanasi. CO was not detected either in all enrooted cities or around other facilities of
NH-1. The 8hrs CO level was found ranging between 0.18 to 1.2 mg/m3, which wasfound
within the national Ambient Air Quality Standard. The highest levels of CO were found at
Haldia location.
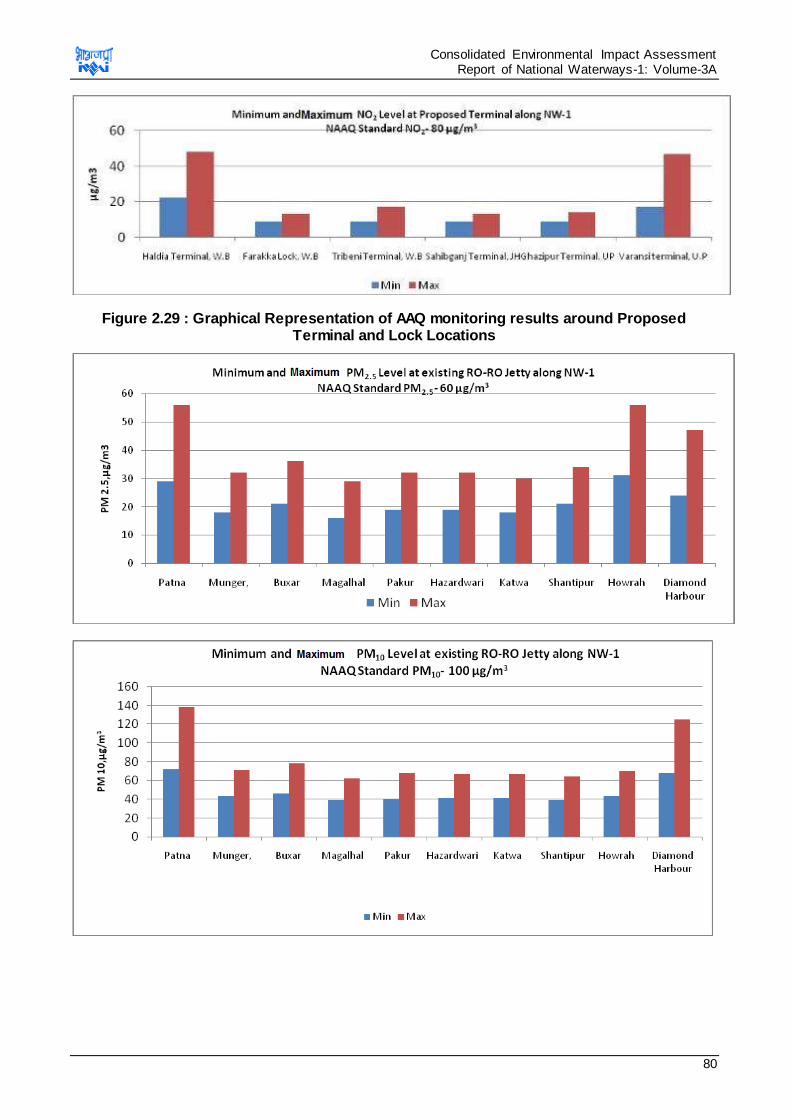
Consolidated Environmental Impact Assessment Report of National Waterways-1: Volume-3A
80
Figure 2.29 : Graphical Representation of AAQ monitoring results around Proposed Terminal and Lock Locations
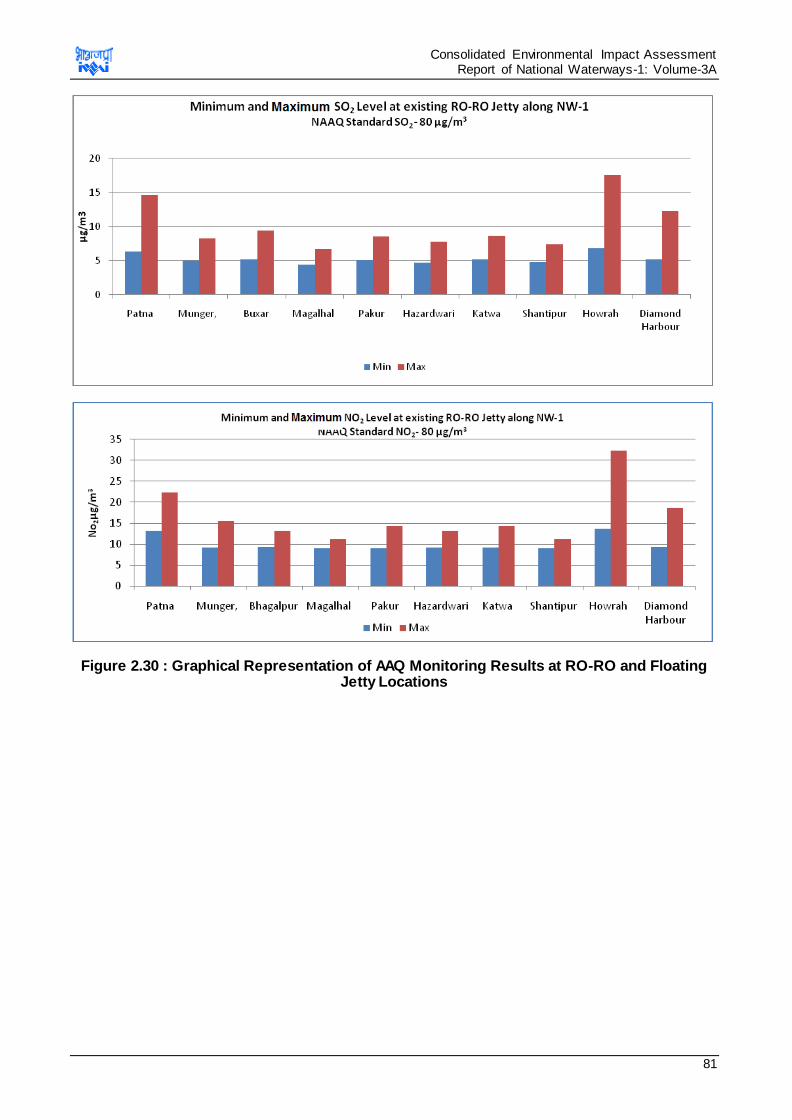
Consolidated Environmental Impact Assessment Report of National Waterways-1: Volume-3A
81
Figure 2.30 : Graphical Representation of AAQ Monitoring Results at RO-RO and Floating Jetty Locations
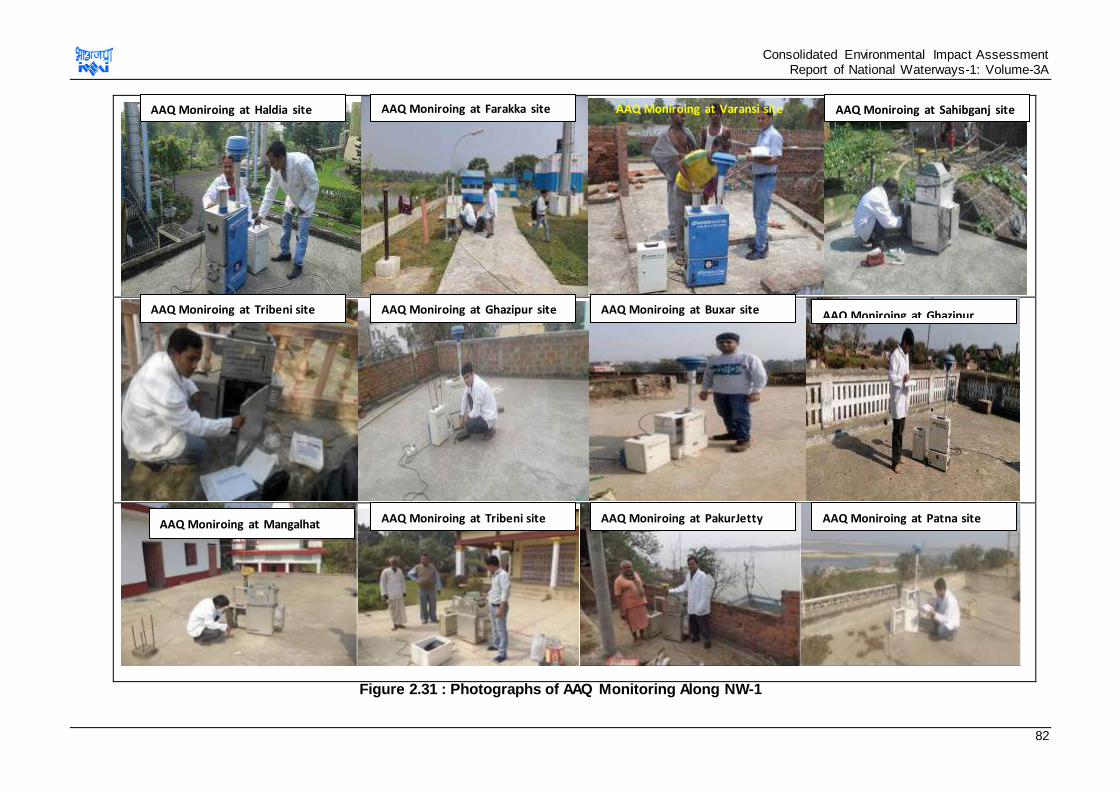
Consolidated Environmental Impact Assessment Report of National Waterways-1: Volume-3A
82
Figure 2.31 : Photographs of AAQ Monitoring Along NW-1
AAQ Moniroing at Farakka site AAQ Moniroing at Haldia site AAQ Moniroing at Sahibganj site AAQ Moniroing at Varansi site
AAQ Moniroing at Tribeni site
AAQ Moniroing at Mangalhat AAQ Moniroing at Tribeni site AAQ Moniroing at PakurJetty AAQ Moniroing at Patna site
AAQ Moniroing at Ghazipur site AAQ Moniroing at Buxar site AAQ Moniroing at Ghazipur
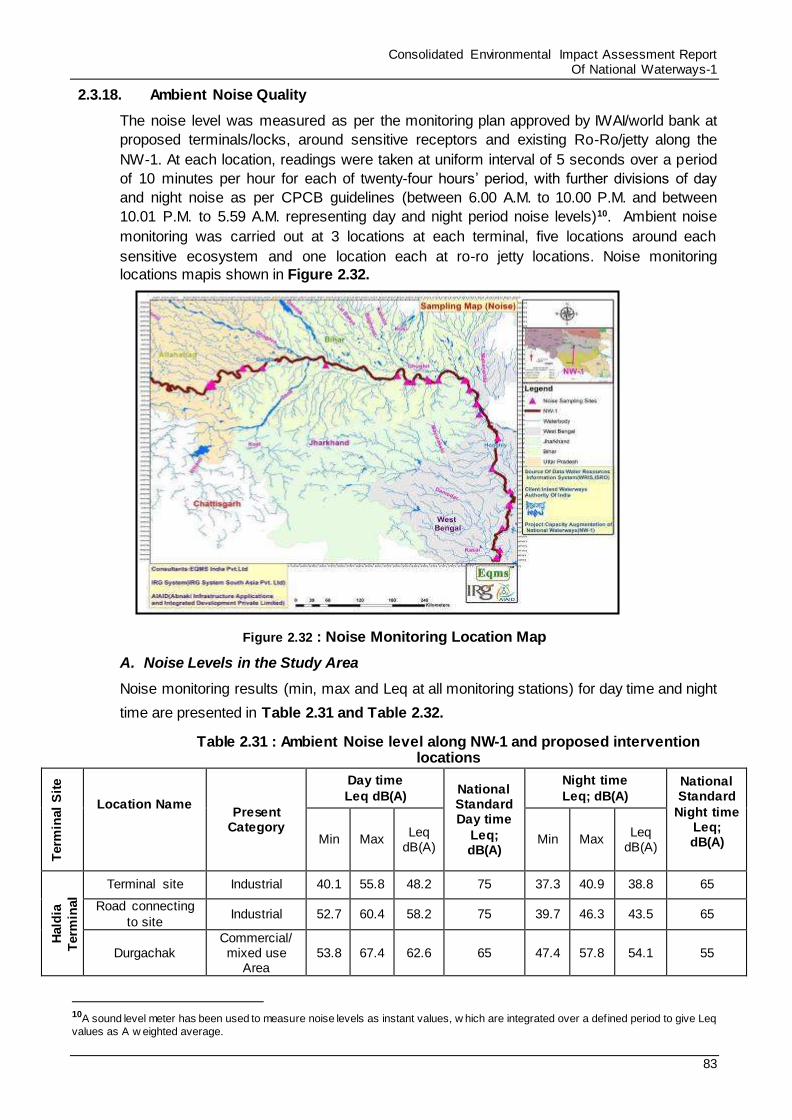
Consolidated Environmental Impact Assessment Report Of National Waterways-1
83
2.3.18. Ambient Noise Quality
The noise level was measured as per the monitoring plan approved by IWAI/world bank at
proposed terminals/locks, around sensitive receptors and existing Ro-Ro/jetty along the
NW-1. At each location, readings were taken at uniform interval of 5 seconds over a period
of 10 minutes per hour for each of twenty-four hours’ period, with further divisions of day
and night noise as per CPCB guidelines (between 6.00 A.M. to 10.00 P.M. and between
10.01 P.M. to 5.59 A.M. representing day and night period noise levels)10. Ambient noise
monitoring was carried out at 3 locations at each terminal, five locations around each
sensitive ecosystem and one location each at ro-ro jetty locations. Noise monitoring
locations mapis shown in Figure 2.32.
Figure 2.32 : Noise Monitoring Location Map
A. Noise Levels in the Study Area
Noise monitoring results (min, max and Leq at all monitoring stations) for day time and night
time are presented in Table 2.31 and Table 2.32.
Table 2.31 : Ambient Noise level along NW-1 and proposed intervention locations
Term
inal
Sit
e
Location Name
Present Category
Day time
Leq dB(A) National Standard Day time
Leq; dB(A)
Night time
Leq; dB(A) National Standard
Night time Leq; dB(A)
Min Max Leq
dB(A) Min Max
Leq dB(A)
Hald
ia
Term
inal
Terminal site Industrial 40.1 55.8 48.2 75 37.3 40.9 38.8 65
Road connecting
to site Industrial 52.7 60.4 58.2 75 39.7 46.3 43.5 65
Durgachak Commercial/mixed use
Area 53.8 67.4 62.6 65 47.4 57.8 54.1 55
10A sound level meter has been used to measure noise levels as instant values, w hich are integrated over a defined period to give Leq
values as A w eighted average.
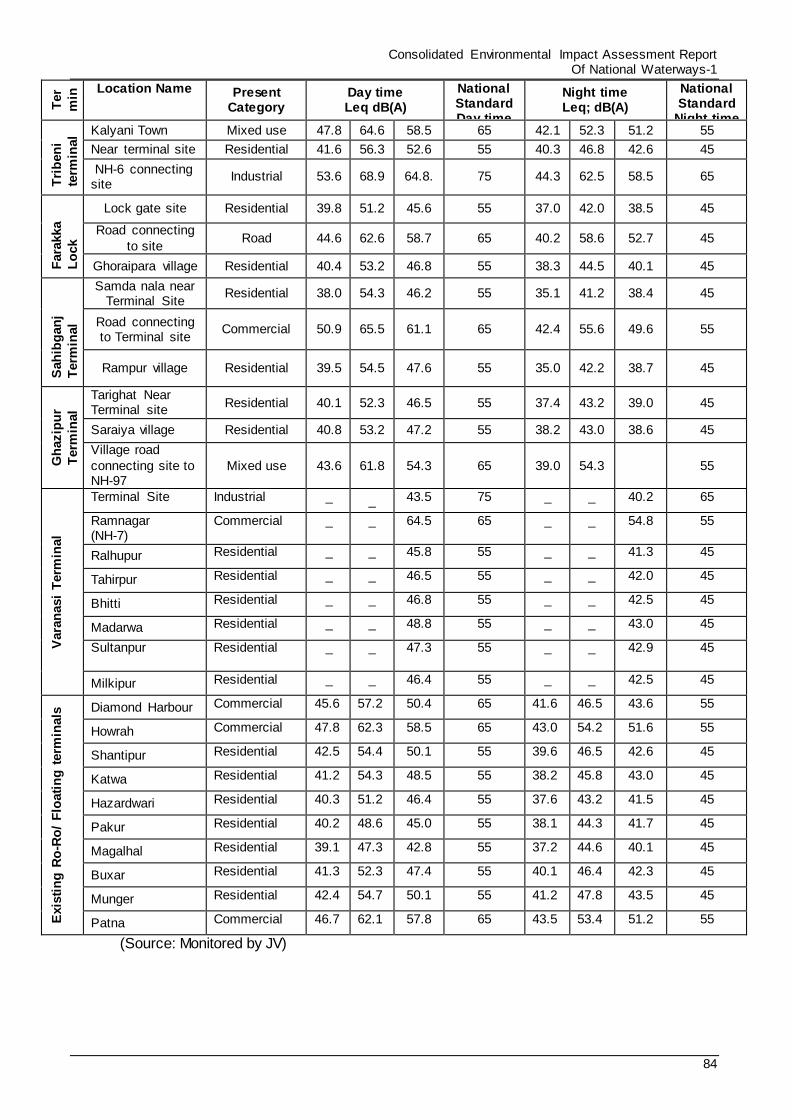
Consolidated Environmental Impact Assessment Report Of National Waterways-1
84
Ter
min al
Sit e Location Name
Present Category
Day time Leq dB(A)
National Standard Day time
Leq; dB(A)
Night time Leq; dB(A)
National Standard
Night time
Leq; dB(A)
Tri
ben
i
term
inal
Kalyani Town Mixed use 47.8 64.6 58.5 65 42.1 52.3 51.2 55
Near terminal site Residential 41.6 56.3 52.6 55 40.3 46.8 42.6 45
NH-6 connecting site
Industrial 53.6 68.9 64.8. 75 44.3 62.5 58.5 65
Fara
kka
Lo
ck
Lock gate site Residential 39.8 51.2 45.6 55 37.0 42.0 38.5 45
Road connecting
to site Road 44.6 62.6 58.7 65 40.2 58.6 52.7 45
Ghoraipara village Residential 40.4 53.2 46.8 55 38.3 44.5 40.1 45
Sah
ibg
an
j
Term
inal
Samda nala near Terminal Site
Residential 38.0 54.3 46.2 55 35.1 41.2 38.4 45
Road connecting to Terminal site
Commercial 50.9 65.5 61.1 65 42.4 55.6 49.6 55
Rampur village Residential 39.5 54.5 47.6 55 35.0 42.2 38.7 45
Gh
azip
ur
Term
inal
Tarighat Near Terminal site
Residential 40.1 52.3 46.5 55 37.4 43.2 39.0 45
Saraiya village Residential 40.8 53.2 47.2 55 38.2 43.0 38.6 45
Village road
connecting site to NH-97
Mixed use 43.6 61.8 54.3 65 39.0 54.3 55
Vara
nasi
Term
inal
Terminal Site Industrial _ _ 43.5 75 _ _ 40.2 65
Ramnagar (NH-7)
Commercial _ _ 64.5 65 _ _ 54.8 55
Ralhupur Residential _ _ 45.8 55 _ _ 41.3 45
Tahirpur Residential _ _ 46.5 55 _ _ 42.0 45
Bhitti Residential _ _ 46.8 55 _ _ 42.5 45
Madarwa Residential _ _ 48.8 55 _ _ 43.0 45
Sultanpur
Residential _ _ 47.3 55 _ _ 42.9 45
Milkipur Residential _ _ 46.4 55 _ _ 42.5 45
Exis
tin
g R
o-R
o/
Flo
ati
ng
term
inals
Diamond Harbour Commercial 45.6 57.2 50.4 65 41.6 46.5 43.6 55
Howrah Commercial 47.8 62.3 58.5 65 43.0 54.2 51.6 55
Shantipur Residential 42.5 54.4 50.1 55 39.6 46.5 42.6 45
Katwa Residential 41.2 54.3 48.5 55 38.2 45.8 43.0 45
Hazardwari Residential 40.3 51.2 46.4 55 37.6 43.2 41.5 45
Pakur Residential 40.2 48.6 45.0 55 38.1 44.3 41.7 45
Magalhal Residential 39.1 47.3 42.8 55 37.2 44.6 40.1 45
Buxar Residential 41.3 52.3 47.4 55 40.1 46.4 42.3 45
Munger Residential 42.4 54.7 50.1 55 41.2 47.8 43.5 45
Patna Commercial 46.7 62.1 57.8 65 43.5 53.4 51.2 55
(Source: Monitored by JV)
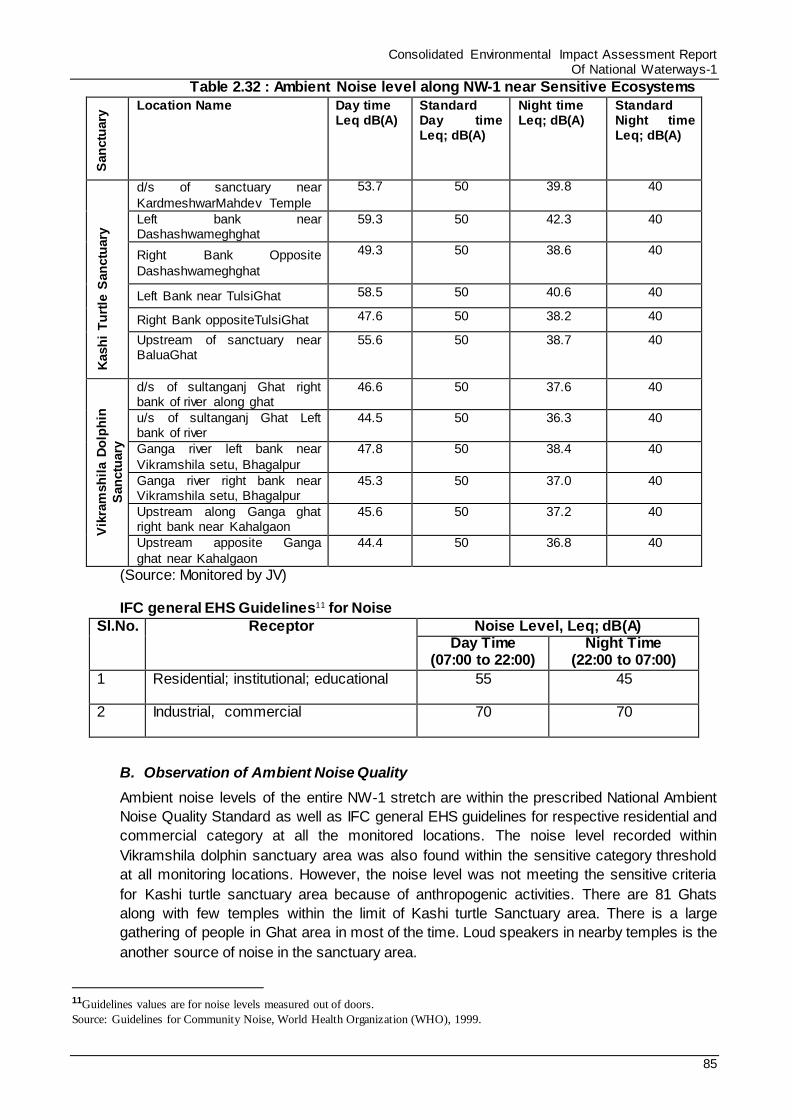
Consolidated Environmental Impact Assessment Report Of National Waterways-1
85
Table 2.32 : Ambient Noise level along NW-1 near Sensitive Ecosystems S
an
ctu
ary
Location Name
Day time Leq dB(A)
Standard Day time Leq; dB(A)
Night time Leq; dB(A)
Standard Night time Leq; dB(A)
Kash
i T
urt
le S
an
ctu
ary
d/s of sanctuary near
KardmeshwarMahdev Temple
53.7 50 39.8 40
Left bank near Dashashwameghghat
59.3 50 42.3 40
Right Bank Opposite
Dashashwameghghat
49.3 50 38.6 40
Left Bank near TulsiGhat 58.5 50 40.6 40
Right Bank oppositeTulsiGhat 47.6 50 38.2 40
Upstream of sanctuary near BaluaGhat
55.6 50 38.7 40
Vik
ram
sh
ila D
olp
hin
San
ctu
ary
d/s of sultanganj Ghat right bank of river along ghat
46.6 50 37.6 40
u/s of sultanganj Ghat Left bank of river
44.5 50 36.3 40
Ganga river left bank near
Vikramshila setu, Bhagalpur
47.8 50 38.4 40
Ganga river right bank near Vikramshila setu, Bhagalpur
45.3 50 37.0 40
Upstream along Ganga ghat right bank near Kahalgaon
45.6 50 37.2 40
Upstream apposite Ganga
ghat near Kahalgaon
44.4 50 36.8 40
(Source: Monitored by JV) IFC general EHS Guidelines11 for Noise
Sl.No. Receptor Noise Level, Leq; dB(A) Day Time
(07:00 to 22:00) Night Time
(22:00 to 07:00)
1 Residential; institutional; educational 55 45
2 Industrial, commercial 70 70
B. Observation of Ambient Noise Quality
Ambient noise levels of the entire NW-1 stretch are within the prescribed National Ambient
Noise Quality Standard as well as IFC general EHS guidelines for respective residential and
commercial category at all the monitored locations. The noise level recorded within
Vikramshila dolphin sanctuary area was also found within the sensitive category threshold
at all monitoring locations. However, the noise level was not meeting the sensitive criteria
for Kashi turtle sanctuary area because of anthropogenic activities. There are 81 Ghats
along with few temples within the limit of Kashi turtle Sanctuary area. There is a large
gathering of people in Ghat area in most of the time. Loud speakers in nearby temples is the
another source of noise in the sanctuary area.
11Guidelines values are for noise levels measured out of doors.
Source: Guidelines for Community Noise, World Health Organization (WHO), 1999.
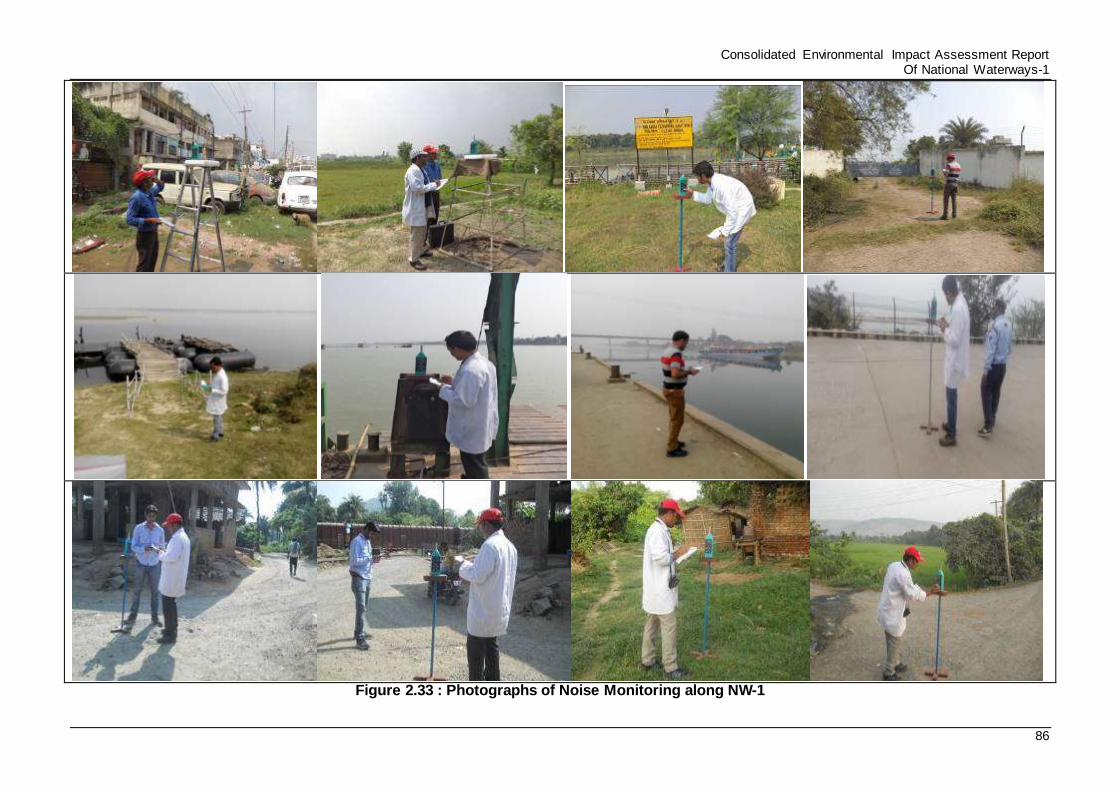
Consolidated Environmental Impact Assessment Report Of National Waterways-1
86
Figure 2.33 : Photographs of Noise Monitoring along NW-1
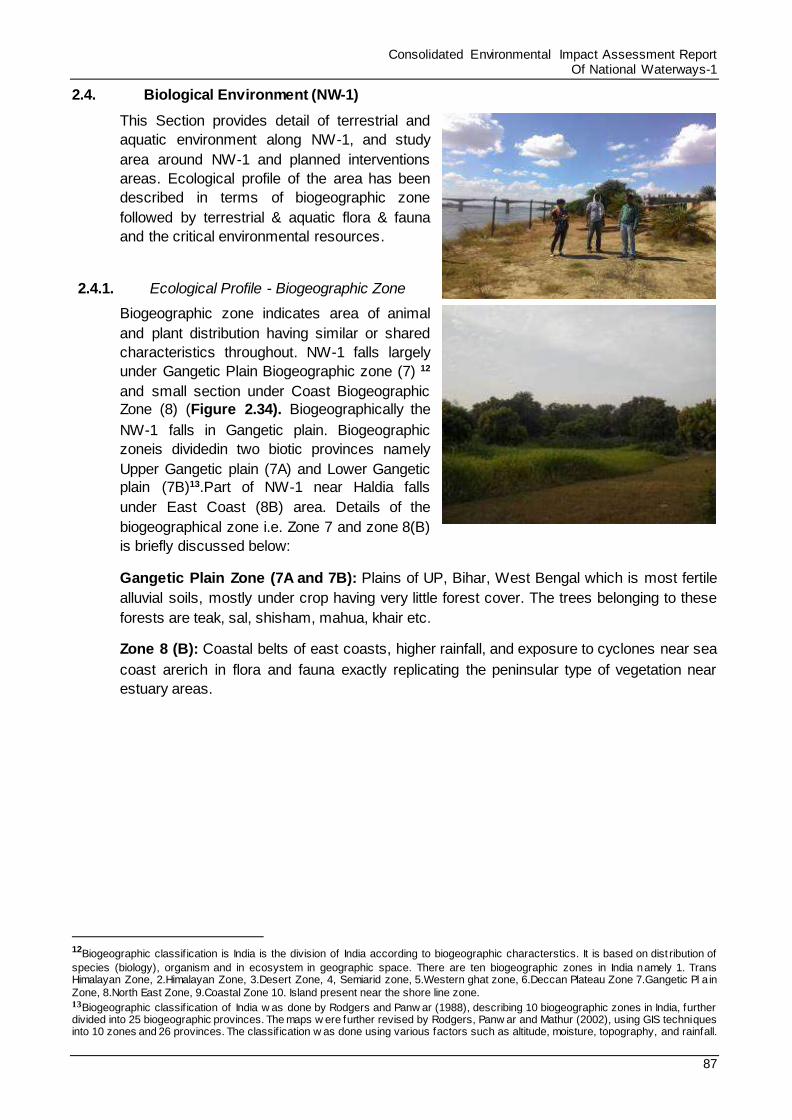
Consolidated Environmental Impact Assessment Report Of National Waterways-1
87
2.4. Biological Environment (NW-1)
This Section provides detail of terrestrial and
aquatic environment along NW-1, and study
area around NW-1 and planned interventions
areas. Ecological profile of the area has been
described in terms of biogeographic zone
followed by terrestrial & aquatic flora & fauna
and the critical environmental resources.
2.4.1. Ecological Profile - Biogeographic Zone
Biogeographic zone indicates area of animal
and plant distribution having similar or shared
characteristics throughout. NW-1 falls largely
under Gangetic Plain Biogeographic zone (7) 12
and small section under Coast Biogeographic
Zone (8) (Figure 2.34). Biogeographically the
NW-1 falls in Gangetic plain. Biogeographic
zoneis dividedin two biotic provinces namely
Upper Gangetic plain (7A) and Lower Gangetic
plain (7B)13.Part of NW-1 near Haldia falls
under East Coast (8B) area. Details of the
biogeographical zone i.e. Zone 7 and zone 8(B)
is briefly discussed below:
Gangetic Plain Zone (7A and 7B): Plains of UP, Bihar, West Bengal which is most fertile
alluvial soils, mostly under crop having very little forest cover. The trees belonging to these
forests are teak, sal, shisham, mahua, khair etc.
Zone 8 (B): Coastal belts of east coasts, higher rainfall, and exposure to cyclones near sea
coast arerich in flora and fauna exactly replicating the peninsular type of vegetation near
estuary areas.
12Biogeographic classif ication is India is the division of India according to biogeographic characterstics. It is based on dist ribution of
species (biology), organism and in ecosystem in geographic space. There are ten biogeographic zones in India namely 1. Trans Himalayan Zone, 2.Himalayan Zone, 3.Desert Zone, 4, Semiarid zone, 5.Western ghat zone, 6.Deccan Plateau Zone 7.Gangetic Pl a in
Zone, 8.North East Zone, 9.Coastal Zone 10. Island present near the shore line zone. 13Biogeographic classif ication of India w as done by Rodgers and Panw ar (1988), describing 10 biogeographic zones in India, further divided into 25 biogeographic provinces. The maps w ere further revised by Rodgers, Panw ar and Mathur (2002), using GIS techniques into 10 zones and 26 provinces. The classif ication w as done using various factors such as altitude, moisture, topography, and rainfall.
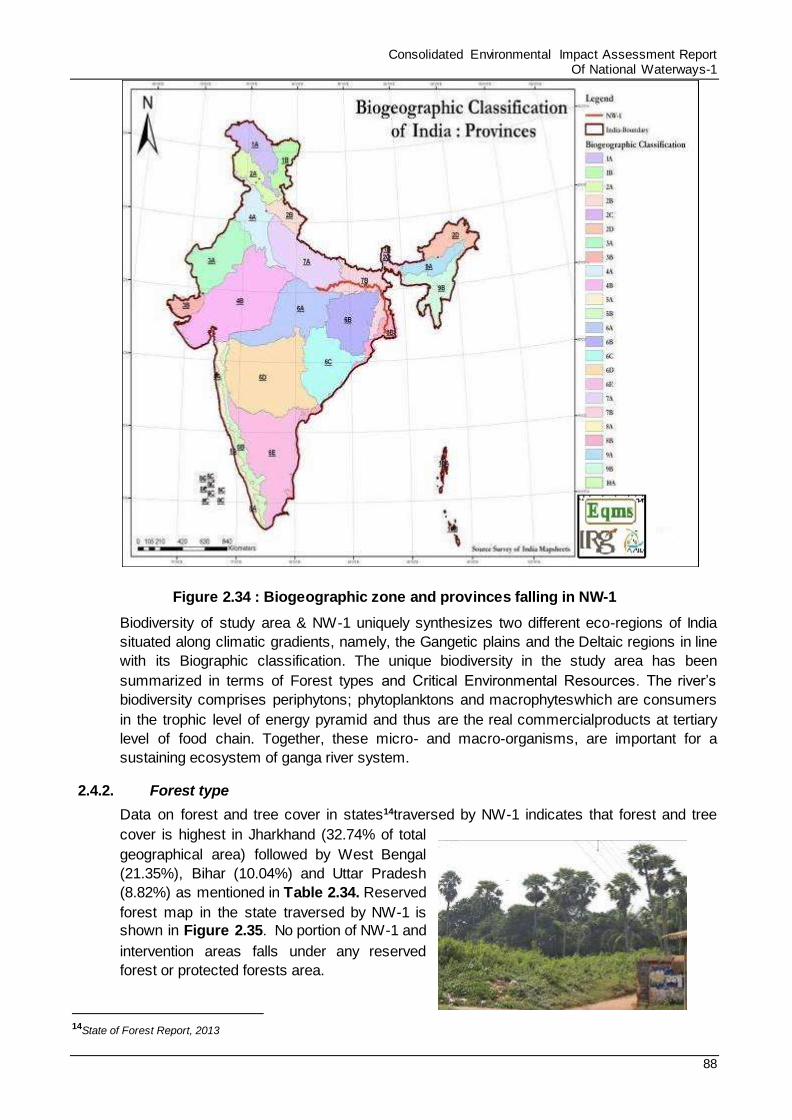
Consolidated Environmental Impact Assessment Report Of National Waterways-1
88
Figure 2.34 : Biogeographic zone and provinces falling in NW-1
Biodiversity of study area & NW-1 uniquely synthesizes two different eco-regions of India
situated along climatic gradients, namely, the Gangetic plains and the Deltaic regions in line
with its Biographic classification. The unique biodiversity in the study area has been
summarized in terms of Forest types and Critical Environmental Resources. The river’s
biodiversity comprises periphytons; phytoplanktons and macrophyteswhich are consumers
in the trophic level of energy pyramid and thus are the real commercialproducts at tertiary
level of food chain. Together, these micro- and macro-organisms, are important for a
sustaining ecosystem of ganga river system.
2.4.2. Forest type
Data on forest and tree cover in states14traversed by NW-1 indicates that forest and tree
cover is highest in Jharkhand (32.74% of total
geographical area) followed by West Bengal
(21.35%), Bihar (10.04%) and Uttar Pradesh
(8.82%) as mentioned in Table 2.34. Reserved
forest map in the state traversed by NW-1 is
shown in Figure 2.35. No portion of NW-1 and
intervention areas falls under any reserved
forest or protected forests area.
14State of Forest Report, 2013
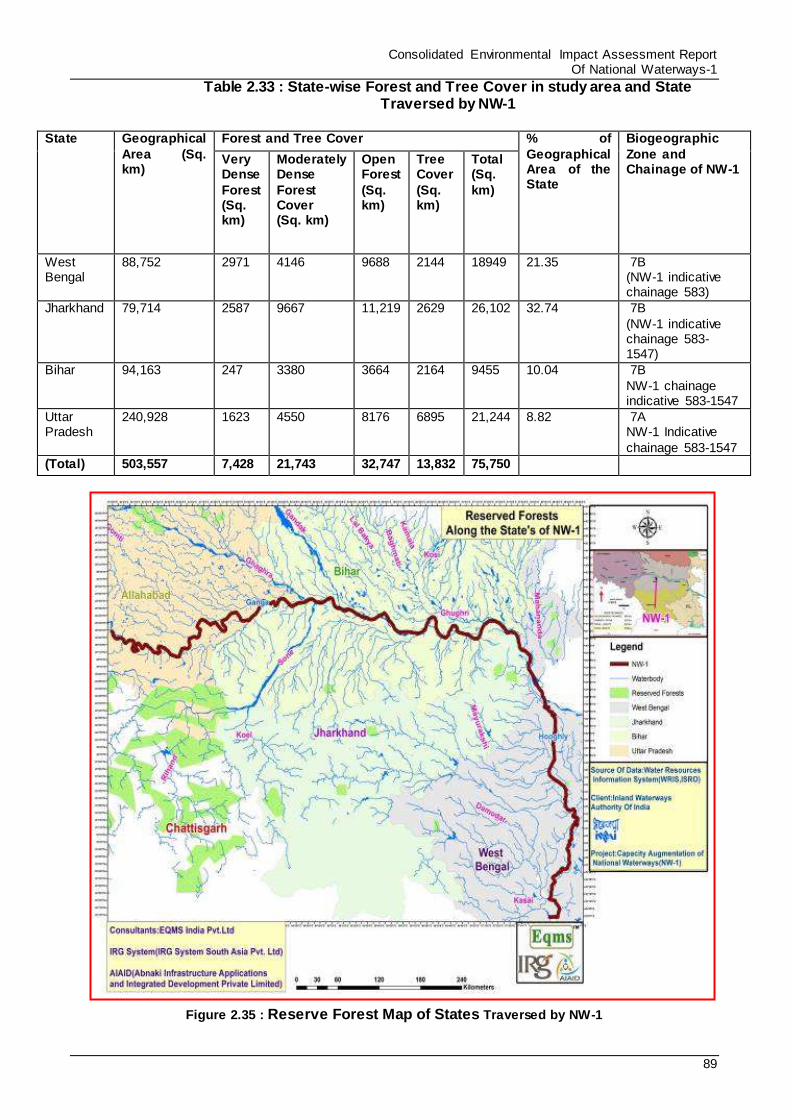
Consolidated Environmental Impact Assessment Report Of National Waterways-1
89
Table 2.33 : State-wise Forest and Tree Cover in study area and State Traversed by NW-1
State
Geographical
Area (Sq. km)
Forest and Tree Cover % of
Geographical Area of the State
Biogeographic
Zone and Chainage of NW-1
Very Dense
Forest (Sq. km)
Moderately Dense
Forest Cover (Sq. km)
Open Forest
(Sq. km)
Tree Cover
(Sq. km)
Total (Sq.
km)
West Bengal
88,752 2971 4146 9688 2144 18949 21.35 7B (NW-1 indicative chainage 583)
Jharkhand 79,714 2587 9667 11,219 2629 26,102 32.74 7B
(NW-1 indicative chainage 583-1547)
Bihar 94,163 247 3380 3664 2164 9455 10.04 7B
NW-1 chainage indicative 583-1547
Uttar Pradesh
240,928 1623 4550 8176 6895 21,244 8.82 7A NW-1 Indicative
chainage 583-1547
(Total) 503,557 7,428 21,743 32,747 13,832 75,750
Figure 2.35 : Reserve Forest Map of States Traversed by NW-1
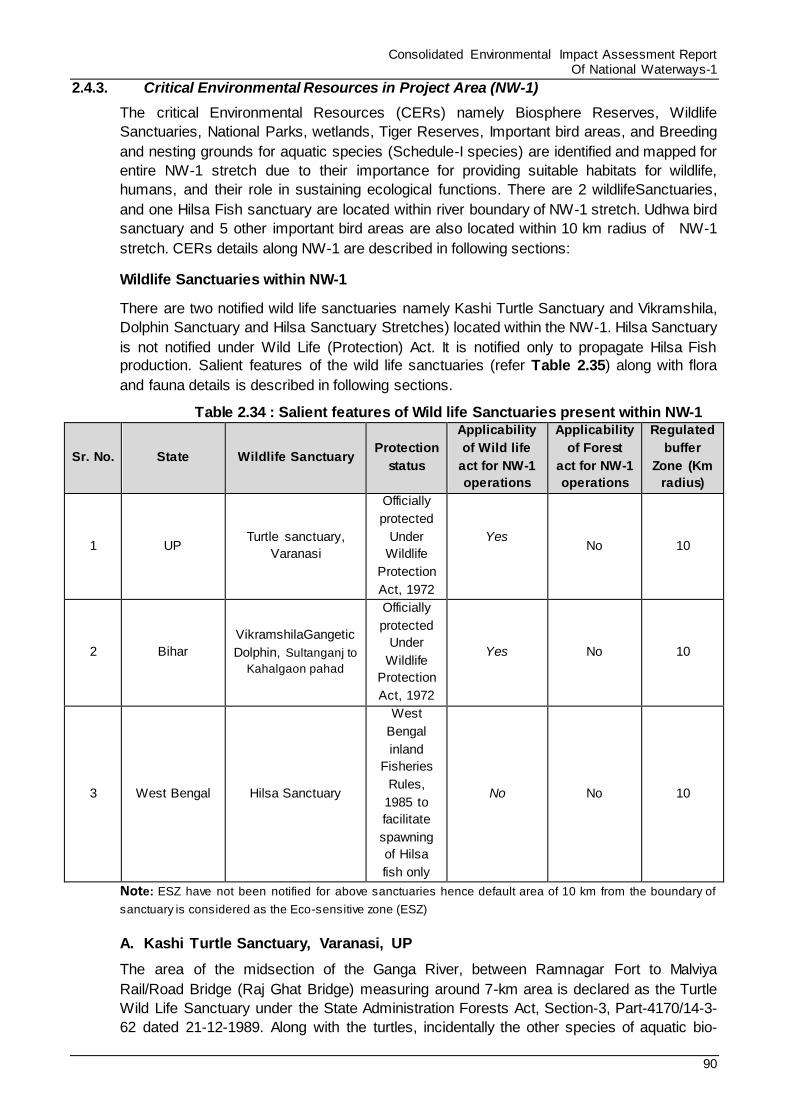
Consolidated Environmental Impact Assessment Report Of National Waterways-1
90
2.4.3. Critical Environmental Resources in Project Area (NW-1)
The critical Environmental Resources (CERs) namely Biosphere Reserves, Wildlife
Sanctuaries, National Parks, wetlands, Tiger Reserves, Important bird areas, and Breeding
and nesting grounds for aquatic species (Schedule-I species) are identified and mapped for
entire NW-1 stretch due to their importance for providing suitable habitats for wildlife,
humans, and their role in sustaining ecological functions. There are 2 wildlifeSanctuaries,
and one Hilsa Fish sanctuary are located within river boundary of NW-1 stretch. Udhwa bird
sanctuary and 5 other important bird areas are also located within 10 km radius of NW-1
stretch. CERs details along NW-1 are described in following sections:
Wildlife Sanctuaries within NW-1
There are two notified wild life sanctuaries namely Kashi Turtle Sanctuary and Vikramshila,
Dolphin Sanctuary and Hilsa Sanctuary Stretches) located within the NW-1. Hilsa Sanctuary
is not notified under Wild Life (Protection) Act. It is notified only to propagate Hilsa Fish
production. Salient features of the wild life sanctuaries (refer Table 2.35) along with flora
and fauna details is described in following sections.
Table 2.34 : Salient features of Wild life Sanctuaries present within NW-1
Sr. No. State Wildlife Sanctuary Protection
status
Applicability
of Wild life
act for NW-1
operations
Applicability
of Forest
act for NW-1
operations
Regulated
buffer
Zone (Km
radius)
1 UP Turtle sanctuary,
Varanasi
Officially
protected
Under
Wildlife
Protection
Act, 1972
Yes
No 10
2 Bihar
VikramshilaGangetic
Dolphin, Sultanganj to
Kahalgaon pahad
Officially
protected
Under
Wildlife
Protection
Act, 1972
Yes No 10
3 West Bengal Hilsa Sanctuary
West
Bengal
inland
Fisheries
Rules,
1985 to
facilitate
spawning
of Hilsa
fish only
No No 10
Note: ESZ have not been notified for above sanctuaries hence default area of 10 km from the boundary of
sanctuary is considered as the Eco-sensitive zone (ESZ)
A. Kashi Turtle Sanctuary, Varanasi, UP
The area of the midsection of the Ganga River, between Ramnagar Fort to Malviya
Rail/Road Bridge (Raj Ghat Bridge) measuring around 7-km area is declared as the Turtle
Wild Life Sanctuary under the State Administration Forests Act, Section-3, Part-4170/14-3-
62 dated 21-12-1989. Along with the turtles, incidentally the other species of aquatic bio-
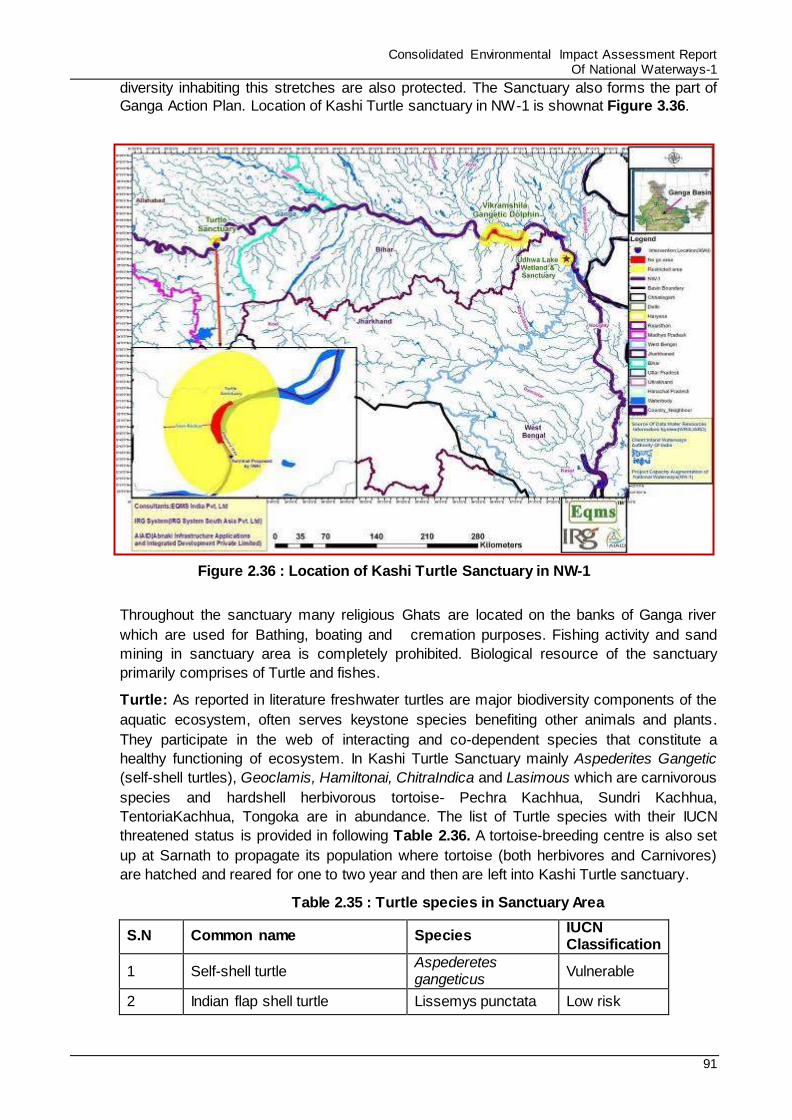
Consolidated Environmental Impact Assessment Report Of National Waterways-1
91
diversity inhabiting this stretches are also protected. The Sanctuary also forms the part of
Ganga Action Plan. Location of Kashi Turtle sanctuary in NW-1 is shownat Figure 3.36.
Figure 2.36 : Location of Kashi Turtle Sanctuary in NW-1
Throughout the sanctuary many religious Ghats are located on the banks of Ganga river
which are used for Bathing, boating and cremation purposes. Fishing activity and sand
mining in sanctuary area is completely prohibited. Biological resource of the sanctuary
primarily comprises of Turtle and fishes.
Turtle: As reported in literature freshwater turtles are major biodiversity components of the
aquatic ecosystem, often serves keystone species benefiting other animals and plants.
They participate in the web of interacting and co-dependent species that constitute a
healthy functioning of ecosystem. In Kashi Turtle Sanctuary mainly Aspederites Gangetic
(self-shell turtles), Geoclamis, Hamiltonai, ChitraIndica and Lasimous which are carnivorous
species and hardshell herbivorous tortoise- Pechra Kachhua, Sundri Kachhua,
TentoriaKachhua, Tongoka are in abundance. The list of Turtle species with their IUCN
threatened status is provided in following Table 2.36. A tortoise-breeding centre is also set
up at Sarnath to propagate its population where tortoise (both herbivores and Carnivores)
are hatched and reared for one to two year and then are left into Kashi Turtle sanctuary.
Table 2.35 : Turtle species in Sanctuary Area
S.N Common name Species IUCN Classification
1 Self-shell turtle Aspederetes gangeticus
Vulnerable
2 Indian flap shell turtle Lissemys punctata Low risk
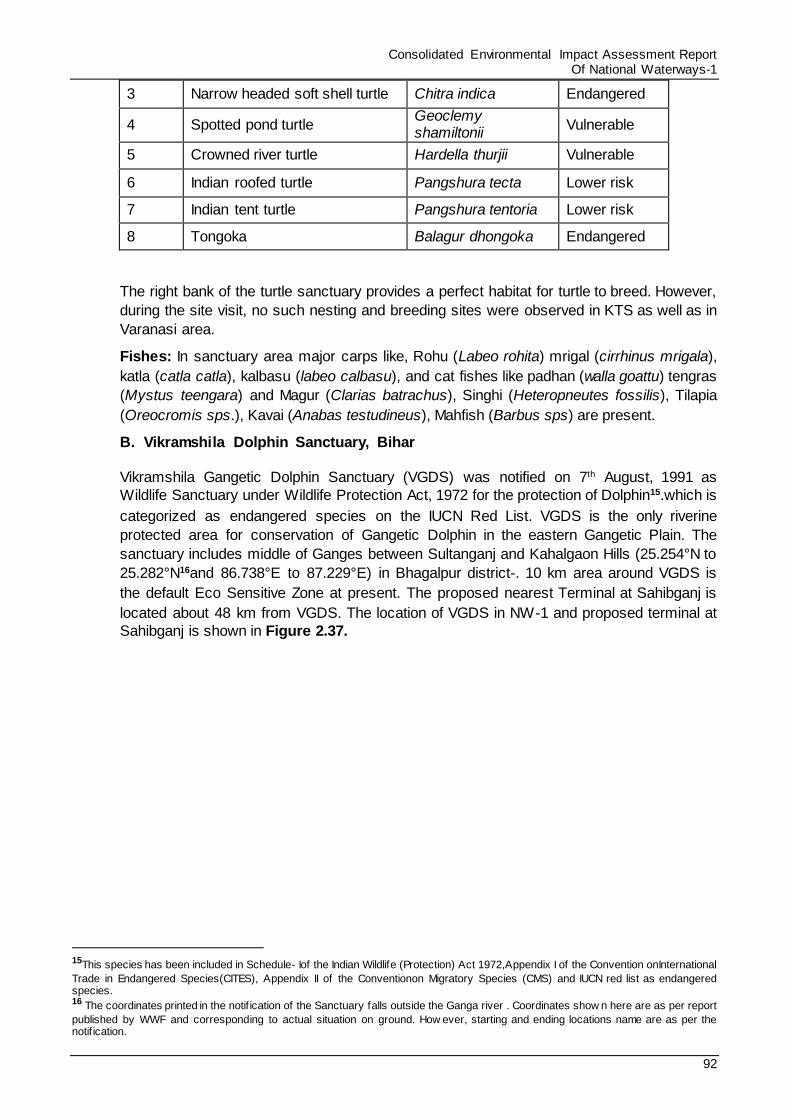
Consolidated Environmental Impact Assessment Report Of National Waterways-1
92
3 Narrow headed soft shell turtle Chitra indica Endangered
4 Spotted pond turtle Geoclemy shamiltonii
Vulnerable
5 Crowned river turtle Hardella thurjii Vulnerable
6 Indian roofed turtle Pangshura tecta Lower risk
7 Indian tent turtle Pangshura tentoria Lower risk
8 Tongoka Balagur dhongoka Endangered
The right bank of the turtle sanctuary provides a perfect habitat for turtle to breed. However,
during the site visit, no such nesting and breeding sites were observed in KTS as well as in
Varanasi area.
Fishes: In sanctuary area major carps like, Rohu (Labeo rohita) mrigal (cirrhinus mrigala),
katla (catla catla), kalbasu (labeo calbasu), and cat fishes like padhan (walla goattu) tengras
(Mystus teengara) and Magur (Clarias batrachus), Singhi (Heteropneutes fossilis), Tilapia
(Oreocromis sps.), Kavai (Anabas testudineus), Mahfish (Barbus sps) are present.
B. Vikramshila Dolphin Sanctuary, Bihar
Vikramshila Gangetic Dolphin Sanctuary (VGDS) was notified on 7th August, 1991 as
Wildlife Sanctuary under Wildlife Protection Act, 1972 for the protection of Dolphin15.which is
categorized as endangered species on the IUCN Red List. VGDS is the only riverine
protected area for conservation of Gangetic Dolphin in the eastern Gangetic Plain. The
sanctuary includes middle of Ganges between Sultanganj and Kahalgaon Hills (25.254°N to
25.282°N16and 86.738°E to 87.229°E) in Bhagalpur district-. 10 km area around VGDS is
the default Eco Sensitive Zone at present. The proposed nearest Terminal at Sahibganj is
located about 48 km from VGDS. The location of VGDS in NW-1 and proposed terminal at
Sahibganj is shown in Figure 2.37.
15This species has been included in Schedule- Iof the Indian Wildlife (Protection) Act 1972,Appendix I of the Convention onInternational
Trade in Endangered Species(CITES), Appendix II of the Conventionon Migratory Species (CMS) and IUCN red list as endangered species. 16 The coordinates printed in the notif ication of the Sanctuary falls outside the Ganga river . Coordinates show n here are as per report
published by WWF and corresponding to actual situation on ground. How ever, starting and ending locations name are as per the notif ication.
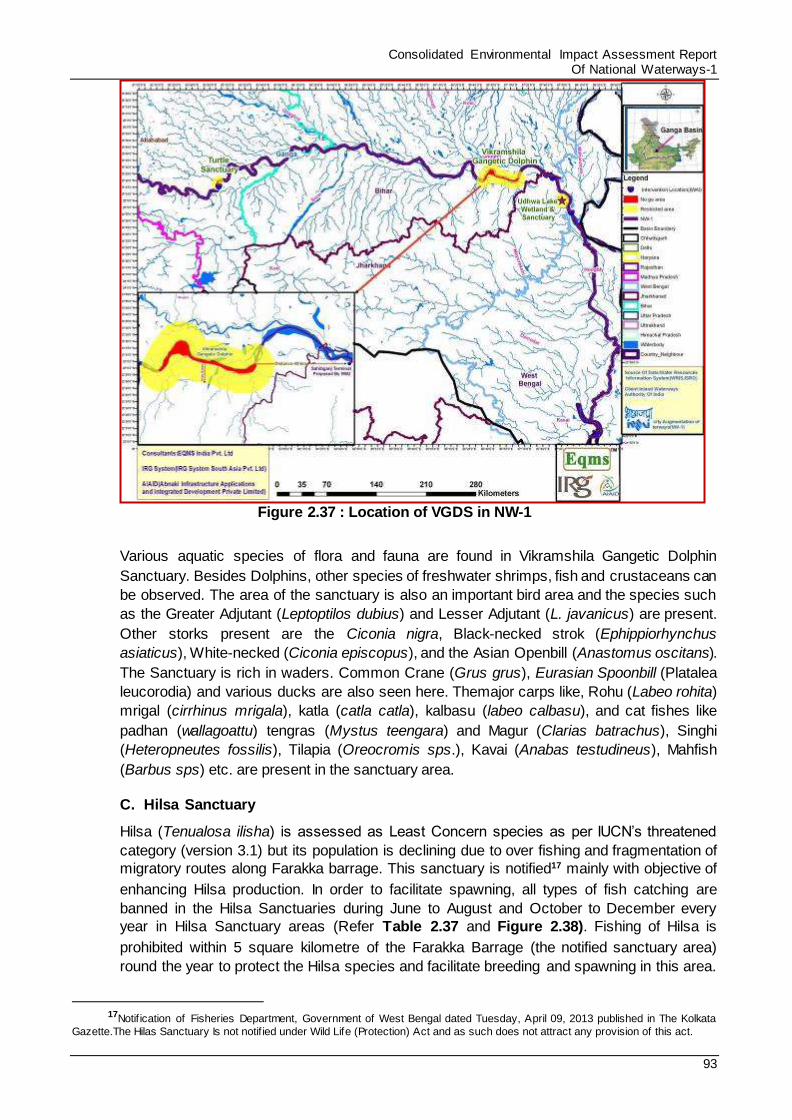
Consolidated Environmental Impact Assessment Report Of National Waterways-1
93
Figure 2.37 : Location of VGDS in NW-1
Various aquatic species of flora and fauna are found in Vikramshila Gangetic Dolphin
Sanctuary. Besides Dolphins, other species of freshwater shrimps, fish and crustaceans can
be observed. The area of the sanctuary is also an important bird area and the species such
as the Greater Adjutant (Leptoptilos dubius) and Lesser Adjutant (L. javanicus) are present.
Other storks present are the Ciconia nigra, Black-necked strok (Ephippiorhynchus
asiaticus), White-necked (Ciconia episcopus), and the Asian Openbill (Anastomus oscitans).
The Sanctuary is rich in waders. Common Crane (Grus grus), Eurasian Spoonbill (Platalea
leucorodia) and various ducks are also seen here. Themajor carps like, Rohu (Labeo rohita)
mrigal (cirrhinus mrigala), katla (catla catla), kalbasu (labeo calbasu), and cat fishes like
padhan (wallagoattu) tengras (Mystus teengara) and Magur (Clarias batrachus), Singhi
(Heteropneutes fossilis), Tilapia (Oreocromis sps.), Kavai (Anabas testudineus), Mahfish
(Barbus sps) etc. are present in the sanctuary area.
C. Hilsa Sanctuary
Hilsa (Tenualosa ilisha) is assessed as Least Concern species as per IUCN’s threatened
category (version 3.1) but its population is declining due to over fishing and fragmentation of
migratory routes along Farakka barrage. This sanctuary is notified17 mainly with objective of
enhancing Hilsa production. In order to facilitate spawning, all types of fish catching are
banned in the Hilsa Sanctuaries during June to August and October to December every
year in Hilsa Sanctuary areas (Refer Table 2.37 and Figure 2.38). Fishing of Hilsa is
prohibited within 5 square kilometre of the Farakka Barrage (the notified sanctuary area)
round the year to protect the Hilsa species and facilitate breeding and spawning in this area.
17Notif ication of Fisheries Department, Government of West Bengal dated Tuesday, April 09, 2013 published in The Kolkata
Gazette.The Hilas Sanctuary Is not notif ied under Wild Life (Protection) Act and as such does not attract any provision of this act.
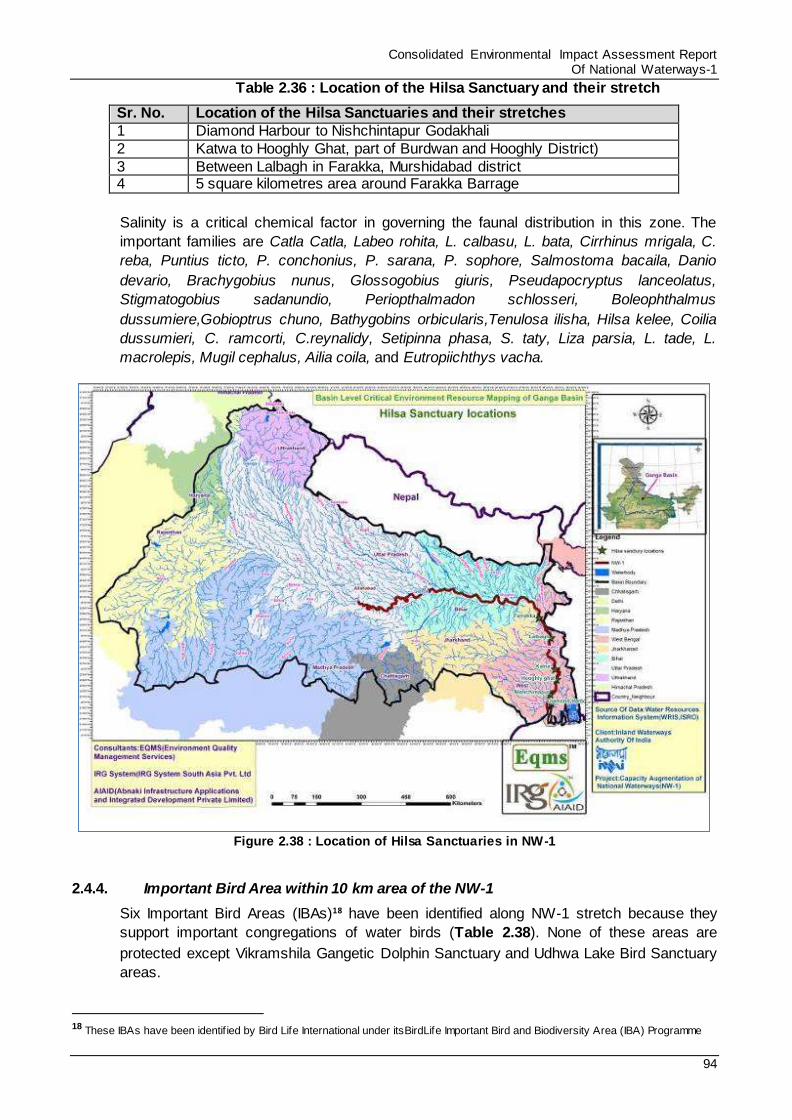
Consolidated Environmental Impact Assessment Report Of National Waterways-1
94
Table 2.36 : Location of the Hilsa Sanctuary and their stretch
Sr. No. Location of the Hilsa Sanctuaries and their stretches
1 Diamond Harbour to Nishchintapur Godakhali
2 Katwa to Hooghly Ghat, part of Burdwan and Hooghly District)
3 Between Lalbagh in Farakka, Murshidabad district 4 5 square kilometres area around Farakka Barrage
Salinity is a critical chemical factor in governing the faunal distribution in this zone. The
important families are Catla Catla, Labeo rohita, L. calbasu, L. bata, Cirrhinus mrigala, C.
reba, Puntius ticto, P. conchonius, P. sarana, P. sophore, Salmostoma bacaila, Danio
devario, Brachygobius nunus, Glossogobius giuris, Pseudapocryptus lanceolatus,
Stigmatogobius sadanundio, Periopthalmadon schlosseri, Boleophthalmus
dussumiere,Gobioptrus chuno, Bathygobins orbicularis,Tenulosa ilisha, Hilsa kelee, Coilia
dussumieri, C. ramcorti, C.reynalidy, Setipinna phasa, S. taty, Liza parsia, L. tade, L.
macrolepis, Mugil cephalus, Ailia coila, and Eutropiichthys vacha.
Figure 2.38 : Location of Hilsa Sanctuaries in NW-1
2.4.4. Important Bird Area within 10 km area of the NW-1
Six Important Bird Areas (IBAs)18 have been identified along NW-1 stretch because they
support important congregations of water birds (Table 2.38). None of these areas are
protected except Vikramshila Gangetic Dolphin Sanctuary and Udhwa Lake Bird Sanctuary
areas.
18 These IBAs have been identif ied by Bird Life International under itsBirdLife Important Bird and Biodiversity Area (IBA) Programme
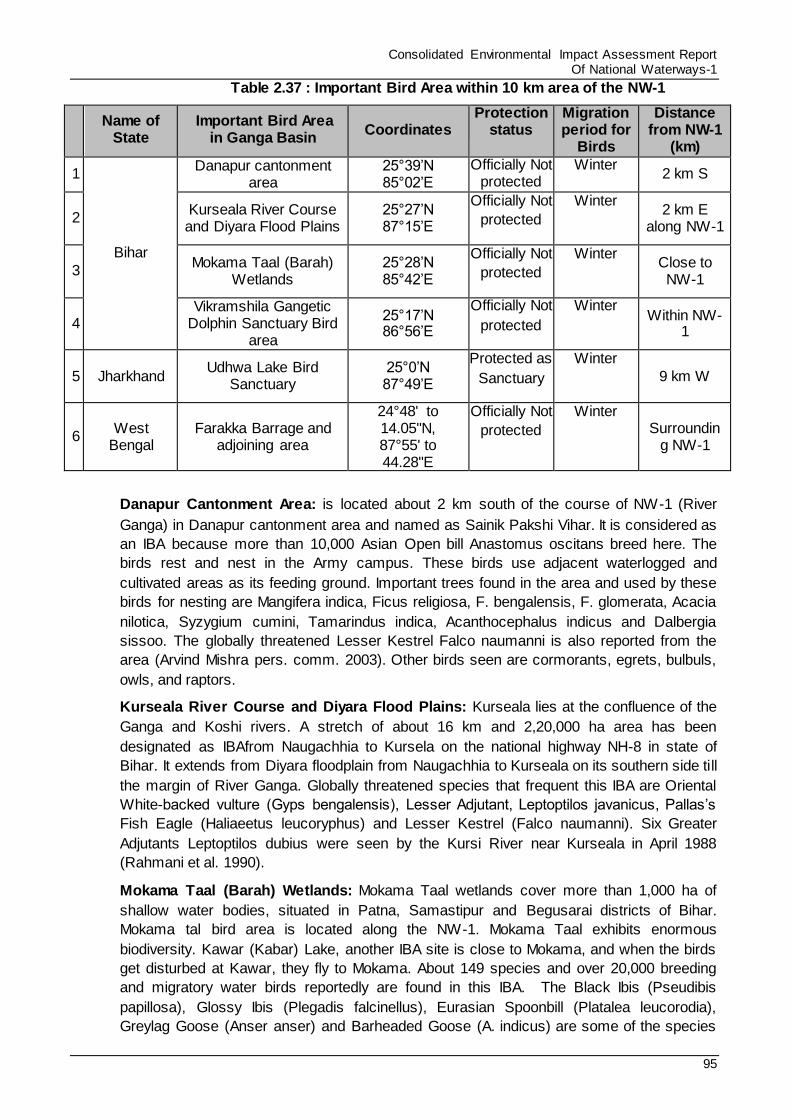
Consolidated Environmental Impact Assessment Report Of National Waterways-1
95
Table 2.37 : Important Bird Area within 10 km area of the NW-1
Name of
State Important Bird Area
in Ganga Basin Coordinates
Protection status
Migration period for
Birds
Distance from NW-1
(km)
1
Bihar
Danapur cantonment area
25°39’N 85°02’E
Officially Not protected
Winter 2 km S
2 Kurseala River Course and Diyara Flood Plains
25°27’N 87°15’E
Officially Not
protected
Winter 2 km E
along NW-1
3 Mokama Taal (Barah)
Wetlands 25°28’N 85°42’E
Officially Not
protected
Winter Close to NW-1
4 Vikramshila Gangetic
Dolphin Sanctuary Bird area
25°17’N 86°56’E
Officially Not
protected
Winter Within NW-
1
5 Jharkhand Udhwa Lake Bird
Sanctuary 25°0’N 87°49’E
Protected as
Sanctuary
Winter 9 km W
6 West
Bengal Farakka Barrage and
adjoining area
24°48' to 14.05"N, 87°55' to 44.28"E
Officially Not
protected
Winter Surroundin
g NW-1
Danapur Cantonment Area: is located about 2 km south of the course of NW-1 (River
Ganga) in Danapur cantonment area and named as Sainik Pakshi Vihar. It is considered as
an IBA because more than 10,000 Asian Open bill Anastomus oscitans breed here. The
birds rest and nest in the Army campus. These birds use adjacent waterlogged and
cultivated areas as its feeding ground. Important trees found in the area and used by these
birds for nesting are Mangifera indica, Ficus religiosa, F. bengalensis, F. glomerata, Acacia
nilotica, Syzygium cumini, Tamarindus indica, Acanthocephalus indicus and Dalbergia
sissoo. The globally threatened Lesser Kestrel Falco naumanni is also reported from the
area (Arvind Mishra pers. comm. 2003). Other birds seen are cormorants, egrets, bulbuls,
owls, and raptors.
Kurseala River Course and Diyara Flood Plains: Kurseala lies at the confluence of the
Ganga and Koshi rivers. A stretch of about 16 km and 2,20,000 ha area has been
designated as IBAfrom Naugachhia to Kursela on the national highway NH-8 in state of
Bihar. It extends from Diyara floodplain from Naugachhia to Kurseala on its southern side till
the margin of River Ganga. Globally threatened species that frequent this IBA are Oriental
White-backed vulture (Gyps bengalensis), Lesser Adjutant, Leptoptilos javanicus, Pallas’s
Fish Eagle (Haliaeetus leucoryphus) and Lesser Kestrel (Falco naumanni). Six Greater
Adjutants Leptoptilos dubius were seen by the Kursi River near Kurseala in April 1988
(Rahmani et al. 1990).
Mokama Taal (Barah) Wetlands: Mokama Taal wetlands cover more than 1,000 ha of
shallow water bodies, situated in Patna, Samastipur and Begusarai districts of Bihar.
Mokama tal bird area is located along the NW-1. Mokama Taal exhibits enormous
biodiversity. Kawar (Kabar) Lake, another IBA site is close to Mokama, and when the birds
get disturbed at Kawar, they fly to Mokama. About 149 species and over 20,000 breeding
and migratory water birds reportedly are found in this IBA. The Black Ibis (Pseudibis
papillosa), Glossy Ibis (Plegadis falcinellus), Eurasian Spoonbill (Platalea leucorodia),
Greylag Goose (Anser anser) and Barheaded Goose (A. indicus) are some of the species
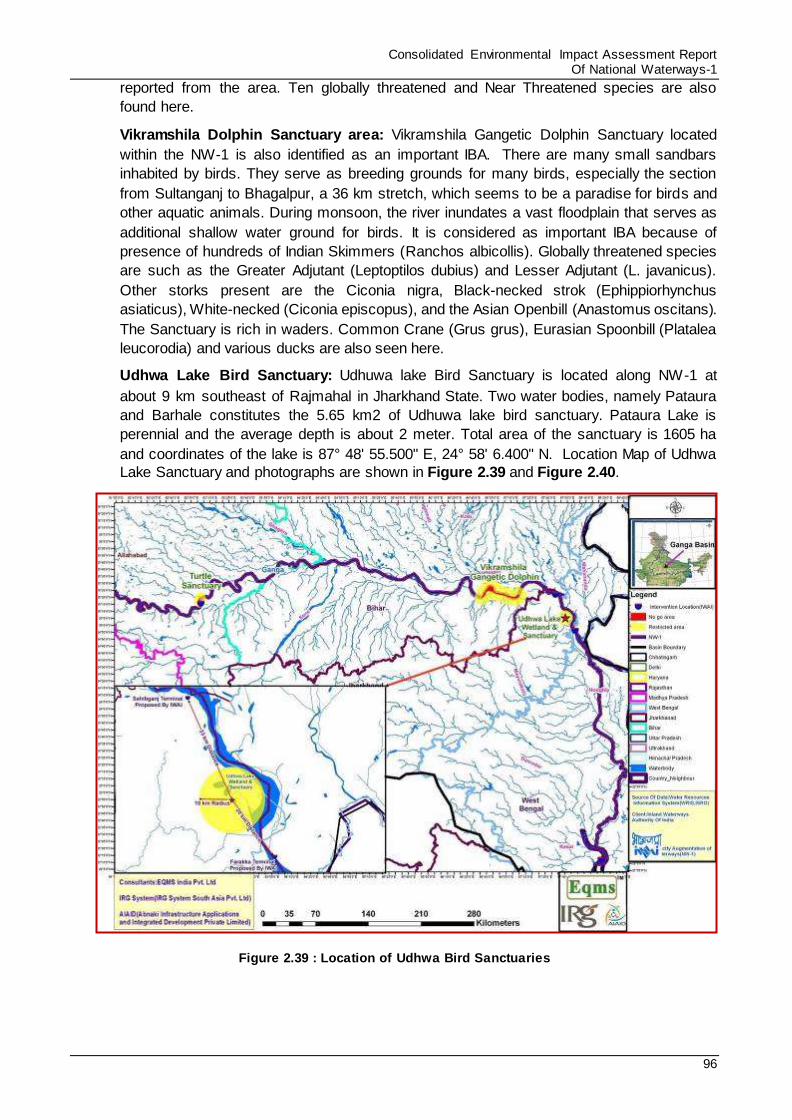
Consolidated Environmental Impact Assessment Report Of National Waterways-1
96
reported from the area. Ten globally threatened and Near Threatened species are also
found here.
Vikramshila Dolphin Sanctuary area: Vikramshila Gangetic Dolphin Sanctuary located
within the NW-1 is also identified as an important IBA. There are many small sandbars
inhabited by birds. They serve as breeding grounds for many birds, especially the section
from Sultanganj to Bhagalpur, a 36 km stretch, which seems to be a paradise for birds and
other aquatic animals. During monsoon, the river inundates a vast floodplain that serves as
additional shallow water ground for birds. It is considered as important IBA because of
presence of hundreds of Indian Skimmers (Ranchos albicollis). Globally threatened species
are such as the Greater Adjutant (Leptoptilos dubius) and Lesser Adjutant (L. javanicus).
Other storks present are the Ciconia nigra, Black-necked strok (Ephippiorhynchus
asiaticus), White-necked (Ciconia episcopus), and the Asian Openbill (Anastomus oscitans).
The Sanctuary is rich in waders. Common Crane (Grus grus), Eurasian Spoonbill (Platalea
leucorodia) and various ducks are also seen here.
Udhwa Lake Bird Sanctuary: Udhuwa lake Bird Sanctuary is located along NW-1 at
about 9 km southeast of Rajmahal in Jharkhand State. Two water bodies, namely Pataura
and Barhale constitutes the 5.65 km2 of Udhuwa lake bird sanctuary. Pataura Lake is
perennial and the average depth is about 2 meter. Total area of the sanctuary is 1605 ha
and coordinates of the lake is 87° 48' 55.500" E, 24° 58' 6.400" N. Location Map of Udhwa
Lake Sanctuary and photographs are shown in Figure 2.39 and Figure 2.40.
Figure 2.39 : Location of Udhwa Bird Sanctuaries
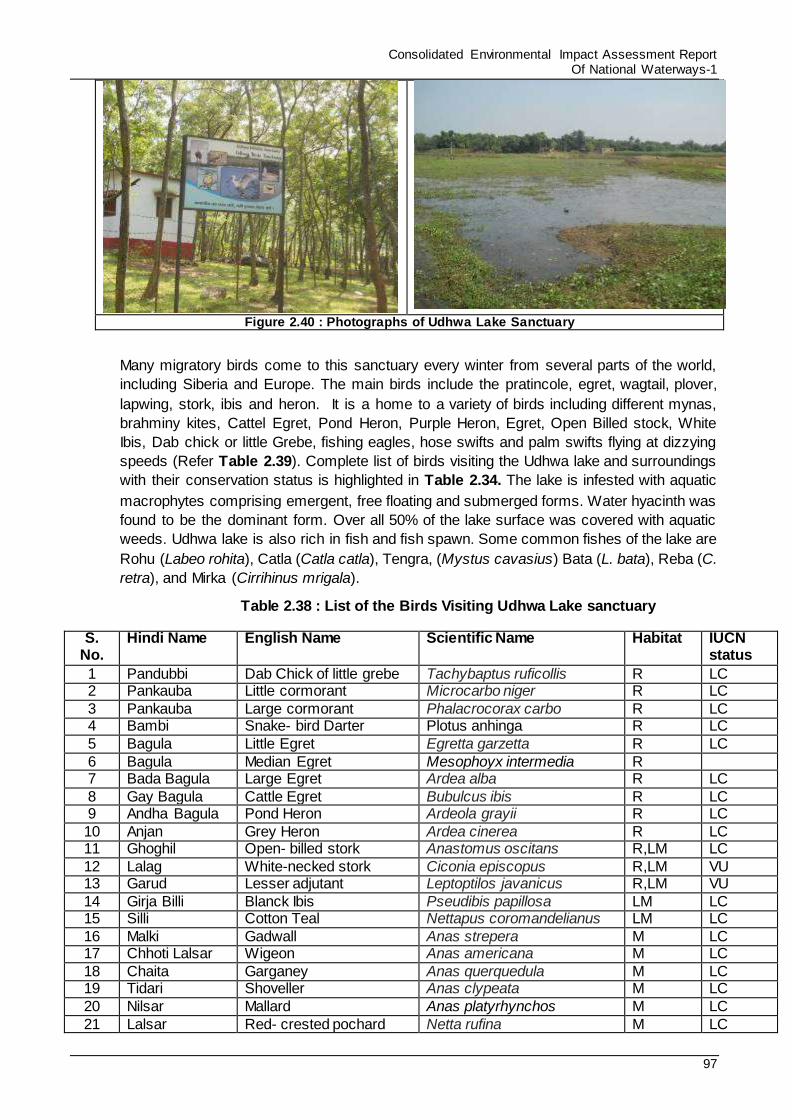
Consolidated Environmental Impact Assessment Report Of National Waterways-1
97
Figure 2.40 : Photographs of Udhwa Lake Sanctuary
Many migratory birds come to this sanctuary every winter from several parts of the world,
including Siberia and Europe. The main birds include the pratincole, egret, wagtail, plover,
lapwing, stork, ibis and heron. It is a home to a variety of birds including different mynas,
brahminy kites, Cattel Egret, Pond Heron, Purple Heron, Egret, Open Billed stock, White
Ibis, Dab chick or little Grebe, fishing eagles, hose swifts and palm swifts flying at dizzying
speeds (Refer Table 2.39). Complete list of birds visiting the Udhwa lake and surroundings
with their conservation status is highlighted in Table 2.34. The lake is infested with aquatic
macrophytes comprising emergent, free floating and submerged forms. Water hyacinth was
found to be the dominant form. Over all 50% of the lake surface was covered with aquatic
weeds. Udhwa lake is also rich in fish and fish spawn. Some common fishes of the lake are
Rohu (Labeo rohita), Catla (Catla catla), Tengra, (Mystus cavasius) Bata (L. bata), Reba (C.
retra), and Mirka (Cirrihinus mrigala).
Table 2.38 : List of the Birds Visiting Udhwa Lake sanctuary
S. No.
Hindi Name English Name Scientific Name Habitat IUCN status
1 Pandubbi Dab Chick of little grebe Tachybaptus ruficollis R LC 2 Pankauba Little cormorant Microcarbo niger R LC
3 Pankauba Large cormorant Phalacrocorax carbo R LC 4 Bambi Snake- bird Darter Plotus anhinga R LC
5 Bagula Little Egret Egretta garzetta R LC
6 Bagula Median Egret Mesophoyx intermedia R 7 Bada Bagula Large Egret Ardea alba R LC
8 Gay Bagula Cattle Egret Bubulcus ibis R LC 9 Andha Bagula Pond Heron Ardeola grayii R LC
10 Anjan Grey Heron Ardea cinerea R LC 11 Ghoghil Open- billed stork Anastomus oscitans R,LM LC
12 Lalag White-necked stork Ciconia episcopus R,LM VU 13 Garud Lesser adjutant Leptoptilos javanicus R,LM VU
14 Girja Billi Blanck Ibis Pseudibis papillosa LM LC 15 Silli Cotton Teal Nettapus coromandelianus LM LC
16 Malki Gadwall Anas strepera M LC 17 Chhoti Lalsar Wigeon Anas americana M LC
18 Chaita Garganey Anas querquedula M LC 19 Tidari Shoveller Anas clypeata M LC
20 Nilsar Mallard Anas platyrhynchos M LC
21 Lalsar Red- crested pochard Netta rufina M LC
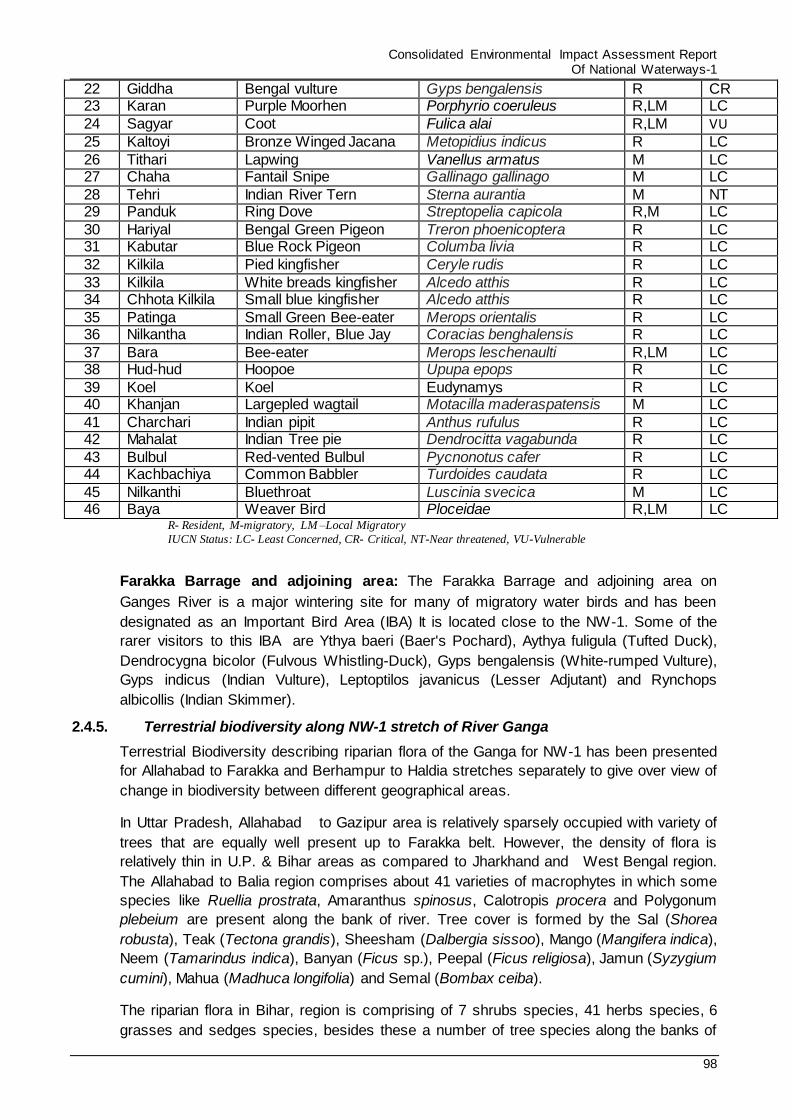
Consolidated Environmental Impact Assessment Report Of National Waterways-1
98
22 Giddha Bengal vulture Gyps bengalensis R CR 23 Karan Purple Moorhen Porphyrio coeruleus R,LM LC
24 Sagyar Coot Fulica alai R,LM VU
25 Kaltoyi Bronze Winged Jacana Metopidius indicus R LC
26 Tithari Lapwing Vanellus armatus M LC 27 Chaha Fantail Snipe Gallinago gallinago M LC
28 Tehri Indian River Tern Sterna aurantia M NT 29 Panduk Ring Dove Streptopelia capicola R,M LC
30 Hariyal Bengal Green Pigeon Treron phoenicoptera R LC 31 Kabutar Blue Rock Pigeon Columba livia R LC
32 Kilkila Pied kingfisher Ceryle rudis R LC
33 Kilkila White breads kingfisher Alcedo atthis R LC 34 Chhota Kilkila Small blue kingfisher Alcedo atthis R LC
35 Patinga Small Green Bee-eater Merops orientalis R LC 36 Nilkantha Indian Roller, Blue Jay Coracias benghalensis R LC
37 Bara Bee-eater Merops leschenaulti R,LM LC 38 Hud-hud Hoopoe Upupa epops R LC
39 Koel Koel Eudynamys R LC 40 Khanjan Largepled wagtail Motacilla maderaspatensis M LC
41 Charchari Indian pipit Anthus rufulus R LC 42 Mahalat Indian Tree pie Dendrocitta vagabunda R LC
43 Bulbul Red-vented Bulbul Pycnonotus cafer R LC 44 Kachbachiya Common Babbler Turdoides caudata R LC
45 Nilkanthi Bluethroat Luscinia svecica M LC 46 Baya Weaver Bird Ploceidae R,LM LC
R- Resident, M-migratory, LM –Local Migratory
IUCN Status: LC- Least Concerned, CR- Critical, NT-Near threatened, VU-Vulnerable
Farakka Barrage and adjoining area: The Farakka Barrage and adjoining area on
Ganges River is a major wintering site for many of migratory water birds and has been
designated as an Important Bird Area (IBA) It is located close to the NW-1. Some of the
rarer visitors to this IBA are Ythya baeri (Baer's Pochard), Aythya fuligula (Tufted Duck),
Dendrocygna bicolor (Fulvous Whistling-Duck), Gyps bengalensis (White-rumped Vulture),
Gyps indicus (Indian Vulture), Leptoptilos javanicus (Lesser Adjutant) and Rynchops
albicollis (Indian Skimmer).
2.4.5. Terrestrial biodiversity along NW-1 stretch of River Ganga
Terrestrial Biodiversity describing riparian flora of the Ganga for NW-1 has been presented
for Allahabad to Farakka and Berhampur to Haldia stretches separately to give over view of
change in biodiversity between different geographical areas.
In Uttar Pradesh, Allahabad to Gazipur area is relatively sparsely occupied with variety of
trees that are equally well present up to Farakka belt. However, the density of flora is
relatively thin in U.P. & Bihar areas as compared to Jharkhand and West Bengal region.
The Allahabad to Balia region comprises about 41 varieties of macrophytes in which some
species like Ruellia prostrata, Amaranthus spinosus, Calotropis procera and Polygonum
plebeium are present along the bank of river. Tree cover is formed by the Sal (Shorea
robusta), Teak (Tectona grandis), Sheesham (Dalbergia sissoo), Mango (Mangifera indica),
Neem (Tamarindus indica), Banyan (Ficus sp.), Peepal (Ficus religiosa), Jamun (Syzygium
cumini), Mahua (Madhuca longifolia) and Semal (Bombax ceiba).
The riparian flora in Bihar, region is comprising of 7 shrubs species, 41 herbs species, 6
grasses and sedges species, besides these a number of tree species along the banks of
Consolidated Environmental Impact Assessment Report Of National Waterways-1
99
river is reported. The tree species in the stretch is mainly composed of Shorea robusta,
Diospyros melanoxylon, Boswellia serrata, Dalbergia sisoo, Tamarindus indica, Terminalia
tomentosa, Terminalia bellirica, Terminalia arjuna, Pterocarpus marsupium, and Madhuca
indica. 23 families comprising of 48 species in Diara land of Ganga and its tributaries are
reported. The important species of this land are Justicia peploides, Rauwolfia serpentina,
Eclipta prostrata, Leucas aspera, Desmodium gangeticum, Lippia javanica and Scoparia
dulcis.
Farakka to Haldia: The climatic condition of this region is humid, subtropical, and tropical.
Humidity is less near Farakka as compared to Haldia. Farakka to Nawadip the riparian flora
is similar as in Bihar stretch since it is freshwater flora zone. After Nawadip the salinity
increase in river water due to estuarine affect the change in riparian flora is noticed. From
Bally to Bandel about 32 species of macrophtes have been reported which includes 7
species of Asteraceae, 4 species of Euphorbiaceae, 2 of Amaranthaceae and 3 of
Cyperaceae, 2 of Polygonaceae and 1 of Poaceae. Tree species mainly comprising of
Semal (Bombax ceiba), Mango (Mangifera indica), Peepal (Ficus religiosa), Neem
(Tamarindus indica), Jackfruit (Artocarpus heterophyllus) and Pakur (Ficus lacor).Other
Macrophytes comprises of Adhatoda zeylanica, Barleria prionitis, B. cristata, Dipteracanthus
prostratus, Hygrophila auriculata, Achyranthes aspera, Alternanthera pungens, A. sessilis,
Amaranthus spp, Chenopodium album, Centella asiatica, Rauvolfia serpentine, Calotropis
procera, Leptadenia reticulate, Asparagus spp., Oroxylum indicum, Cannabis sativa,
Cyperus rotundus, Hydrilla verticillata, Marselia minuta.
From Bendel to Haldia the tree species is mainly comprised of Semal (Bombax ceiba),
Mango (Magnifera indica), Peepal (Ficus religiosa), Neem (Tamarindus indica), Jackfruit
(Artocarpus heterophyllus) and Pakur (Ficus lacor). Other macrophytes (aquatic and semi
aquatic) is Alternanthera philoxeoroides, Amaranthus spinosus, Blumea lacera, Eclipta alba,
Grangea maderaspatana, Tridax procumbens, Veronia cinerea, Xanthium strumarium,
Nasturtium indicum, Chenopodium indicum, Juncellus sp., Cyperus sp., Sida rhombifolia,
Chrozophora plicata, Croton bonpandianum, Boerhavia repens, Polygonum sp and
Chrozophora plicata species. The list of riparian flora observed during study along NW-1
stretch is given in Annexure 3.1.
2.4.6. Aquatic Biodiversity in NW-1
The aquatic fauna of NW-1 stretch comprises of phytoplankton, zooplankton, zoo-benthos,
fish, and higher aquatic vertebrates. The higher aquatic vertebrates mammalian fauna
present in NW-1 stretch (Allahabad to Haldia area are Gangetic dolphin (Platanista
gangetica gangetica) and the Smooth Coated Otter (Lutrogale perspicillata) which are
categorized as endangered species (Schedule-I). The reptile fauna found in Gangetic
system are variety of fresh water turtle species, water snake (Xenochrophis pistator),
Mugger Crocodile (Crocodilus Paluspris), estuarine (East Coast) Crocodile (C. porosus) and
Indian Gharial (Gavilialis Gangeticus). The Mugger, Crocodile and Indian Gharial are
observed rarely in NW-1 stretch. Details provided below:
Mammalian Fauna in NW-1 strech of Ganga River: In this class there are only two
species found in river Ganga. These are the Gangetic Dolphin (Platanista gangeticus) and
the smmoth coated Otter (Lutrogale perspicillata).
The most common one and most important one is the Gangetic Dolphin (Platanista
gangetica) which is a schedule-I species. As mentioned earlier this species is found
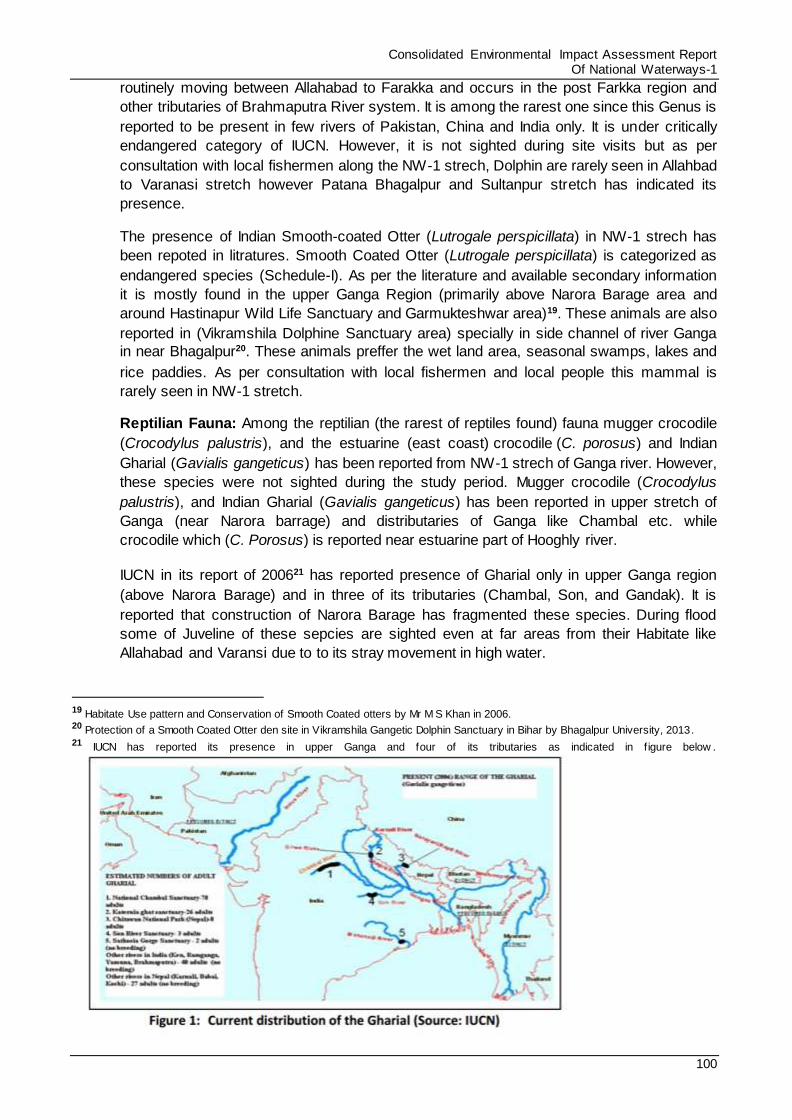
Consolidated Environmental Impact Assessment Report Of National Waterways-1
100
routinely moving between Allahabad to Farakka and occurs in the post Farkka region and
other tributaries of Brahmaputra River system. It is among the rarest one since this Genus is
reported to be present in few rivers of Pakistan, China and India only. It is under critically
endangered category of IUCN. However, it is not sighted during site visits but as per
consultation with local fishermen along the NW-1 strech, Dolphin are rarely seen in Allahbad
to Varanasi stretch however Patana Bhagalpur and Sultanpur stretch has indicated its
presence.
The presence of Indian Smooth-coated Otter (Lutrogale perspicillata) in NW-1 strech has
been repoted in litratures. Smooth Coated Otter (Lutrogale perspicillata) is categorized as
endangered species (Schedule-I). As per the literature and available secondary information
it is mostly found in the upper Ganga Region (primarily above Narora Barage area and
around Hastinapur Wild Life Sanctuary and Garmukteshwar area)19. These animals are also
reported in (Vikramshila Dolphine Sanctuary area) specially in side channel of river Ganga
in near Bhagalpur20. These animals preffer the wet land area, seasonal swamps, lakes and
rice paddies. As per consultation with local fishermen and local people this mammal is
rarely seen in NW-1 stretch.
Reptilian Fauna: Among the reptilian (the rarest of reptiles found) fauna mugger crocodile
(Crocodylus palustris), and the estuarine (east coast) crocodile (C. porosus) and Indian
Gharial (Gavialis gangeticus) has been reported from NW-1 strech of Ganga river. However,
these species were not sighted during the study period. Mugger crocodile (Crocodylus
palustris), and Indian Gharial (Gavialis gangeticus) has been reported in upper stretch of
Ganga (near Narora barrage) and distributaries of Ganga like Chambal etc. while
crocodile which (C. Porosus) is reported near estuarine part of Hooghly river.
IUCN in its report of 200621 has reported presence of Gharial only in upper Ganga region
(above Narora Barage) and in three of its tributaries (Chambal, Son, and Gandak). It is
reported that construction of Narora Barage has fragmented these species. During flood
some of Juveline of these sepcies are sighted even at far areas from their Habitate like
Allahabad and Varansi due to to its stray movement in high water.
19 Habitate Use pattern and Conservation of Smooth Coated otters by Mr M S Khan in 2006. 20 Protection of a Smooth Coated Otter den site in Vikramshila Gangetic Dolphin Sanctuary in Bihar by Bhagalpur University, 2013. 21 IUCN has reported its presence in upper Ganga and four of its tributaries as indicated in f igure below .
Consolidated Environmental Impact Assessment Report Of National Waterways-1
101
Turtles: Freshwater turtles are major biodiversity components of the aquatic ecosystem,
often serves keystone species benefiting other animals and plants. They participate in the
web of interacting and co-dependent species that constitute a healthy functioning of
ecosystem. Aspederites Gangetic (self-shell turtles), Geoclamis, Hamiltonai, ChitraIndica,
Lasimous Pechra Kachhua, Sundri Kachhua, Tentoria Kachhua, Tongoka present in in the
NW-1 strech of Ganga river.
Water Snakes: Water snakes (Xenochrophis piscator) are frequently seen in the river. But
found very low in numbers (never more than 3-10 other wise just one or two flowing with
the water current or swimming around bank) were encountered by few fishermen or bathers
in river Ganga children or the adults at various places was shared with us at Allahabad,
Varanasi, Bhagalpuer, Sultanganj Ghazipur and Farakka. These snakes are piscivorous
though can feed on the eggs of reptiles if find along the riverbanks or amphibians.
About the Ganges Shark [Glyphis gangeticus]
As detailed in Cumulative Impact Assessment Report that Ganges Shark (a critically
endangered species) does not exists in river Ganga. There is only unconfirmed report of its
presence in this river22. Considering doubbtfull presence focus of impact assessment has
been made on prominently found endengerad species.
Fishes: Though there are more than 176 species of freshwater fishes reported from
different places between Allahabad to Haldia. The major commercial fish species found in
the stretch are Rohu (Labeo rohita), mrigal (cirrhinus mrigala), katla (catla catla), kalbasu
(labeo calbasu), Magur (Clarias batrachus), Singhi (Heteropneutes fossilis), Tilapia (Oreo
cromissps.), Kavai (Anabas testudineus), Mahfish (Barbus sps), padhan (walla goattu) also
called as freshwater shark) and tengras (Mystus teengara).
Phytoplanktons, Zooplanktons and Bentos: The Allahabad to Farakka segment of River
Ganga (LG-A) comprises of fresh water zone of 701 km.The floral and faunal diversity
comprise of phytoplankton, zooplankton, zoo-benthos including macro-invertebrates, fish
and higher vertebrates. As per the secondary source23, the Phytoplankton in Ganga river
from Allahabad to Farakka segment is represented by total of 270 taxa (91 sp. of
Chlorophyceae, 81 sp. of Bacillariophyceae, 78 sp. of Cyanophyceae, 8 sp. of
Euglenophyceae, 3 sp. of Chrysophyceae, 3 sp. of Xanthophyceae, 2 sp. of Dinophyceae, 2
sp. of Rhodophyceae, 1 sp. of Cryptophyceae, 1 sp. of Synurophyceae). Zooplankton
comprises of Protozoans (8 sp.), Rotifers (26 sp.) and Crustaceans (5 sp. of Copepods and
13 sp. of Cladocerans). In this stretch, all groups are represented though are low in specific
composition. The stretch supports the zoobenthos i.e. Insects (43%), Annelids (21%) and
Molluscs (36%). Nematodes are also reported in the stretch. Fish in the stretch is
represented by total of 121 species belonging to 35 families. Thirty-five commercially
important fishes are included in the taxa along with six invasive species. Beside the
preponderance of fish species in this zone, an aquatic mammal, Gangetic dolphinis also
present in the Bihar stretch.
22 R.K. Sinha (2014), and WWF has reported the presence of this in the low er stretch of Ganga (Hoogly River Region). How ever, no
additional secondary information or literature available confirming its presence in Ganga river. 23 Status of Heigher Aquatic Vertebrates in the Ganga River GRB EMP: Ganga River Basin Environmment Management Plan by
Consotorium of 7 Indian Institute of Technology.
Consolidated Environmental Impact Assessment Report Of National Waterways-1
102
286 km of stretch of Lower Ganga downstream of Farakka up to Haldiaconsist of
Phytoplankton, Zooplankton, Macrobenthos, Nekton, Macrofauna. As per the secondary
data analysis Phytoplankton distribution in this stretch is represented by 641 algal species
(Cyanophyceae 280 taxa; Chlorophyceae 206 taxa; Bacillariophyceae 115 taxa;
Rhodophyceae 17 taxa; Dinophyceae 14 taxa; Xanthophyceae 4 taxa; Euglenophyceae 3
taxa; Phaeophyceae 2 taxa) under 169 genera. The dominant algal species in lower Ganga
is Cyanophyceae followed by Chlorophyceae. The zooplankton communities in lower
Ganga basin are represented by members of Cnidaria (25 taxa), Rotifera (102 taxa),
Copepod (26 taxa), Cladocerans (53 taxa) and larval forms of Decapods and Cyclopods.
Macrobenthos and Macro-invertebrates constitute Annelida (90 taxa), Arthropoda (Total 476
taxa;240 species of Crustaceans, 33 species of Arachnids, 201 species of insects and 2
species of Merostomata), Mollusca (Total 68 taxa) and Echinodermata (17 taxa). The
Ichthyo-fauna is represented by 175 species, out of which 103 species, under 69 genera
and 37 families are strictly estuarine in nature. Detail list of flora and Fauna along NW-1
strech are presented in Annexure 3.1.
2.4.7. Primary Data analysis
Water quality parameters such as temperature, pH, turbidity, transparency etc. influence the
aquatic ecosystem. There are several aquatic floral species present in the riparian zone and
in aquatic habitat along the whole NW-1 stretch. Detailed survey for aquatic flora and fauna
(Phytoplankton, zooplankton, zoo-benthos including macro-invertebrates, fish and higher
vertebrates) were conducted during June 2015 to September 2015 along the NW-1.
Phytoplankton/ zoolplanktons, benthos and fish sampling was performed at different
location along the NW-1 stretch. The floral and faunal diversity comprise of phytoplankton,
zooplankton, zoo-benthos including macro-invertebrates, fish and higher vertebrates. In
Ganga river from Allahabad to Haldia, NW-1 segment total of 90 taxa (28 sp. of
Chlorophyceae, 39 sp. of Bacillariophyceae, 11 sp. of Cyanophyceae, 5 sp. of
Euglenophyceae, 5 sp. of Rhodophyceae were observed. Bacillariphyceae (diatoms)
dominated having maximum abundance as compared to cholophyceae and cyanophyceae
The Zooplankton comprises of Protozoans (11 sp.), Rotifers (10 sp.), and Crustaceans (3
sp. of Copepods and 7 sp. of Cladocerans) were observed during study period. Habitat for
Benthos in the river is aphotic zone or benthic zone. Aphotic zone of the aquatic ecosystem
is zone where sunlight is completely absent. These are depending on sediments and they
take the nutrients for their survival from sediments. The soil samples for benthos were
collected from the sediment throughout the NW-1 stretch. The most common Benthos
observed in Ganga River were Gabbia sp., Bellamya sp., Lymnaeasp, Belostomaindica and
Cybister confuses. The higher aquatic vertebrates observed in this stretch during study
period are represented by turtles and dolphins. The Ichthyo-fauna is represented by 106
species, out of which 103 species belonging to family Balilooridae, Siluridae, Cyrinidea,
Channidaea, Cobitidaea, Osplronemidae and Nandidae.
A. Phytoplanktons & Zoplanktons Observed in Sanctuary Area along NW-1
Aquatic biodiversity depends on quality of water and nutrients present in the water. The
variety of zooplankton in any aquatic system reflects the primary productivity status of the
system. However, the population of phytoplankton’s in riverine system is a sort of moving
crop. The phytoplankton originates in shallow water levels of low velocity, in streams, pools
and zones of shallow meandering of rivers. The submerged aquatic vegetation along
riparian areas developed due to accumulation of soil in the course of river serves as good
feeding grounds for fishes and their juveniles and zooplanktons. The site observations and
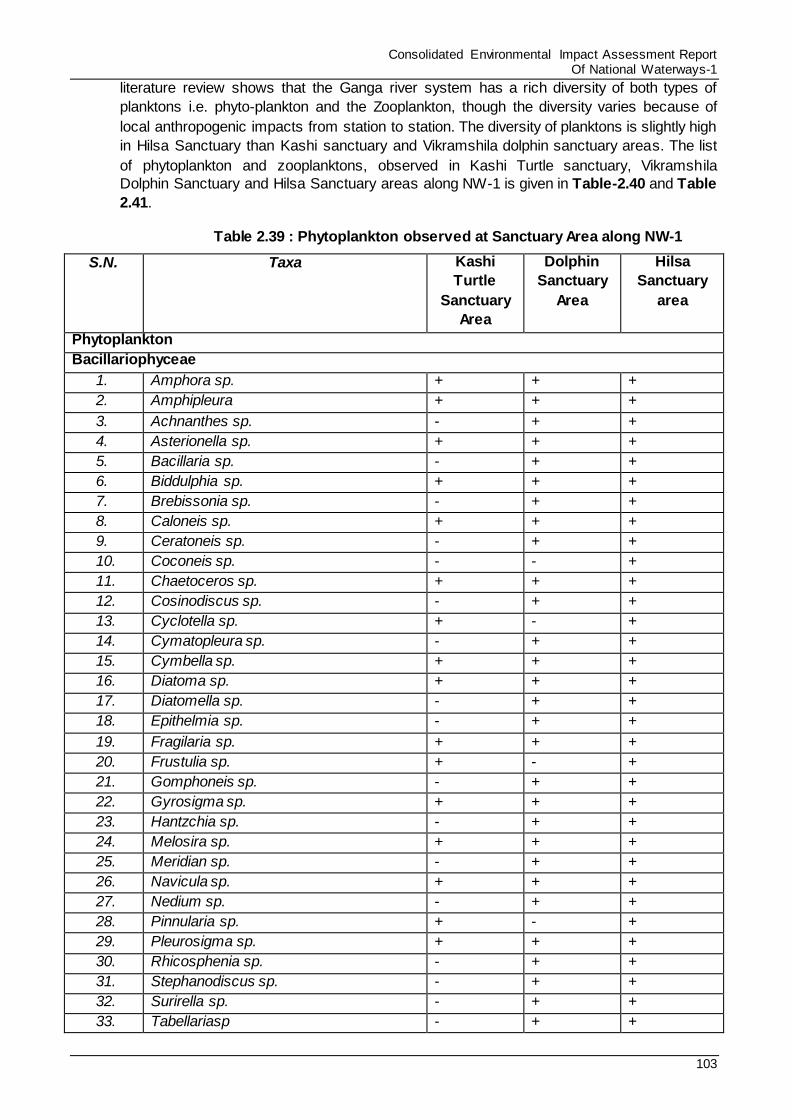
Consolidated Environmental Impact Assessment Report Of National Waterways-1
103
literature review shows that the Ganga river system has a rich diversity of both types of
planktons i.e. phyto-plankton and the Zooplankton, though the diversity varies because of
local anthropogenic impacts from station to station. The diversity of planktons is slightly high
in Hilsa Sanctuary than Kashi sanctuary and Vikramshila dolphin sanctuary areas. The list
of phytoplankton and zooplanktons, observed in Kashi Turtle sanctuary, Vikramshila
Dolphin Sanctuary and Hilsa Sanctuary areas along NW-1 is given in Table-2.40 and Table
2.41.
Table 2.39 : Phytoplankton observed at Sanctuary Area along NW-1
S.N. Taxa Kashi
Turtle
Sanctuary
Area
Dolphin
Sanctuary
Area
Hilsa
Sanctuary
area
Phytoplankton
Bacillariophyceae
1. Amphora sp. + + +
2. Amphipleura + + +
3. Achnanthes sp. - + +
4. Asterionella sp. + + +
5. Bacillaria sp. - + +
6. Biddulphia sp. + + +
7. Brebissonia sp. - + +
8. Caloneis sp. + + +
9. Ceratoneis sp. - + +
10. Coconeis sp. - - +
11. Chaetoceros sp. + + +
12. Cosinodiscus sp. - + +
13. Cyclotella sp. + - +
14. Cymatopleura sp. - + +
15. Cymbella sp. + + +
16. Diatoma sp. + + +
17. Diatomella sp. - + +
18. Epithelmia sp. - + +
19. Fragilaria sp. + + +
20. Frustulia sp. + - +
21. Gomphoneis sp. - + +
22. Gyrosigma sp. + + +
23. Hantzchia sp. - + +
24. Melosira sp. + + +
25. Meridian sp. - + +
26. Navicula sp. + + +
27. Nedium sp. - + +
28. Pinnularia sp. + - +
29. Pleurosigma sp. + + +
30. Rhicosphenia sp. - + +
31. Stephanodiscus sp. - + +
32. Surirella sp. - + +
33. Tabellariasp - + +
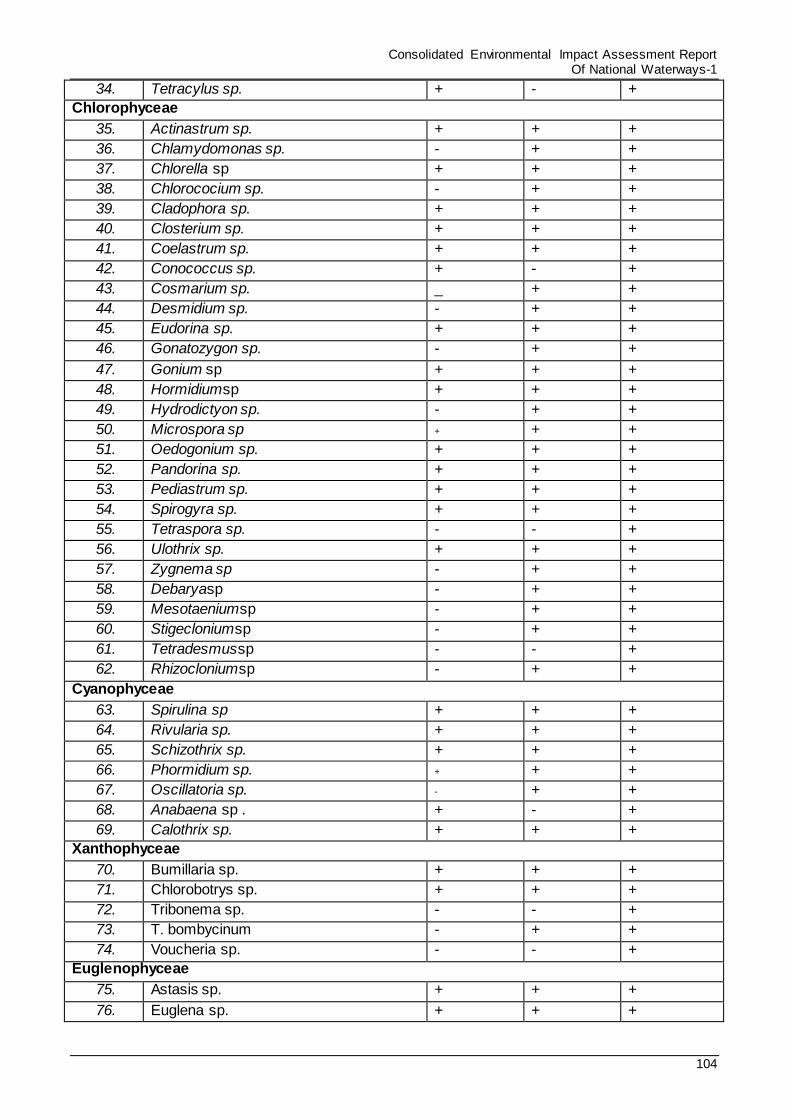
Consolidated Environmental Impact Assessment Report Of National Waterways-1
104
34. Tetracylus sp. + - +
Chlorophyceae
35. Actinastrum sp. + + +
36. Chlamydomonas sp. - + +
37. Chlorella sp + + +
38. Chlorococium sp. - + +
39. Cladophora sp. + + +
40. Closterium sp. + + +
41. Coelastrum sp. + + +
42. Conococcus sp. + - +
43. Cosmarium sp. _ + +
44. Desmidium sp. - + +
45. Eudorina sp. + + +
46. Gonatozygon sp. - + +
47. Gonium sp + + +
48. Hormidiumsp + + +
49. Hydrodictyon sp. - + +
50. Microspora sp + + +
51. Oedogonium sp. + + +
52. Pandorina sp. + + +
53. Pediastrum sp. + + +
54. Spirogyra sp. + + +
55. Tetraspora sp. - - +
56. Ulothrix sp. + + +
57. Zygnema sp - + +
58. Debaryasp - + +
59. Mesotaeniumsp - + +
60. Stigecloniumsp - + +
61. Tetradesmussp - - +
62. Rhizocloniumsp - + +
Cyanophyceae
63. Spirulina sp + + +
64. Rivularia sp. + + +
65. Schizothrix sp. + + +
66. Phormidium sp. + + +
67. Oscillatoria sp. - + +
68. Anabaena sp . + - +
69. Calothrix sp. + + +
Xanthophyceae
70. Bumillaria sp. + + +
71. Chlorobotrys sp. + + +
72. Tribonema sp. - - +
73. T. bombycinum - + +
74. Voucheria sp. - - +
Euglenophyceae
75. Astasis sp. + + +
76. Euglena sp. + + +
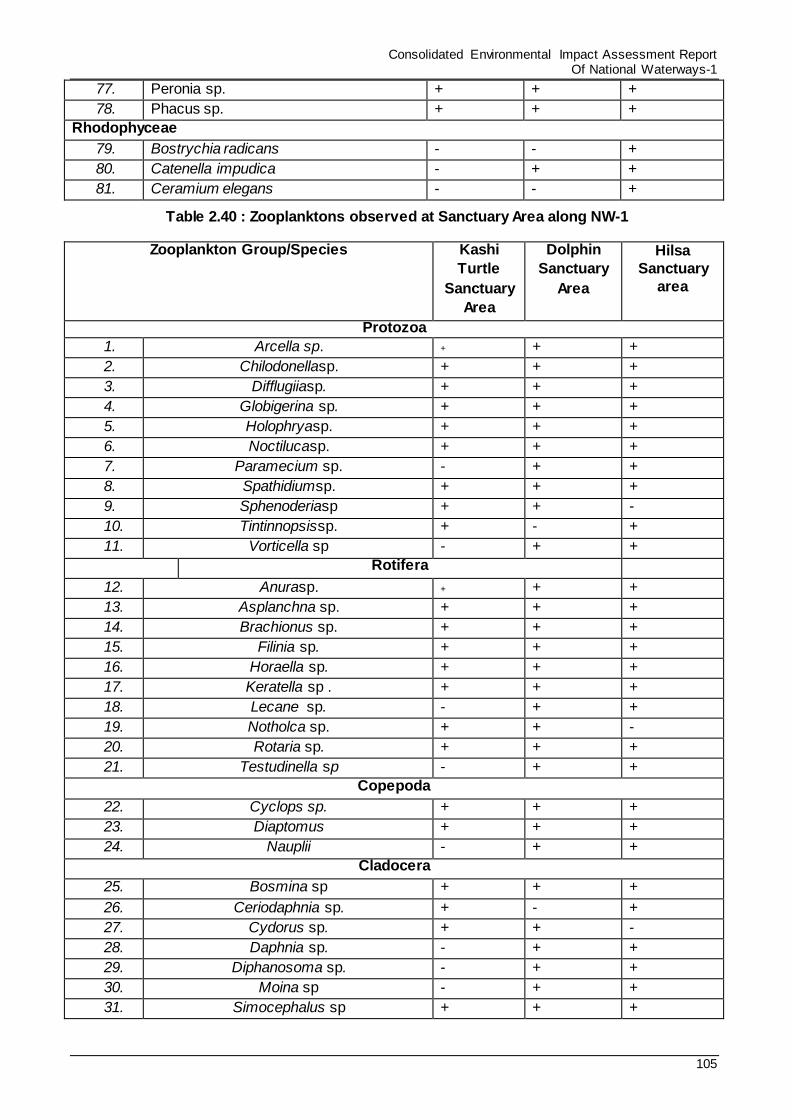
Consolidated Environmental Impact Assessment Report Of National Waterways-1
105
77. Peronia sp. + + +
78. Phacus sp. + + +
Rhodophyceae
79. Bostrychia radicans - - +
80. Catenella impudica - + +
81. Ceramium elegans - - +
Table 2.40 : Zooplanktons observed at Sanctuary Area along NW-1
Zooplankton Group/Species Kashi
Turtle
Sanctuary
Area
Dolphin
Sanctuary
Area
Hilsa
Sanctuary
area
Protozoa
1. Arcella sp. + + +
2. Chilodonellasp. + + +
3. Difflugiiasp. + + +
4. Globigerina sp. + + +
5. Holophryasp. + + +
6. Noctilucasp. + + +
7. Paramecium sp. - + +
8. Spathidiumsp. + + +
9. Sphenoderiasp + + -
10. Tintinnopsissp. + - +
11. Vorticella sp - + +
Rotifera
12. Anurasp. + + +
13. Asplanchna sp. + + +
14. Brachionus sp. + + +
15. Filinia sp. + + +
16. Horaella sp. + + +
17. Keratella sp . + + +
18. Lecane sp. - + +
19. Notholca sp. + + -
20. Rotaria sp. + + +
21. Testudinella sp - + +
Copepoda
22. Cyclops sp. + + +
23. Diaptomus + + +
24. Nauplii - + +
Cladocera
25. Bosmina sp + + +
26. Ceriodaphnia sp. + - +
27. Cydorus sp. + + -
28. Daphnia sp. - + +
29. Diphanosoma sp. - + +
30. Moina sp - + +
31. Simocephalus sp + + +
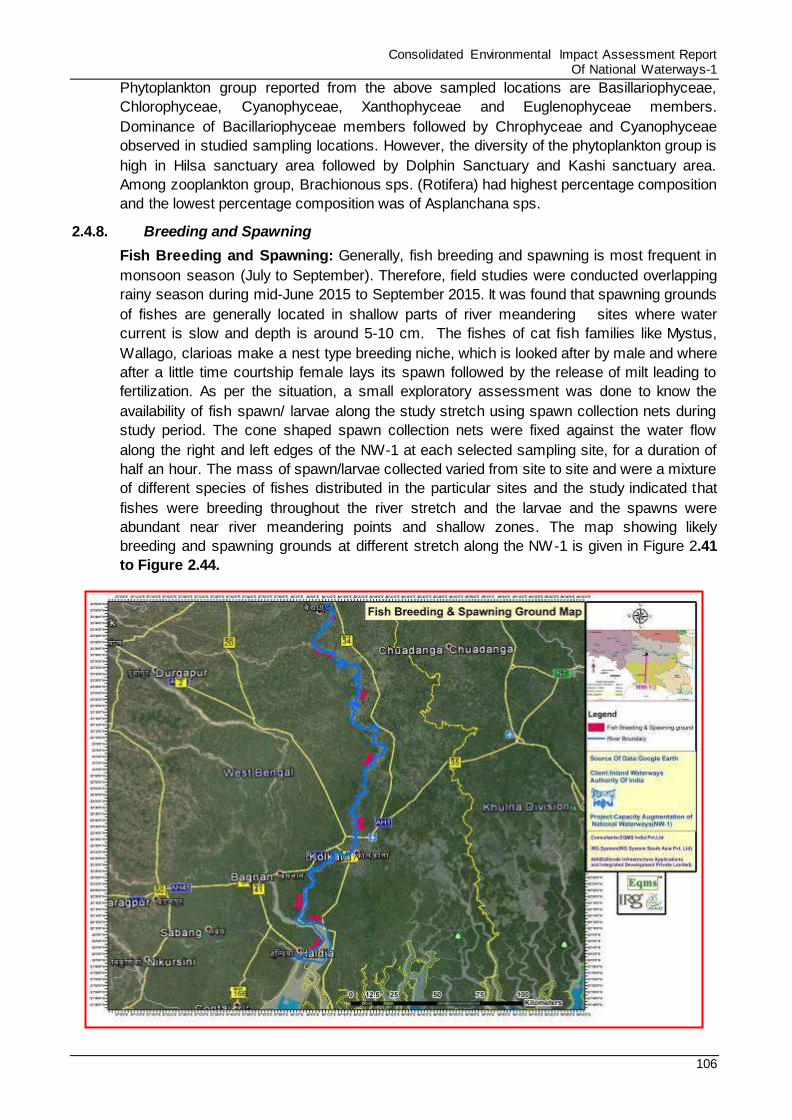
Consolidated Environmental Impact Assessment Report Of National Waterways-1
106
Phytoplankton group reported from the above sampled locations are Basillariophyceae,
Chlorophyceae, Cyanophyceae, Xanthophyceae and Euglenophyceae members.
Dominance of Bacillariophyceae members followed by Chrophyceae and Cyanophyceae
observed in studied sampling locations. However, the diversity of the phytoplankton group is
high in Hilsa sanctuary area followed by Dolphin Sanctuary and Kashi sanctuary area.
Among zooplankton group, Brachionous sps. (Rotifera) had highest percentage composition
and the lowest percentage composition was of Asplanchana sps.
2.4.8. Breeding and Spawning
Fish Breeding and Spawning: Generally, fish breeding and spawning is most frequent in
monsoon season (July to September). Therefore, field studies were conducted overlapping
rainy season during mid-June 2015 to September 2015. It was found that spawning grounds
of fishes are generally located in shallow parts of river meandering sites where water
current is slow and depth is around 5-10 cm. The fishes of cat fish families like Mystus,
Wallago, clarioas make a nest type breeding niche, which is looked after by male and where
after a little time courtship female lays its spawn followed by the release of milt leading to
fertilization. As per the situation, a small exploratory assessment was done to know the
availability of fish spawn/ larvae along the study stretch using spawn collection nets during
study period. The cone shaped spawn collection nets were fixed against the water flow
along the right and left edges of the NW-1 at each selected sampling site, for a duration of
half an hour. The mass of spawn/larvae collected varied from site to site and were a mixture
of different species of fishes distributed in the particular sites and the study indicated that
fishes were breeding throughout the river stretch and the larvae and the spawns were
abundant near river meandering points and shallow zones. The map showing likely
breeding and spawning grounds at different stretch along the NW-1 is given in Figure 2.41
to Figure 2.44.
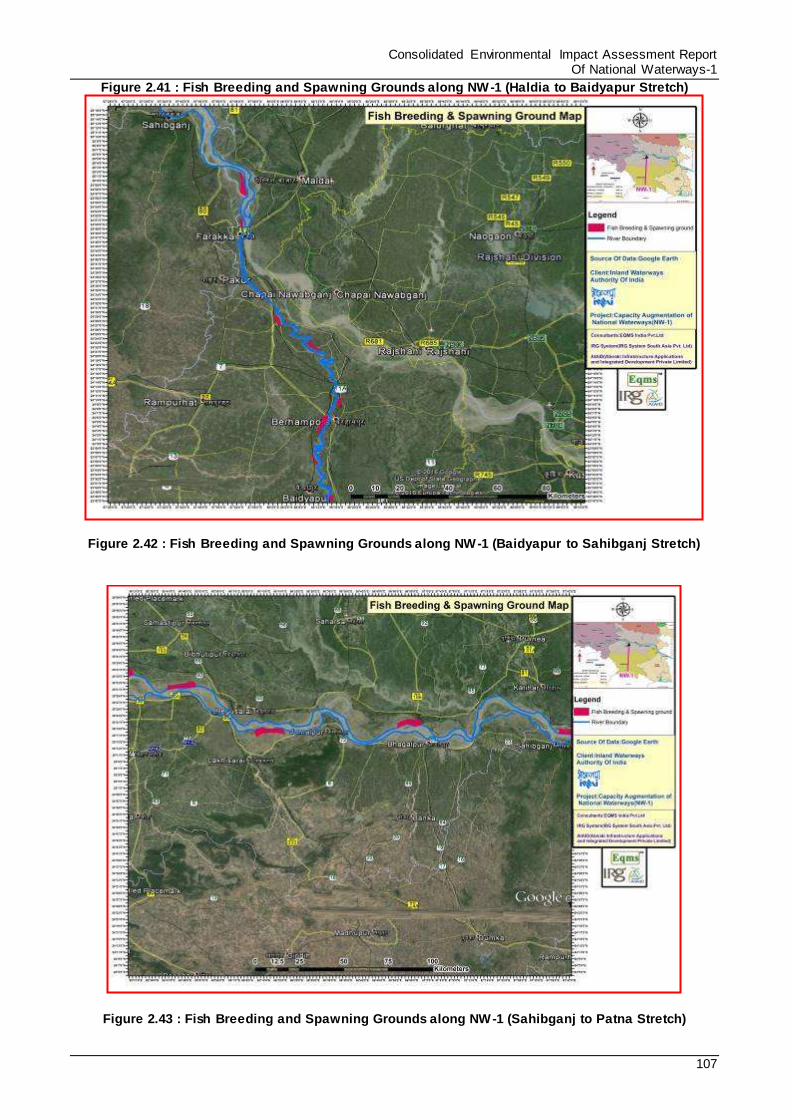
Consolidated Environmental Impact Assessment Report Of National Waterways-1
107
Figure 2.41 : Fish Breeding and Spawning Grounds along NW-1 (Haldia to Baidyapur Stretch)
Figure 2.42 : Fish Breeding and Spawning Grounds along NW-1 (Baidyapur to Sahibganj Stretch)
Figure 2.43 : Fish Breeding and Spawning Grounds along NW-1 (Sahibganj to Patna Stretch)
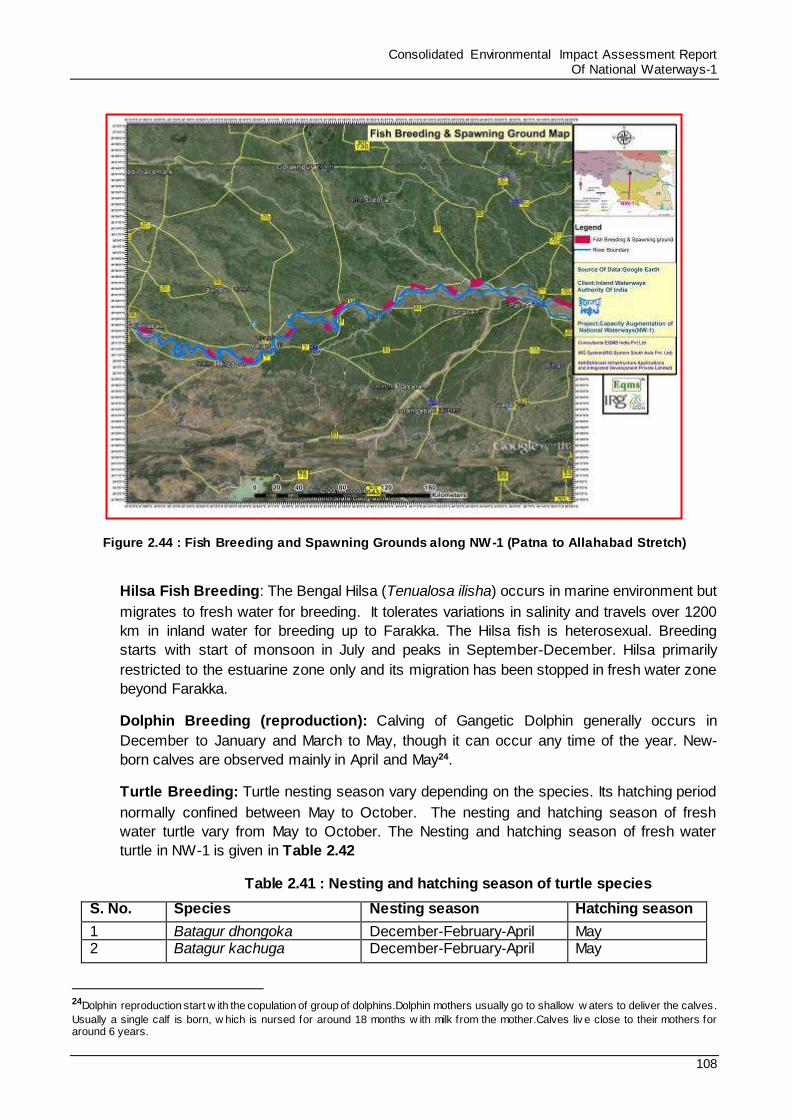
Consolidated Environmental Impact Assessment Report Of National Waterways-1
108
Figure 2.44 : Fish Breeding and Spawning Grounds along NW-1 (Patna to Allahabad Stretch)
Hilsa Fish Breeding: The Bengal Hilsa (Tenualosa ilisha) occurs in marine environment but
migrates to fresh water for breeding. It tolerates variations in salinity and travels over 1200
km in inland water for breeding up to Farakka. The Hilsa fish is heterosexual. Breeding
starts with start of monsoon in July and peaks in September-December. Hilsa primarily
restricted to the estuarine zone only and its migration has been stopped in fresh water zone
beyond Farakka.
Dolphin Breeding (reproduction): Calving of Gangetic Dolphin generally occurs in
December to January and March to May, though it can occur any time of the year. New-
born calves are observed mainly in April and May24.
Turtle Breeding: Turtle nesting season vary depending on the species. Its hatching period
normally confined between May to October. The nesting and hatching season of fresh
water turtle vary from May to October. The Nesting and hatching season of fresh water
turtle in NW-1 is given in Table 2.42
Table 2.41 : Nesting and hatching season of turtle species
S. No. Species Nesting season Hatching season
1 Batagur dhongoka December-February-April May 2 Batagur kachuga December-February-April May
24Dolphin reproduction start w ith the copulation of group of dolphins.Dolphin mothers usually go to shallow w aters to deliver the calves.
Usually a single calf is born, w hich is nursed for around 18 months w ith milk from the mother.Calves liv e close to their mothers for around 6 years.
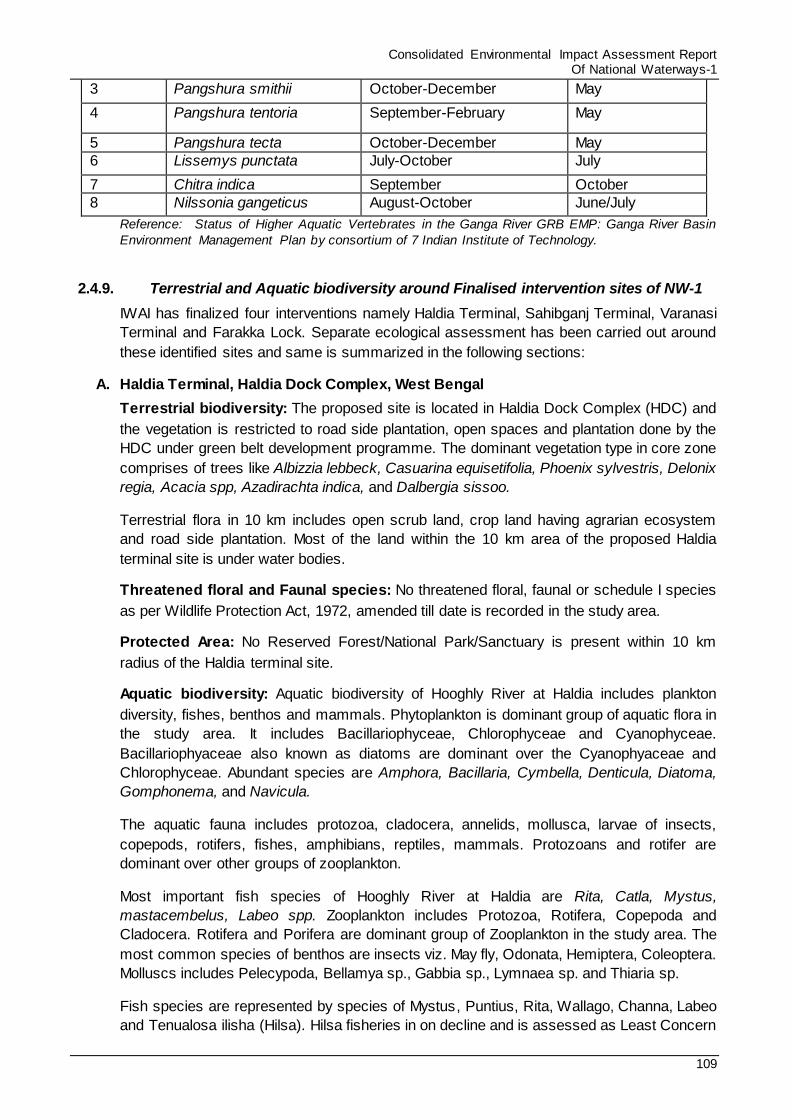
Consolidated Environmental Impact Assessment Report Of National Waterways-1
109
3 Pangshura smithii October-December May
4 Pangshura tentoria September-February May
5 Pangshura tecta October-December May
6 Lissemys punctata July-October July
7 Chitra indica September October
8 Nilssonia gangeticus August-October June/July
Reference: Status of Higher Aquatic Vertebrates in the Ganga River GRB EMP: Ganga River Basin
Environment Management Plan by consortium of 7 Indian Institute of Technology.
2.4.9. Terrestrial and Aquatic biodiversity around Finalised intervention sites of NW-1
IWAI has finalized four interventions namely Haldia Terminal, Sahibganj Terminal, Varanasi
Terminal and Farakka Lock. Separate ecological assessment has been carried out around
these identified sites and same is summarized in the following sections:
A. Haldia Terminal, Haldia Dock Complex, West Bengal
Terrestrial biodiversity: The proposed site is located in Haldia Dock Complex (HDC) and
the vegetation is restricted to road side plantation, open spaces and plantation done by the
HDC under green belt development programme. The dominant vegetation type in core zone
comprises of trees like Albizzia lebbeck, Casuarina equisetifolia, Phoenix sylvestris, Delonix
regia, Acacia spp, Azadirachta indica, and Dalbergia sissoo.
Terrestrial flora in 10 km includes open scrub land, crop land having agrarian ecosystem
and road side plantation. Most of the land within the 10 km area of the proposed Haldia
terminal site is under water bodies.
Threatened floral and Faunal species: No threatened floral, faunal or schedule I species
as per Wildlife Protection Act, 1972, amended till date is recorded in the study area.
Protected Area: No Reserved Forest/National Park/Sanctuary is present within 10 km
radius of the Haldia terminal site.
Aquatic biodiversity: Aquatic biodiversity of Hooghly River at Haldia includes plankton
diversity, fishes, benthos and mammals. Phytoplankton is dominant group of aquatic flora in
the study area. It includes Bacillariophyceae, Chlorophyceae and Cyanophyceae.
Bacillariophyaceae also known as diatoms are dominant over the Cyanophyaceae and
Chlorophyceae. Abundant species are Amphora, Bacillaria, Cymbella, Denticula, Diatoma,
Gomphonema, and Navicula.
The aquatic fauna includes protozoa, cladocera, annelids, mollusca, larvae of insects,
copepods, rotifers, fishes, amphibians, reptiles, mammals. Protozoans and rotifer are
dominant over other groups of zooplankton.
Most important fish species of Hooghly River at Haldia are Rita, Catla, Mystus,
mastacembelus, Labeo spp. Zooplankton includes Protozoa, Rotifera, Copepoda and
Cladocera. Rotifera and Porifera are dominant group of Zooplankton in the study area. The
most common species of benthos are insects viz. May fly, Odonata, Hemiptera, Coleoptera.
Molluscs includes Pelecypoda, Bellamya sp., Gabbia sp., Lymnaea sp. and Thiaria sp.
Fish species are represented by species of Mystus, Puntius, Rita, Wallago, Channa, Labeo
and Tenualosa ilisha (Hilsa). Hilsa fisheries in on decline and is assessed as Least Concern
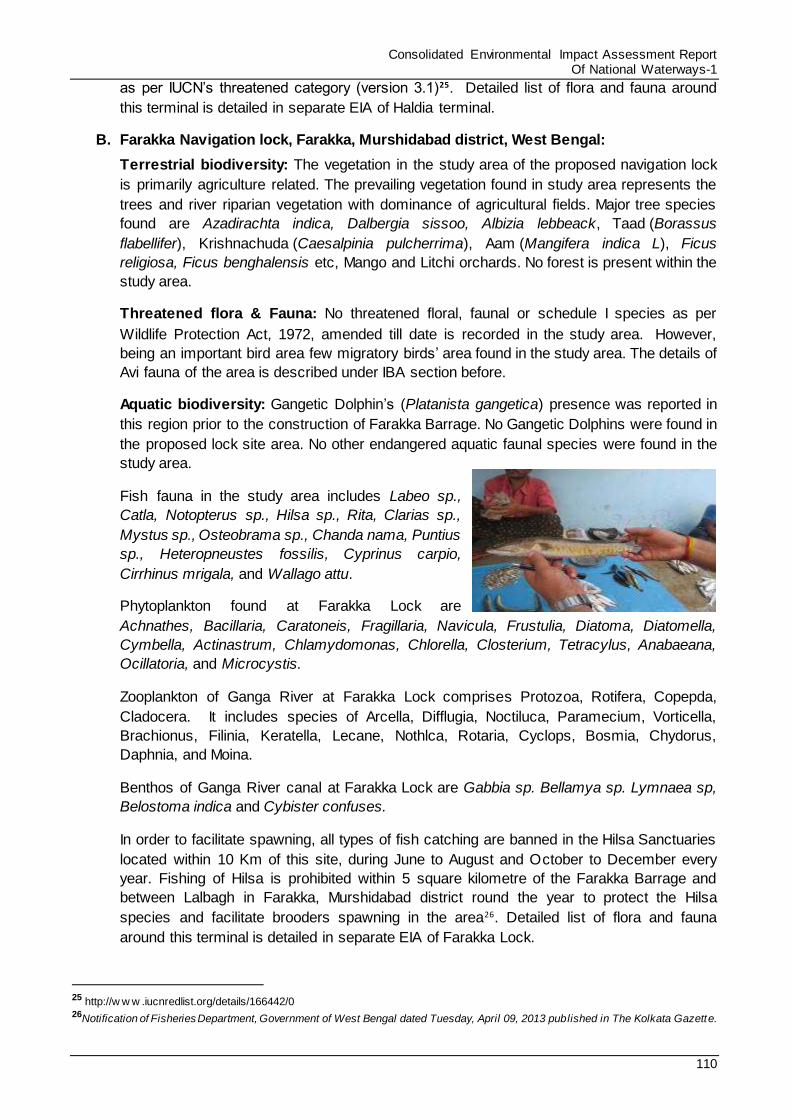
Consolidated Environmental Impact Assessment Report Of National Waterways-1
110
as per IUCN’s threatened category (version 3.1)25. Detailed list of flora and fauna around
this terminal is detailed in separate EIA of Haldia terminal.
B. Farakka Navigation lock, Farakka, Murshidabad district, West Bengal:
Terrestrial biodiversity: The vegetation in the study area of the proposed navigation lock
is primarily agriculture related. The prevailing vegetation found in study area represents the
trees and river riparian vegetation with dominance of agricultural fields. Major tree species
found are Azadirachta indica, Dalbergia sissoo, Albizia lebbeack, Taad (Borassus
flabellifer), Krishnachuda (Caesalpinia pulcherrima), Aam (Mangifera indica L), Ficus
religiosa, Ficus benghalensis etc, Mango and Litchi orchards. No forest is present within the
study area.
Threatened flora & Fauna: No threatened floral, faunal or schedule I species as per
Wildlife Protection Act, 1972, amended till date is recorded in the study area. However,
being an important bird area few migratory birds’ area found in the study area. The details of
Avi fauna of the area is described under IBA section before.
Aquatic biodiversity: Gangetic Dolphin’s (Platanista gangetica) presence was reported in
this region prior to the construction of Farakka Barrage. No Gangetic Dolphins were found in
the proposed lock site area. No other endangered aquatic faunal species were found in the
study area.
Fish fauna in the study area includes Labeo sp.,
Catla, Notopterus sp., Hilsa sp., Rita, Clarias sp.,
Mystus sp., Osteobrama sp., Chanda nama, Puntius
sp., Heteropneustes fossilis, Cyprinus carpio,
Cirrhinus mrigala, and Wallago attu.
Phytoplankton found at Farakka Lock are
Achnathes, Bacillaria, Caratoneis, Fragillaria, Navicula, Frustulia, Diatoma, Diatomella,
Cymbella, Actinastrum, Chlamydomonas, Chlorella, Closterium, Tetracylus, Anabaeana,
Ocillatoria, and Microcystis.
Zooplankton of Ganga River at Farakka Lock comprises Protozoa, Rotifera, Copepda,
Cladocera. It includes species of Arcella, Difflugia, Noctiluca, Paramecium, Vorticella,
Brachionus, Filinia, Keratella, Lecane, Nothlca, Rotaria, Cyclops, Bosmia, Chydorus,
Daphnia, and Moina.
Benthos of Ganga River canal at Farakka Lock are Gabbia sp. Bellamya sp. Lymnaea sp,
Belostoma indica and Cybister confuses.
In order to facilitate spawning, all types of fish catching are banned in the Hilsa Sanctuaries
located within 10 Km of this site, during June to August and October to December every
year. Fishing of Hilsa is prohibited within 5 square kilometre of the Farakka Barrage and
between Lalbagh in Farakka, Murshidabad district round the year to protect the Hilsa
species and facilitate brooders spawning in the area26. Detailed list of flora and fauna
around this terminal is detailed in separate EIA of Farakka Lock.
25 http://w w w .iucnredlist.org/details/166442/0 26Notification of Fisheries Department, Government of West Bengal dated Tuesday, April 09, 2013 published in The Kolkata Gazette.
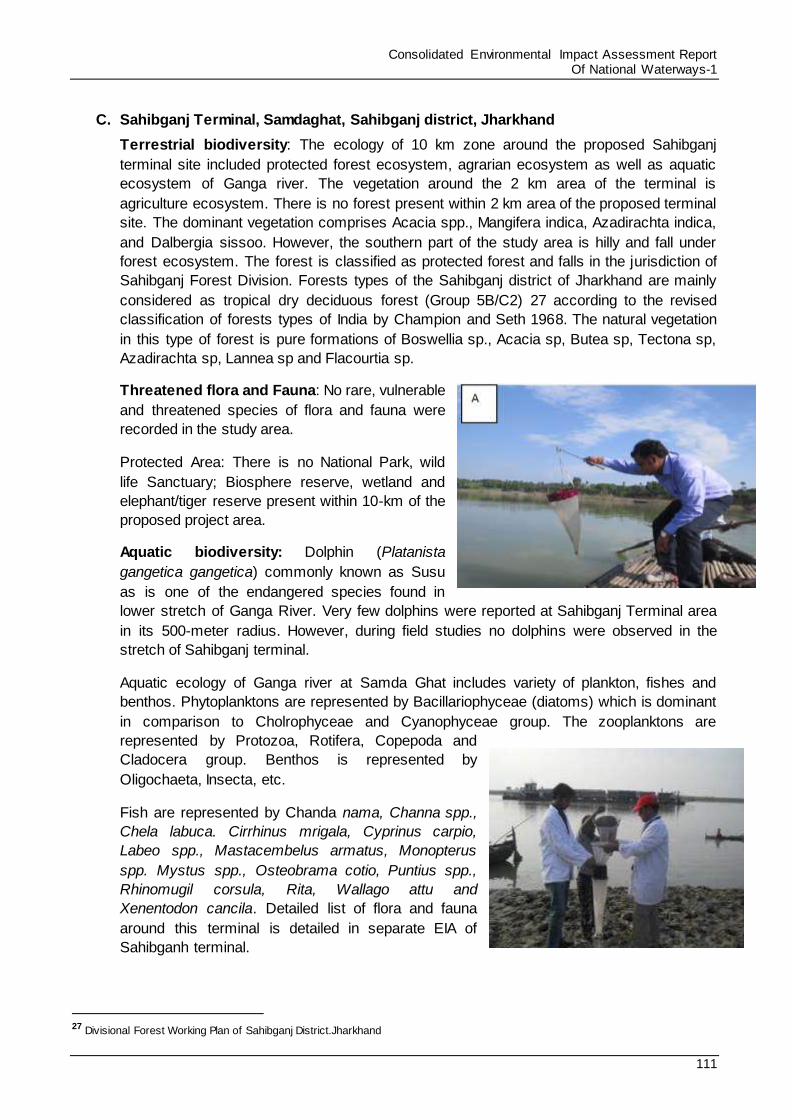
Consolidated Environmental Impact Assessment Report Of National Waterways-1
111
C. Sahibganj Terminal, Samdaghat, Sahibganj district, Jharkhand
Terrestrial biodiversity: The ecology of 10 km zone around the proposed Sahibganj
terminal site included protected forest ecosystem, agrarian ecosystem as well as aquatic
ecosystem of Ganga river. The vegetation around the 2 km area of the terminal is
agriculture ecosystem. There is no forest present within 2 km area of the proposed terminal
site. The dominant vegetation comprises Acacia spp., Mangifera indica, Azadirachta indica,
and Dalbergia sissoo. However, the southern part of the study area is hilly and fall under
forest ecosystem. The forest is classified as protected forest and falls in the jurisdiction of
Sahibganj Forest Division. Forests types of the Sahibganj district of Jharkhand are mainly
considered as tropical dry deciduous forest (Group 5B/C2) 27 according to the revised
classification of forests types of India by Champion and Seth 1968. The natural vegetation
in this type of forest is pure formations of Boswellia sp., Acacia sp, Butea sp, Tectona sp,
Azadirachta sp, Lannea sp and Flacourtia sp.
Threatened flora and Fauna: No rare, vulnerable
and threatened species of flora and fauna were
recorded in the study area.
Protected Area: There is no National Park, wild
life Sanctuary; Biosphere reserve, wetland and
elephant/tiger reserve present within 10-km of the
proposed project area.
Aquatic biodiversity: Dolphin (Platanista
gangetica gangetica) commonly known as Susu
as is one of the endangered species found in
lower stretch of Ganga River. Very few dolphins were reported at Sahibganj Terminal area
in its 500-meter radius. However, during field studies no dolphins were observed in the
stretch of Sahibganj terminal.
Aquatic ecology of Ganga river at Samda Ghat includes variety of plankton, fishes and
benthos. Phytoplanktons are represented by Bacillariophyceae (diatoms) which is dominant
in comparison to Cholrophyceae and Cyanophyceae group. The zooplanktons are
represented by Protozoa, Rotifera, Copepoda and
Cladocera group. Benthos is represented by
Oligochaeta, Insecta, etc.
Fish are represented by Chanda nama, Channa spp.,
Chela labuca. Cirrhinus mrigala, Cyprinus carpio,
Labeo spp., Mastacembelus armatus, Monopterus
spp. Mystus spp., Osteobrama cotio, Puntius spp.,
Rhinomugil corsula, Rita, Wallago attu and
Xenentodon cancila. Detailed list of flora and fauna
around this terminal is detailed in separate EIA of
Sahibganh terminal.
27 Divisional Forest Working Plan of Sahibganj District.Jharkhand
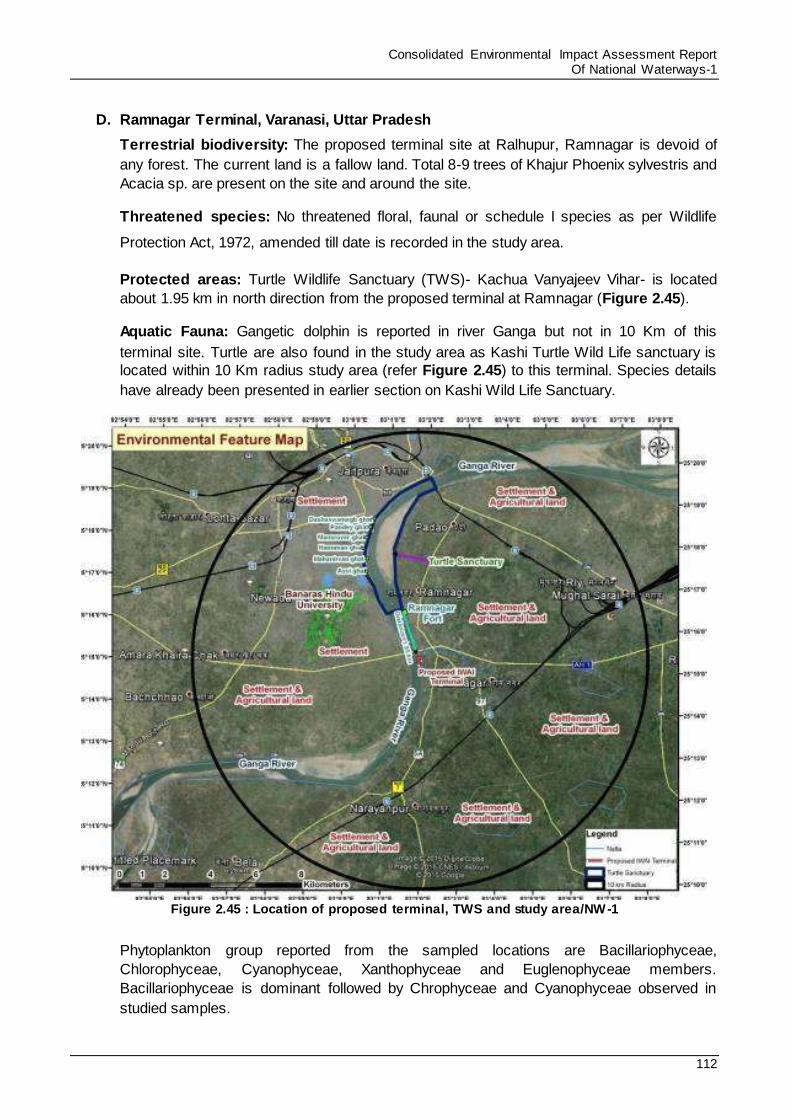
Consolidated Environmental Impact Assessment Report Of National Waterways-1
112
D. Ramnagar Terminal, Varanasi, Uttar Pradesh
Terrestrial biodiversity: The proposed terminal site at Ralhupur, Ramnagar is devoid of
any forest. The current land is a fallow land. Total 8-9 trees of Khajur Phoenix sylvestris and
Acacia sp. are present on the site and around the site.
Threatened species: No threatened floral, faunal or schedule I species as per Wildlife
Protection Act, 1972, amended till date is recorded in the study area.
Protected areas: Turtle Wildlife Sanctuary (TWS)- Kachua Vanyajeev Vihar- is located
about 1.95 km in north direction from the proposed terminal at Ramnagar (Figure 2.45).
Aquatic Fauna: Gangetic dolphin is reported in river Ganga but not in 10 Km of this
terminal site. Turtle are also found in the study area as Kashi Turtle Wild Life sanctuary is
located within 10 Km radius study area (refer Figure 2.45) to this terminal. Species details
have already been presented in earlier section on Kashi Wild Life Sanctuary.
Figure 2.45 : Location of proposed terminal, TWS and study area/NW-1
Phytoplankton group reported from the sampled locations are Bacillariophyceae,
Chlorophyceae, Cyanophyceae, Xanthophyceae and Euglenophyceae members.
Bacillariophyceae is dominant followed by Chrophyceae and Cyanophyceae observed in
studied samples.
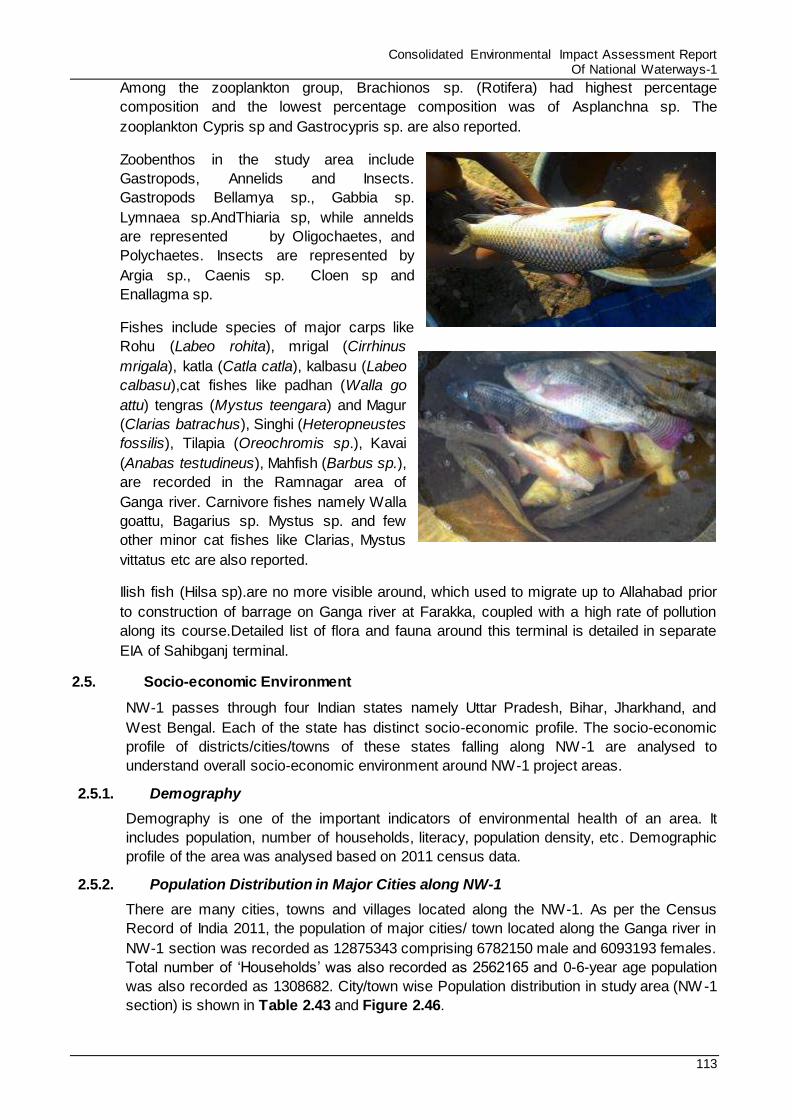
Consolidated Environmental Impact Assessment Report Of National Waterways-1
113
Among the zooplankton group, Brachionos sp. (Rotifera) had highest percentage
composition and the lowest percentage composition was of Asplanchna sp. The
zooplankton Cypris sp and Gastrocypris sp. are also reported.
Zoobenthos in the study area include
Gastropods, Annelids and Insects.
Gastropods Bellamya sp., Gabbia sp.
Lymnaea sp.AndThiaria sp, while annelds
are represented by Oligochaetes, and
Polychaetes. Insects are represented by
Argia sp., Caenis sp. Cloen sp and
Enallagma sp.
Fishes include species of major carps like
Rohu (Labeo rohita), mrigal (Cirrhinus
mrigala), katla (Catla catla), kalbasu (Labeo
calbasu),cat fishes like padhan (Walla go
attu) tengras (Mystus teengara) and Magur
(Clarias batrachus), Singhi (Heteropneustes
fossilis), Tilapia (Oreochromis sp.), Kavai
(Anabas testudineus), Mahfish (Barbus sp.),
are recorded in the Ramnagar area of
Ganga river. Carnivore fishes namely Walla
goattu, Bagarius sp. Mystus sp. and few
other minor cat fishes like Clarias, Mystus
vittatus etc are also reported.
Ilish fish (Hilsa sp).are no more visible around, which used to migrate up to Allahabad prior
to construction of barrage on Ganga river at Farakka, coupled with a high rate of pollution
along its course.Detailed list of flora and fauna around this terminal is detailed in separate
EIA of Sahibganj terminal.
2.5. Socio-economic Environment
NW-1 passes through four Indian states namely Uttar Pradesh, Bihar, Jharkhand, and
West Bengal. Each of the state has distinct socio-economic profile. The socio-economic
profile of districts/cities/towns of these states falling along NW-1 are analysed to
understand overall socio-economic environment around NW-1 project areas.
2.5.1. Demography
Demography is one of the important indicators of environmental health of an area. It
includes population, number of households, literacy, population density, etc. Demographic
profile of the area was analysed based on 2011 census data.
2.5.2. Population Distribution in Major Cities along NW-1
There are many cities, towns and villages located along the NW-1. As per the Census
Record of India 2011, the population of major cities/ town located along the Ganga river in
NW-1 section was recorded as 12875343 comprising 6782150 male and 6093193 females.
Total number of ‘Households’ was also recorded as 2562165 and 0-6-year age population
was also recorded as 1308682. City/town wise Population distribution in study area (NW-1
section) is shown in Table 2.43 and Figure 2.46.
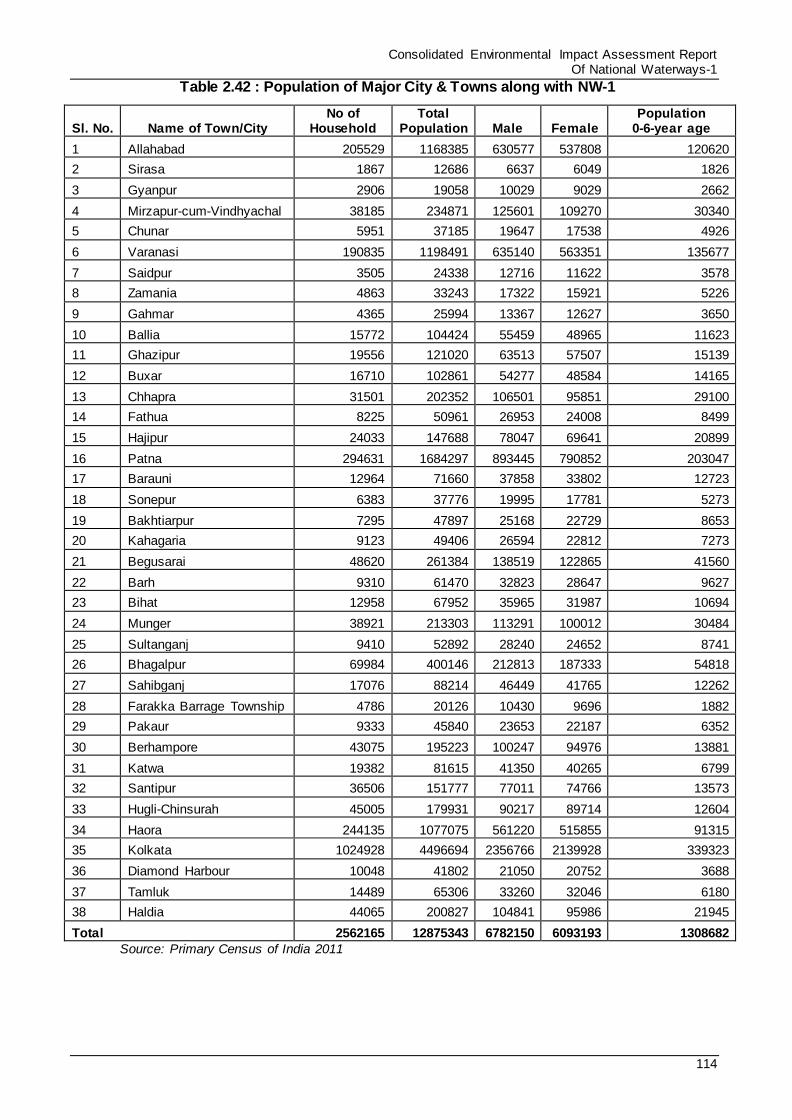
Consolidated Environmental Impact Assessment Report Of National Waterways-1
114
Table 2.42 : Population of Major City & Towns along with NW-1
Sl. No. Name of Town/City No of
Household Total
Population Male Female Population
0-6-year age
1 Allahabad 205529 1168385 630577 537808 120620
2 Sirasa 1867 12686 6637 6049 1826
3 Gyanpur 2906 19058 10029 9029 2662
4 Mirzapur-cum-Vindhyachal 38185 234871 125601 109270 30340
5 Chunar 5951 37185 19647 17538 4926
6 Varanasi 190835 1198491 635140 563351 135677
7 Saidpur 3505 24338 12716 11622 3578
8 Zamania 4863 33243 17322 15921 5226
9 Gahmar 4365 25994 13367 12627 3650
10 Ballia 15772 104424 55459 48965 11623
11 Ghazipur 19556 121020 63513 57507 15139
12 Buxar 16710 102861 54277 48584 14165
13 Chhapra 31501 202352 106501 95851 29100
14 Fathua 8225 50961 26953 24008 8499
15 Hajipur 24033 147688 78047 69641 20899
16 Patna 294631 1684297 893445 790852 203047
17 Barauni 12964 71660 37858 33802 12723
18 Sonepur 6383 37776 19995 17781 5273
19 Bakhtiarpur 7295 47897 25168 22729 8653
20 Kahagaria 9123 49406 26594 22812 7273
21 Begusarai 48620 261384 138519 122865 41560
22 Barh 9310 61470 32823 28647 9627
23 Bihat 12958 67952 35965 31987 10694
24 Munger 38921 213303 113291 100012 30484
25 Sultanganj 9410 52892 28240 24652 8741
26 Bhagalpur 69984 400146 212813 187333 54818
27 Sahibganj 17076 88214 46449 41765 12262
28 Farakka Barrage Township 4786 20126 10430 9696 1882
29 Pakaur 9333 45840 23653 22187 6352
30 Berhampore 43075 195223 100247 94976 13881
31 Katwa 19382 81615 41350 40265 6799
32 Santipur 36506 151777 77011 74766 13573
33 Hugli-Chinsurah 45005 179931 90217 89714 12604
34 Haora 244135 1077075 561220 515855 91315
35 Kolkata 1024928 4496694 2356766 2139928 339323
36 Diamond Harbour 10048 41802 21050 20752 3688
37 Tamluk 14489 65306 33260 32046 6180
38 Haldia 44065 200827 104841 95986 21945
Total 2562165 12875343 6782150 6093193 1308682
Source: Primary Census of India 2011
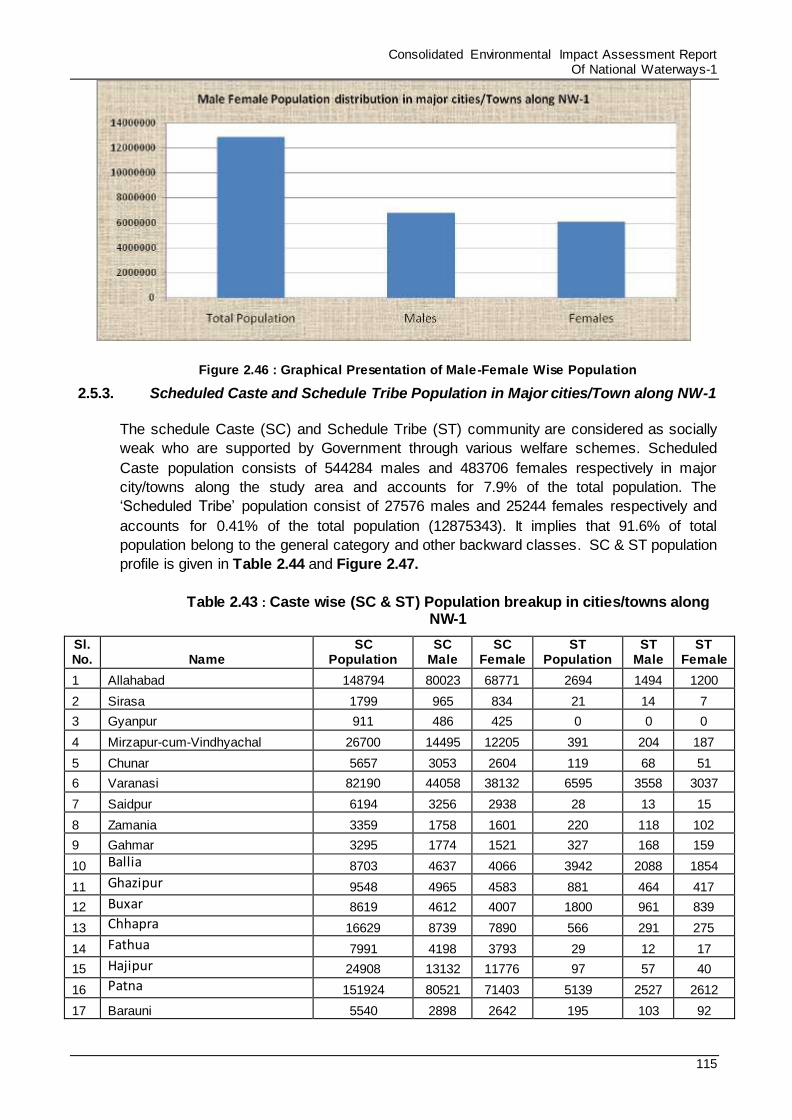
Consolidated Environmental Impact Assessment Report Of National Waterways-1
115
Figure 2.46 : Graphical Presentation of Male-Female Wise Population
2.5.3. Scheduled Caste and Schedule Tribe Population in Major cities/Town along NW-1
The schedule Caste (SC) and Schedule Tribe (ST) community are considered as socially
weak who are supported by Government through various welfare schemes. Scheduled
Caste population consists of 544284 males and 483706 females respectively in major
city/towns along the study area and accounts for 7.9% of the total population. The
‘Scheduled Tribe’ population consist of 27576 males and 25244 females respectively and
accounts for 0.41% of the total population (12875343). It implies that 91.6% of total
population belong to the general category and other backward classes. SC & ST population
profile is given in Table 2.44 and Figure 2.47.
Table 2.43 : Caste wise (SC & ST) Population breakup in cities/towns along NW-1
Sl. No. Name
SC Population
SC Male
SC Female
ST Population
ST Male
ST Female
1 Allahabad 148794 80023 68771 2694 1494 1200
2 Sirasa 1799 965 834 21 14 7
3 Gyanpur 911 486 425 0 0 0
4 Mirzapur-cum-Vindhyachal 26700 14495 12205 391 204 187
5 Chunar 5657 3053 2604 119 68 51
6 Varanasi 82190 44058 38132 6595 3558 3037
7 Saidpur 6194 3256 2938 28 13 15
8 Zamania 3359 1758 1601 220 118 102
9 Gahmar 3295 1774 1521 327 168 159
10 Ballia 8703 4637 4066 3942 2088 1854
11 Ghazipur 9548 4965 4583 881 464 417
12 Buxar 8619 4612 4007 1800 961 839
13 Chhapra 16629 8739 7890 566 291 275
14 Fathua 7991 4198 3793 29 12 17
15 Hajipur 24908 13132 11776 97 57 40
16 Patna 151924 80521 71403 5139 2527 2612
17 Barauni 5540 2898 2642 195 103 92
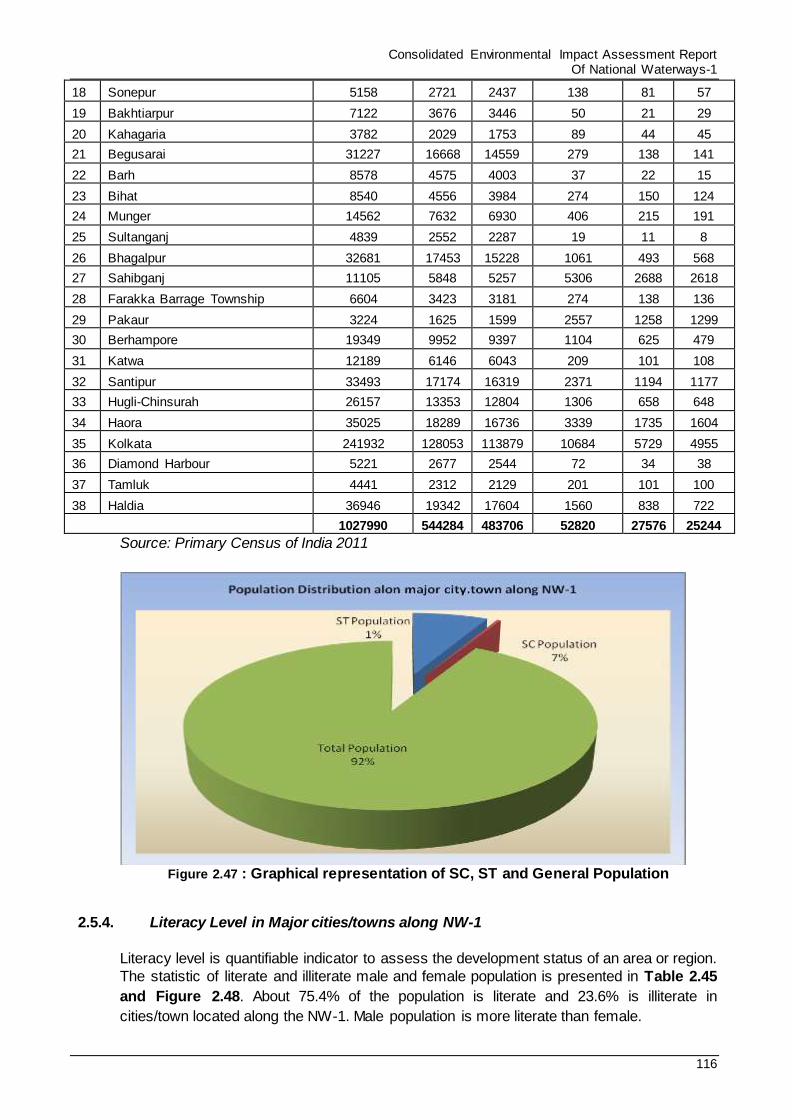
Consolidated Environmental Impact Assessment Report Of National Waterways-1
116
18 Sonepur 5158 2721 2437 138 81 57
19 Bakhtiarpur 7122 3676 3446 50 21 29
20 Kahagaria 3782 2029 1753 89 44 45
21 Begusarai 31227 16668 14559 279 138 141
22 Barh 8578 4575 4003 37 22 15
23 Bihat 8540 4556 3984 274 150 124
24 Munger 14562 7632 6930 406 215 191
25 Sultanganj 4839 2552 2287 19 11 8
26 Bhagalpur 32681 17453 15228 1061 493 568
27 Sahibganj 11105 5848 5257 5306 2688 2618
28 Farakka Barrage Township 6604 3423 3181 274 138 136
29 Pakaur 3224 1625 1599 2557 1258 1299
30 Berhampore 19349 9952 9397 1104 625 479
31 Katwa 12189 6146 6043 209 101 108
32 Santipur 33493 17174 16319 2371 1194 1177
33 Hugli-Chinsurah 26157 13353 12804 1306 658 648
34 Haora 35025 18289 16736 3339 1735 1604
35 Kolkata 241932 128053 113879 10684 5729 4955
36 Diamond Harbour 5221 2677 2544 72 34 38
37 Tamluk 4441 2312 2129 201 101 100
38 Haldia 36946 19342 17604 1560 838 722
1027990 544284 483706 52820 27576 25244
Source: Primary Census of India 2011
Figure 2.47 : Graphical representation of SC, ST and General Population
2.5.4. Literacy Level in Major cities/towns along NW-1
Literacy level is quantifiable indicator to assess the development status of an area or region.
The statistic of literate and illiterate male and female population is presented in Table 2.45
and Figure 2.48. About 75.4% of the population is literate and 23.6% is illiterate in
cities/town located along the NW-1. Male population is more literate than female.
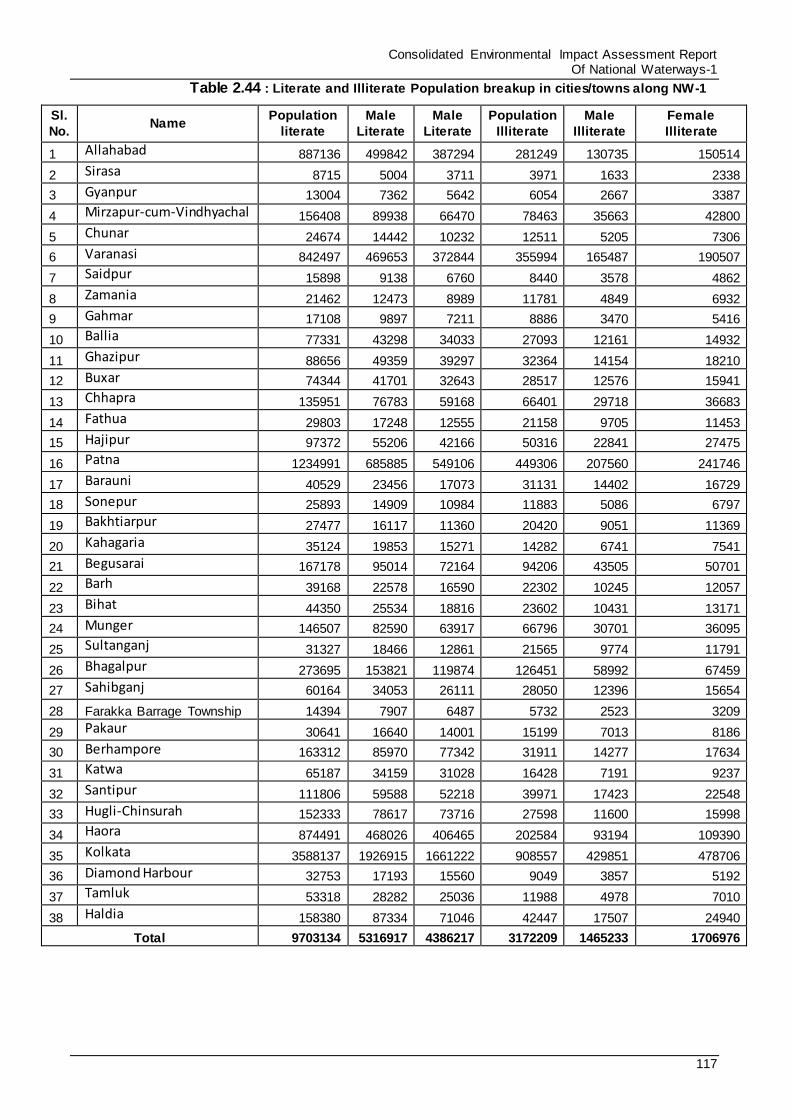
Consolidated Environmental Impact Assessment Report Of National Waterways-1
117
Table 2.44 : Literate and Illiterate Population breakup in cities/towns along NW-1
Sl.
No. Name
Population
literate
Male
Literate
Male
Literate
Population
Illiterate
Male
Illiterate Female
Illiterate
1 Allahabad 887136 499842 387294 281249 130735 150514
2 Sirasa 8715 5004 3711 3971 1633 2338
3 Gyanpur 13004 7362 5642 6054 2667 3387
4 Mirzapur-cum-Vindhyachal 156408 89938 66470 78463 35663 42800
5 Chunar 24674 14442 10232 12511 5205 7306
6 Varanasi 842497 469653 372844 355994 165487 190507
7 Saidpur 15898 9138 6760 8440 3578 4862
8 Zamania 21462 12473 8989 11781 4849 6932
9 Gahmar 17108 9897 7211 8886 3470 5416
10 Ballia 77331 43298 34033 27093 12161 14932
11 Ghazipur 88656 49359 39297 32364 14154 18210
12 Buxar 74344 41701 32643 28517 12576 15941
13 Chhapra 135951 76783 59168 66401 29718 36683
14 Fathua 29803 17248 12555 21158 9705 11453
15 Hajipur 97372 55206 42166 50316 22841 27475
16 Patna 1234991 685885 549106 449306 207560 241746
17 Barauni 40529 23456 17073 31131 14402 16729
18 Sonepur 25893 14909 10984 11883 5086 6797
19 Bakhtiarpur 27477 16117 11360 20420 9051 11369
20 Kahagaria 35124 19853 15271 14282 6741 7541
21 Begusarai 167178 95014 72164 94206 43505 50701
22 Barh 39168 22578 16590 22302 10245 12057
23 Bihat 44350 25534 18816 23602 10431 13171
24 Munger 146507 82590 63917 66796 30701 36095
25 Sultanganj 31327 18466 12861 21565 9774 11791
26 Bhagalpur 273695 153821 119874 126451 58992 67459
27 Sahibganj 60164 34053 26111 28050 12396 15654
28 Farakka Barrage Township 14394 7907 6487 5732 2523 3209
29 Pakaur 30641 16640 14001 15199 7013 8186
30 Berhampore 163312 85970 77342 31911 14277 17634
31 Katwa 65187 34159 31028 16428 7191 9237
32 Santipur 111806 59588 52218 39971 17423 22548
33 Hugli-Chinsurah 152333 78617 73716 27598 11600 15998
34 Haora 874491 468026 406465 202584 93194 109390
35 Kolkata 3588137 1926915 1661222 908557 429851 478706
36 Diamond Harbour 32753 17193 15560 9049 3857 5192
37 Tamluk 53318 28282 25036 11988 4978 7010
38 Haldia 158380 87334 71046 42447 17507 24940
Total 9703134 5316917 4386217 3172209 1465233 1706976
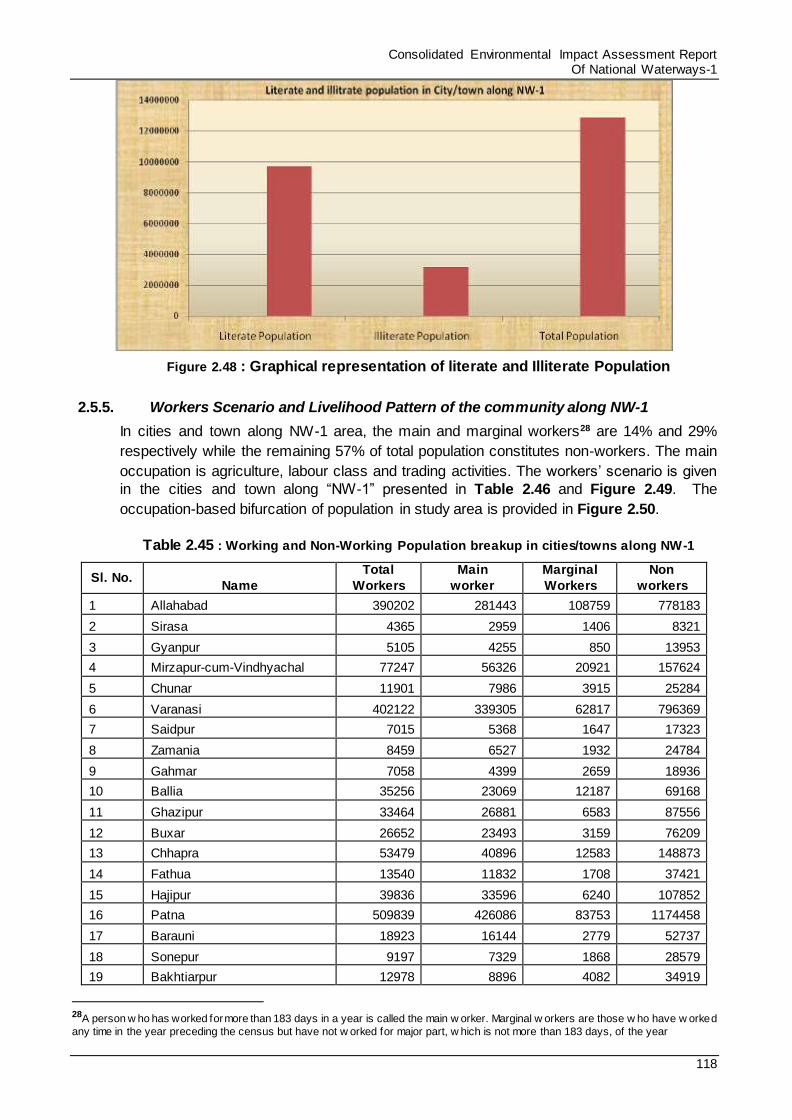
Consolidated Environmental Impact Assessment Report Of National Waterways-1
118
Figure 2.48 : Graphical representation of literate and Illiterate Population
2.5.5. Workers Scenario and Livelihood Pattern of the community along NW-1
In cities and town along NW-1 area, the main and marginal workers28 are 14% and 29%
respectively while the remaining 57% of total population constitutes non-workers. The main
occupation is agriculture, labour class and trading activities. The workers’ scenario is given
in the cities and town along “NW-1” presented in Table 2.46 and Figure 2.49. The
occupation-based bifurcation of population in study area is provided in Figure 2.50.
Table 2.45 : Working and Non-Working Population breakup in cities/towns along NW-1
Sl. No. Name
Total
Workers
Main
worker
Marginal
Workers
Non
workers
1 Allahabad 390202 281443 108759 778183
2 Sirasa 4365 2959 1406 8321
3 Gyanpur 5105 4255 850 13953
4 Mirzapur-cum-Vindhyachal 77247 56326 20921 157624
5 Chunar 11901 7986 3915 25284
6 Varanasi 402122 339305 62817 796369
7 Saidpur 7015 5368 1647 17323
8 Zamania 8459 6527 1932 24784
9 Gahmar 7058 4399 2659 18936
10 Ballia 35256 23069 12187 69168
11 Ghazipur 33464 26881 6583 87556
12 Buxar 26652 23493 3159 76209
13 Chhapra 53479 40896 12583 148873
14 Fathua 13540 11832 1708 37421
15 Hajipur 39836 33596 6240 107852
16 Patna 509839 426086 83753 1174458
17 Barauni 18923 16144 2779 52737
18 Sonepur 9197 7329 1868 28579
19 Bakhtiarpur 12978 8896 4082 34919
28A person w ho has worked for more than 183 days in a year is called the main w orker. Marginal w orkers are those w ho have w orked
any time in the year preceding the census but have not w orked for major part, w hich is not more than 183 days, of the year
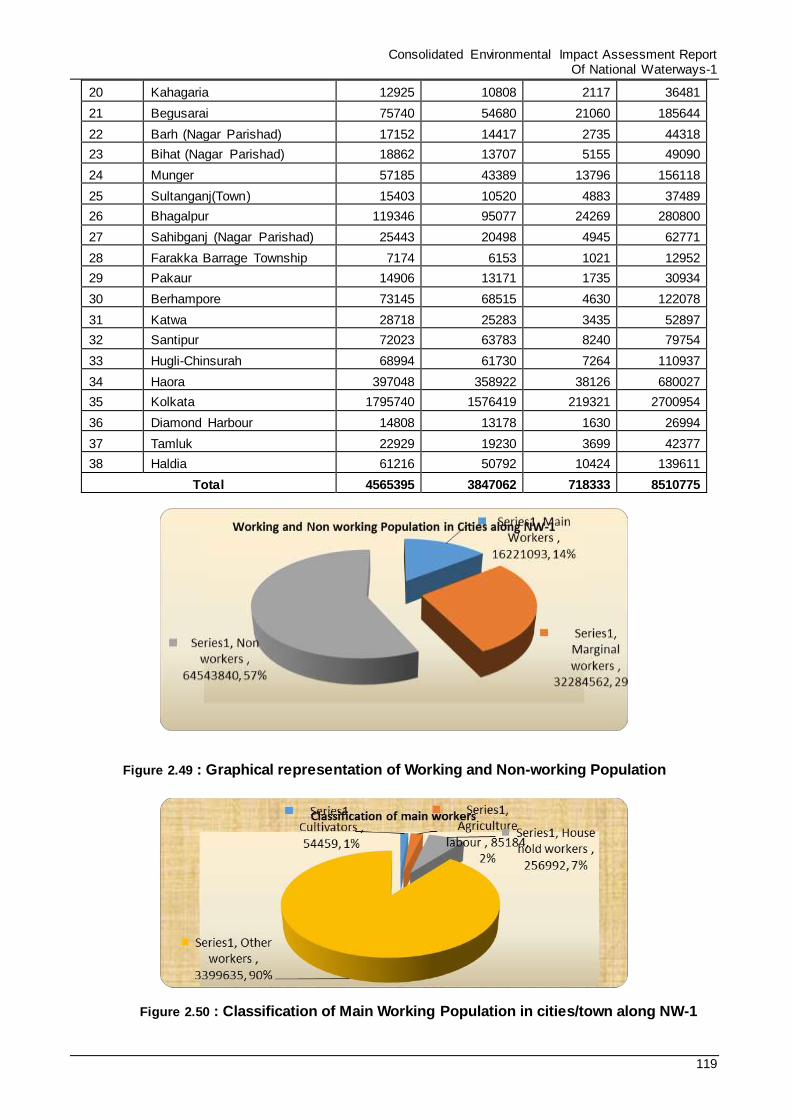
Consolidated Environmental Impact Assessment Report Of National Waterways-1
119
20 Kahagaria 12925 10808 2117 36481
21 Begusarai 75740 54680 21060 185644
22 Barh (Nagar Parishad) 17152 14417 2735 44318
23 Bihat (Nagar Parishad) 18862 13707 5155 49090
24 Munger 57185 43389 13796 156118
25 Sultanganj(Town) 15403 10520 4883 37489
26 Bhagalpur 119346 95077 24269 280800
27 Sahibganj (Nagar Parishad) 25443 20498 4945 62771
28 Farakka Barrage Township 7174 6153 1021 12952
29 Pakaur 14906 13171 1735 30934
30 Berhampore 73145 68515 4630 122078
31 Katwa 28718 25283 3435 52897
32 Santipur 72023 63783 8240 79754
33 Hugli-Chinsurah 68994 61730 7264 110937
34 Haora 397048 358922 38126 680027
35 Kolkata 1795740 1576419 219321 2700954
36 Diamond Harbour 14808 13178 1630 26994
37 Tamluk 22929 19230 3699 42377
38 Haldia 61216 50792 10424 139611
Total 4565395 3847062 718333 8510775
Figure 2.49 : Graphical representation of Working and Non-working Population
Figure 2.50 : Classification of Main Working Population in cities/town along NW-1
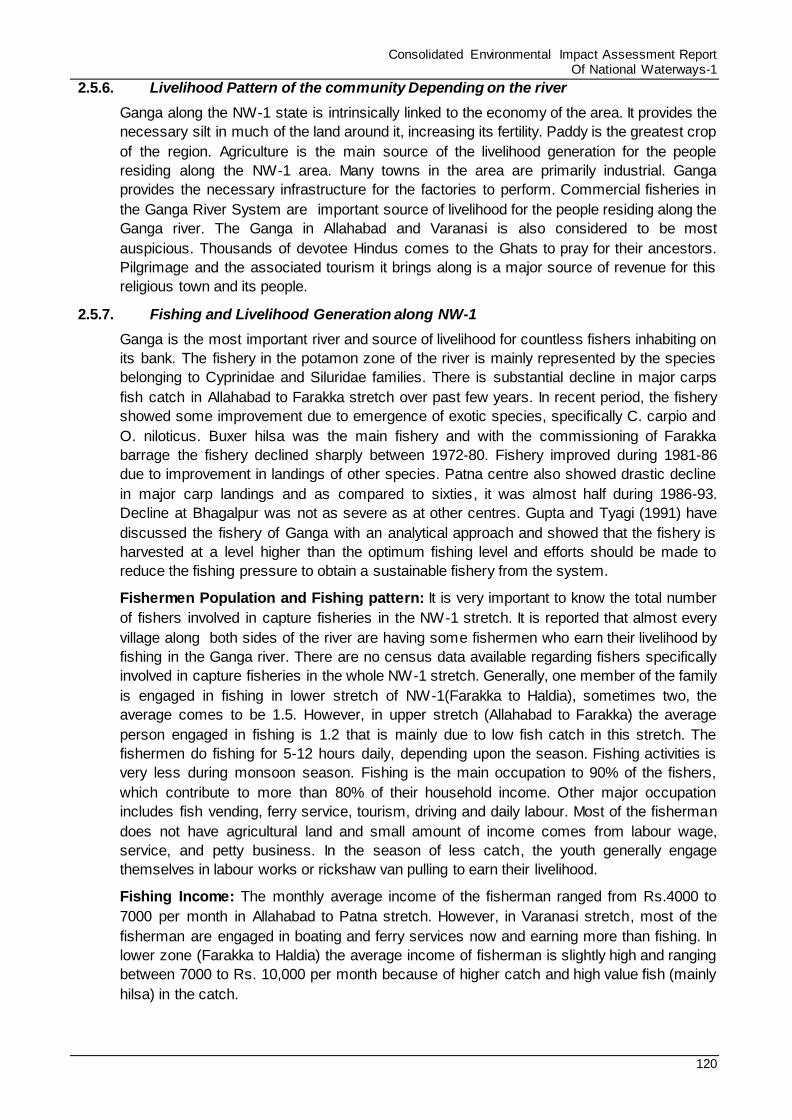
Consolidated Environmental Impact Assessment Report Of National Waterways-1
120
2.5.6. Livelihood Pattern of the community Depending on the river
Ganga along the NW-1 state is intrinsically linked to the economy of the area. It provides the
necessary silt in much of the land around it, increasing its fertility. Paddy is the greatest crop
of the region. Agriculture is the main source of the livelihood generation for the people
residing along the NW-1 area. Many towns in the area are primarily industrial. Ganga
provides the necessary infrastructure for the factories to perform. Commercial fisheries in
the Ganga River System are important source of livelihood for the people residing along the
Ganga river. The Ganga in Allahabad and Varanasi is also considered to be most
auspicious. Thousands of devotee Hindus comes to the Ghats to pray for their ancestors.
Pilgrimage and the associated tourism it brings along is a major source of revenue for this
religious town and its people.
2.5.7. Fishing and Livelihood Generation along NW-1
Ganga is the most important river and source of livelihood for countless fishers inhabiting on
its bank. The fishery in the potamon zone of the river is mainly represented by the species
belonging to Cyprinidae and Siluridae families. There is substantial decline in major carps
fish catch in Allahabad to Farakka stretch over past few years. In recent period, the fishery
showed some improvement due to emergence of exotic species, specifically C. carpio and
O. niloticus. Buxer hilsa was the main fishery and with the commissioning of Farakka
barrage the fishery declined sharply between 1972-80. Fishery improved during 1981-86
due to improvement in landings of other species. Patna centre also showed drastic decline
in major carp landings and as compared to sixties, it was almost half during 1986-93.
Decline at Bhagalpur was not as severe as at other centres. Gupta and Tyagi (1991) have
discussed the fishery of Ganga with an analytical approach and showed that the fishery is
harvested at a level higher than the optimum fishing level and efforts should be made to
reduce the fishing pressure to obtain a sustainable fishery from the system.
Fishermen Population and Fishing pattern: It is very important to know the total number
of fishers involved in capture fisheries in the NW-1 stretch. It is reported that almost every
village along both sides of the river are having some fishermen who earn their livelihood by
fishing in the Ganga river. There are no census data available regarding fishers specifically
involved in capture fisheries in the whole NW-1 stretch. Generally, one member of the family
is engaged in fishing in lower stretch of NW-1(Farakka to Haldia), sometimes two, the
average comes to be 1.5. However, in upper stretch (Allahabad to Farakka) the average
person engaged in fishing is 1.2 that is mainly due to low fish catch in this stretch. The
fishermen do fishing for 5-12 hours daily, depending upon the season. Fishing activities is
very less during monsoon season. Fishing is the main occupation to 90% of the fishers,
which contribute to more than 80% of their household income. Other major occupation
includes fish vending, ferry service, tourism, driving and daily labour. Most of the fisherman
does not have agricultural land and small amount of income comes from labour wage,
service, and petty business. In the season of less catch, the youth generally engage
themselves in labour works or rickshaw van pulling to earn their livelihood.
Fishing Income: The monthly average income of the fisherman ranged from Rs.4000 to
7000 per month in Allahabad to Patna stretch. However, in Varanasi stretch, most of the
fisherman are engaged in boating and ferry services now and earning more than fishing. In
lower zone (Farakka to Haldia) the average income of fisherman is slightly high and ranging
between 7000 to Rs. 10,000 per month because of higher catch and high value fish (mainly
hilsa) in the catch.
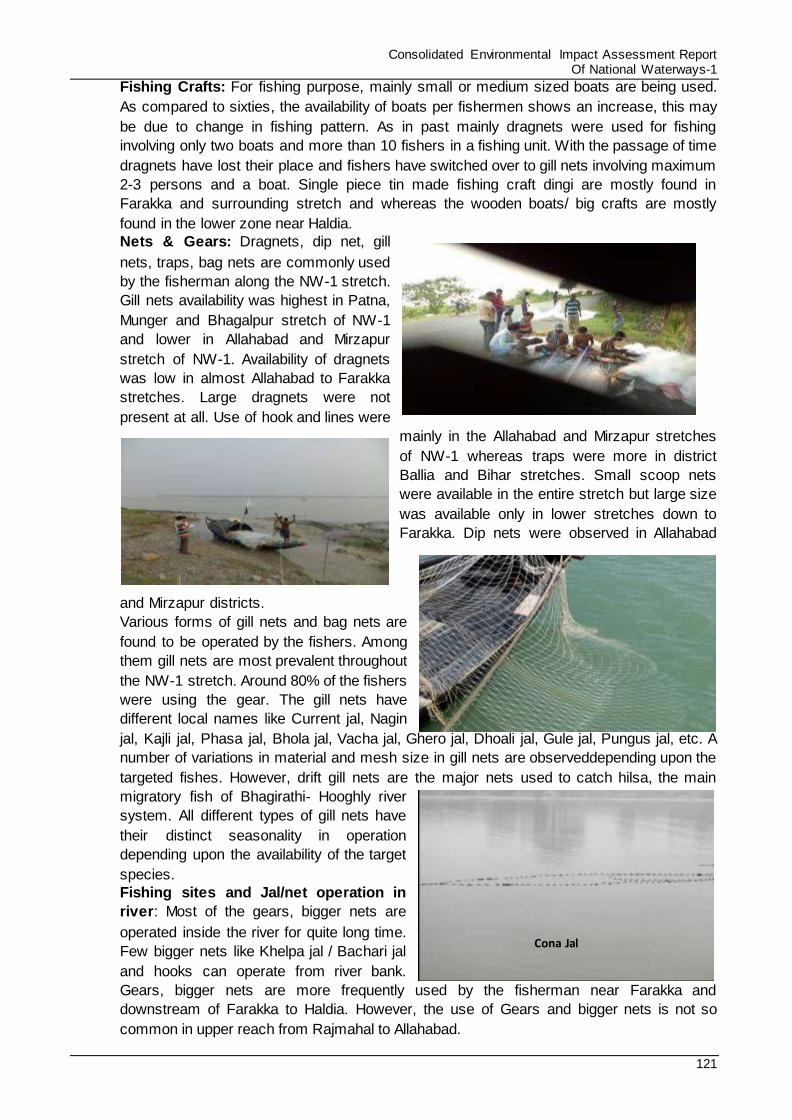
Consolidated Environmental Impact Assessment Report Of National Waterways-1
121
Fishing Crafts: For fishing purpose, mainly small or medium sized boats are being used.
As compared to sixties, the availability of boats per fishermen shows an increase, this may
be due to change in fishing pattern. As in past mainly dragnets were used for fishing
involving only two boats and more than 10 fishers in a fishing unit. With the passage of time
dragnets have lost their place and fishers have switched over to gill nets involving maximum
2-3 persons and a boat. Single piece tin made fishing craft dingi are mostly found in
Farakka and surrounding stretch and whereas the wooden boats/ big crafts are mostly
found in the lower zone near Haldia.
Nets & Gears: Dragnets, dip net, gill
nets, traps, bag nets are commonly used
by the fisherman along the NW-1 stretch.
Gill nets availability was highest in Patna,
Munger and Bhagalpur stretch of NW-1
and lower in Allahabad and Mirzapur
stretch of NW-1. Availability of dragnets
was low in almost Allahabad to Farakka
stretches. Large dragnets were not
present at all. Use of hook and lines were
mainly in the Allahabad and Mirzapur stretches
of NW-1 whereas traps were more in district
Ballia and Bihar stretches. Small scoop nets
were available in the entire stretch but large size
was available only in lower stretches down to
Farakka. Dip nets were observed in Allahabad
and Mirzapur districts.
Various forms of gill nets and bag nets are
found to be operated by the fishers. Among
them gill nets are most prevalent throughout
the NW-1 stretch. Around 80% of the fishers
were using the gear. The gill nets have
different local names like Current jal, Nagin
jal, Kajli jal, Phasa jal, Bhola jal, Vacha jal, Ghero jal, Dhoali jal, Gule jal, Pungus jal, etc. A
number of variations in material and mesh size in gill nets are observeddepending upon the
targeted fishes. However, drift gill nets are the major nets used to catch hilsa, the main
migratory fish of Bhagirathi- Hooghly river
system. All different types of gill nets have
their distinct seasonality in operation
depending upon the availability of the target
species.
Fishing sites and Jal/net operation in
river: Most of the gears, bigger nets are
operated inside the river for quite long time.
Few bigger nets like Khelpa jal / Bachari jal
and hooks can operate from river bank.
Gears, bigger nets are more frequently used by the fisherman near Farakka and
downstream of Farakka to Haldia. However, the use of Gears and bigger nets is not so
common in upper reach from Rajmahal to Allahabad.
Cona Jal
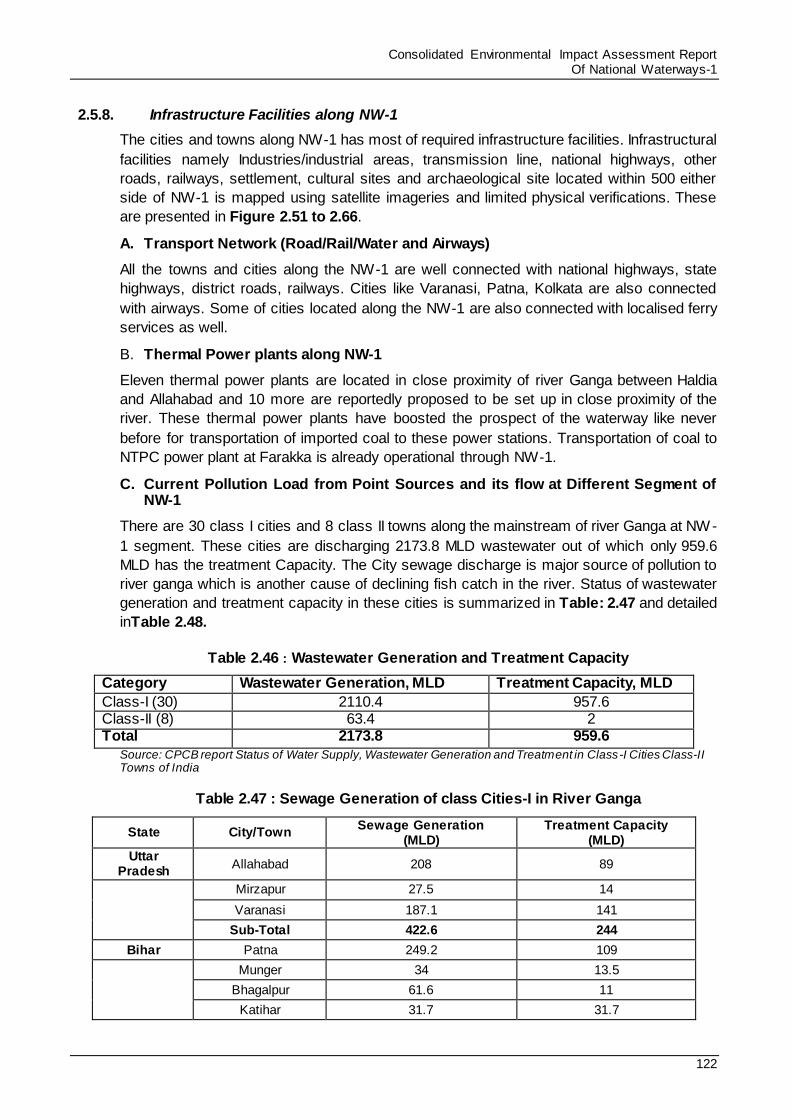
Consolidated Environmental Impact Assessment Report Of National Waterways-1
122
2.5.8. Infrastructure Facilities along NW-1
The cities and towns along NW-1 has most of required infrastructure facilities. Infrastructural
facilities namely Industries/industrial areas, transmission line, national highways, other
roads, railways, settlement, cultural sites and archaeological site located within 500 either
side of NW-1 is mapped using satellite imageries and limited physical verifications. These
are presented in Figure 2.51 to 2.66.
A. Transport Network (Road/Rail/Water and Airways)
All the towns and cities along the NW-1 are well connected with national highways, state
highways, district roads, railways. Cities like Varanasi, Patna, Kolkata are also connected
with airways. Some of cities located along the NW-1 are also connected with localised ferry
services as well.
B. Thermal Power plants along NW-1
Eleven thermal power plants are located in close proximity of river Ganga between Haldia
and Allahabad and 10 more are reportedly proposed to be set up in close proximity of the
river. These thermal power plants have boosted the prospect of the waterway like never
before for transportation of imported coal to these power stations. Transportation of coal to
NTPC power plant at Farakka is already operational through NW-1.
C. Current Pollution Load from Point Sources and its flow at Different Segment of NW-1
There are 30 class I cities and 8 class II towns along the mainstream of river Ganga at NW-
1 segment. These cities are discharging 2173.8 MLD wastewater out of which only 959.6
MLD has the treatment Capacity. The City sewage discharge is major source of pollution to
river ganga which is another cause of declining fish catch in the river. Status of wastewater
generation and treatment capacity in these cities is summarized in Table: 2.47 and detailed
inTable 2.48.
Table 2.46 : Wastewater Generation and Treatment Capacity
Category Wastewater Generation, MLD Treatment Capacity, MLD
Class-I (30) 2110.4 957.6 Class-II (8) 63.4 2 Total 2173.8 959.6
Source: CPCB report Status of Water Supply, Wastewater Generation and Treatment in Class-I Cities Class-II Towns of India
Table 2.47 : Sewage Generation of class Cities-I in River Ganga
State City/Town Sewage Generation
(MLD) Treatment Capacity
(MLD)
Uttar Pradesh
Allahabad 208 89
Mirzapur 27.5 14
Varanasi 187.1 141
Sub-Total 422.6 244
Bihar Patna 249.2 109
Munger 34 13.5
Bhagalpur 61.6 11
Katihar 31.7 31.7
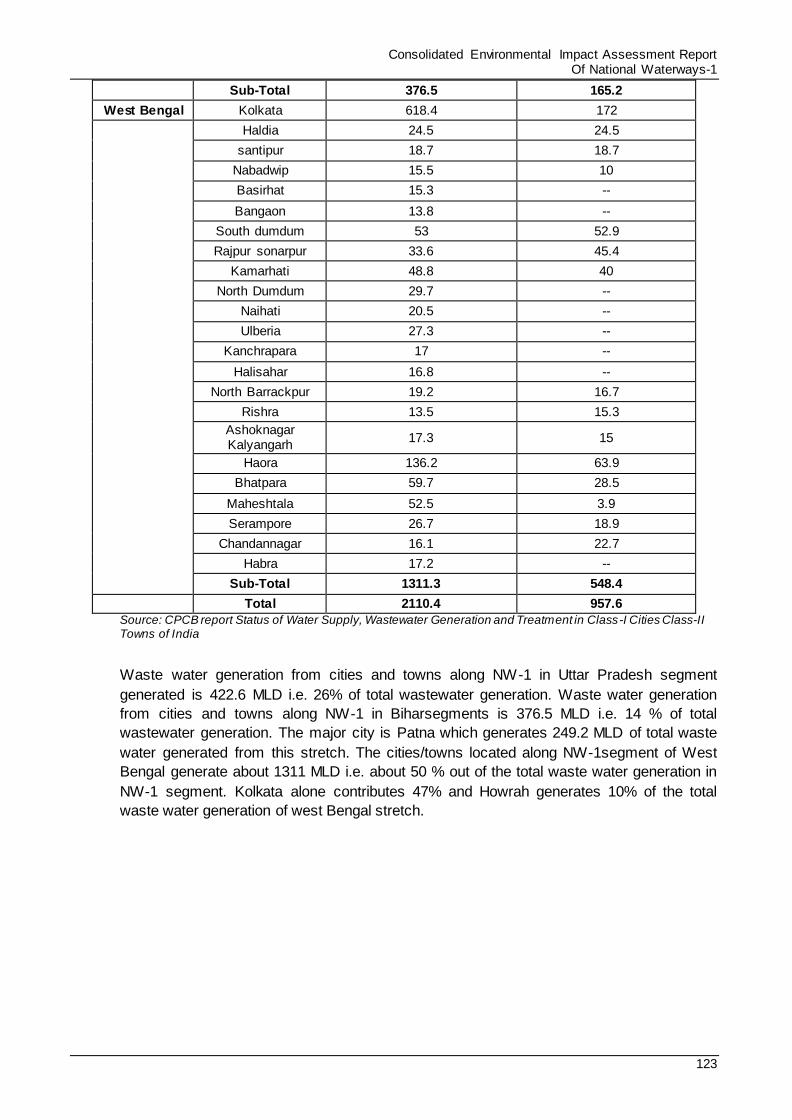
Consolidated Environmental Impact Assessment Report Of National Waterways-1
123
Sub-Total 376.5 165.2
West Bengal Kolkata 618.4 172
Haldia 24.5 24.5
santipur 18.7 18.7
Nabadwip 15.5 10
Basirhat 15.3 --
Bangaon 13.8 --
South dumdum 53 52.9
Rajpur sonarpur 33.6 45.4
Kamarhati 48.8 40
North Dumdum 29.7 --
Naihati 20.5 --
Ulberia 27.3 --
Kanchrapara 17 --
Halisahar 16.8 --
North Barrackpur 19.2 16.7
Rishra 13.5 15.3
Ashoknagar Kalyangarh
17.3 15
Haora 136.2 63.9
Bhatpara 59.7 28.5
Maheshtala 52.5 3.9
Serampore 26.7 18.9
Chandannagar 16.1 22.7
Habra 17.2 --
Sub-Total 1311.3 548.4
Total 2110.4 957.6
Source: CPCB report Status of Water Supply, Wastewater Generation and Treatment in Class-I Cities Class-II Towns of India
Waste water generation from cities and towns along NW-1 in Uttar Pradesh segment
generated is 422.6 MLD i.e. 26% of total wastewater generation. Waste water generation
from cities and towns along NW-1 in Biharsegments is 376.5 MLD i.e. 14 % of total
wastewater generation. The major city is Patna which generates 249.2 MLD of total waste
water generated from this stretch. The cities/towns located along NW-1segment of West
Bengal generate about 1311 MLD i.e. about 50 % out of the total waste water generation in
NW-1 segment. Kolkata alone contributes 47% and Howrah generates 10% of the total
waste water generation of west Bengal stretch.
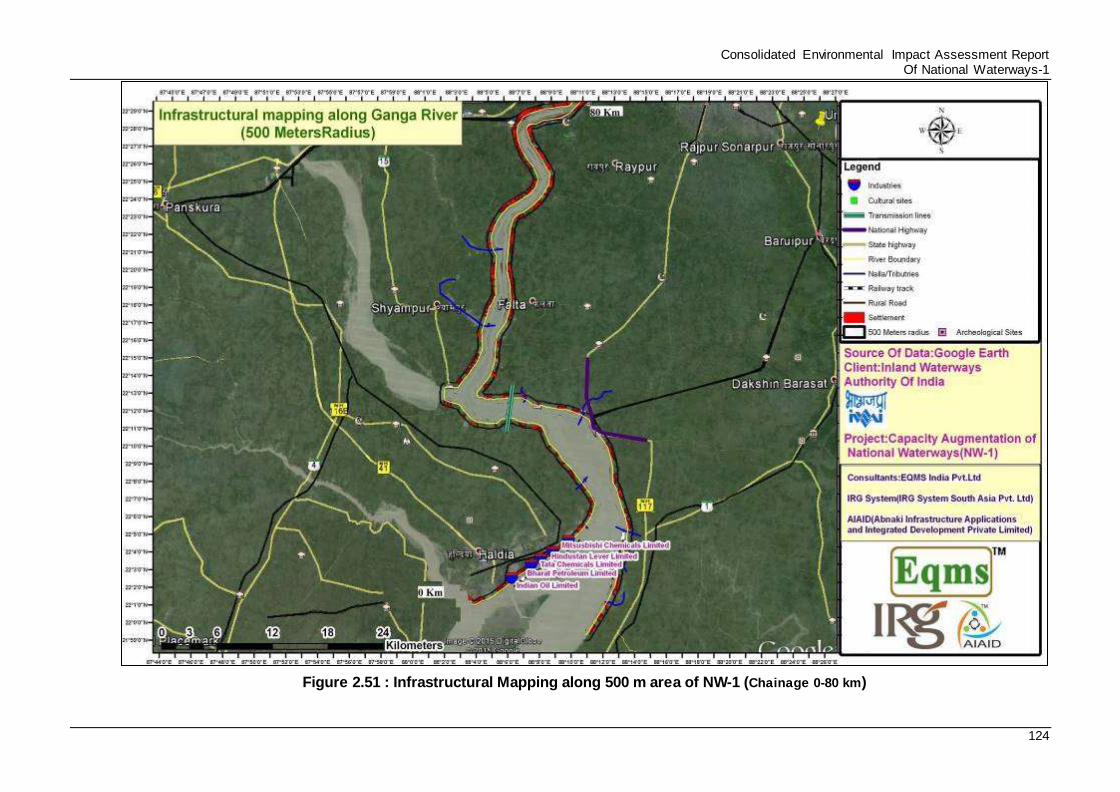
Consolidated Environmental Impact Assessment Report Of National Waterways-1
124
Figure 2.51 : Infrastructural Mapping along 500 m area of NW-1 (Chainage 0-80 km)
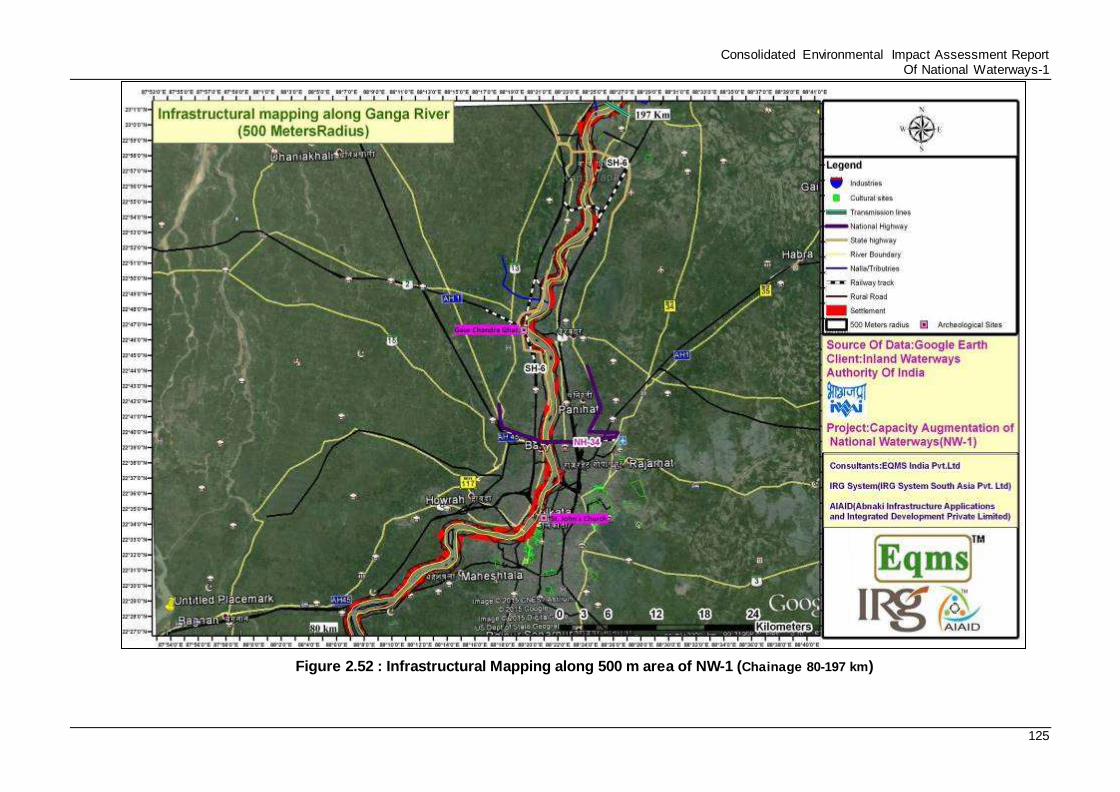
Consolidated Environmental Impact Assessment Report Of National Waterways-1
125
Figure 2.52 : Infrastructural Mapping along 500 m area of NW-1 (Chainage 80-197 km)
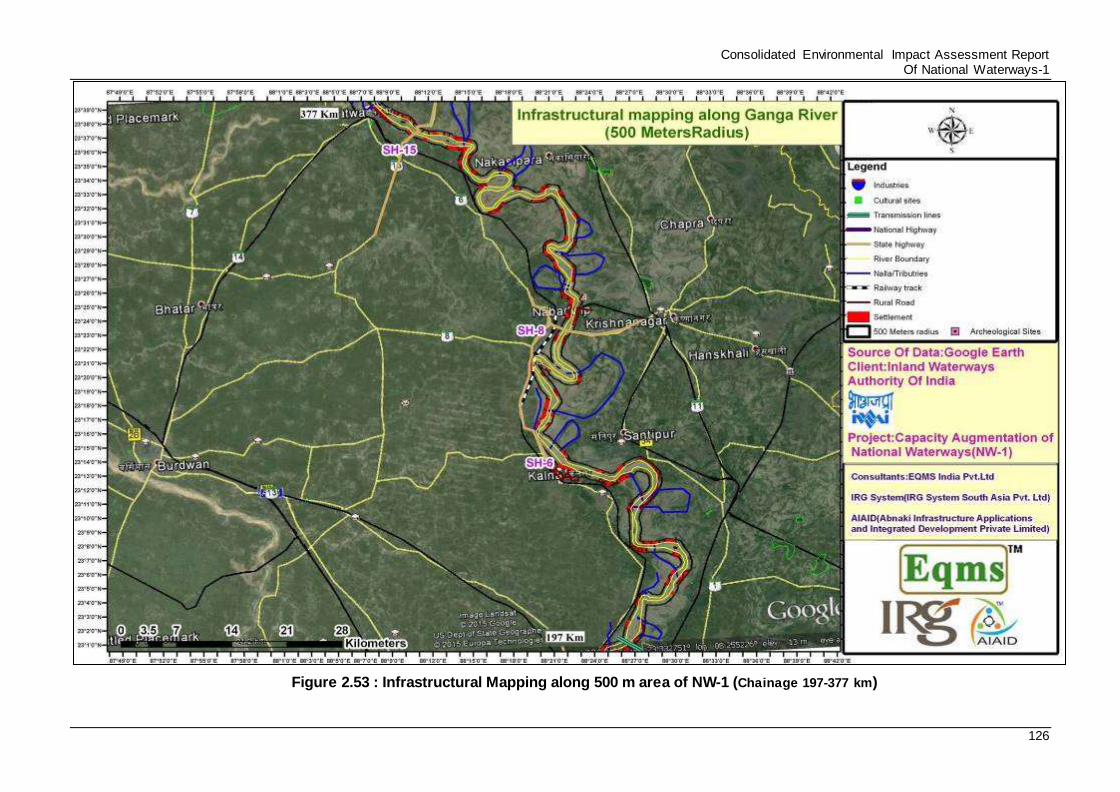
Consolidated Environmental Impact Assessment Report Of National Waterways-1
126
Figure 2.53 : Infrastructural Mapping along 500 m area of NW-1 (Chainage 197-377 km)
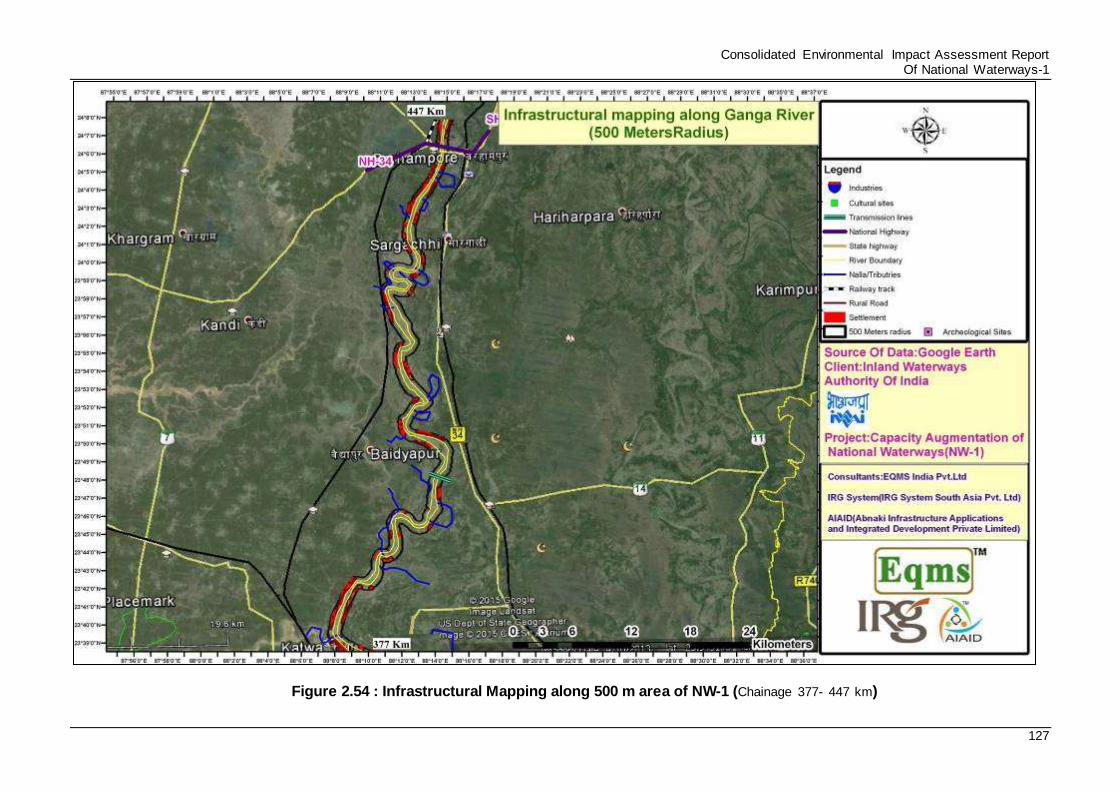
Consolidated Environmental Impact Assessment Report Of National Waterways-1
127
Figure 2.54 : Infrastructural Mapping along 500 m area of NW-1 (Chainage 377- 447 km)
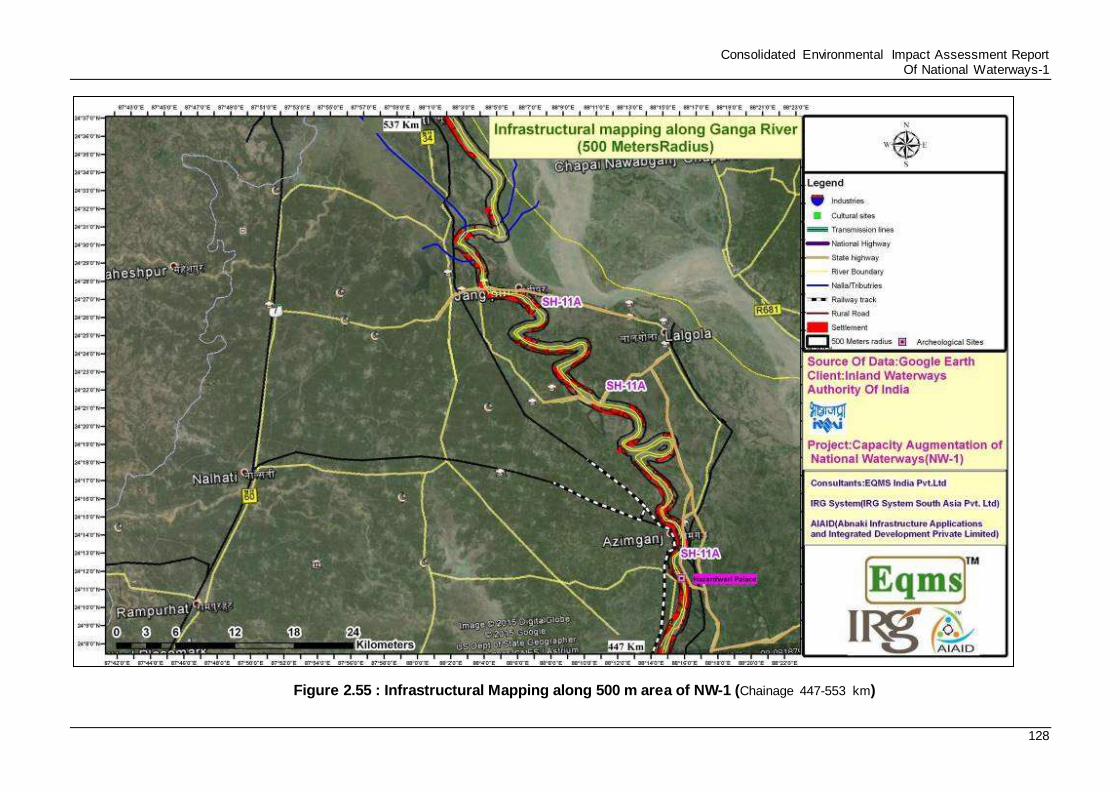
Consolidated Environmental Impact Assessment Report Of National Waterways-1
128
Figure 2.55 : Infrastructural Mapping along 500 m area of NW-1 (Chainage 447-553 km)
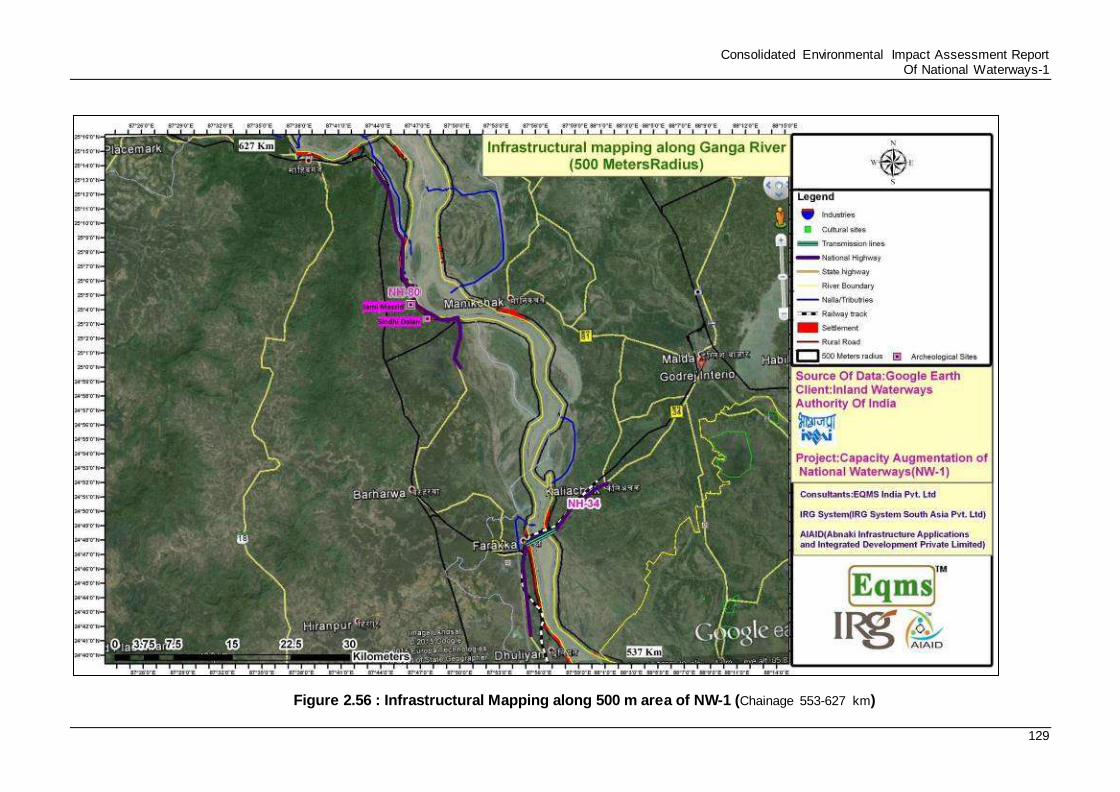
Consolidated Environmental Impact Assessment Report Of National Waterways-1
129
Figure 2.56 : Infrastructural Mapping along 500 m area of NW-1 (Chainage 553-627 km)
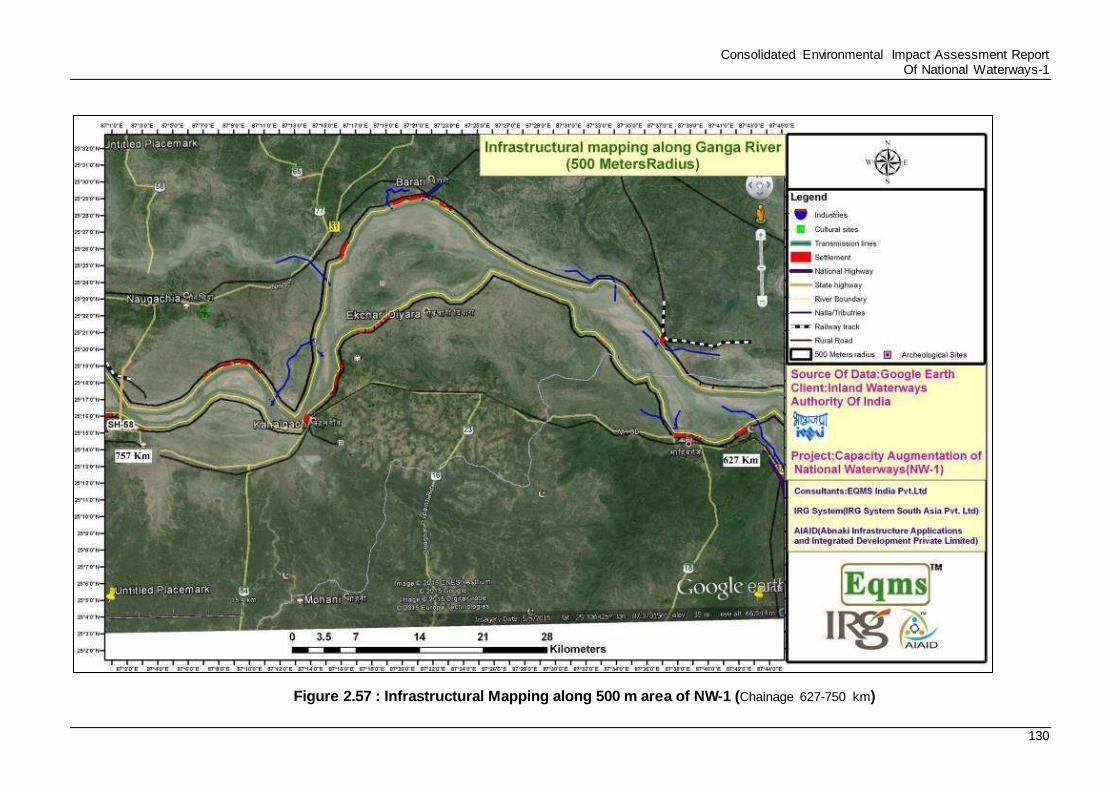
Consolidated Environmental Impact Assessment Report Of National Waterways-1
130
Figure 2.57 : Infrastructural Mapping along 500 m area of NW-1 (Chainage 627-750 km)
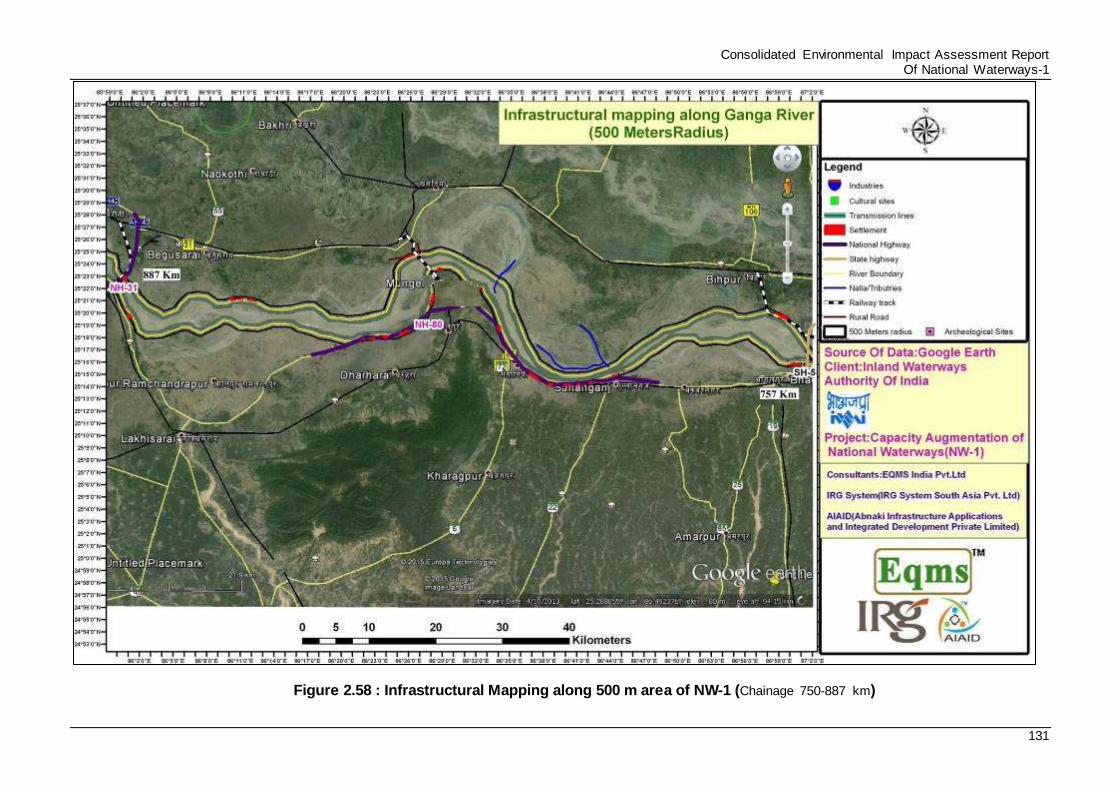
Consolidated Environmental Impact Assessment Report Of National Waterways-1
131
Figure 2.58 : Infrastructural Mapping along 500 m area of NW-1 (Chainage 750-887 km)
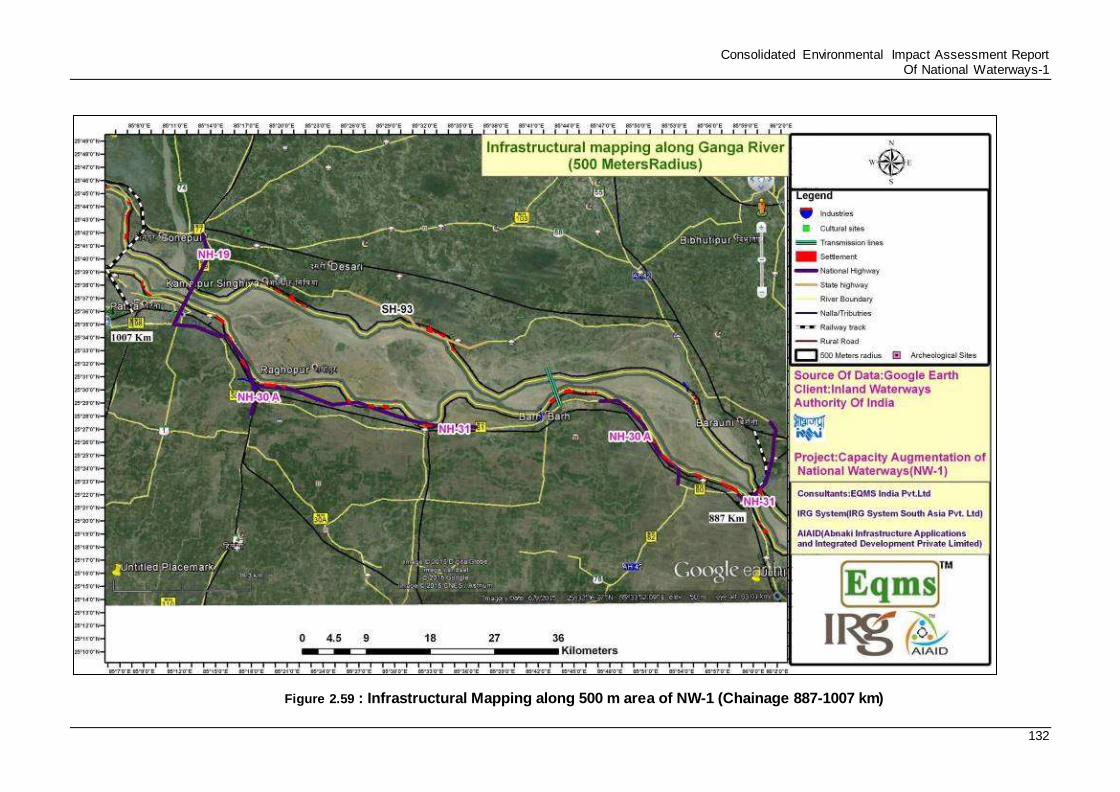
Consolidated Environmental Impact Assessment Report Of National Waterways-1
132
Figure 2.59 : Infrastructural Mapping along 500 m area of NW-1 (Chainage 887-1007 km)
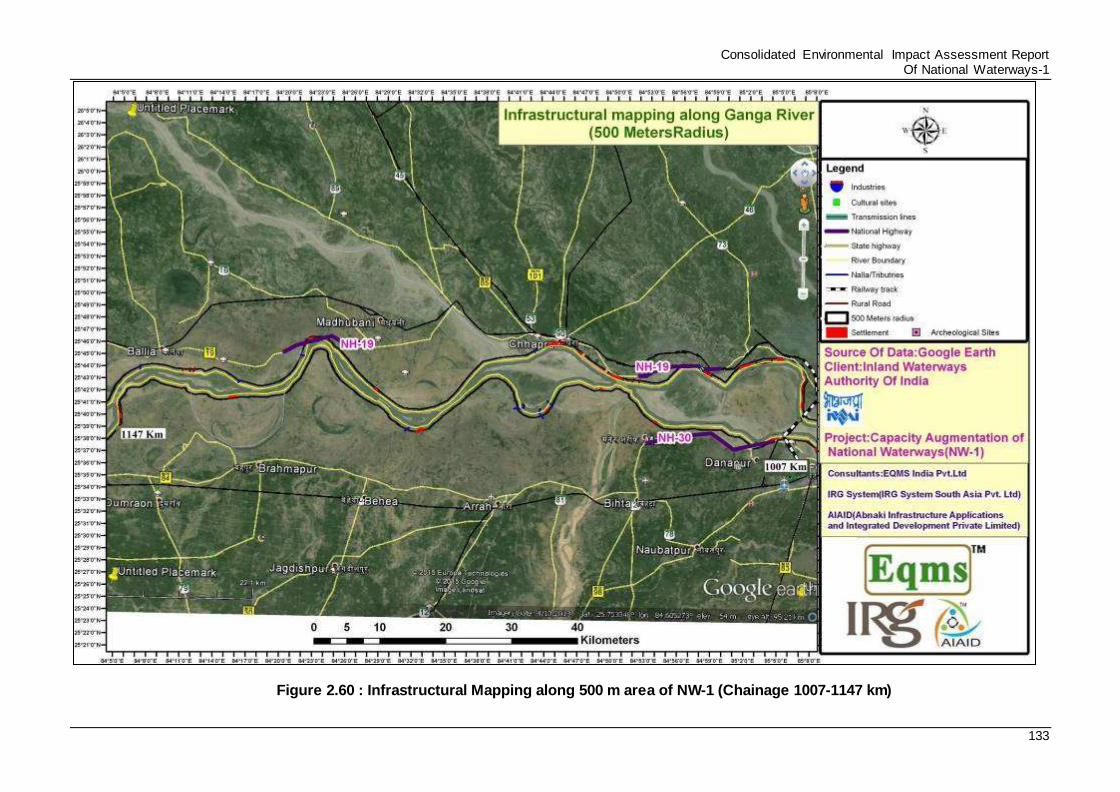
Consolidated Environmental Impact Assessment Report Of National Waterways-1
133
Figure 2.60 : Infrastructural Mapping along 500 m area of NW-1 (Chainage 1007-1147 km)
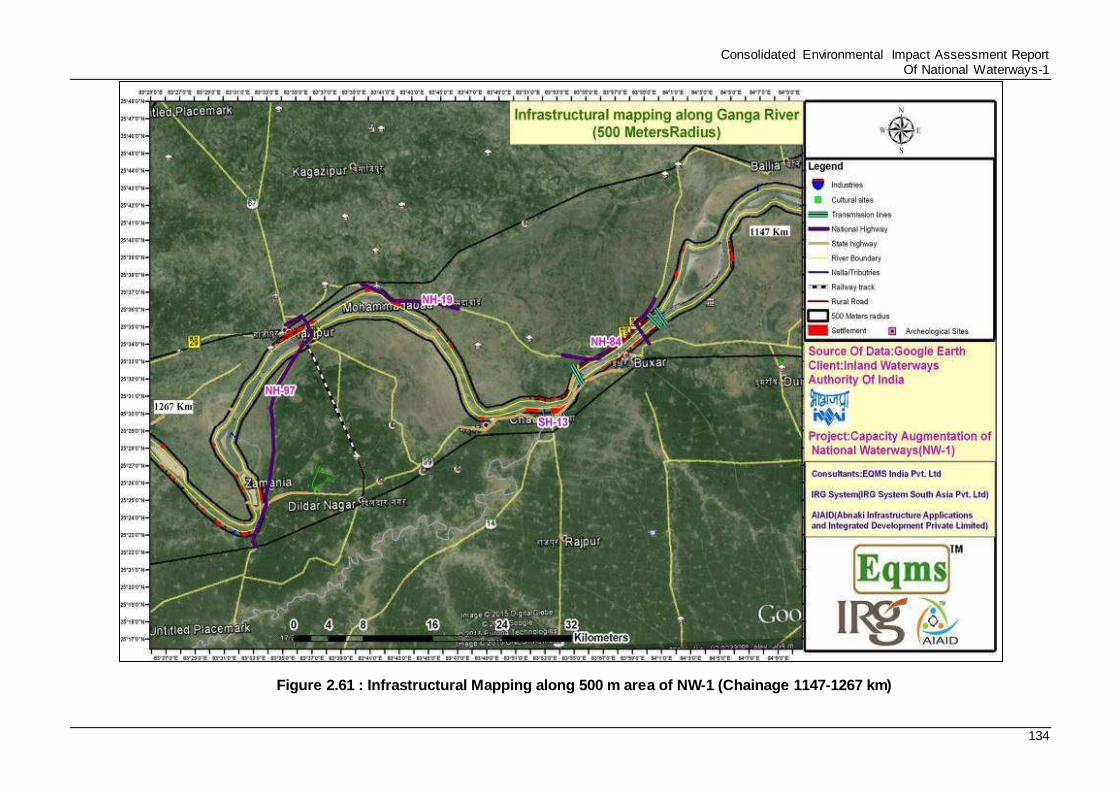
Consolidated Environmental Impact Assessment Report Of National Waterways-1
134
Figure 2.61 : Infrastructural Mapping along 500 m area of NW-1 (Chainage 1147-1267 km)
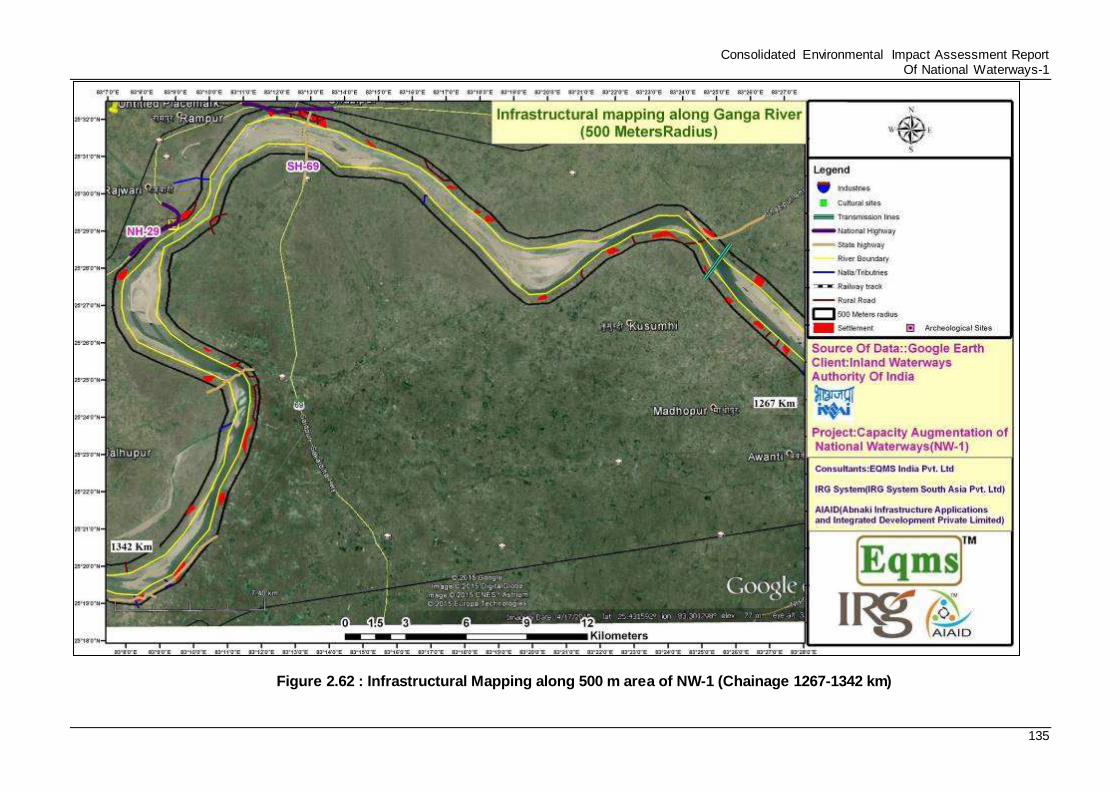
Consolidated Environmental Impact Assessment Report Of National Waterways-1
135
Figure 2.62 : Infrastructural Mapping along 500 m area of NW-1 (Chainage 1267-1342 km)
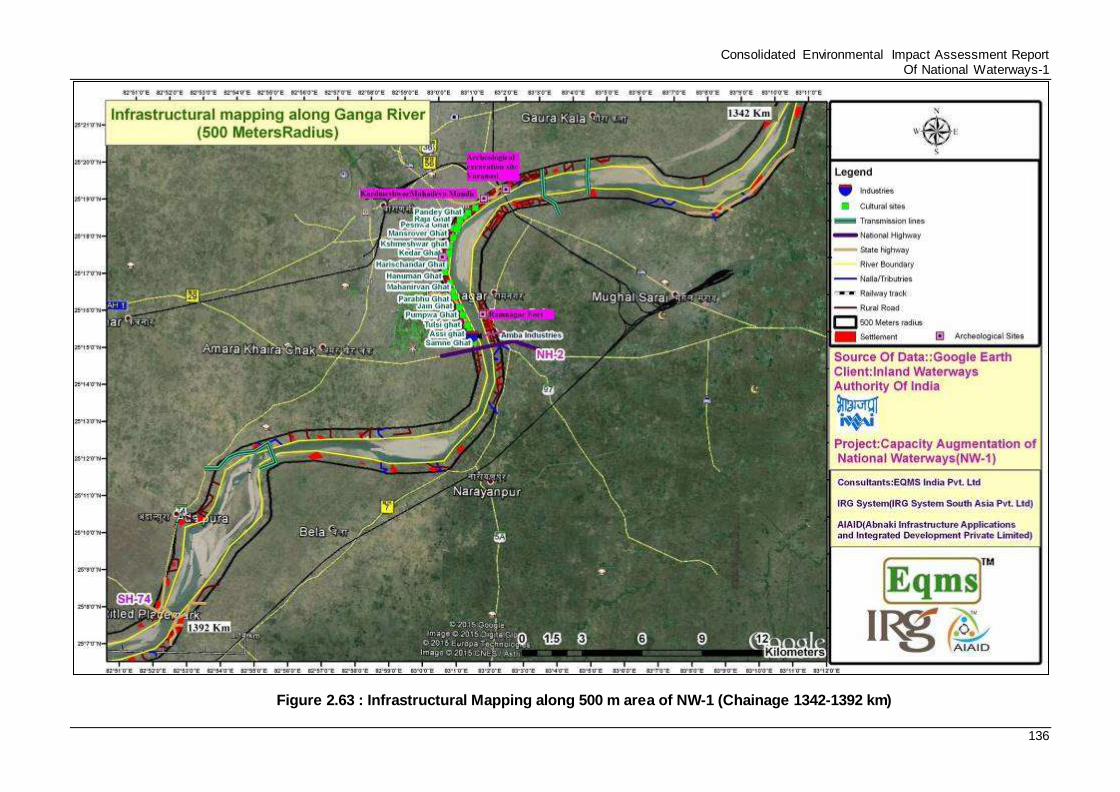
Consolidated Environmental Impact Assessment Report Of National Waterways-1
136
Figure 2.63 : Infrastructural Mapping along 500 m area of NW-1 (Chainage 1342-1392 km)
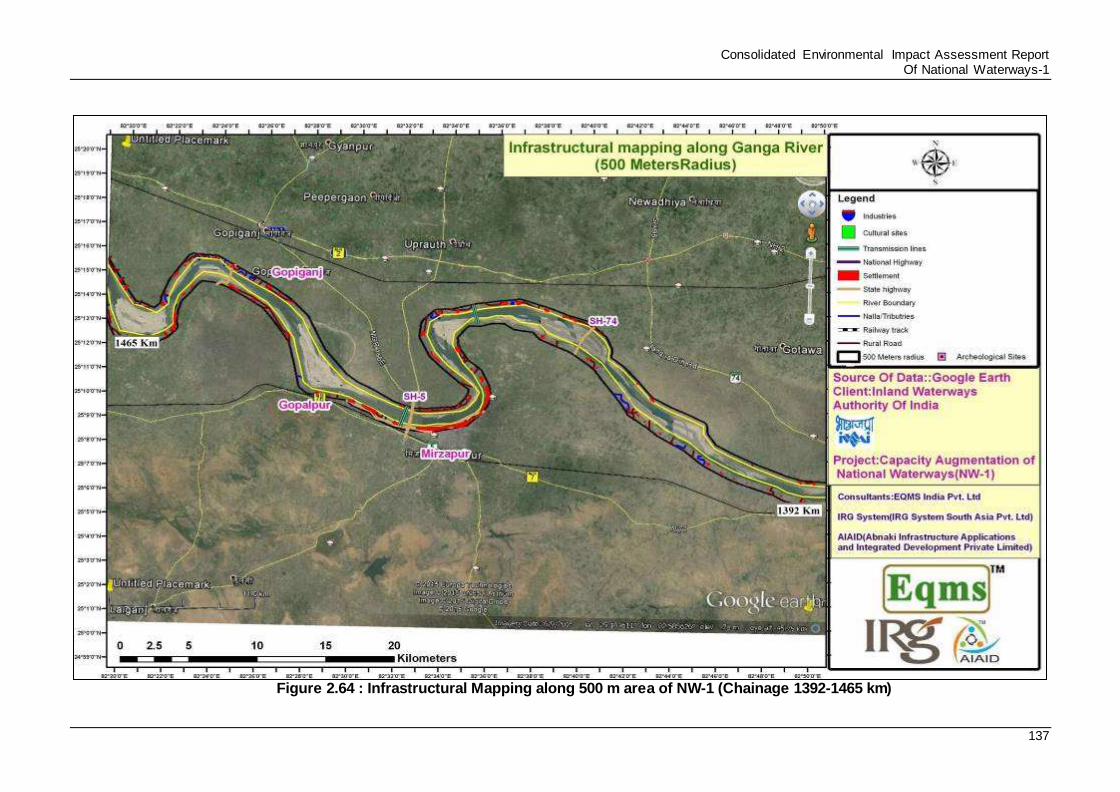
Consolidated Environmental Impact Assessment Report Of National Waterways-1
137
Figure 2.64 : Infrastructural Mapping along 500 m area of NW-1 (Chainage 1392-1465 km)
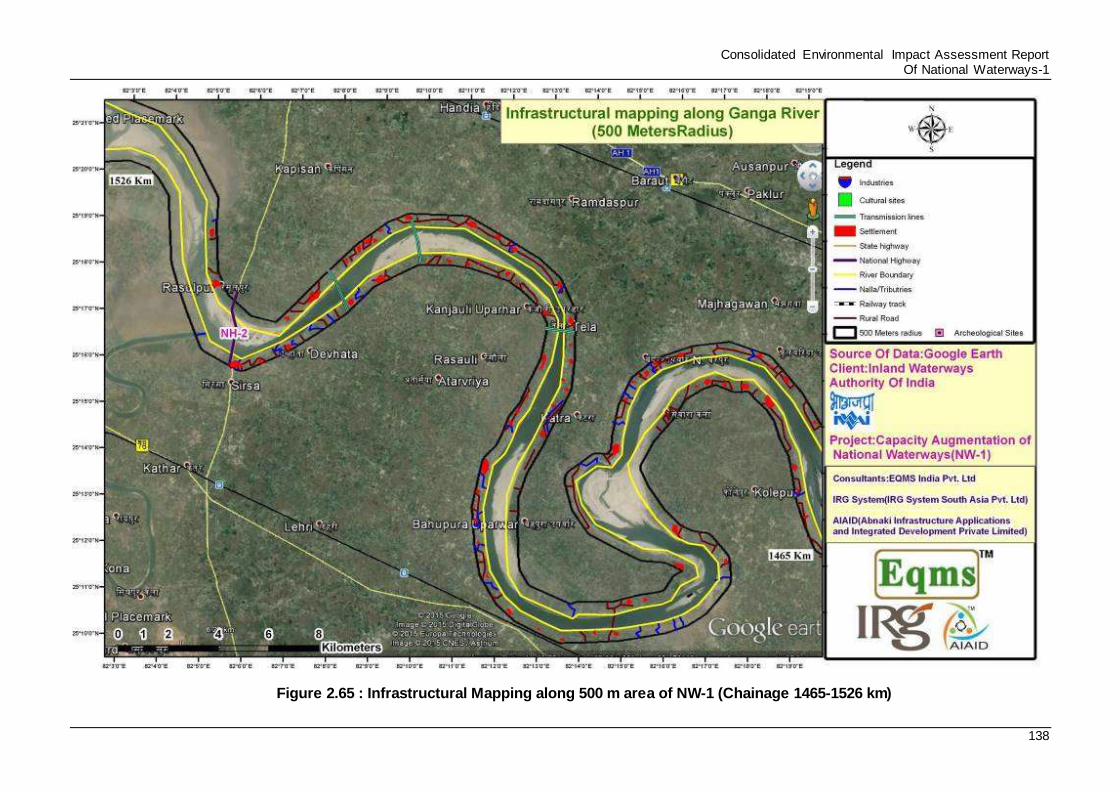
Consolidated Environmental Impact Assessment Report Of National Waterways-1
138
Figure 2.65 : Infrastructural Mapping along 500 m area of NW-1 (Chainage 1465-1526 km)
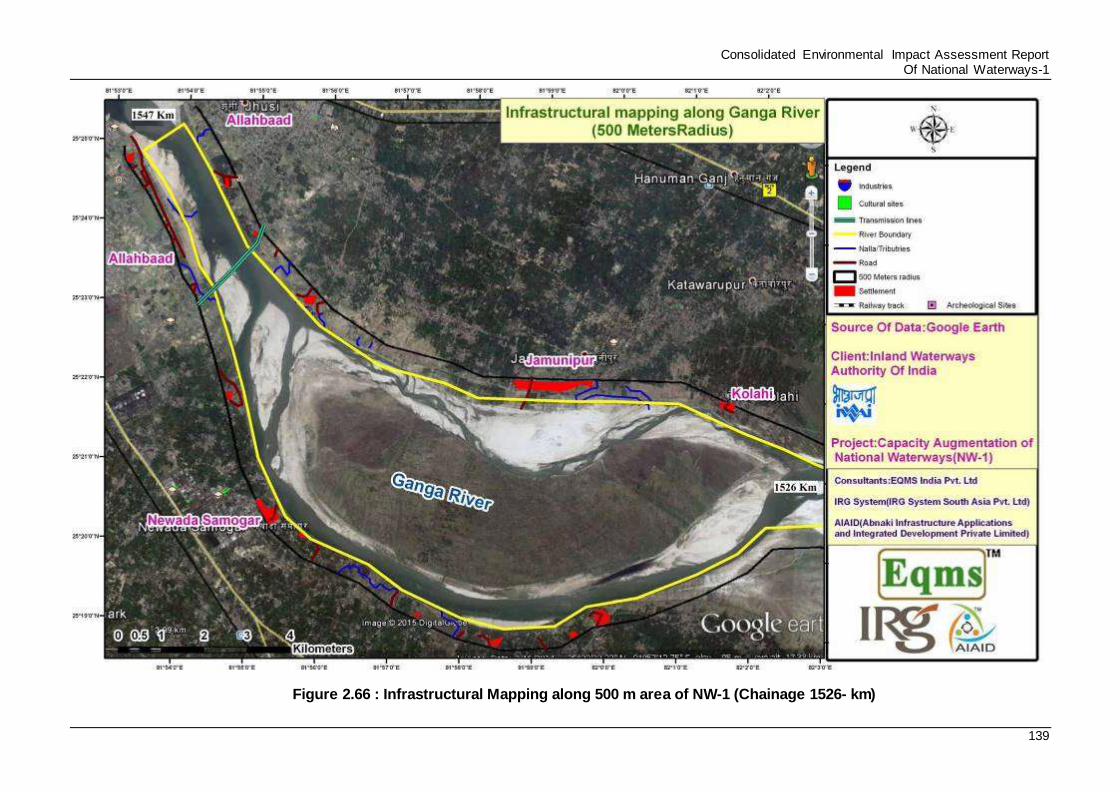
Consolidated Environmental Impact Assessment Report Of National Waterways-1
139
Figure 2.66 : Infrastructural Mapping along 500 m area of NW-1 (Chainage 1526- km)
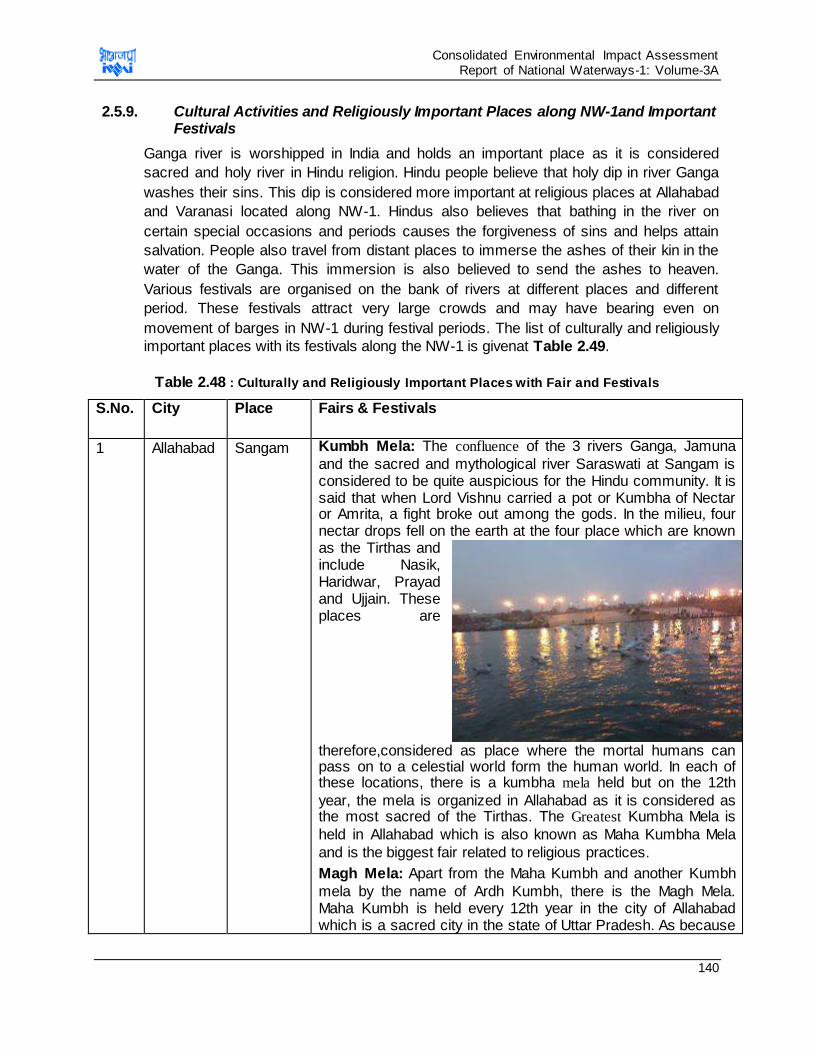
Consolidated Environmental Impact Assessment Report of National Waterways-1: Volume-3A
140
2.5.9. Cultural Activities and Religiously Important Places along NW-1and Important Festivals
Ganga river is worshipped in India and holds an important place as it is considered
sacred and holy river in Hindu religion. Hindu people believe that holy dip in river Ganga
washes their sins. This dip is considered more important at religious places at Allahabad
and Varanasi located along NW-1. Hindus also believes that bathing in the river on
certain special occasions and periods causes the forgiveness of sins and helps attain
salvation. People also travel from distant places to immerse the ashes of their kin in the
water of the Ganga. This immersion is also believed to send the ashes to heaven.
Various festivals are organised on the bank of rivers at different places and different
period. These festivals attract very large crowds and may have bearing even on
movement of barges in NW-1 during festival periods. The list of culturally and religiously
important places with its festivals along the NW-1 is givenat Table 2.49.
Table 2.48 : Culturally and Religiously Important Places with Fair and Festivals
S.No. City Place Fairs & Festivals
1 Allahabad Sangam Kumbh Mela: The confluence of the 3 rivers Ganga, Jamuna
and the sacred and mythological river Saraswati at Sangam is considered to be quite auspicious for the Hindu community. It is said that when Lord Vishnu carried a pot or Kumbha of Nectar or Amrita, a fight broke out among the gods. In the milieu, four nectar drops fell on the earth at the four place which are known as the Tirthas and include Nasik, Haridwar, Prayad and Ujjain. These places are
therefore,considered as place where the mortal humans can pass on to a celestial world form the human world. In each of these locations, there is a kumbha mela held but on the 12th
year, the mela is organized in Allahabad as it is considered as the most sacred of the Tirthas. The Greatest Kumbha Mela is
held in Allahabad which is also known as Maha Kumbha Mela
and is the biggest fair related to religious practices.
Magh Mela: Apart from the Maha Kumbh and another Kumbh
mela by the name of Ardh Kumbh, there is the Magh Mela. Maha Kumbh is held every 12th year in the city of Allahabad which is a sacred city in the state of Uttar Pradesh. As because
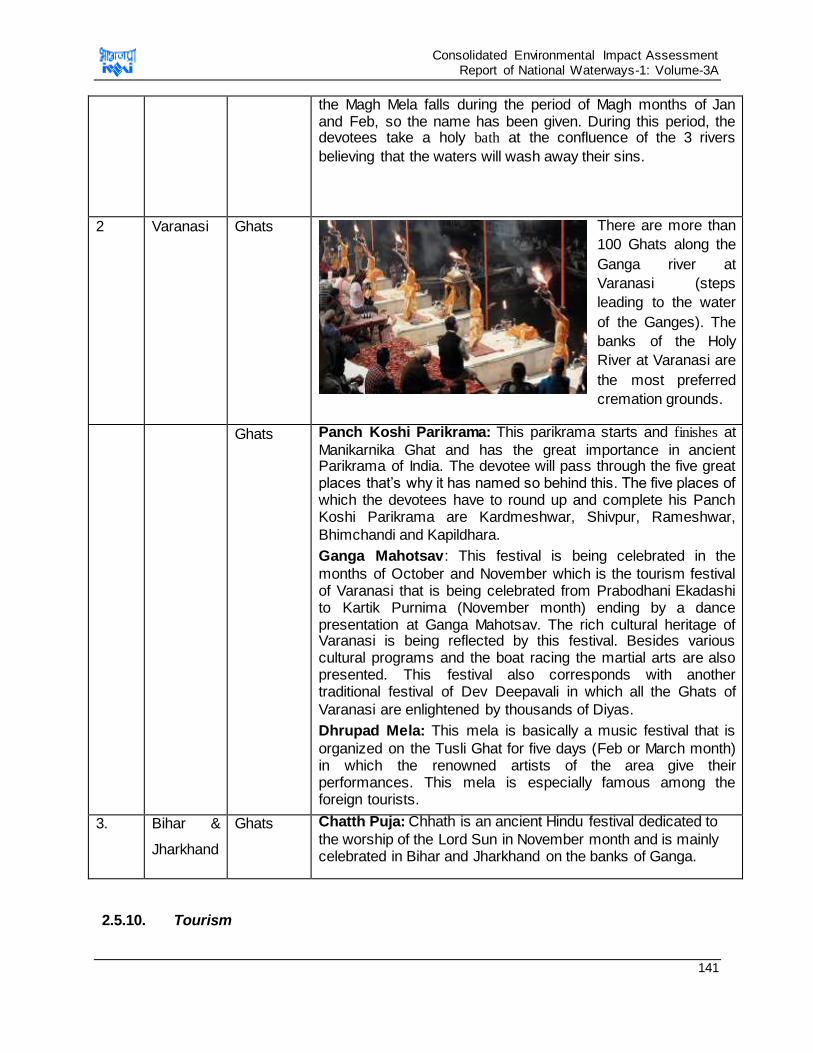
Consolidated Environmental Impact Assessment Report of National Waterways-1: Volume-3A
141
the Magh Mela falls during the period of Magh months of Jan and Feb, so the name has been given. During this period, the devotees take a holy bath at the confluence of the 3 rivers
believing that the waters will wash away their sins.
2 Varanasi Ghats There are more than
100 Ghats along the
Ganga river at
Varanasi (steps
leading to the water
of the Ganges). The
banks of the Holy
River at Varanasi are
the most preferred
cremation grounds.
Ghats Panch Koshi Parikrama: This parikrama starts and finishes at
Manikarnika Ghat and has the great importance in ancient Parikrama of India. The devotee will pass through the five great places that’s why it has named so behind this. The five places of which the devotees have to round up and complete his Panch Koshi Parikrama are Kardmeshwar, Shivpur, Rameshwar,
Bhimchandi and Kapildhara.
Ganga Mahotsav: This festival is being celebrated in the
months of October and November which is the tourism festival of Varanasi that is being celebrated from Prabodhani Ekadashi to Kartik Purnima (November month) ending by a dance presentation at Ganga Mahotsav. The rich cultural heritage of Varanasi is being reflected by this festival. Besides various cultural programs and the boat racing the martial arts are also presented. This festival also corresponds with another traditional festival of Dev Deepavali in which all the Ghats of
Varanasi are enlightened by thousands of Diyas.
Dhrupad Mela: This mela is basically a music festival that is
organized on the Tusli Ghat for five days (Feb or March month) in which the renowned artists of the area give their performances. This mela is especially famous among the foreign tourists.
3. Bihar &
Jharkhand
Ghats Chatth Puja: Chhath is an ancient Hindu festival dedicated to
the worship of the Lord Sun in November month and is mainly celebrated in Bihar and Jharkhand on the banks of Ganga.
2.5.10. Tourism
Consolidated Environmental Impact Assessment Report of National Waterways-1: Volume-3A
142
The river is of great cultural and religious significance for all Indians. All of this makes
the Ganges a must for all tourists who wish to encounter all of India’s diverse beauty in
terms of both culture and nature. There are many cities along the banks of NW-1
specially Allahabad, Varanasi and Kolkata which are important from tourism prospective
and attract thousands of religious and non-religious tourists every year. Varanasi, a
pilgrim place for Hindus and Buddhists alone attracts over one million pilgrims every
year followed by Allahabad.
2.5.11. Existing Waste Management Facilities along NW-1
The municipal and bio-medical waste management facility is available at select cities
only along the entire stretch of NW-1. Common Hazardous waste facility is available only
at Haldia in NW-1 area. The status of these facilities in select cities along the NW-1 is
described below:
Allahabad (Uttar Pradesh): Currently, the local body of Allahabad Municipal
Corporation collects and dispose its municipal solid waste through Allahabad Waste
Processing Company Pvt. Ltd (AWPCPL at Solid Waste Disposal Site (SWDS) located
near Kareli which is about 4 km away from the Allahabad railway station and functions
on composting technology. The compost that is generated from this plant will be
supplied to local agricultural farms.
Municipal solid waste treatment facilities in Varanasi (Uttar Pradesh): Varanasi
Municipal Corporation (VMC) currently collects municipal waste and dispose to
unorganized dumping site located 20 Km away from the city in Karsada. Construction of
a treatment plant and organized landfill site is planned under JNNURM.
Bio-medical waste treatment facilities in Varanasi (Uttar Pradesh): Varanasi Nagar
Nigam has established Common Bio Medical Waste Treatment Facility (CBWTF) at 310-
Mohan Sarai, National Highway and is well managed.
Solid waste disposal Facilities in Patna (Bihar): Solid waste management is an
overall responsibility of the Municipal Corporation as per Bihar Municipal act 2007 and
MSW (management & Handling) rules 2000. Patna Municipal Corporation (PMC) is
responsible for development of municipal waste land fill sites but it is yet to develop an
organized land fill site. At present municipal waste is dumped in identified unorganized
dumping sites. Bihar Urban infrastructure development Corporation Ltd (BUIDCO) has
also initiated the process of an integrated Solid Waste Management process plant at
Patna on PPP mode with power generation capacity of 8 MW electricity.
Solid waste Disposal in Bhagalpur (Bihar): No organized or bio medical waste
disposal facility is available in this city.
Solid waste disposal facilities in Kolkata (West Bengal): About 95% of total waste
generated in Kolkata Municipal Corporation (KMC) area is disposed at Dhapa landfill site
and the rest at Garden Reach dumping ground. 700 TPD compost plant is set up by
M/s. Eastern Organic Fertilizer Ltd. with technical back up of Excel Industry, Mumbai.
Plant was set up and commissioned in the year 2000 and operated at 200 – 250 TPD
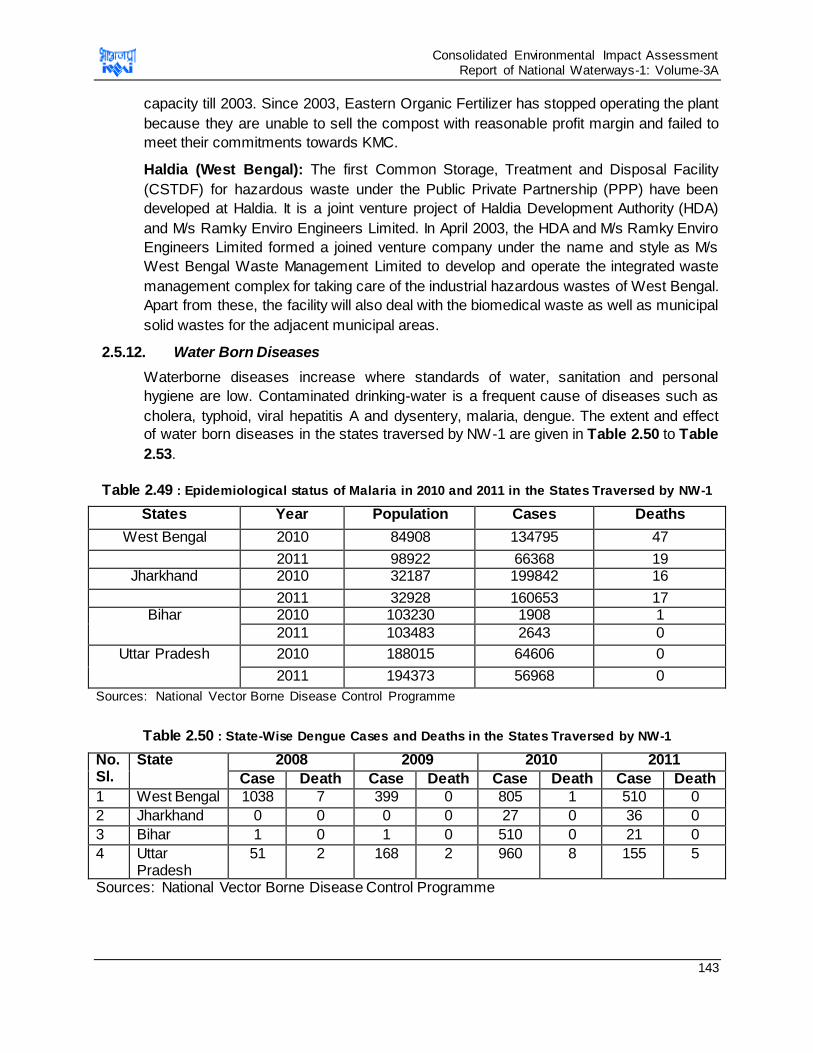
Consolidated Environmental Impact Assessment Report of National Waterways-1: Volume-3A
143
capacity till 2003. Since 2003, Eastern Organic Fertilizer has stopped operating the plant
because they are unable to sell the compost with reasonable profit margin and failed to
meet their commitments towards KMC.
Haldia (West Bengal): The first Common Storage, Treatment and Disposal Facility
(CSTDF) for hazardous waste under the Public Private Partnership (PPP) have been
developed at Haldia. It is a joint venture project of Haldia Development Authority (HDA)
and M/s Ramky Enviro Engineers Limited. In April 2003, the HDA and M/s Ramky Enviro
Engineers Limited formed a joined venture company under the name and style as M/s
West Bengal Waste Management Limited to develop and operate the integrated waste
management complex for taking care of the industrial hazardous wastes of West Bengal.
Apart from these, the facility will also deal with the biomedical waste as well as municipal
solid wastes for the adjacent municipal areas.
2.5.12. Water Born Diseases
Waterborne diseases increase where standards of water, sanitation and personal
hygiene are low. Contaminated drinking-water is a frequent cause of diseases such as
cholera, typhoid, viral hepatitis A and dysentery, malaria, dengue. The extent and effect
of water born diseases in the states traversed by NW-1 are given in Table 2.50 to Table
2.53.
Table 2.49 : Epidemiological status of Malaria in 2010 and 2011 in the States Traversed by NW-1
States Year Population Cases Deaths
West Bengal 2010 84908 134795 47
2011 98922 66368 19 Jharkhand 2010 32187 199842 16
2011 32928 160653 17 Bihar
2010 103230 1908 1
2011 103483 2643 0
Uttar Pradesh 2010 188015 64606 0
2011 194373 56968 0
Sources: National Vector Borne Disease Control Programme
Table 2.50 : State-Wise Dengue Cases and Deaths in the States Traversed by NW-1
No. Sl.
State 2008 2009 2010 2011
Case Death Case Death Case Death Case Death
1 West Bengal 1038 7 399 0 805 1 510 0
2 Jharkhand 0 0 0 0 27 0 36 0
3 Bihar 1 0 1 0 510 0 21 0
4 Uttar Pradesh
51 2 168 2 960 8 155 5
Sources: National Vector Borne Disease Control Programme
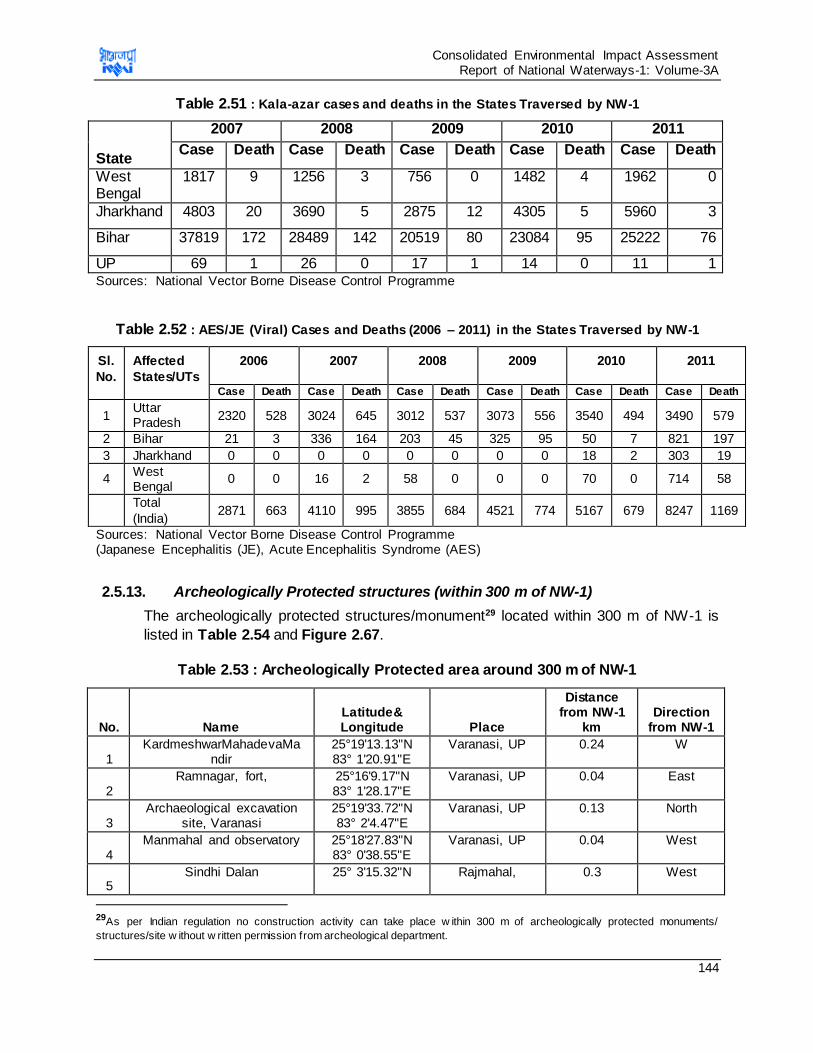
Consolidated Environmental Impact Assessment Report of National Waterways-1: Volume-3A
144
Table 2.51 : Kala-azar cases and deaths in the States Traversed by NW-1
State
2007 2008 2009 2010 2011
Case Death Case Death Case Death Case Death Case Death
West Bengal
1817 9 1256 3 756 0 1482 4 1962 0
Jharkhand 4803 20 3690 5 2875 12 4305 5 5960 3
Bihar 37819 172 28489 142 20519 80 23084 95 25222 76
UP 69 1 26 0 17 1 14 0 11 1 Sources: National Vector Borne Disease Control Programme
Table 2.52 : AES/JE (Viral) Cases and Deaths (2006 – 2011) in the States Traversed by NW-1
Sl. Affected 2006 2007 2008 2009 2010 2011
No. States/UTs Case Death Case Death Case Death Case Death Case Death Case Death
1 Uttar Pradesh
2320 528 3024 645 3012 537 3073 556 3540 494 3490 579
2 Bihar 21 3 336 164 203 45 325 95 50 7 821 197
3 Jharkhand 0 0 0 0 0 0 0 0 18 2 303 19
4 West Bengal
0 0 16 2 58 0 0 0 70 0 714 58
Total
(India) 2871 663 4110 995 3855 684 4521 774 5167 679 8247 1169
Sources: National Vector Borne Disease Control Programme (Japanese Encephalitis (JE), Acute Encephalitis Syndrome (AES)
2.5.13. Archeologically Protected structures (within 300 m of NW-1)
The archeologically protected structures/monument29 located within 300 m of NW-1 is
listed in Table 2.54 and Figure 2.67.
Table 2.53 : Archeologically Protected area around 300 m of NW-1
No. Name Latitude& Longitude Place
Distance from NW-1
km Direction
from NW-1
1 KardmeshwarMahadevaMa
ndir 25°19'13.13"N 83° 1'20.91"E
Varanasi, UP 0.24 W
2 Ramnagar, fort, 25°16'9.17"N
83° 1'28.17"E Varanasi, UP 0.04 East
3 Archaeological excavation
site, Varanasi 25°19'33.72"N 83° 2'4.47"E
Varanasi, UP 0.13 North
4 Manmahal and observatory 25°18'27.83"N
83° 0'38.55"E Varanasi, UP 0.04 West
5 Sindhi Dalan 25° 3'15.32"N Rajmahal, 0.3 West
29As per Indian regulation no construction activity can take place w ithin 300 m of archeologically protected monuments/
structures/site w ithout w ritten permission from archeological department.
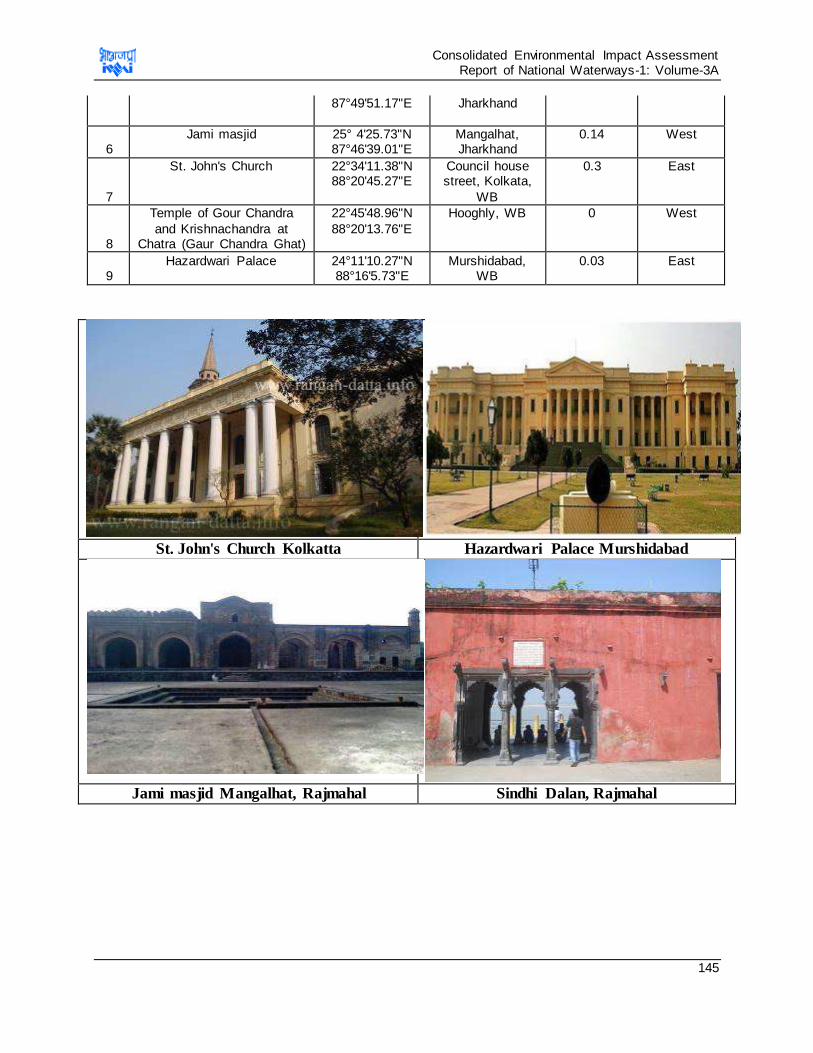
Consolidated Environmental Impact Assessment Report of National Waterways-1: Volume-3A
145
87°49'51.17"E Jharkhand
6 Jami masjid 25° 4'25.73"N
87°46'39.01"E Mangalhat, Jharkhand
0.14 West
7
St. John's Church 22°34'11.38"N 88°20'45.27"E
Council house street, Kolkata,
WB
0.3 East
8
Temple of Gour Chandra
and Krishnachandra at Chatra (Gaur Chandra Ghat)
22°45'48.96"N
88°20'13.76"E
Hooghly, WB 0 West
9 Hazardwari Palace 24°11'10.27"N
88°16'5.73"E Murshidabad,
WB 0.03 East
St. John's Church Kolkatta Hazardwari Palace Murshidabad
Jami masjid Mangalhat, Rajmahal Sindhi Dalan, Rajmahal
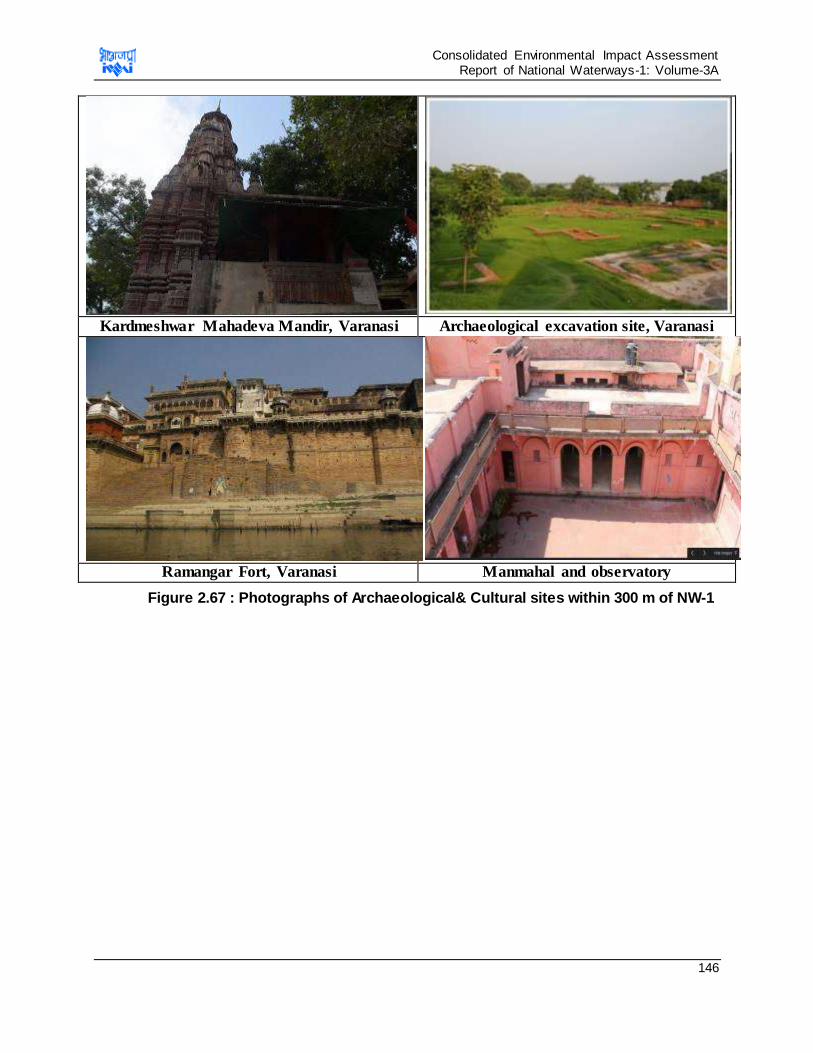
Consolidated Environmental Impact Assessment Report of National Waterways-1: Volume-3A
146
Kardmeshwar Mahadeva Mandir, Varanasi Archaeological excavation site, Varanasi
Ramangar Fort, Varanasi Manmahal and observatory
Figure 2.67 : Photographs of Archaeological& Cultural sites within 300 m of NW-1
Consolidated Environmental Impact Assessment Report of National Waterways-1: Volume-3A
147
ANNEXURE
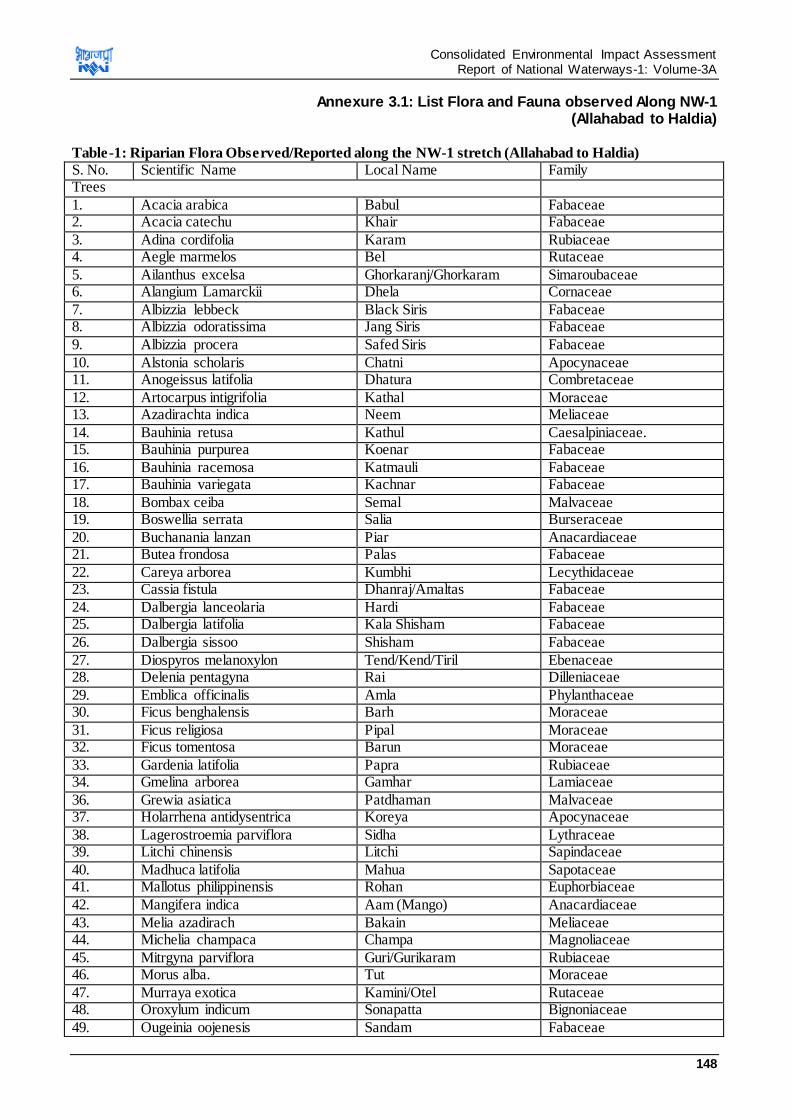
Consolidated Environmental Impact Assessment Report of National Waterways-1: Volume-3A
148
Annexure 3.1: List Flora and Fauna observed Along NW-1 (Allahabad to Haldia)
Table-1: Riparian Flora Observed/Reported along the NW-1 stretch (Allahabad to Haldia)
S. No. Scientific Name Local Name Family Trees
1. Acacia arabica Babul Fabaceae 2. Acacia catechu Khair Fabaceae
3. Adina cordifolia Karam Rubiaceae 4. Aegle marmelos Bel Rutaceae
5. Ailanthus excelsa Ghorkaranj/Ghorkaram Simaroubaceae 6. Alangium Lamarckii Dhela Cornaceae
7. Albizzia lebbeck Black Siris Fabaceae 8. Albizzia odoratissima Jang Siris Fabaceae
9. Albizzia procera Safed Siris Fabaceae
10. Alstonia scholaris Chatni Apocynaceae 11. Anogeissus latifolia Dhatura Combretaceae
12. Artocarpus intigrifolia Kathal eaeoaMoM 13. Azadirachta indica Neem Meliaceae
14. Bauhinia retusa Kathul Caesalpiniaceae. 15. Bauhinia purpurea Koenar Fabaceae
16. Bauhinia racemosa Katmauli Fabaceae 17. Bauhinia variegata Kachnar Fabaceae
18. Bombax ceiba Semal Malvaceae 19. Boswellia serrata Salia Burseraceae
20. Buchanania lanzan Piar Anacardiaceae 21. Butea frondosa Palas Fabaceae
22. Careya arborea Kumbhi Lecythidaceae 23. Cassia fistula Dhanraj/Amaltas Fabaceae
24. Dalbergia lanceolaria Hardi Fabaceae 25. Dalbergia latifolia Kala Shisham Fabaceae
26. Dalbergia sissoo Shisham Fabaceae
27. Diospyros melanoxylon Tend/Kend/Tiril Ebenaceae 28. Delenia pentagyna Rai Dilleniaceae
29. Emblica officinalis Amla Phylanthaceae 30. Ficus benghalensis Barh Moraceae
31. Ficus religiosa Pipal Moraceae 32. Ficus tomentosa Barun Moraceae
33. Gardenia latifolia Papra Rubiaceae 34. Gmelina arborea Gamhar Lamiaceae
36. Grewia asiatica Patdhaman Malvaceae 37. Holarrhena antidysentrica Koreya Apocynaceae
38. Lagerostroemia parviflora Sidha Lythraceae 39. Litchi chinensis Litchi Sapindaceae
40. Madhuca latifolia Mahua Sapotaceae 41. Mallotus philippinensis Rohan Euphorbiaceae
42. Mangifera indica Aam (Mango) Anacardiaceae
43. Melia azadirach Bakain Meliaceae 44. Michelia champaca Champa Magnoliaceae
45. Mitrgyna parviflora Guri/Gurikaram Rubiaceae 46. Morus alba. Tut Moraceae
47. Murraya exotica Kamini/Otel Rutaceae 48. Oroxylum indicum Sonapatta Bignoniaceae
49. Ougeinia oojenesis Sandam Fabaceae
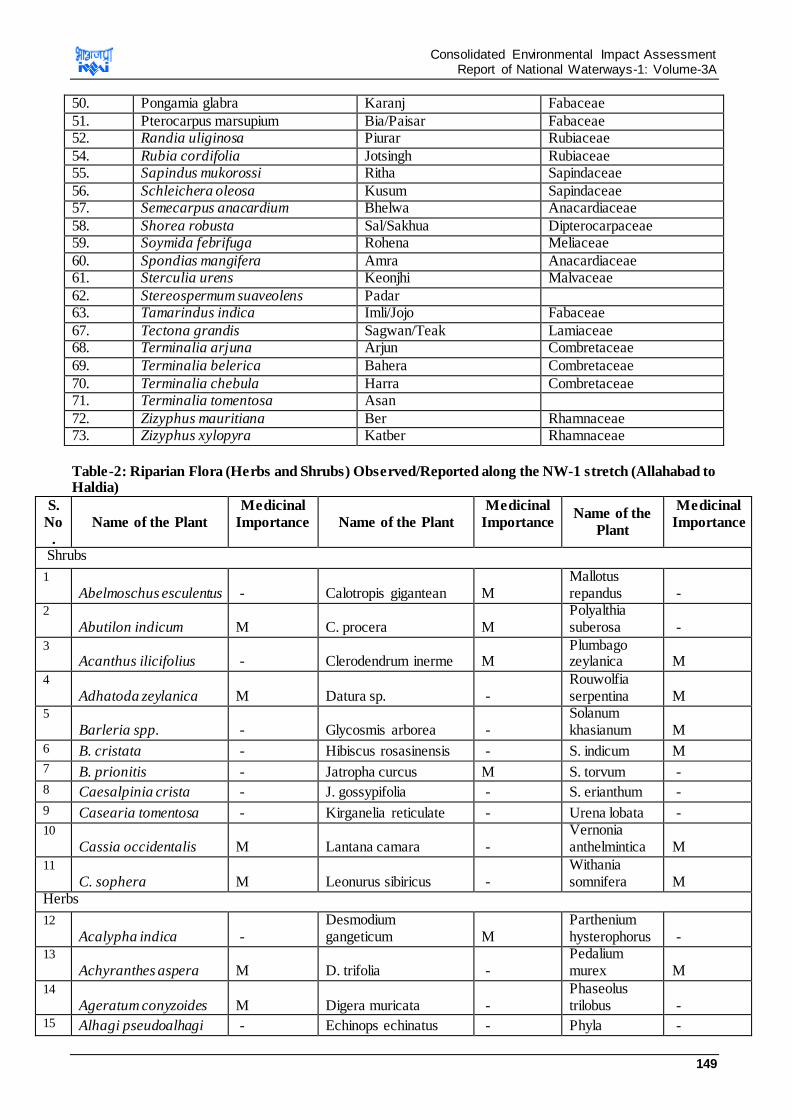
Consolidated Environmental Impact Assessment Report of National Waterways-1: Volume-3A
149
Table-2: Riparian Flora (Herbs and Shrubs) Observed/Reported along the NW-1 stretch (Allahabad to Haldia)
S.
No
.
Name of the Plant
Medicinal
Importance Name of the Plant
Medicinal
Importance Name of the
Plant
Medicinal
Importance
Shrubs
1
Abelmoschus esculentus - Calotropis gigantean M Mallotus repandus -
2
Abutilon indicum M C. procera M Polyalthia suberosa -
3
Acanthus ilicifolius - Clerodendrum inerme M Plumbago zeylanica M
4
Adhatoda zeylanica M Datura sp. - Rouwolfia serpentina M
5
Barleria spp. - Glycosmis arborea - Solanum khasianum M
6 B. cristata - Hibiscus rosasinensis - S. indicum M 7 B. prionitis - Jatropha curcus M S. torvum - 8 Caesalpinia crista - J. gossypifolia - S. erianthum -
9 Casearia tomentosa - Kirganelia reticulate - Urena lobata - 10
Cassia occidentalis M Lantana camara - Vernonia anthelmintica M
11
C. sophera M Leonurus sibiricus - Withania somnifera M
Herbs
12
Acalypha indica - Desmodium gangeticum M
Parthenium hysterophorus -
13
Achyranthes aspera M D. trifolia - Pedalium murex M
14
Ageratum conyzoides M Digera muricata - Phaseolus trilobus -
15 Alhagi pseudoalhagi - Echinops echinatus - Phyla -
50. Pongamia glabra Karanj Fabaceae
51. Pterocarpus marsupium Bia/Paisar Fabaceae 52. Randia uliginosa Piurar Rubiaceae
54. Rubia cordifolia Jotsingh Rubiaceae 55. Sapindus mukorossi Ritha Sapindaceae
56. Schleichera oleosa Kusum Sapindaceae 57. Semecarpus anacardium Bhelwa Anacardiaceae
58. Shorea robusta Sal/Sakhua Dipterocarpaceae 59. Soymida febrifuga Rohena Meliaceae
60. Spondias mangifera Amra Anacardiaceae 61. Sterculia urens Keonjhi Malvaceae
62. Stereospermum suaveolens Padar 63. Tamarindus indica Imli/Jojo Fabaceae
67. Tectona grandis Sagwan/Teak Lamiaceae 68. Terminalia arjuna Arjun Combretaceae
69. Terminalia belerica Bahera Combretaceae
70. Terminalia chebula Harra Combretaceae 71. Terminalia tomentosa Asan
72. Zizyphus mauritiana Ber Rhamnaceae 73. Zizyphus xylopyra Katber Rhamnaceae
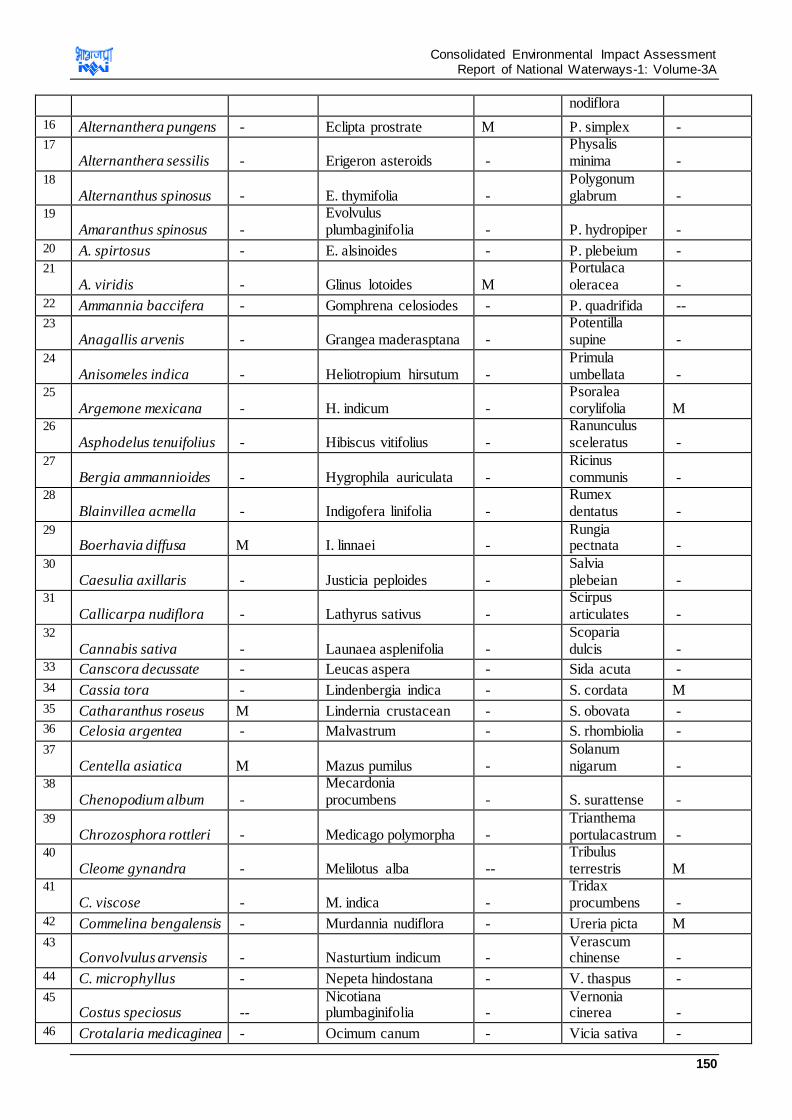
Consolidated Environmental Impact Assessment Report of National Waterways-1: Volume-3A
150
nodiflora
16 Alternanthera pungens - Eclipta prostrate M P. simplex - 17
Alternanthera sessilis - Erigeron asteroids - Physalis minima -
18
Alternanthus spinosus - E. thymifolia - Polygonum glabrum -
19
Amaranthus spinosus - Evolvulus plumbaginifolia - P. hydropiper -
20 A. spirtosus - E. alsinoides - P. plebeium - 21
A. viridis - Glinus lotoides M Portulaca oleracea -
22 Ammannia baccifera - Gomphrena celosiodes - P. quadrifida -- 23
Anagallis arvenis - Grangea maderasptana - Potentilla supine -
24
Anisomeles indica - Heliotropium hirsutum - Primula umbellata -
25
Argemone mexicana - H. indicum - Psoralea corylifolia M
26
Asphodelus tenuifolius - Hibiscus vitifolius - Ranunculus sceleratus -
27
Bergia ammannioides - Hygrophila auriculata - Ricinus communis -
28
Blainvillea acmella - Indigofera linifolia - Rumex dentatus -
29
Boerhavia diffusa M I. linnaei - Rungia pectnata -
30
Caesulia axillaris - Justicia peploides - Salvia plebeian -
31
Callicarpa nudiflora - Lathyrus sativus - Scirpus articulates -
32
Cannabis sativa - Launaea asplenifolia - Scoparia dulcis -
33 Canscora decussate - Leucas aspera - Sida acuta -
34 Cassia tora - Lindenbergia indica - S. cordata M
35 Catharanthus roseus M Lindernia crustacean - S. obovata - 36 Celosia argentea - Malvastrum - S. rhombiolia -
37
Centella asiatica M Mazus pumilus - Solanum nigarum -
38
Chenopodium album - Mecardonia procumbens - S. surattense -
39
Chrozosphora rottleri - Medicago polymorpha - Trianthema portulacastrum -
40
Cleome gynandra - Melilotus alba -- Tribulus terrestris M
41
C. viscose - M. indica - Tridax procumbens -
42 Commelina bengalensis - Murdannia nudiflora - Ureria picta M
43
Convolvulus arvensis - Nasturtium indicum - Verascum chinense -
44 C. microphyllus - Nepeta hindostana - V. thaspus -
45
Costus speciosus -- Nicotiana plumbaginifolia -
Vernonia cinerea -
46 Crotalaria medicaginea - Ocimum canum - Vicia sativa -
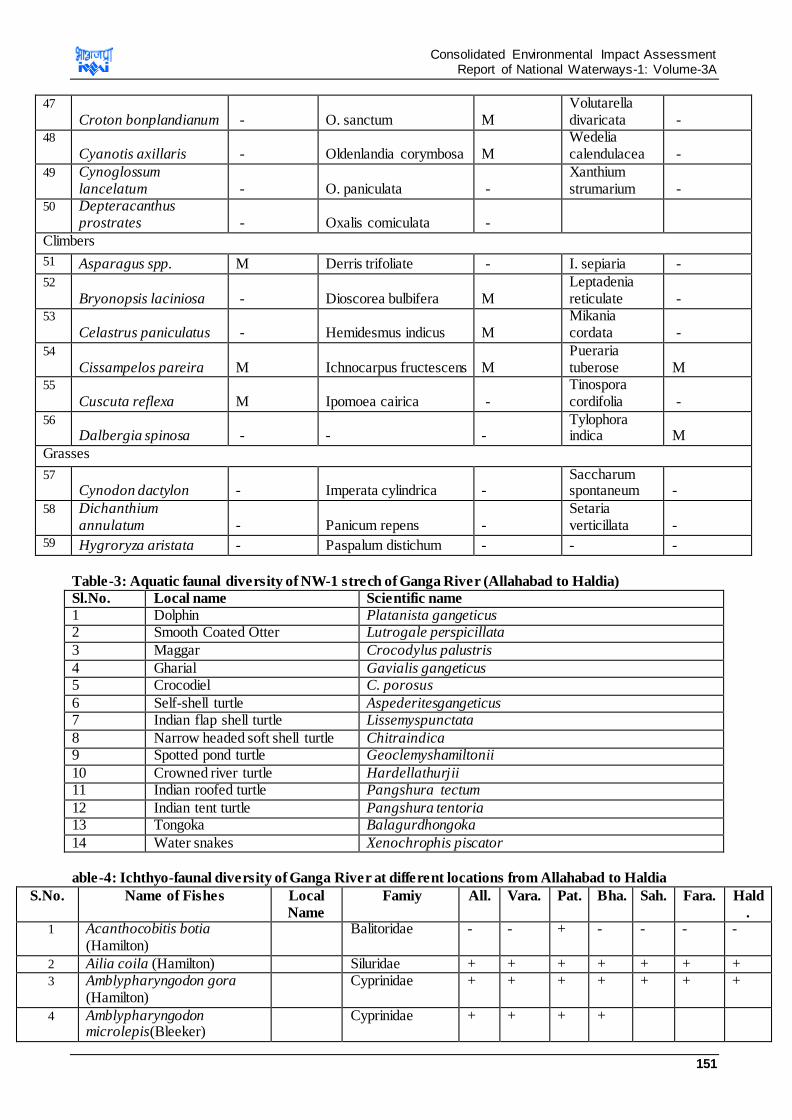
Consolidated Environmental Impact Assessment Report of National Waterways-1: Volume-3A
151
47
Croton bonplandianum - O. sanctum M Volutarella divaricata -
48
Cyanotis axillaris - Oldenlandia corymbosa M Wedelia calendulacea -
49 Cynoglossum lancelatum - O. paniculata -
Xanthium strumarium -
50 Depteracanthus prostrates - Oxalis comiculata -
Climbers
51 Asparagus spp. M Derris trifoliate - I. sepiaria -
52
Bryonopsis laciniosa - Dioscorea bulbifera M Leptadenia reticulate -
53
Celastrus paniculatus - Hemidesmus indicus M Mikania cordata -
54
Cissampelos pareira M Ichnocarpus fructescens M Pueraria tuberose M
55
Cuscuta reflexa M Ipomoea cairica - Tinospora cordifolia -
56
Dalbergia spinosa - - - Tylophora indica M
Grasses
57
Cynodon dactylon - Imperata cylindrica - Saccharum spontaneum -
58 Dichanthium annulatum - Panicum repens -
Setaria verticillata -
59 Hygroryza aristata - Paspalum distichum - - -
Table-3: Aquatic faunal diversity of NW-1 strech of Ganga River (Allahabad to Haldia)
Sl.No. Local name Scientific name
1 Dolphin Platanista gangeticus 2 Smooth Coated Otter Lutrogale perspicillata
3 Maggar Crocodylus palustris
4 Gharial Gavialis gangeticus 5 Crocodiel C. porosus
6 Self-shell turtle Aspederitesgangeticus 7 Indian flap shell turtle Lissemyspunctata
8 Narrow headed soft shell turtle Chitraindica 9 Spotted pond turtle Geoclemyshamiltonii
10 Crowned river turtle Hardellathurjii 11 Indian roofed turtle Pangshura tectum
12 Indian tent turtle Pangshura tentoria 13 Tongoka Balagurdhongoka
14 Water snakes Xenochrophis piscator
able-4: Ichthyo-faunal diversity of Ganga River at different locations from Allahabad to Haldia
S.No. Name of Fishes Local
Name
Famiy All. Vara. Pat. Bha. Sah. Fara. Hald
. 1 Acanthocobitis botia
(Hamilton) Balitoridae - - + - - - -
2 Ailia coila (Hamilton) Siluridae + + + + + + + 3 Amblypharyngodon gora
(Hamilton) Cyprinidae + + + + + + +
4 Amblypharyngodon microlepis(Bleeker)
Cyprinidae + + + +
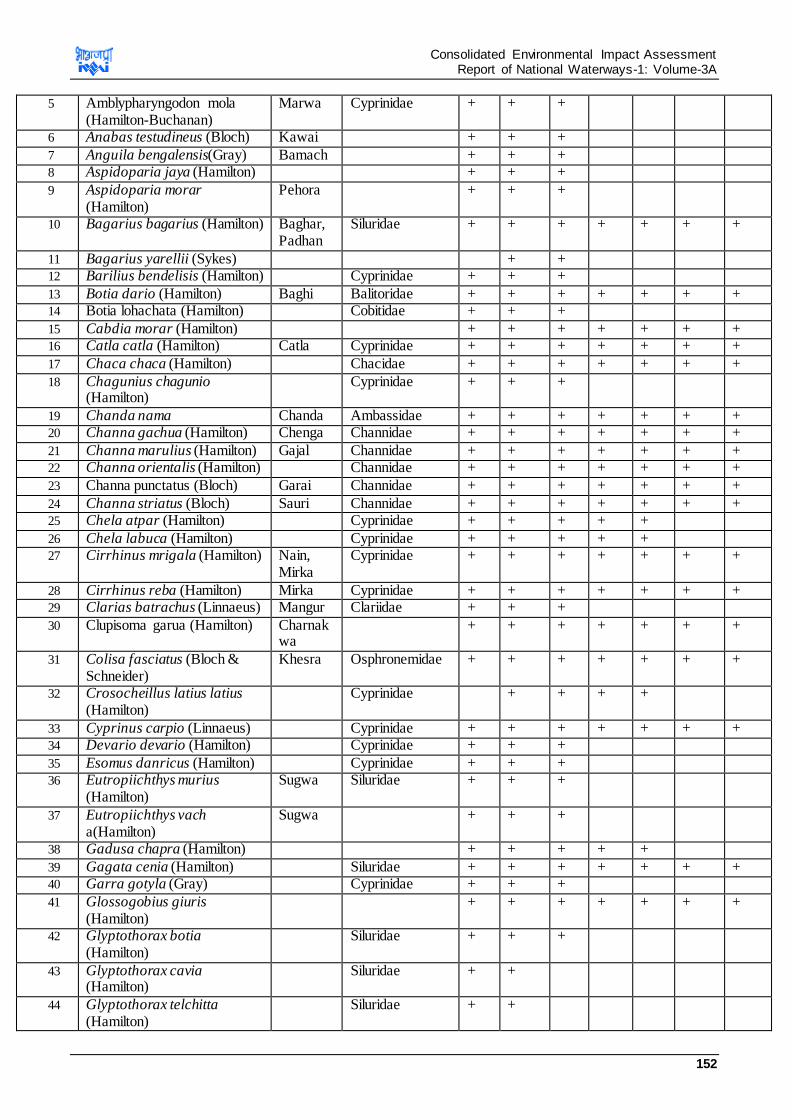
Consolidated Environmental Impact Assessment Report of National Waterways-1: Volume-3A
152
5 Amblypharyngodon mola (Hamilton-Buchanan)
Marwa Cyprinidae + + +
6 Anabas testudineus (Bloch) Kawai + + +
7 Anguila bengalensis(Gray) Bamach + + + 8 Aspidoparia jaya (Hamilton) + + +
9 Aspidoparia morar (Hamilton)
Pehora + + +
10 Bagarius bagarius (Hamilton) Baghar, Padhan
Siluridae + + + + + + +
11 Bagarius yarellii (Sykes) + + 12 Barilius bendelisis (Hamilton) Cyprinidae + + +
13 Botia dario (Hamilton) Baghi Balitoridae + + + + + + + 14 Botia lohachata (Hamilton) Cobitidae + + +
15 Cabdia morar (Hamilton) + + + + + + + 16 Catla catla (Hamilton) Catla Cyprinidae + + + + + + +
17 Chaca chaca (Hamilton) Chacidae + + + + + + +
18 Chagunius chagunio (Hamilton)
Cyprinidae + + +
19 Chanda nama Chanda Ambassidae + + + + + + + 20 Channa gachua (Hamilton) Chenga Channidae + + + + + + +
21 Channa marulius (Hamilton) Gajal Channidae + + + + + + + 22 Channa orientalis (Hamilton) Channidae + + + + + + +
23 Channa punctatus (Bloch) Garai Channidae + + + + + + +
24 Channa striatus (Bloch) Sauri Channidae + + + + + + + 25 Chela atpar (Hamilton) Cyprinidae + + + + +
26 Chela labuca (Hamilton) Cyprinidae + + + + + 27 Cirrhinus mrigala (Hamilton) Nain,
Mirka Cyprinidae + + + + + + +
28 Cirrhinus reba (Hamilton) Mirka Cyprinidae + + + + + + + 29 Clarias batrachus (Linnaeus) Mangur Clariidae + + +
30 Clupisoma garua (Hamilton) Charnakwa
+ + + + + + +
31 Colisa fasciatus (Bloch & Schneider)
Khesra Osphronemidae + + + + + + +
32 Crosocheillus latius latius (Hamilton)
Cyprinidae + + + +
33 Cyprinus carpio (Linnaeus) Cyprinidae + + + + + + + 34 Devario devario (Hamilton) Cyprinidae + + +
35 Esomus danricus (Hamilton) Cyprinidae + + + 36 Eutropiichthys murius
(Hamilton) Sugwa Siluridae + + +
37 Eutropiichthys vach a(Hamilton)
Sugwa + + +
38 Gadusa chapra (Hamilton) + + + + +
39 Gagata cenia (Hamilton) Siluridae + + + + + + + 40 Garra gotyla (Gray) Cyprinidae + + +
41 Glossogobius giuris (Hamilton)
+ + + + + + +
42 Glyptothorax botia (Hamilton)
Siluridae + + +
43 Glyptothorax cavia (Hamilton)
Siluridae + +
44 Glyptothorax telchitta (Hamilton)
Siluridae + +
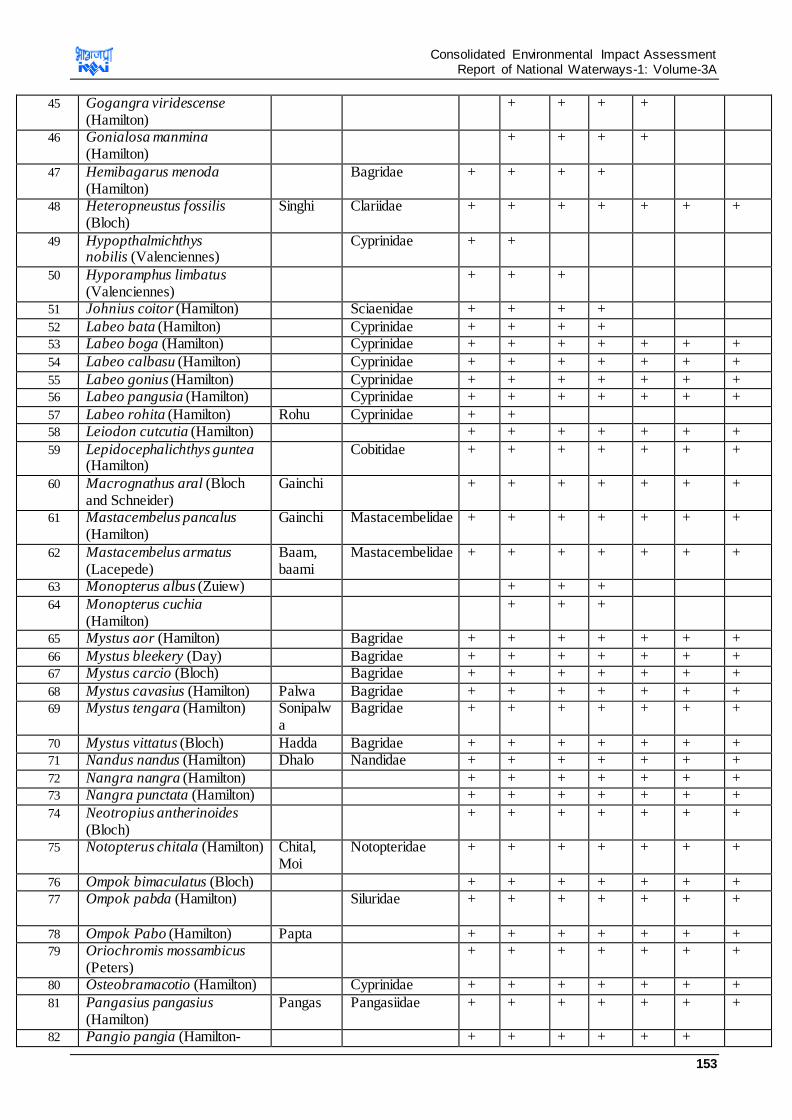
Consolidated Environmental Impact Assessment Report of National Waterways-1: Volume-3A
153
45 Gogangra viridescense (Hamilton)
+ + + +
46 Gonialosa manmina (Hamilton)
+ + + +
47 Hemibagarus menoda (Hamilton)
Bagridae + + + +
48 Heteropneustus fossilis (Bloch)
Singhi Clariidae + + + + + + +
49 Hypopthalmichthys nobilis (Valenciennes)
Cyprinidae + +
50 Hyporamphus limbatus (Valenciennes)
+ + +
51 Johnius coitor (Hamilton) Sciaenidae + + + +
52 Labeo bata (Hamilton) Cyprinidae + + + + 53 Labeo boga (Hamilton) Cyprinidae + + + + + + +
54 Labeo calbasu (Hamilton) Cyprinidae + + + + + + +
55 Labeo gonius (Hamilton) Cyprinidae + + + + + + + 56 Labeo pangusia (Hamilton) Cyprinidae + + + + + + +
57 Labeo rohita (Hamilton) Rohu Cyprinidae + + 58 Leiodon cutcutia (Hamilton) + + + + + + +
59 Lepidocephalichthys guntea (Hamilton)
Cobitidae + + + + + + +
60 Macrognathus aral (Bloch and Schneider)
Gainchi + + + + + + +
61 Mastacembelus pancalus (Hamilton)
Gainchi Mastacembelidae + + + + + + +
62 Mastacembelus armatus (Lacepede)
Baam, baami
Mastacembelidae + + + + + + +
63 Monopterus albus (Zuiew) + + +
64 Monopterus cuchia (Hamilton)
+ + +
65 Mystus aor (Hamilton) Bagridae + + + + + + +
66 Mystus bleekery (Day) Bagridae + + + + + + + 67 Mystus carcio (Bloch) Bagridae + + + + + + +
68 Mystus cavasius (Hamilton) Palwa Bagridae + + + + + + + 69 Mystus tengara (Hamilton) Sonipalw
a Bagridae + + + + + + +
70 Mystus vittatus (Bloch) Hadda Bagridae + + + + + + + 71 Nandus nandus (Hamilton) Dhalo Nandidae + + + + + + +
72 Nangra nangra (Hamilton) + + + + + + + 73 Nangra punctata (Hamilton) + + + + + + +
74 Neotropius antherinoides (Bloch)
+ + + + + + +
75 Notopterus chitala (Hamilton) Chital, Moi
Notopteridae + + + + + + +
76 Ompok bimaculatus (Bloch) + + + + + + + 77 Ompok pabda (Hamilton)
Siluridae + + + + + + +
78 Ompok Pabo (Hamilton) Papta + + + + + + + 79 Oriochromis mossambicus
(Peters) + + + + + + +
80 Osteobramacotio (Hamilton) Cyprinidae + + + + + + +
81 Pangasius pangasius (Hamilton)
Pangas Pangasiidae + + + + + + +
82 Pangio pangia (Hamilton- + + + + + +
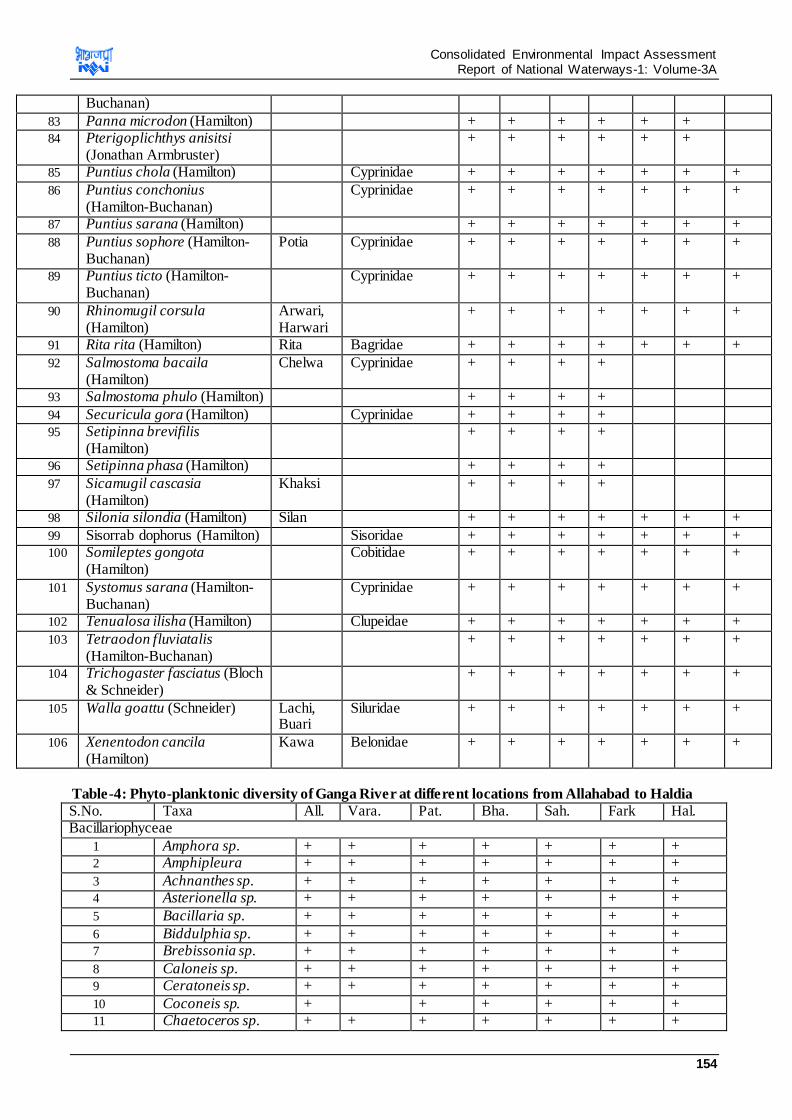
Consolidated Environmental Impact Assessment Report of National Waterways-1: Volume-3A
154
Buchanan)
83 Panna microdon (Hamilton) + + + + + + 84 Pterigoplichthys anisitsi
(Jonathan Armbruster) + + + + + +
85 Puntius chola (Hamilton) Cyprinidae + + + + + + +
86 Puntius conchonius (Hamilton-Buchanan)
Cyprinidae + + + + + + +
87 Puntius sarana (Hamilton) + + + + + + +
88 Puntius sophore (Hamilton-Buchanan)
Potia Cyprinidae + + + + + + +
89 Puntius ticto (Hamilton-Buchanan)
Cyprinidae + + + + + + +
90 Rhinomugil corsula (Hamilton)
Arwari, Harwari
+ + + + + + +
91 Rita rita (Hamilton) Rita Bagridae + + + + + + +
92 Salmostoma bacaila (Hamilton)
Chelwa Cyprinidae + + + +
93 Salmostoma phulo (Hamilton) + + + +
94 Securicula gora (Hamilton) Cyprinidae + + + + 95 Setipinna brevifilis
(Hamilton) + + + +
96 Setipinna phasa (Hamilton) + + + +
97 Sicamugil cascasia (Hamilton)
Khaksi + + + +
98 Silonia silondia (Hamilton) Silan + + + + + + +
99 Sisorrab dophorus (Hamilton) Sisoridae + + + + + + + 100 Somileptes gongota
(Hamilton) Cobitidae + + + + + + +
101 Systomus sarana (Hamilton-Buchanan)
Cyprinidae + + + + + + +
102 Tenualosa ilisha (Hamilton) Clupeidae + + + + + + +
103 Tetraodon fluviatalis (Hamilton-Buchanan)
+ + + + + + +
104 Trichogaster fasciatus (Bloch & Schneider)
+ + + + + + +
105 Walla goattu (Schneider) Lachi, Buari
Siluridae + + + + + + +
106 Xenentodon cancila (Hamilton)
Kawa Belonidae + + + + + + +
Table-4: Phyto-planktonic diversity of Ganga River at different locations from Allahabad to Haldia
S.No. Taxa All. Vara. Pat. Bha. Sah. Fark Hal. Bacillariophyceae
1 Amphora sp. + + + + + + + 2 Amphipleura + + + + + + +
3 Achnanthes sp. + + + + + + + 4 Asterionella sp. + + + + + + +
5 Bacillaria sp. + + + + + + +
6 Biddulphia sp. + + + + + + + 7 Brebissonia sp. + + + + + + +
8 Caloneis sp. + + + + + + + 9 Ceratoneis sp. + + + + + + +
10 Coconeis sp. + + + + + + 11 Chaetoceros sp. + + + + + + +
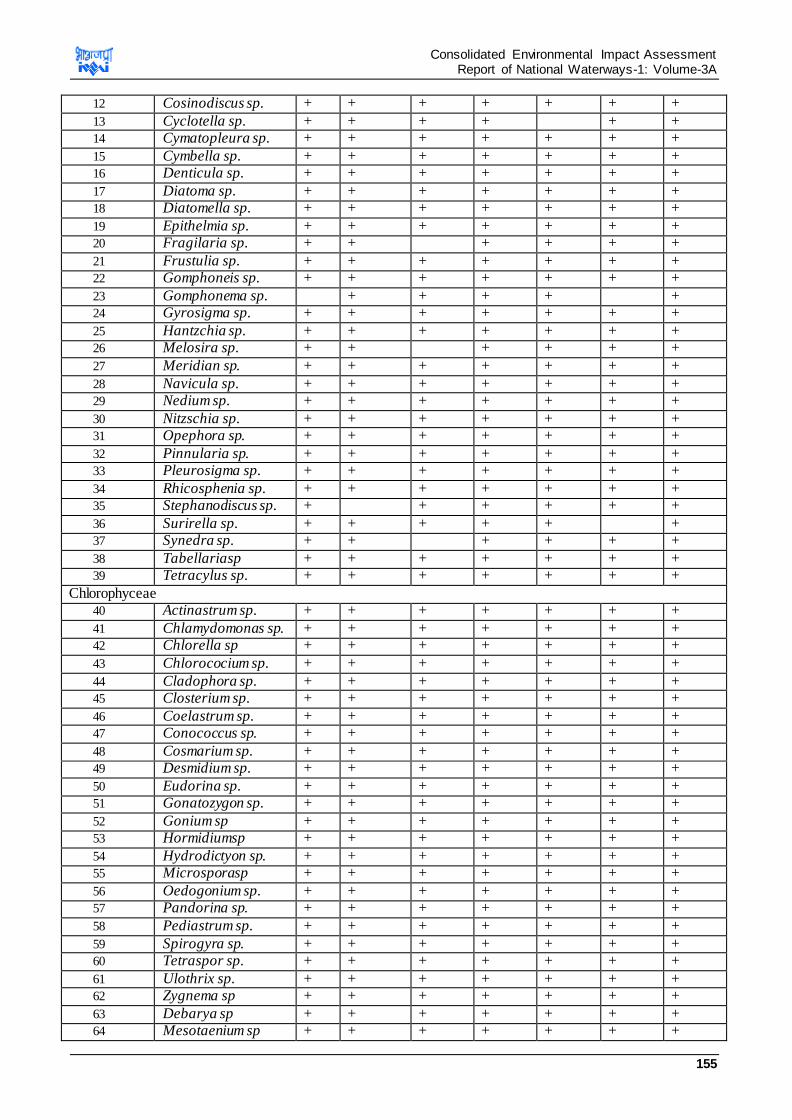
Consolidated Environmental Impact Assessment Report of National Waterways-1: Volume-3A
155
12 Cosinodiscus sp. + + + + + + +
13 Cyclotella sp. + + + + + + 14 Cymatopleura sp. + + + + + + +
15 Cymbella sp. + + + + + + + 16 Denticula sp. + + + + + + +
17 Diatoma sp. + + + + + + + 18 Diatomella sp. + + + + + + +
19 Epithelmia sp. + + + + + + + 20 Fragilaria sp. + + + + + +
21 Frustulia sp. + + + + + + + 22 Gomphoneis sp. + + + + + + +
23 Gomphonema sp. + + + + + 24 Gyrosigma sp. + + + + + + +
25 Hantzchia sp. + + + + + + + 26 Melosira sp. + + + + + +
27 Meridian sp. + + + + + + +
28 Navicula sp. + + + + + + + 29 Nedium sp. + + + + + + +
30 Nitzschia sp. + + + + + + + 31 Opephora sp. + + + + + + +
32 Pinnularia sp. + + + + + + + 33 Pleurosigma sp. + + + + + + +
34 Rhicosphenia sp. + + + + + + + 35 Stephanodiscus sp. + + + + + +
36 Surirella sp. + + + + + + 37 Synedra sp. + + + + + +
38 Tabellariasp + + + + + + + 39 Tetracylus sp. + + + + + + +
Chlorophyceae 40 Actinastrum sp. + + + + + + +
41 Chlamydomonas sp. + + + + + + + 42 Chlorella sp + + + + + + +
43 Chlorococium sp. + + + + + + +
44 Cladophora sp. + + + + + + + 45 Closterium sp. + + + + + + +
46 Coelastrum sp. + + + + + + + 47 Conococcus sp. + + + + + + +
48 Cosmarium sp. + + + + + + + 49 Desmidium sp. + + + + + + +
50 Eudorina sp. + + + + + + + 51 Gonatozygon sp. + + + + + + +
52 Gonium sp + + + + + + + 53 Hormidiumsp + + + + + + +
54 Hydrodictyon sp. + + + + + + + 55 Microsporasp + + + + + + +
56 Oedogonium sp. + + + + + + + 57 Pandorina sp. + + + + + + +
58 Pediastrum sp. + + + + + + +
59 Spirogyra sp. + + + + + + + 60 Tetraspor sp. + + + + + + +
61 Ulothrix sp. + + + + + + + 62 Zygnema sp + + + + + + +
63 Debarya sp + + + + + + + 64 Mesotaenium sp + + + + + + +
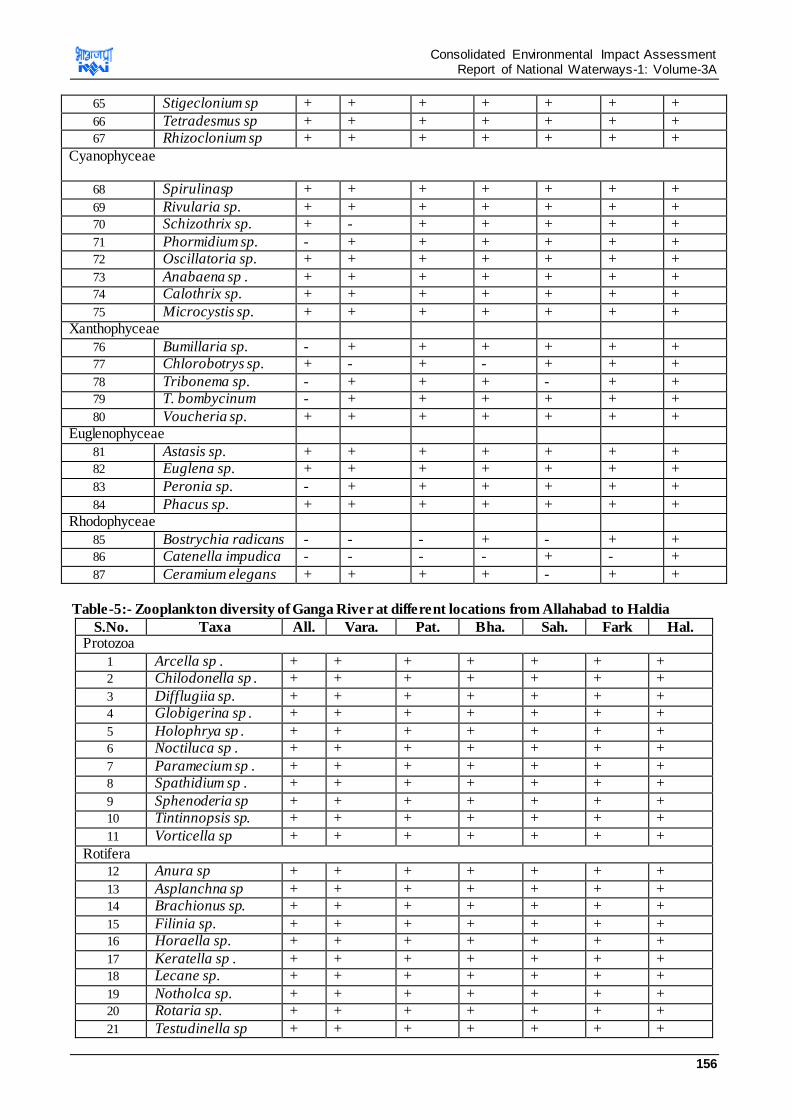
Consolidated Environmental Impact Assessment Report of National Waterways-1: Volume-3A
156
65 Stigeclonium sp + + + + + + +
66 Tetradesmus sp + + + + + + + 67 Rhizoclonium sp + + + + + + +
Cyanophyceae
68 Spirulinasp + + + + + + +
69 Rivularia sp. + + + + + + + 70 Schizothrix sp. + - + + + + +
71 Phormidium sp. - + + + + + + 72 Oscillatoria sp. + + + + + + +
73 Anabaena sp . + + + + + + + 74 Calothrix sp. + + + + + + +
75 Microcystis sp. + + + + + + + Xanthophyceae
76 Bumillaria sp. - + + + + + + 77 Chlorobotrys sp. + - + - + + +
78 Tribonema sp. - + + + - + + 79 T. bombycinum - + + + + + +
80 Voucheria sp. + + + + + + + Euglenophyceae
81 Astasis sp. + + + + + + + 82 Euglena sp. + + + + + + +
83 Peronia sp. - + + + + + +
84 Phacus sp. + + + + + + + Rhodophyceae
85 Bostrychia radicans - - - + - + + 86 Catenella impudica - - - - + - +
87 Ceramium elegans + + + + - + +
Table-5:- Zooplankton diversity of Ganga River at different locations from Allahabad to Haldia
S.No. Taxa All. Vara. Pat. Bha. Sah. Fark Hal. Protozoa
1 Arcella sp . + + + + + + + 2 Chilodonella sp . + + + + + + +
3 Difflugiia sp. + + + + + + + 4 Globigerina sp . + + + + + + +
5 Holophrya sp . + + + + + + + 6 Noctiluca sp . + + + + + + +
7 Paramecium sp . + + + + + + + 8 Spathidium sp . + + + + + + +
9 Sphenoderia sp + + + + + + + 10 Tintinnopsis sp. + + + + + + +
11 Vorticella sp + + + + + + +
Rotifera 12 Anura sp + + + + + + +
13 Asplanchna sp + + + + + + + 14 Brachionus sp. + + + + + + +
15 Filinia sp. + + + + + + + 16 Horaella sp. + + + + + + +
17 Keratella sp . + + + + + + + 18 Lecane sp. + + + + + + +
19 Notholca sp. + + + + + + + 20 Rotaria sp. + + + + + + +
21 Testudinella sp + + + + + + +
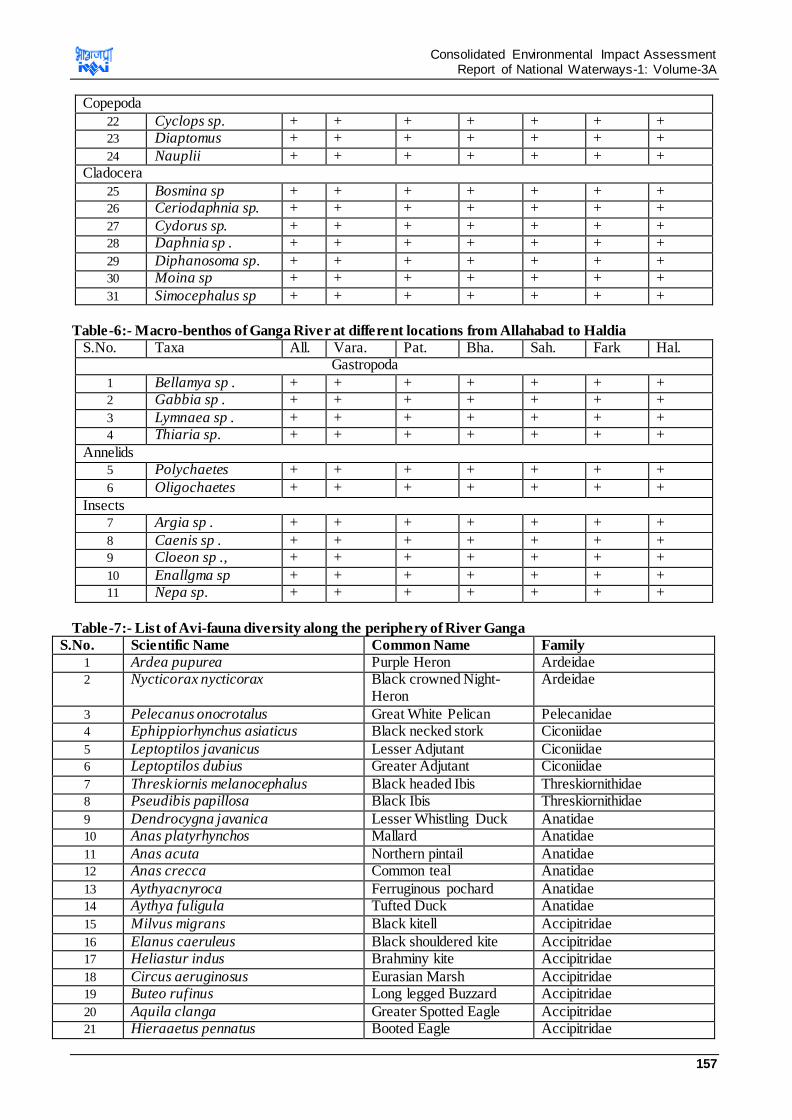
Consolidated Environmental Impact Assessment Report of National Waterways-1: Volume-3A
157
Copepoda
22 Cyclops sp. + + + + + + + 23 Diaptomus + + + + + + +
24 Nauplii + + + + + + + Cladocera
25 Bosmina sp + + + + + + + 26 Ceriodaphnia sp. + + + + + + +
27 Cydorus sp. + + + + + + + 28 Daphnia sp . + + + + + + +
29 Diphanosoma sp. + + + + + + + 30 Moina sp + + + + + + +
31 Simocephalus sp + + + + + + +
Table-6:- Macro-benthos of Ganga River at different locations from Allahabad to Haldia
S.No. Taxa All. Vara. Pat. Bha. Sah. Fark Hal. Gastropoda
1 Bellamya sp . + + + + + + + 2 Gabbia sp . + + + + + + +
3 Lymnaea sp . + + + + + + + 4 Thiaria sp. + + + + + + +
Annelids 5 Polychaetes + + + + + + +
6 Oligochaetes + + + + + + +
Insects 7 Argia sp . + + + + + + +
8 Caenis sp . + + + + + + + 9 Cloeon sp ., + + + + + + +
10 Enallgma sp + + + + + + + 11 Nepa sp. + + + + + + +
Table-7:- List of Avi-fauna diversity along the periphery of River Ganga
S.No. Scientific Name Common Name Family
1 Ardea pupurea Purple Heron Ardeidae 2 Nycticorax nycticorax Black crowned Night-
Heron Ardeidae
3 Pelecanus onocrotalus Great White Pelican Pelecanidae 4 Ephippiorhynchus asiaticus Black necked stork Ciconiidae
5 Leptoptilos javanicus Lesser Adjutant Ciconiidae 6 Leptoptilos dubius Greater Adjutant Ciconiidae
7 Threskiornis melanocephalus Black headed Ibis Threskiornithidae 8 Pseudibis papillosa Black Ibis Threskiornithidae
9 Dendrocygna javanica Lesser Whistling Duck Anatidae 10 Anas platyrhynchos Mallard Anatidae
11 Anas acuta Northern pintail Anatidae 12 Anas crecca Common teal Anatidae
13 Aythyacnyroca Ferruginous pochard Anatidae 14 Aythya fuligula Tufted Duck Anatidae
15 Milvus migrans Black kitell Accipitridae
16 Elanus caeruleus Black shouldered kite Accipitridae 17 Heliastur indus Brahminy kite Accipitridae
18 Circus aeruginosus Eurasian Marsh Accipitridae 19 Buteo rufinus Long legged Buzzard Accipitridae
20 Aquila clanga Greater Spotted Eagle Accipitridae 21 Hieraaetus pennatus Booted Eagle Accipitridae
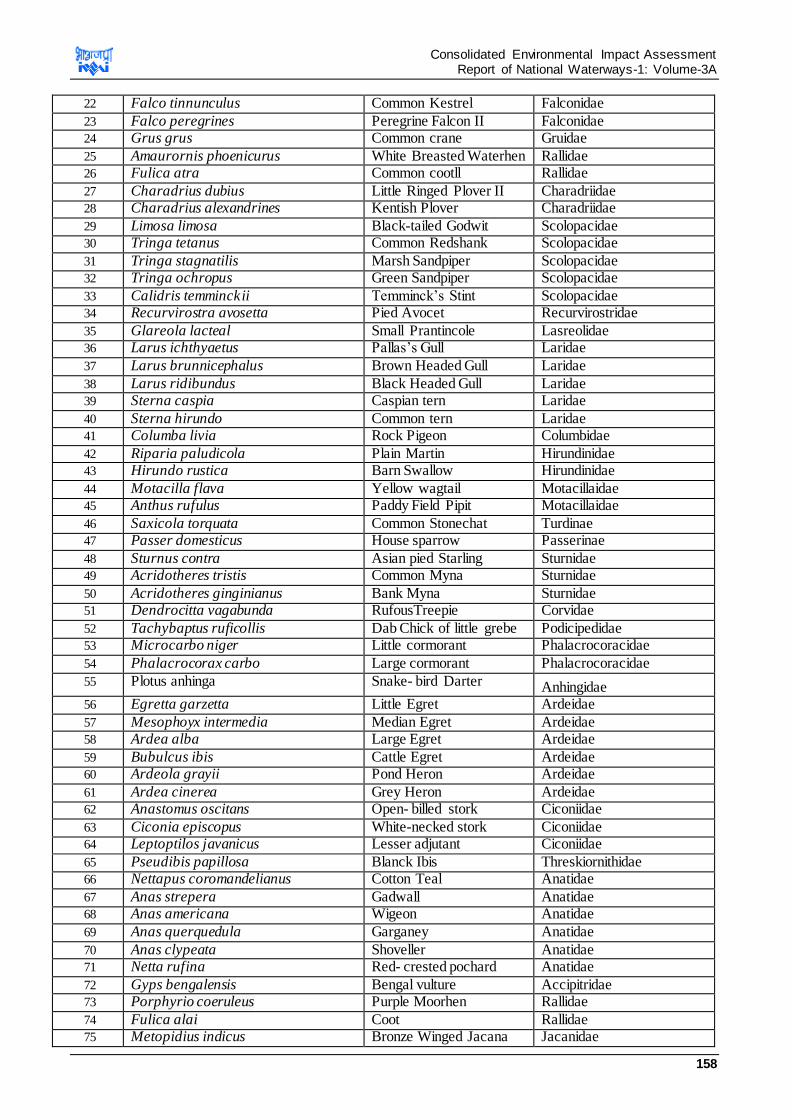
Consolidated Environmental Impact Assessment Report of National Waterways-1: Volume-3A
158
22 Falco tinnunculus Common Kestrel Falconidae
23 Falco peregrines Peregrine Falcon II Falconidae 24 Grus grus Common crane Gruidae
25 Amaurornis phoenicurus White Breasted Waterhen Rallidae 26 Fulica atra Common cootll Rallidae
27 Charadrius dubius Little Ringed Plover II Charadriidae 28 Charadrius alexandrines Kentish Plover Charadriidae
29 Limosa limosa Black-tailed Godwit Scolopacidae 30 Tringa tetanus Common Redshank Scolopacidae
31 Tringa stagnatilis Marsh Sandpiper Scolopacidae 32 Tringa ochropus Green Sandpiper Scolopacidae
33 Calidris temminckii Temminck’s Stint Scolopacidae 34 Recurvirostra avosetta Pied Avocet Recurvirostridae
35 Glareola lacteal Small Prantincole Lasreolidae 36 Larus ichthyaetus Pallas’s Gull Laridae
37 Larus brunnicephalus Brown Headed Gull Laridae
38 Larus ridibundus Black Headed Gull Laridae 39 Sterna caspia Caspian tern Laridae
40 Sterna hirundo Common tern Laridae 41 Columba livia Rock Pigeon Columbidae
42 Riparia paludicola Plain Martin Hirundinidae 43 Hirundo rustica Barn Swallow Hirundinidae
44 Motacilla flava Yellow wagtail Motacillaidae 45 Anthus rufulus Paddy Field Pipit Motacillaidae
46 Saxicola torquata Common Stonechat Turdinae 47 Passer domesticus House sparrow Passerinae
48 Sturnus contra Asian pied Starling Sturnidae 49 Acridotheres tristis Common Myna Sturnidae
50 Acridotheres ginginianus Bank Myna Sturnidae 51 Dendrocitta vagabunda RufousTreepie Corvidae
52 Tachybaptus ruficollis Dab Chick of little grebe Podicipedidae 53 Microcarbo niger Little cormorant Phalacrocoracidae
54 Phalacrocorax carbo Large cormorant Phalacrocoracidae
55 Plotus anhinga Snake- bird Darter Anhingidae 56 Egretta garzetta Little Egret Ardeidae
57 Mesophoyx intermedia Median Egret Ardeidae 58 Ardea alba Large Egret Ardeidae
59 Bubulcus ibis Cattle Egret Ardeidae 60 Ardeola grayii Pond Heron Ardeidae
61 Ardea cinerea Grey Heron Ardeidae 62 Anastomus oscitans Open- billed stork Ciconiidae
63 Ciconia episcopus White-necked stork Ciconiidae 64 Leptoptilos javanicus Lesser adjutant Ciconiidae
65 Pseudibis papillosa Blanck Ibis Threskiornithidae 66 Nettapus coromandelianus Cotton Teal Anatidae
67 Anas strepera Gadwall Anatidae 68 Anas americana Wigeon Anatidae
69 Anas querquedula Garganey Anatidae
70 Anas clypeata Shoveller Anatidae 71 Netta rufina Red- crested pochard Anatidae
72 Gyps bengalensis Bengal vulture Accipitridae 73 Porphyrio coeruleus Purple Moorhen Rallidae
74 Fulica alai Coot Rallidae 75 Metopidius indicus Bronze Winged Jacana Jacanidae
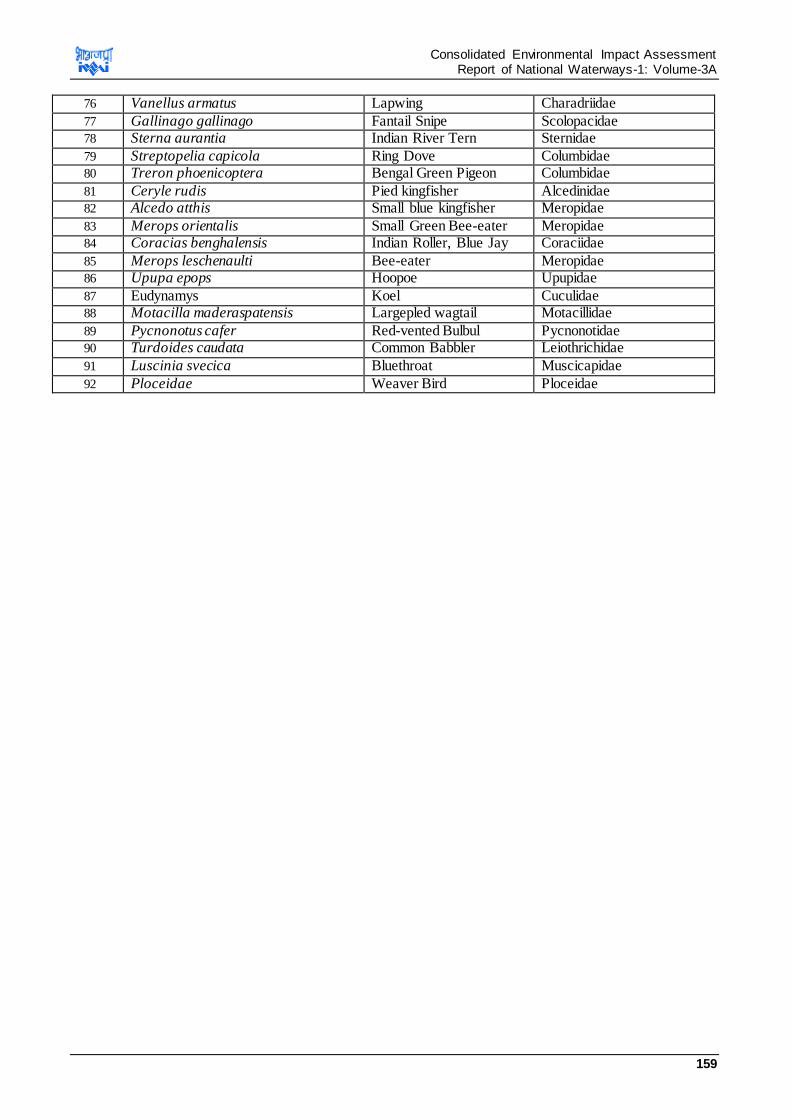
Consolidated Environmental Impact Assessment Report of National Waterways-1: Volume-3A
159
76 Vanellus armatus Lapwing Charadriidae
77 Gallinago gallinago Fantail Snipe Scolopacidae 78 Sterna aurantia Indian River Tern Sternidae
79 Streptopelia capicola Ring Dove Columbidae 80 Treron phoenicoptera Bengal Green Pigeon Columbidae
81 Ceryle rudis Pied kingfisher Alcedinidae 82 Alcedo atthis Small blue kingfisher Meropidae
83 Merops orientalis Small Green Bee-eater Meropidae 84 Coracias benghalensis Indian Roller, Blue Jay Coraciidae
85 Merops leschenaulti Bee-eater Meropidae 86 Upupa epops Hoopoe Upupidae
87 Eudynamys Koel Cuculidae 88 Motacilla maderaspatensis Largepled wagtail Motacillidae
89 Pycnonotus cafer Red-vented Bulbul Pycnonotidae 90 Turdoides caudata Common Babbler Leiothrichidae
91 Luscinia svecica Bluethroat Muscicapidae
92 Ploceidae Weaver Bird Ploceidae
Related Documents