Ink recognition based on statistical classification methods Vassiliki KOKLA, Alexandra PSARROU, Vassilis KONSTANTINOU Harrow School of Computer Science, University of Westminster, Watford Road, Harrow HA1 3TP UK December 20, 2005 Abstract Statistical classification methods can be applied on images of his- torical manuscript in order to characterize the various kinds of inks used. As these methods do not require destructive sampling they can be applied to the study of old and fragile manuscripts. Analysis on manuscript inks based on statistical analysis can be applied in situ, to provide important information on the authenticity, dating and origin of manuscripts. This paper describes a methodology and related algorithms used to interpret the photometric properties of inks and produce computa- tional models which classify diverse types of inks found in Byzantine- era manuscripts. The optical properties of these inks are extracted by the analysis of digital images taken in the visible and infrared area of the light spectrum. The inks are modelled based on their grey- level and colour information using a mixture of Gaussian functions and classified using Bayes’ decision rule. 1 Introduction The aim of this work is to use image-based techniques to complement the reflectographical methods of analysis. This is done by developing computa- tional models for the interpretation of the visual properties of the inks in the visible and infrared areas of the spectrum, therefore providing an in situ and portable quantitative method for the identification of inks used in old manuscripts. In order, however, to develop a generic framework which for- mulates solutions for ink recognition problems we need a statistical approach

Welcome message from author
This document is posted to help you gain knowledge. Please leave a comment to let me know what you think about it! Share it to your friends and learn new things together.
Transcript
Ink recognition based on statisticalclassification methods
Vassiliki KOKLA, Alexandra PSARROU, Vassilis KONSTANTINOUHarrow School of Computer Science, University of Westminster,
Watford Road, Harrow HA1 3TP UK
December 20, 2005
Abstract
Statistical classification methods can be applied on images of his-torical manuscript in order to characterize the various kinds of inksused. As these methods do not require destructive sampling they canbe applied to the study of old and fragile manuscripts. Analysis onmanuscript inks based on statistical analysis can be applied in situ, toprovide important information on the authenticity, dating and originof manuscripts.
This paper describes a methodology and related algorithms usedto interpret the photometric properties of inks and produce computa-tional models which classify diverse types of inks found in Byzantine-era manuscripts. The optical properties of these inks are extractedby the analysis of digital images taken in the visible and infrared areaof the light spectrum. The inks are modelled based on their grey-level and colour information using a mixture of Gaussian functionsand classified using Bayes’ decision rule.
1 Introduction
The aim of this work is to use image-based techniques to complement thereflectographical methods of analysis. This is done by developing computa-tional models for the interpretation of the visual properties of the inks inthe visible and infrared areas of the spectrum, therefore providing an in situand portable quantitative method for the identification of inks used in oldmanuscripts. In order, however, to develop a generic framework which for-mulates solutions for ink recognition problems we need a statistical approach
which recognizes: a) the probabilistic nature of the optical ink informationwe seek to process, and b)the form in which we should express the results.
The manuscript inks we examined, were made using a combination ofinorganic organic pigments such as metals, salts and vegetable materials.Existing methods used for the examination of pigments can be applied inthe analysis of manuscript inks, however, most are based on destructive test-ing techniques that require the physicochemical sampling of the manuscriptunder test. Such methods cannot be used widely for manuscripts mainlybecause of their historical value. Non-destructive techniques such as spec-troscopy and reflectography where the optical properties of the pigments areexamined under illumination beyond the visible spectrum, are more suitedto the study and conservation of old manuscripts.
Related machine vision research in the analysis and modeling of color [7],focuses mainly in the visual retrieval of information in the form of digitalimage libraries [21, 12, 17]. Most of the image-based research on materialsused in works of art are focused on generation, rather than analysis, and aremainly applied in the restoration of colors in paintings and frescoes [18, 19,24]. Granado used mathematical morphology to identify and extract severalstylistic components used in antique printed books such as drop capitals,stripes, figures, annotations and text matters, in order to build metadataautomatically [13].
In recent years, attempts have been made for the analysis of pigmentsusing electronic video imaging devices in reflectographic and radiographictechniques. These attempts are few and fragmented. Some of the most rele-vant are included below. The examination of underdrawing lines in artworks[4]. The use of vidicon TV camera for infrared reflectography on artworks[16]. The platinum silicide cameras for use in infrared reflectography onartworks[22, 23]. A more sophisticated approach is the use of band-pass fil-ter reflectography, which helps to discriminate between types of inks [11, 10].Radiographic techniques and new imaging technologies are used in the studyand conservation of paintings [20].The analysis of Anglo-Saxon manuscriptspigments with non-destructive techniques[3]. A method for the eliminationof cracks in infrared reflectograms that show the underdrawing - the basicconcept of the artist drawn on the ground layer - in ancient wood panelpaintings [14].
Manuscript inks, however, are semi-transparent pigments and difficult tocharacterize because their intensity depends on the amount of liquid spreadduring scripting and the reflective properties of the support. In this work weshow that manuscript inks can be represented in the visible and infrared areaof the spectrum through a mixture of Gaussian functions and their opticalfeatures can be classified using Bayes’ decision rule.
2
In the remaining of this paper, in Section 2 we give a short descriptionof the composition of inks that were used during this study and present themodel and test images used during the experiments of this study. In Section3 we present the inks analysis. In Section 4 we give some of our resultsin the classification of manuscript inks. Finally, in Section 5 we concludethe results and propose further research on the morphological analysis ofmanuscript inks.
2 Background
The main body of manuscript texts is usually written in black, brown orbrown-black inks as evidenced by the the cataloging of such manuscripts inmuseums and libraries. This descriptive term, however, does little to indicatethe richness or variety of tones of the inks which fall within this category.The two most common ”brown, black or brown-black” writing fluids werecomposed of either carbon or metalgall[2]. The carbon inks were composedgenerally of either soot, lampblack, or some type of charcoal to which gumarabic and solvent such as water, wine, or vinegar were added. The basicingredients of metalgall inks are copper, iron, galls, gum arabic, and a solventsuch as water, wine, or vinegar[5], [9]. The inks used in this study date fromthe 11th to the 18th century and are employed in manuscripts located insouth-east Europe and the eastern Mediterranean areas, especially in areaswhere the Byzantine Empire and its influence spread. Furthemore, all thetext used in this study is Greek. The first aim of our study was to derivemodels from inks manufactured according to the recipes given in[25] in orderto have a basis for comparison with unknown inks. We prepared eight inkswith various known chemical compositions, in order to represent as manytypes of inks as possible. The inks we prepared are as follows:
• Carbon ink
• Metalgall ink. This category contains the Coppergall inks and Irongallinks.
• Incomplete ink. This group includes ink, that have a similar compo-sition to that of metalgall inks, although their composition does notinclude all of the ingredients of metalgall inks and we treat them assubclasses of metalgall inks(type A,B and C).
• Mixed ink. This category contains inks that have ingredients of thefirst two categories.
3
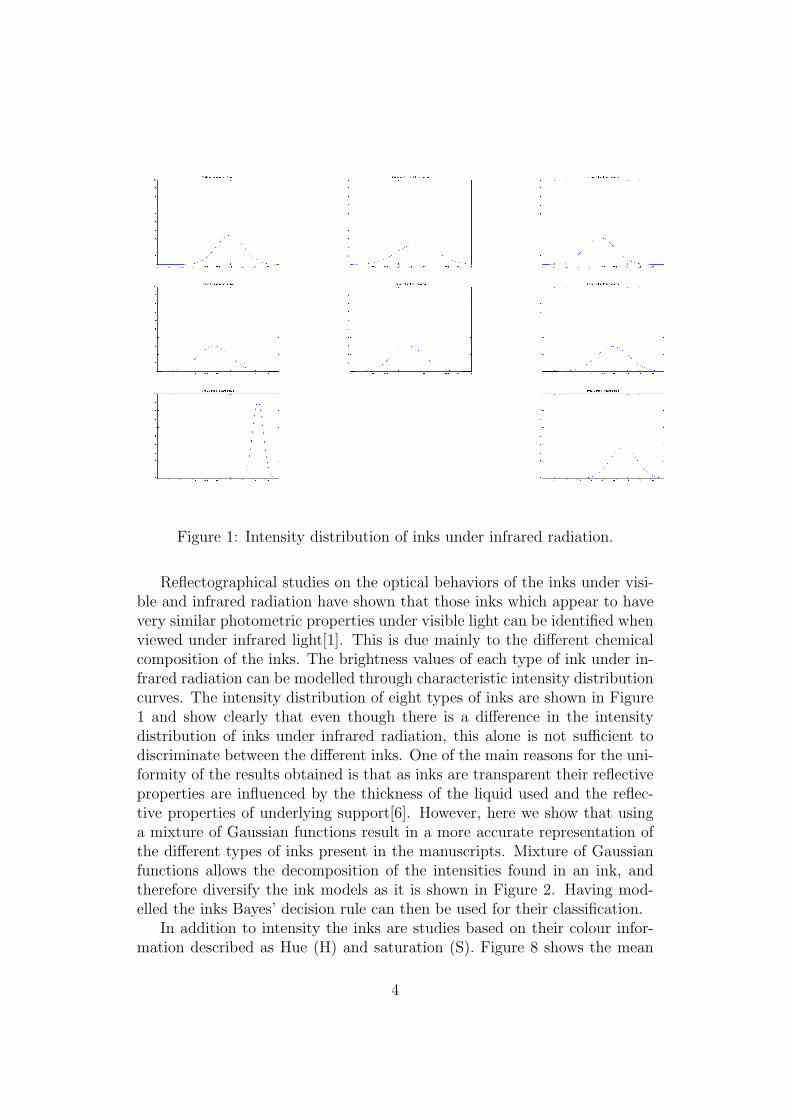
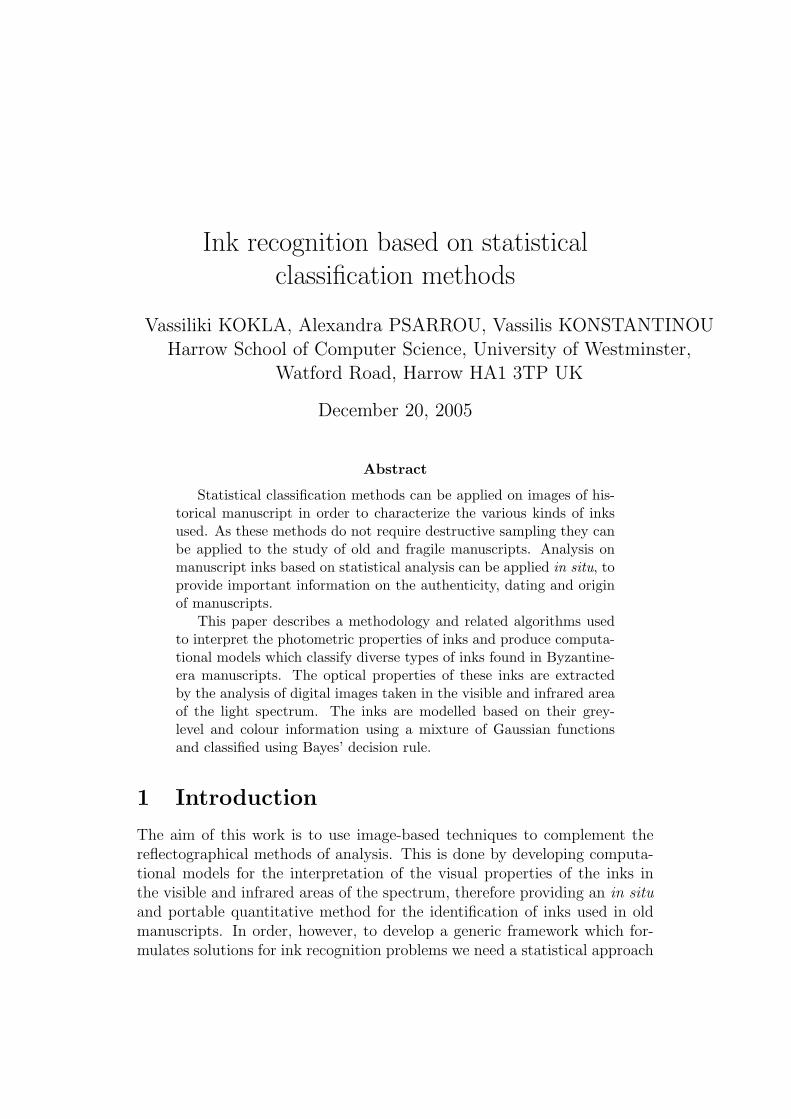
Figure 1: Intensity distribution of inks under infrared radiation.
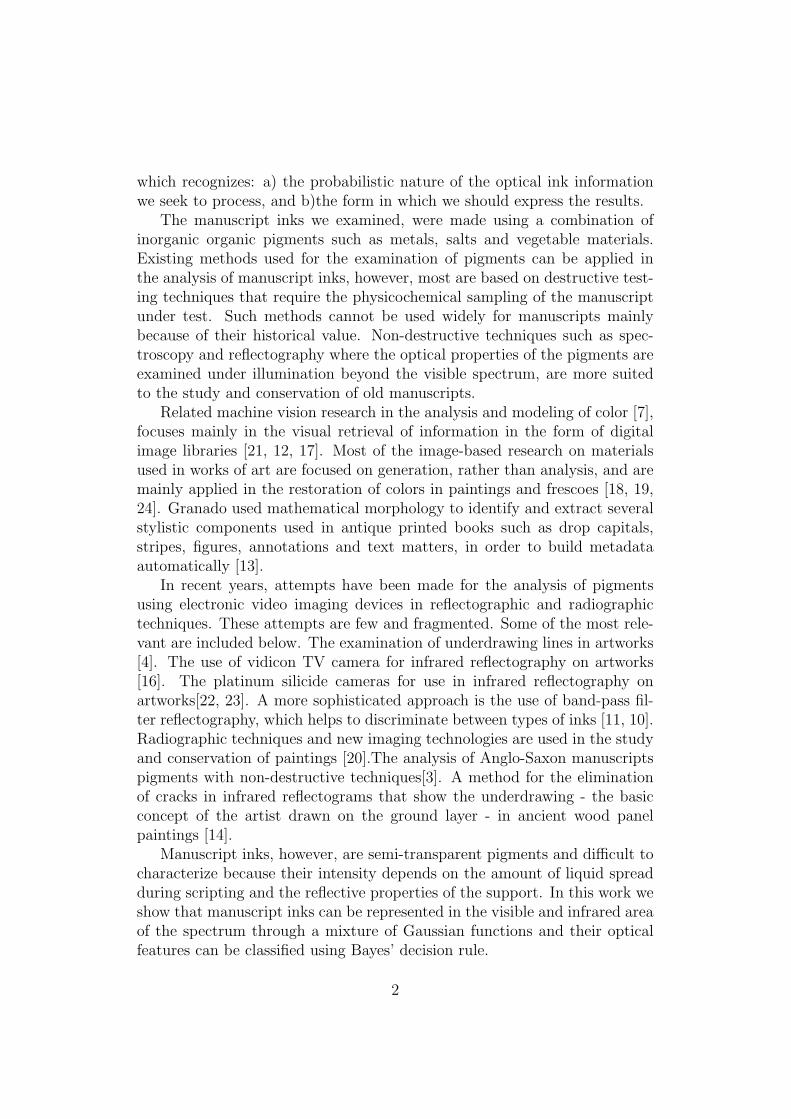
Reflectographical studies on the optical behaviors of the inks under visi-ble and infrared radiation have shown that those inks which appear to havevery similar photometric properties under visible light can be identified whenviewed under infrared light[1]. This is due mainly to the different chemicalcomposition of the inks. The brightness values of each type of ink under in-frared radiation can be modelled through characteristic intensity distributioncurves. The intensity distribution of eight types of inks are shown in Figure1 and show clearly that even though there is a difference in the intensitydistribution of inks under infrared radiation, this alone is not sufficient todiscriminate between the different inks. One of the main reasons for the uni-formity of the results obtained is that as inks are transparent their reflectiveproperties are influenced by the thickness of the liquid used and the reflec-tive properties of underlying support[6]. However, here we show that usinga mixture of Gaussian functions result in a more accurate representation ofthe different types of inks present in the manuscripts. Mixture of Gaussianfunctions allows the decomposition of the intensities found in an ink, andtherefore diversify the ink models as it is shown in Figure 2. Having mod-elled the inks Bayes’ decision rule can then be used for their classification.
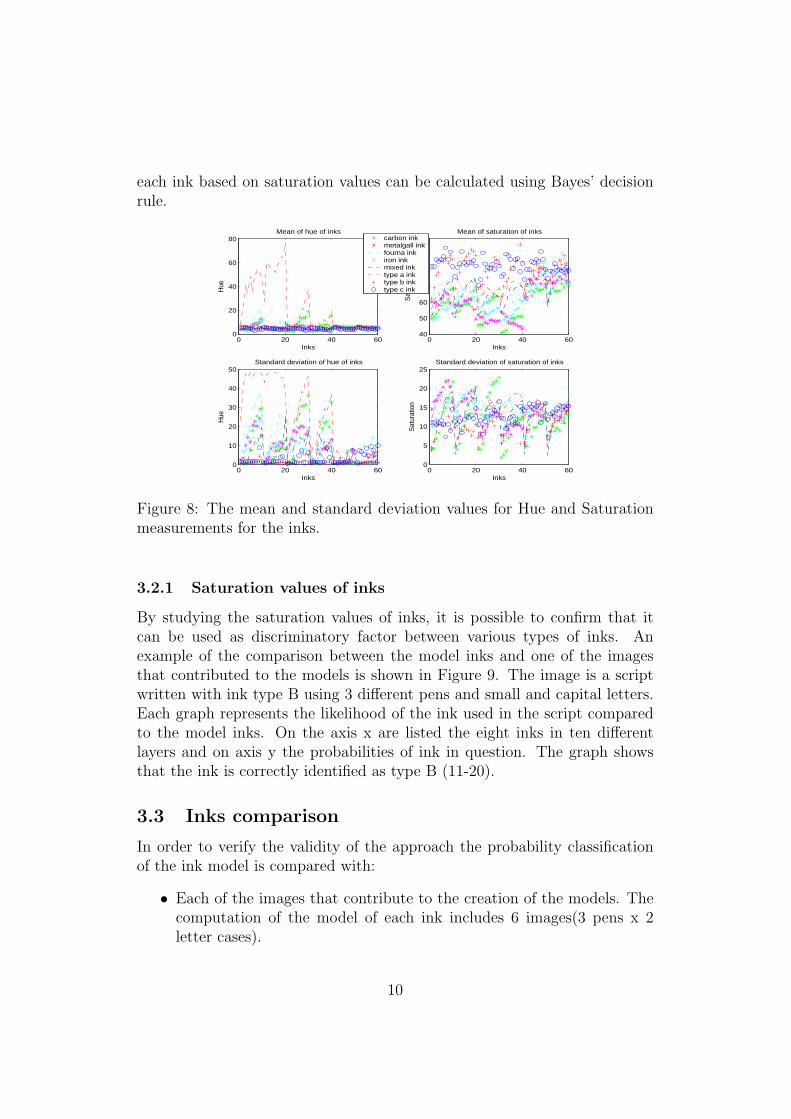
In addition to intensity the inks are studies based on their colour infor-mation described as Hue (H) and saturation (S). Figure 8 shows the mean
4
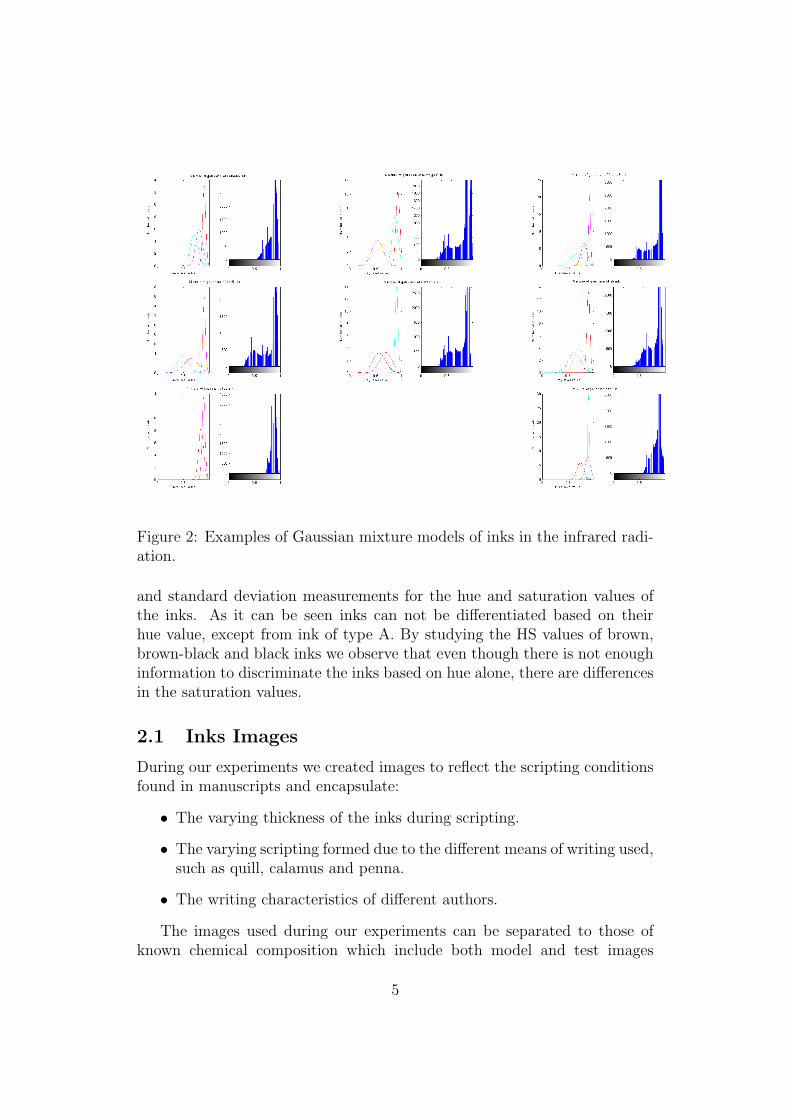
Figure 2: Examples of Gaussian mixture models of inks in the infrared radi-ation.
and standard deviation measurements for the hue and saturation values ofthe inks. As it can be seen inks can not be differentiated based on theirhue value, except from ink of type A. By studying the HS values of brown,brown-black and black inks we observe that even though there is not enoughinformation to discriminate the inks based on hue alone, there are differencesin the saturation values.
2.1 Inks Images
During our experiments we created images to reflect the scripting conditionsfound in manuscripts and encapsulate:
• The varying thickness of the inks during scripting.
• The varying scripting formed due to the different means of writing used,such as quill, calamus and penna.
• The writing characteristics of different authors.
The images used during our experiments can be separated to those ofknown chemical composition which include both model and test images
5
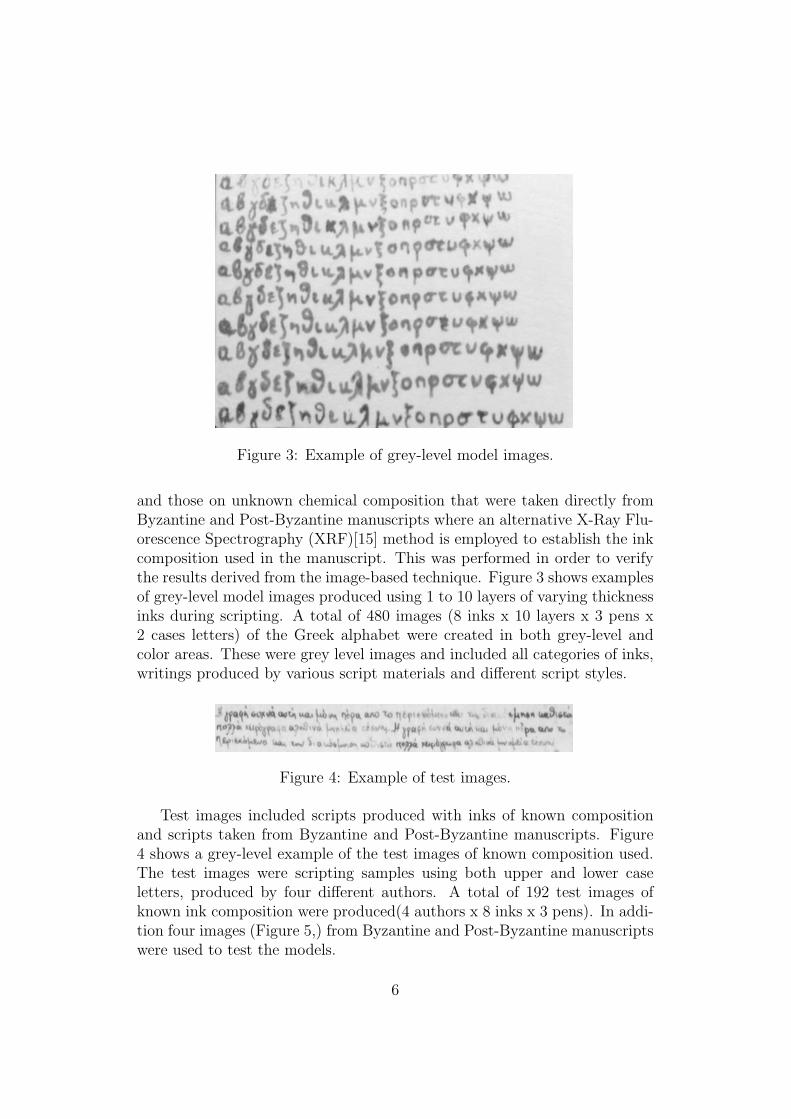
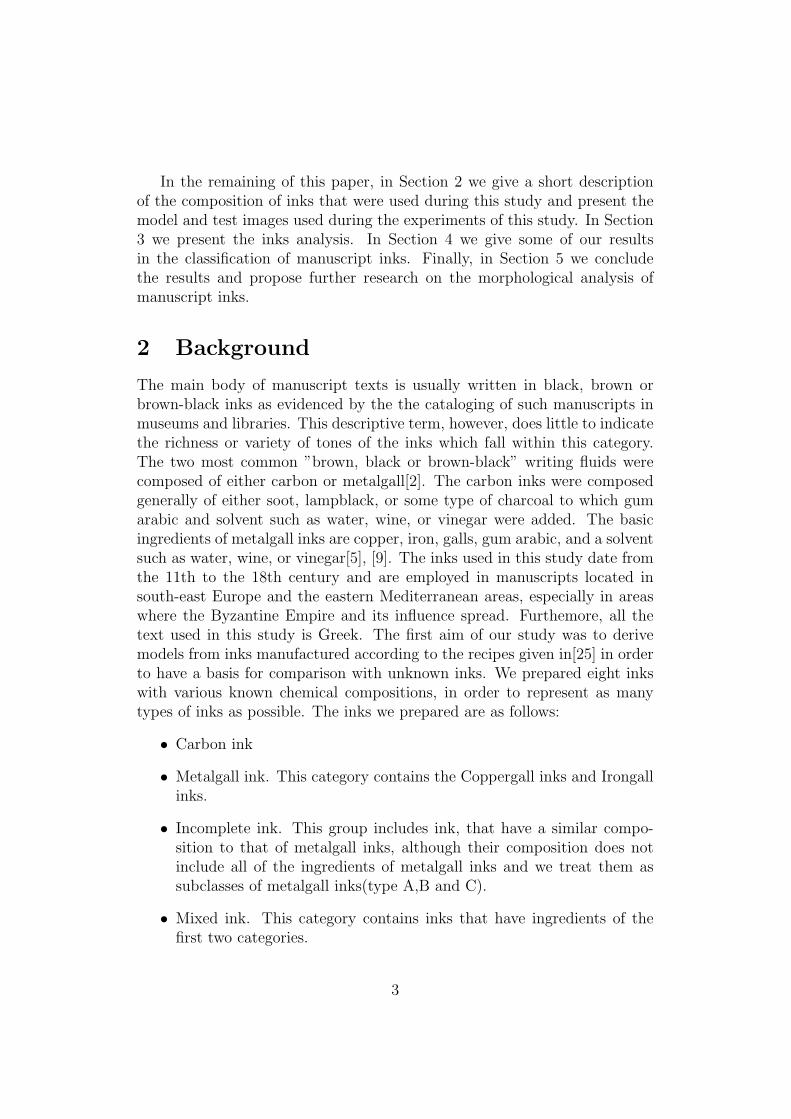
Figure 3: Example of grey-level model images.
and those on unknown chemical composition that were taken directly fromByzantine and Post-Byzantine manuscripts where an alternative X-Ray Flu-orescence Spectrography (XRF)[15] method is employed to establish the inkcomposition used in the manuscript. This was performed in order to verifythe results derived from the image-based technique. Figure 3 shows examplesof grey-level model images produced using 1 to 10 layers of varying thicknessinks during scripting. A total of 480 images (8 inks x 10 layers x 3 pens x2 cases letters) of the Greek alphabet were created in both grey-level andcolor areas. These were grey level images and included all categories of inks,writings produced by various script materials and different script styles.
Figure 4: Example of test images.
Test images included scripts produced with inks of known compositionand scripts taken from Byzantine and Post-Byzantine manuscripts. Figure4 shows a grey-level example of the test images of known composition used.The test images were scripting samples using both upper and lower caseletters, produced by four different authors. A total of 192 test images ofknown ink composition were produced(4 authors x 8 inks x 3 pens). In addi-tion four images (Figure 5,) from Byzantine and Post-Byzantine manuscriptswere used to test the models.
6
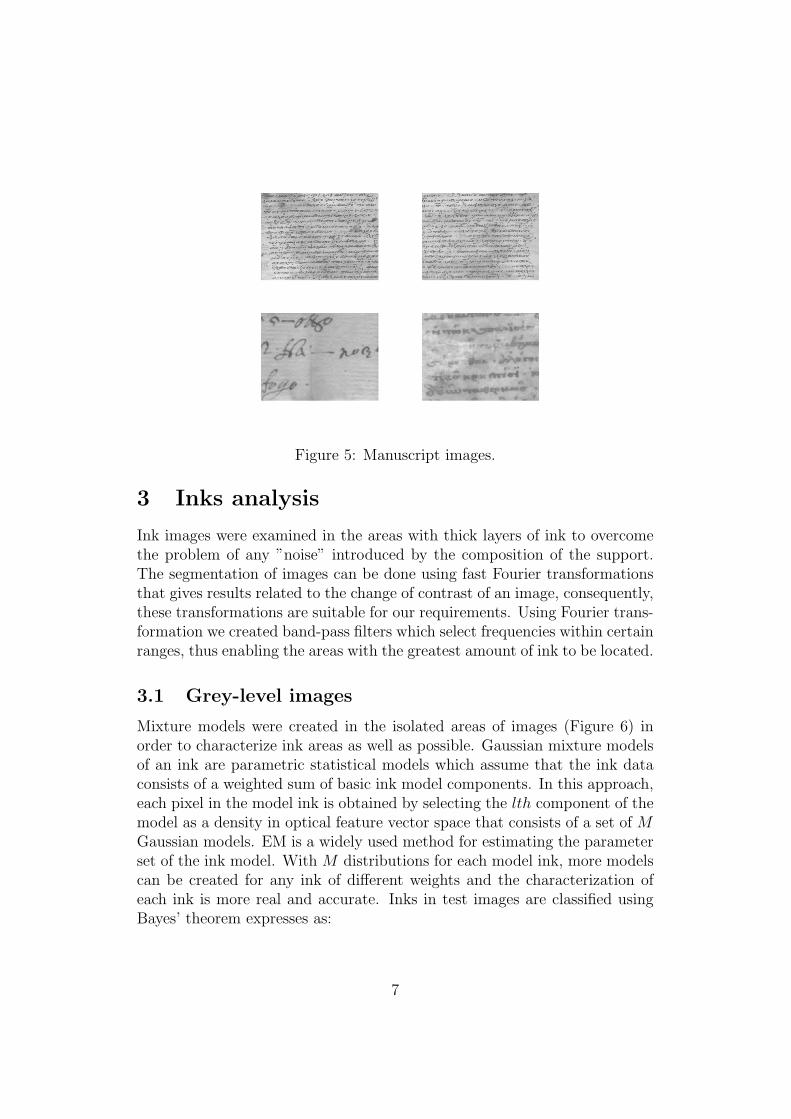
Figure 5: Manuscript images.
3 Inks analysis
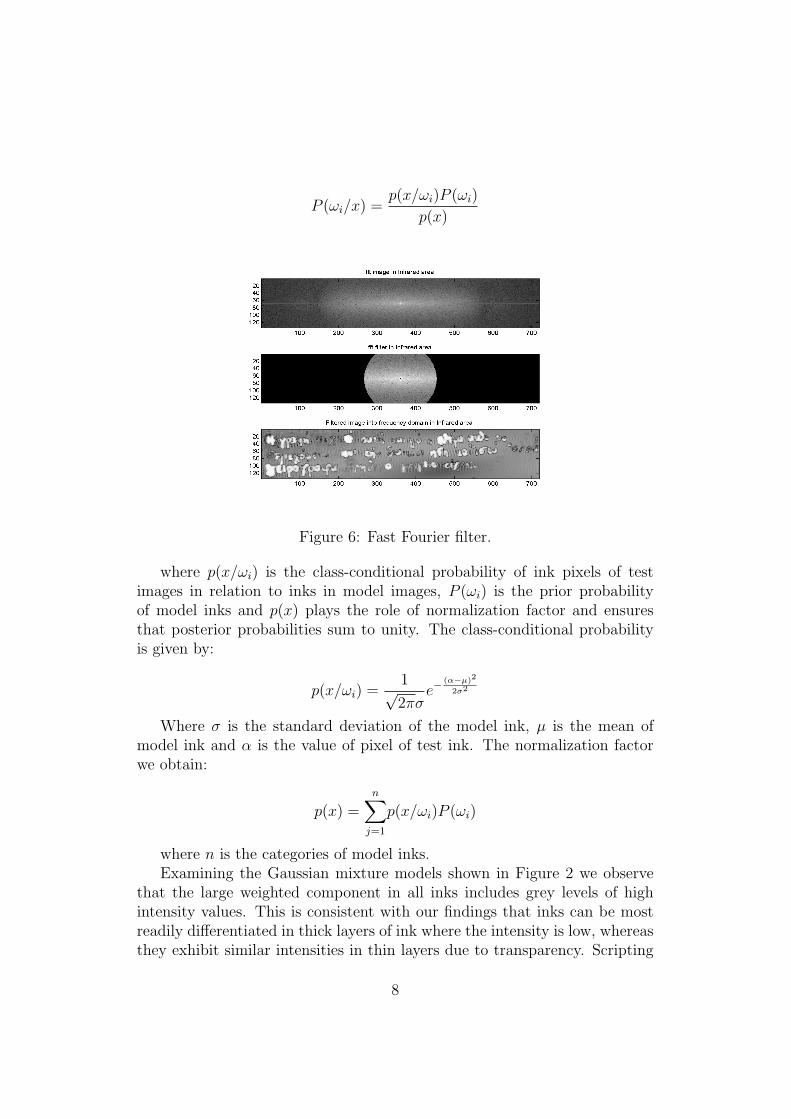
Ink images were examined in the areas with thick layers of ink to overcomethe problem of any ”noise” introduced by the composition of the support.The segmentation of images can be done using fast Fourier transformationsthat gives results related to the change of contrast of an image, consequently,these transformations are suitable for our requirements. Using Fourier trans-formation we created band-pass filters which select frequencies within certainranges, thus enabling the areas with the greatest amount of ink to be located.
3.1 Grey-level images
Mixture models were created in the isolated areas of images (Figure 6) inorder to characterize ink areas as well as possible. Gaussian mixture modelsof an ink are parametric statistical models which assume that the ink dataconsists of a weighted sum of basic ink model components. In this approach,each pixel in the model ink is obtained by selecting the lth component of themodel as a density in optical feature vector space that consists of a set of MGaussian models. EM is a widely used method for estimating the parameterset of the ink model. With M distributions for each model ink, more modelscan be created for any ink of different weights and the characterization ofeach ink is more real and accurate. Inks in test images are classified usingBayes’ theorem expresses as:
7
P (ωi/x) =p(x/ωi)P (ωi)
p(x)
Figure 6: Fast Fourier filter.
where p(x/ωi) is the class-conditional probability of ink pixels of testimages in relation to inks in model images, P (ωi) is the prior probabilityof model inks and p(x) plays the role of normalization factor and ensuresthat posterior probabilities sum to unity. The class-conditional probabilityis given by:
p(x/ωi) =1√2πσ
e−(α−µ)2
2σ2
Where σ is the standard deviation of the model ink, µ is the mean ofmodel ink and α is the value of pixel of test ink. The normalization factorwe obtain:
p(x) =n∑
j=1
p(x/ωi)P (ωi)
where n is the categories of model inks.Examining the Gaussian mixture models shown in Figure 2 we observe
that the large weighted component in all inks includes grey levels of highintensity values. This is consistent with our findings that inks can be mostreadily differentiated in thick layers of ink where the intensity is low, whereasthey exhibit similar intensities in thin layers due to transparency. Scripting
8
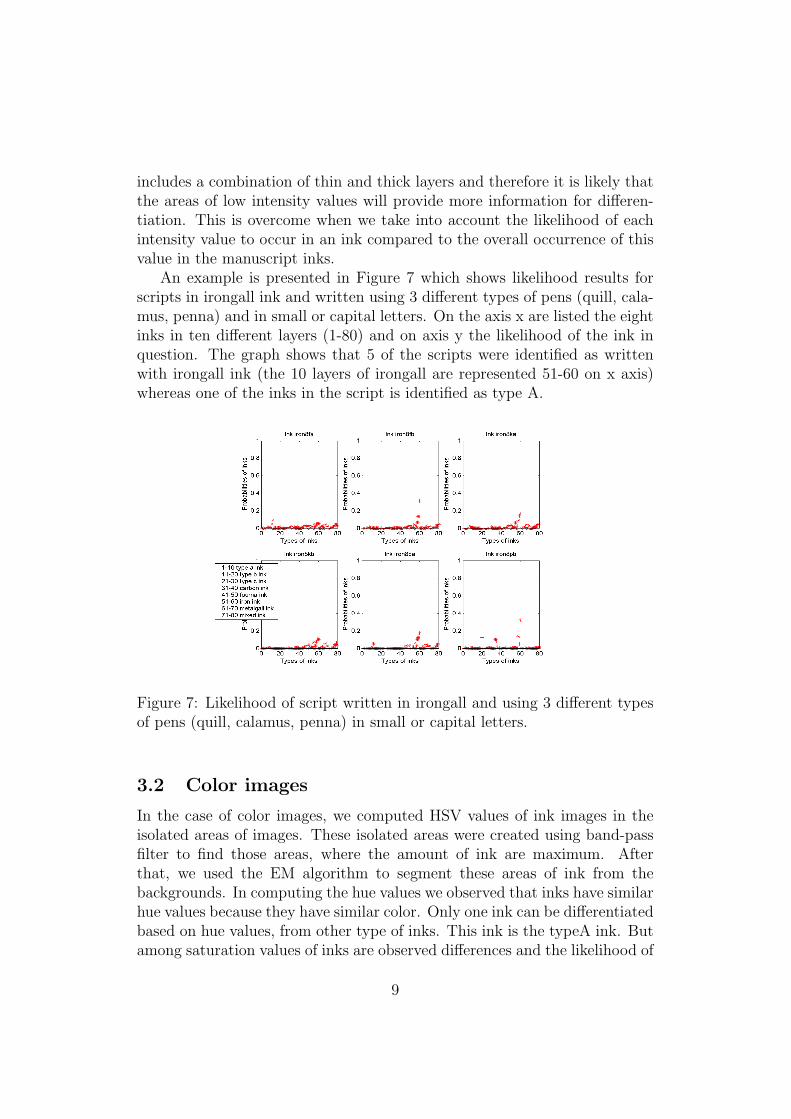
includes a combination of thin and thick layers and therefore it is likely thatthe areas of low intensity values will provide more information for differen-tiation. This is overcome when we take into account the likelihood of eachintensity value to occur in an ink compared to the overall occurrence of thisvalue in the manuscript inks.
An example is presented in Figure 7 which shows likelihood results forscripts in irongall ink and written using 3 different types of pens (quill, cala-mus, penna) and in small or capital letters. On the axis x are listed the eightinks in ten different layers (1-80) and on axis y the likelihood of the ink inquestion. The graph shows that 5 of the scripts were identified as writtenwith irongall ink (the 10 layers of irongall are represented 51-60 on x axis)whereas one of the inks in the script is identified as type A.
Figure 7: Likelihood of script written in irongall and using 3 different typesof pens (quill, calamus, penna) in small or capital letters.
3.2 Color images
In the case of color images, we computed HSV values of ink images in theisolated areas of images. These isolated areas were created using band-passfilter to find those areas, where the amount of ink are maximum. Afterthat, we used the EM algorithm to segment these areas of ink from thebackgrounds. In computing the hue values we observed that inks have similarhue values because they have similar color. Only one ink can be differentiatedbased on hue values, from other type of inks. This ink is the typeA ink. Butamong saturation values of inks are observed differences and the likelihood of
9
each ink based on saturation values can be calculated using Bayes’ decisionrule.
0 20 40 600
20
40
60
80Mean of hue of inks
Inks
Hue
0 20 40 6040
50
60
70
80
90
100Mean of saturation of inks
Inks
Sat
urat
ion
0 20 40 600
10
20
30
40
50
Inks
Hue
Standard deviation of hue of inks
0 20 40 600
5
10
15
20
25
Inks
Sat
urat
ion
Standard deviation of saturation of inks
carbon inkmetalgall inkfourna inkiron inkmixed inktype a inktype b inktype c ink
Figure 8: The mean and standard deviation values for Hue and Saturationmeasurements for the inks.
3.2.1 Saturation values of inks
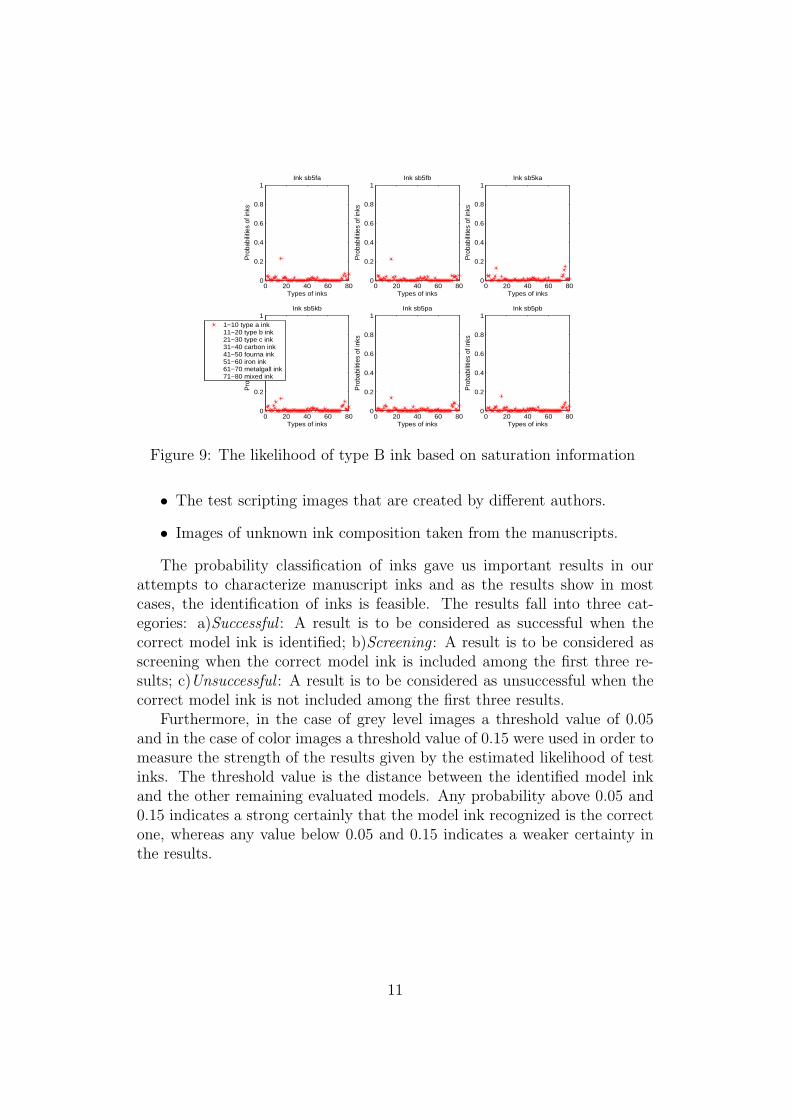
By studying the saturation values of inks, it is possible to confirm that itcan be used as discriminatory factor between various types of inks. Anexample of the comparison between the model inks and one of the imagesthat contributed to the models is shown in Figure 9. The image is a scriptwritten with ink type B using 3 different pens and small and capital letters.Each graph represents the likelihood of the ink used in the script comparedto the model inks. On the axis x are listed the eight inks in ten differentlayers and on axis y the probabilities of ink in question. The graph showsthat the ink is correctly identified as type B (11-20).
3.3 Inks comparison
In order to verify the validity of the approach the probability classificationof the ink model is compared with:
• Each of the images that contribute to the creation of the models. Thecomputation of the model of each ink includes 6 images(3 pens x 2letter cases).
10
0 20 40 60 800
0.2
0.4
0.6
0.8
1Ink sb5fa
Types of inks
Pro
babi
litie
s of
inks
0 20 40 60 800
0.2
0.4
0.6
0.8
1Ink sb5fb
Types of inks
Pro
babi
litie
s of
inks
0 20 40 60 800
0.2
0.4
0.6
0.8
1Ink sb5ka
Types of inks
Pro
babi
litie
s of
inks
0 20 40 60 800
0.2
0.4
0.6
0.8
1Ink sb5kb
Types of inks
Pro
babi
litie
s of
inks
0 20 40 60 800
0.2
0.4
0.6
0.8
1Ink sb5pa
Types of inks
Pro
babi
litie
s of
inks
0 20 40 60 800
0.2
0.4
0.6
0.8
1Ink sb5pb
Types of inks
Pro
babi
litie
s of
inks
1−10 type a ink11−20 type b ink21−30 type c ink31−40 carbon ink41−50 fourna ink51−60 iron ink61−70 metalgall ink71−80 mixed ink
Figure 9: The likelihood of type B ink based on saturation information
• The test scripting images that are created by different authors.
• Images of unknown ink composition taken from the manuscripts.
The probability classification of inks gave us important results in ourattempts to characterize manuscript inks and as the results show in mostcases, the identification of inks is feasible. The results fall into three cat-egories: a)Successful : A result is to be considered as successful when thecorrect model ink is identified; b)Screening : A result is to be considered asscreening when the correct model ink is included among the first three re-sults; c)Unsuccessful : A result is to be considered as unsuccessful when thecorrect model ink is not included among the first three results.
Furthermore, in the case of grey level images a threshold value of 0.05and in the case of color images a threshold value of 0.15 were used in order tomeasure the strength of the results given by the estimated likelihood of testinks. The threshold value is the distance between the identified model inkand the other remaining evaluated models. Any probability above 0.05 and0.15 indicates a strong certainly that the model ink recognized is the correctone, whereas any value below 0.05 and 0.15 indicates a weaker certainty inthe results.
11
4 RESULTS
4.1 Model images
4.1.1 Grey-level images
Figure 10: Estimated likelihood based on intensity values.
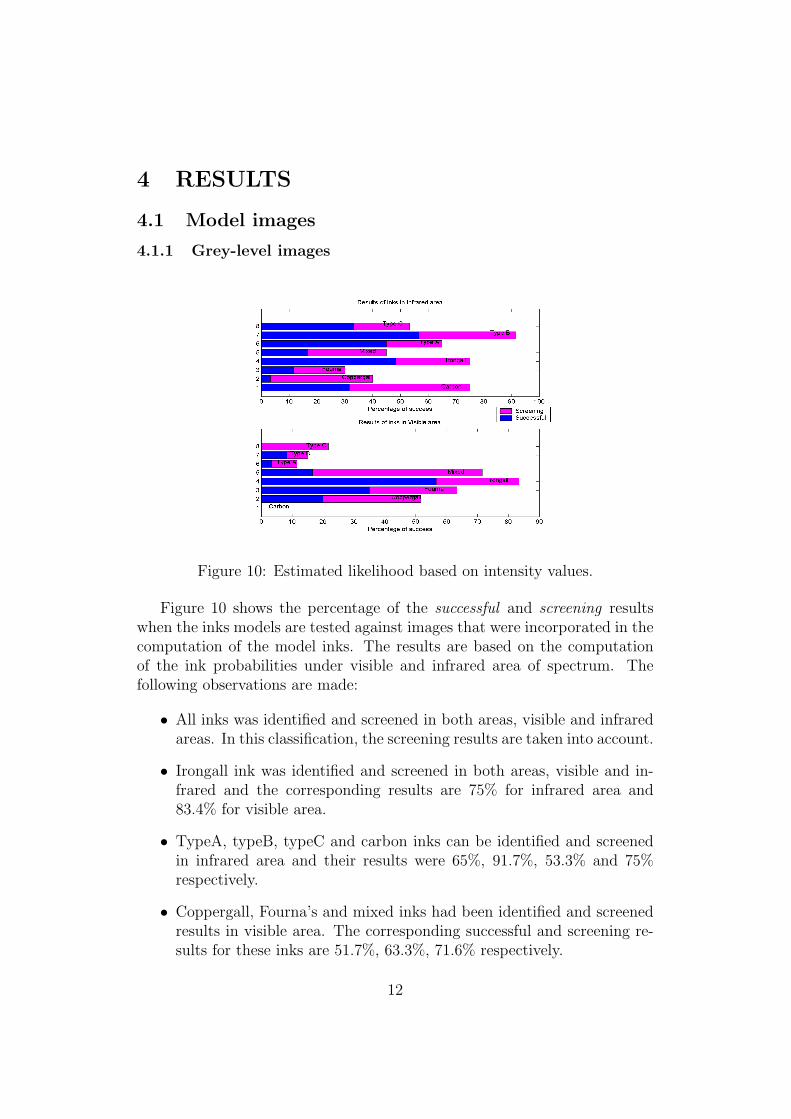
Figure 10 shows the percentage of the successful and screening resultswhen the inks models are tested against images that were incorporated in thecomputation of the model inks. The results are based on the computationof the ink probabilities under visible and infrared area of spectrum. Thefollowing observations are made:
• All inks was identified and screened in both areas, visible and infraredareas. In this classification, the screening results are taken into account.
• Irongall ink was identified and screened in both areas, visible and in-frared and the corresponding results are 75% for infrared area and83.4% for visible area.
• TypeA, typeB, typeC and carbon inks can be identified and screenedin infrared area and their results were 65%, 91.7%, 53.3% and 75%respectively.
• Coppergall, Fourna’s and mixed inks had been identified and screenedresults in visible area. The corresponding successful and screening re-sults for these inks are 51.7%, 63.3%, 71.6% respectively.
12
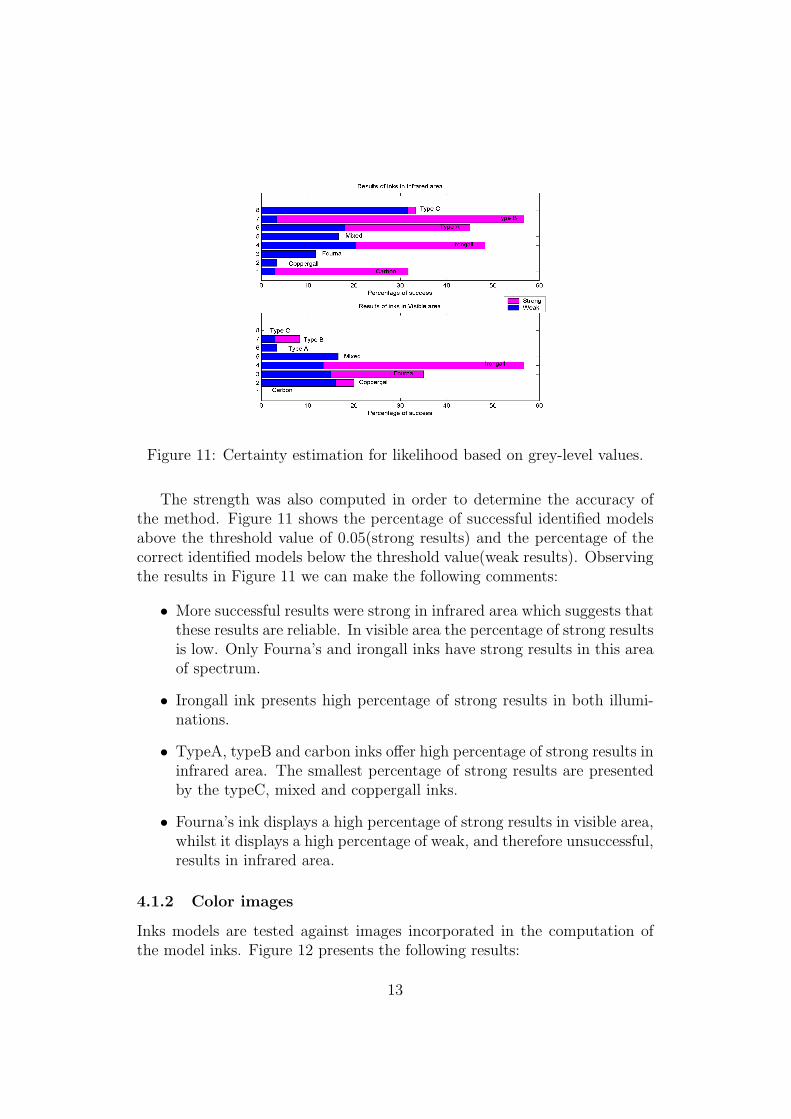
Figure 11: Certainty estimation for likelihood based on grey-level values.
The strength was also computed in order to determine the accuracy ofthe method. Figure 11 shows the percentage of successful identified modelsabove the threshold value of 0.05(strong results) and the percentage of thecorrect identified models below the threshold value(weak results). Observingthe results in Figure 11 we can make the following comments:
• More successful results were strong in infrared area which suggests thatthese results are reliable. In visible area the percentage of strong resultsis low. Only Fourna’s and irongall inks have strong results in this areaof spectrum.
• Irongall ink presents high percentage of strong results in both illumi-nations.
• TypeA, typeB and carbon inks offer high percentage of strong results ininfrared area. The smallest percentage of strong results are presentedby the typeC, mixed and coppergall inks.
• Fourna’s ink displays a high percentage of strong results in visible area,whilst it displays a high percentage of weak, and therefore unsuccessful,results in infrared area.
4.1.2 Color images
Inks models are tested against images incorporated in the computation ofthe model inks. Figure 12 presents the following results:
13
0 10 20 30 40 50 60 70 80 90 100
1
2
3
4
5
6
7
8
Carbon
Coppergall
Fourna
Irongall
Mixed
Type A
Type B
Type C
Percentage of success
Results of saturation values of inks
ScreeningSuccessful
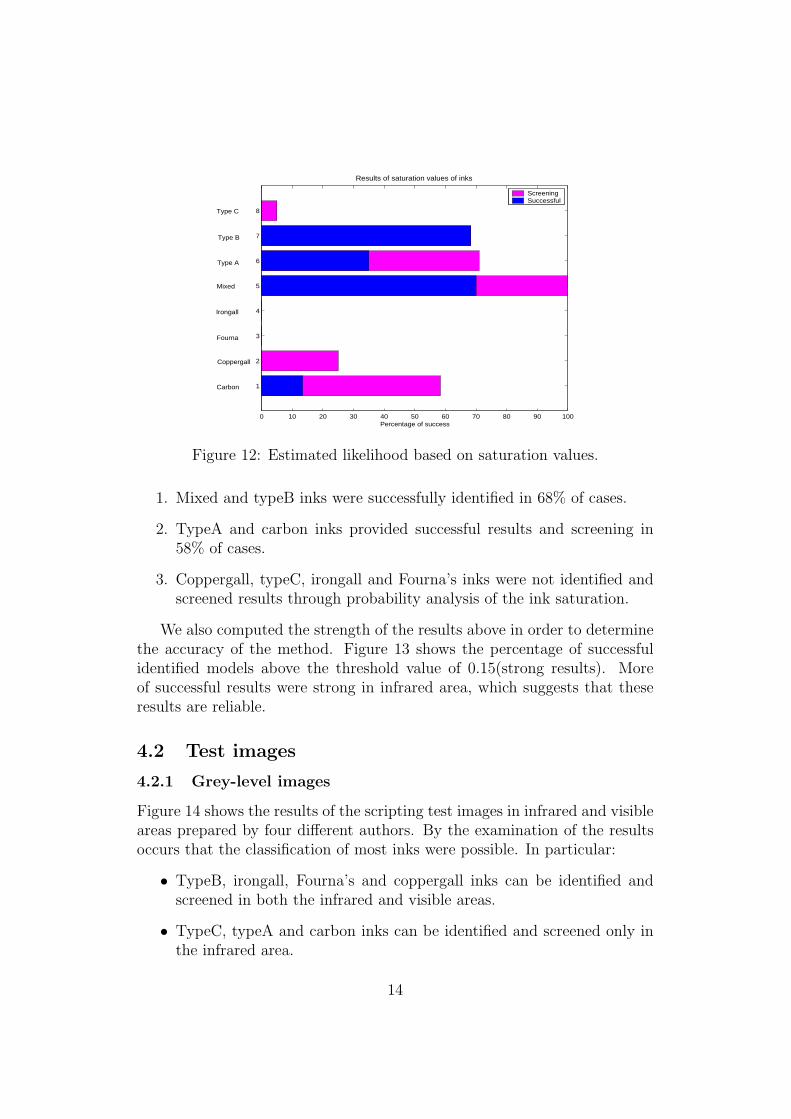
Figure 12: Estimated likelihood based on saturation values.
1. Mixed and typeB inks were successfully identified in 68% of cases.
2. TypeA and carbon inks provided successful results and screening in58% of cases.
3. Coppergall, typeC, irongall and Fourna’s inks were not identified andscreened results through probability analysis of the ink saturation.
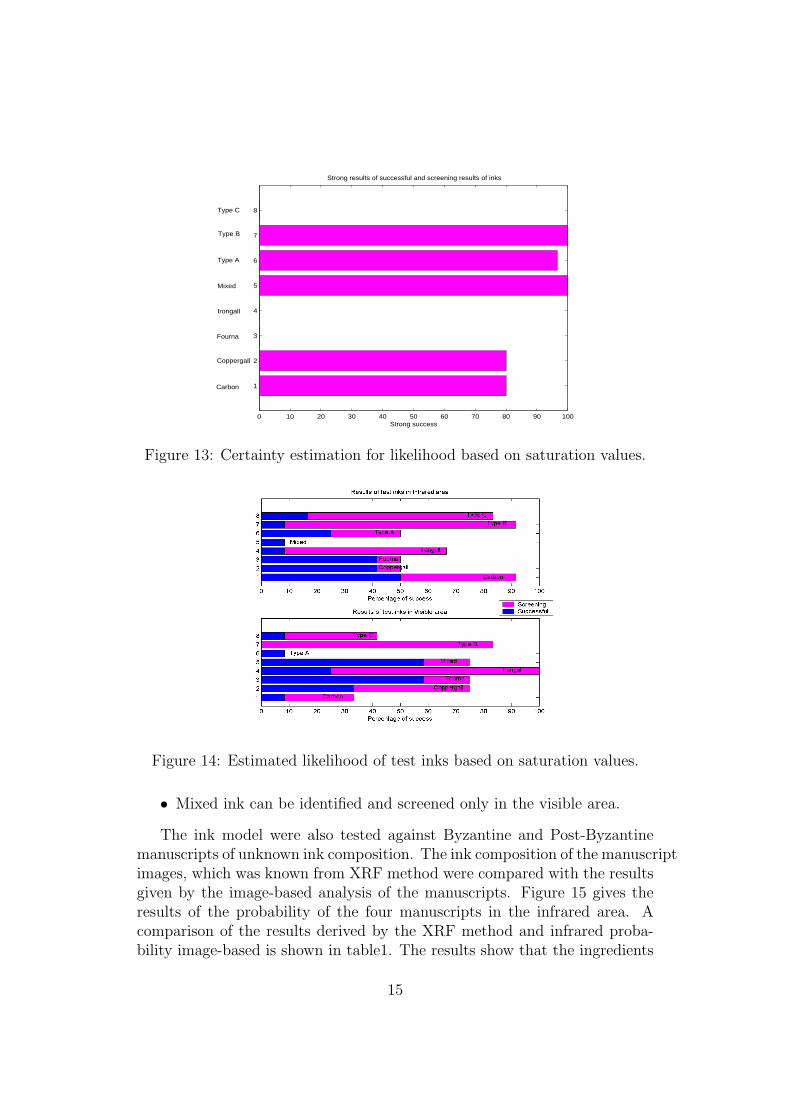
We also computed the strength of the results above in order to determinethe accuracy of the method. Figure 13 shows the percentage of successfulidentified models above the threshold value of 0.15(strong results). Moreof successful results were strong in infrared area, which suggests that theseresults are reliable.
4.2 Test images
4.2.1 Grey-level images
Figure 14 shows the results of the scripting test images in infrared and visibleareas prepared by four different authors. By the examination of the resultsoccurs that the classification of most inks were possible. In particular:
• TypeB, irongall, Fourna’s and coppergall inks can be identified andscreened in both the infrared and visible areas.
• TypeC, typeA and carbon inks can be identified and screened only inthe infrared area.
14
0 10 20 30 40 50 60 70 80 90 100
1
2
3
4
5
6
7
8
Carbon
Coppergall
Fourna
Irongall
Mixed
Type A
Type B
Type C
Strong success
Strong results of successful and screening results of inks
Figure 13: Certainty estimation for likelihood based on saturation values.
Figure 14: Estimated likelihood of test inks based on saturation values.
• Mixed ink can be identified and screened only in the visible area.
The ink model were also tested against Byzantine and Post-Byzantinemanuscripts of unknown ink composition. The ink composition of the manuscriptimages, which was known from XRF method were compared with the resultsgiven by the image-based analysis of the manuscripts. Figure 15 gives theresults of the probability of the four manuscripts in the infrared area. Acomparison of the results derived by the XRF method and infrared proba-bility image-based is shown in table1. The results show that the ingredients
15
Manuscripts XRF image-basedMemosa Fe TypeAMemosaa Fe TypeAMemosb Fe and Cu Carbon, TypeC, CoppergallMemosc Fe and Cu TypeC and TypeB
Table 1: Comparison between XRF and image-based results on the manuscripts.
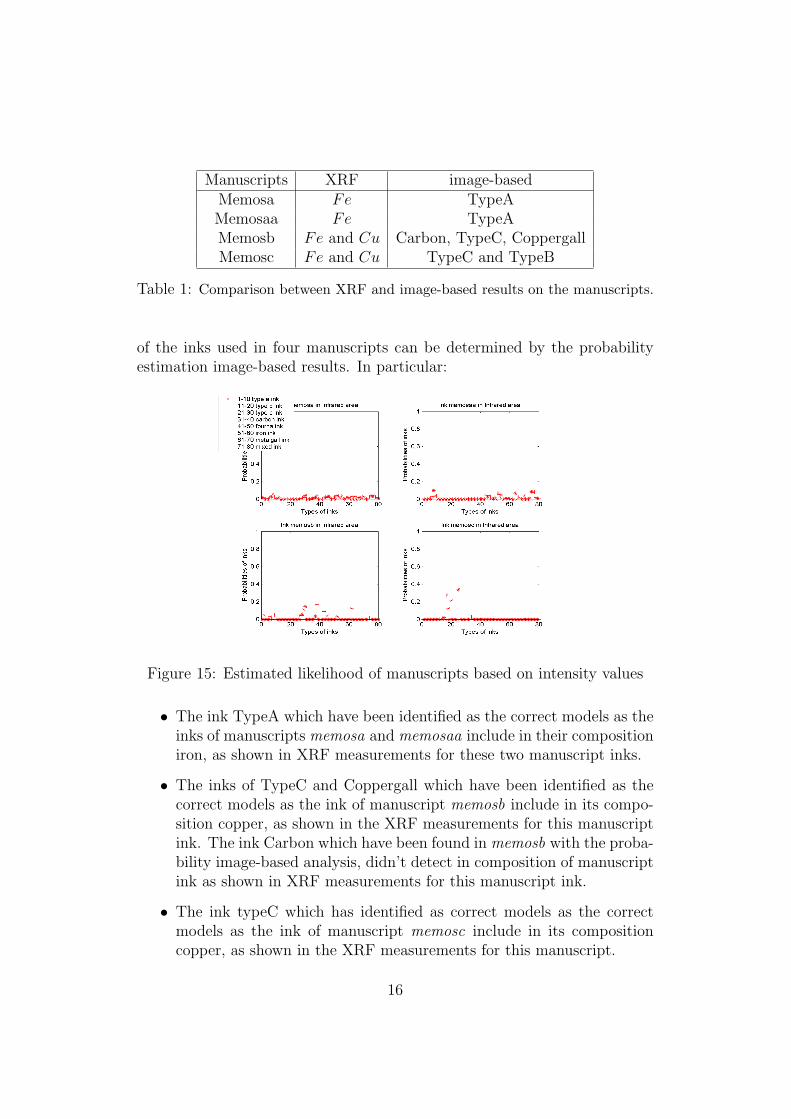
of the inks used in four manuscripts can be determined by the probabilityestimation image-based results. In particular:
Figure 15: Estimated likelihood of manuscripts based on intensity values
• The ink TypeA which have been identified as the correct models as theinks of manuscripts memosa and memosaa include in their compositioniron, as shown in XRF measurements for these two manuscript inks.
• The inks of TypeC and Coppergall which have been identified as thecorrect models as the ink of manuscript memosb include in its compo-sition copper, as shown in the XRF measurements for this manuscriptink. The ink Carbon which have been found in memosb with the proba-bility image-based analysis, didn’t detect in composition of manuscriptink as shown in XRF measurements for this manuscript ink.
• The ink typeC which has identified as correct models as the correctmodels as the ink of manuscript memosc include in its compositioncopper, as shown in the XRF measurements for this manuscript.
16
4.2.2 Color images
0 10 20 30 40 50 60 70 80 90 100
1
2
3
4
5
6
7
8
Carbon
Coppergall
Fourna
Irongall
Mixed
Type A
Type B
Type C
Percentage of success
Results of saturation values of standinks
ScreeningSuccessful
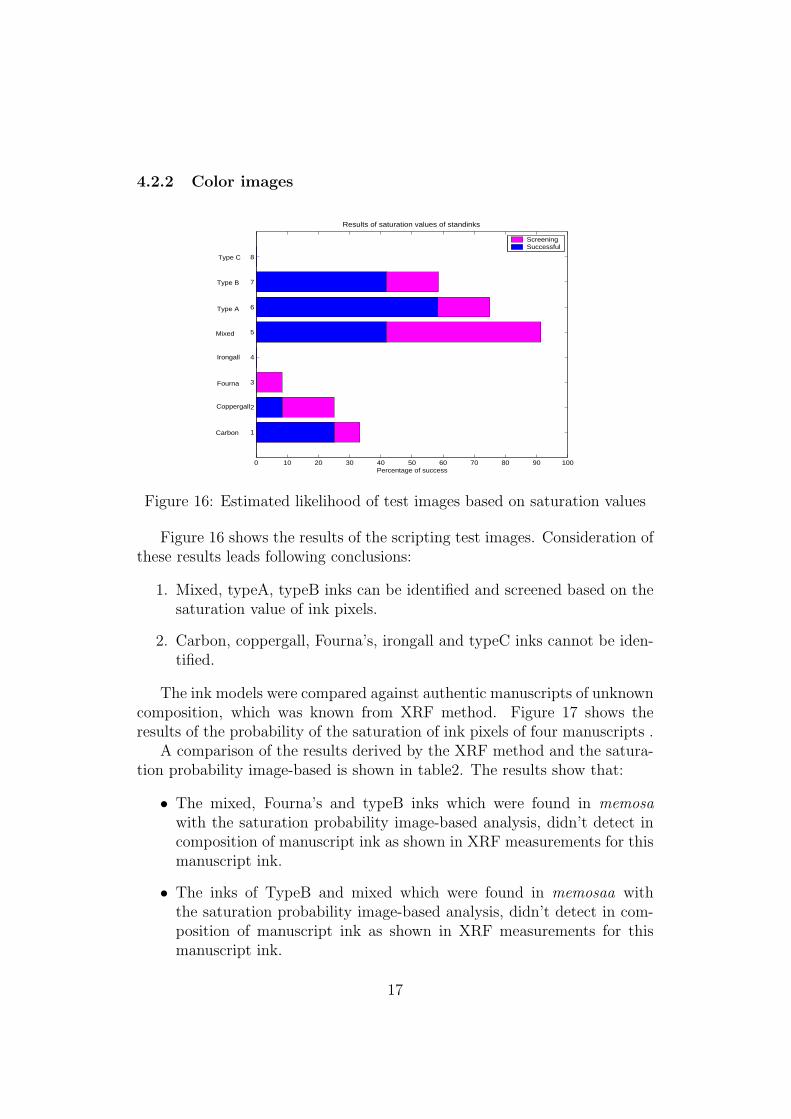
Figure 16: Estimated likelihood of test images based on saturation values
Figure 16 shows the results of the scripting test images. Consideration ofthese results leads following conclusions:
1. Mixed, typeA, typeB inks can be identified and screened based on thesaturation value of ink pixels.
2. Carbon, coppergall, Fourna’s, irongall and typeC inks cannot be iden-tified.
The ink models were compared against authentic manuscripts of unknowncomposition, which was known from XRF method. Figure 17 shows theresults of the probability of the saturation of ink pixels of four manuscripts .
A comparison of the results derived by the XRF method and the satura-tion probability image-based is shown in table2. The results show that:
• The mixed, Fourna’s and typeB inks which were found in memosawith the saturation probability image-based analysis, didn’t detect incomposition of manuscript ink as shown in XRF measurements for thismanuscript ink.
• The inks of TypeB and mixed which were found in memosaa withthe saturation probability image-based analysis, didn’t detect in com-position of manuscript ink as shown in XRF measurements for thismanuscript ink.
17
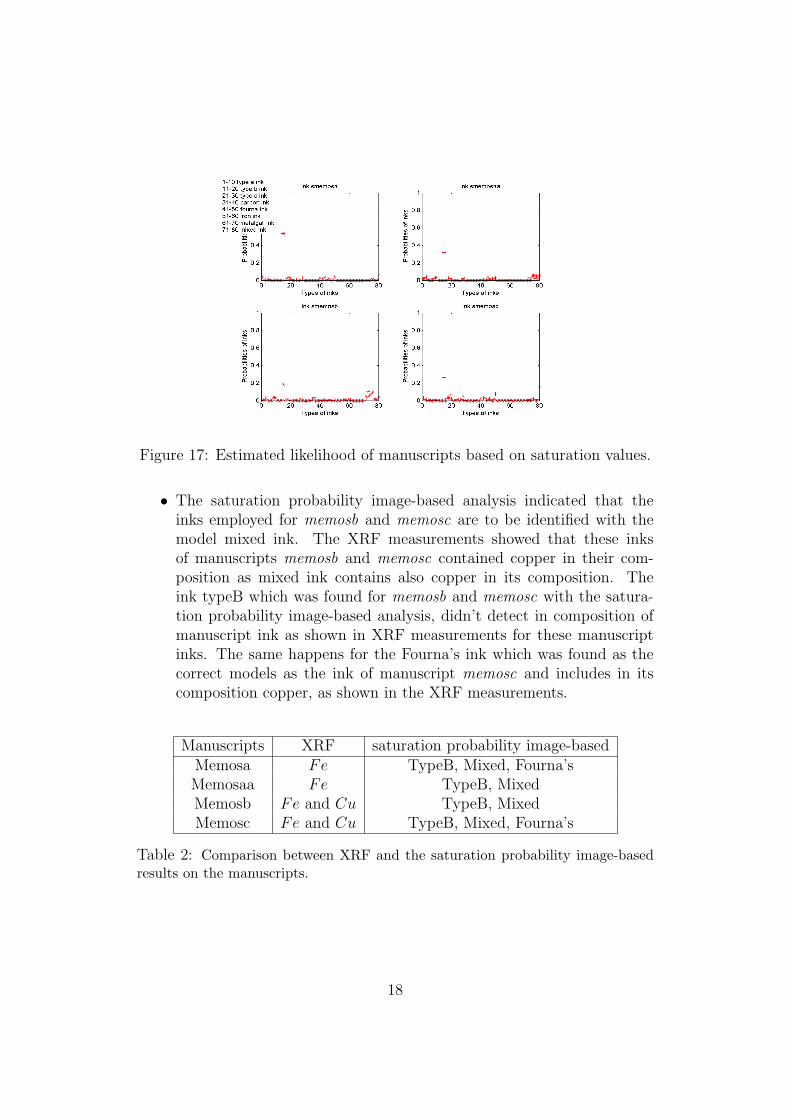
Figure 17: Estimated likelihood of manuscripts based on saturation values.
• The saturation probability image-based analysis indicated that theinks employed for memosb and memosc are to be identified with themodel mixed ink. The XRF measurements showed that these inksof manuscripts memosb and memosc contained copper in their com-position as mixed ink contains also copper in its composition. Theink typeB which was found for memosb and memosc with the satura-tion probability image-based analysis, didn’t detect in composition ofmanuscript ink as shown in XRF measurements for these manuscriptinks. The same happens for the Fourna’s ink which was found as thecorrect models as the ink of manuscript memosc and includes in itscomposition copper, as shown in the XRF measurements.
Manuscripts XRF saturation probability image-basedMemosa Fe TypeB, Mixed, Fourna’sMemosaa Fe TypeB, MixedMemosb Fe and Cu TypeB, MixedMemosc Fe and Cu TypeB, Mixed, Fourna’s
Table 2: Comparison between XRF and the saturation probability image-basedresults on the manuscripts.
18
5 CONCLUSIONS - FUTURE WORKS
The methodology of this study is based on the probability classification of inkpixels through mixture Gaussian models of diverse types of inks. Analysisin the visible areas mainly reflect the ink intensity whereas analysis in theinfrared area reflects the ink composition. Analysis of color images reflectsalso the color characteristics of various types of inks. Models of the inks arecreated based on mixture Gaussian functions and we have taken into accountscripting with different pens, authors and the thickness of the inks.
Based on the results presented we can conclude that statistical analy-sis and classification based on Bayes’ decision rule classification can providereliable information towards the discrimination of manuscript inks when in-tensity values are used. Results are not that clear when saturation valuesare used. Whilst the probability classification identified or screened all inksin this study, further work is currently undertaken to combine these resultswith additional characteristics of the behavior of the inks during the scriptingprocess
6 Acknowledgments
We would like to thank the Greek State Scholarships Foundation (IKY) forits support towards the results of this work.
References
[1] Alexopoulou A. ,Kokla V. Physicochemical study of inks of manuscriptsusing ultraviolet and near infrared radiation. 6th International Confer-ence on Non-Destructive Testing and Microanalysis for the Diagnosticsand Conservation of the Cultural and Environmental Heritage, 1999,vol. 2, pp. 2047-2056.
[2] Barrow W.J. Manuscripts and Documents. University Press of Virginia,edition 2nd, 1972.
[3] Clark M. Anglo-Saxon manuscript pigments. Studies in Conserva-tion,Vol. 49, no 4, 2004, pp. 231-244.
[4] Delaney J.K., Metzger C., Walmsley E. Examination of the Visibilityof Underdrawing Lines as a Function of Wavelength. ICOM Committeefor Conservation, 10th Triennial Meeting, Washington, 1993, pp. 15-19.
19
[5] De Pas M. Etat des travaux effectues sur l’ analyse des consitituesdes encres noires manuscripts par deux technique: chromatographie surcouche mince et electrophorese. Comite pour la conservation de l’ ICOM,1975.
[6] Derrick R. Michele, Stulik Dusan, Landry M. James. Infrared Spec-troscopy in Conservation Science. The Getty Conservation Institute,Los Angeles, 1999.
[7] Emmel P., Hersch R. D. Spectral Color Prediction Model for a Transpar-ent Fluorescent Ink on Paper. IS&T/SID 6th Color Imaging Conference:Color Science, Systems and Applications, USA, 1998, pp. 116-122.
[8] Fletcher S. A Preliminary Study of the Use of Infrared Reflectographyin the Examination of Works of Art on Paper. ICOM Committee forConservation, 7th Triennial Meeting Preprints, Copenhagen, (1984), 84,14, pp.24-27.
[9] Flieder F., Barroso R., Orvezabal C. Analysis des tannins hydrolysablesusceptibles d’ entrer dans la composition des encres ferro-geliques. 1975.
[10] Fossier L. and Irigoin J. Dechiffrer les ecritures effacees. Centre Nationalde la Research Scientifique, Paris, 1990.
[11] Fuchs R. and Oltrogge D. Modern scientific manuscript research andconservation. in Fellows-Jensen G. and Springborg P., eds, Care andconservation of manuscripts 3: Proccedings of third international semi-nar on the care and conservation of manuscripts held at the University ofCopenhagen 14th-15th October 1996, The Royal Library, Copenhagen,1997, pp. 77-98.
[12] Gevers, T. and Smeulders, A. A comparative study of several color mod-els for color image invariant retrieval. Proc of First Int. Workshop onImage Databases and Multimedia Search, pp 17-27, Amsterdam, Au-gust, 1996.
[13] Granado I. Automatic feature extraction on pages of antique booksthrough a mathematical morphology based methodology. Actas de10EPCG-10 Encontro Portugues de Computacao Grafica, Lisboa, Por-tugal, 2001, pp. 115-122.
[14] Hanbury A., Kammerer P., Zolda E. Painting Crack Elimination Us-ing Viscous Morphological Reconstruction. 12th International Confer-ence on Image Analysis and Processing(ICIAP’03), (2003), Mantova,Italy p.226.
20
[15] Janssens, K. Use of Micropscopic XRF for Non-destructive Analysis inArt and Archaeometry. X-Ray Spectrometry 29, 73-91, 2000.
[16] Kossolapov A.J. An Improved Vidicon TV Camera of IR-Reflectography.ICOM Committee for Conservation 10th Triennial meeting, Interna-tional Council of Museums, Washington, 1993, pp. 25-31.
[17] Niblack, W., Barber, R., Equitz, W., Flickner M., Glassman, E.,Petkovic D. and Yanker, P. The QBIC project: Querying images by con-tent using color, texture and shape. In SPIE 1908, Storage and Retrievalfor Image and Video Databases, February, 1993.
[18] Pappas M., and Pitas I. Old painting digital color restoration. in Proc.Of Noblesse Workshop on non-linear model based image analysis”, p.188-192, Glasgow, July, 1998.
[19] Pappas M., and Pitas I. Digital Color Restoration of Old Painting. IEEETransactions on image processing, Vol. 9, No. 2, 2000.
[20] Rossi M., Casali F., Casadei G., Zuelli S. Image Reconstruction of Paint-ing Radiographs. 6th International Conference on Non-Destructive Test-ing and Microanalysis for the Diagnostics and Conservation of the Cul-tural and Environmental Heritage, Ministry of Cultural Heritage andActivity Central Institute for Restoration (I.C.R.) and Italian Societyfor Non-Destructive Testing Monitoring Diagnostics (AIPnD), Rome,(1999), 1077-1086.
[21] Smith, J.R. and Chang, S.F. VisualSEEk: A fully automated content-based image query system. ACM Multimedia. Bonston, MA, November1996.
[22] Walmsley E., Flecher C., and Delaney J. Evaluation of System Perfor-mance of Near-Infrared Imaging Devices. Studies in Conservation 37,1991, pp. 120-31.
[23] Walmsley E.,Metzger C., Flecher C. et al. Evaluation of Platinum Sili-cide Cameras for Use in Infrared Reflectography. ICOM Committee forConservation 10th Triennial meeting, International Council of Museums,Washington, 1993, pp. 57-62.
[24] Xiangyang L., Dongming L., Yunhe P. Color Restoration and Im-age Retrieval Techniques for Dunhuang Fresco Preservation. IEEEMultimedia,April-June, 2000, pp. 38-41.
21

[25] Zerdoun Bat-Yeouda M. Les encres noires au moyen ages(jusqu’ a 1600).edition du CNRS, 1983.
22
Related Documents