INITIATING COVERAGE BOB Capital Markets Ltd is a wholly owned subsidiary of Bank of Baroda Important disclosures, including any required research certifications, are provided at the end of this report. BUY TP: Rs 1,137 47% SBI CARD | NBFC | 06 June 2022 A play on India’s cashless revolution – initiate with BUY ▪ Major player in credit card domain with vast growth potential due to partnership with parent SBIN and customised offerings Mohit Mangal [email protected] Ticker/Price SBICARD IN/Rs 773 Market cap US$ 9.5bn Free float 30% 3M ADV US$ 24.8mn 52wk high/low Rs 1,165/Rs 711 Promoter/FPI/DII 70%/10%/21% Source: NSE | Price as of 3 Jun 2022 Key financials Y/E 31 Mar FY22P FY23E FY24E Net interest income (Rs mn) 38,387 47,999 61,277 NII growth (%) (1.7) 25.0 27.7 Adj. net profit (Rs mn) 16,161 23,064 30,012 EPS (Rs) 17.0 24.3 31.6 Consensus EPS (Rs) 17.0 24.3 31.4 P/E (x) 45.4 31.9 24.5 P/BV (x) 9.5 7.5 5.9 ROA (%) 5.2 6.0 6.4 ROE (%) 23.0 26.2 26.9 Source: Company, Bloomberg, BOBCAPS Research | P – Provisional Stock performance Source: NSE ▪ Expect earnings to log a 32% CAGR over FY22-FY25, aiding +6% ROAA and +26% ROAE in the medium term ▪ Initiate with BUY given strong fundamentals, structural story and compelling valuations; TP at Rs 1,137 (36x FY24E P/E) Competitive advantage of SBIN partnership: SBI Card’s partnership with its parent State Bank of India gives it the benefits of SBIN’s vast network, cheaper customer acquisition cost, better asset-quality clients and strong cross-sell opportunities. The company’s strategy to expand into tier-2/3 cities should spur growth, with SBIN having the highest network reach among banks in these markets. Open market sourcing reinforces business model: SBI Card boasts a presence in ~3,500 open market points of sale, has 148 sourcing locations and 35,000+ sales agents. It also has co-branded partnerships with over 10 non-bank entities and 8 banks that use their own channels and networks for client origination. Return ratios healthy: Credit cards are a high-margin business and SBI Card earned average ROAA/ROAE of 4.6%/29% for FY16-FY20. Amid Covid, these ratios fell to 3.8%/16.9% in FY21 before rebounding to 5.2%/23% in FY22. We expect ROAA of 6%/6.4% and ROAE of 26.2%/26.9% in FY23/FY24 as the pandemic impact ebbs. NIM on path to recovery: SBI Card was consistently generating 15%+ NIMs but in FY22, NIM contracted to ~13% owing to a lower share of revolving accounts in the receivables mix. We believe that as economic activity revives, the share of interest- earning EMI and revolver accounts in the receivables mix will grow over the next 2-3 years, supporting better margins of ~14.5% by FY25. Asset quality improving: The company’s credit cost averaged 6% during FY16- FY19. This increased during the pandemic to 9.5%/11.4% in FY20/FY21, before ending lower at 8.4% in FY22. We expect credit cost to decline further to 7.7%/7.2%/ 7% for FY23/FY24/FY25. GNPA averaged 2.4% over FY17-FY20 and net NPA 0.8%. Although GNPA rose to 5.0% in FY21, it tapered to 2.2% in FY22. Initiate with BUY: SBI Card is trading at attractive valuations of 24x FY24E EPS. We value the stock at 36x FY24E P/E– this yields a TP of Rs 1,137, implying a potential upside of 47%. Our residual income model assumes COE of 11.8% and terminal growth rate of 5.5%. Initiate with BUY. 470 640 810 980 1,150 1,320 Mar-20 Jun-20 Sep-20 Dec-20 Mar-21 Jun-21 Sep-21 Dec-21 Mar-22 Jun-22 SBICARD NSE Nifty (Relative)

Welcome message from author
This document is posted to help you gain knowledge. Please leave a comment to let me know what you think about it! Share it to your friends and learn new things together.
Transcript
INITIATING COVERAGE
BOB Capital Markets Ltd is a wholly owned subsidiary of Bank of Baroda
Important disclosures, including any required research certifications, are provided at the end of this report.
BUY
TP: Rs 1,137 47% SBI CARD | NBFC | 06 June 2022
A play on India’s cashless revolution – initiate with BUY
▪ Major player in credit card domain with vast growth potential due to
partnership with parent SBIN and customised offerings
Mohit Mangal
Ticker/Price SBICARD IN/Rs 773
Market cap US$ 9.5bn
Free float 30%
3M ADV US$ 24.8mn
52wk high/low Rs 1,165/Rs 711
Promoter/FPI/DII 70%/10%/21%
Source: NSE | Price as of 3 Jun 2022
Key financials
Y/E 31 Mar FY22P FY23E FY24E
Net interest income (Rs mn) 38,387 47,999 61,277
NII growth (%) (1.7) 25.0 27.7
Adj. net profit (Rs mn) 16,161 23,064 30,012
EPS (Rs) 17.0 24.3 31.6
Consensus EPS (Rs) 17.0 24.3 31.4
P/E (x) 45.4 31.9 24.5
P/BV (x) 9.5 7.5 5.9
ROA (%) 5.2 6.0 6.4
ROE (%) 23.0 26.2 26.9
Source: Company, Bloomberg, BOBCAPS Research | P – Provisional
Stock performance
Source: NSE
▪ Expect earnings to log a 32% CAGR over FY22-FY25, aiding +6% ROAA
and +26% ROAE in the medium term
▪ Initiate with BUY given strong fundamentals, structural story and
compelling valuations; TP at Rs 1,137 (36x FY24E P/E)
Competitive advantage of SBIN partnership: SBI Card’s partnership with its
parent State Bank of India gives it the benefits of SBIN’s vast network, cheaper
customer acquisition cost, better asset-quality clients and strong cross-sell
opportunities. The company’s strategy to expand into tier-2/3 cities should spur
growth, with SBIN having the highest network reach among banks in these markets.
Open market sourcing reinforces business model: SBI Card boasts a presence
in ~3,500 open market points of sale, has 148 sourcing locations and 35,000+ sales
agents. It also has co-branded partnerships with over 10 non-bank entities and 8
banks that use their own channels and networks for client origination.
Return ratios healthy: Credit cards are a high-margin business and SBI Card
earned average ROAA/ROAE of 4.6%/29% for FY16-FY20. Amid Covid, these ratios
fell to 3.8%/16.9% in FY21 before rebounding to 5.2%/23% in FY22. We expect ROAA
of 6%/6.4% and ROAE of 26.2%/26.9% in FY23/FY24 as the pandemic impact ebbs.
NIM on path to recovery: SBI Card was consistently generating 15%+ NIMs but in
FY22, NIM contracted to ~13% owing to a lower share of revolving accounts in the
receivables mix. We believe that as economic activity revives, the share of interest-
earning EMI and revolver accounts in the receivables mix will grow over the next 2-3
years, supporting better margins of ~14.5% by FY25.
Asset quality improving: The company’s credit cost averaged 6% during FY16-
FY19. This increased during the pandemic to 9.5%/11.4% in FY20/FY21, before
ending lower at 8.4% in FY22. We expect credit cost to decline further to 7.7%/7.2%/
7% for FY23/FY24/FY25. GNPA averaged 2.4% over FY17-FY20 and net NPA
0.8%. Although GNPA rose to 5.0% in FY21, it tapered to 2.2% in FY22.
Initiate with BUY: SBI Card is trading at attractive valuations of 24x FY24E EPS.
We value the stock at 36x FY24E P/E– this yields a TP of Rs 1,137, implying a
potential upside of 47%. Our residual income model assumes COE of 11.8% and
terminal growth rate of 5.5%. Initiate with BUY.
470
640
810
980
1,150
1,320
Mar
-20
Jun-
20
Sep
-20
Dec
-20
Mar
-21
Jun-
21
Sep
-21
Dec
-21
Mar
-22
Jun-
22
SBICARD NSE Nifty (Relative)
SBI CARD
EQUITY RESEARCH 2 06 June 2022
Contents
SBI Card – Unfolding the story ....................................................................... 3
Investment rationale ......................................................................................... 5
Strong parentage with sizeable opportunity to upscale .............................................. 5
Open market sourcing – a robust model .................................................................... 6
Digital sourcing opens up new growth avenue ........................................................... 7
Wide-ranging product suite......................................................................................... 8
Focus on lower-risk salaried category ........................................................................ 8
Retail dominates spends; premiumisation holds key ................................................ 10
NII growth trajectory healthy, NIM set to improve ..................................................... 10
Expect strong loan book growth through FY25......................................................... 12
Fee income growth on the rise ................................................................................. 12
#2 player in cards outstanding amid stiff competition ............................................... 13
Financial review .............................................................................................. 15
Expect 32% earnings CAGR over FY22-FY25 ......................................................... 15
Pandemic, macro climate temporarily depress return ratios ..................................... 15
Asset quality – credit cost expected to fall, GNPA reasonable ................................. 17
Well capitalised ........................................................................................................ 19
ALM positive in the short-to-medium term ................................................................ 19
Competitive analysis ...................................................................................... 20
Spends ..................................................................................................................... 20
Volumes ................................................................................................................... 20
Ticket size ................................................................................................................ 21
Buy now, pay later .................................................................................................... 21
Industry review ............................................................................................... 23
Credit card spends at ~Rs 10tn; card o/s at 74mn ................................................... 23
Digital payments gaining traction .............................................................................. 23
Key credit card industry trends ................................................................................. 24
Comparison with the US market ................................................................... 29
Scenario analyses .......................................................................................... 30
Capping interest rates .............................................................................................. 30
MDR reduction ......................................................................................................... 30
Valuation .......................................................................................................... 32
Key risks .......................................................................................................... 34
Company and Management ........................................................................... 36
Background .............................................................................................................. 36
Management ............................................................................................................ 37
Appendix ......................................................................................................... 38
ROAA ....................................................................................................................... 38
Digital payment options ............................................................................................ 38
Credit card co-branding ............................................................................................ 39
New RBI guidelines .................................................................................................. 39
Understanding the US market .................................................................................. 40
SBI CARD
EQUITY RESEARCH 3 06 June 2022
SBI Card – Unfolding the story
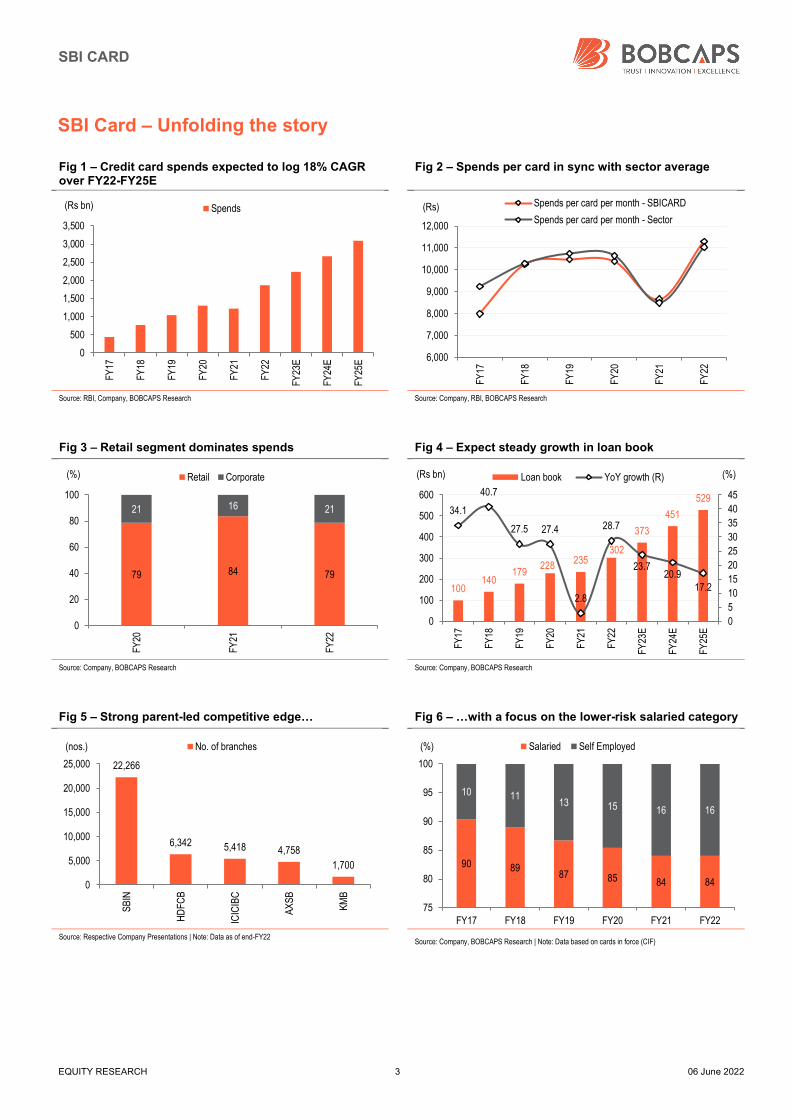
Fig 1 – Credit card spends expected to log 18% CAGR over FY22-FY25E
Fig 2 – Spends per card in sync with sector average
Source: RBI, Company, BOBCAPS Research Source: Company, RBI, BOBCAPS Research
Fig 3 – Retail segment dominates spends Fig 4 – Expect steady growth in loan book
Source: Company, BOBCAPS Research Source: Company, BOBCAPS Research
Fig 5 – Strong parent-led competitive edge… Fig 6 – …with a focus on the lower-risk salaried category
Source: Respective Company Presentations | Note: Data as of end-FY22 Source: Company, BOBCAPS Research | Note: Data based on cards in force (CIF)
0
500
1,000
1,500
2,000
2,500
3,000
3,500
FY17
FY18
FY19
FY20
FY21
FY22
FY23
E
FY24
E
FY25
E
(Rs bn) Spends
6,000
7,000
8,000
9,000
10,000
11,000
12,000
FY17
FY18
FY19
FY20
FY21
FY22
(Rs) Spends per card per month - SBICARD
Spends per card per month - Sector
79 84 79
21 16 21
0
20
40
60
80
100
FY20
FY21
FY22
(%) Retail Corporate
100140
179228
235302
373
451
52934.1
40.7
27.5 27.4
2.8
28.7
23.720.9
17.2
0
5
10
15
20
25
30
35
40
45
0
100
200
300
400
500
600
FY17
FY18
FY19
FY20
FY21
FY22
FY23
E
FY24
E
FY25
E
(%)(Rs bn) Loan book YoY growth (R)
22,266
6,342 5,418 4,758
1,700
0
5,000
10,000
15,000
20,000
25,000
SB
IN
HD
FCB
ICIC
IBC
AX
SB
KM
B
(nos.) No. of branches
90 8987 85 84 84
10 1113 15 16 16
75
80
85
90
95
100
FY17 FY18 FY19 FY20 FY21 FY22
(%) Salaried Self Employed
SBI CARD
EQUITY RESEARCH 4 06 June 2022
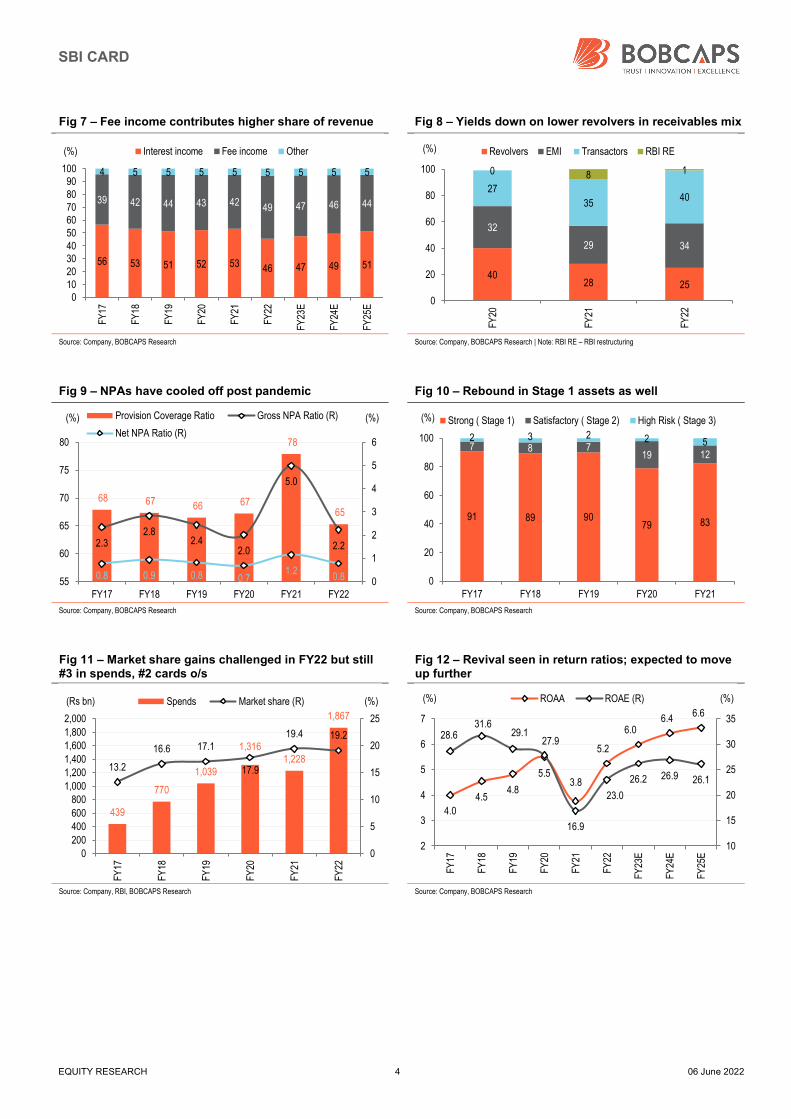
Fig 7 – Fee income contributes higher share of revenue Fig 8 – Yields down on lower revolvers in receivables mix
Source: Company, BOBCAPS Research Source: Company, BOBCAPS Research | Note: RBI RE – RBI restructuring
Fig 9 – NPAs have cooled off post pandemic Fig 10 – Rebound in Stage 1 assets as well
Source: Company, BOBCAPS Research Source: Company, BOBCAPS Research
Fig 11 – Market share gains challenged in FY22 but still #3 in spends, #2 cards o/s
Fig 12 – Revival seen in return ratios; expected to move up further
Source: Company, RBI, BOBCAPS Research Source: Company, BOBCAPS Research
56 53 51 52 53 46 47 49 51
39 42 44 43 4249 47 46 44
4 5 5 5 5 5 5 5 5
0102030405060708090
100
FY17
FY18
FY19
FY20
FY21
FY22
FY23
E
FY24
E
FY25
E
(%) Interest income Fee income Other
4028 25
32
29 34
27
3540
0 8 1
0
20
40
60
80
100
FY20
FY21
FY22
(%) Revolvers EMI Transactors RBI RE
68 67 66 67
78
65
2.32.8
2.42.0
5.0
2.2
0.8 0.9 0.8 0.71.2
0.8 0
1
2
3
4
5
6
55
60
65
70
75
80
FY17 FY18 FY19 FY20 FY21 FY22
(%)(%) Provision Coverage Ratio Gross NPA Ratio (R)
Net NPA Ratio (R)
91 89 9079 83
7 8 719 12
2 3 2 2 5
0
20
40
60
80
100
FY17 FY18 FY19 FY20 FY21
(%) Strong ( Stage 1) Satisfactory ( Stage 2) High Risk ( Stage 3)
439
770
1,039
1,3161,228
1,867
13.2
16.6 17.1
17.9
19.4 19.2
0
5
10
15
20
25
0
200
400
600
800
1,000
1,200
1,400
1,600
1,800
2,000
FY17
FY18
FY19
FY20
FY21
FY22
(%)(Rs bn) Spends Market share (R)
4.0
4.54.8
5.53.8
5.2
6.06.4
6.6
28.631.6
29.127.9
16.9
23.0
26.2 26.9 26.1
10
15
20
25
30
35
2
3
4
5
6
7
FY17
FY18
FY19
FY20
FY21
FY22
FY23
E
FY24
E
FY25
E(%)(%) ROAA ROAE (R)
SBI CARD
EQUITY RESEARCH 5 06 June 2022
Investment rationale
Strong parentage with sizeable opportunity to upscale
SBI Cards and Payment Services (SBI Card) has the competitive advantage of
partnering with its parent, State Bank of India (SBIN) – the country’s largest state-
owned bank. Under Project Shikhar initiated in Oct’17, the company has access to over
22,000 branches of SBIN and over 450mn customers, which provides immense
scalability potential. The customer acquisition cost of the bancassurance channel is also
lower than open market sourcing, apart from providing better quality clientele.
As much as 46.5% of new customer acquisitions came from the bancassurance
channel at end-FY22 vs. 35% in FY17. In terms of cards in force (CIF), the split
between SBIN and open sourcing was 43.2% and 56.8% respectively at end-FY22.
Apart from sourcing and cross-sell benefits, a strong parent can provide solid support in
the event of any distress.
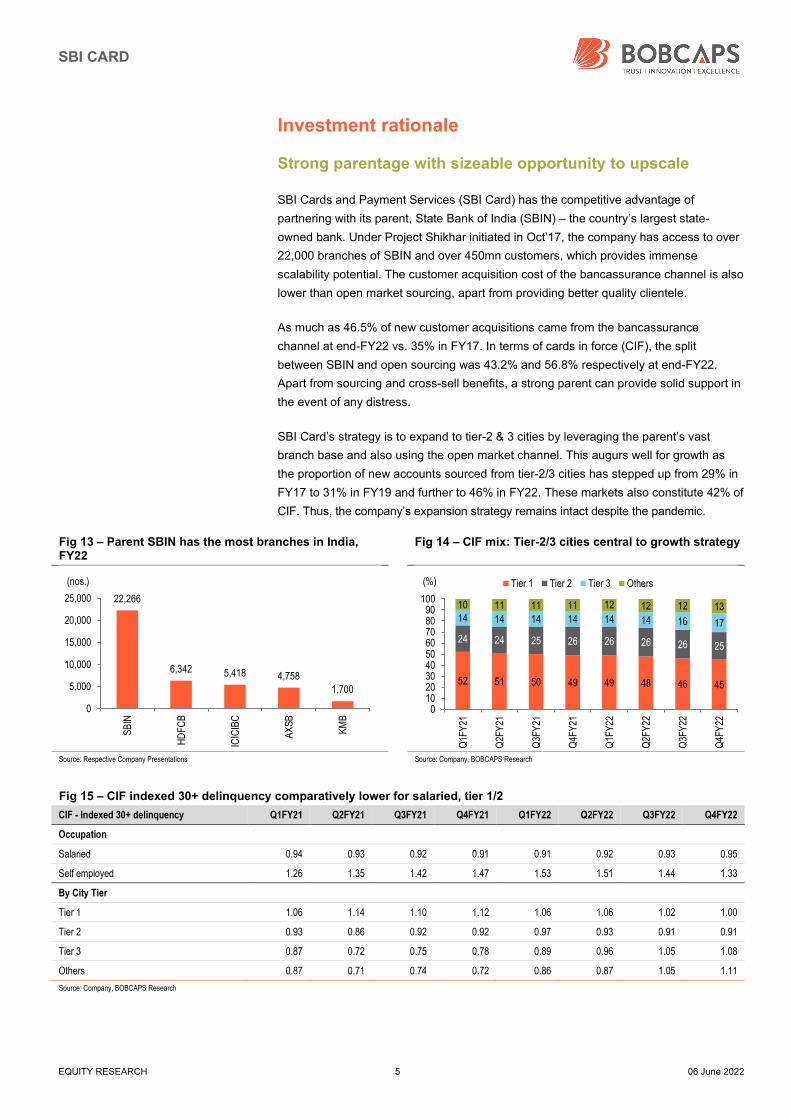
SBI Card’s strategy is to expand to tier-2 & 3 cities by leveraging the parent’s vast
branch base and also using the open market channel. This augurs well for growth as
the proportion of new accounts sourced from tier-2/3 cities has stepped up from 29% in
FY17 to 31% in FY19 and further to 46% in FY22. These markets also constitute 42% of
CIF. Thus, the company’s expansion strategy remains intact despite the pandemic.
Fig 13 – Parent SBIN has the most branches in India, FY22
Fig 14 – CIF mix: Tier-2/3 cities central to growth strategy
Source: Respective Company Presentations Source: Company, BOBCAPS Research
Fig 15 – CIF indexed 30+ delinquency comparatively lower for salaried, tier 1/2
CIF - Indexed 30+ delinquency Q1FY21 Q2FY21 Q3FY21 Q4FY21 Q1FY22 Q2FY22 Q3FY22 Q4FY22
Occupation
Salaried 0.94 0.93 0.92 0.91 0.91 0.92 0.93 0.95
Self employed 1.26 1.35 1.42 1.47 1.53 1.51 1.44 1.33
By City Tier
Tier 1 1.06 1.14 1.10 1.12 1.06 1.06 1.02 1.00
Tier 2 0.93 0.86 0.92 0.92 0.97 0.93 0.91 0.91
Tier 3 0.87 0.72 0.75 0.78 0.89 0.96 1.05 1.08
Others 0.87 0.71 0.74 0.72 0.86 0.87 1.05 1.11
Source: Company, BOBCAPS Research
22,266
6,342 5,418 4,758
1,700
0
5,000
10,000
15,000
20,000
25,000
SB
IN
HD
FCB
ICIC
IBC
AX
SB
KM
B
(nos.)
52 51 50 49 49 48 46 45
24 24 25 26 26 26 26 25
14 14 14 14 14 14 16 17
10 11 11 11 12 12 12 13
0102030405060708090
100
Q1F
Y21
Q2F
Y21
Q3F
Y21
Q4F
Y21
Q1F
Y22
Q2F
Y22
Q3F
Y22
Q4F
Y22
(%) Tier 1 Tier 2 Tier 3 Others
SBI CARD
EQUITY RESEARCH 6 06 June 2022
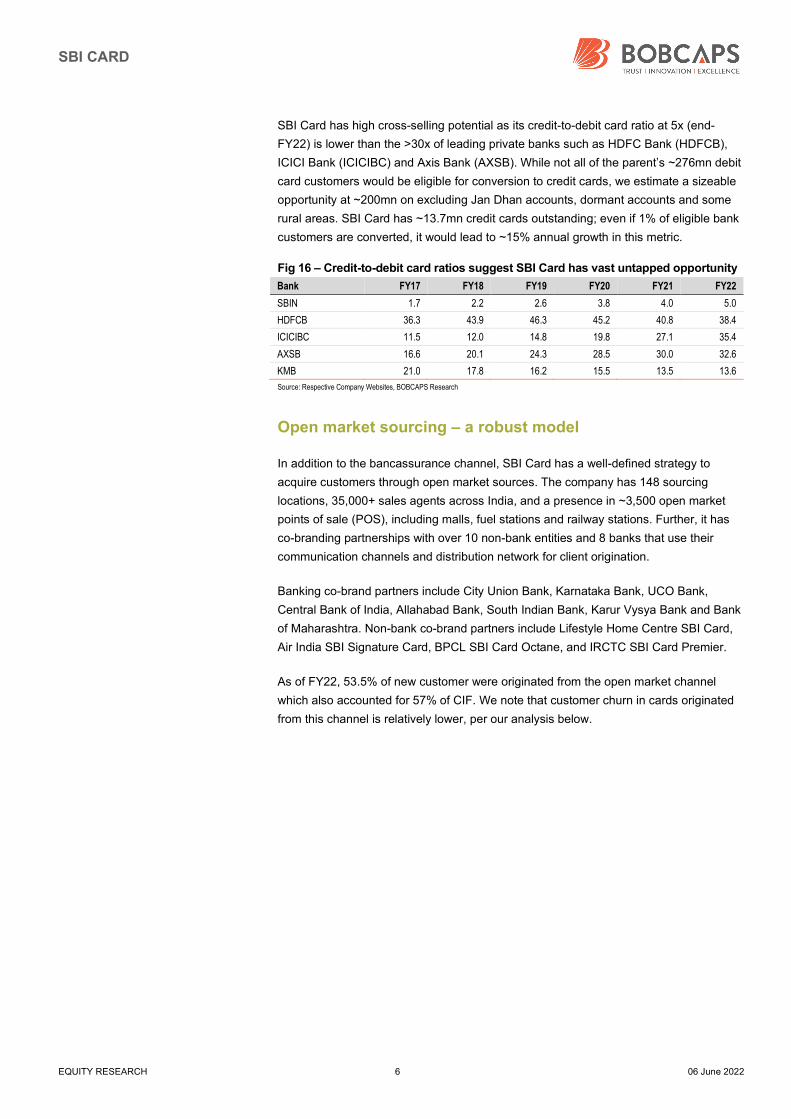
SBI Card has high cross-selling potential as its credit-to-debit card ratio at 5x (end-
FY22) is lower than the >30x of leading private banks such as HDFC Bank (HDFCB),
ICICI Bank (ICICIBC) and Axis Bank (AXSB). While not all of the parent’s ~276mn debit
card customers would be eligible for conversion to credit cards, we estimate a sizeable
opportunity at ~200mn on excluding Jan Dhan accounts, dormant accounts and some
rural areas. SBI Card has ~13.7mn credit cards outstanding; even if 1% of eligible bank
customers are converted, it would lead to ~15% annual growth in this metric.
Fig 16 – Credit-to-debit card ratios suggest SBI Card has vast untapped opportunity
Bank FY17 FY18 FY19 FY20 FY21 FY22
SBIN 1.7 2.2 2.6 3.8 4.0 5.0
HDFCB 36.3 43.9 46.3 45.2 40.8 38.4
ICICIBC 11.5 12.0 14.8 19.8 27.1 35.4
AXSB 16.6 20.1 24.3 28.5 30.0 32.6
KMB 21.0 17.8 16.2 15.5 13.5 13.6
Source: Respective Company Websites, BOBCAPS Research
Open market sourcing – a robust model
In addition to the bancassurance channel, SBI Card has a well-defined strategy to
acquire customers through open market sources. The company has 148 sourcing
locations, 35,000+ sales agents across India, and a presence in ~3,500 open market
points of sale (POS), including malls, fuel stations and railway stations. Further, it has
co-branding partnerships with over 10 non-bank entities and 8 banks that use their
communication channels and distribution network for client origination.
Banking co-brand partners include City Union Bank, Karnataka Bank, UCO Bank,
Central Bank of India, Allahabad Bank, South Indian Bank, Karur Vysya Bank and Bank
of Maharashtra. Non-bank co-brand partners include Lifestyle Home Centre SBI Card,
Air India SBI Signature Card, BPCL SBI Card Octane, and IRCTC SBI Card Premier.
As of FY22, 53.5% of new customer were originated from the open market channel
which also accounted for 57% of CIF. We note that customer churn in cards originated
from this channel is relatively lower, per our analysis below.
SBI CARD
EQUITY RESEARCH 7 06 June 2022
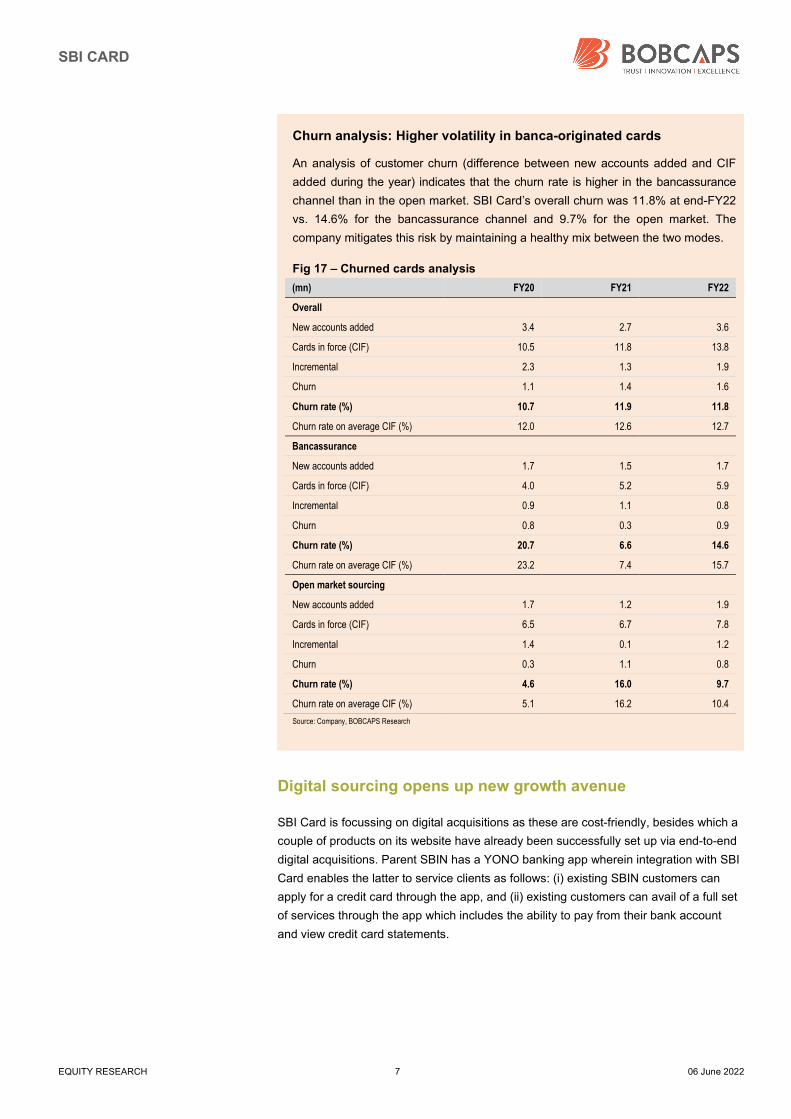
Churn analysis: Higher volatility in banca-originated cards
An analysis of customer churn (difference between new accounts added and CIF
added during the year) indicates that the churn rate is higher in the bancassurance
channel than in the open market. SBI Card’s overall churn was 11.8% at end-FY22
vs. 14.6% for the bancassurance channel and 9.7% for the open market. The
company mitigates this risk by maintaining a healthy mix between the two modes.
Fig 17 – Churned cards analysis
(mn) FY20 FY21 FY22
Overall
New accounts added 3.4 2.7 3.6
Cards in force (CIF) 10.5 11.8 13.8
Incremental 2.3 1.3 1.9
Churn 1.1 1.4 1.6
Churn rate (%) 10.7 11.9 11.8
Churn rate on average CIF (%) 12.0 12.6 12.7
Bancassurance
New accounts added 1.7 1.5 1.7
Cards in force (CIF) 4.0 5.2 5.9
Incremental 0.9 1.1 0.8
Churn 0.8 0.3 0.9
Churn rate (%) 20.7 6.6 14.6
Churn rate on average CIF (%) 23.2 7.4 15.7
Open market sourcing
New accounts added 1.7 1.2 1.9
Cards in force (CIF) 6.5 6.7 7.8
Incremental 1.4 0.1 1.2
Churn 0.3 1.1 0.8
Churn rate (%) 4.6 16.0 9.7
Churn rate on average CIF (%) 5.1 16.2 10.4
Source: Company, BOBCAPS Research
Digital sourcing opens up new growth avenue
SBI Card is focussing on digital acquisitions as these are cost-friendly, besides which a
couple of products on its website have already been successfully set up via end-to-end
digital acquisitions. Parent SBIN has a YONO banking app wherein integration with SBI
Card enables the latter to service clients as follows: (i) existing SBIN customers can
apply for a credit card through the app, and (ii) existing customers can avail of a full set
of services through the app which includes the ability to pay from their bank account
and view credit card statements.
SBI CARD
EQUITY RESEARCH 8 06 June 2022
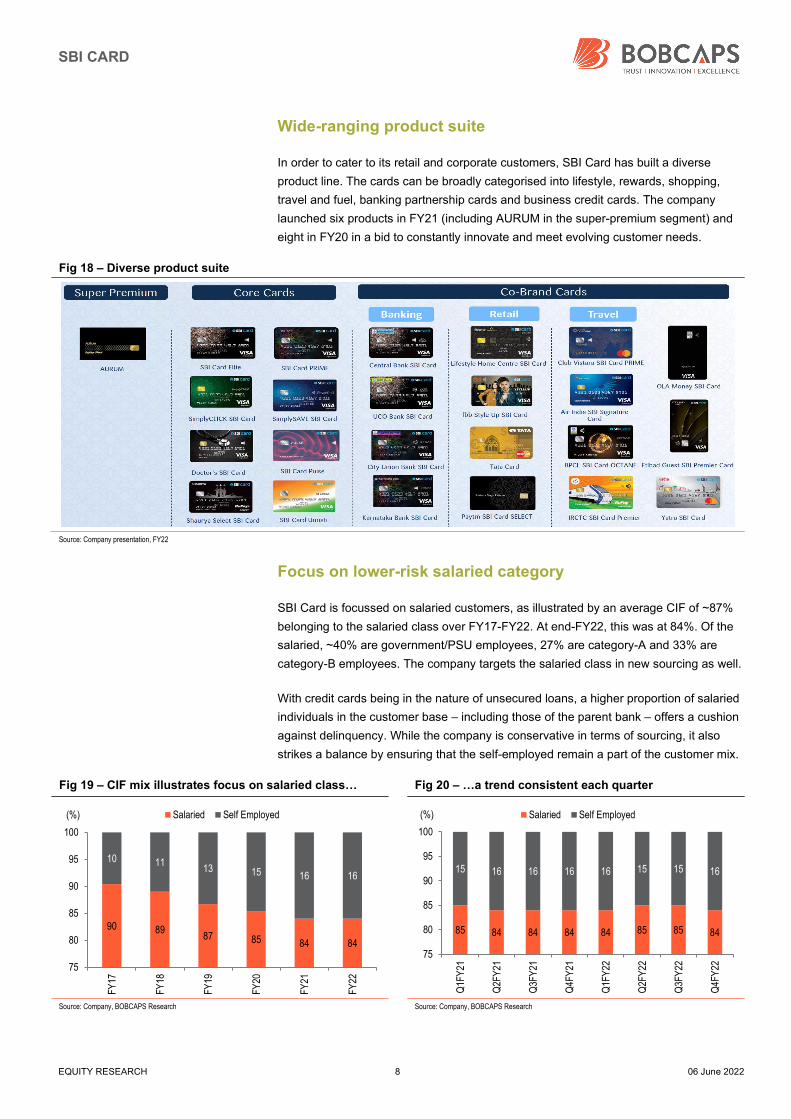
Wide-ranging product suite
In order to cater to its retail and corporate customers, SBI Card has built a diverse
product line. The cards can be broadly categorised into lifestyle, rewards, shopping,
travel and fuel, banking partnership cards and business credit cards. The company
launched six products in FY21 (including AURUM in the super-premium segment) and
eight in FY20 in a bid to constantly innovate and meet evolving customer needs.
Fig 18 – Diverse product suite
Source: Company presentation, FY22
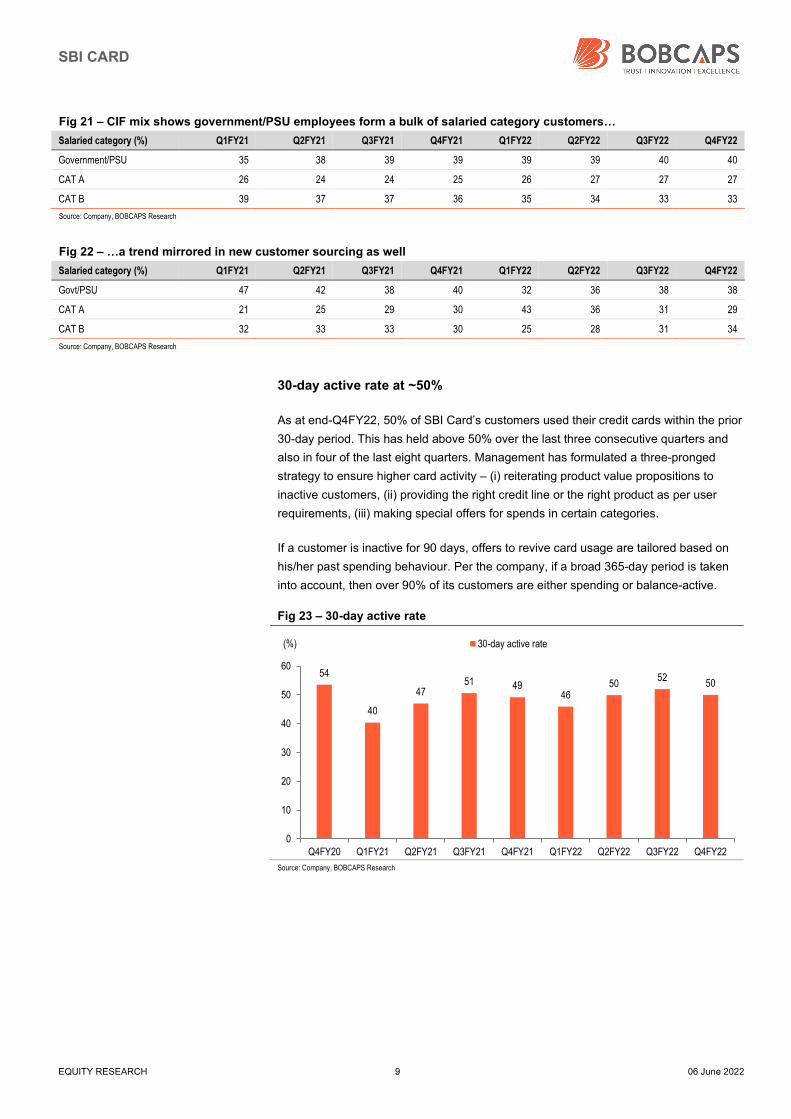
Focus on lower-risk salaried category
SBI Card is focussed on salaried customers, as illustrated by an average CIF of ~87%
belonging to the salaried class over FY17-FY22. At end-FY22, this was at 84%. Of the
salaried, ~40% are government/PSU employees, 27% are category-A and 33% are
category-B employees. The company targets the salaried class in new sourcing as well.
With credit cards being in the nature of unsecured loans, a higher proportion of salaried
individuals in the customer base – including those of the parent bank – offers a cushion
against delinquency. While the company is conservative in terms of sourcing, it also
strikes a balance by ensuring that the self-employed remain a part of the customer mix.
Fig 19 – CIF mix illustrates focus on salaried class… Fig 20 – …a trend consistent each quarter
Source: Company, BOBCAPS Research Source: Company, BOBCAPS Research
90 8987 85 84 84
10 1113 15 16 16
75
80
85
90
95
100
FY17
FY18
FY19
FY20
FY21
FY22
(%) Salaried Self Employed
85 84 84 84 84 85 85 84
15 16 16 16 16 15 15 16
75
80
85
90
95
100
Q1F
Y21
Q2F
Y21
Q3F
Y21
Q4F
Y21
Q1F
Y22
Q2F
Y22
Q3F
Y22
Q4F
Y22
(%) Salaried Self Employed
SBI CARD
EQUITY RESEARCH 9 06 June 2022
Fig 21 – CIF mix shows government/PSU employees form a bulk of salaried category customers…
Salaried category (%) Q1FY21 Q2FY21 Q3FY21 Q4FY21 Q1FY22 Q2FY22 Q3FY22 Q4FY22
Government/PSU 35 38 39 39 39 39 40 40
CAT A 26 24 24 25 26 27 27 27
CAT B 39 37 37 36 35 34 33 33
Source: Company, BOBCAPS Research
Fig 22 – …a trend mirrored in new customer sourcing as well
Salaried category (%) Q1FY21 Q2FY21 Q3FY21 Q4FY21 Q1FY22 Q2FY22 Q3FY22 Q4FY22
Govt/PSU 47 42 38 40 32 36 38 38
CAT A 21 25 29 30 43 36 31 29
CAT B 32 33 33 30 25 28 31 34
Source: Company, BOBCAPS Research
30-day active rate at ~50%
As at end-Q4FY22, 50% of SBI Card’s customers used their credit cards within the prior
30-day period. This has held above 50% over the last three consecutive quarters and
also in four of the last eight quarters. Management has formulated a three-pronged
strategy to ensure higher card activity – (i) reiterating product value propositions to
inactive customers, (ii) providing the right credit line or the right product as per user
requirements, (iii) making special offers for spends in certain categories.
If a customer is inactive for 90 days, offers to revive card usage are tailored based on
his/her past spending behaviour. Per the company, if a broad 365-day period is taken
into account, then over 90% of its customers are either spending or balance-active.
Fig 23 – 30-day active rate
Source: Company, BOBCAPS Research
54
40
4751 49
4650
5250
0
10
20
30
40
50
60
Q4FY20 Q1FY21 Q2FY21 Q3FY21 Q4FY21 Q1FY22 Q2FY22 Q3FY22 Q4FY22
(%) 30-day active rate
SBI CARD
EQUITY RESEARCH 10 06 June 2022
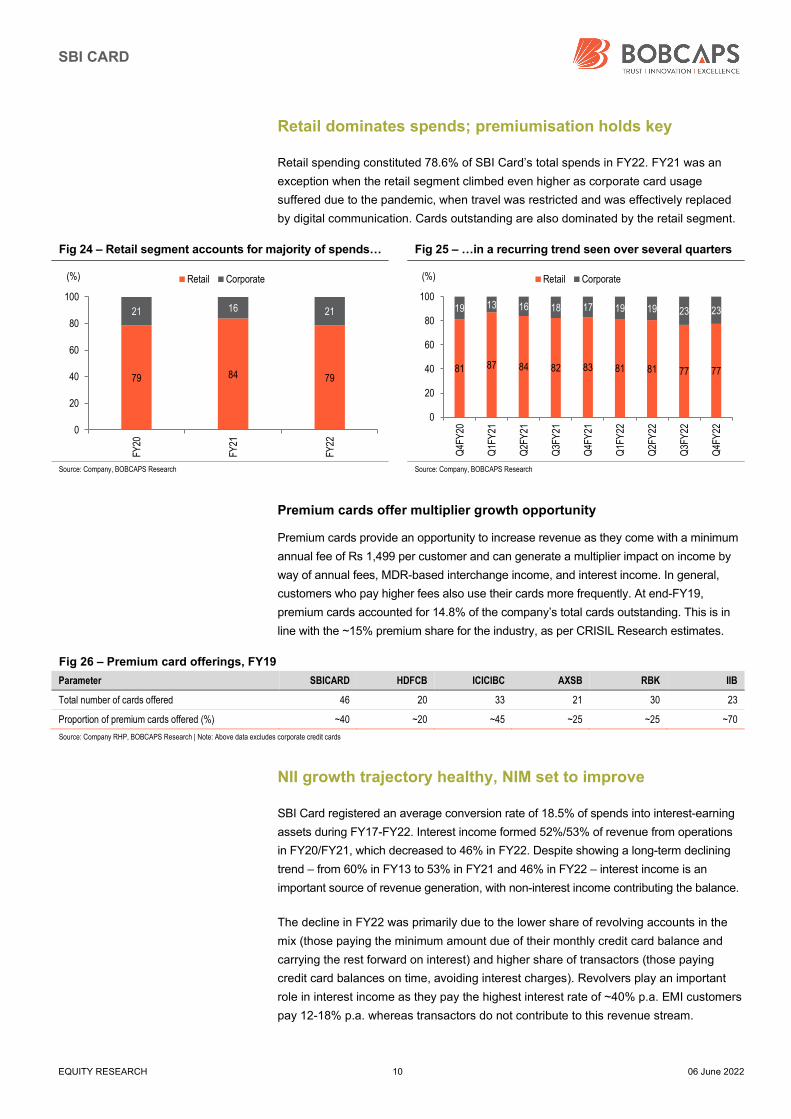
Retail dominates spends; premiumisation holds key
Retail spending constituted 78.6% of SBI Card’s total spends in FY22. FY21 was an
exception when the retail segment climbed even higher as corporate card usage
suffered due to the pandemic, when travel was restricted and was effectively replaced
by digital communication. Cards outstanding are also dominated by the retail segment.
Fig 24 – Retail segment accounts for majority of spends… Fig 25 – …in a recurring trend seen over several quarters
Source: Company, BOBCAPS Research Source: Company, BOBCAPS Research
Premium cards offer multiplier growth opportunity
Premium cards provide an opportunity to increase revenue as they come with a minimum
annual fee of Rs 1,499 per customer and can generate a multiplier impact on income by
way of annual fees, MDR-based interchange income, and interest income. In general,
customers who pay higher fees also use their cards more frequently. At end-FY19,
premium cards accounted for 14.8% of the company’s total cards outstanding. This is in
line with the ~15% premium share for the industry, as per CRISIL Research estimates.
Fig 26 – Premium card offerings, FY19
Parameter SBICARD HDFCB ICICIBC AXSB RBK IIB
Total number of cards offered 46 20 33 21 30 23
Proportion of premium cards offered (%) ~40 ~20 ~45 ~25 ~25 ~70
Source: Company RHP, BOBCAPS Research | Note: Above data excludes corporate credit cards
NII growth trajectory healthy, NIM set to improve
SBI Card registered an average conversion rate of 18.5% of spends into interest-earning
assets during FY17-FY22. Interest income formed 52%/53% of revenue from operations
in FY20/FY21, which decreased to 46% in FY22. Despite showing a long-term declining
trend – from 60% in FY13 to 53% in FY21 and 46% in FY22 – interest income is an
important source of revenue generation, with non-interest income contributing the balance.
The decline in FY22 was primarily due to the lower share of revolving accounts in the
mix (those paying the minimum amount due of their monthly credit card balance and
carrying the rest forward on interest) and higher share of transactors (those paying
credit card balances on time, avoiding interest charges). Revolvers play an important
role in interest income as they pay the highest interest rate of ~40% p.a. EMI customers
pay 12-18% p.a. whereas transactors do not contribute to this revenue stream.
79 84 79
21 16 21
0
20
40
60
80
100
FY20
FY21
FY22
(%) Retail Corporate
81 87 84 82 83 81 81 77 77
19 13 16 18 17 19 19 23 23
0
20
40
60
80
100
Q4F
Y20
Q1F
Y21
Q2F
Y21
Q3F
Y21
Q4F
Y21
Q1F
Y22
Q2F
Y22
Q3F
Y22
Q4F
Y22
(%) Retail Corporate
SBI CARD
EQUITY RESEARCH 11 06 June 2022
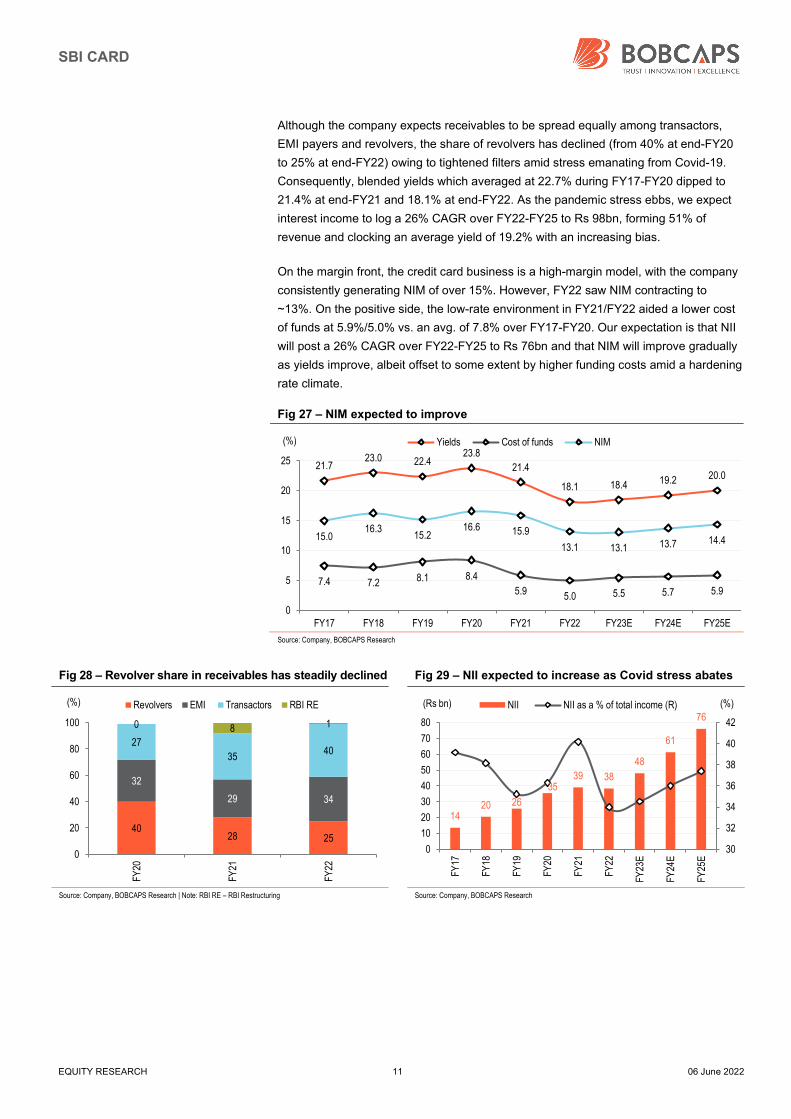
Although the company expects receivables to be spread equally among transactors,
EMI payers and revolvers, the share of revolvers has declined (from 40% at end-FY20
to 25% at end-FY22) owing to tightened filters amid stress emanating from Covid-19.
Consequently, blended yields which averaged at 22.7% during FY17-FY20 dipped to
21.4% at end-FY21 and 18.1% at end-FY22. As the pandemic stress ebbs, we expect
interest income to log a 26% CAGR over FY22-FY25 to Rs 98bn, forming 51% of
revenue and clocking an average yield of 19.2% with an increasing bias.
On the margin front, the credit card business is a high-margin model, with the company
consistently generating NIM of over 15%. However, FY22 saw NIM contracting to
~13%. On the positive side, the low-rate environment in FY21/FY22 aided a lower cost
of funds at 5.9%/5.0% vs. an avg. of 7.8% over FY17-FY20. Our expectation is that NII
will post a 26% CAGR over FY22-FY25 to Rs 76bn and that NIM will improve gradually
as yields improve, albeit offset to some extent by higher funding costs amid a hardening
rate climate.
Fig 27 – NIM expected to improve
Source: Company, BOBCAPS Research
Fig 28 – Revolver share in receivables has steadily declined Fig 29 – NII expected to increase as Covid stress abates
Source: Company, BOBCAPS Research | Note: RBI RE – RBI Restructuring Source: Company, BOBCAPS Research
21.723.0 22.4
23.8
21.4
18.1 18.4 19.2 20.0
7.4 7.2 8.1 8.4
5.9 5.0 5.5 5.7 5.9
15.016.3
15.216.6 15.9
13.1 13.1 13.7 14.4
0
5
10
15
20
25
FY17 FY18 FY19 FY20 FY21 FY22 FY23E FY24E FY25E
(%) Yields Cost of funds NIM
4028 25
32
29 34
27
3540
0 8 1
0
20
40
60
80
100
FY20
FY21
FY22
(%) Revolvers EMI Transactors RBI RE
1420 26
3539 38
48
61
76
30
32
34
36
38
40
42
0
10
20
30
40
50
60
70
80
FY17
FY18
FY19
FY20
FY21
FY22
FY23
E
FY24
E
FY25
E(%)(Rs bn) NII NII as a % of total income (R)
SBI CARD
EQUITY RESEARCH 12 06 June 2022
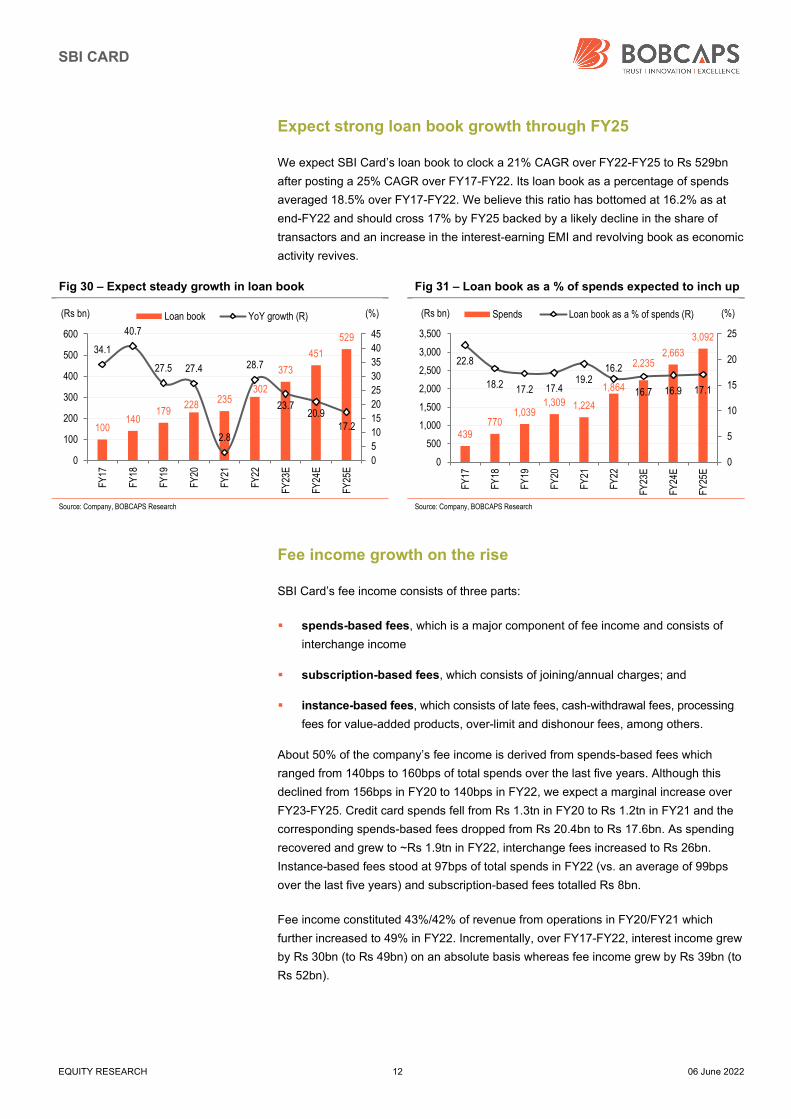
Expect strong loan book growth through FY25
We expect SBI Card’s loan book to clock a 21% CAGR over FY22-FY25 to Rs 529bn
after posting a 25% CAGR over FY17-FY22. Its loan book as a percentage of spends
averaged 18.5% over FY17-FY22. We believe this ratio has bottomed at 16.2% as at
end-FY22 and should cross 17% by FY25 backed by a likely decline in the share of
transactors and an increase in the interest-earning EMI and revolving book as economic
activity revives.
Fig 30 – Expect steady growth in loan book Fig 31 – Loan book as a % of spends expected to inch up
Source: Company, BOBCAPS Research Source: Company, BOBCAPS Research
Fee income growth on the rise
SBI Card’s fee income consists of three parts:
spends-based fees, which is a major component of fee income and consists of
interchange income
subscription-based fees, which consists of joining/annual charges; and
instance-based fees, which consists of late fees, cash-withdrawal fees, processing
fees for value-added products, over-limit and dishonour fees, among others.
About 50% of the company’s fee income is derived from spends-based fees which
ranged from 140bps to 160bps of total spends over the last five years. Although this
declined from 156bps in FY20 to 140bps in FY22, we expect a marginal increase over
FY23-FY25. Credit card spends fell from Rs 1.3tn in FY20 to Rs 1.2tn in FY21 and the
corresponding spends-based fees dropped from Rs 20.4bn to Rs 17.6bn. As spending
recovered and grew to ~Rs 1.9tn in FY22, interchange fees increased to Rs 26bn.
Instance-based fees stood at 97bps of total spends in FY22 (vs. an average of 99bps
over the last five years) and subscription-based fees totalled Rs 8bn.
Fee income constituted 43%/42% of revenue from operations in FY20/FY21 which
further increased to 49% in FY22. Incrementally, over FY17-FY22, interest income grew
by Rs 30bn (to Rs 49bn) on an absolute basis whereas fee income grew by Rs 39bn (to
Rs 52bn).
100140
179228
235302
373
451
52934.1
40.7
27.5 27.4
2.8
28.7
23.720.9
17.2
0
5
10
15
20
25
30
35
40
45
0
100
200
300
400
500
600
FY17
FY18
FY19
FY20
FY21
FY22
FY23
E
FY24
E
FY25
E
(%)(Rs bn) Loan book YoY growth (R)
439770
1,0391,309 1,224
1,864
2,2352,663
3,092
22.8
18.2 17.2 17.419.2
16.2
16.7 16.9 17.1
0
5
10
15
20
25
0
500
1,000
1,500
2,000
2,500
3,000
3,500
FY17
FY18
FY19
FY20
FY21
FY22
FY23
E
FY24
E
FY25
E
(%)(Rs bn) Spends Loan book as a % of spends (R)
SBI CARD
EQUITY RESEARCH 13 06 June 2022
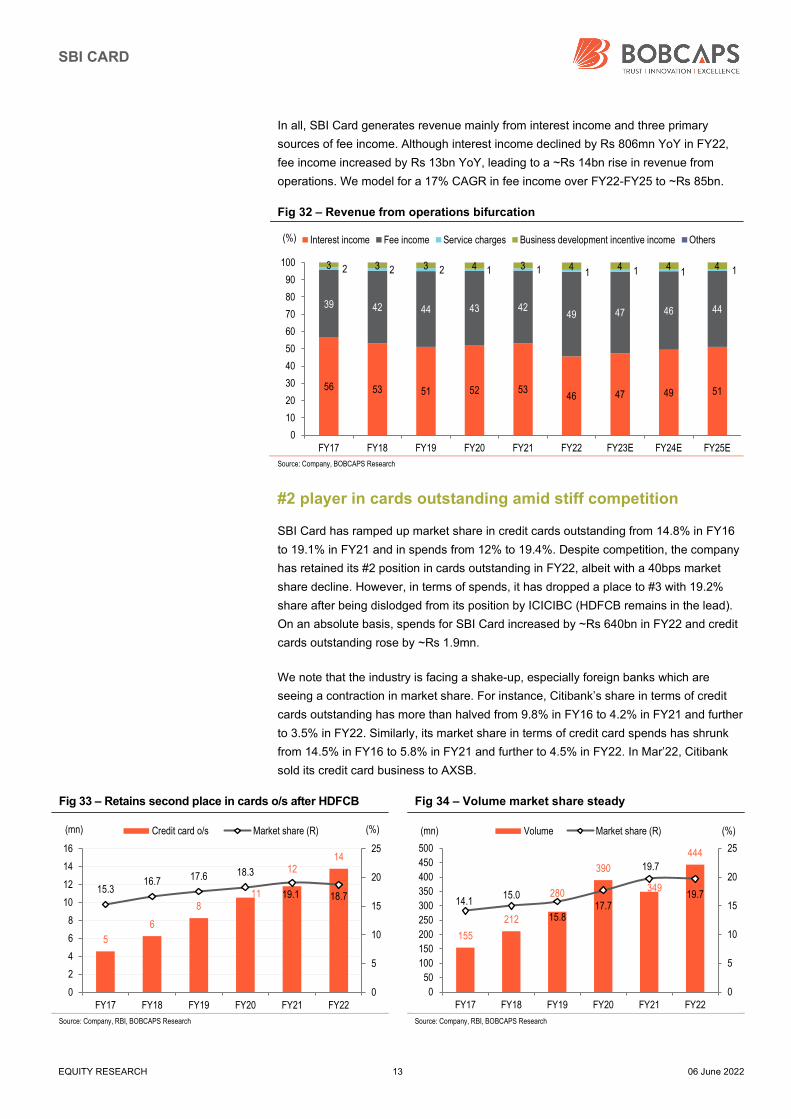
In all, SBI Card generates revenue mainly from interest income and three primary
sources of fee income. Although interest income declined by Rs 806mn YoY in FY22,
fee income increased by Rs 13bn YoY, leading to a ~Rs 14bn rise in revenue from
operations. We model for a 17% CAGR in fee income over FY22-FY25 to ~Rs 85bn.
Fig 32 – Revenue from operations bifurcation
Source: Company, BOBCAPS Research
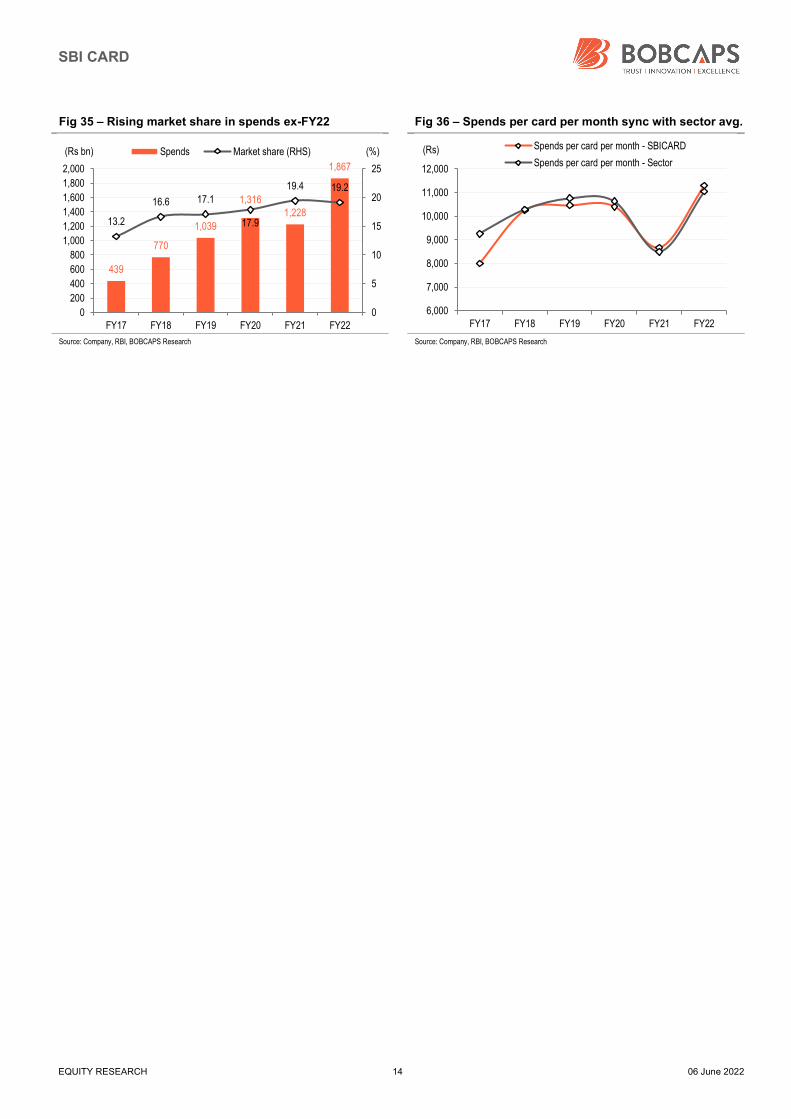
#2 player in cards outstanding amid stiff competition
SBI Card has ramped up market share in credit cards outstanding from 14.8% in FY16
to 19.1% in FY21 and in spends from 12% to 19.4%. Despite competition, the company
has retained its #2 position in cards outstanding in FY22, albeit with a 40bps market
share decline. However, in terms of spends, it has dropped a place to #3 with 19.2%
share after being dislodged from its position by ICICIBC (HDFCB remains in the lead).
On an absolute basis, spends for SBI Card increased by ~Rs 640bn in FY22 and credit
cards outstanding rose by ~Rs 1.9mn.
We note that the industry is facing a shake-up, especially foreign banks which are
seeing a contraction in market share. For instance, Citibank’s share in terms of credit
cards outstanding has more than halved from 9.8% in FY16 to 4.2% in FY21 and further
to 3.5% in FY22. Similarly, its market share in terms of credit card spends has shrunk
from 14.5% in FY16 to 5.8% in FY21 and further to 4.5% in FY22. In Mar’22, Citibank
sold its credit card business to AXSB.
Fig 33 – Retains second place in cards o/s after HDFCB Fig 34 – Volume market share steady
Source: Company, RBI, BOBCAPS Research Source: Company, RBI, BOBCAPS Research
56 53 51 52 5346 47 49 51
39 42 44 43 4249 47 46 44
2 2 2 1 1 1 1 1 13 3 3 4 3 4 4 4 4
0
10
20
30
40
50
60
70
80
90
100
FY17 FY18 FY19 FY20 FY21 FY22 FY23E FY24E FY25E
(%) Interest income Fee income Service charges Business development incentive income Others
5
6
811
1214
15.316.7 17.6 18.3
19.1 18.7
0
5
10
15
20
25
0
2
4
6
8
10
12
14
16
FY17 FY18 FY19 FY20 FY21 FY22
(%)(mn) Credit card o/s Market share (R)
155
212
280
390
349
444
14.115.0
15.817.7
19.7
19.7
0
5
10
15
20
25
0
50
100
150
200
250
300
350
400
450
500
FY17 FY18 FY19 FY20 FY21 FY22
(%)(mn) Volume Market share (R)
SBI CARD
EQUITY RESEARCH 14 06 June 2022
Fig 35 – Rising market share in spends ex-FY22 Fig 36 – Spends per card per month sync with sector avg.
Source: Company, RBI, BOBCAPS Research Source: Company, RBI, BOBCAPS Research
439
770
1,039
1,3161,228
1,867
13.2
16.6 17.1
17.9
19.4 19.2
0
5
10
15
20
25
0
200
400
600
800
1,000
1,200
1,400
1,600
1,800
2,000
FY17 FY18 FY19 FY20 FY21 FY22
(%)(Rs bn) Spends Market share (RHS)
6,000
7,000
8,000
9,000
10,000
11,000
12,000
FY17 FY18 FY19 FY20 FY21 FY22
(Rs) Spends per card per month - SBICARD
Spends per card per month - Sector
SBI CARD
EQUITY RESEARCH 15 06 June 2022
Financial review
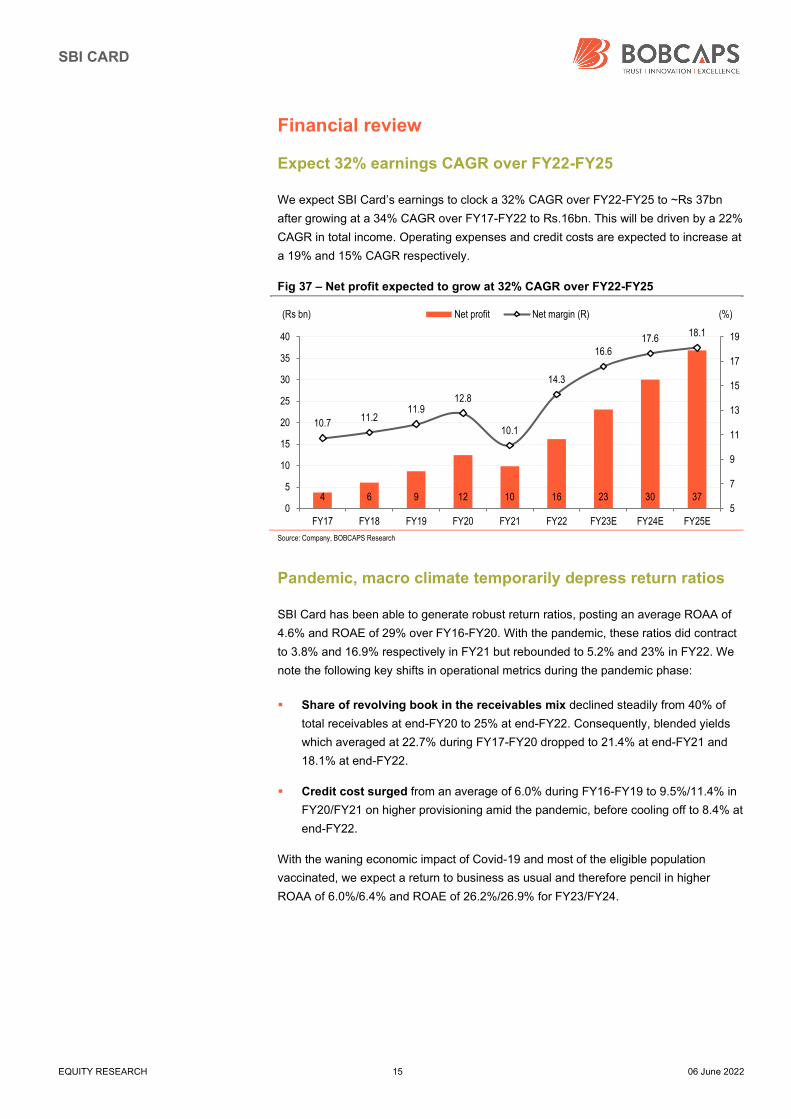
Expect 32% earnings CAGR over FY22-FY25
We expect SBI Card’s earnings to clock a 32% CAGR over FY22-FY25 to ~Rs 37bn
after growing at a 34% CAGR over FY17-FY22 to Rs.16bn. This will be driven by a 22%
CAGR in total income. Operating expenses and credit costs are expected to increase at
a 19% and 15% CAGR respectively.
Fig 37 – Net profit expected to grow at 32% CAGR over FY22-FY25
Source: Company, BOBCAPS Research
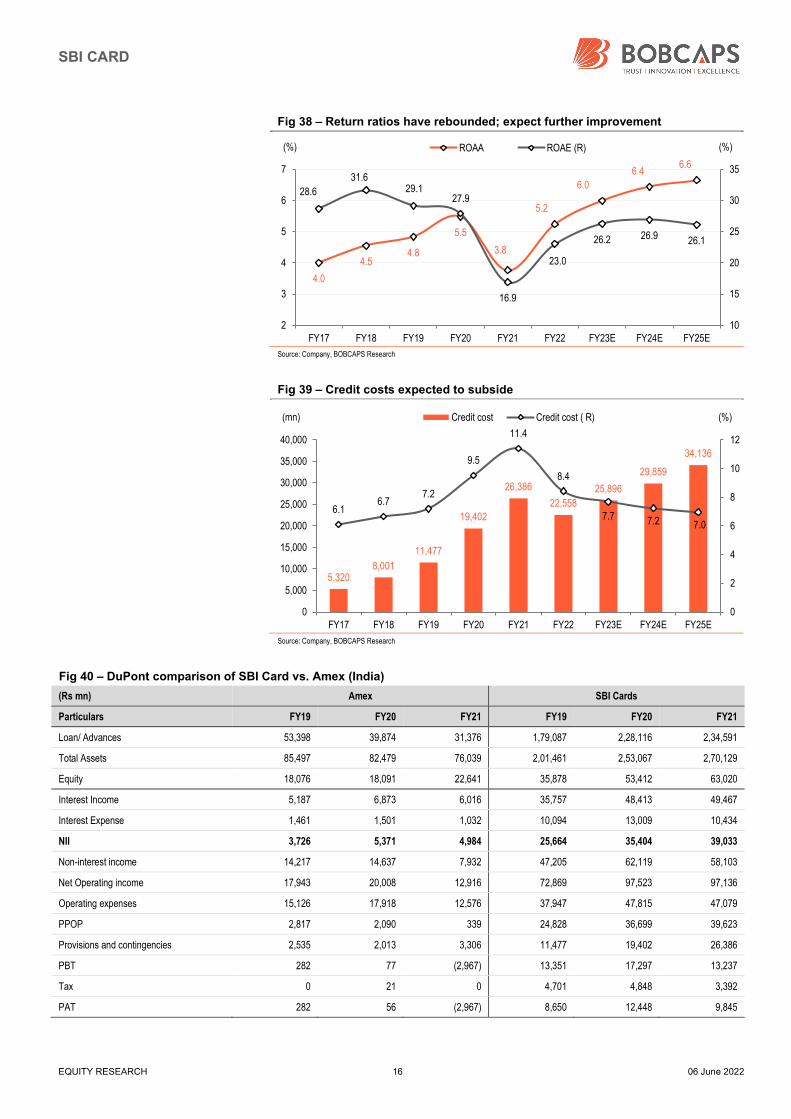
Pandemic, macro climate temporarily depress return ratios
SBI Card has been able to generate robust return ratios, posting an average ROAA of
4.6% and ROAE of 29% over FY16-FY20. With the pandemic, these ratios did contract
to 3.8% and 16.9% respectively in FY21 but rebounded to 5.2% and 23% in FY22. We
note the following key shifts in operational metrics during the pandemic phase:
Share of revolving book in the receivables mix declined steadily from 40% of
total receivables at end-FY20 to 25% at end-FY22. Consequently, blended yields
which averaged at 22.7% during FY17-FY20 dropped to 21.4% at end-FY21 and
18.1% at end-FY22.
Credit cost surged from an average of 6.0% during FY16-FY19 to 9.5%/11.4% in
FY20/FY21 on higher provisioning amid the pandemic, before cooling off to 8.4% at
end-FY22.
With the waning economic impact of Covid-19 and most of the eligible population
vaccinated, we expect a return to business as usual and therefore pencil in higher
ROAA of 6.0%/6.4% and ROAE of 26.2%/26.9% for FY23/FY24.
4 6 9 12 10 16 23 30 37
10.711.2
11.912.8
10.1
14.3
16.617.6
18.1
5
7
9
11
13
15
17
19
0
5
10
15
20
25
30
35
40
FY17 FY18 FY19 FY20 FY21 FY22 FY23E FY24E FY25E
(%)(Rs bn) Net profit Net margin (R)
SBI CARD
EQUITY RESEARCH 16 06 June 2022
Fig 38 – Return ratios have rebounded; expect further improvement
Source: Company, BOBCAPS Research
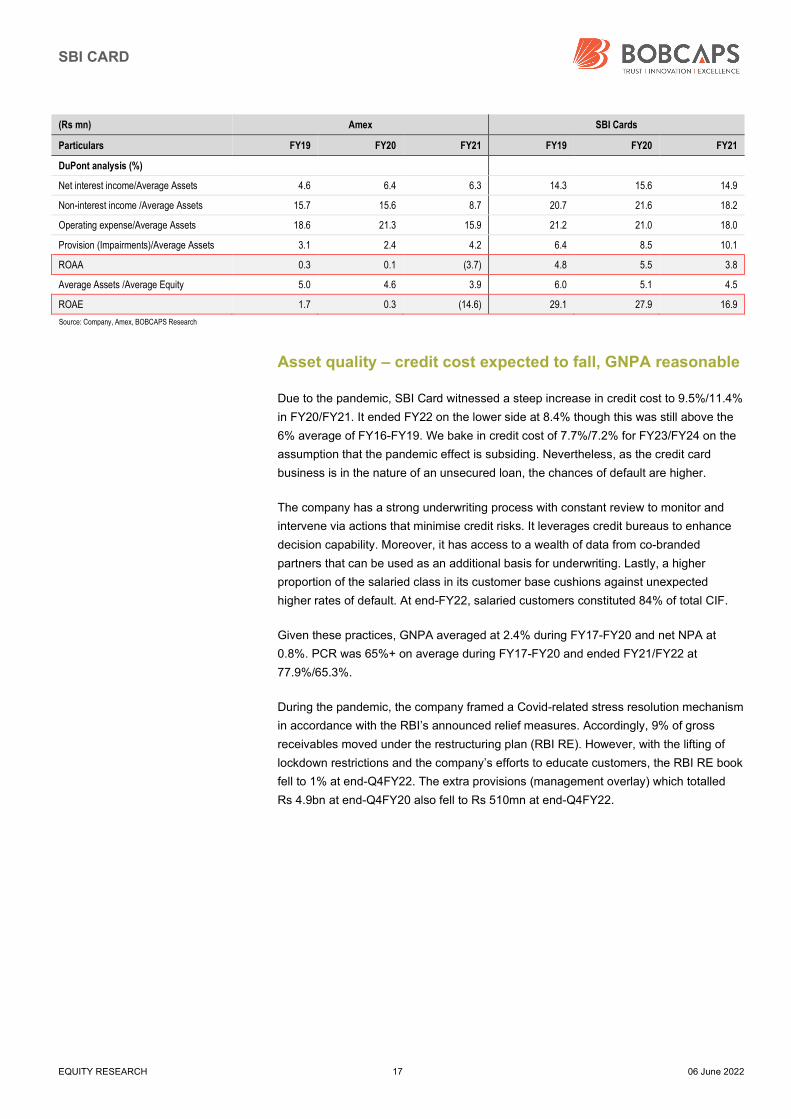
Fig 39 – Credit costs expected to subside
Source: Company, BOBCAPS Research
Fig 40 – DuPont comparison of SBI Card vs. Amex (India)
(Rs mn) Amex SBI Cards
Particulars FY19 FY20 FY21 FY19 FY20 FY21
Loan/ Advances 53,398 39,874 31,376 1,79,087 2,28,116 2,34,591
Total Assets 85,497 82,479 76,039 2,01,461 2,53,067 2,70,129
Equity 18,076 18,091 22,641 35,878 53,412 63,020
Interest Income 5,187 6,873 6,016 35,757 48,413 49,467
Interest Expense 1,461 1,501 1,032 10,094 13,009 10,434
NII 3,726 5,371 4,984 25,664 35,404 39,033
Non-interest income 14,217 14,637 7,932 47,205 62,119 58,103
Net Operating income 17,943 20,008 12,916 72,869 97,523 97,136
Operating expenses 15,126 17,918 12,576 37,947 47,815 47,079
PPOP 2,817 2,090 339 24,828 36,699 39,623
Provisions and contingencies 2,535 2,013 3,306 11,477 19,402 26,386
PBT 282 77 (2,967) 13,351 17,297 13,237
Tax 0 21 0 4,701 4,848 3,392
PAT 282 56 (2,967) 8,650 12,448 9,845
4.0
4.54.8
5.5
3.8
5.2
6.0
6.46.6
28.6
31.629.1
27.9
16.9
23.0
26.2 26.9 26.1
10
15
20
25
30
35
2
3
4
5
6
7
FY17 FY18 FY19 FY20 FY21 FY22 FY23E FY24E FY25E
(%)(%) ROAA ROAE (R)
5,3208,001
11,477
19,402
26,386
22,558
25,896
29,859
34,136
6.16.7
7.2
9.5
11.4
8.4
7.7 7.2 7.0
0
2
4
6
8
10
12
0
5,000
10,000
15,000
20,000
25,000
30,000
35,000
40,000
FY17 FY18 FY19 FY20 FY21 FY22 FY23E FY24E FY25E
(%)(mn) Credit cost Credit cost ( R)
SBI CARD
EQUITY RESEARCH 17 06 June 2022
(Rs mn) Amex SBI Cards
Particulars FY19 FY20 FY21 FY19 FY20 FY21
DuPont analysis (%)
Net interest income/Average Assets 4.6 6.4 6.3 14.3 15.6 14.9
Non-interest income /Average Assets 15.7 15.6 8.7 20.7 21.6 18.2
Operating expense/Average Assets 18.6 21.3 15.9 21.2 21.0 18.0
Provision (Impairments)/Average Assets 3.1 2.4 4.2 6.4 8.5 10.1
ROAA 0.3 0.1 (3.7) 4.8 5.5 3.8
Average Assets /Average Equity 5.0 4.6 3.9 6.0 5.1 4.5
ROAE 1.7 0.3 (14.6) 29.1 27.9 16.9
Source: Company, Amex, BOBCAPS Research
Asset quality – credit cost expected to fall, GNPA reasonable
Due to the pandemic, SBI Card witnessed a steep increase in credit cost to 9.5%/11.4%
in FY20/FY21. It ended FY22 on the lower side at 8.4% though this was still above the
6% average of FY16-FY19. We bake in credit cost of 7.7%/7.2% for FY23/FY24 on the
assumption that the pandemic effect is subsiding. Nevertheless, as the credit card
business is in the nature of an unsecured loan, the chances of default are higher.
The company has a strong underwriting process with constant review to monitor and
intervene via actions that minimise credit risks. It leverages credit bureaus to enhance
decision capability. Moreover, it has access to a wealth of data from co-branded
partners that can be used as an additional basis for underwriting. Lastly, a higher
proportion of the salaried class in its customer base cushions against unexpected
higher rates of default. At end-FY22, salaried customers constituted 84% of total CIF.
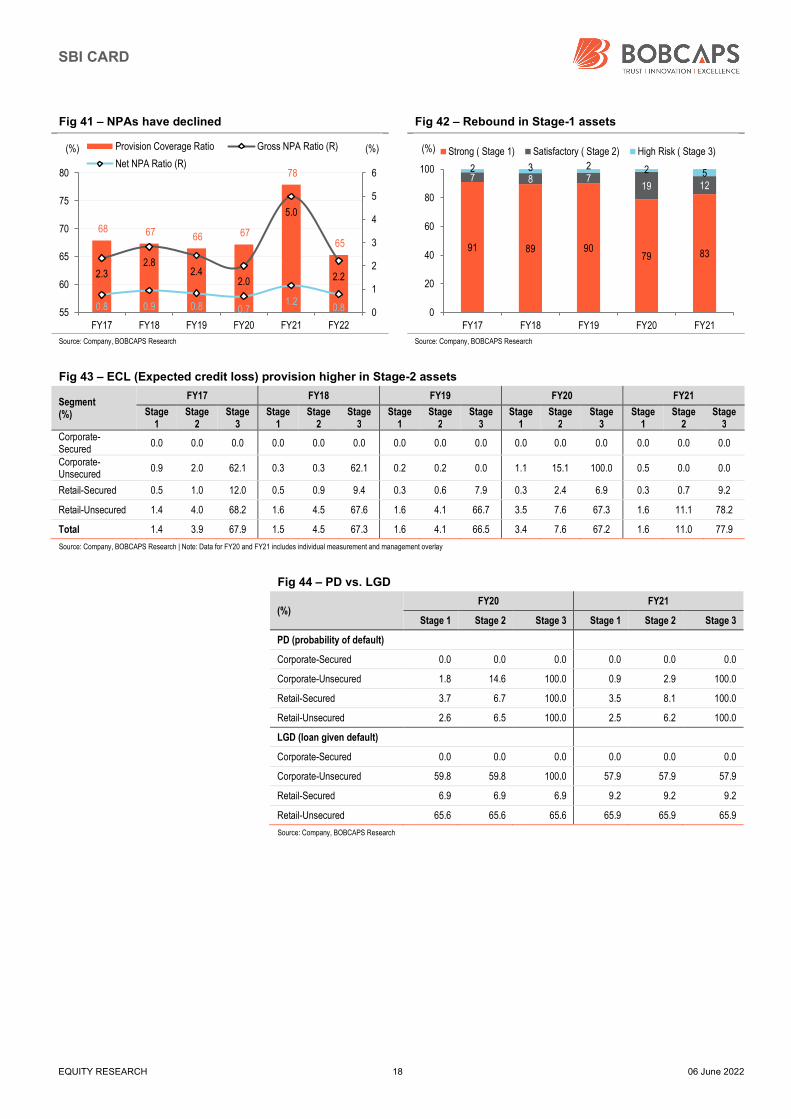
Given these practices, GNPA averaged at 2.4% during FY17-FY20 and net NPA at
0.8%. PCR was 65%+ on average during FY17-FY20 and ended FY21/FY22 at
77.9%/65.3%.
During the pandemic, the company framed a Covid-related stress resolution mechanism
in accordance with the RBI’s announced relief measures. Accordingly, 9% of gross
receivables moved under the restructuring plan (RBI RE). However, with the lifting of
lockdown restrictions and the company’s efforts to educate customers, the RBI RE book
fell to 1% at end-Q4FY22. The extra provisions (management overlay) which totalled
Rs 4.9bn at end-Q4FY20 also fell to Rs 510mn at end-Q4FY22.
SBI CARD
EQUITY RESEARCH 18 06 June 2022
Fig 41 – NPAs have declined Fig 42 – Rebound in Stage-1 assets
Source: Company, BOBCAPS Research Source: Company, BOBCAPS Research
Fig 43 – ECL (Expected credit loss) provision higher in Stage-2 assets
Segment (%)
FY17 FY18 FY19 FY20 FY21
Stage 1
Stage 2
Stage 3
Stage 1
Stage 2
Stage 3
Stage 1
Stage 2
Stage 3
Stage 1
Stage 2
Stage 3
Stage 1
Stage 2
Stage 3
Corporate- Secured
0.0 0.0 0.0 0.0 0.0 0.0 0.0 0.0 0.0 0.0 0.0 0.0 0.0 0.0 0.0
Corporate- Unsecured
0.9 2.0 62.1 0.3 0.3 62.1 0.2 0.2 0.0 1.1 15.1 100.0 0.5 0.0 0.0
Retail-Secured 0.5 1.0 12.0 0.5 0.9 9.4 0.3 0.6 7.9 0.3 2.4 6.9 0.3 0.7 9.2
Retail-Unsecured 1.4 4.0 68.2 1.6 4.5 67.6 1.6 4.1 66.7 3.5 7.6 67.3 1.6 11.1 78.2
Total 1.4 3.9 67.9 1.5 4.5 67.3 1.6 4.1 66.5 3.4 7.6 67.2 1.6 11.0 77.9
Source: Company, BOBCAPS Research | Note: Data for FY20 and FY21 includes individual measurement and management overlay
Fig 44 – PD vs. LGD
(%) FY20 FY21
Stage 1 Stage 2 Stage 3 Stage 1 Stage 2 Stage 3
PD (probability of default)
Corporate-Secured 0.0 0.0 0.0 0.0 0.0 0.0
Corporate-Unsecured 1.8 14.6 100.0 0.9 2.9 100.0
Retail-Secured 3.7 6.7 100.0 3.5 8.1 100.0
Retail-Unsecured 2.6 6.5 100.0 2.5 6.2 100.0
LGD (loan given default)
Corporate-Secured 0.0 0.0 0.0 0.0 0.0 0.0
Corporate-Unsecured 59.8 59.8 100.0 57.9 57.9 57.9
Retail-Secured 6.9 6.9 6.9 9.2 9.2 9.2
Retail-Unsecured 65.6 65.6 65.6 65.9 65.9 65.9
Source: Company, BOBCAPS Research
68 67 66 67
78
65
2.32.8
2.42.0
5.0
2.2
0.8 0.9 0.8 0.71.2
0.8 0
1
2
3
4
5
6
55
60
65
70
75
80
FY17 FY18 FY19 FY20 FY21 FY22
(%)(%) Provision Coverage Ratio Gross NPA Ratio (R)
Net NPA Ratio (R)
91 89 9079 83
7 8 719 12
2 3 2 2 5
0
20
40
60
80
100
FY17 FY18 FY19 FY20 FY21
(%) Strong ( Stage 1) Satisfactory ( Stage 2) High Risk ( Stage 3)
SBI CARD
EQUITY RESEARCH 19 06 June 2022
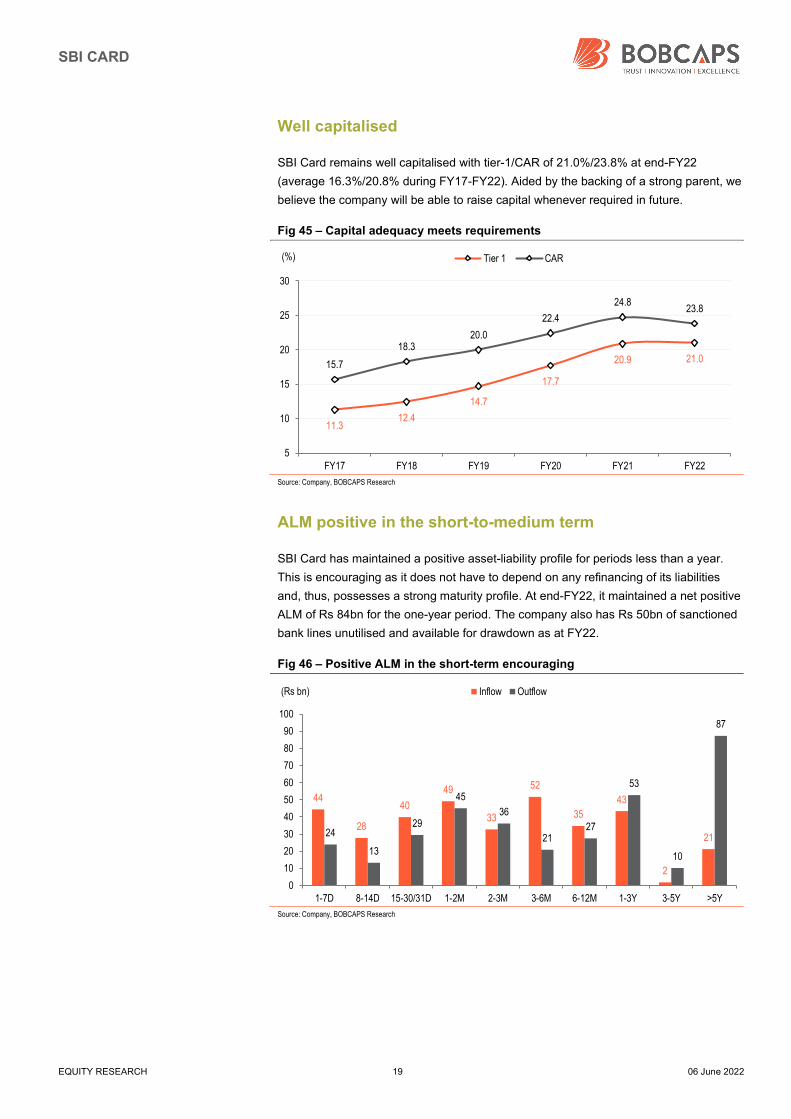
Well capitalised
SBI Card remains well capitalised with tier-1/CAR of 21.0%/23.8% at end-FY22
(average 16.3%/20.8% during FY17-FY22). Aided by the backing of a strong parent, we
believe the company will be able to raise capital whenever required in future.
Fig 45 – Capital adequacy meets requirements
Source: Company, BOBCAPS Research
ALM positive in the short-to-medium term
SBI Card has maintained a positive asset-liability profile for periods less than a year.
This is encouraging as it does not have to depend on any refinancing of its liabilities
and, thus, possesses a strong maturity profile. At end-FY22, it maintained a net positive
ALM of Rs 84bn for the one-year period. The company also has Rs 50bn of sanctioned
bank lines unutilised and available for drawdown as at FY22.
Fig 46 – Positive ALM in the short-term encouraging
Source: Company, BOBCAPS Research
11.312.4
14.7
17.7
20.9 21.015.7
18.320.0
22.4
24.823.8
5
10
15
20
25
30
FY17 FY18 FY19 FY20 FY21 FY22
(%) Tier 1 CAR
44
28
40
49
33
52
35
43
2
2124
13
29
45
36
2127
53
10
87
0
10
20
30
40
50
60
70
80
90
100
1-7D 8-14D 15-30/31D 1-2M 2-3M 3-6M 6-12M 1-3Y 3-5Y >5Y
(Rs bn) Inflow Outflow
SBI CARD
EQUITY RESEARCH 20 06 June 2022
Competitive analysis
Spends
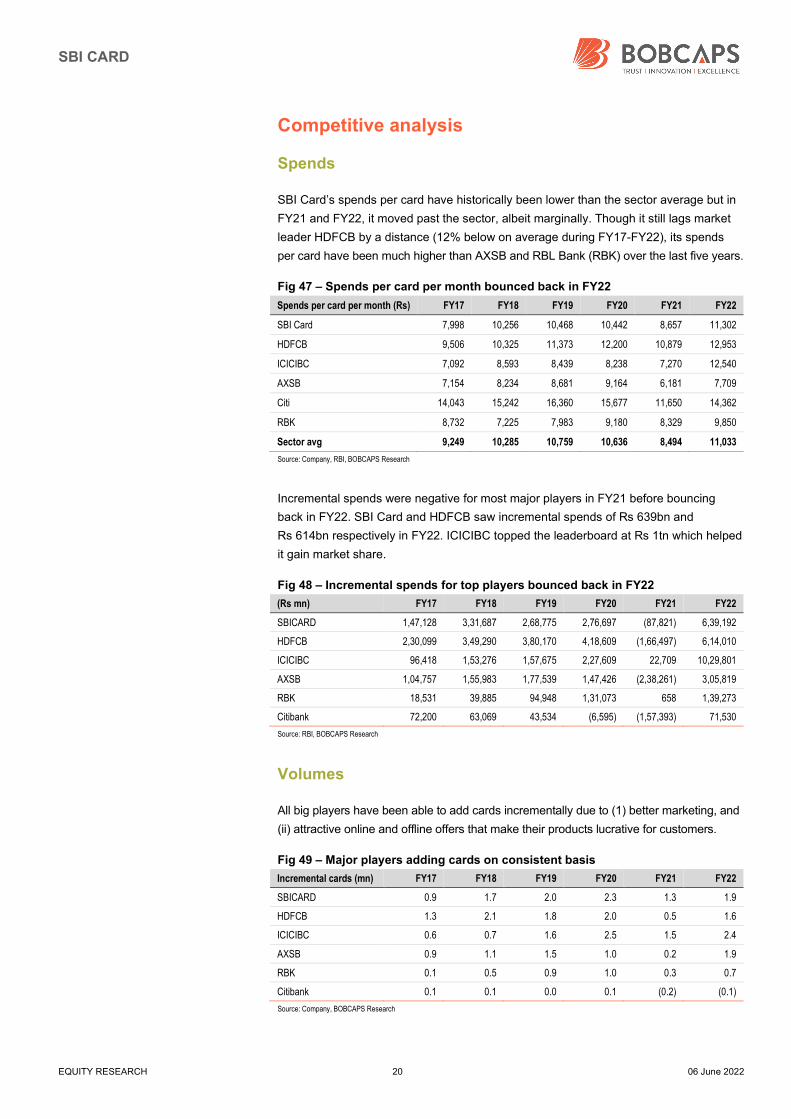
SBI Card’s spends per card have historically been lower than the sector average but in
FY21 and FY22, it moved past the sector, albeit marginally. Though it still lags market
leader HDFCB by a distance (12% below on average during FY17-FY22), its spends
per card have been much higher than AXSB and RBL Bank (RBK) over the last five years.
Fig 47 – Spends per card per month bounced back in FY22
Spends per card per month (Rs) FY17 FY18 FY19 FY20 FY21 FY22
SBI Card 7,998 10,256 10,468 10,442 8,657 11,302
HDFCB 9,506 10,325 11,373 12,200 10,879 12,953
ICICIBC 7,092 8,593 8,439 8,238 7,270 12,540
AXSB 7,154 8,234 8,681 9,164 6,181 7,709
Citi 14,043 15,242 16,360 15,677 11,650 14,362
RBK 8,732 7,225 7,983 9,180 8,329 9,850
Sector avg 9,249 10,285 10,759 10,636 8,494 11,033
Source: Company, RBI, BOBCAPS Research
Incremental spends were negative for most major players in FY21 before bouncing
back in FY22. SBI Card and HDFCB saw incremental spends of Rs 639bn and
Rs 614bn respectively in FY22. ICICIBC topped the leaderboard at Rs 1tn which helped
it gain market share.
Fig 48 – Incremental spends for top players bounced back in FY22
(Rs mn) FY17 FY18 FY19 FY20 FY21 FY22
SBICARD 1,47,128 3,31,687 2,68,775 2,76,697 (87,821) 6,39,192
HDFCB 2,30,099 3,49,290 3,80,170 4,18,609 (1,66,497) 6,14,010
ICICIBC 96,418 1,53,276 1,57,675 2,27,609 22,709 10,29,801
AXSB 1,04,757 1,55,983 1,77,539 1,47,426 (2,38,261) 3,05,819
RBK 18,531 39,885 94,948 1,31,073 658 1,39,273
Citibank 72,200 63,069 43,534 (6,595) (1,57,393) 71,530
Source: RBI, BOBCAPS Research
Volumes
All big players have been able to add cards incrementally due to (1) better marketing, and
(ii) attractive online and offline offers that make their products lucrative for customers.
Fig 49 – Major players adding cards on consistent basis
Incremental cards (mn) FY17 FY18 FY19 FY20 FY21 FY22
SBICARD 0.9 1.7 2.0 2.3 1.3 1.9
HDFCB 1.3 2.1 1.8 2.0 0.5 1.6
ICICIBC 0.6 0.7 1.6 2.5 1.5 2.4
AXSB 0.9 1.1 1.5 1.0 0.2 1.9
RBK 0.1 0.5 0.9 1.0 0.3 0.7
Citibank 0.1 0.1 0.0 0.1 (0.2) (0.1)
Source: Company, BOBCAPS Research
SBI CARD
EQUITY RESEARCH 21 06 June 2022
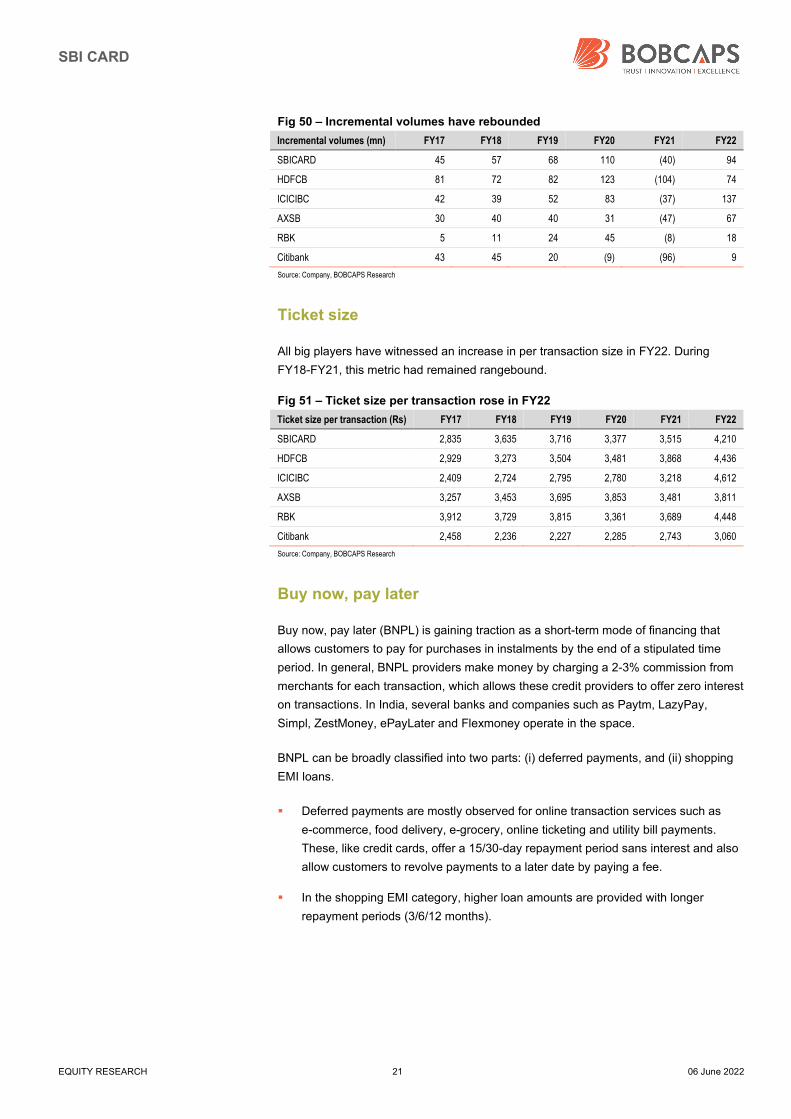
Fig 50 – Incremental volumes have rebounded
Incremental volumes (mn) FY17 FY18 FY19 FY20 FY21 FY22
SBICARD 45 57 68 110 (40) 94
HDFCB 81 72 82 123 (104) 74
ICICIBC 42 39 52 83 (37) 137
AXSB 30 40 40 31 (47) 67
RBK 5 11 24 45 (8) 18
Citibank 43 45 20 (9) (96) 9
Source: Company, BOBCAPS Research
Ticket size
All big players have witnessed an increase in per transaction size in FY22. During
FY18-FY21, this metric had remained rangebound.
Fig 51 – Ticket size per transaction rose in FY22
Ticket size per transaction (Rs) FY17 FY18 FY19 FY20 FY21 FY22
SBICARD 2,835 3,635 3,716 3,377 3,515 4,210
HDFCB 2,929 3,273 3,504 3,481 3,868 4,436
ICICIBC 2,409 2,724 2,795 2,780 3,218 4,612
AXSB 3,257 3,453 3,695 3,853 3,481 3,811
RBK 3,912 3,729 3,815 3,361 3,689 4,448
Citibank 2,458 2,236 2,227 2,285 2,743 3,060
Source: Company, BOBCAPS Research
Buy now, pay later
Buy now, pay later (BNPL) is gaining traction as a short-term mode of financing that
allows customers to pay for purchases in instalments by the end of a stipulated time
period. In general, BNPL providers make money by charging a 2-3% commission from
merchants for each transaction, which allows these credit providers to offer zero interest
on transactions. In India, several banks and companies such as Paytm, LazyPay,
Simpl, ZestMoney, ePayLater and Flexmoney operate in the space.
BNPL can be broadly classified into two parts: (i) deferred payments, and (ii) shopping
EMI loans.
Deferred payments are mostly observed for online transaction services such as
e-commerce, food delivery, e-grocery, online ticketing and utility bill payments.
These, like credit cards, offer a 15/30-day repayment period sans interest and also
allow customers to revolve payments to a later date by paying a fee.
In the shopping EMI category, higher loan amounts are provided with longer
repayment periods (3/6/12 months).
SBI CARD
EQUITY RESEARCH 22 06 June 2022
Examples of BNPL offerings
E-commerce: Amazon offers a Pay Later option whereby customers opting to pay
for purchases the following month are not charged, whereas interest applies if they
opt for EMI payment (ranging from 3 to 12 months). The minimum and maximum
loan disbursed under Amazon Pay Later varies according to the payment schedule.
For instance, customers who opt to pay in the next month (interest-free) have a
limit of Rs 10k. For repayment in three-month EMIs, customers can borrow
anywhere between Rs 3k and Rs 30k, which rises to Rs 6k and Rs 60k when
opting for six-month EMIs.
Bank-based: HDFCB offers its savings and current account customers a FlexiPay
option which they can use on purchases with partner merchants (including FlipKart,
MakeMyTrip, Myntra, Metro Shoes and Royal Oak Furniture). Here, the loan
amount can range from Rs 1k to Rs 20k at no extra cost on payment within 15
days. Beyond this, customers can choose an auto-debit repayment schedule of 30/
60/90 days at 28% p.a. interest. For instance, on purchases of Rs 3k, interest
would be charged at Rs 70/month. Non-payment or partial repayment of the
outstanding amount will attract a penalty of 3% plus 18% GST. There is a pre-
closure charge of 4% on the balance principal outstanding plus 18% GST.
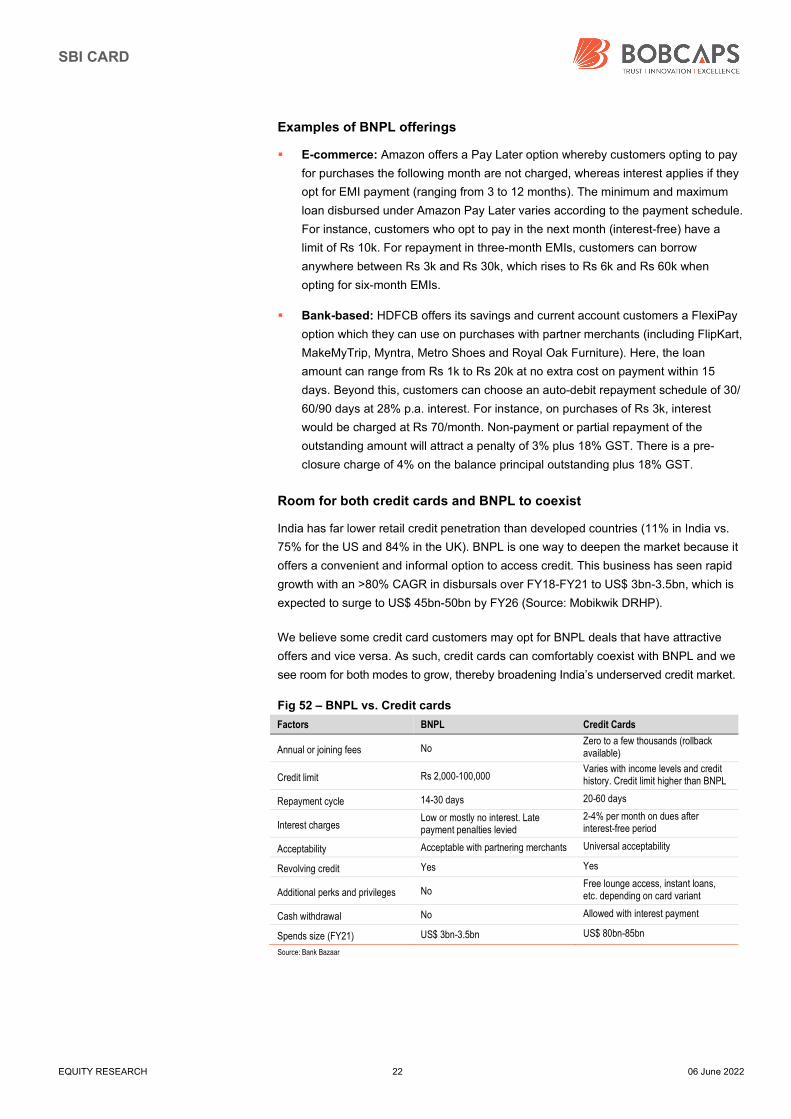
Room for both credit cards and BNPL to coexist
India has far lower retail credit penetration than developed countries (11% in India vs.
75% for the US and 84% in the UK). BNPL is one way to deepen the market because it
offers a convenient and informal option to access credit. This business has seen rapid
growth with an >80% CAGR in disbursals over FY18-FY21 to US$ 3bn-3.5bn, which is
expected to surge to US$ 45bn-50bn by FY26 (Source: Mobikwik DRHP).
We believe some credit card customers may opt for BNPL deals that have attractive
offers and vice versa. As such, credit cards can comfortably coexist with BNPL and we
see room for both modes to grow, thereby broadening India’s underserved credit market.
Fig 52 – BNPL vs. Credit cards
Factors BNPL Credit Cards
Annual or joining fees No Zero to a few thousands (rollback available)
Credit limit Rs 2,000-100,000 Varies with income levels and credit history. Credit limit higher than BNPL
Repayment cycle 14-30 days 20-60 days
Interest charges Low or mostly no interest. Late payment penalties levied
2-4% per month on dues after interest-free period
Acceptability Acceptable with partnering merchants Universal acceptability
Revolving credit Yes Yes
Additional perks and privileges No Free lounge access, instant loans, etc. depending on card variant
Cash withdrawal No Allowed with interest payment
Spends size (FY21) US$ 3bn-3.5bn US$ 80bn-85bn
Source: Bank Bazaar
SBI CARD
EQUITY RESEARCH 23 06 June 2022
Industry review
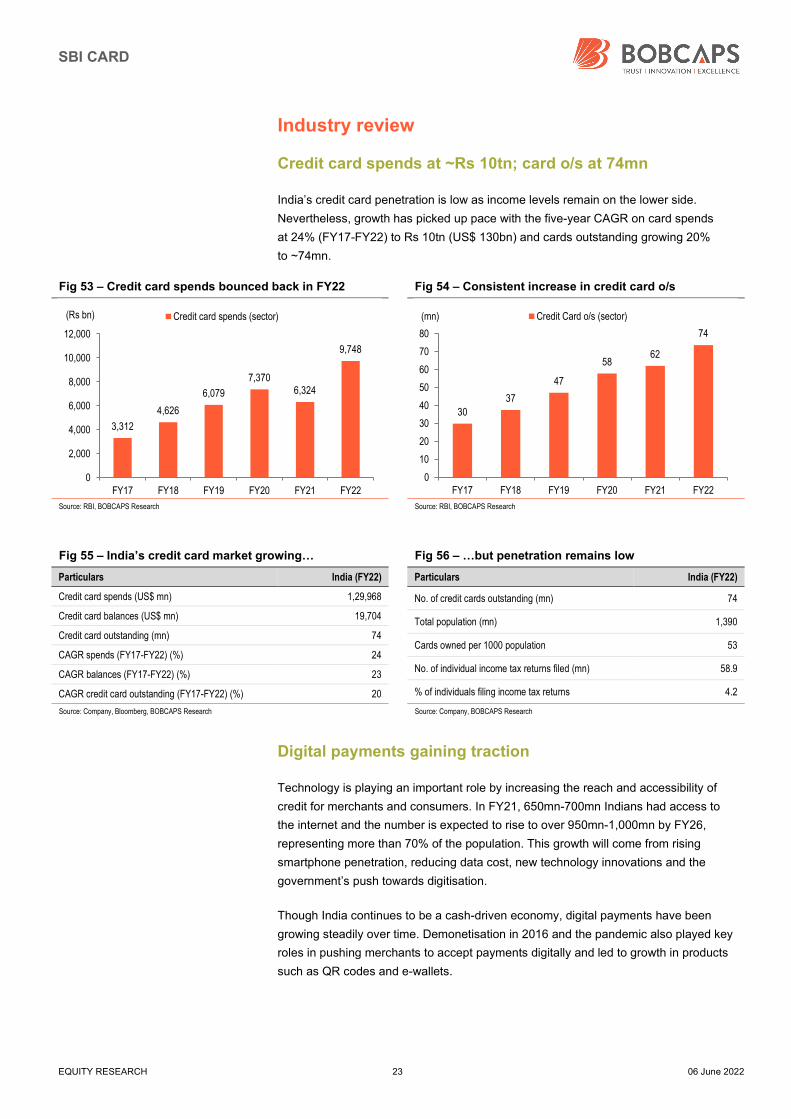
Credit card spends at ~Rs 10tn; card o/s at 74mn
India’s credit card penetration is low as income levels remain on the lower side.
Nevertheless, growth has picked up pace with the five-year CAGR on card spends
at 24% (FY17-FY22) to Rs 10tn (US$ 130bn) and cards outstanding growing 20%
to ~74mn.
Fig 53 – Credit card spends bounced back in FY22 Fig 54 – Consistent increase in credit card o/s
Source: RBI, BOBCAPS Research Source: RBI, BOBCAPS Research
Fig 55 – India’s credit card market growing… Fig 56 – …but penetration remains low
Particulars India (FY22)
Credit card spends (US$ mn) 1,29,968
Credit card balances (US$ mn) 19,704
Credit card outstanding (mn) 74
CAGR spends (FY17-FY22) (%) 24
CAGR balances (FY17-FY22) (%) 23
CAGR credit card outstanding (FY17-FY22) (%) 20
Particulars India (FY22)
No. of credit cards outstanding (mn) 74
Total population (mn) 1,390
Cards owned per 1000 population 53
No. of individual income tax returns filed (mn) 58.9
% of individuals filing income tax returns 4.2
Source: Company, Bloomberg, BOBCAPS Research Source: Company, BOBCAPS Research
Digital payments gaining traction
Technology is playing an important role by increasing the reach and accessibility of
credit for merchants and consumers. In FY21, 650mn-700mn Indians had access to
the internet and the number is expected to rise to over 950mn-1,000mn by FY26,
representing more than 70% of the population. This growth will come from rising
smartphone penetration, reducing data cost, new technology innovations and the
government’s push towards digitisation.
Though India continues to be a cash-driven economy, digital payments have been
growing steadily over time. Demonetisation in 2016 and the pandemic also played key
roles in pushing merchants to accept payments digitally and led to growth in products
such as QR codes and e-wallets.
3,312
4,626
6,079
7,3706,324
9,748
0
2,000
4,000
6,000
8,000
10,000
12,000
FY17 FY18 FY19 FY20 FY21 FY22
(Rs bn) Credit card spends (sector)
30
37
47
5862
74
0
10
20
30
40
50
60
70
80
FY17 FY18 FY19 FY20 FY21 FY22
(mn) Credit Card o/s (sector)
SBI CARD
EQUITY RESEARCH 24 06 June 2022
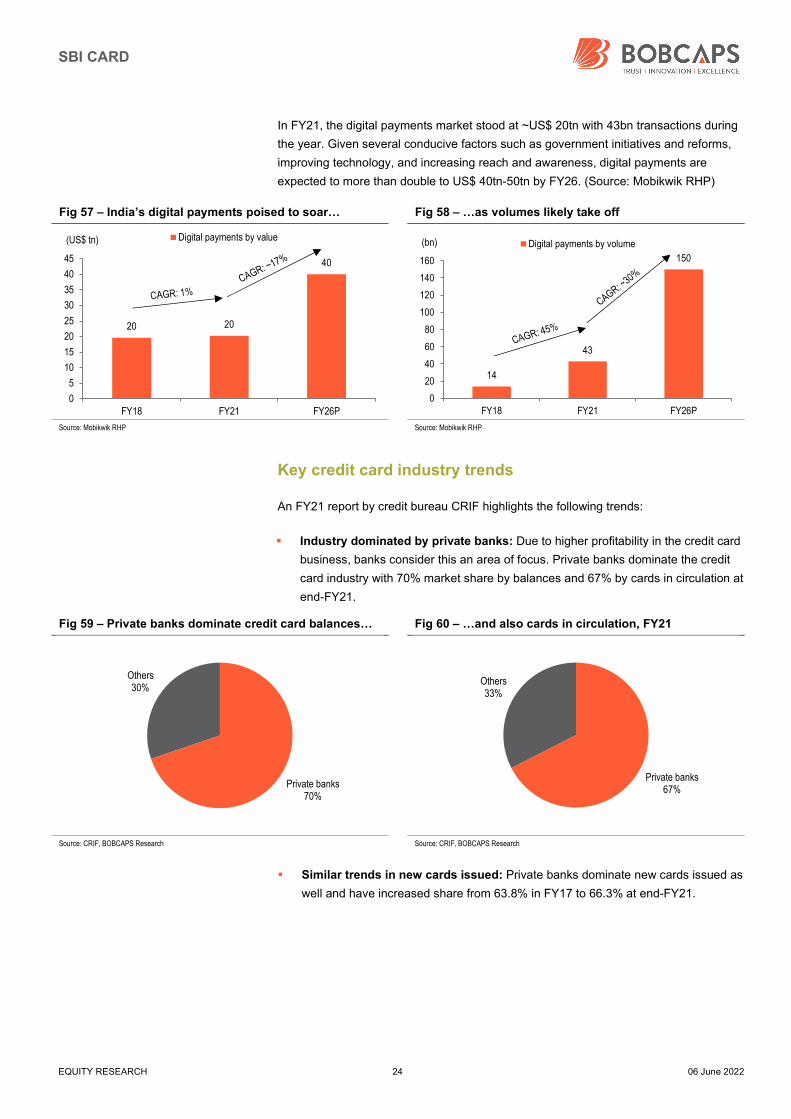
In FY21, the digital payments market stood at ~US$ 20tn with 43bn transactions during
the year. Given several conducive factors such as government initiatives and reforms,
improving technology, and increasing reach and awareness, digital payments are
expected to more than double to US$ 40tn-50tn by FY26. (Source: Mobikwik RHP)
Fig 57 – India’s digital payments poised to soar… Fig 58 – …as volumes likely take off
Source: Mobikwik RHP Source: Mobikwik RHP
Key credit card industry trends
An FY21 report by credit bureau CRIF highlights the following trends:
Industry dominated by private banks: Due to higher profitability in the credit card
business, banks consider this an area of focus. Private banks dominate the credit
card industry with 70% market share by balances and 67% by cards in circulation at
end-FY21.
Fig 59 – Private banks dominate credit card balances… Fig 60 – …and also cards in circulation, FY21
Source: CRIF, BOBCAPS Research Source: CRIF, BOBCAPS Research
Similar trends in new cards issued: Private banks dominate new cards issued as
well and have increased share from 63.8% in FY17 to 66.3% at end-FY21.
20 20
40
0
5
10
15
20
25
30
35
40
45
FY18 FY21 FY26P
(US$ tn) Digital payments by value
14
43
150
0
20
40
60
80
100
120
140
160
FY18 FY21 FY26P
(bn) Digital payments by volume
Private banks70%
Others30%
Private banks67%
Others33%
SBI CARD
EQUITY RESEARCH 25 06 June 2022
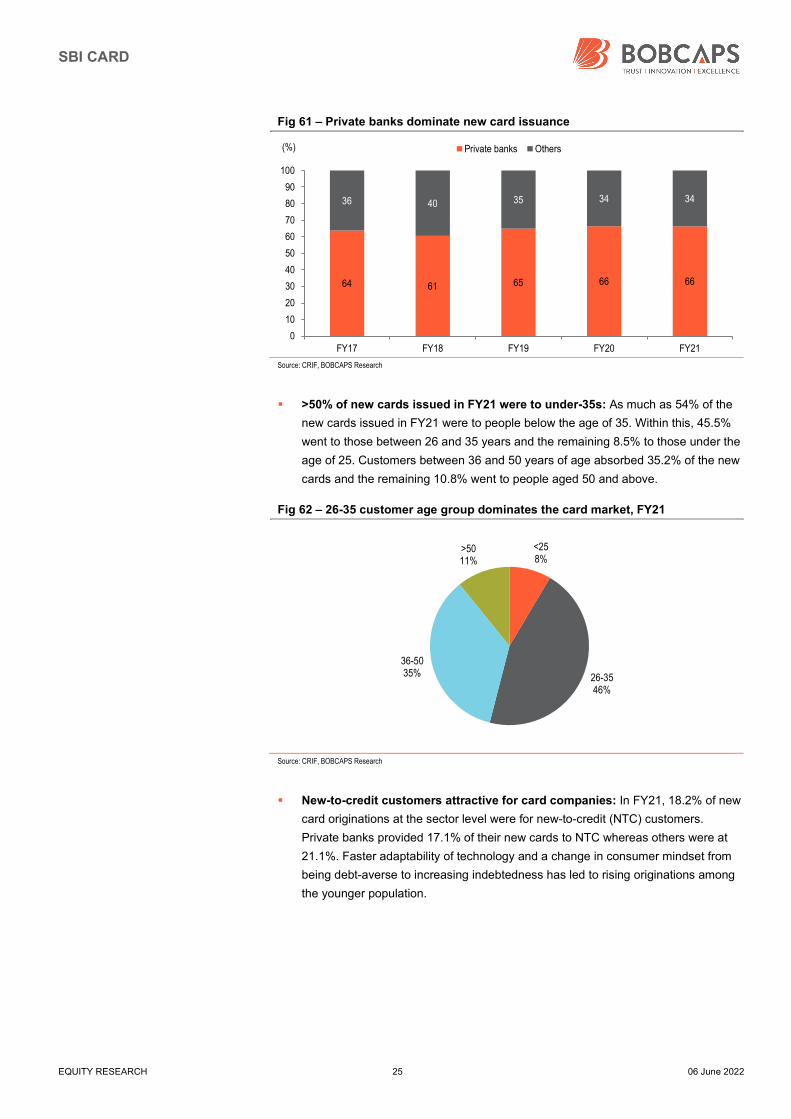
Fig 61 – Private banks dominate new card issuance
Source: CRIF, BOBCAPS Research
>50% of new cards issued in FY21 were to under-35s: As much as 54% of the
new cards issued in FY21 were to people below the age of 35. Within this, 45.5%
went to those between 26 and 35 years and the remaining 8.5% to those under the
age of 25. Customers between 36 and 50 years of age absorbed 35.2% of the new
cards and the remaining 10.8% went to people aged 50 and above.
Fig 62 – 26-35 customer age group dominates the card market, FY21
Source: CRIF, BOBCAPS Research
New-to-credit customers attractive for card companies: In FY21, 18.2% of new
card originations at the sector level were for new-to-credit (NTC) customers.
Private banks provided 17.1% of their new cards to NTC whereas others were at
21.1%. Faster adaptability of technology and a change in consumer mindset from
being debt-averse to increasing indebtedness has led to rising originations among
the younger population.
64 61 65 66 66
36 40 35 34 34
0
10
20
30
40
50
60
70
80
90
100
FY17 FY18 FY19 FY20 FY21
(%) Private banks Others
<258%
26-3546%
36-5035%
>5011%
SBI CARD
EQUITY RESEARCH 26 06 June 2022
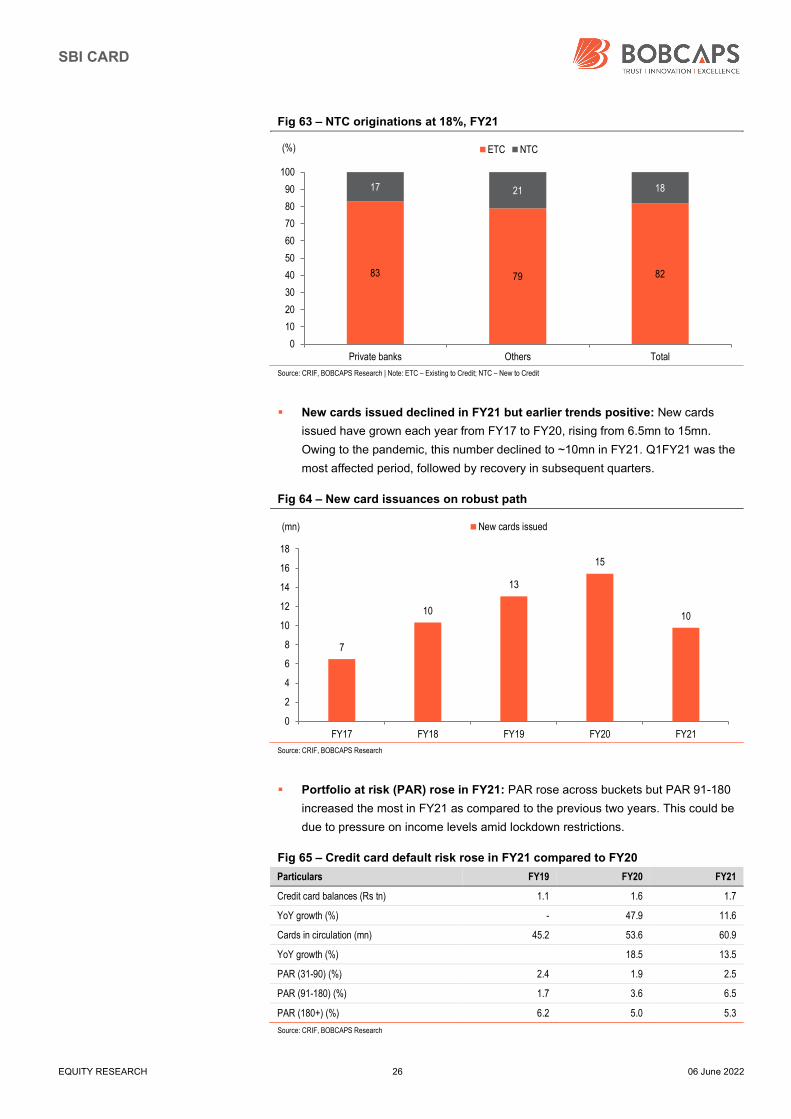
Fig 63 – NTC originations at 18%, FY21
Source: CRIF, BOBCAPS Research | Note: ETC – Existing to Credit; NTC – New to Credit
New cards issued declined in FY21 but earlier trends positive: New cards
issued have grown each year from FY17 to FY20, rising from 6.5mn to 15mn.
Owing to the pandemic, this number declined to ~10mn in FY21. Q1FY21 was the
most affected period, followed by recovery in subsequent quarters.
Fig 64 – New card issuances on robust path
Source: CRIF, BOBCAPS Research
Portfolio at risk (PAR) rose in FY21: PAR rose across buckets but PAR 91-180
increased the most in FY21 as compared to the previous two years. This could be
due to pressure on income levels amid lockdown restrictions.
Fig 65 – Credit card default risk rose in FY21 compared to FY20
Particulars FY19 FY20 FY21
Credit card balances (Rs tn) 1.1 1.6 1.7
YoY growth (%) - 47.9 11.6
Cards in circulation (mn) 45.2 53.6 60.9
YoY growth (%) 18.5 13.5
PAR (31-90) (%) 2.4 1.9 2.5
PAR (91-180) (%) 1.7 3.6 6.5
PAR (180+) (%) 6.2 5.0 5.3
Source: CRIF, BOBCAPS Research
83 79 82
17 21 18
0
10
20
30
40
50
60
70
80
90
100
Private banks Others Total
(%) ETC NTC
7
10
13
15
10
0
2
4
6
8
10
12
14
16
18
FY17 FY18 FY19 FY20 FY21
(mn) New cards issued
SBI CARD
EQUITY RESEARCH 27 06 June 2022
CRIF in its Apr’20 report highlighted the following behavioural trends:
Young customers have lower outstandings: Customers aged 18-25 have
comparatively lower outstanding card balances owing to limited purchasing
capacities. As of Sep’19, just 3% (Rs 28bn) of outstanding balances were in this
group. As income levels rise and stabilise, balances increase sharply. Customers
aged 36-50 have the highest levels, at 43% (Rs 412bn). Beyond the age of 50,
balances reduce as borrowers turn more cautious and begin to restrict card usage
to accommodate future needs, post retirement. As of Sep’19, 35% of the inactive/
closed cards were from the age segment over 50 years.
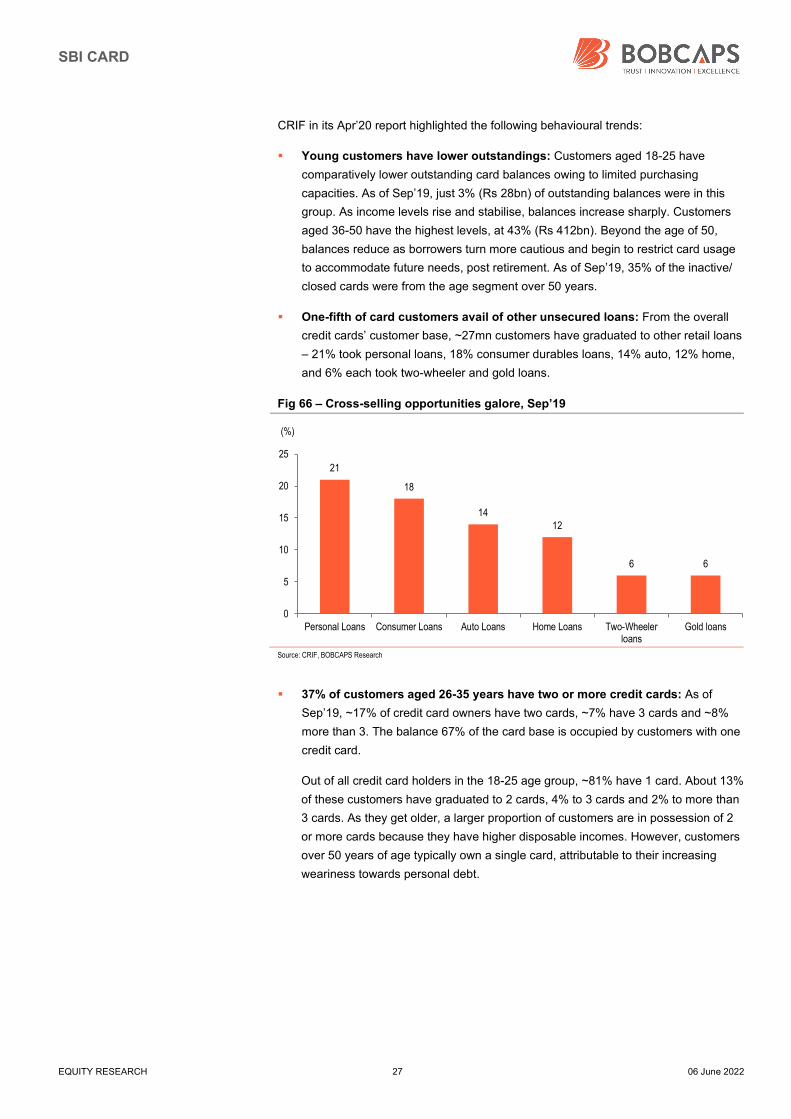
One-fifth of card customers avail of other unsecured loans: From the overall
credit cards’ customer base, ~27mn customers have graduated to other retail loans
– 21% took personal loans, 18% consumer durables loans, 14% auto, 12% home,
and 6% each took two-wheeler and gold loans.
Fig 66 – Cross-selling opportunities galore, Sep’19
Source: CRIF, BOBCAPS Research
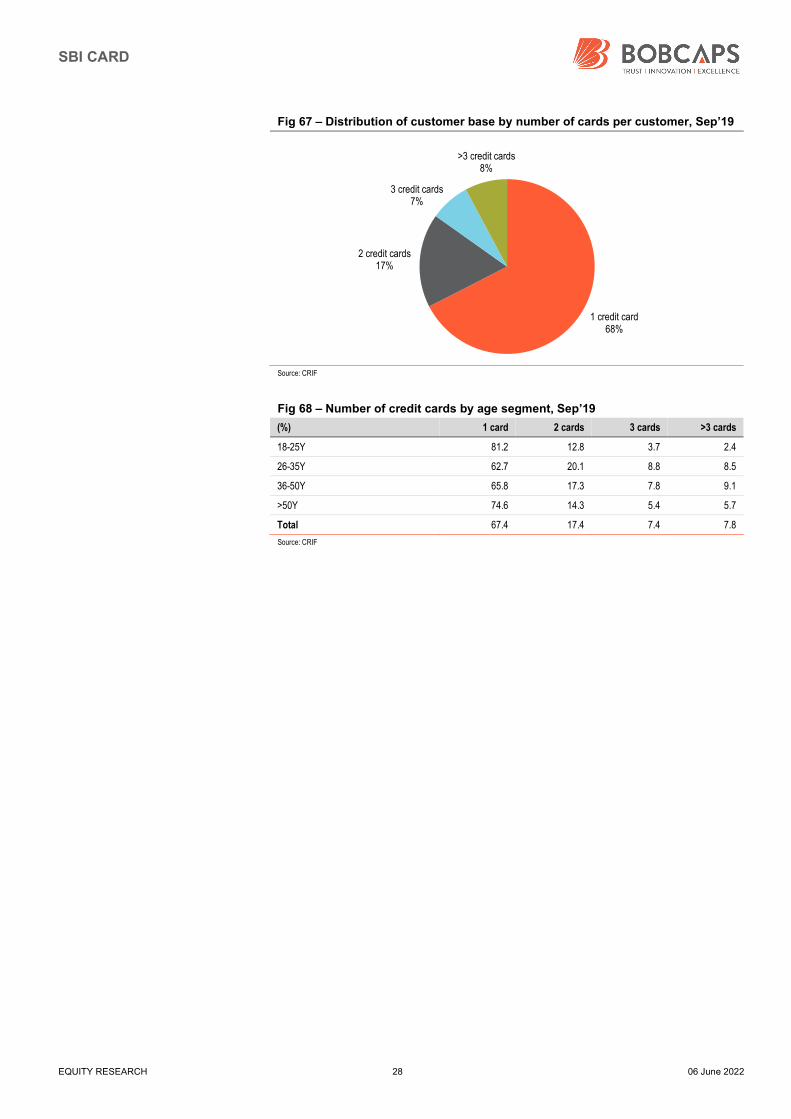
37% of customers aged 26-35 years have two or more credit cards: As of
Sep’19, ~17% of credit card owners have two cards, ~7% have 3 cards and ~8%
more than 3. The balance 67% of the card base is occupied by customers with one
credit card.
Out of all credit card holders in the 18-25 age group, ~81% have 1 card. About 13%
of these customers have graduated to 2 cards, 4% to 3 cards and 2% to more than
3 cards. As they get older, a larger proportion of customers are in possession of 2
or more cards because they have higher disposable incomes. However, customers
over 50 years of age typically own a single card, attributable to their increasing
weariness towards personal debt.
21
18
1412
6 6
0
5
10
15
20
25
Personal Loans Consumer Loans Auto Loans Home Loans Two-Wheelerloans
Gold loans
(%)
SBI CARD
EQUITY RESEARCH 28 06 June 2022
Fig 67 – Distribution of customer base by number of cards per customer, Sep’19
Source: CRIF
Fig 68 – Number of credit cards by age segment, Sep’19
(%) 1 card 2 cards 3 cards >3 cards
18-25Y 81.2 12.8 3.7 2.4
26-35Y 62.7 20.1 8.8 8.5
36-50Y 65.8 17.3 7.8 9.1
>50Y 74.6 14.3 5.4 5.7
Total 67.4 17.4 7.4 7.8
Source: CRIF
1 credit card68%
2 credit cards17%
3 credit cards7%
>3 credit cards8%
SBI CARD
EQUITY RESEARCH 29 06 June 2022
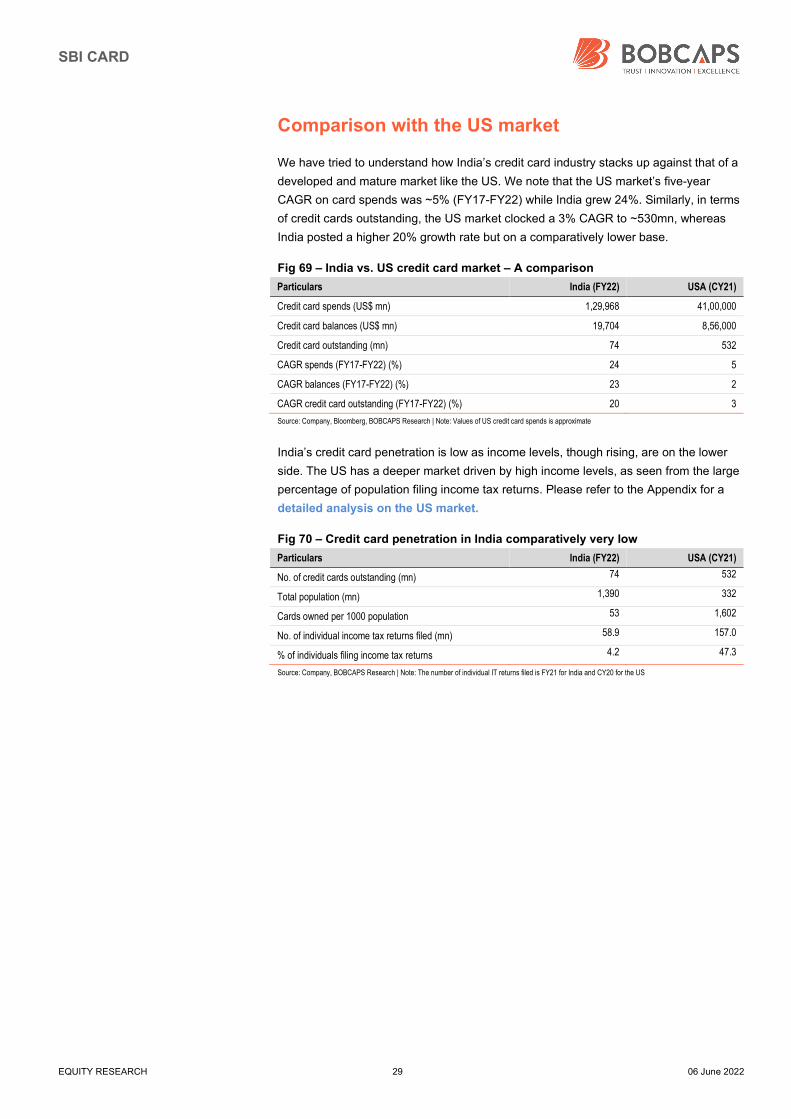
Comparison with the US market
We have tried to understand how India’s credit card industry stacks up against that of a
developed and mature market like the US. We note that the US market’s five-year
CAGR on card spends was ~5% (FY17-FY22) while India grew 24%. Similarly, in terms
of credit cards outstanding, the US market clocked a 3% CAGR to ~530mn, whereas
India posted a higher 20% growth rate but on a comparatively lower base.
Fig 69 – India vs. US credit card market – A comparison
Particulars India (FY22) USA (CY21)
Credit card spends (US$ mn) 1,29,968 41,00,000
Credit card balances (US$ mn) 19,704 8,56,000
Credit card outstanding (mn) 74 532
CAGR spends (FY17-FY22) (%) 24 5
CAGR balances (FY17-FY22) (%) 23 2
CAGR credit card outstanding (FY17-FY22) (%) 20 3
Source: Company, Bloomberg, BOBCAPS Research | Note: Values of US credit card spends is approximate
India’s credit card penetration is low as income levels, though rising, are on the lower
side. The US has a deeper market driven by high income levels, as seen from the large
percentage of population filing income tax returns. Please refer to the Appendix for a
detailed analysis on the US market.
Fig 70 – Credit card penetration in India comparatively very low
Particulars India (FY22) USA (CY21)
No. of credit cards outstanding (mn) 74 532
Total population (mn) 1,390 332
Cards owned per 1000 population 53 1,602
No. of individual income tax returns filed (mn) 58.9 157.0
% of individuals filing income tax returns 4.2 47.3
Source: Company, BOBCAPS Research | Note: The number of individual IT returns filed is FY21 for India and CY20 for the US
SBI CARD
EQUITY RESEARCH 30 06 June 2022
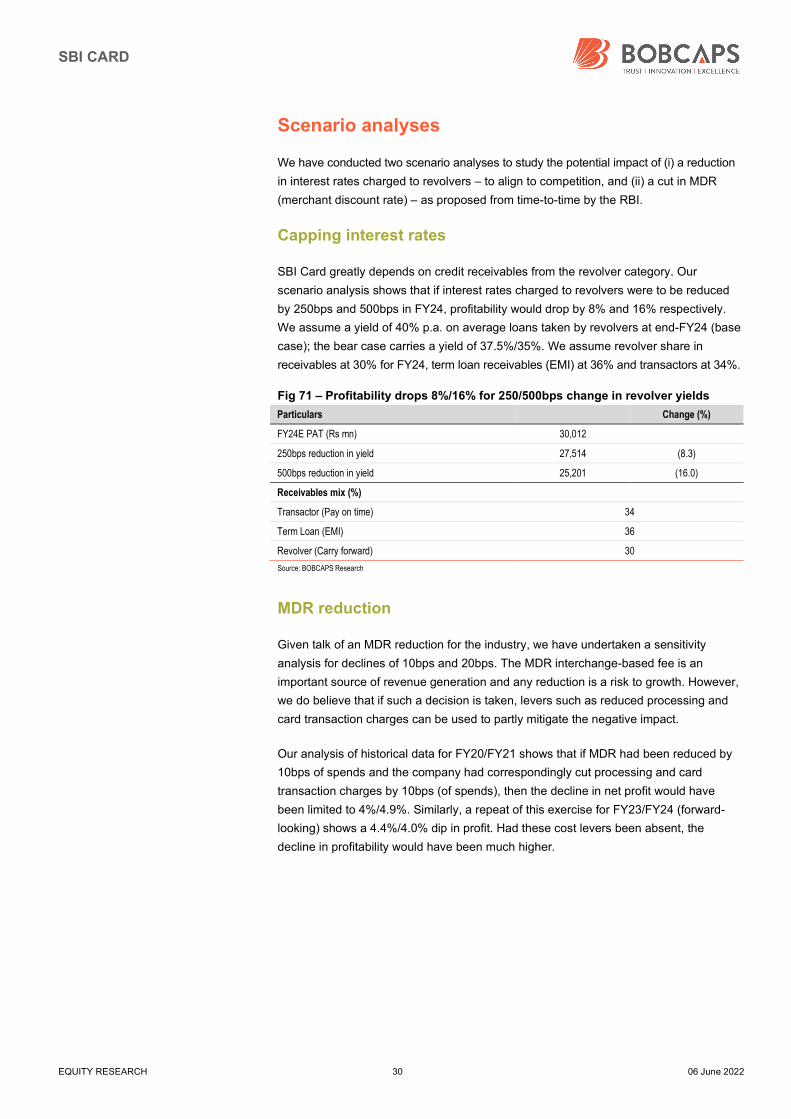
Scenario analyses
We have conducted two scenario analyses to study the potential impact of (i) a reduction
in interest rates charged to revolvers – to align to competition, and (ii) a cut in MDR
(merchant discount rate) – as proposed from time-to-time by the RBI.
Capping interest rates
SBI Card greatly depends on credit receivables from the revolver category. Our
scenario analysis shows that if interest rates charged to revolvers were to be reduced
by 250bps and 500bps in FY24, profitability would drop by 8% and 16% respectively.
We assume a yield of 40% p.a. on average loans taken by revolvers at end-FY24 (base
case); the bear case carries a yield of 37.5%/35%. We assume revolver share in
receivables at 30% for FY24, term loan receivables (EMI) at 36% and transactors at 34%.
Fig 71 – Profitability drops 8%/16% for 250/500bps change in revolver yields
Particulars Change (%)
FY24E PAT (Rs mn) 30,012
250bps reduction in yield 27,514 (8.3)
500bps reduction in yield 25,201 (16.0)
Receivables mix (%)
Transactor (Pay on time) 34
Term Loan (EMI) 36
Revolver (Carry forward) 30
Source: BOBCAPS Research
MDR reduction
Given talk of an MDR reduction for the industry, we have undertaken a sensitivity
analysis for declines of 10bps and 20bps. The MDR interchange-based fee is an
important source of revenue generation and any reduction is a risk to growth. However,
we do believe that if such a decision is taken, levers such as reduced processing and
card transaction charges can be used to partly mitigate the negative impact.
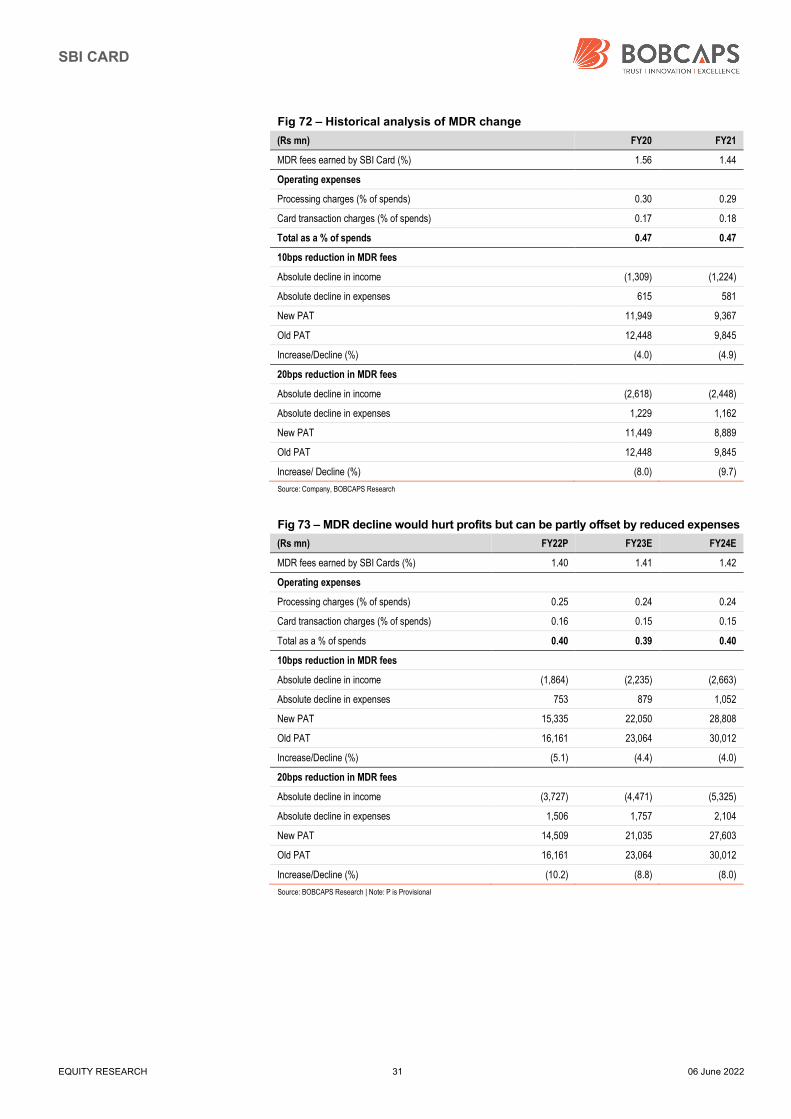
Our analysis of historical data for FY20/FY21 shows that if MDR had been reduced by
10bps of spends and the company had correspondingly cut processing and card
transaction charges by 10bps (of spends), then the decline in net profit would have
been limited to 4%/4.9%. Similarly, a repeat of this exercise for FY23/FY24 (forward-
looking) shows a 4.4%/4.0% dip in profit. Had these cost levers been absent, the
decline in profitability would have been much higher.
SBI CARD
EQUITY RESEARCH 31 06 June 2022
Fig 72 – Historical analysis of MDR change
(Rs mn) FY20 FY21
MDR fees earned by SBI Card (%) 1.56 1.44
Operating expenses
Processing charges (% of spends) 0.30 0.29
Card transaction charges (% of spends) 0.17 0.18
Total as a % of spends 0.47 0.47
10bps reduction in MDR fees
Absolute decline in income (1,309) (1,224)
Absolute decline in expenses 615 581
New PAT 11,949 9,367
Old PAT 12,448 9,845
Increase/Decline (%) (4.0) (4.9)
20bps reduction in MDR fees
Absolute decline in income (2,618) (2,448)
Absolute decline in expenses 1,229 1,162
New PAT 11,449 8,889
Old PAT 12,448 9,845
Increase/ Decline (%) (8.0) (9.7)
Source: Company, BOBCAPS Research
Fig 73 – MDR decline would hurt profits but can be partly offset by reduced expenses
(Rs mn) FY22P FY23E FY24E
MDR fees earned by SBI Cards (%) 1.40 1.41 1.42
Operating expenses
Processing charges (% of spends) 0.25 0.24 0.24
Card transaction charges (% of spends) 0.16 0.15 0.15
Total as a % of spends 0.40 0.39 0.40
10bps reduction in MDR fees
Absolute decline in income (1,864) (2,235) (2,663)
Absolute decline in expenses 753 879 1,052
New PAT 15,335 22,050 28,808
Old PAT 16,161 23,064 30,012
Increase/Decline (%) (5.1) (4.4) (4.0)
20bps reduction in MDR fees
Absolute decline in income (3,727) (4,471) (5,325)
Absolute decline in expenses 1,506 1,757 2,104
New PAT 14,509 21,035 27,603
Old PAT 16,161 23,064 30,012
Increase/Decline (%) (10.2) (8.8) (8.0)
Source: BOBCAPS Research | Note: P is Provisional
SBI CARD
EQUITY RESEARCH 32 06 June 2022
Valuation
We remain positive on credit card growth in India given the government’s push for
digital transactions and growing internet reach. Demonetisation and Covid-19 have also
lent a fillip to the cashless mode of transactions. SBI Card is the only listed credit card
player in India and in a strong position to grow, backed by a wide array of offerings,
including co-branded cards, that drive robust spends. The company derives key
synergistic benefits from parent SBIN, including access to an extensive branch network
and ready customer base with high cross-sell opportunities. We believe revenue from
interest income and varied fee streams will gather pace as economic activity picks up.
In our view, pandemic-led pressure on financials is largely behind us and hence we
expect the company to clock a strong 32% EPS CAGR over FY22-FY25. We also
model for improvement in ROAA/ROAE to 6.0%/26.2% in FY23 and 6.4%/26.9% in
FY24. The stock is currently trading at attractive valuations of 24x FY24E P/E. We value
SBI Card at ~36x FY24E P/E which yields a TP of Rs 1,137, and initiate coverage with
a BUY rating for a potential upside of 47%. Our residual income model yields a similar
target price.
Fig 74 – Residual income model: Key assumptions
Parameter (%)
Risk-free rate 7.3
Cost of equity 11.8
Terminal growth rate 5.5
Source: Company, BOBCAPS Research
Fig 75 – Residual income model: Valuation summary
Business (Rs mn)
PV of Residual Income 10,08,170
Current Book Value 77,527
Estimated Market Value 10,85,697
Shares 951
Estimated Price Per Share (Rs) 1,142
Source: BOBCAPS Research
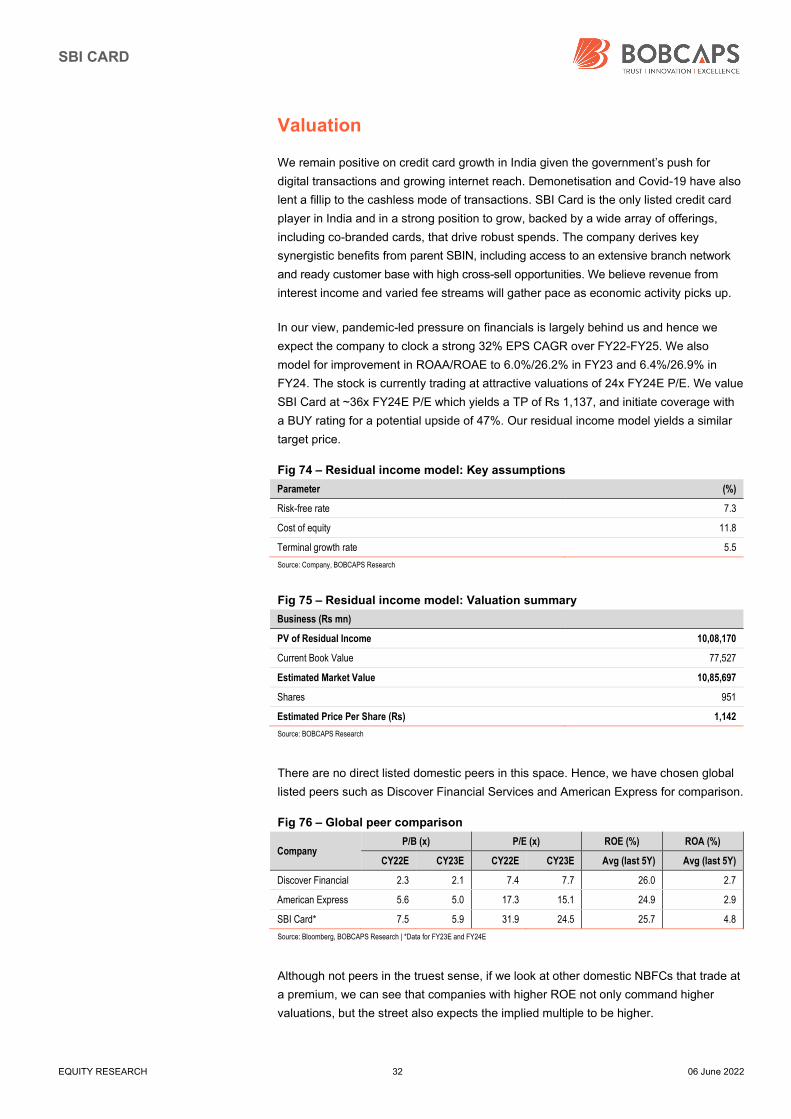
There are no direct listed domestic peers in this space. Hence, we have chosen global
listed peers such as Discover Financial Services and American Express for comparison.
Fig 76 – Global peer comparison
Company P/B (x) P/E (x) ROE (%) ROA (%)
CY22E CY23E CY22E CY23E Avg (last 5Y) Avg (last 5Y)
Discover Financial 2.3 2.1 7.4 7.7 26.0 2.7
American Express 5.6 5.0 17.3 15.1 24.9 2.9
SBI Card* 7.5 5.9 31.9 24.5 25.7 4.8
Source: Bloomberg, BOBCAPS Research | *Data for FY23E and FY24E
Although not peers in the truest sense, if we look at other domestic NBFCs that trade at
a premium, we can see that companies with higher ROE not only command higher
valuations, but the street also expects the implied multiple to be higher.
SBI CARD
EQUITY RESEARCH 33 06 June 2022
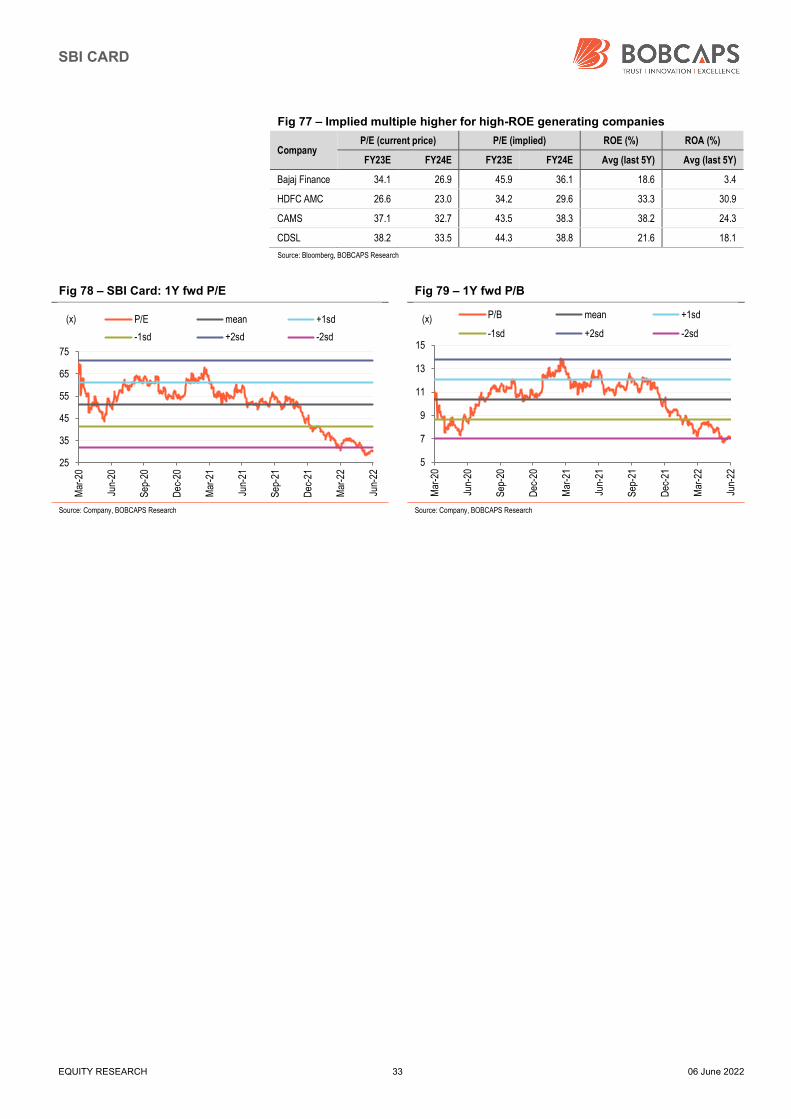
Fig 77 – Implied multiple higher for high-ROE generating companies
Company P/E (current price) P/E (implied) ROE (%) ROA (%)
FY23E FY24E FY23E FY24E Avg (last 5Y) Avg (last 5Y)
Bajaj Finance 34.1 26.9 45.9 36.1 18.6 3.4
HDFC AMC 26.6 23.0 34.2 29.6 33.3 30.9
CAMS 37.1 32.7 43.5 38.3 38.2 24.3
CDSL 38.2 33.5 44.3 38.8 21.6 18.1
Source: Bloomberg, BOBCAPS Research
Fig 78 – SBI Card: 1Y fwd P/E Fig 79 – 1Y fwd P/B
Source: Company, BOBCAPS Research Source: Company, BOBCAPS Research
25
35
45
55
65
75
Mar
-20
Jun-
20
Sep
-20
Dec
-20
Mar
-21
Jun-
21
Sep
-21
Dec
-21
Mar
-22
Jun-
22
(x) P/E mean +1sd
-1sd +2sd -2sd
5
7
9
11
13
15
Mar
-20
Jun-
20
Sep
-20
Dec
-20
Mar
-21
Jun-
21
Sep
-21
Dec
-21
Mar
-22
Jun-
22
(x) P/B mean +1sd
-1sd +2sd -2sd
SBI CARD
EQUITY RESEARCH 34 06 June 2022
Key risks
UPI gaining market share
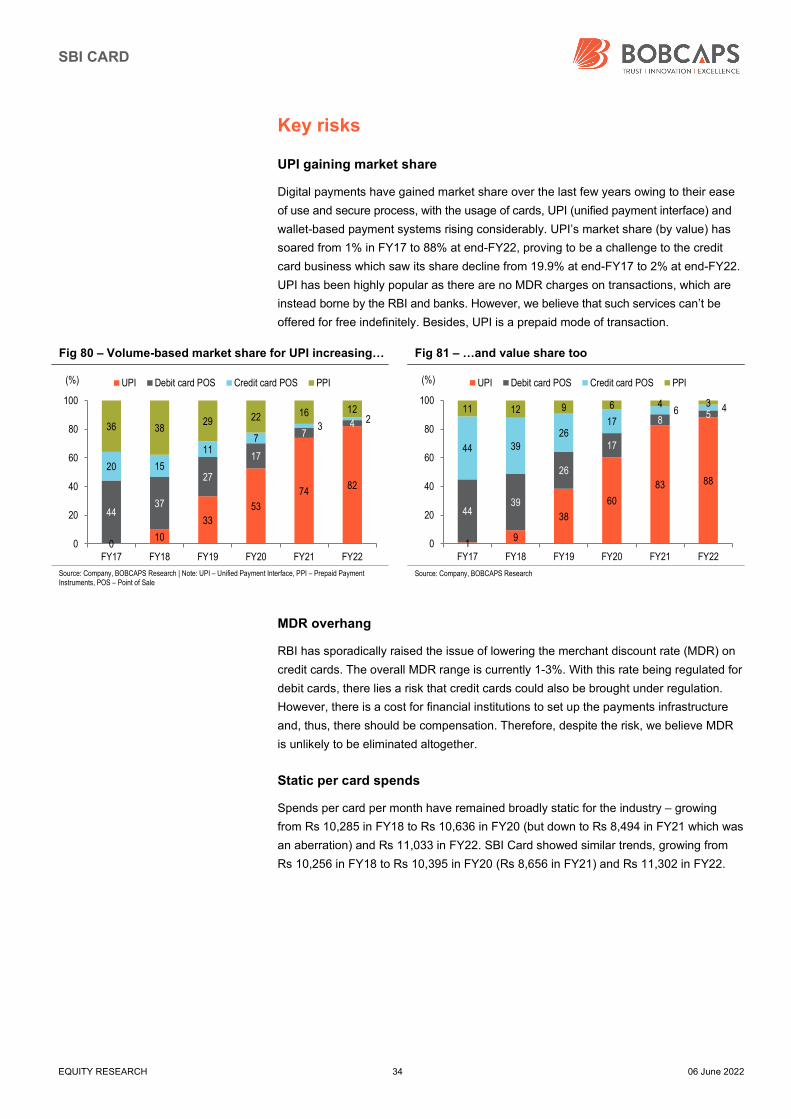
Digital payments have gained market share over the last few years owing to their ease
of use and secure process, with the usage of cards, UPI (unified payment interface) and
wallet-based payment systems rising considerably. UPI’s market share (by value) has
soared from 1% in FY17 to 88% at end-FY22, proving to be a challenge to the credit
card business which saw its share decline from 19.9% at end-FY17 to 2% at end-FY22.
UPI has been highly popular as there are no MDR charges on transactions, which are
instead borne by the RBI and banks. However, we believe that such services can’t be
offered for free indefinitely. Besides, UPI is a prepaid mode of transaction.
Fig 80 – Volume-based market share for UPI increasing… Fig 81 – …and value share too
Source: Company, BOBCAPS Research | Note: UPI – Unified Payment Interface, PPI – Prepaid Payment Instruments, POS – Point of Sale
Source: Company, BOBCAPS Research
MDR overhang
RBI has sporadically raised the issue of lowering the merchant discount rate (MDR) on
credit cards. The overall MDR range is currently 1-3%. With this rate being regulated for
debit cards, there lies a risk that credit cards could also be brought under regulation.
However, there is a cost for financial institutions to set up the payments infrastructure
and, thus, there should be compensation. Therefore, despite the risk, we believe MDR
is unlikely to be eliminated altogether.
Static per card spends
Spends per card per month have remained broadly static for the industry – growing
from Rs 10,285 in FY18 to Rs 10,636 in FY20 (but down to Rs 8,494 in FY21 which was
an aberration) and Rs 11,033 in FY22. SBI Card showed similar trends, growing from
Rs 10,256 in FY18 to Rs 10,395 in FY20 (Rs 8,656 in FY21) and Rs 11,302 in FY22.
010
33
53
7482
4437
27
17
74
20 15
117
32
36 3829 22 16 12
0
20
40
60
80
100
FY17 FY18 FY19 FY20 FY21 FY22
(%) UPI Debit card POS Credit card POS PPI
19
38
60
83 88
4439
26
17
85
44 39
2617
6 411 12 9 6 4 3
0
20
40
60
80
100
FY17 FY18 FY19 FY20 FY21 FY22
(%) UPI Debit card POS Credit card POS PPI
SBI CARD
EQUITY RESEARCH 35 06 June 2022
Other risks
Any modification of terms with the parent or SBIN lowering its stake further could
be detrimental to growth. SBI Card is required to pay a royalty fee of 2% of PAT or
0.2% of total income, whichever is higher, to SBIN within two months of the end of
every financial year.
Technology plays an important part in the credit card business. With the increased
use of digital payments, there is a constant risk of cyberattacks which could disrupt
day-to-day operations. This apart, RBI is very strict about customer data storage
which could lead to restrictions on sourcing new clients, as was recently seen with
a leading card player. Although these matters get resolved eventually, there could
be business losses in the interim.
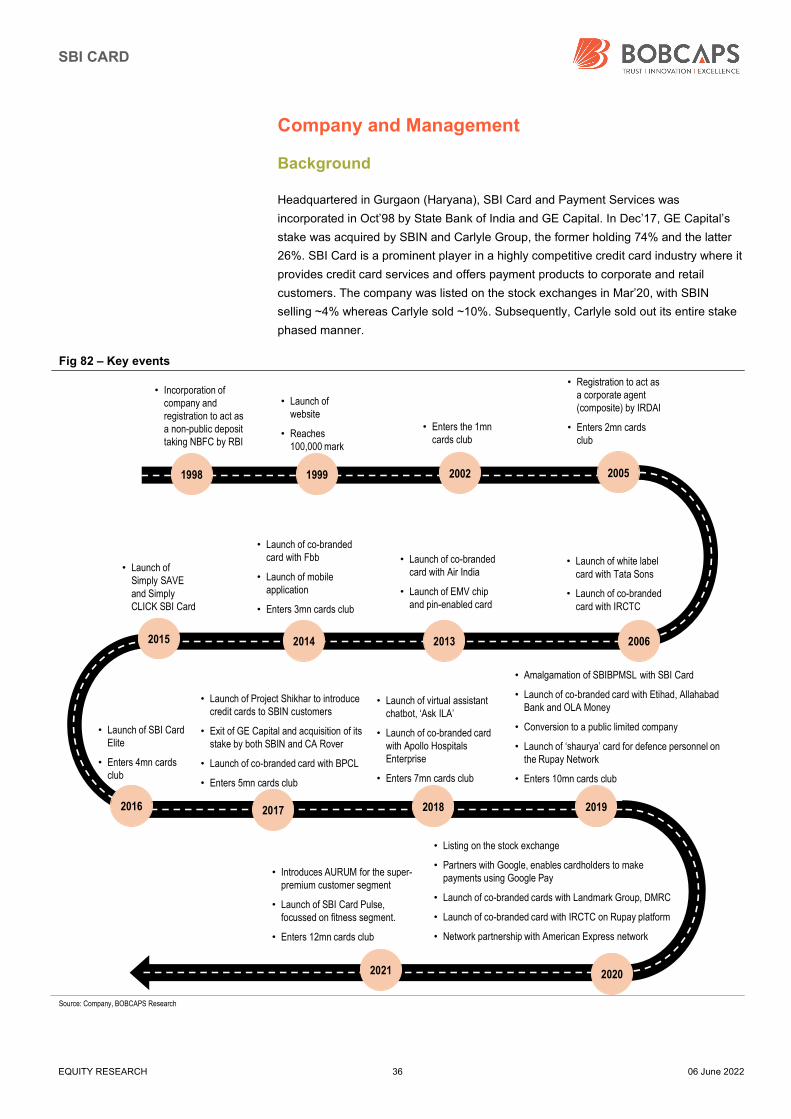
SBI CARD
EQUITY RESEARCH 36 06 June 2022
Company and Management
Background
Headquartered in Gurgaon (Haryana), SBI Card and Payment Services was
incorporated in Oct’98 by State Bank of India and GE Capital. In Dec’17, GE Capital’s
stake was acquired by SBIN and Carlyle Group, the former holding 74% and the latter
26%. SBI Card is a prominent player in a highly competitive credit card industry where it
provides credit card services and offers payment products to corporate and retail
customers. The company was listed on the stock exchanges in Mar’20, with SBIN
selling ~4% whereas Carlyle sold ~10%. Subsequently, Carlyle sold out its entire stake
phased manner.
Fig 82 – Key events
Source: Company, BOBCAPS Research
• Incorporation of company and registration to act as a non-public deposit taking NBFC by RBI
1999
• Launch of website
• Reaches 100,000 mark
• Enters the 1mn cards club
• Registration to act as a corporate agent (composite) by IRDAI
• Enters 2mn cards club
1998 2002
20132014
• Launch of white label card with Tata Sons
• Launch of co-branded card with IRCTC
• Launch of co-branded card with Air India
• Launch of EMV chip and pin-enabled card
• Launch of co-branded card with Fbb
• Launch of mobile application
• Enters 3mn cards club
• Launch of Simply SAVE and Simply CLICK SBI Card
2017 2018
• Launch of SBI Card Elite
• Enters 4mn cards club
• Launch of Project Shikhar to introduce credit cards to SBIN customers
• Exit of GE Capital and acquisition of its stake by both SBIN and CA Rover
• Launch of co-branded card with BPCL
• Enters 5mn cards club
• Launch of virtual assistant chatbot, ‘Ask ILA’
• Launch of co-branded card with Apollo Hospitals Enterprise
• Enters 7mn cards club
• Amalgamation of SBIBPMSL with SBI Card
• Launch of co-branded card with Etihad, Allahabad Bank and OLA Money
• Conversion to a public limited company
• Launch of ‘shaurya’ card for defence personnel on the Rupay Network
• Enters 10mn cards club
• Listing on the stock exchange
• Partners with Google, enables cardholders to make payments using Google Pay
• Launch of co-branded cards with Landmark Group, DMRC
• Launch of co-branded card with IRCTC on Rupay platform
• Network partnership with American Express network
2021
• Introduces AURUM for the super-premium customer segment
• Launch of SBI Card Pulse, focussed on fitness segment.
• Enters 12mn cards club
20062015
2016
2020
2019
2005
SBI CARD
EQUITY RESEARCH 37 06 June 2022
Management
Rama Mohan Rao Amara – Managing Director and Chief Executive Officer, was
appointed effective Jan’21. He is an engineering graduate and also has financial
accreditations from CFA and FRM and is a Certified Associate of Indian Institute of
Bankers (CAIIB). He has three decades of experience working with SBIN, including
as Chief General Manager, Bhopal Circle, where he looked after two states, namely,
Madhya Pradesh and Chhattisgarh. Prior to that he served as the Chief General
Manager, Financial Control, at SBI Corporate Centre in Mumbai. At the international
level, he managed key assignments for SBIN in markets like Singapore and the US.
Richhpal Singh – Chief Operating Officer, joined the company in Dec’17. He has
done his B.A. from Maharshi Dayanand University, Rohtak. He was associated with
the erstwhile SBIBPMSL (previously known as GE Capital Business Process
Management Services) since Dec’17, which was amalgamated with SBI Card in
2018. He was previously associated with Jio Payments Bank and SBIN.
Aparna Kuppuswamy – Executive VP and Chief Risk Officer, holds a Master’s
degree in Finance and Control from the University of Delhi. She was associated
with GE Money Financial Services for a year and transferred to SBI Card in Apr’09.
She was previously associated with American Express Financial Advisors, Bank of
America and ABN AMRO Bank.
Manish Dewan – Executive VP and Chief Sales Officer, holds a Bachelor’s
degree in Engineering (Mechanical) from Panjab University and a Postgraduate
Diploma in Management from Indian Institute of Management Society, Lucknow.
He was associated with the erstwhile SBIBPMSL (previously known as GE Capital
Business Process Management Services) for five years and was transferred to the
company in Oct’11. Prior to that he was associated with Standard Chartered Bank
and American Express Bank.
Dinesh Kumar Khara – Chairman, holds Bachelor’s and Master’s degrees in
Commerce and a Master’s degree in Business Administration. He is also a Certified
Associate of Indian Institute of Bankers (CAIIB). He is the Chairman of SBIN and
has held several key positions in the bank such as MD (Global Banking &
Subsidiaries), MD (Associates & Subsidiaries), MD & CEO (SBI Mutual Funds) and
Chief General Manager – Bhopal Circle. He was also posted in Chicago for an
overseas assignment.
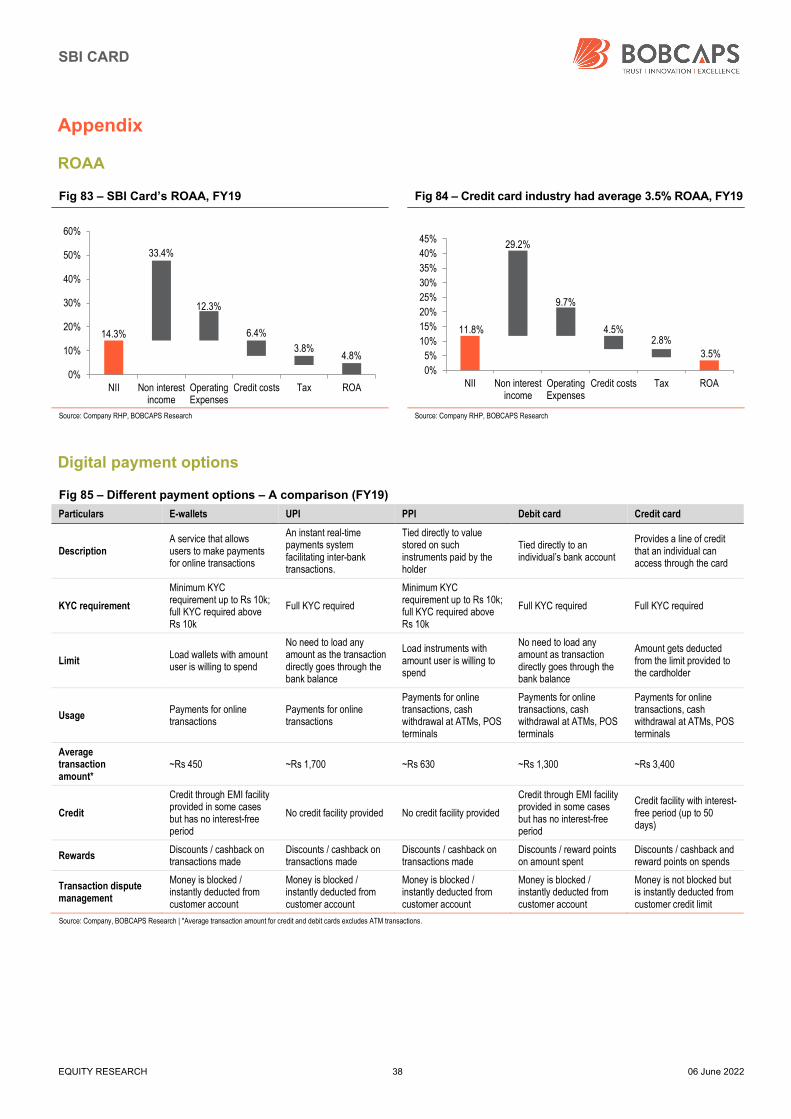
SBI CARD
EQUITY RESEARCH 38 06 June 2022
Appendix
ROAA
Fig 83 – SBI Card’s ROAA, FY19 Fig 84 – Credit card industry had average 3.5% ROAA, FY19
Source: Company RHP, BOBCAPS Research Source: Company RHP, BOBCAPS Research
Digital payment options
Fig 85 – Different payment options – A comparison (FY19)
Particulars E-wallets UPI PPI Debit card Credit card
Description A service that allows users to make payments for online transactions
An instant real-time payments system facilitating inter-bank transactions.
Tied directly to value stored on such instruments paid by the holder
Tied directly to an individual’s bank account
Provides a line of credit that an individual can access through the card
KYC requirement
Minimum KYC requirement up to Rs 10k; full KYC required above Rs 10k
Full KYC required
Minimum KYC requirement up to Rs 10k; full KYC required above Rs 10k
Full KYC required Full KYC required
Limit Load wallets with amount user is willing to spend
No need to load any amount as the transaction directly goes through the bank balance
Load instruments with amount user is willing to spend
No need to load any amount as transaction directly goes through the bank balance
Amount gets deducted from the limit provided to the cardholder
Usage Payments for online transactions
Payments for online transactions
Payments for online transactions, cash withdrawal at ATMs, POS terminals
Payments for online transactions, cash withdrawal at ATMs, POS terminals
Payments for online transactions, cash withdrawal at ATMs, POS terminals
Average transaction amount*
~Rs 450 ~Rs 1,700 ~Rs 630 ~Rs 1,300 ~Rs 3,400
Credit
Credit through EMI facility provided in some cases but has no interest-free period
No credit facility provided No credit facility provided
Credit through EMI facility provided in some cases but has no interest-free period
Credit facility with interest-free period (up to 50 days)
Rewards Discounts / cashback on transactions made
Discounts / cashback on transactions made
Discounts / cashback on transactions made
Discounts / reward points on amount spent
Discounts / cashback and reward points on spends
Transaction dispute management
Money is blocked / instantly deducted from customer account
Money is blocked / instantly deducted from customer account
Money is blocked / instantly deducted from customer account
Money is blocked / instantly deducted from customer account
Money is not blocked but is instantly deducted from customer credit limit
Source: Company, BOBCAPS Research | *Average transaction amount for credit and debit cards excludes ATM transactions.
14.3%
33.4%
12.3%
6.4%
3.8%4.8%
0%
10%
20%
30%
40%
50%
60%
NII Non interestincome
OperatingExpenses
Credit costs Tax ROA
11.8%
29.2%
9.7%
4.5%2.8%
3.5%
0%
5%
10%
15%
20%
25%
30%
35%
40%
45%
NII Non interestincome
OperatingExpenses
Credit costs Tax ROA
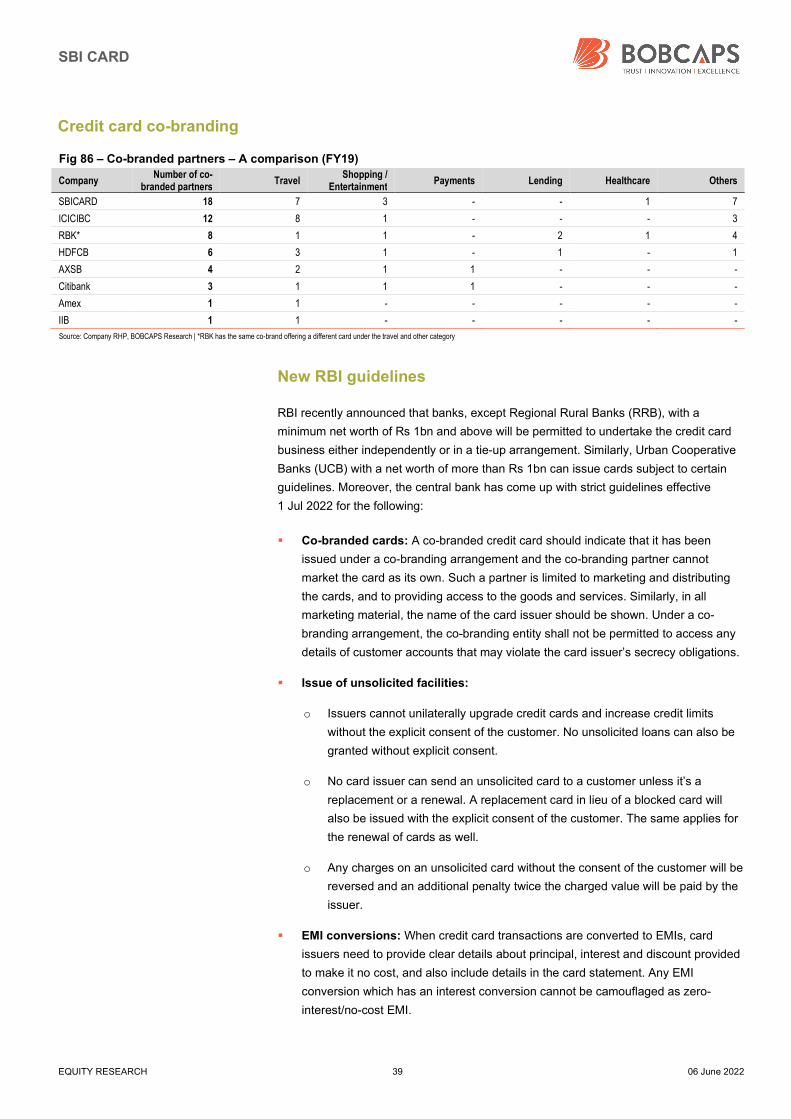
SBI CARD
EQUITY RESEARCH 39 06 June 2022
Credit card co-branding
Fig 86 – Co-branded partners – A comparison (FY19)
Company Number of co-
branded partners Travel
Shopping / Entertainment
Payments Lending Healthcare Others
SBICARD 18 7 3 - - 1 7
ICICIBC 12 8 1 - - - 3
RBK* 8 1 1 - 2 1 4
HDFCB 6 3 1 - 1 - 1
AXSB 4 2 1 1 - - -
Citibank 3 1 1 1 - - -
Amex 1 1 - - - - -
IIB 1 1 - - - - -
Source: Company RHP, BOBCAPS Research | *RBK has the same co-brand offering a different card under the travel and other category
New RBI guidelines
RBI recently announced that banks, except Regional Rural Banks (RRB), with a
minimum net worth of Rs 1bn and above will be permitted to undertake the credit card
business either independently or in a tie-up arrangement. Similarly, Urban Cooperative
Banks (UCB) with a net worth of more than Rs 1bn can issue cards subject to certain
guidelines. Moreover, the central bank has come up with strict guidelines effective
1 Jul 2022 for the following:
Co-branded cards: A co-branded credit card should indicate that it has been
issued under a co-branding arrangement and the co-branding partner cannot
market the card as its own. Such a partner is limited to marketing and distributing
the cards, and to providing access to the goods and services. Similarly, in all
marketing material, the name of the card issuer should be shown. Under a co-
branding arrangement, the co-branding entity shall not be permitted to access any
details of customer accounts that may violate the card issuer’s secrecy obligations.
Issue of unsolicited facilities:
o Issuers cannot unilaterally upgrade credit cards and increase credit limits
without the explicit consent of the customer. No unsolicited loans can also be
granted without explicit consent.
o No card issuer can send an unsolicited card to a customer unless it’s a
replacement or a renewal. A replacement card in lieu of a blocked card will
also be issued with the explicit consent of the customer. The same applies for
the renewal of cards as well.
o Any charges on an unsolicited card without the consent of the customer will be
reversed and an additional penalty twice the charged value will be paid by the
issuer.
EMI conversions: When credit card transactions are converted to EMIs, card
issuers need to provide clear details about principal, interest and discount provided
to make it no cost, and also include details in the card statement. Any EMI
conversion which has an interest conversion cannot be camouflaged as zero-
interest/no-cost EMI.
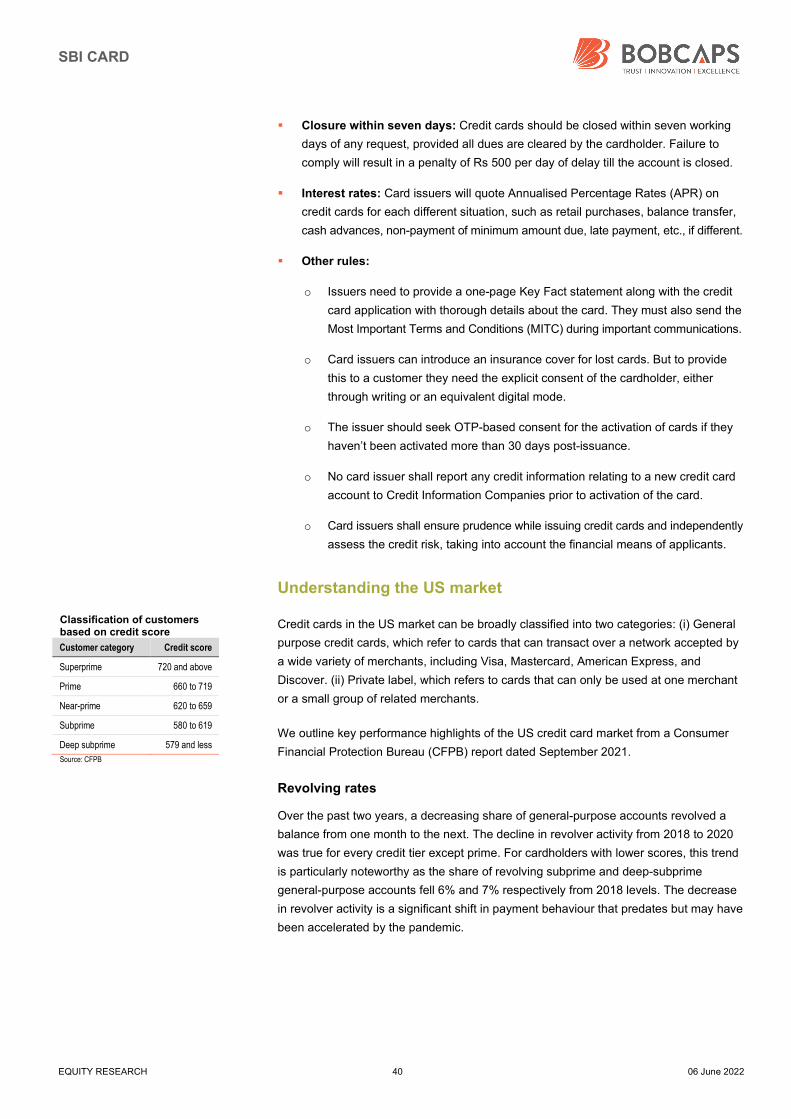
SBI CARD
EQUITY RESEARCH 40 06 June 2022
Closure within seven days: Credit cards should be closed within seven working
days of any request, provided all dues are cleared by the cardholder. Failure to
comply will result in a penalty of Rs 500 per day of delay till the account is closed.
Interest rates: Card issuers will quote Annualised Percentage Rates (APR) on
credit cards for each different situation, such as retail purchases, balance transfer,
cash advances, non-payment of minimum amount due, late payment, etc., if different.
Other rules:
o Issuers need to provide a one-page Key Fact statement along with the credit
card application with thorough details about the card. They must also send the
Most Important Terms and Conditions (MITC) during important communications.
o Card issuers can introduce an insurance cover for lost cards. But to provide
this to a customer they need the explicit consent of the cardholder, either
through writing or an equivalent digital mode.
o The issuer should seek OTP-based consent for the activation of cards if they
haven’t been activated more than 30 days post-issuance.
o No card issuer shall report any credit information relating to a new credit card
account to Credit Information Companies prior to activation of the card.
o Card issuers shall ensure prudence while issuing credit cards and independently
assess the credit risk, taking into account the financial means of applicants.
Understanding the US market
Credit cards in the US market can be broadly classified into two categories: (i) General
purpose credit cards, which refer to cards that can transact over a network accepted by
a wide variety of merchants, including Visa, Mastercard, American Express, and
Discover. (ii) Private label, which refers to cards that can only be used at one merchant
or a small group of related merchants.
We outline key performance highlights of the US credit card market from a Consumer
Financial Protection Bureau (CFPB) report dated September 2021.
Revolving rates
Over the past two years, a decreasing share of general-purpose accounts revolved a
balance from one month to the next. The decline in revolver activity from 2018 to 2020
was true for every credit tier except prime. For cardholders with lower scores, this trend
is particularly noteworthy as the share of revolving subprime and deep-subprime
general-purpose accounts fell 6% and 7% respectively from 2018 levels. The decrease
in revolver activity is a significant shift in payment behaviour that predates but may have
been accelerated by the pandemic.
Classification of customers based on credit score
Customer category Credit score
Superprime 720 and above
Prime 660 to 719
Near-prime 620 to 659
Subprime 580 to 619
Deep subprime 579 and less
Source: CFPB
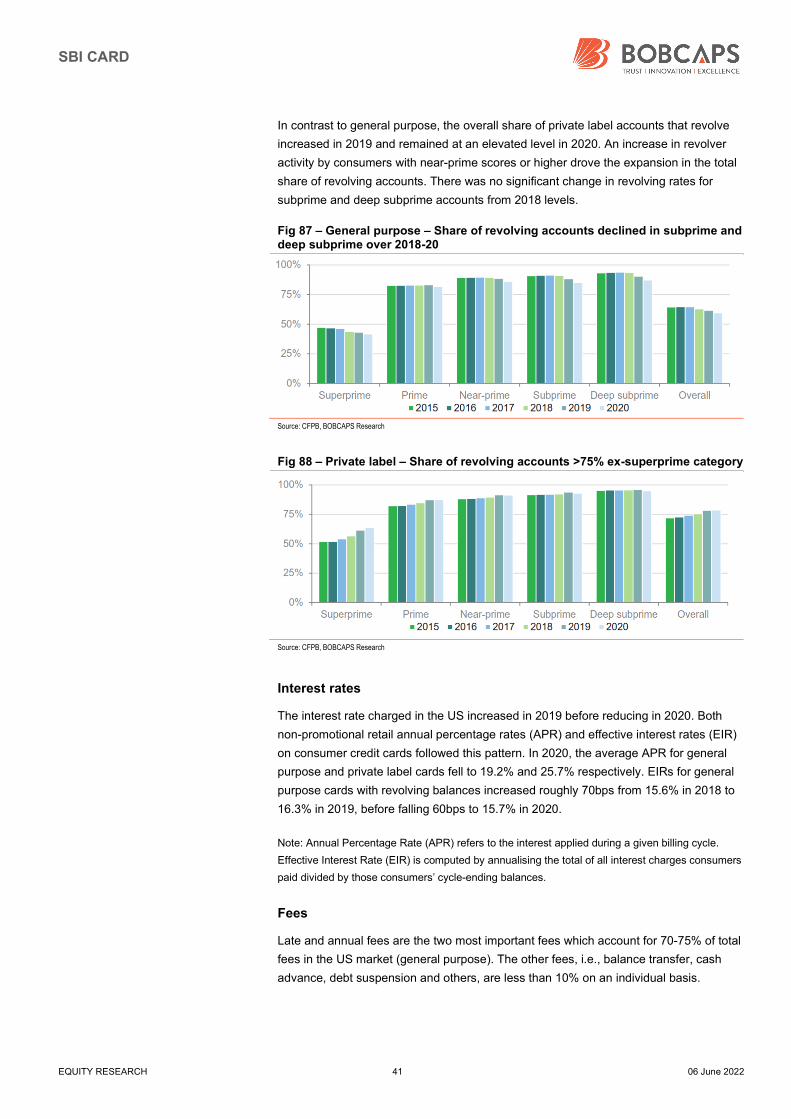
SBI CARD
EQUITY RESEARCH 41 06 June 2022
In contrast to general purpose, the overall share of private label accounts that revolve
increased in 2019 and remained at an elevated level in 2020. An increase in revolver
activity by consumers with near-prime scores or higher drove the expansion in the total
share of revolving accounts. There was no significant change in revolving rates for
subprime and deep subprime accounts from 2018 levels.
Fig 87 – General purpose – Share of revolving accounts declined in subprime and deep subprime over 2018-20
Source: CFPB, BOBCAPS Research
Fig 88 – Private label – Share of revolving accounts >75% ex-superprime category
Source: CFPB, BOBCAPS Research
Interest rates
The interest rate charged in the US increased in 2019 before reducing in 2020. Both
non-promotional retail annual percentage rates (APR) and effective interest rates (EIR)
on consumer credit cards followed this pattern. In 2020, the average APR for general
purpose and private label cards fell to 19.2% and 25.7% respectively. EIRs for general
purpose cards with revolving balances increased roughly 70bps from 15.6% in 2018 to
16.3% in 2019, before falling 60bps to 15.7% in 2020.
Note: Annual Percentage Rate (APR) refers to the interest applied during a given billing cycle.
Effective Interest Rate (EIR) is computed by annualising the total of all interest charges consumers
paid divided by those consumers’ cycle-ending balances.
Fees
Late and annual fees are the two most important fees which account for 70-75% of total
fees in the US market (general purpose). The other fees, i.e., balance transfer, cash
advance, debt suspension and others, are less than 10% on an individual basis.
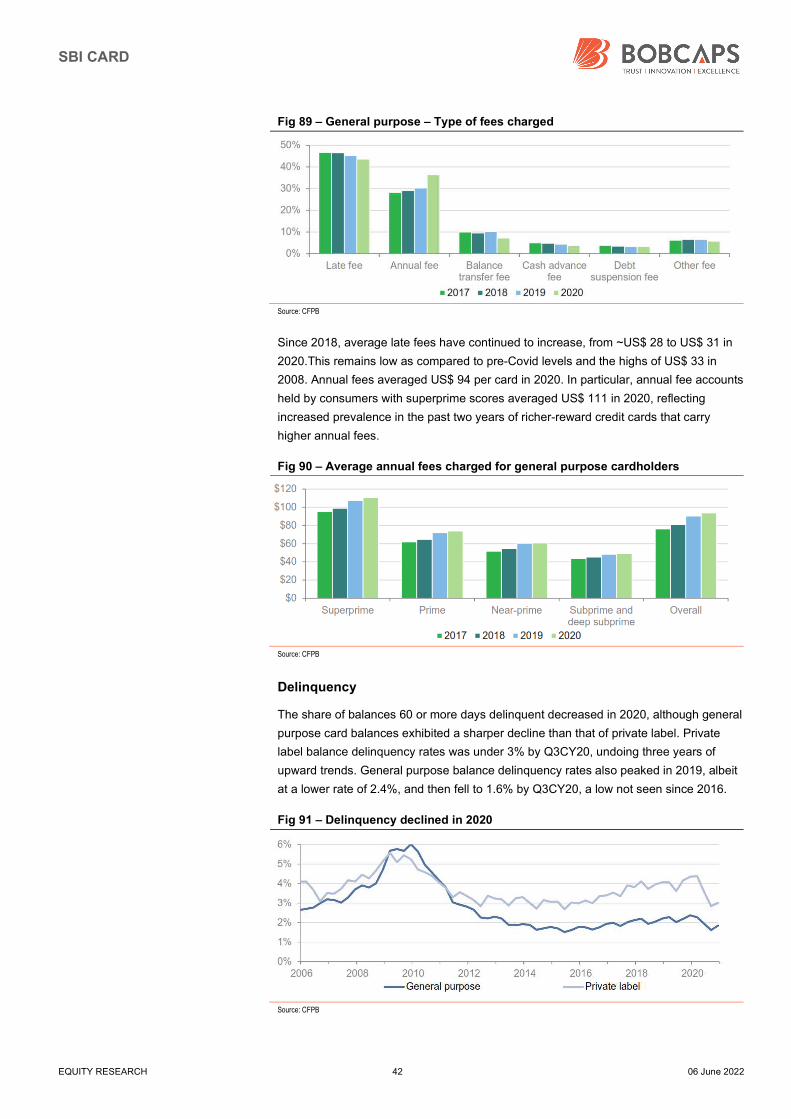
SBI CARD
EQUITY RESEARCH 42 06 June 2022
Fig 89 – General purpose – Type of fees charged
Source: CFPB
Since 2018, average late fees have continued to increase, from ~US$ 28 to US$ 31 in
2020.This remains low as compared to pre-Covid levels and the highs of US$ 33 in
2008. Annual fees averaged US$ 94 per card in 2020. In particular, annual fee accounts
held by consumers with superprime scores averaged US$ 111 in 2020, reflecting
increased prevalence in the past two years of richer-reward credit cards that carry
higher annual fees.
Fig 90 – Average annual fees charged for general purpose cardholders
Source: CFPB
Delinquency
The share of balances 60 or more days delinquent decreased in 2020, although general
purpose card balances exhibited a sharper decline than that of private label. Private
label balance delinquency rates was under 3% by Q3CY20, undoing three years of
upward trends. General purpose balance delinquency rates also peaked in 2019, albeit
at a lower rate of 2.4%, and then fell to 1.6% by Q3CY20, a low not seen since 2016.
Fig 91 – Delinquency declined in 2020
Source: CFPB
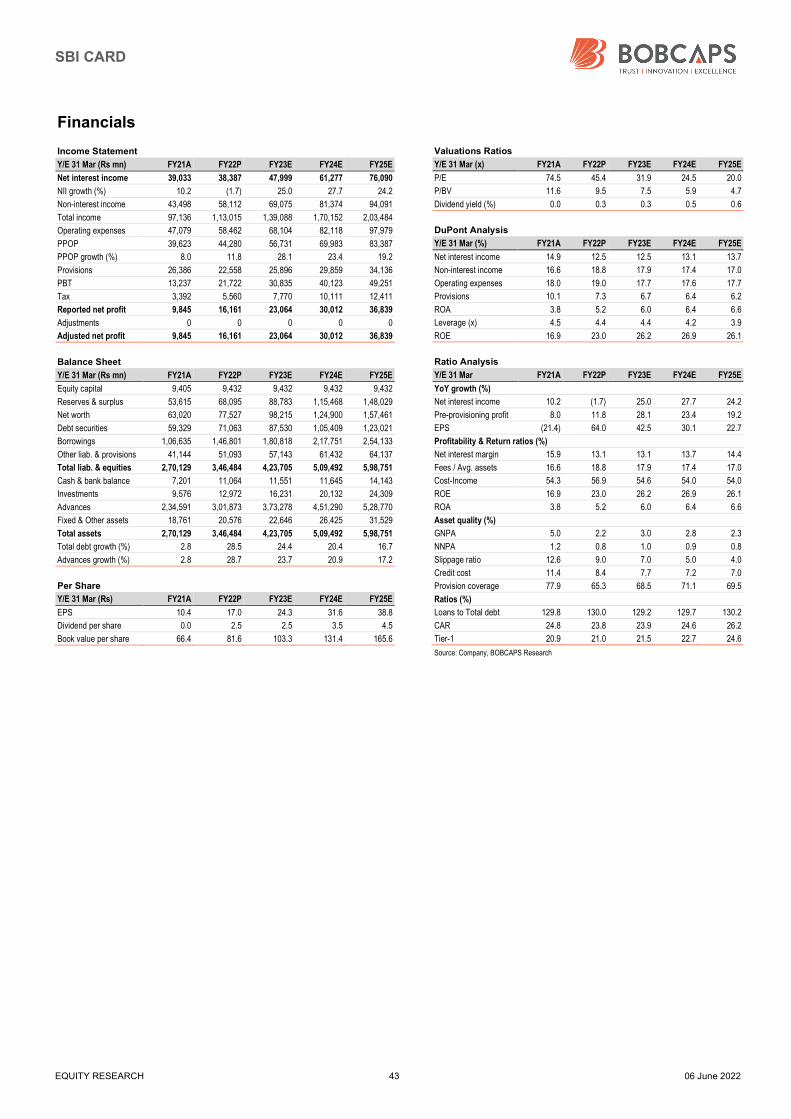
SBI CARD
EQUITY RESEARCH 43 06 June 2022
Financials
Income Statement
Y/E 31 Mar (Rs mn) FY21A FY22P FY23E FY24E FY25E
Net interest income 39,033 38,387 47,999 61,277 76,090
NII growth (%) 10.2 (1.7) 25.0 27.7 24.2
Non-interest income 43,498 58,112 69,075 81,374 94,091
Total income 97,136 1,13,015 1,39,088 1,70,152 2,03,484
Operating expenses 47,079 58,462 68,104 82,118 97,979
PPOP 39,623 44,280 56,731 69,983 83,387
PPOP growth (%) 8.0 11.8 28.1 23.4 19.2
Provisions 26,386 22,558 25,896 29,859 34,136
PBT 13,237 21,722 30,835 40,123 49,251
Tax 3,392 5,560 7,770 10,111 12,411
Reported net profit 9,845 16,161 23,064 30,012 36,839
Adjustments 0 0 0 0 0
Adjusted net profit 9,845 16,161 23,064 30,012 36,839
Balance Sheet
Y/E 31 Mar (Rs mn) FY21A FY22P FY23E FY24E FY25E
Equity capital 9,405 9,432 9,432 9,432 9,432
Reserves & surplus 53,615 68,095 88,783 1,15,468 1,48,029
Net worth 63,020 77,527 98,215 1,24,900 1,57,461
Debt securities 59,329 71,063 87,530 1,05,409 1,23,021
Borrowings 1,06,635 1,46,801 1,80,818 2,17,751 2,54,133
Other liab. & provisions 41,144 51,093 57,143 61,432 64,137
Total liab. & equities 2,70,129 3,46,484 4,23,705 5,09,492 5,98,751
Cash & bank balance 7,201 11,064 11,551 11,645 14,143
Investments 9,576 12,972 16,231 20,132 24,309
Advances 2,34,591 3,01,873 3,73,278 4,51,290 5,28,770
Fixed & Other assets 18,761 20,576 22,646 26,425 31,529
Total assets 2,70,129 3,46,484 4,23,705 5,09,492 5,98,751
Total debt growth (%) 2.8 28.5 24.4 20.4 16.7
Advances growth (%) 2.8 28.7 23.7 20.9 17.2
Per Share
Y/E 31 Mar (Rs) FY21A FY22P FY23E FY24E FY25E
EPS 10.4 17.0 24.3 31.6 38.8
Dividend per share 0.0 2.5 2.5 3.5 4.5
Book value per share 66.4 81.6 103.3 131.4 165.6
Valuations Ratios
Y/E 31 Mar (x) FY21A FY22P FY23E FY24E FY25E
P/E 74.5 45.4 31.9 24.5 20.0
P/BV 11.6 9.5 7.5 5.9 4.7
Dividend yield (%) 0.0 0.3 0.3 0.5 0.6
DuPont Analysis
Y/E 31 Mar (%) FY21A FY22P FY23E FY24E FY25E
Net interest income 14.9 12.5 12.5 13.1 13.7
Non-interest income 16.6 18.8 17.9 17.4 17.0
Operating expenses 18.0 19.0 17.7 17.6 17.7
Provisions 10.1 7.3 6.7 6.4 6.2
ROA 3.8 5.2 6.0 6.4 6.6
Leverage (x) 4.5 4.4 4.4 4.2 3.9
ROE 16.9 23.0 26.2 26.9 26.1
Ratio Analysis
Y/E 31 Mar FY21A FY22P FY23E FY24E FY25E
YoY growth (%)
Net interest income 10.2 (1.7) 25.0 27.7 24.2
Pre-provisioning profit 8.0 11.8 28.1 23.4 19.2
EPS (21.4) 64.0 42.5 30.1 22.7
Profitability & Return ratios (%)
Net interest margin 15.9 13.1 13.1 13.7 14.4
Fees / Avg. assets 16.6 18.8 17.9 17.4 17.0
Cost-Income 54.3 56.9 54.6 54.0 54.0
ROE 16.9 23.0 26.2 26.9 26.1
ROA 3.8 5.2 6.0 6.4 6.6
Asset quality (%)
GNPA 5.0 2.2 3.0 2.8 2.3
NNPA 1.2 0.8 1.0 0.9 0.8
Slippage ratio 12.6 9.0 7.0 5.0 4.0
Credit cost 11.4 8.4 7.7 7.2 7.0
Provision coverage 77.9 65.3 68.5 71.1 69.5
Ratios (%)
Loans to Total debt 129.8 130.0 129.2 129.7 130.2
CAR 24.8 23.8 23.9 24.6 26.2
Tier-1 20.9 21.0 21.5 22.7 24.6
Source: Company, BOBCAPS Research
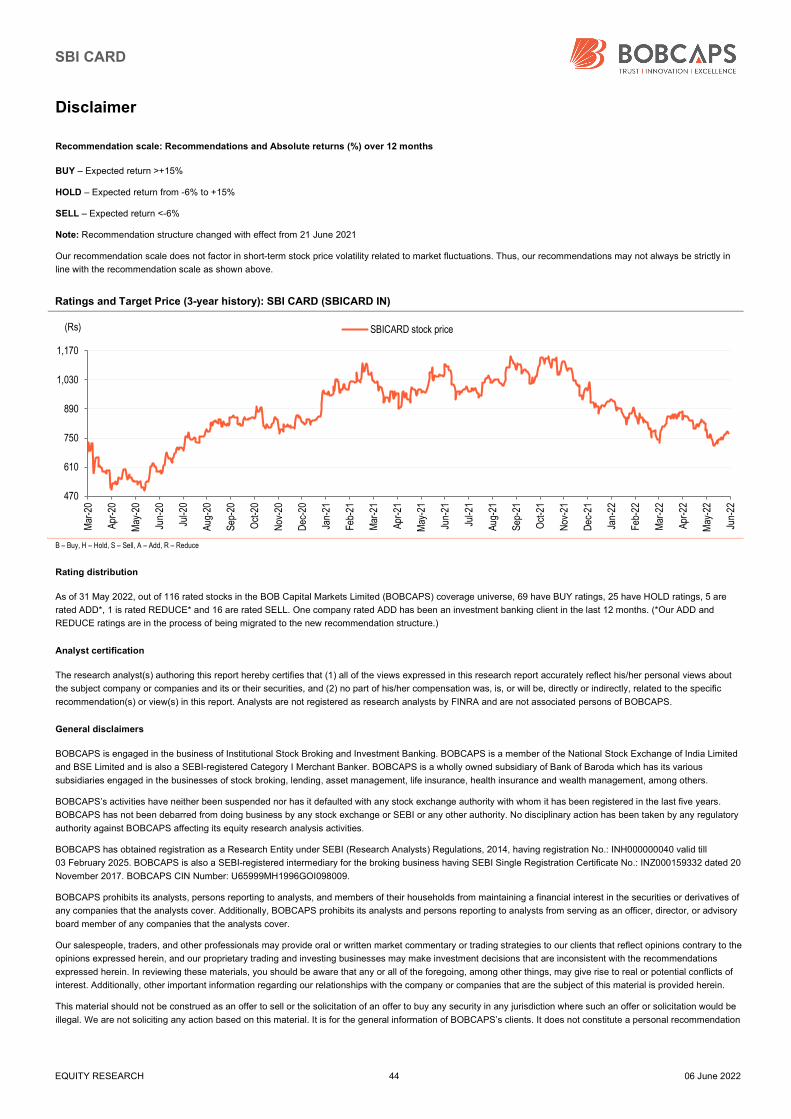
SBI CARD
EQUITY RESEARCH 44 06 June 2022
Disclaimer
Recommendation scale: Recommendations and Absolute returns (%) over 12 months
BUY – Expected return >+15%
HOLD – Expected return from -6% to +15%
SELL – Expected return <-6%
Note: Recommendation structure changed with effect from 21 June 2021
Our recommendation scale does not factor in short-term stock price volatility related to market fluctuations. Thus, our recommendations may not always be strictly in
line with the recommendation scale as shown above.
Ratings and Target Price (3-year history): SBI CARD (SBICARD IN)
B – Buy, H – Hold, S – Sell, A – Add, R – Reduce
Rating distribution
As of 31 May 2022, out of 116 rated stocks in the BOB Capital Markets Limited (BOBCAPS) coverage universe, 69 have BUY ratings, 25 have HOLD ratings, 5 are
rated ADD*, 1 is rated REDUCE* and 16 are rated SELL. One company rated ADD has been an investment banking client in the last 12 months. (*Our ADD and
REDUCE ratings are in the process of being migrated to the new recommendation structure.)
Analyst certification
The research analyst(s) authoring this report hereby certifies that (1) all of the views expressed in this research report accurately reflect his/her personal views about
the subject company or companies and its or their securities, and (2) no part of his/her compensation was, is, or will be, directly or indirectly, related to the specific
recommendation(s) or view(s) in this report. Analysts are not registered as research analysts by FINRA and are not associated persons of BOBCAPS.
General disclaimers
BOBCAPS is engaged in the business of Institutional Stock Broking and Investment Banking. BOBCAPS is a member of the National Stock Exchange of India Limited
and BSE Limited and is also a SEBI-registered Category I Merchant Banker. BOBCAPS is a wholly owned subsidiary of Bank of Baroda which has its various
subsidiaries engaged in the businesses of stock broking, lending, asset management, life insurance, health insurance and wealth management, among others.
BOBCAPS’s activities have neither been suspended nor has it defaulted with any stock exchange authority with whom it has been registered in the last five years.
BOBCAPS has not been debarred from doing business by any stock exchange or SEBI or any other authority. No disciplinary action has been taken by any regulatory
authority against BOBCAPS affecting its equity research analysis activities.
BOBCAPS has obtained registration as a Research Entity under SEBI (Research Analysts) Regulations, 2014, having registration No.: INH000000040 valid till
03 February 2025. BOBCAPS is also a SEBI-registered intermediary for the broking business having SEBI Single Registration Certificate No.: INZ000159332 dated 20
November 2017. BOBCAPS CIN Number: U65999MH1996GOI098009.
BOBCAPS prohibits its analysts, persons reporting to analysts, and members of their households from maintaining a financial interest in the securities or derivatives of
any companies that the analysts cover. Additionally, BOBCAPS prohibits its analysts and persons reporting to analysts from serving as an officer, director, or advisory
board member of any companies that the analysts cover.
Our salespeople, traders, and other professionals may provide oral or written market commentary or trading strategies to our clients that reflect opinions contrary to the
opinions expressed herein, and our proprietary trading and investing businesses may make investment decisions that are inconsistent with the recommendations
expressed herein. In reviewing these materials, you should be aware that any or all of the foregoing, among other things, may give rise to real or potential conflicts of
interest. Additionally, other important information regarding our relationships with the company or companies that are the subject of this material is provided herein.
This material should not be construed as an offer to sell or the solicitation of an offer to buy any security in any jurisdiction where such an offer or solicitation would be
illegal. We are not soliciting any action based on this material. It is for the general information of BOBCAPS’s clients. It does not constitute a personal recommendation
470
610
750
890
1,030
1,170
Mar
-20
Apr
-20
May
-20
Jun-
20
Jul-2
0
Aug
-20
Sep
-20
Oct
-20
Nov
-20
Dec
-20
Jan-
21
Feb-
21
Mar
-21
Apr
-21
May
-21
Jun-
21
Jul-2
1
Aug
-21
Sep
-21
Oct
-21
Nov
-21
Dec
-21
Jan-
22
Feb-
22
Mar
-22
Apr
-22
May
-22
Jun-
22
(Rs) SBICARD stock price
SBI CARD
EQUITY RESEARCH 45 06 June 2022
or take into account the particular investment objectives, financial situations, or needs of individual clients. Before acting on any advice or recommendation in this
material, clients should consider whether it is suitable for their particular circumstances and, if necessary, seek professional advice.
The price and value of the investments referred to in this material and the income from them may go down as well as up, and investors may realize losses on any
investments. Past performance is not a guide for future performance, future returns are not guaranteed and a loss of original capital may occur. BOBCAPS does not
provide tax advice to its clients, and all investors are strongly advised to consult with their tax advisers regarding any potential investment in certain transactions —
including those involving futures, options, and other derivatives as well as non-investment-grade securities —that give rise to substantial risk and are not suitable for all
investors. The material is based on information that we consider reliable, but we do not represent that it is accurate or complete, and it should not be relied on as such.
Opinions expressed are our current opinions as of the date appearing on this material only. We endeavour to update on a reasonable basis the information discussed
in this material, but regulatory, compliance, or other reasons may prevent us from doing so.
We and our affiliates, officers, directors, and employees, including persons involved in the preparation or issuance of this material, may from time to time have “long” or
“short” positions in, act as principal in, and buy or sell the securities or derivatives thereof of companies mentioned herein and may from time to time add to or dispose
of any such securities (or investment). We and our affiliates may act as market makers or assume an underwriting commitment in the securities of companies
discussed in this document (or in related investments), may sell them to or buy them from customers on a principal basis, and may also perform or seek to perform
investment banking or advisory services for or relating to these companies and may also be represented in the supervisory board or any other committee of these
companies.
For the purpose of calculating whether BOBCAPS and its affiliates hold, beneficially own, or control, including the right to vote for directors, one per cent or more of the
equity shares of the subject company, the holdings of the issuer of the research report is also included.
BOBCAPS and its non-US affiliates may, to the extent permissible under applicable laws, have acted on or used this research to the extent that it relates to non-US
issuers, prior to or immediately following its publication. Foreign currency denominated securities are subject to fluctuations in exchange rates that could have an
adverse effect on the value or price of or income derived from the investment. In addition, investors in securities such as ADRs, the value of which are influenced by
foreign currencies, effectively assume currency risk. In addition, options involve risks and are not suitable for all investors. Please ensure that you have read and
understood the Risk disclosure document before entering into any derivative transactions.
In the US, this material is only for Qualified Institutional Buyers as defined under rule 144(a) of the Securities Act, 1933. No part of this document may be distributed in
Canada or used by private customers in the United Kingdom.
No part of this material may be (1) copied, photocopied, or duplicated in any form by any means or (2) redistributed without BOBCAPS’s prior written consent.
Company-specific disclosures under SEBI (Research Analysts) Regulations, 2014
The research analyst(s) or his/her relatives do not have any material conflict of interest at the time of publication of this research report.
BOBCAPS or its research analyst(s) or his/her relatives do not have any financial interest in the subject company. BOBCAPS or its research analyst(s) or his/her
relatives do not have actual/beneficial ownership of one per cent or more securities in the subject company at the end of the month immediately preceding the date of
publication of this report.
The research analyst(s) has not received any compensation from the subject company in the past 12 months. Compensation of the research analyst(s) is not based on
any specific merchant banking, investment banking or brokerage service transactions.
BOBCAPS or its research analyst(s) is not engaged in any market making activities for the subject company.
The research analyst(s) has not served as an officer, director or employee of the subject company.
BOBCAPS or its associates may have material conflict of interest at the time of publication of this research report.
BOBCAPS’s associates may have financial interest in the subject company. BOBCAPS’s associates may hold actual / beneficial ownership of one per cent or more
securities in the subject company at the end of the month immediately preceding the date of publication of this report.
BOBCAPS or its associates may have managed or co-managed a public offering of securities for the subject company or may have been mandated by the subject
company for any other assignment in the past 12 months.
BOBCAPS may have received compensation from the subject company in the past 12 months. BOBCAPS may from time to time solicit or perform investment banking
services for the subject company. BOBCAPS or its associates may have received compensation from the subject company in the past 12 months for services in
respect of managing or co-managing public offerings, corporate finance, investment banking or merchant banking, brokerage services or other advisory services in a
merger or specific transaction. BOBCAPS or its associates may have received compensation for products or services other than investment banking or merchant
banking or brokerage services from the subject company in the past 12 months.
Related Documents