INITIATING COVERAGE 8 OCT 2013 Bharti Infratel BUY Cash box We initiate coverage on Bharti Infratel (BIL) with a BUY rating and Sep-14 DCF based SoTP of Rs 198. BIL is the best pan-India telecom tower play and provides exposure to a steady FCF-growth business. Presence of three incumbent telecom operators as anchor tenants and increasingly favourable demand-supply adds to long-term prospects. Key risks include pressure on tower rentals. Note: We use BIL (SA) to represent Bharti Infratel standalone and BIL for Bharti Infratel consolidated (BIL standalone + 42% of Indus). Best exposure to the telecom tower space : BIL is the largest pan-India tower company, through its direct operational presence plus 42% stake in Indus Towers. BIL enjoys 22% tower and 24% tenancy market share. This gives an opportunity to participate in voice network expansion in rural markets and data in urban markets, access to strong anchor tenants, a superior tower portfolio. BIL has a strong execution track record. The tower industry has lately seen modest supply, a positive for BIL. ~40% single tenant towers, a key trigger : 45% of BIL (SA) towers and 37% of Indus towers have only a single tenant. An additional tenant on this single tenant towers can add ~Rs 10bn to BIL’s (consolidated) EBITDA and Rs 6.7bn to PAT (viz. 24% and 48% of FY14E respectively). Stable business, reasonable valuations : Led by a low-risk annuity business model, strong FCF (~7% average yield over FY14-15E) and potential for tenancy surprise driven by an ever increasing data market, we think current valuations at 6.4/5.6x FY14/15E EV/EBITDA are reasonable. We value BIL (SA) and Indus separately (ascribing 20% holdco discount) on DCF basis with Sep-14 SoTP of Rs 198. Key risks : BIL’s sub-optimal capital structure & risk of a value dilutive acquisition and fall in rentals are downsides. Although the contours of Reliance Jio- Rcom tower deal are not apparent, rental is estimated at ~50% of BIL’s rental/tenant. Misalignment of interests of anchor tenants as customer-owner poses additional risks for minority shareholders. CONSOLIDATED FINANCIAL SUMMARY YE Mar (Rs mn) FY11 FY12 FY13 FY14E FY15E Net Sales 85,081 94,521 102,720 107,992 117,436 EBITDA 31,288 35,343 38,302 42,267 46,353 PAT 5,515 7,491 10,003 14,025 16,791 Diluted EPS (Rs) 3.2 4.3 5.3 7.4 8.9 P/E (x) 50.2 37.0 30.0 21.4 17.9 EV / EBITDA (x) 10.9 9.4 7.7 6.4 5.6 RoE (%) 4.0 5.3 6.3 8.0 9.3 Source: Company, HDFC sec Inst Research INDUSTRY TELECOM CMP (as on 8 Oct 2013) Rs 158 Target Price Rs 198 Nifty 5,928 Sensex 19,984 KEY STOCK DATA Bloomberg BHIN IN No. of Shares (mn) 1,889 MCap (Rs bn) / ($ mn) 298/4,823 6m avg traded value (Rs mn) 57 STOCK PERFORMANCE (%) 52 Week high / low Rs 220 / 126 3M 6M 12M Absolute (%) 4.5 (11.1) - Relative (%) 1.1 (19.5) - SHAREHOLDING PATTERN (%) Promoters 79.42 FIs & Local MFs 2.35 FIIs 9.44 Public & Others 8.79 Source : BSE Himanshu Shah [email protected] +91-22-6171-7325 HDFC securities Institutional Research is also available on Bloomberg HSLB <GO> & Thomson Reuters

Welcome message from author
This document is posted to help you gain knowledge. Please leave a comment to let me know what you think about it! Share it to your friends and learn new things together.
Transcript

INITIATING COVERAGE 8 OCT 2013
Bharti Infratel BUY
Cash box We initiate coverage on Bharti Infratel (BIL) with a BUY rating and Sep-14 DCF based SoTP of Rs 198. BIL is the best pan-India telecom tower play and provides exposure to a steady FCF-growth business. Presence of three incumbent telecom operators as anchor tenants and increasingly favourable demand-supply adds to long-term prospects. Key risks include pressure on tower rentals. Note: We use BIL (SA) to represent Bharti Infratel standalone and BIL for Bharti Infratel consolidated (BIL standalone + 42% of Indus).
Best exposure to the telecom tower space : BIL is the largest pan-India tower company, through its direct operational presence plus 42% stake in Indus Towers. BIL enjoys 22% tower and 24% tenancy market share. This gives an opportunity to participate in voice network expansion in rural markets and data in urban markets, access to strong anchor tenants, a superior tower portfolio. BIL has a strong execution track record. The tower industry has lately seen modest supply, a positive for BIL.
~40% single tenant towers, a key trigger : 45% of BIL (SA) towers and 37% of Indus towers have only a single tenant. An additional tenant on this single tenant towers can add ~Rs 10bn to BIL’s (consolidated) EBITDA and Rs 6.7bn to PAT (viz. 24% and 48% of FY14E respectively).
Stable business, reasonable valuations : Led by a low-risk annuity business model, strong FCF (~7% average yield over FY14-15E) and potential for tenancy surprise driven by an ever increasing data market, we think current valuations at 6.4/5.6x FY14/15E EV/EBITDA are reasonable. We value BIL (SA) and Indus separately (ascribing 20% holdco discount) on DCF basis with Sep-14 SoTP of Rs 198.
Key risks : BIL’s sub-optimal capital structure & risk of a value dilutive acquisition and fall in rentals are downsides. Although the contours of Reliance Jio-Rcom tower deal are not apparent, rental is estimated at ~50% of BIL’s rental/tenant. Misalignment of interests of anchor tenants as customer-owner poses additional risks for minority shareholders.
CONSOLIDATED FINANCIAL SUMMARY YE Mar (Rs mn) FY11 FY12 FY13 FY14E FY15E
Net Sales 85,081 94,521 102,720 107,992 117,436 EBITDA 31,288 35,343 38,302 42,267 46,353 PAT 5,515 7,491 10,003 14,025 16,791 Diluted EPS (Rs) 3.2 4.3 5.3 7.4 8.9 P/E (x) 50.2 37.0 30.0 21.4 17.9 EV / EBITDA (x) 10.9 9.4 7.7 6.4 5.6 RoE (%) 4.0 5.3 6.3 8.0 9.3 Source: Company, HDFC sec Inst Research
INDUSTRY TELECOM CMP (as on 8 Oct 2013) Rs 158 Target Price Rs 198 Nifty 5,928
Sensex 19,984
KEY STOCK DATA
Bloomberg BHIN IN
No. of Shares (mn) 1,889
MCap (Rs bn) / ($ mn) 298/4,823
6m avg traded value (Rs mn) 57
STOCK PERFORMANCE (%)
52 Week high / low Rs 220 / 126
3M 6M 12M
Absolute (%) 4.5 (11.1) -
Relative (%) 1.1 (19.5) -
SHAREHOLDING PATTERN (%)
Promoters 79.42
FIs & Local MFs 2.35
FIIs 9.44
Public & Others 8.79
Source : BSE
Himanshu Shah [email protected] +91-22-6171-7325
HDFC securities Institutional Research is also available on Bloomberg HSLB <GO> & Thomson Reuters

BHARTI INFRATEL : INITIATING COVERAGE
INDUSTRY OVERVIEW
Telecom Tower Industry : Poised for growth Passive infrastructure (tower) sharing started as
barter arrangements between operators. It has evolved into a large industry with several independent and operator-owned tower cos. Tower sharing eliminates capex and opex duplication and shortens the time-to-market for telecom operators. An independent towerco enables them to focus on core functions.
The basic business model of tower sharing is now well-established and tenancies are witnessing a consistent uptick, albeit slowly. The industry is set to benefit from an anticipated business revival of Indian telcos led by expanding data market, increasing voice tariffs, receding competition and regulatory concerns. We believe disproportionate benefits can accrue to tower companies with superior tenants, tower portfolio and financial muscle.
COMPETITIVE LANDSCAPE OF TOWER INDUSTRY (AS OF END-FY12)
No. of towers
(‘000) Average
Tenancies Tenants
(‘000) Tower market
share (%) Tenancy market
share (%) Operator-owned tower companies Viom Networks 42 2.38 100 12% 16% Indus 109 1.94 211 30% 34% Bharti Infratel 33 1.82 60 9% 10% Reliance Infratel 50 1.84 92 14% 15% BSNL 50 1.00 50 14% 8% Idea Cellular 8 1.54 12 2% 2% Sub total 292 1.80 526 80% 84% Independent tower companies ATC 10 1.90 19 3% 3% Tower Vision 8 1.60 13 2% 2% Ascend 4 1.50 6 1% 1% GTL Infra 33 1.29 43 9% 7% Others 18 1.00 18 5% 3% Sub total 73 1.35 98 20% 16% Total 365 1.71 624 100% 100% Source: Bharti Infratel DRHP, Company, Analysys Mason, HDFC sec Inst Research; Indus tower is jointly owned by Bharti Infratel (42%), Vodafone (42%) and Idea (16%). Three large incumbent operators account for 62% of active subscriber market share and 70% of revenue market share as at Jun-13.
BIL with its 42% holding in Indus Towers is the largest tower company in India Operator owned tower companies better placed due to anchor tenant existence and high visibility on the same
Tower industry is set to benefit from revival of growth of telcos
Page | 2

BHARTI INFRATEL : INITIATING COVERAGE
Value creation : tricky but possible Simple revenue model : No of towers * No of
tenants/tower * Rental/tenant : Tower leasing business model is akin to a real estate business with value addition. Tower cos lease space on passive infrastructure to telecom operators for installation of active equipments. Revenue growth of tower companies is a function of no of towers, tenancy (tenants/tower) and rentals, but with differing implications on value creation.
Towers : Revenue growth led by towers may or may not be value accretive (refer table on pg 8). Single tenancy has poor economics. Nevertheless, most new towers start with a single tenant and gradually ramp-up. Future deployment of towers is expected to be demand driven and not proactive. As such, it is likely to be at a much slower pace compared to the last few years. Historically, the tower industry has witnessed problems after aggressive acquisitions and then awaiting tenants.
Tenants : Tenancy-led growth is best for driving value and is an important metric to measure the health of tower companies. A critical tenancy is a pre-requisite for creating value (refer table on pg 8). 2G networks expansion in urban areas led by quality drivers, coverage expansion for rural areas (especially in B&C category circles) and capacity/coverage expansion for 3G and 4G data services should drive tenancy growth.
Rental/tenant : An intricate metric Improvement in rental per tenant too is a positive driver. However, this metric is complicated as the analysis below indicates
MSA - guiding force : Tower companies typically sign a master service agreement (MSA) with their customers. MSA defines the base rentals, service level agreements, rental premium, strategic premium
for specific location and loading premium for additional weights and/or equipments beyond standard configuration. It also involves term-based and volume-based discounts. Specific agreements are then inked for each tower. Service level agreements define the minimum network uptime.
Base rentals follow a descending structure : Base rental per tenant declines as additional tenant signs up for co-location. There is an annual escalation in base rentals; however this is not reflected in P&L due to revenue equalisation*.
*Revenue equalisation is straight-line accounting of annual rental escalations over the fixed, non-cancellable term of contracts.
Standard terms of MSA : Lease rental of Rs 35,500 for ground based tower (GBT) and Rs 25,500 for roof top tower (RTT) for 1st tenant and ~10% discount to both tenants on 2nd tenant and ~6-7% discount to each tenant on 3nd tenant and onwards. The difference in rentals of GBT and RTT is due to the difference in cost of building towers. MSAs are typically long term in nature (10-15 years) with built-in escalation in rentals (~2.5%) and exit penalties (35% of payment due over residual contract duration or one year’s rental whichever is higher) for an early termination.
Rental/tenant expected to remain range bound : A common perception is increasing trend of rental/tenant owing to (a) fresh tenant on new tower with significantly higher rentals, further aided by revenue equalisation and (b) additional loading of equipments that adds to existing rental/tenant (and not tenancy). However, based on our analysis, we expect the rental/tenant to remain flat upto the expiry of existing contracts. This is primarily due to the discounts to all the tenants, as incremental tenant joins the existing tower. We provide the analysis of the same below.
Revenue growth led by more towers may or may not be value accretive Single tenant tower has poor economics Tower company needs to hit a critical tenancy before it starts creating value Thrust for quality, 2G network expansion in rural areas and data growth in urban areas to drive tenancy in medium term
Page | 3

BHARTI INFRATEL : INITIATING COVERAGE
REVENUE EQUALIZATION : AVERAGE RENTAL/TENANT FOR A 10YEAR CONTRACT WITH 2.5% ESCALATION PER ANNUM Year Rental/GBT/Tenant Rental/RTT/Tenant Blended Rental
(Indus)* Blended Rental
BIL (SA)* 1 35,700 25,500 31,906 34,588 2 36,593 26,138 32,703 35,453 3 37,507 26,791 33,521 36,339 4 38,445 27,461 34,359 37,248 5 39,406 28,147 35,218 38,179 6 40,391 28,851 36,098 39,133 7 41,401 29,572 37,001 40,112 8 42,436 30,311 37,926 41,115 9 43,497 31,069 38,874 42,142
10 44,584 31,846 39,846 43,196 10 yrs avg rental 39,996 28,569 35,745 38,750
*Blended rental for Indus is based on current GBT:RTT tower mix of 62:38 and for BIL (SA) 89:11
INCREMENTAL REVENUE PER NEW TENANT TO PULL DOWN THE OVERALL RENTAL/TENANT No of tenants 1 2 3 4 Indus Rental/tenant (Rs) 35,745 32,171 30,079 28,124 Discount in rentals (%) 10.0% 6.5% 6.5% Rental/tower 35,745 64,341 90,238 112,497 Incremental revenue 28,596 25,897 22,259 BIL (SA) Rental/tenant (Rs) 38,750 34,875 32,609 30,489 Discount in rentals (%) 10.0% 6.5% 6.5% Rental/tower 38,750 69,751 97,826 121,956 Incremental revenue 31,000 28,075 24,130 Source : HDFC sec Inst Research
Rental/tenant a complicated variable to the model Upside in rental/tenant will be led by additional loading, new tenants on fresh towers; however it would be offset by additional tenants on existing towers leading to rental discounts for all tenants In a nutshell, we estimate rental/tenant to remain flat
Page | 4

BHARTI INFRATEL : INITIATING COVERAGE
COST STRUCTURE
Power and fuel Power and fuel is the largest cost component.
However, it is pass-through to telecom operators by tower companies.
Fixed energy contracts add volatility to margin : Though power cost is pass-through, some operators are now adopting a fixed energy model where tenants pay a fixed energy charge per month, calculated on the basis of the number of tenants on the tower and the operator’s equipment installed at the tower. Fixed energy contracts are not necessarily fixed charge/unit. A tower company still gets to pass-on any increase in unit/cost of power.
Fixed energy contracts add another level of unpredictability. Basically tower companies commit to a standard mix of use of fuel (and not fixed power bill). They get to keep the upside if perform better, but in case of failure, face margin risk.
Fixed-energy contracts enable a tower company to reduce the billing disputes with telecom operators thus fastening the settlement process. Besides tower companies are able to invest in newer technologies (green energy/solar power). But, tower companies pass on the savings using new technology to telecom operators after recovering interest and depreciation cost. This leads to higher capex and lower FCF in the near term. Risk of technology failure resides with tower companies and upsides from energy saving are passed on to customers.
Lease rentals to landlord Tower companies sign 5-15 year long-term contracts
with the landlords and building societies with an escalation clause every 2-3 years. However, tower companies have been witnessing an abnormal
increase in rental demand as new tenant kicks in. This remains a risk, although tower companies have a rental premium clause with telecom operators (namely increase in lease rentals to landlords beyond a certain threshold is passed on to telcos).
Similar to rental revenues from telecom operators, tower companies account for escalation in lease rental on straight line basis termed as lease equalisation. Although tower rentals would significantly vary across states and cities, it averages ~Rs 10,000-11,000 per tower per month for Indus Towers and ~Rs 5,500-6,000 per tower per month for BIL (SA). Indus operates in Metro and A circles, whereas BIL (SA) operates in B & C circles leading to a difference in rental/tower.
Site maintenance cost This cost is incurred on security charges for towers,
repairs and maintenance of passive infrastructure equipments like ACs, DG Set, batter bank, power equipments, insurance etc. This cost hovers around Rs 9,000-10,000 per tower per month for both BIL (SA) and Indus Towers.
Incremental operating costs incurred with the addition of new tenants are minimal, resulting in a significant increase in operating margins with higher tenancy.
Capital Investment per tower Tower sharing business involves a high initial capital
outlay. There are two types of towers – ground based (GBT) and roof top (RTT). GBTs are created on vacant land and hence more prevalent in suburban and rural areas. GBTs are approximately of 40-60 meter heights, can support five-six tenants and cost Rs 2.3-2.6mn. RTTs are built on roof of building and hence
Power and fuel cost is pass through to telecom operators But fixed energy contracts add another level of uncertainty to margin Unprecedented rise in lease rentals to landlord remains a risk Tower companies enjoy significant operating leverage with every new tenant
Page | 5

BHARTI INFRATEL : INITIATING COVERAGE
more prevalent in urban areas. RTTs are approximately of 20-40 meter heights, can support three tenants and cost Rs 1.5-1.8mn.
Capex intensity to remain at ~15-20% of rental revenue: Based on our estimate (see below), maintenance capex is estimated at ~14% of revenue. BIL’s management estimates maintenance capex per tower at ~Rs 100k per annum from third year of tower build. This is lower than our computation of Rs 130-150k p.a.
Besides capex on maintenance of existing towers, tower companies incur capex on new tower roll-outs; upgrade capex for supporting additional tenants or loading of equipments and green energy capex. BIL uses various premises on lease to install plant and equipments. A provision is recognised for the costs to be incurred for the restoration of these premises at the end of the lease period, which is capitalized.
In nutshell, capex is estimated to be 15-20% of revenue. We forecast 17-18% capex p.a. for BIL (SA) and Indus.
COMPUTATION OF MAINTENANCE CAPEX AS % OF REVENUE
Sr No Rs mn GBT (40m height**)
RTT (21m height**)
Tower mix (70:30)
Life span for book/depreciation
purpose
Practical life span
1 Tower (including civil work, erection and painting charges) 1.13 0.43 0.92 20 40
2 Diesel generator including installation and commissioning charges 0.20 0.20 0.20 7 7
3a Plug- Play cabinet 0.22 - 0.15 10 10
3b Equipment shelter, integrated power management system (“IPMS”) and battery chiller - 0.29 0.09 10 10
4 Battery 0.07 0.07 0.07 3 3 5 Other electrical items 0.08 0.08 0.08 15* 15*
6 Electrical work (including installation and commissioning charges) 0.05 0.07 0.06 15* 15*
7a Electricity Board (“EB”) charges including laying transformer & pole laying as per State Electricity Board requirements (“SEB”) (500m)
0.45 - 0.32 15* 15*
7b EB charges including laying pole as per SEB requirements (300m) - 0.25 0.08 15* 15*
8 Miscellaneous expenses (including project management charges, survey and third party inspection)
0.14 0.15 0.14 15* 15*
Total (A) 2.34 1.54 2.10 0.15
Capex intensity to remain at 15-20% of revenue led by maintenance capex of ~Rs 130-150k/tower, upgrade capex on existing towers, site restoration costs and capex on new tower rollouts
Page | 6

BHARTI INFRATEL : INITIATING COVERAGE
Sr No Rs mn GBT (40m height**)
RTT (21m height**)
Tower mix (70:30)
Life span for book/depreciation
purpose
Practical life span
Average life span for depreciation purpose (B) 13.1 11.1 12.5 Practical life span (C) 16.0 12.0 14.8 Depreciation per annum (Rs mn) (D=100/B) 7.6 9.0 8.0 Maintenance capex/per annum (Rs mn) (E=A/C) 0.15 0.13 0.14 Maintenance capex as % of revenue Peak tenancy 3.0 2.0 2.7
Rental revenue/tenant/month (adjusted for 2.5% escalation p.a. over contract duration of say 10 years and discount on multiple tenants)
35,000 25,500 32,150
Rental revenue (Rs mn) 1.3 0.6 1.0 Capex as % of revenue 11.6% 21.0% 13.6% Source : Bharti Infratel DRHP, HDFC sec Inst Research * assumed life span CAPEX GUIDANCE OF BIL (SA) Particulars FY14E FY15E FY16E Total Installation of 4,813 new towers 5,071 4,253 1,541 10,866 Upgradation and replacement on existing towers 5,049 5,307 1,785 12,141 Green initiatives at tower sites 2,991 2,768 634 6,394 Total 13,111 12,329 3,960 29,400 Source : Bharti Infratel DRHP, HDFC Sec Inst Research CIRCLE-WISE NEW GBT AND RTT ADDITIONS Circle category GBT RTT Total Category B 1,398 160 1,558 Category C 2,919 336 3,255 Total 4,317 496 4,813
Source : Company, HDFC sec Inst Research
CIRCLE-WISE ANNUALLY NEW TOWER ADDITIONS Circle category FY14E FY15E FY16E Total Category B 741 603 214 1,558 Category C 1,504 1,282 469 3,255 Total 2,245 1,885 683 4,813
Source : Company, HDFC sec Inst Research
Page | 7

BHARTI INFRATEL : INITIATING COVERAGE
ROUGH ECONOMICS OF TOWER BUSINESS
GBT RTT Blended Mix 70% 30% Capex 2,400 1,600 2,160 Rental 35,700 25,500 32,640 Debt:Equity 1:1 Tax rate 34% Escalation p.a 2.5% No of tenants 1.0 2.0 3.0 4.0 Capex (Rs 000) 2,160 2,268 2,381 2,500 Debt:Equity (x) 1:1 1:1 1:1 1:1 Rental/tenant/month (Rs) 32,640 29,376 27,173 25,814 Rental/tower/month (Rs) 32,640 58,752 81,518 103,257 Rental revenue (Rs 000) 392 705 978 1,239 Operating cost/tower/month (Rs) Rent 8,000 8,400 8,820 9,261 Employee cost 3,500 3,605 3,713 3,825 Site maintenance and other opex 12,000 12,360 12,731 13,113 Total 23,500 24,365 25,264 26,198 Operating cost (Rs 000) 282 292 303 314 EBITDA (Rs 000) 110 413 675 925 Margin % 28.0% 58.5% 69.0% 74.6% Asset Life 10 yrs 10 yrs 10 yrs 10 yrs Depreciation 216 227 238 250 EBIT (106) 186 437 675 Interest @ 10% 108 113 119 125 PBT (214) 72 318 550 Tax @ 33% (71) 24 105 181 PAT (144) 49 213 368 EBIT less tax (106) 125 293 452
ROCE % -4.9% 5.5% 12.3% 18.1% ROE % -13.3% 4.3% 17.9% 29.5% Source : HDFC sec Inst Research
A critical tenancy (~2), a prerequisite for Tower Co before it starts generating value
Page | 8

BHARTI INFRATEL : INITIATING COVERAGE
OTHER BUSINESS CHARACTERISTICS Annuity cash flows: Revenue growth led by more
towers may not be value accretive (Single tenant tower) has poor economics. Nevertheless, most new towers start with a single tenant and gradually ramp-up. However, as the tower gets additional tenants, it generates stable cash flow with fair amount of certainty, significantly higher incremental profitability and return ratios.
• Low churn: Towers are an integral part of the wireless service provider networks and shifting to another tower leasing company is quite inconvenient. The complexity in adjusting to a competitor’s tower sites, switching costs and exit penalties further reduce the churn rate.
While switching equipment may not be practical and economical, lower rentals by competing tower firms may put pressure on yields. Case in point is Reliance Jio - Rcom tower deal at ~50% below market rates. Tower rentals are 17-18% of the telcos’ revenue. We discuss this in detail in our risks section.
Technology agnostic: Tower infrastructure tends to be technology agnostic. Wireless service providers own their active equipment and therefore bear the technology risk. Thus, tower companies face low risk due to technology obsolescence. However, active infrastructure sharing, availability of additional spectrum, technological advancements leading to higher through-put (more minutes/data using same equipment and spectrum quantum) pose risk to towers and tenancy growth.
Business characteristics of the tower business: Annuity driven business Higher incremental
profitability Low churn Low risk from technology
obsolescence
Page | 9

BHARTI INFRATEL : INITIATING COVERAGE
BHARTI INFRATEL : OVERVIEW & INVESTMENT THESIS Bharti Infratel is the largest towerco in India, owning
35,288 towers on standalone basis as at Jun-13. The company has 42% stake in Indus Towers (Indus) having 111,983 towers as at Jun-13. BIL, after hitting the critical tenancy mark (tenancy of 1.91), is at an inflection point to capitalise on the growth revival of telcos.
Bharti Airtel incorporated Bharti Infratel in 2006 as a 100% subsidiary. Airtel transferred its towers to Infratel in Jan-08. In Nov-07, Bharti Infratel (42% share), Vodafone (42%) and Idea Cellular (16%) entered into a JV to form Indus Towers.
As part of the shareholders agreement, Indus operates exclusively in 15 circles with first right of refusal for all new towers and co-location requirement by JV partners. BIL (SA) operates in 11 circles, 4 of which overlap with Indus. BIL (SA) has first right of refusal for all new towers and co-location requirement of Bharti Airtel. In the four overlapping circles, BIL (SA) cannot build new towers, but has first right of refusal on incremental tenancy from the JV partners. BIL, along with Indus, provides superior pan-India coverage.
CIRCLEWISE MOBILE PENETRATION AND FOOTHOLD OF INDUS/INFRATEL
Circle Category Popn (mn) Active Subs (mn) Penetration % Presence of Indus
Presence of Infratel
DEL M 19 33 172% Y KOL M 17 18 103% Y MUM M 19 24 128% Y Sub M 3 55 75 135% ANP A 86 54 63% Y GUJ A 61 44 72% Y KAR A 61 44 73% Y MAH A 99 61 61% Y TAN A 70 53 76% Y Sub A 5 376 256 68% HAR B 26 16 62% Y Y KER B 35 26 74% Y MAP B 99 46 46% Y PUN B 30 25 83% Y RAJ B 70 42 60% Y Y UPE B 129 60 47% Y Y UPW B 88 41 46% Y Y WEB B 75 36 48% Y Sub B 8 552 292 53%
BIL’s tower footprint is well positioned to capture sector growth opportunities BIL enjoys exclusive presence in category B & C circles (except four overlapping circles) with first right of refusal on incremental tower and tenancy demand from Bharti Airtel Indus enjoys exclusive presence in Metro and category A circles with first right of refusal on incremental tower and tenancy demand from JV partners
Page | 10

BHARTI INFRATEL : INITIATING COVERAGE
Circle Category Popn (mn) Active Subs (mn) Penetration % Presence of
Indus Presence of
Infratel ASM C 31 12 40% Y BIH C 132 50 38% Y HIP C 7 6 86% Y JAK C 12 6 49% Y NOE C 13 7 53% Y ORI C 41 19 47% Y Sub C 6 237 101 42%
Grand Total 23 1,221 723 59% Indus footprint 885 576 65% BIL (SA) footprint* 650 306 47% BIL (SA) footprint** 337 147 44% Source: TRAI, HDFC sec Inst Research * including four overlapping circles with Indus towers ** excluding four overlapping circles with Indus towers Growth drivers 2G coverage co-location demand, especially from incumbents :
Active wireless sim penetration in India at 59% is still low. Unique person penetration would be even lower. Thus penetration led growth is still not saturated. Further, rural penetration is mere 41%, while urban penetration is at whopping 147% (as at Mar-13) indicating huge potential to expand footprint in rural areas.
Active subscriber additions were impacted in FY13 due to service tax increase, reduction in channel commissions in Aug-12, stringent customer acquisition norms in Nov-12 and roll back of operations by Aircel, Tata, Uninor and MTS.
With things returning to normalcy, we estimate the telecom industry to add ~60mn active subscribers p.a. in the medium term (~7.5% CAGR over FY13-17), primarily from rural India.
With active subscriber penetration at 59% (people penetration even lower), voice led revenue and hence network expansion not yet saturated
Page | 11

BHARTI INFRATEL : INITIATING COVERAGE
Active subs : penetration led growth not yet saturated Active subs quarterly additions trend
Source : TRAI, Company, HDFC sec Inst Research **Growth and Penetration is on gross subs upto FY10 and on active subs since FY11
Source : TRAI, Company, HDFC sec Inst Research
INDUSTRY PROJECTIONS OF ACTIVE SIM BY TECHNOLOGY (mn) FY08 FY09 FY10E FY11E FY12E FY13E FY14E FY15E FY16E FY17E 2G 234 301 403 557 638 649 661 655 631 593 3G 3 17 45 97 153 222 301 379 4G - - - - 1 2 4 12 Total 234 301 406 574 683 746 815 879 936 984 Source: Bharti Infratel DRHP (Analysys Mason), HDFC sec Inst Research
2G network expansion (especially in rural areas) has been slow owing to intensive competition, declining RPM, significant rise in debt on account of 3G/4G auctions, acquisitions and regulatory uncertainties. With the dust settling down, we expect network expansion to revive. We see decent potential for tenancy growth on this aspect, led by incumbents.
Bharti may look to maintain its network lead over peers. At the same time, Vodafone and Idea may look to further bridge coverage gaps with Bharti. We
believe it may be difficult for incumbents to find ex-Indus, ex-BIL towers for expansion. Key assumption here is coverage of incumbents supersedes peers with competition imitating incumbents’ footprint.
We highlight that 2G spectrum holding of Bharti exceeds that of Vodafone and Idea, both in terms of quantity and quality (900MHz vs. 1800 MHz). 900MHz provides wider coverage compared to 1800MHz thus necessitating more BTS especially in sparsely populated rural areas.
Vodafone and Idea have been growing at a faster clip chasing Bharti Airtel, but have lower spectrum holding especially in 900MHz which provides a superior coverage It would thus necessitate a higher site count and tower demand for Vodafone & Idea Bharti may also look to maintain its network quality lead with a dense network
-
10.0
20.0
30.0
40.0
50.0
60.0
3QFY
11
4QFY
11
1QFY
12
2QFY
12
3QFY
12
4QFY
12
1QFY
13
2QFY
13
3QFY
13
4QFY
13
1QFY
14
Active subs addition Active subs addition of B+I+V
Mn
0%
15%
30%
45%
60%
75%
90%
-
200
400
600
800
1,000
1,200
FY06
FY07
FY08
FY09
FY10
FY11
FY12
FY13
FY14
E
FY15
E
FY16
E
FY17
E
Gross subs Active subsGrowth %* (RHS) Penetration %** (RHS)
Mn
Page | 12

BHARTI INFRATEL : INITIATING COVERAGE
SPECTRUM HOLDING OF INCUMBENTS IN 900MHZ AND 1800MHZ BAND
Circle Circle Category
Bharti Vodafone Idea Presence of Indus
Presence of Infratel 900 1800 Total 900 1800 Total 900 1800 Total
Delhi M 8.0 2.0 10.0 8.0 2.0 10.0 8.0 8.0 Y Kolkata M 9.2 9.2 8.0 2.0 10.0 4.4 4.4 Y Mumbai M 6.2 1.8 8.0 7.8 2.0 9.8 5.0 5.0 Y Chennai M 6.2 2.4 8.6 8.0 8.0 5.0 5.0 Y Maharashtra A 8.2 8.2 6.2 6.2 7.8 2.0 9.8 Y Gujarat A 6.2 6.2 7.8 2.0 9.8 6.2 6.2 Y Andhra Pradesh A 7.8 2.2 10.0 6.2 6.2 6.2 1.8 8.0 Y Karnataka A 7.8 2.2 10.0 8.0 8.0 6.2 6.2 Y Tamilnadu (excl. Chennai) A 6.2 2.4 8.6 6.2 1.0 7.2 5.0 5.0 Y Kerala B 6.2 6.2 6.2 6.2 6.2 1.8 8.0 Y Punjab B 7.8 7.8 6.2 6.2 7.8 7.8 Y Haryana B 6.2 6.2 6.2 6.2 6.2 6.2 Y Y UP (West) B 6.2 6.2 6.2 6.2 6.2 1.8 8.0 Y Y UP (East) B 6.2 1.0 7.2 6.2 2.0 8.2 6.2 6.2 Y Y Rajasthan B 6.2 2.0 8.2 6.2 6.2 6.2 6.2 Y Y Madhya Pradesh B 8.0 8.0 4.4 4.4 6.2 1.8 8.0 Y West Bengal B 4.4 1.8 6.2 4.4 1.8 6.2 5.0 5.0 Y Himachal Pradesh C 6.2 6.2 4.4 4.4 4.4 4.4 Y
Bihar C 6.2 3.0 9.2 4.4 4.4 4.4 4.4 Y Orissa C 6.2 1.8 8.0 4.4 4.4 5.0 5.0 Y Assam C 1.8 4.4 6.2 4.4 4.4 5.0 5.0 Y North East C 4.4 1.8 6.2 4.4 4.4 5.0 5.0 Y J&K C 6.2 6.2 4.4 4.4 5.0 5.0 Y Total Holding 97.8 79.0 176.8 79.4 72.0 151.4 59.0 82.8 141.8 Average Holding 4.3 3.4 7.7 3.5 3.1 6.6 2.6 3.6 6.2 Source : TRAI, HDFC sec Inst Research
Page | 13

BHARTI INFRATEL : INITIATING COVERAGE
NETWORK EXPANSION OF INCUMBENT OPERATORS No of cell sites FY10 FY11* FY12 FY13 – 2G Bharti 104,826 116,261 120,905 133,778 Idea 66,187 73,668 83,190 90,182 Vodafone 93,948 100,680 110,004 115,000 Total 264,961 290,609 314,099 338,960 – 3G Bharti 8,000 16,162 24,573 Idea 5,000 12,825 17,140 Vodafone 6,500 14,494 20,857 Total - 19,500 43,481 62,570 – Total Bharti 104,826 124,261 137,067 158,351 Idea 66,187 78,668 96,015 107,322 Vodafone 93,948 107,180 124,498 135,857 Total 264,961 310,109 357,580 401,530 Incremental sites additions – 2G Bharti 11,435 4,644 12,873 Idea 7,481 9,522 6,992 Vodafone 6,732 9,324 4,996 Total 25,648 23,490 24,861 – 3G Bharti 8,000 8,162 8,411 Idea 5,000 7,825 4,315 Vodafone 6,500 7,994 6,363 Total 19,500 23,981 19,089 –Total Bharti 19,435 12,806 21,284 Idea 12,481 17,347 11,307 Vodafone 13,232 17,318 11,359 Total 45,148 47,471 43,950 Source: Company, HDFC sec Inst Research * Assumed Uptick in ~40% single tenant tower, key trigger
As of Sep-12, 44% of BIL’s standalone and 37% of Indus towers had a single tenant. These towers are primarily in the rural areas. With limited incremental capex and opex on these towers, network expansion
by any of the incumbents in these locations would significantly boost the earnings of BIL. An additional tenant on a single tenant tower would add ~Rs 10bn to BIL’s EBITDA and Rs 6.7bn to earnings (24% and 49% of FY14E respectively).
Page | 14

BHARTI INFRATEL : INITIATING COVERAGE
INCREMENTAL UPSIDES FROM SINGLE TENANT TOWERS
BIL standalone Indus Blended Portfolio
No of towers (A) 34,220 110,561 144,781 No of tenants (B) 62,027 219,687 281,714 Tenancy ratio (B/A) 1.81 1.99 1.95 Avg yield/tenant in FY13 (Rs) 37,191 31,520 32,768 Tower mix GBT:RTT 89:11 63:37 69:31
No of towers with single tenant (C) 15,553 41,855 57,408 % of towers with single tenant No of towers with multiple tenant (D=A-C) 18,667 68,706 87,373 Tenancies (E=B-C) 46,474 177,832 224,306 Tenancy ratio (E/D) 2.49 2.59 2.57
Avg yield/tenant on single tenant tower (assumed 10% higher than avg) (Rs) 40,910 34,672 36,045
Incremental yield/tower from additional tenant on single tenant tower 32,728 27,737 28,836 (2*yield/tenant on single tower*90%-yield/tenant on single tower) Incremental revenue from additional tenant on single tenant tower (Rs mn) 6,108 13,931 20,040 Incremental EBITDA margin (%) 85% 85% 85% Incremental EBITDA (Rs mn) 5,192 11,842 17,034
Incremental EBITDA of BIL including 42% share in Indus (Rs mn) 10,166 FY14E Consolidated EBITDA 42,267 % increase in EBITDA 24% Tax rate @ 34% 3,456 Incremental PAT (Rs mn) 6,709 FY14E Consolidated PAT 14,025 % increase in PAT 48% Source : Bharti Infratel DRHP, HDFC sec Inst Research
2G coverage co-location demand from others We expect limited scope for growth on this account
due to stretched balance sheets the challengers face. In urban areas, tower demand, if any from challengers would see healthy competition.
Competing tower firms have decent presence here. Non-urban demand, if any, has higher chances to end up with BIL (standalone) or Indus.
45% of BIL (SA) towers and 37% of Indus towers had single tenant as of Sep-12. An additional tenant on this tower would add ~Rs 10bn to BIL’s EBITDA and Rs 6.7bn to PAT.
Page | 15

BHARTI INFRATEL : INITIATING COVERAGE
Data growth, a potential long term growth driver
Data (3G and 4G/BWA network expansion) is expected to be the next revenue growth driver for operators as growth in voice business moderates. Data accounts for 6-7% of telcos’ wireless revenue (after witnessing a growth of ~100% YoY in FY13) vs. 25-30% in developed markets. Accelerated and sustained investments by operators in expanding their 3G and BWA networks presents a long term revenue growth opportunity for tower industry.
Our interaction with equipment supplier reveals that as a thumb rule, addressable market for 3G services could be presumed at ~50% and for 4G at 25% of 2G. Growth potential from 3G and 4G services remains significantly higher.
An important factor to consider for 3G/BWA tenancy potential is the higher tower density for these technology led data services on assigned spectrum bands. In the May-10 auction, 3G spectrum was assigned in 2100MHz band and 4G in 2300MHz band.
INDUSTRY PROJECTIONS OF INSTALLED BASE OF TOWERS AND TENANCY
FY08 FY09 FY10 FY11 FY12 FY13 FY14 FY15 FY16 FY17 Growth CAGR FY13-17
Towers (000’s) 258 290 309 361 376 387 396 405 413 420 2% Tenancy (x) 1.05 1.13 1.38 1.60 1.70 1.77 1.90 2.11 2.27 2.46 9% BTS (000’s) 271 328 426 578 639 685 752 855 938 1,034 11% - 2G 670 697 731 735 735 2% - 3G 13 39 78 126 194 97% - 4G 2 16 46 77 105 169% Source: Bharti Infratel DRHP, Analysys Mason, HDFC sec Inst Research SITES REQUIRED FOR COVERING 1,000 SQUARE KILOMETER DENSE URBAN AREA IN DIFFERENT FREQUENCY BANDS
Spectrum band No of sites BTS multiplier of 900 MHz (x) 900 485
1800 777 1.6 2100 914 1.9 2300 1,572 3.2 2600 1,804 3.7
Source: Bharti Infratel DRHP (Analysys Mason), HDFC sec Inst Research
Data to be a long term revenue growth driver led by incremental loading (rental revenue) in the near term and additional coverage/capacity sites demand (fresh tenancy) in medium to long term
Interaction with equipment suppliers reveals that addressable market and thus site requirement for 3G could be presumed at ~50% and for 4G at 25% of 2G.
Page | 16

BHARTI INFRATEL : INITIATING COVERAGE
BTS MULTIPLES FOR MIGRATION AMONG FREQUENCY BANDS IN DENSE URBAN AREAS
Base Frequency Band New frequency band
900 MHz 1800 MHz 2100 MHz 2300 MHz 2600 MHz 900 MHz 1x 1.6x 1.9x 3.2x 3.7x
1800 MHz 1x 1.2x 2x 2.3x 2100 MHz 1x 1.7x 2x 2300 MHz 1x 1.1x 2600 MHz 1x
Source: Bharti Infratel DRHP (Analysys Mason), HDFC sec Inst Research
3G/BWA tenancy to take time to show-up
3G/BWA networks are initially expected to stay restricted to urban/sub-urban areas. 2G networks are fairly dense in these areas to take care of capacity requirements and hence 3G/BWA may not demand fresh sites in the near term.
Revenue growth potential from 3G/BWA would come from (1) loading factor (additional equipments) on the existing 2G cell sites in near term and fresh cell site requirement for additional coverage/capacity co-location demand, a long term growth driver. Note that the 3G/BWA loading would show up in the revenue/tenant part of the equation (Revenue = Number of towers * tenants/tower * rental/tenant). This is because expansion of a 2G site to 2G+3G is considered as an additional loading from tower business perspective, instead of additional tenancy.
Tower companies charge between 5-15% of the base rental for additional equipment loading on account of 3G. Lower rental (5-15%) is charged for additional equipments (3G/BWA) to enable faster roll-outs and due to significantly higher price paid by telecom
service providers for spectrum acquisition. However, this reduces the earnings potential for tower companies. As per BIL management, additional coverage/capacity sites for 3G/BWA would necessitate fresh tower demand with BIL (SA)/Indus. This is because the site coverage of competing tower companies mirror BIL (SA)/Indus and thus lack presence where new tower build-out is required.
With a significantly lower rental for loading, we foresee limited incentives for telecom operators to pay higher rental for additional coverage/capacity sites for 3G/BWA. We are thus building the incremental tenancy upsides primarily led by 2G network expansion and 3G/BWA expansion to improve the yield.
One could also argue that renewal of 2G spectrum (900/1800) at a significant premium to erstwhile cost may put pressure on the existing tower rentals. We highlight, tower rentals constitutes ~17-18% of the telcos operating cost.
Tenancy led growth for data opportunities to be a significant long term revenue growth driver led by additional capacity sites demand (fresh tenancy)
However we remain conservative and thus build the incremental tenancy upsides primarily led by 2G network expansion and 3G/BWA expansion to improve the yield.
Page | 17

BHARTI INFRATEL : INITIATING COVERAGE
VALUATION AND KEY ASSUMPTIONS Led by a low-risk annuity business model, strong FCF
(~7% average yield over FY14-15E) and potential for tenancy surprise led by data, we think current valuations at 6.4/5.6x FY14/15E EV/EBITDA are reasonable. We value BIL (SA) and stake in Indus
towers separately (ascribing 20% holdco discount) on DCF basis with Sep-14 SoTP of Rs 198.
We value BIL on SOTP basis ascribing separate DCF-based value to BIL (SA) and Indus Towers.
DISCOUNTED FREE CASH FLOW – BIL (SA)
FY15E FY16E FY17E FY18E FY19E FY20E FY21E FY22E FY23E EBIT 9,171 12,823 14,401 15,343 16,268 17,565 19,053 20,763 22,602 (-) Tax (3,109) (4,347) (4,882) (5,201) (5,515) (5,954) (6,459) (7,039) (7,662) Depreciation 12,694 11,061 11,224 11,392 11,547 11,696 11,847 11,999 12,278 Capex (12,329) (6,460) (7,036) (6,975) (6,909) (7,155) (7,335) (7,562) (11,978) Working capital change 797 (207) 1,913 864 5,418 1,699 1,680 1,895 1,419 FCFF 7,224 12,869 15,621 15,424 20,809 17,851 18,787 20,056 16,659 Disc factor 1.06 1.17 1.30 1.44 1.60 1.78 1.97 2.19 2.43 Disc FCFF 6,847 10,990 12,017 10,690 12,993 10,041 9,521 9,157 6,852 Source: HDFC sec Inst Research DISCOUNTED FREE CASH FLOW – INDUS TOWERS (FOR BIL’S PROPORTIONATE SHARE OF 42%)
FY15E FY16E FY17E FY18E FY19E FY20E FY21E FY22E FY23E EBIT 12,392 13,967 15,621 16,723 17,758 19,175 20,761 22,545 24,425 (-) Tax (4,201) (4,735) (5,295) (5,669) (6,020) (6,500) (7,038) (7,643) (8,280) Depreciation 12,097 12,408 12,547 12,709 12,852 12,985 13,118 13,249 13,506 Capex (8,595) (7,165) (8,481) (8,423) (8,360) (8,673) (8,907) (9,200) (13,721) Working capital change 202 (1,054) 1,849 2,052 (461) 103 396 151 4,473 FCFF 11,895 13,421 16,240 17,392 15,768 17,090 18,330 19,103 20,403 Disc factor 1.06 1.17 1.30 1.44 1.60 1.78 1.97 2.19 2.43 Disc FCFF 11,275 11,461 12,494 12,054 9,845 9,613 9,289 8,721 8,392 Source: HDFC sec Inst Research
Page | 18

BHARTI INFRATEL : INITIATING COVERAGE
VALUATION SUMMARY*
BIL (SA) Indus Towers BIL Consolidated PV of FCF 89,107 93,143 182,250 TV of FCF 85,650 104,899 190,549 Enterprise value 174,757 198,042 372,799 Net debt/(cash) (64,593) 29,831 (34,762) Equity value 239,350 168,211 407,561 O/s shares 1,889 1,889 1,889 Equity value/share 127 89 216 Holding Co discount (20%) (18) (18) Equity value/share 127 71 198 Source: HDFC sec Inst Research * DCF value is based on WACC of 11% and terminal growth rate of 3% SENSITIVITY ANALYSIS OF TP TO KEY VARIABLES
BIL Standalone Indus Tower** BIL Consol Yield/tenant
-5% (14) (14) (28) 5% 14 14 28
Tenants* -5% (12) (12) (28) 5% 12 12 28
* Assumed 85% incremental EBITDA margin % ** For 42% proportionate share of BIL and adjusted for 20% holding company discount SENSITIVITY ANALYSIS OF TP TO KEY VARIABLES
WACC (%) Terminal Growth (%)
2% 3% 4% 5% 10% 209 222 241 267 11% 188 198 211 228 12% 171 179 188 200 13% 158 163 170 179 14% 147 151 156 162
Source: HDFC sec Inst Research
Page | 19

BHARTI INFRATEL : INITIATING COVERAGE
BIL (SA) Rs mn FY11 FY12 FY13 FY14E FY15E FY16E FY17E FY18E Rental Income 23,898 26,082 27,441 30,227 33,289 35,985 38,302 40,036 Energy costs 13,907 15,499 17,160 18,874 21,095 22,598 23,891 24,898 Total Income 37,805 41,582 44,601 49,100 54,384 58,583 62,193 64,934 Energy costs 14,001 15,647 16,942 18,634 20,827 22,311 23,587 24,581 Lease rentals 2,107 2,184 2,382 2,605 2,809 2,961 3,076 3,201 Employee expenses 1,918 2,003 2,087 2,254 2,434 2,629 2,839 3,066 Other expenses 5,366 5,392 5,470 5,982 6,449 6,799 7,065 7,350 Expenses 23,392 25,227 26,881 29,475 32,519 34,700 36,568 38,199 EBITDA 14,413 16,355 17,720 19,625 21,865 23,884 25,625 26,735 D&A Exps 9,791 10,588 11,086 11,867 12,694 11,061 11,224 11,392 EBIT 4,622 5,767 6,634 7,758 9,171 12,823 14,401 15,343 Other income 890 1,111 2,508 4,955 6,459 7,213 8,068 8,900 Finance cost 361 10 7 - - - - - PBT 5,151 6,867 9,166 12,713 15,630 20,035 22,469 24,244 Tax 1,564 2,375 3,118 4,310 5,299 6,792 7,617 8,219 PAT 3,587 4,492 6,048 8,404 10,332 13,243 14,852 16,025 Dividend from Indus - - 4,050 3,844 4,969 5,986 6,940 7,757 Total PAT 3,587 4,492 10,098 12,247 15,301 19,229 21,792 23,782
Capex 10,422 7,114 9,282 13,111 12,329 6,460 7,036 6,975 Capex as % of revenue 43.6% 27.3% 33.8% 43.4% 37.0% 18.0% 18.4% 17.4% Key operating parameters No of towers 32,775 33,147 35,119 37,364 39,249 39,932 40,731 41,545 No of tenants 57,621 60,160 63,573 70,021 76,369 82,034 87,123 90,942 Avg sharing factor 1.70 1.79 1.81 1.84 1.91 2.00 2.10 2.16 Avg sharing rev/tenant/mth (Rs) 37,009 36,908 37,191 37,709 37,900 37,863 37,738 37,474 Rental Income 62,883 65,943 66,995 69,503 72,418 75,745 79,140 81,102 Energy costs 36,595 39,186 41,895 43,398 45,891 47,566 49,364 50,435 Total Income 99,477 105,128 108,890 112,901 118,310 123,311 128,503 131,537 Power and fuel 36,841 39,559 41,363 42,847 45,308 46,962 48,737 49,794 Lease rentals 5,545 5,523 5,815 5,990 6,110 6,232 6,357 6,484 Employee benefits expenses 5,047 5,065 5,095 5,183 5,296 5,534 5,867 6,212 Other expenses 14,119 13,632 13,355 13,755 14,030 14,311 14,597 14,889 Expenses 61,552 63,779 65,628 67,775 70,744 73,039 75,557 77,379 EBITDA 37,925 41,349 43,262 45,126 47,566 50,272 52,946 54,158 Opex ex power & fuel 24,711 24,220 24,265 24,928 25,436 26,077 26,820 27,585 Source: Company, HDFC sec Inst Research
Page | 20

BHARTI INFRATEL : INITIATING COVERAGE
INDUS TOWER – BIL’S PROPORTIONATE SHARE Rs mn FY11 FY12 FY13 FY14E FY15E FY16E FY17E FY18E Rental Income 29,233 32,922 34,567 36,828 39,193 41,507 43,709 45,435 Energy costs 15,569 17,559 20,820 22,063 23,859 24,879 25,745 26,402 Total Income 44,802 50,481 55,387 58,891 63,051 66,385 69,454 71,837 Energy costs 16,150 17,971 21,074 22,223 23,914 24,810 25,545 26,064 Lease rentals 9,417 10,234 10,373 5,769 5,987 6,168 6,339 6,530 Employee expenses 936 1,093 1,252 1,352 1,460 1,577 1,703 1,840 Other expenses 5,850 6,570 6,812 6,905 7,202 7,455 7,700 7,971 Expenses 32,354 35,868 39,511 36,250 38,563 40,011 41,286 42,406 EBITDA 12,448 14,613 15,876 22,641 24,488 26,375 28,167 29,432 D&A Exps 5,895 6,657 6,870 11,090 12,097 12,408 12,547 12,709 EBIT 6,553 7,956 9,006 11,551 12,392 13,967 15,621 16,723 Other income 287 353 718 410 771 1,365 1,765 2,457 Finance cost 3,966 4,061 3,939 3,456 3,389 3,559 3,737 3,924 PBT 2,874 4,248 5,785 8,504 9,773 11,773 13,649 15,256 Tax 961 1,361 1,980 2,883 3,313 3,991 4,627 5,172 PAT 1,913 2,888 3,805 5,621 6,460 7,782 9,022 10,085
Capex 12,663 7,808 9,774 8,887 8,595 7,165 8,481 8,423 Capex as % of rev. 43.3% 23.7% 28.3% 24.1% 21.9% 17.3% 19.4% 18.5%
Key operating parameters No of towers 103,230 108,732 109,325 111,819 114,614 116,907 118,076 119,847 No of tenants 178,144 201,106 213,685 221,511 235,363 248,998 261,168 272,099 Avg sharing factor 1.62 1.79 1.90 1.99 2.02 2.09 2.17 2.24 Avg sharing rev/tenant/month (Rs) 28,373 30,587 31,496 31,520 31,987 32,110 32,286 32,525
Per tower per month (Rs) Rental Income 54,728 59,912 62,028 64,541 67,176 70,095 72,900 74,660 Energy costs 29,147 31,955 37,359 38,666 40,894 42,013 42,939 43,385 Total Income 83,875 91,866 99,388 103,207 108,070 112,108 115,840 118,045 Power and fuel 30,236 32,704 37,816 38,947 40,988 41,898 42,605 42,830 Lease rentals 17,630 18,624 18,614 10,110 10,262 10,416 10,572 10,731 Employee benefits exps 1,753 1,989 2,247 2,370 2,503 2,663 2,841 3,023 Other exps 10,952 11,956 12,224 12,101 12,343 12,590 12,842 13,099 Expenses 60,571 65,273 70,899 63,528 66,097 67,568 68,860 69,682 EBITDA 23,304 26,593 28,488 39,679 41,973 44,540 46,980 48,363 Opex ex P&F 30,335 32,569 33,084 24,581 25,108 25,669 26,255 26,852 Source: Company, HDFC sec Inst Research
Decline in lease rental/tower/month is owing to merger of Bharti Infratel’s towers with Indus Towers w.e.f June-13 leading to cease of IRU arrangement
Page | 21

BHARTI INFRATEL : INITIATING COVERAGE
KEY RISKS
Sustainability of tenancy : Several telcos are struggling for viability of business. Tower companies hosting them face business continuity risk from such customers. Post the license cancellation by the Supreme Court, Uninor curtailed operations in 7 circles, Tata in 3 and MTS in 12. Further, led by financial stress, Aircel & Tata have scaled down operations. We highlight that in FY13 BIL standalone witnessed a loss of 1,138 tenants and Indus Towers (on 100% basis) of 4,990 tenants.
However, tower companies with higher quality tenants should enjoy superior multiples. We believe ~90% of the BIL (SA) plus Indus tenancies is from strong and profitable telcos viz. Bharti, Idea and Vodafone.
Sustainability of rental/tenant : BIL runs the risk of decline in rental/tenant led by financial strain of telecom operators. Tower company payout accounts for 17-18% of telecom operators’ revenue. While the long term demand-supply remains favorable, overcapacity in the tower industry in the near term may put pressure on rentals.
A case in point is Reliance Jio – Rcom deal. We see this as a special case where a large buyer is squeezing a desperate seller in need of cash. We don’t foresee this to significantly impact market rentals.
Reliance Jio (RIL’s subsidiary for telecom business) signed an agreement with Rcom to utilise upto 45,000 towers of the later. Deal value is over Rs 120bn over lifetime of the contract. In the absence of contract duration, timeframe for absorption of 45k towers and payment terms (front or back ended), it is difficult to arrive at an implied monthly tower rentals. Nevertheless, going by the financial strain of Rcom, RIL’s bargaining strength and the size of deal, it is fair to assume rentals to be at a significant discount to market rates.
We foresee limited possibility of competing tower companies especially Bharti Infratel or Indus witnessing pressure of losing tenancy to Rcom or on their rentals. This is due to lack of economic value (ref table) on account of cost of transitioning equipments and agreement covenants. Further, post leasing of towers to Jio, tenancy of Rcom would stand at 2.8 leaving limited room for additional tenants especially at preferred tower position.
IMPLIED MONTHLY RENTAL FOR RCOM FROM TOWER LEASE ARRANGEMENT WITH RELIANCE JIO Deal value over contract duration (Rs mn) 120,000 120,000 120,000 120,000 Contract duration (no of years) (assumed) 17 8 10 14 Deal value p.a. (Rs mn) 7,059 15,000 12,000 8,571 No of towers (Nos) 45,000 45,000 45,000 45,000 Rental/tower/month (Rs) 13,072 27,778 22,222 15,873 % discount to BIL standalone's rental 65% 25% 40% 57% % discount to Indus tower rental 59% 12% 29% 50% Source: Company, HDFC sec Inst Research
Page | 22
BHARTI INFRATEL : INITIATING COVERAGE
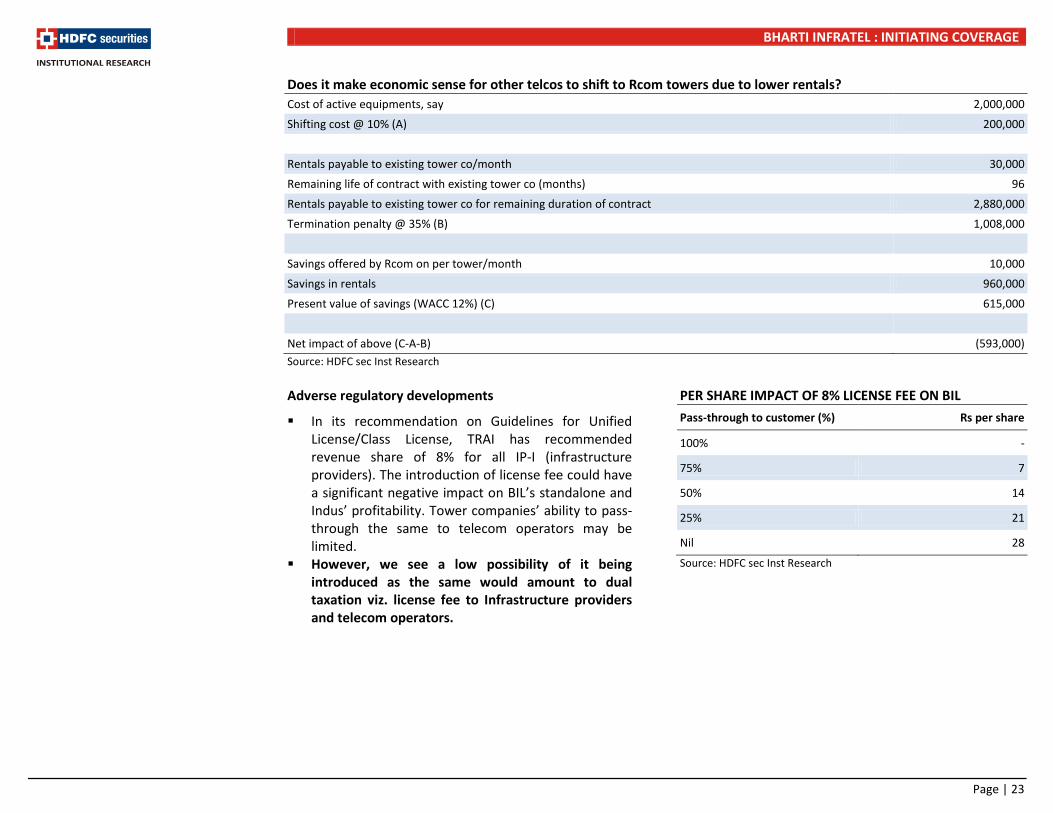
Does it make economic sense for other telcos to shift to Rcom towers due to lower rentals? Cost of active equipments, say 2,000,000
Shifting cost @ 10% (A) 200,000
Rentals payable to existing tower co/month 30,000
Remaining life of contract with existing tower co (months) 96
Rentals payable to existing tower co for remaining duration of contract 2,880,000
Termination penalty @ 35% (B) 1,008,000
Savings offered by Rcom on per tower/month 10,000
Savings in rentals 960,000
Present value of savings (WACC 12%) (C) 615,000
Net impact of above (C-A-B) (593,000) Source: HDFC sec Inst Research Adverse regulatory developments
In its recommendation on Guidelines for Unified License/Class License, TRAI has recommended revenue share of 8% for all IP-I (infrastructure providers). The introduction of license fee could have a significant negative impact on BIL’s standalone and Indus’ profitability. Tower companies’ ability to pass-through the same to telecom operators may be limited.
However, we see a low possibility of it being introduced as the same would amount to dual taxation viz. license fee to Infrastructure providers and telecom operators.
PER SHARE IMPACT OF 8% LICENSE FEE ON BIL Pass-through to customer (%) Rs per share
100% -
75% 7
50% 14
25% 21
Nil 28
Source: HDFC sec Inst Research
Page | 23

BHARTI INFRATEL : INITIATING COVERAGE
OTHER OBSERVATIONS
Conflict of interest with minority shareholders Most Indian tower companies are owned by the
telcos who are also anchor tenants. This makes conflict of interest issue with minority shareholders. For instance,
• Green Capex : In the 4QFY13 concall BIL management highlighted the low profitability of energy saving green capex. Management claims that green capex makes towers more attractive for tenants. However, we believe this is inconsistent as the relationship with anchor tenant (owners) is well established. The fact is the capex risk lies with the tower companies and thus detrimental for minority shareholders.
• Decline in rental/tenant : It is difficult to foresee a decline in rentals. Nevertheless, a decline in rentals would be value depletive for tower companies and minority shareholders. However, value depletion of majority shareholders would be off-set by increase in core mobile business. One such instance of discounts offered to anchor tenants was observed in June-12. Another such instance runs the risk of estimates and fair value.
Utilisation of Cash At end-FY13, BIL (SA) had net cash of ~Rs 63bn
(including Rs 26bn interest bearing loan to related parties). BIL’s current financial position is sub-optimal and value dilutive, especially for standalone business. BIL consolidated had net cash of Rs 34bn at end-FY13. BIL management targets an optimal net debt/EBITDA of 2x. However, current net debt to EBITDA of BIL standalone is -3.5x, Indus is 2.5x and BIL consolidated at -1x.
BIL’s cash utilisation would thus be keenly watched. A better use of cash would be higher dividend payment (one time or step-up), stock buyback or good acquisitions. Management has indicated capex and acquisitions as the main route for optimal leveraging. Capex cycle for towers in India is largely over. Acquisitions come with the risk of overpayment and subsequent integration issues. If the cash is not put to use, it would suppress ROE ramp up.
Tax on dividend from Indus – leakage of money BIL would be unable to offset dividend tax of ~17% on
dividend distributed by JV company Indus Towers, as it is not a subsidiary. Subsequently, it leads to higher dividend tax outgo and penalizes shareholders. We thus ascribe a 20% holding company discount to Indus’ valuation for derivation of TP of BIL.
Page | 24

BHARTI INFRATEL : INITIATING COVERAGE
PEER VALUATION
Companies CMP Mcap ($ mn)
EV/EBITDA P/E P/B ROE % FY14E FY15E FY14E FY15E FY14E FY15E FY14E FY15E
Bharti Infratel 159 4,862 6.4 5.6 21.4 17.9 1.7 1.6 8.0 9.3 Bharti Airtel 332 21,469 6.6 5.5 29.8 19.4 2.1 1.9 8.6 11.3 Idea Cellular 182 9,766 8.6 6.9 35.5 24.3 3.8 3.3 11.2 14.4 US tower companies* American Tower 73 28,847 17.6 15.4 40.8 29.9 7.7 7.2 19.6 22.6 Crown Castle 71 20,868 18.0 17.0 124.7 61.5 6.5 5.9 6.2 13.9 SBA Communications 78 9,974 19.6 17.7 NA NA NA NA NA NA Indonesian* Tower Bersama** 0.5 2,420 15.6 12.7 23.2 17.8 5.4 4.2 26.3 25.9 Source: Bloomberg, HDFC sec Inst Research * Valuation of US and Indonesian tower company is on CY13 and CY14 basis ** Tower Bersama CMP and Mcap is in USD
Bharti Infratel trades at significant discount to US tower companies. However it is not directly comparable owing to difference in cost of capital.
Page | 25
BHARTI INFRATEL : INITIATING COVERAGE
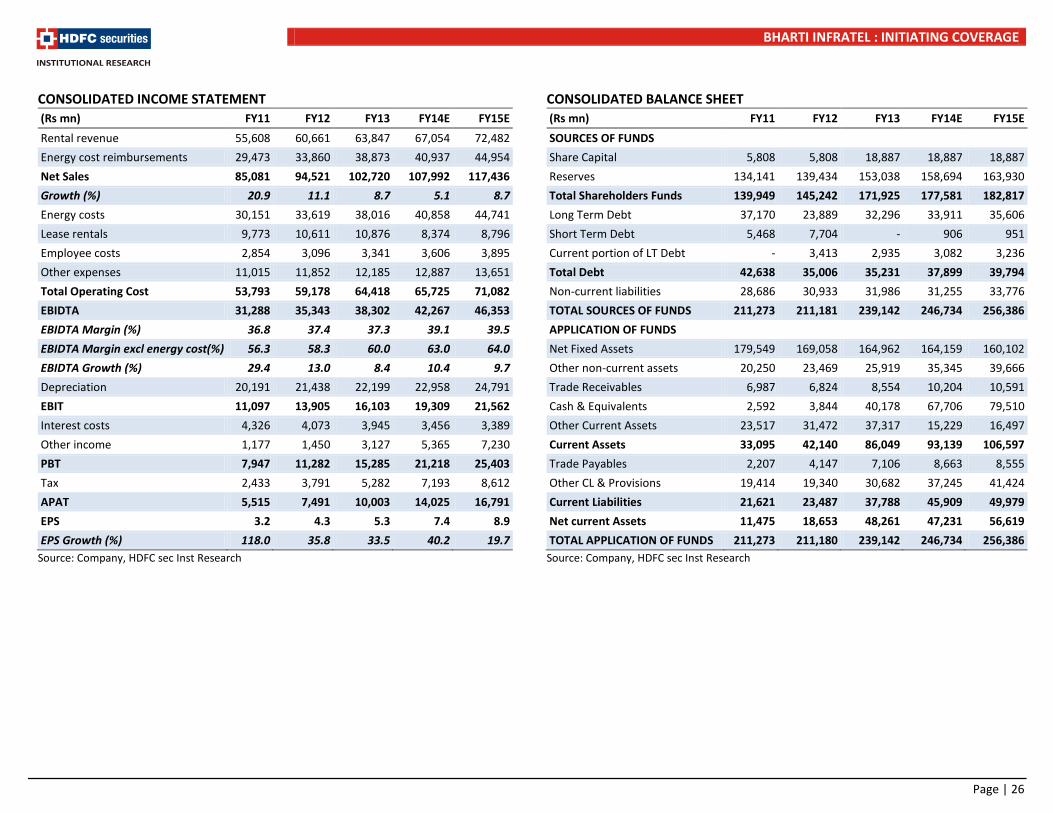
CONSOLIDATED INCOME STATEMENT (Rs mn) FY11 FY12 FY13 FY14E FY15E Rental revenue 55,608 60,661 63,847 67,054 72,482 Energy cost reimbursements 29,473 33,860 38,873 40,937 44,954 Net Sales 85,081 94,521 102,720 107,992 117,436 Growth (%) 20.9 11.1 8.7 5.1 8.7 Energy costs 30,151 33,619 38,016 40,858 44,741 Lease rentals 9,773 10,611 10,876 8,374 8,796 Employee costs 2,854 3,096 3,341 3,606 3,895 Other expenses 11,015 11,852 12,185 12,887 13,651 Total Operating Cost 53,793 59,178 64,418 65,725 71,082 EBIDTA 31,288 35,343 38,302 42,267 46,353 EBIDTA Margin (%) 36.8 37.4 37.3 39.1 39.5 EBIDTA Margin excl energy cost(%) 56.3 58.3 60.0 63.0 64.0 EBIDTA Growth (%) 29.4 13.0 8.4 10.4 9.7 Depreciation 20,191 21,438 22,199 22,958 24,791 EBIT 11,097 13,905 16,103 19,309 21,562 Interest costs 4,326 4,073 3,945 3,456 3,389 Other income 1,177 1,450 3,127 5,365 7,230 PBT 7,947 11,282 15,285 21,218 25,403 Tax 2,433 3,791 5,282 7,193 8,612 APAT 5,515 7,491 10,003 14,025 16,791 EPS 3.2 4.3 5.3 7.4 8.9 EPS Growth (%) 118.0 35.8 33.5 40.2 19.7
Source: Company, HDFC sec Inst Research
CONSOLIDATED BALANCE SHEET (Rs mn) FY11 FY12 FY13 FY14E FY15E SOURCES OF FUNDS Share Capital 5,808 5,808 18,887 18,887 18,887 Reserves 134,141 139,434 153,038 158,694 163,930 Total Shareholders Funds 139,949 145,242 171,925 177,581 182,817 Long Term Debt 37,170 23,889 32,296 33,911 35,606 Short Term Debt 5,468 7,704 - 906 951 Current portion of LT Debt - 3,413 2,935 3,082 3,236 Total Debt 42,638 35,006 35,231 37,899 39,794 Non-current liabilities 28,686 30,933 31,986 31,255 33,776 TOTAL SOURCES OF FUNDS 211,273 211,181 239,142 246,734 256,386 APPLICATION OF FUNDS Net Fixed Assets 179,549 169,058 164,962 164,159 160,102 Other non-current assets 20,250 23,469 25,919 35,345 39,666 Trade Receivables 6,987 6,824 8,554 10,204 10,591 Cash & Equivalents 2,592 3,844 40,178 67,706 79,510 Other Current Assets 23,517 31,472 37,317 15,229 16,497 Current Assets 33,095 42,140 86,049 93,139 106,597 Trade Payables 2,207 4,147 7,106 8,663 8,555 Other CL & Provisions 19,414 19,340 30,682 37,245 41,424 Current Liabilities 21,621 23,487 37,788 45,909 49,979 Net current Assets 11,475 18,653 48,261 47,231 56,619 TOTAL APPLICATION OF FUNDS 211,273 211,180 239,142 246,734 256,386
Source: Company, HDFC sec Inst Research
Page | 26

BHARTI INFRATEL : INITIATING COVERAGE
CONSOLIDATED CASH FLOW (Rs mn) FY11 FY12 FY13 FY14E FY15E Reported PAT 5,515 7,491 10,003 14,025 16,791 Non-operating & EO items - - - - - PAT from Operations 5,515 7,491 10,003 14,025 16,791 Depreciation 20,191 21,438 22,199 22,958 24,791 Interest 4,326 4,073 3,945 3,456 3,389 Working Capital Change (11,639) (6,898) 5,329 (5,456) 615 OPERATING CASH FLOW ( a ) 18,394 26,103 41,476 34,983 45,587 Capex (20,340) (10,947) (18,103) (22,155) (20,734) Free Cash Flow (1,946) 15,156 23,373 12,828 24,853 Investments & Others (1,841) (2,198) (9,143) 23,858 - INVESTING CASH FLOW ( b ) (22,181) (13,145) (27,246) 1,703 (20,734) Capital Issuance 212 11,692 31,544 - - Debt Issuance (270) (7,632) 225 2,668 1,895 Interest (4,326) (4,073) (3,945) (3,456) (3,389) Dividend - (11,692) (5,721) (8,369) (11,555) FINANCING CASH FLOW ( c ) (4,385) (11,706) 22,103 (9,158) (13,050) NET CASH FLOW (a+b+c) (8,172) 1,252 36,333 27,528 11,804 Closing Cash & Equivalents 2,593 3,845 40,177 67,706 79,509
Source: Company, HDFC sec Inst Research
KEY RATIOS FY11 FY12 FY13 FY14 FY15 PROFITABILITY (%) EBITDA Margin 36.8 37.4 37.3 39.1 39.5 EBITDA Margin excl energy cost 56.3 58.3 60.0 63.0 64.0 EBIT Margin excl energy cost 20.0 22.9 25.2 28.8 29.7 APAT Margin excl energy cost 9.9 12.3 15.7 20.9 23.2 RoE 4.0 5.3 6.3 8.0 9.3 Core ROCE 3.8 4.4 5.2 6.8 8.0 RoCE 3.7 4.4 4.7 5.3 5.7 EFFICIENCY Tax Rate (%) 30.6 33.6 34.6 33.9 33.9 Asset Turnover (x) 0.4 0.4 0.4 0.4 0.5 Debtors (days) 30 26 30 34 33 Payables (days) 9 16 25 29 27 Cash Conversion Cycle (days) 21 10 5 5 6 Net Debt/EBITDA (x) 1.3 0.9 (0.1) (0.7) (0.9) Net D/E 0.3 0.2 (0.0) (0.2) (0.2) Interest Coverage 2.6 3.4 4.1 5.6 6.4 PER SHARE DATA EPS (Rs/sh) 3.2 4.3 5.3 7.4 8.9 CEPS (Rs/sh) 44.3 49.8 17.0 19.6 22.0 DPS (Rs/sh) - 5.5 1.4 3.5 4.8 BV (Rs/sh) 80.3 83.4 91.0 94.0 96.8 VALUATION P/E 49.9 36.8 29.8 21.4 17.9 P/BV 2.0 1.9 1.7 1.7 1.6 EV/EBITDA 10.8 9.3 7.7 6.4 5.6 OCF/EV (%) 5.4 7.9 14.0 12.9 17.5 FCF/EV (%) (0.6) 4.6 7.9 4.7 9.5 FCFE/Mcap (%) (2.1) 3.7 6.5 3.1 7.1
Source: Company, HDFC sec Inst Research
Page | 27

BHARTI INFRATEL : INITIATING COVERAGE
Disclaimer: This report has been prepared by HDFC Securities Ltd and is meant for sole use by the recipient and not for circulation. The information and opinions contained herein have been compiled or arrived at, based upon information obtained in good faith from sources believed to be reliable. Such information has not been independently verified and no guaranty, representation of warranty, express or implied, is made as to its accuracy, completeness or correctness. All such information and opinions are subject to change without notice. This document is for information purposes only. Descriptions of any company or companies or their securities mentioned herein are not intended to be complete and this document is not, and should not be construed as an offer or solicitation of an offer, to buy or sell any securities or other financial instruments. This report is not directed to, or intended for display, downloading, printing, reproducing or for distribution to or use by, any person or entity who is a citizen or resident or located in any locality, state, country or other jurisdiction where such distribution, publication, reproduction, availability or use would be contrary to law or regulation or what would subject HDFC Securities Ltd or its affiliates to any registration or licensing requirement within such jurisdiction. If this report is inadvertently send or has reached any individual in such country, especially, USA, the same may be ignored and brought to the attention of the sender. This document may not be reproduced, distributed or published for any purposes with out prior written approval of HDFC Securities Ltd . Foreign currencies denominated securities, wherever mentioned, are subject to exchange rate fluctuations, which could have an adverse effect on their value or price, or the income derived from them. In addition, investors in securities such as ADRs, the values of which are influenced by foreign currencies effectively assume currency risk. It should not be considered to be taken as an offer to sell or a solicitation to buy any security. HDFC Securities Ltd may from time to time solicit from, or perform broking, or other services for, any company mentioned in this mail and/or its attachments. HDFC Securities and its affiliated company(ies), their directors and employees may; (a) from time to time, have a long or short position in, and buy or sell the securities of the company(ies) mentioned herein or (b) be engaged in any other transaction involving such securities and earn brokerage or other compensation or act as a market maker in the financial instruments of the company(ies) discussed herein or act as an advisor or lender/borrower to such company(ies) or may have any other potential conflict of interests with respect to any recommendation and other related information and opinions. HDFC Securities Ltd, its directors, analysts or employees do not take any responsibility, financial or otherwise, of the losses or the damages sustained due to the investments made or any action taken on basis of this report, including but not restricted to, fluctuation in the prices of shares and bonds, changes in the currency rates, diminution in the NAVs, reduction in the dividend or income, etc. HDFC Securities Ltd and other group companies, its directors, associates, employees may have various positions in any of the stocks, securities and financial instruments dealt in the report, or may make sell or purchase or other deals in these securities from time to time or may deal in other securities of the companies / organisations described in this report.
Rating Definitions
BUY : Where the stock is expected to deliver more than 10% returns over the next 12 month period
NEUTRAL : Where the stock is expected to deliver (-)10% to 10% returns over the next 12 month period
SELL : Where the stock is expected to deliver less than (-)10% returns over the next 12 month period
HDFC securities Institutional Equities Unit No. 1602, 16th Floor, Tower A, Peninsula Business Park, Senapati Bapat Marg, Lower Parel, Mumbai - 400 013 Board : +91-22-6171 7330 www.hdfcsec.com
Page | 28
Related Documents
![[XLS]bharti-infratel.com · Web viewXAVIOUR MARIAMMAL ABANI PANIGRAHI SALVI GUBENDIRAN SUBIN SOLOMEN JAYALAKSHMI L64201DL2006PLC156038 Bharti Infratel Limited 04-AUG-2014 PURAN DEVI](https://static.cupdf.com/doc/110x72/5afdb0cf7f8b9a814d8ddaf0/xlsbharti-viewxaviour-mariammal-abani-panigrahi-salvi-gubendiran-subin-solomen.jpg)