2252 VOLUME 128 MONTHLY WEATHER REVIEW q 2000 American Meteorological Society Initialization and Simulation of a Landfalling Hurricane Using a Variational Bogus Data Assimilation Scheme QINGNONG XIAO,XIAOLEI ZOU, AND BIN WANG* Department of Meteorology, The Florida State University, Tallahassee, Florida (Manuscript received 14 January 1999, in final form 21 September 1999) ABSTRACT The bogus data assimilation (BDA) scheme designed by Zou and Xiao to specify initial structures of tropical cyclones was tested further on the simulation of a landfalling hurricane—Hurricane Fran (1996). The sensitivity of the simulated hurricane track and intensity to the specified radius of maximum wind of the bogus vortex, the resolution of the BDA assimilation model, and the bogus variables specified in the BDA are studied. In addition, the simulated hurricane structures are compared with the available observations, including the surface wind analysis and the radar reflectivity captured onshore during Fran’s landfall. The sensitivity study of the BDA scheme showed that the simulations of the hurricane track and intensity were sensitive to the size of the specified bogus vortex. Hurricanes with a larger radius of maximum sea level pressure gradient are prone to a more westward propagation. The larger the radius, the weaker the predicted hurricane. Results of the hurricane initial structures and prediction were also sensitive to the bogus variables specified in the BDA. Fitting the model to the bogused pressure data reproduced the hurricane structure of all model variables more efficiently than when fitting it to bogused wind data. Examining the initial conditions produced by the BDA, it is found that the generation and intensity of hurricane warm-core structure in the model initial state was a key factor for the hurricane intensity prediction. Initialized with the initial conditions obtained by the BDA scheme, the model successfully simulated Hurricane Fran’s landfall, the intensity change, and some inner-core structures. Verified against the surface wind analysis, the model reproduced the distribution of the maximum wind streaks reasonably well. The model-predicted reflectivity field during the landfall of Hurricane Fran resembled the observed radar reflec- tivity image onshore. 1. Introduction Numerical prediction of tropical cyclone tracks has improved enormously over the past few decades, but there is little skill in forecasting the storm’s intensity change (Elsberry et al. 1992) and inner-core structures (Liu et al. 1997). In fact, hurricane intensity change is closely related to the evolving three-dimensional struc- tures of the hurricane. The difficulties in the prediction of hurricane intensity and inner-core structure are as- sociated with insufficient observations over the oceans and with the limitations of forecast models, such as low- resolution, hydrostatic dynamics, crude physical param- eterization, and the inability to treat multiscale inter- actions. Recently, hurricane forecast models at high res- * Permanent affiliation: LASG, Institute of Atmospheric Physics, Chinese Academy of Sciences, Beijing, China. Corresponding author address: Dr. Qingnong Xiao, Dept. of Me- teorology, The Florida State University, Tallahassee, FL 32306- 4520. E-mail: [email protected] olution have greatly improved as a result of advances in computer architecture. More sophisticated models have been developed and used for hurricane study and forecast. The Florida State University atmospheric glob- al circulation model was run at a resolution as high as T213, which can rebuild some mesoscale signatures of the observed hurricane features with the help of satellite data using physical initialization (Krishnamurti et al. 1995). The well-known Geophysical Fluid Dynamics Laboratory (GFDL) hurricane model has been running operationally with a multiply nested movable mesh sys- tem at a grid resolution as high as 6 km, and a very sophisticated model initialization scheme (Bender et al. 1993; Kurihara et al. 1995; Ross and Kurihara 1995). The Pennsylvania State University–National Center for Atmospheric Research (Penn State–NCAR Mesoscale Model version 5 MM5) was also employed to simulate the development of Hurricane Andrew of 1992 (Liu et al. 1997) and Hurricane Felix of 1995 (Zou and Xiao 2000). It was run at a grid spacing of less than 10 km with explicit microphysics. By contrast, advances in hurricane initialization have been relatively slow. With the sparse data coverage over the oceans, numerical analyses cannot adequately rep-

Welcome message from author
This document is posted to help you gain knowledge. Please leave a comment to let me know what you think about it! Share it to your friends and learn new things together.
Transcript
2252 VOLUME 128M O N T H L Y W E A T H E R R E V I E W
q 2000 American Meteorological Society
Initialization and Simulation of a Landfalling Hurricane Using a VariationalBogus Data Assimilation Scheme
QINGNONG XIAO, XIAOLEI ZOU, AND BIN WANG*
Department of Meteorology, The Florida State University, Tallahassee, Florida
(Manuscript received 14 January 1999, in final form 21 September 1999)
ABSTRACT
The bogus data assimilation (BDA) scheme designed by Zou and Xiao to specify initial structures of tropicalcyclones was tested further on the simulation of a landfalling hurricane—Hurricane Fran (1996). The sensitivityof the simulated hurricane track and intensity to the specified radius of maximum wind of the bogus vortex, theresolution of the BDA assimilation model, and the bogus variables specified in the BDA are studied. In addition,the simulated hurricane structures are compared with the available observations, including the surface windanalysis and the radar reflectivity captured onshore during Fran’s landfall.
The sensitivity study of the BDA scheme showed that the simulations of the hurricane track and intensitywere sensitive to the size of the specified bogus vortex. Hurricanes with a larger radius of maximum sea levelpressure gradient are prone to a more westward propagation. The larger the radius, the weaker the predictedhurricane. Results of the hurricane initial structures and prediction were also sensitive to the bogus variablesspecified in the BDA. Fitting the model to the bogused pressure data reproduced the hurricane structure of allmodel variables more efficiently than when fitting it to bogused wind data. Examining the initial conditionsproduced by the BDA, it is found that the generation and intensity of hurricane warm-core structure in the modelinitial state was a key factor for the hurricane intensity prediction.
Initialized with the initial conditions obtained by the BDA scheme, the model successfully simulatedHurricane Fran’s landfall, the intensity change, and some inner-core structures. Verified against the surfacewind analysis, the model reproduced the distribution of the maximum wind streaks reasonably well. Themodel-predicted reflectivity field during the landfall of Hurricane Fran resembled the observed radar reflec-tivity image onshore.
1. Introduction
Numerical prediction of tropical cyclone tracks hasimproved enormously over the past few decades, butthere is little skill in forecasting the storm’s intensitychange (Elsberry et al. 1992) and inner-core structures(Liu et al. 1997). In fact, hurricane intensity change isclosely related to the evolving three-dimensional struc-tures of the hurricane. The difficulties in the predictionof hurricane intensity and inner-core structure are as-sociated with insufficient observations over the oceansand with the limitations of forecast models, such as low-resolution, hydrostatic dynamics, crude physical param-eterization, and the inability to treat multiscale inter-actions. Recently, hurricane forecast models at high res-
* Permanent affiliation: LASG, Institute of Atmospheric Physics,Chinese Academy of Sciences, Beijing, China.
Corresponding author address: Dr. Qingnong Xiao, Dept. of Me-teorology, The Florida State University, Tallahassee, FL 32306-4520.E-mail: [email protected]
olution have greatly improved as a result of advancesin computer architecture. More sophisticated modelshave been developed and used for hurricane study andforecast. The Florida State University atmospheric glob-al circulation model was run at a resolution as high asT213, which can rebuild some mesoscale signatures ofthe observed hurricane features with the help of satellitedata using physical initialization (Krishnamurti et al.1995). The well-known Geophysical Fluid DynamicsLaboratory (GFDL) hurricane model has been runningoperationally with a multiply nested movable mesh sys-tem at a grid resolution as high as 6 km, and a verysophisticated model initialization scheme (Bender et al.1993; Kurihara et al. 1995; Ross and Kurihara 1995).The Pennsylvania State University–National Center forAtmospheric Research (Penn State–NCAR MesoscaleModel version 5 MM5) was also employed to simulatethe development of Hurricane Andrew of 1992 (Liu etal. 1997) and Hurricane Felix of 1995 (Zou and Xiao2000). It was run at a grid spacing of less than 10 kmwith explicit microphysics.
By contrast, advances in hurricane initialization havebeen relatively slow. With the sparse data coverage overthe oceans, numerical analyses cannot adequately rep-
JULY 2000 2253X I A O E T A L .
resent the initial circulations of tropical cyclones (Leslieand Holland 1995). Hurricane initialization becomes anecessary step before making a prediction. There areseveral approaches for hurricane initialization: (i) sub-stitute a specified vortex circulation defined by an an-alytical expression for the analyzed vortex into the ini-tial conditions (Mathur 1991; Ueno 1989; Serrano andUnden 1994; Leslie and Holland 1995), (ii) implant a‘‘spinup’’ vortex generated by the same forecast modelinto the initial conditions (Kurihara and Ross 1993; Ku-rihara et al. 1995; Peng et al. 1993; Liu et al. 1997);and (iii) improve the initial conditions by making useof satellite–rain gauge based measurements of rainfallthrough a physical initialization procedure (Krishna-murti and Ross 1993, 1995, 1997, 1998). Although bo-gusing schemes are employed by many NWP centers,they do not always work well for a large range of trop-ical cyclones (Wang 1998). In order to minimize theeffects of the ‘‘initial shock’’ resulting from the ad hocassumptions in these bogus schemes, a procedure is usu-ally needed to balance the model initial state. For ex-ample, the National Centers for Environmental Predic-tion (NCEP) global model generates bogus observa-tions, which are run through the multivariate analysisscheme. This ensures that the initial state will be bal-anced. In the GFDL model, a quasi-balanced initial stateis generated using a simplified version of the model inthe bogus procedure (Kurihara and Ross 1993).
In the recent work of Zou and Xiao (2000), a var-iational bogus data assimilation (BDA) scheme wasproposed to generate the structure of a tropical hurri-cane in the initial condition of a high-resolution me-soscale model. In the scheme, a specified surface lowbased on a few observed parameters was incorporatedinto the model’s initial conditions through a variationalapproach in which the forecasting model serves as astrong constraint. The initial vortex obtained by theproposed method contains a more realistic hurricanestructure in all model fields and is also well adaptedto the prediction model. Such an initialization proce-dure is not only objective, but also flexible for theinclusion of any available observations due to its var-iational formulation.
The BDA scheme worked well for the numerical sim-ulation of Hurricane Felix (1995), a hurricane that madea recurvature prior to its landfall (Zou and Xiao 2000).In this paper, we further test the performance of theBDA scheme for the numerical simulations of HurricaneFran (1996) during its landfall, which occurred from0000 UTC 3 September to 0600 UTC 6 September 1996.We extend the work of Zou and Xiao (2000) to examinethe BDA scheme’s sensitivity to model resolution, tothe size of the specified vortex, and to the specificationof bogused sea level pressure (SLP) versus wind. Theadvantage of studying this case is that there were ex-tensive observational analyses after 0000 UTC 3 Sep-tember 1996 that are available from the National Oce-anic and Atmospheric Administration’s Hurricane Re-
search Division (NOAA/HRD) for forecast verification,such as Weather Surveillance Radar-1988 Doppler(WSR-88D) reflectivities and surface wind analysisfrom before the landfall of Fran. These data are notavailable for Hurricane Felix (1995).
From 0000 UTC 3 September through 0600 UTC 6September 1996, Hurricane Fran moved in a northwestdirection in the western Atlantic, north of the Carib-bean, and made landfall on the North Carolina coastaround 0030 UTC 6 September (Fig. 1). At landfall,the minimum central SLP of Fran was estimated as 954hPa and the maximum sustained surface winds were51.7 m s21 . The strongest winds occurred in streakswithin the deep convective areas north and northeastof the center. Hurricane Fran was responsible for 34deaths. The storm surge on the North Carolina coastdestroyed or seriously damaged numerous beachfronthouses. Extensive flooding caused additional damagein the Carolinas, Virginia, West Virginia, Maryland,Ohio, and Pennsylvania. Fran was responsible for anestimated $3.2 billion in damage to the United States(Pasch and Avila 1999).
This paper is organized as follows: The next sectiondescribes the experimental design, including a brief de-scription of the hurricane variational initializationscheme. The BDA generated initial hurricane structureand the subsequent forecast are discussed in sections 3and 4. Section 5 presents the sensitivity of the forecastedhurricane’s track and intensity to the size of initial vor-tex. The importance of bogused SLP versus wind fieldsin the BDA scheme is also tested in section 5. Finally,a summary and conclusions are provided in the lastsection.
2. Experimental design
a. The numerical model
The numerical model used in this study is an im-proved version of the Penn State–NCAR nonhydrostat-ic, movable, triply nested grid, 3D mesoscale model(Dudhia 1993; Grell et al. 1994). The model consists of27 layers in the vertical (the model top is defined at 100hPa). The 27 half-s levels are 0.025, 0.070, 0.110,0.150, 0.190, 0.230, 0.270, 0.310, 0.350, 0.390, 0.430,0.470, 0.510, 0.550, 0.590, 0.630, 0.670, 0.710, 0.750,0.790, 0.830, 0.870, 0.910, 0.945, 0.970, 0.985, and0.995. All variables except vertical velocity w are de-fined on the half-s levels. In the horizontal direction,the model has three nested domains A, B, and C, withhorizontal resolutions of 54, 18, and 6 km, respectively.The coarsest domain A is fixed, but the intermediatedomain B and the fine domain C moved along with thehurricane track (Fig. 1). The model variables are stag-gered horizontally such that u and y are defined on themidpoints of all other quantities. The (x, y) dimensionsare 76 3 85, 112 3 130, and 109 3 127 for domainsA, B, and C, respectively. The time step for the coarsest
2254 VOLUME 128M O N T H L Y W E A T H E R R E V I E W
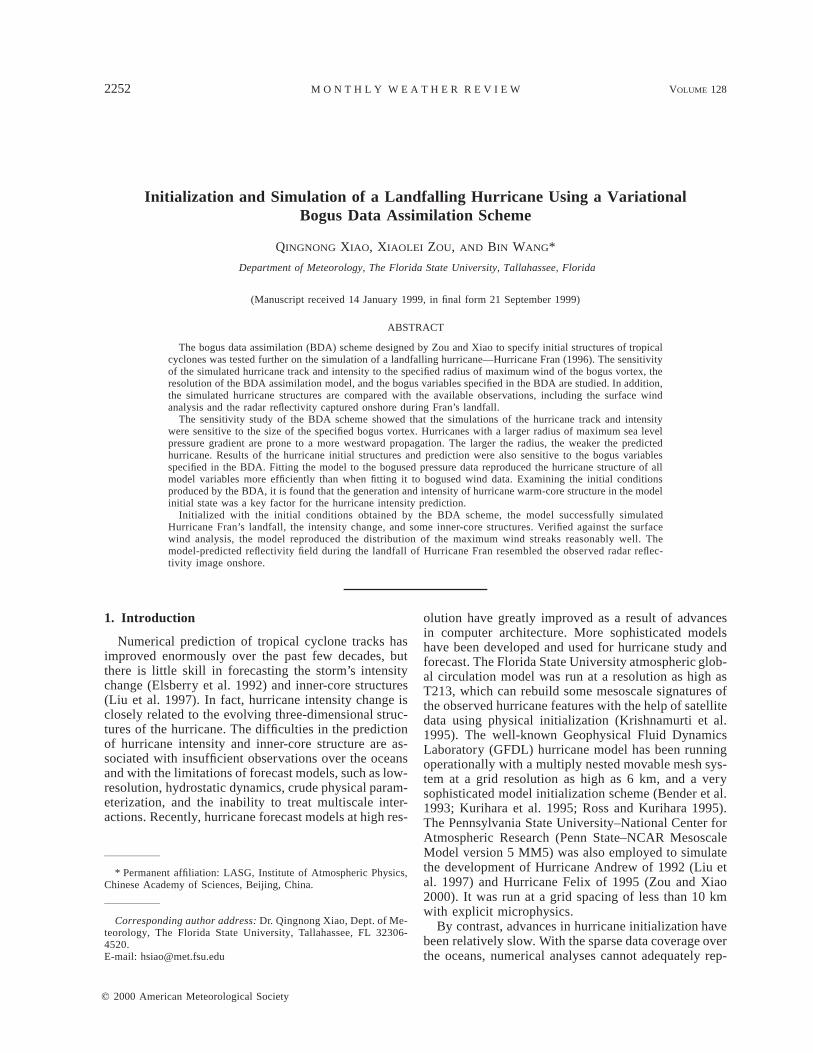
FIG. 1. Fran observed best track (hurricane symbol) starting from 0000 UTC 3 Sep to 0600UTC 6 Sep 1996 and model domains configuration. Domain A fixed; domain B started at initialtime and moved at 28 and 66 h. Domain C started at 66 h and moved at 70 and 74 h.
domain A is 120 s and complies with the ⅓ rule for theintermediate domain B and fine domain C. To reducethe computational cost, domain C is activated into in-tegration at 66 h, when Hurricane Fran is near its land-fall. We activate this fine mesh so as to obtain a moredetailed hurricane structure and compare it to the ob-served radar reflectivity and surface winds during thelandfall of Fran.
The model water cycle processes include parameter-ization of shallow convection for all domains, the Grell(1993) cumulus parameterization and the Dudhia’s sim-ple ice explicit moisture scheme for domain A, theKain–Fritsch cumulus model and the Reisner mixed-phase explicit moisture scheme for domain B, and theReisner graupel explicit moisture scheme for domain C.The more sophisticated model physics was used for thehigher-resolution model domain. According to Zhang etal. (1988) and Molinari and Dudek (1992), convectiveparameterization could be bypassed for a grid size of 6km. Other model physics include a modified version ofBlackadar (1979) PBL parameterization (Zhang and An-thes 1982) and a simple radiative parameterization inwhich the radiation effects due to clouds are consideredand calculated every 20 min. The SST data come fromthe NCEP global analysis and are kept unchanged inthe model integration. However, the land surface tem-
perature is predicted using surface energy budget equa-tions in which the effects of short- and longwave ra-diation and cloud radiation are included. The model alsoincludes three-dimensional Coriolis force. Surface heatand moisture fluxes are taken into account. To deal withthe acoustic waves, an upper radiative boundary con-dition is applied. The reader can refer to Dudhia (1993)and Grell et al. (1994) for a more detailed descriptionof the model.
b. The BDA scheme
The variational initialization scheme includes twoparts. The first step is vortex specification. The secondstep is a minimization procedure forcing the forecastmodel to generate the hurricane vortex. The vortex spec-ification applies to a few model variables and the min-imization procedure produces fields for all model var-iables, objectively satisfying the dynamic and physicalconstraint for the atmosphere.
1) VORTEX SPECIFICATION
The SLP of the hurricane vortex is specified accordingto Fujita’s formula (1952). The formula is expressed as
JULY 2000 2255X I A O E T A L .
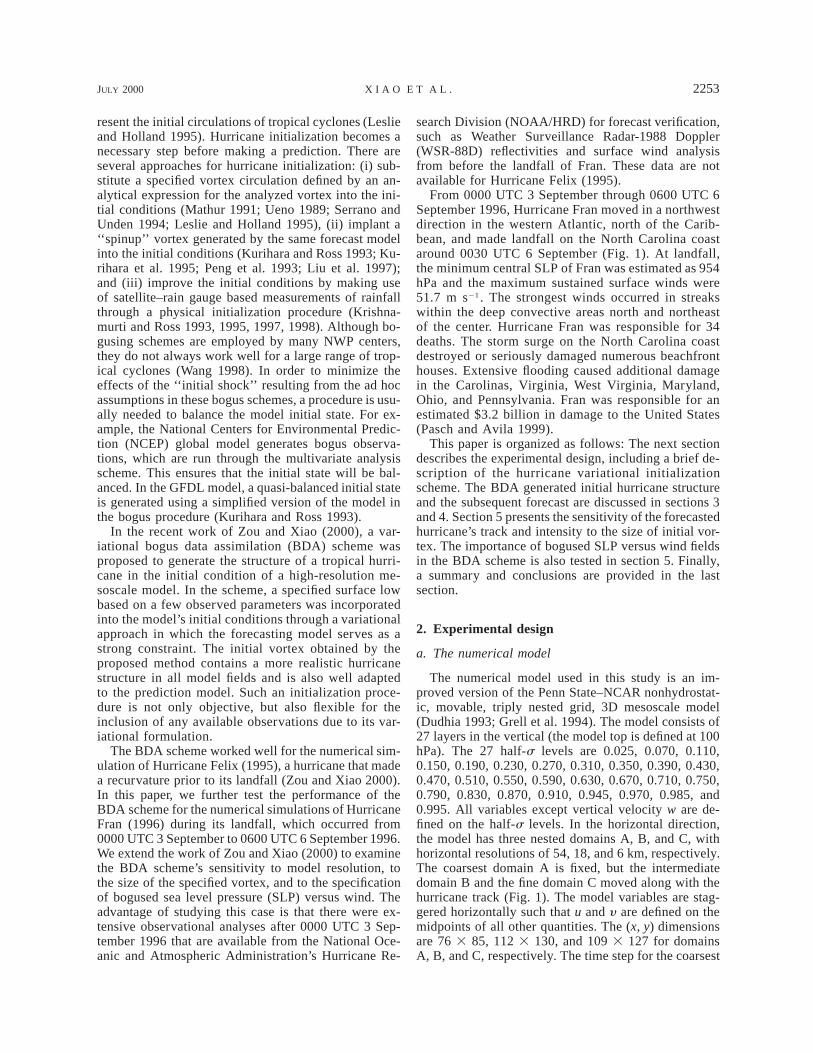
FIG. 2. The vortex specification relationship between DP and R forHurricane Fran at 0000 UTC 3 Sep 1996. The circle marked in thefigure shows DP pertinent to the observed R.
a function of r (radial distance from the cyclone center)as follows:
2 21/21 rP (r) 5 P 1 DP 1 2 1 1 , (1)o c 5 1 2 6[ ]2 R
where Pc is the hurricane’s central pressure, DP is aparameter related to the hurricane SLP gradient infor-mation (which will be determined by the maximum windas shown below), and R is the estimated radius of max-imum SLP gradient. The hurricane location and centralpressure are specified according to the National Hur-ricane Center’s (NHC) observational report.
The wind can be derived from Eq. (1) in terms of thegradient wind relation, which gives
1/22 2r ]P f r r| f |oV (r) 5 1 2 . (2)o 1 2r ]r 4 2
Therefore, the hurricane maximum wind Vmax can becalculated according to Eq. (2), and DP in Eq. (1) canbe adjusted so as to match the observed maximum wind.Here, r is air density (assumed constant). For HurricaneFran (1996) with Pc 5 977 hPa and Vmax 5 75 kt (38.8m s21) at 0000 UTC 3 September 1996, the relationbetween DP and R is calculated and shown in Fig. 2.In addition, there were extensive observational analysesat NOAA/HRD after 0000 UTC 3 September 1996. Theradius of maximum wind (RMW) at 0000 UTC 3 Sep-tember 1996 is around 80 km (marked in Fig. 2). In thevertical, the wind has a weighting profile of 1.0, 1.0,0.95, 0.85, 0.65, and 0.35 at the corresponding 1000-,850-, 700-, 500-, 400-, and 300-hPa levels. This verticalweighting function is empirically determined. The gra-dient wind balances are not necessarily maintained athigh levels before the minimization. During the mini-
mization, model-constraint fields are then gradually pro-duced while the BDA scheme fits the specified windstep by step.
The assigned pressure Po and wind fields Vo valuesin the domain V are used as ‘‘observations’’ data tomodify the MM5 analysis through a variational pro-cedure, which is described below.
2) MINIMIZATION PROCEDURE
In this procedure, a cost function is defined as
J(X ) 5 Jb 1 Jp 1 Jy , (3)
where
1T 21J 5 (X 2 X ) B (X 2 X ), (4a)b b b2
TJ 5 [P(r) 2 P (r)] W [P(r) 2 P (r)], (4b)O Op o p ot Vi
andTJ 5 [V(r, k) 2 V (r, k)]O O Oy o
t V ki
3 W [V(r, k) 2 V (r, k)], (4c)y o
where X 5 (u, y , w, p9, T, q)T represents all the modelvariables at the initial time. The model variables u andy are horizontal velocities, w is the vertical velocity, p9is the pressure perturbation from a constant referencestate, T is the temperature, and q is the specific humidity.In addition, X is gradually adjusted via an iteration pro-cedures, Xb is the background analysis obtained fromstandard MM5 analysis fields with a crudely estimateddiagonal error covariance matrix B, Jb represents thebackground term of the cost function, and Jp is the pres-sure term, in which P(r) represents the SLP of the modelatmosphere. The hydrostatic relation is included in theoperation to obtain the SLP from the surface pressureof the model. The wind term is Jy , in which V(r, k)includes model wind velocity at sea level, 1000-, 850-,700-, 500-, 400-, and 300-hPa level within the domainV. Also, V is a two-dimensional domain in the vicinityof the hurricane center. The rim of V is defined as thelimit line while SLP calculated by Eq. (1) is larger thanthat of the MM5 analysis. It is obvious that the area ofV is related to R in Eq. (1). Larger R is associated withthe larger area of V. Here, V is not necessarily a circleand the average radius of V is about 2.5–3.5 times ofR. Summation over ti is carried out over half-hour win-dows at every 5 min.
For simplicity, the background error covariance Bcontains only the diagonal elements. In this study, back-ground error variances are estimated from the differ-ences between the 12-h MM5 model forecast and theMM5 analysis at the same time. The weightings in Eq.(4), Wp and Wy , are treated as constants and determinedempirically. We take Wp 5 1.6 1/hPa2 and Wy 5 0.185
2256 VOLUME 128M O N T H L Y W E A T H E R R E V I E W
TABLE 1. Experimental design.
Numericalexpt
BDAresolution
(km)Bogus data(variables)
RMW(km)
Model initialconditions
CTL NCEP analysis
B80A80A100A140A180
1854545454
Po, Vo
Po, Vo
Po, Vo
Po, Vo
Po, Vo
8080
100140180 BDA analyses
A220A260A220PA220V
54545454
Po, Vo
Po, Vo
Po
Vo
220260220220
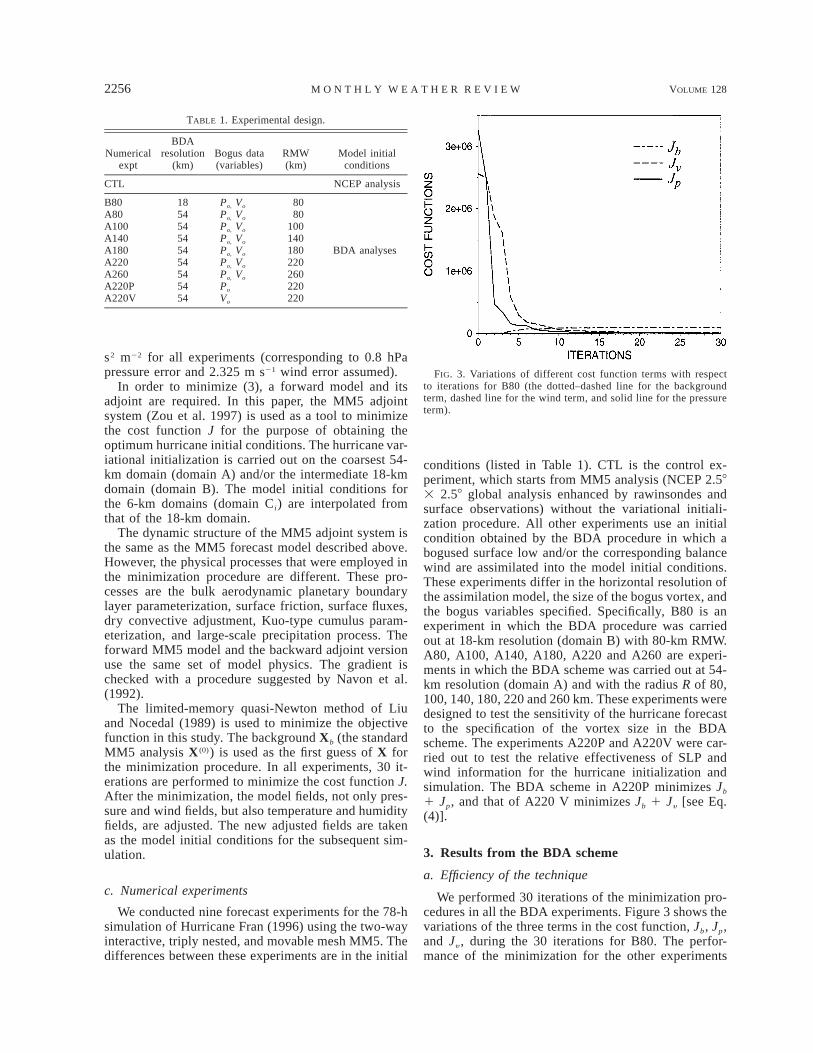
FIG. 3. Variations of different cost function terms with respectto iterations for B80 (the dotted–dashed line for the backgroundterm, dashed line for the wind term, and solid line for the pressureterm).
s2 m22 for all experiments (corresponding to 0.8 hPapressure error and 2.325 m s21 wind error assumed).
In order to minimize (3), a forward model and itsadjoint are required. In this paper, the MM5 adjointsystem (Zou et al. 1997) is used as a tool to minimizethe cost function J for the purpose of obtaining theoptimum hurricane initial conditions. The hurricane var-iational initialization is carried out on the coarsest 54-km domain (domain A) and/or the intermediate 18-kmdomain (domain B). The model initial conditions forthe 6-km domains (domain Ci) are interpolated fromthat of the 18-km domain.
The dynamic structure of the MM5 adjoint system isthe same as the MM5 forecast model described above.However, the physical processes that were employed inthe minimization procedure are different. These pro-cesses are the bulk aerodynamic planetary boundarylayer parameterization, surface friction, surface fluxes,dry convective adjustment, Kuo-type cumulus param-eterization, and large-scale precipitation process. Theforward MM5 model and the backward adjoint versionuse the same set of model physics. The gradient ischecked with a procedure suggested by Navon et al.(1992).
The limited-memory quasi-Newton method of Liuand Nocedal (1989) is used to minimize the objectivefunction in this study. The background Xb (the standardMM5 analysis X (0)) is used as the first guess of X forthe minimization procedure. In all experiments, 30 it-erations are performed to minimize the cost function J.After the minimization, the model fields, not only pres-sure and wind fields, but also temperature and humidityfields, are adjusted. The new adjusted fields are takenas the model initial conditions for the subsequent sim-ulation.
c. Numerical experiments
We conducted nine forecast experiments for the 78-hsimulation of Hurricane Fran (1996) using the two-wayinteractive, triply nested, and movable mesh MM5. Thedifferences between these experiments are in the initial
conditions (listed in Table 1). CTL is the control ex-periment, which starts from MM5 analysis (NCEP 2.583 2.58 global analysis enhanced by rawinsondes andsurface observations) without the variational initiali-zation procedure. All other experiments use an initialcondition obtained by the BDA procedure in which abogused surface low and/or the corresponding balancewind are assimilated into the model initial conditions.These experiments differ in the horizontal resolution ofthe assimilation model, the size of the bogus vortex, andthe bogus variables specified. Specifically, B80 is anexperiment in which the BDA procedure was carriedout at 18-km resolution (domain B) with 80-km RMW.A80, A100, A140, A180, A220 and A260 are experi-ments in which the BDA scheme was carried out at 54-km resolution (domain A) and with the radius R of 80,100, 140, 180, 220 and 260 km. These experiments weredesigned to test the sensitivity of the hurricane forecastto the specification of the vortex size in the BDAscheme. The experiments A220P and A220V were car-ried out to test the relative effectiveness of SLP andwind information for the hurricane initialization andsimulation. The BDA scheme in A220P minimizes Jb
1 Jp, and that of A220 V minimizes Jb 1 Jy [see Eq.(4)].
3. Results from the BDA scheme
a. Efficiency of the technique
We performed 30 iterations of the minimization pro-cedures in all the BDA experiments. Figure 3 shows thevariations of the three terms in the cost function, Jb, Jp,and Jy , during the 30 iterations for B80. The perfor-mance of the minimization for the other experiments
JULY 2000 2257X I A O E T A L .
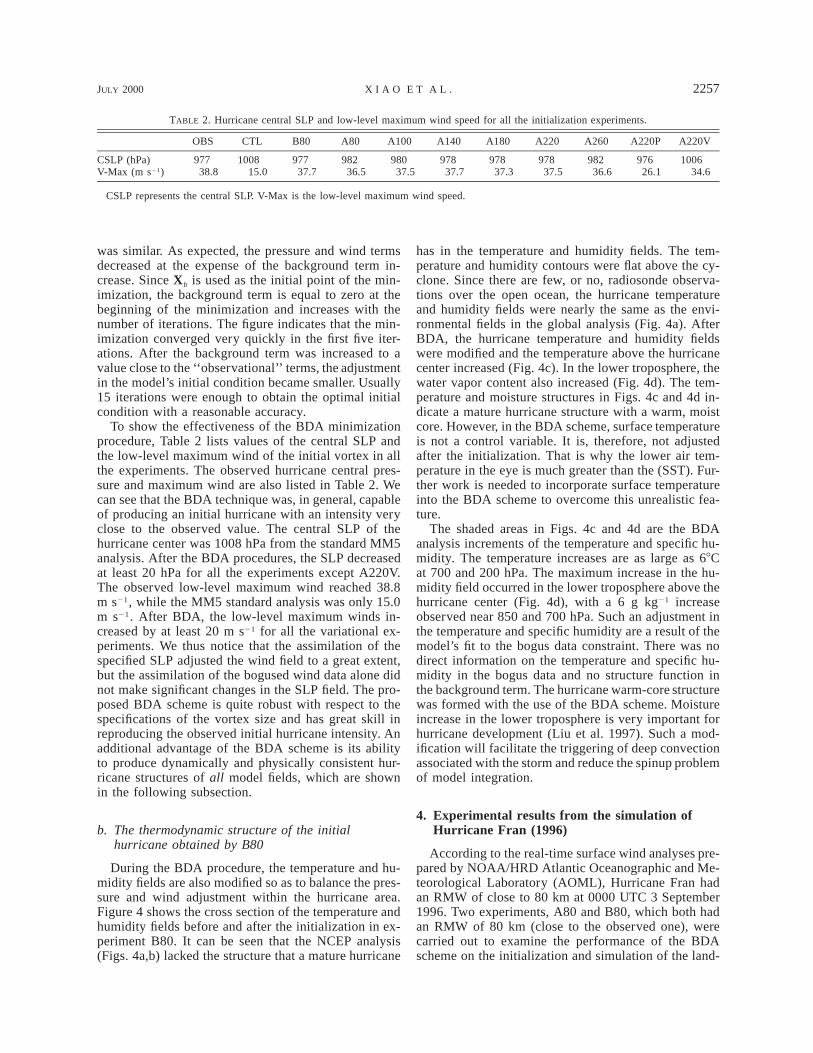
TABLE 2. Hurricane central SLP and low-level maximum wind speed for all the initialization experiments.
OBS CTL B80 A80 A100 A140 A180 A220 A260 A220P A220V
CSLP (hPa)V-Max (m s21)
97738.8
100815.0
97737.7
98236.5
98037.5
97837.7
97837.3
97837.5
98236.6
97626.1
100634.6
CSLP represents the central SLP. V-Max is the low-level maximum wind speed.
was similar. As expected, the pressure and wind termsdecreased at the expense of the background term in-crease. Since Xb is used as the initial point of the min-imization, the background term is equal to zero at thebeginning of the minimization and increases with thenumber of iterations. The figure indicates that the min-imization converged very quickly in the first five iter-ations. After the background term was increased to avalue close to the ‘‘observational’’ terms, the adjustmentin the model’s initial condition became smaller. Usually15 iterations were enough to obtain the optimal initialcondition with a reasonable accuracy.
To show the effectiveness of the BDA minimizationprocedure, Table 2 lists values of the central SLP andthe low-level maximum wind of the initial vortex in allthe experiments. The observed hurricane central pres-sure and maximum wind are also listed in Table 2. Wecan see that the BDA technique was, in general, capableof producing an initial hurricane with an intensity veryclose to the observed value. The central SLP of thehurricane center was 1008 hPa from the standard MM5analysis. After the BDA procedures, the SLP decreasedat least 20 hPa for all the experiments except A220V.The observed low-level maximum wind reached 38.8m s21, while the MM5 standard analysis was only 15.0m s21. After BDA, the low-level maximum winds in-creased by at least 20 m s21 for all the variational ex-periments. We thus notice that the assimilation of thespecified SLP adjusted the wind field to a great extent,but the assimilation of the bogused wind data alone didnot make significant changes in the SLP field. The pro-posed BDA scheme is quite robust with respect to thespecifications of the vortex size and has great skill inreproducing the observed initial hurricane intensity. Anadditional advantage of the BDA scheme is its abilityto produce dynamically and physically consistent hur-ricane structures of all model fields, which are shownin the following subsection.
b. The thermodynamic structure of the initialhurricane obtained by B80
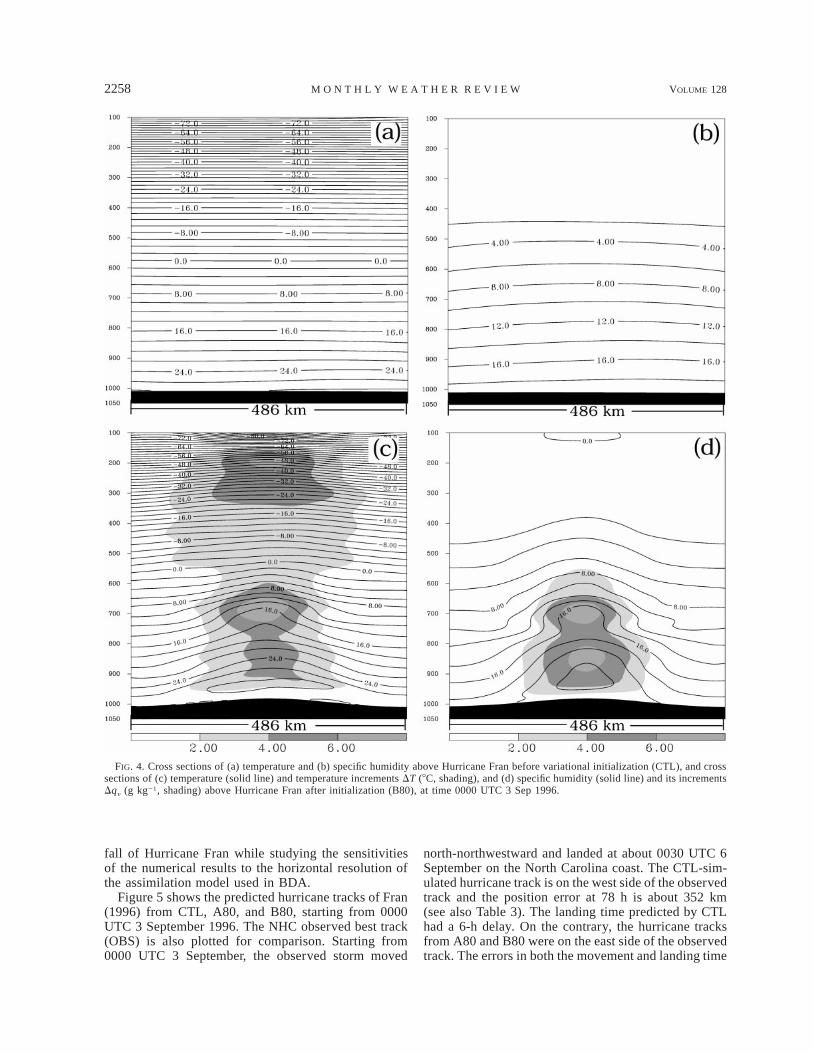
During the BDA procedure, the temperature and hu-midity fields are also modified so as to balance the pres-sure and wind adjustment within the hurricane area.Figure 4 shows the cross section of the temperature andhumidity fields before and after the initialization in ex-periment B80. It can be seen that the NCEP analysis(Figs. 4a,b) lacked the structure that a mature hurricane
has in the temperature and humidity fields. The tem-perature and humidity contours were flat above the cy-clone. Since there are few, or no, radiosonde observa-tions over the open ocean, the hurricane temperatureand humidity fields were nearly the same as the envi-ronmental fields in the global analysis (Fig. 4a). AfterBDA, the hurricane temperature and humidity fieldswere modified and the temperature above the hurricanecenter increased (Fig. 4c). In the lower troposphere, thewater vapor content also increased (Fig. 4d). The tem-perature and moisture structures in Figs. 4c and 4d in-dicate a mature hurricane structure with a warm, moistcore. However, in the BDA scheme, surface temperatureis not a control variable. It is, therefore, not adjustedafter the initialization. That is why the lower air tem-perature in the eye is much greater than the (SST). Fur-ther work is needed to incorporate surface temperatureinto the BDA scheme to overcome this unrealistic fea-ture.
The shaded areas in Figs. 4c and 4d are the BDAanalysis increments of the temperature and specific hu-midity. The temperature increases are as large as 68Cat 700 and 200 hPa. The maximum increase in the hu-midity field occurred in the lower troposphere above thehurricane center (Fig. 4d), with a 6 g kg21 increaseobserved near 850 and 700 hPa. Such an adjustment inthe temperature and specific humidity are a result of themodel’s fit to the bogus data constraint. There was nodirect information on the temperature and specific hu-midity in the bogus data and no structure function inthe background term. The hurricane warm-core structurewas formed with the use of the BDA scheme. Moistureincrease in the lower troposphere is very important forhurricane development (Liu et al. 1997). Such a mod-ification will facilitate the triggering of deep convectionassociated with the storm and reduce the spinup problemof model integration.
4. Experimental results from the simulation ofHurricane Fran (1996)
According to the real-time surface wind analyses pre-pared by NOAA/HRD Atlantic Oceanographic and Me-teorological Laboratory (AOML), Hurricane Fran hadan RMW of close to 80 km at 0000 UTC 3 September1996. Two experiments, A80 and B80, which both hadan RMW of 80 km (close to the observed one), werecarried out to examine the performance of the BDAscheme on the initialization and simulation of the land-
2258 VOLUME 128M O N T H L Y W E A T H E R R E V I E W
FIG. 4. Cross sections of (a) temperature and (b) specific humidity above Hurricane Fran before variational initialization (CTL), and crosssections of (c) temperature (solid line) and temperature increments DT (8C, shading), and (d) specific humidity (solid line) and its incrementsDqy (g kg21, shading) above Hurricane Fran after initialization (B80), at time 0000 UTC 3 Sep 1996.
fall of Hurricane Fran while studying the sensitivitiesof the numerical results to the horizontal resolution ofthe assimilation model used in BDA.
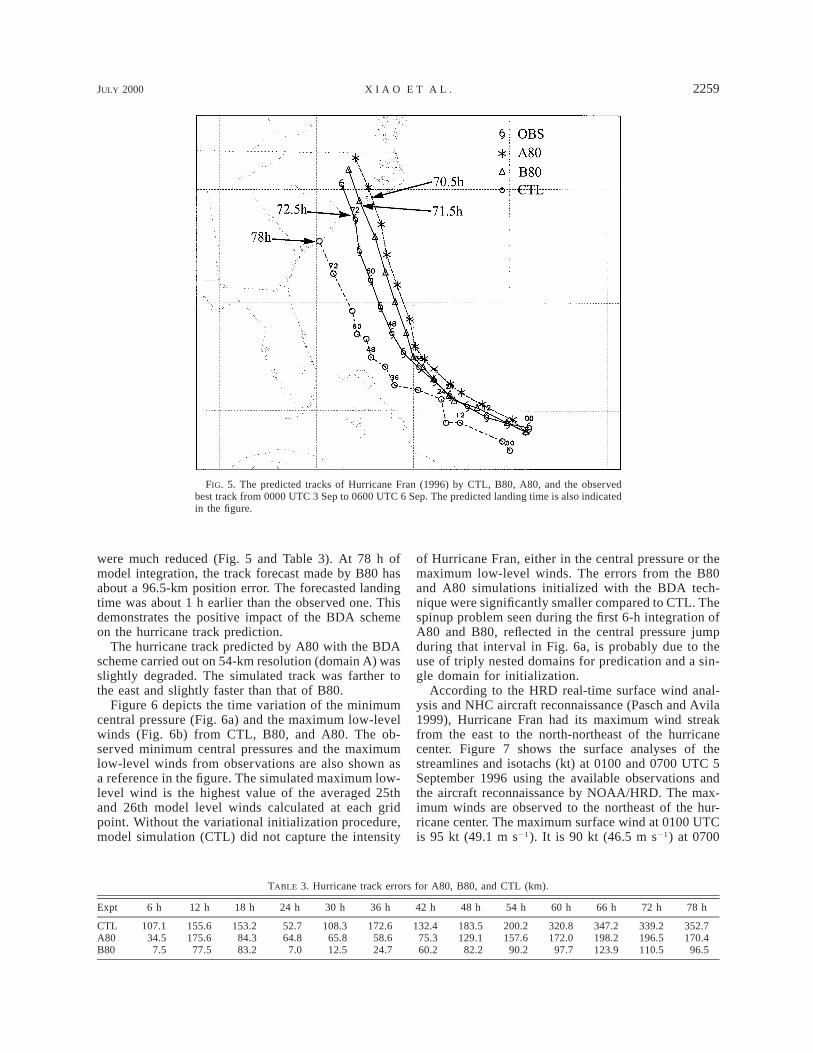
Figure 5 shows the predicted hurricane tracks of Fran(1996) from CTL, A80, and B80, starting from 0000UTC 3 September 1996. The NHC observed best track(OBS) is also plotted for comparison. Starting from0000 UTC 3 September, the observed storm moved
north-northwestward and landed at about 0030 UTC 6September on the North Carolina coast. The CTL-sim-ulated hurricane track is on the west side of the observedtrack and the position error at 78 h is about 352 km(see also Table 3). The landing time predicted by CTLhad a 6-h delay. On the contrary, the hurricane tracksfrom A80 and B80 were on the east side of the observedtrack. The errors in both the movement and landing time
JULY 2000 2259X I A O E T A L .
FIG. 5. The predicted tracks of Hurricane Fran (1996) by CTL, B80, A80, and the observedbest track from 0000 UTC 3 Sep to 0600 UTC 6 Sep. The predicted landing time is also indicatedin the figure.
TABLE 3. Hurricane track errors for A80, B80, and CTL (km).
Expt 6 h 12 h 18 h 24 h 30 h 36 h 42 h 48 h 54 h 60 h 66 h 72 h 78 h
CTLA80B80
107.134.5
7.5
155.6175.6
77.5
153.284.383.2
52.764.8
7.0
108.365.812.5
172.658.624.7
132.475.360.2
183.5129.1
82.2
200.2157.6
90.2
320.8172.0
97.7
347.2198.2123.9
339.2196.5110.5
352.7170.4
96.5
were much reduced (Fig. 5 and Table 3). At 78 h ofmodel integration, the track forecast made by B80 hasabout a 96.5-km position error. The forecasted landingtime was about 1 h earlier than the observed one. Thisdemonstrates the positive impact of the BDA schemeon the hurricane track prediction.
The hurricane track predicted by A80 with the BDAscheme carried out on 54-km resolution (domain A) wasslightly degraded. The simulated track was farther tothe east and slightly faster than that of B80.
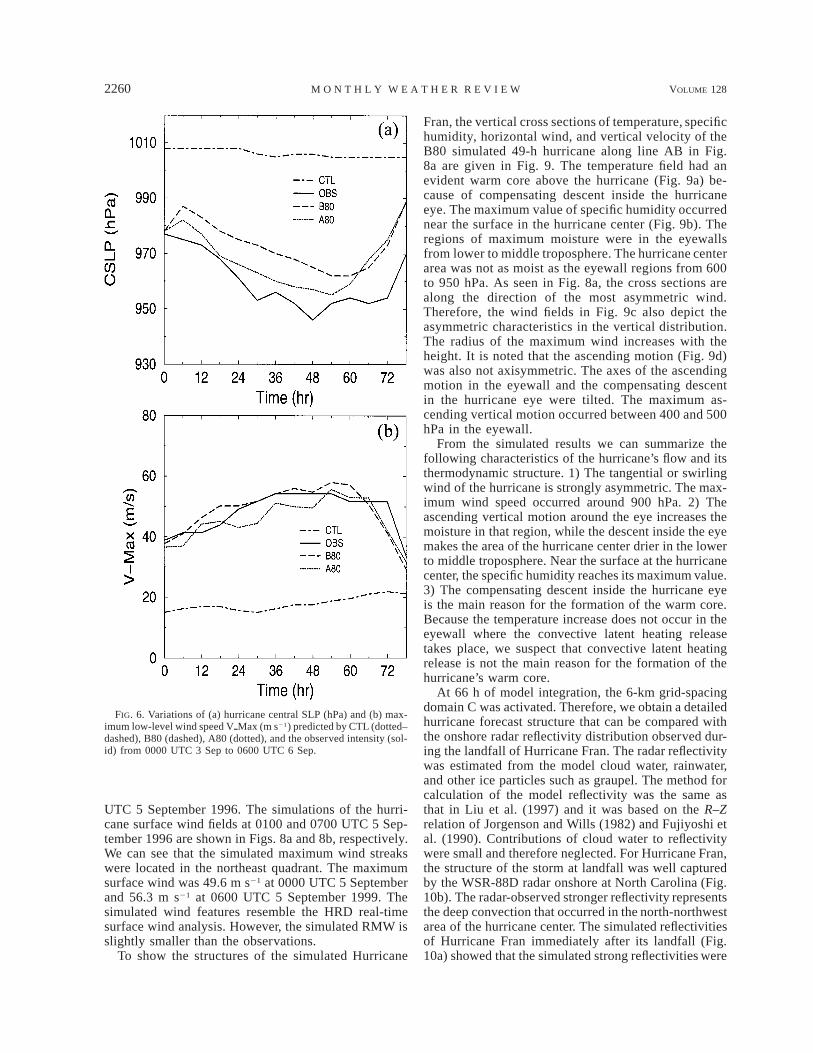
Figure 6 depicts the time variation of the minimumcentral pressure (Fig. 6a) and the maximum low-levelwinds (Fig. 6b) from CTL, B80, and A80. The ob-served minimum central pressures and the maximumlow-level winds from observations are also shown asa reference in the figure. The simulated maximum low-level wind is the highest value of the averaged 25thand 26th model level winds calculated at each gridpoint. Without the variational initialization procedure,model simulation (CTL) did not capture the intensity
of Hurricane Fran, either in the central pressure or themaximum low-level winds. The errors from the B80and A80 simulations initialized with the BDA tech-nique were significantly smaller compared to CTL. Thespinup problem seen during the first 6-h integration ofA80 and B80, reflected in the central pressure jumpduring that interval in Fig. 6a, is probably due to theuse of triply nested domains for predication and a sin-gle domain for initialization.
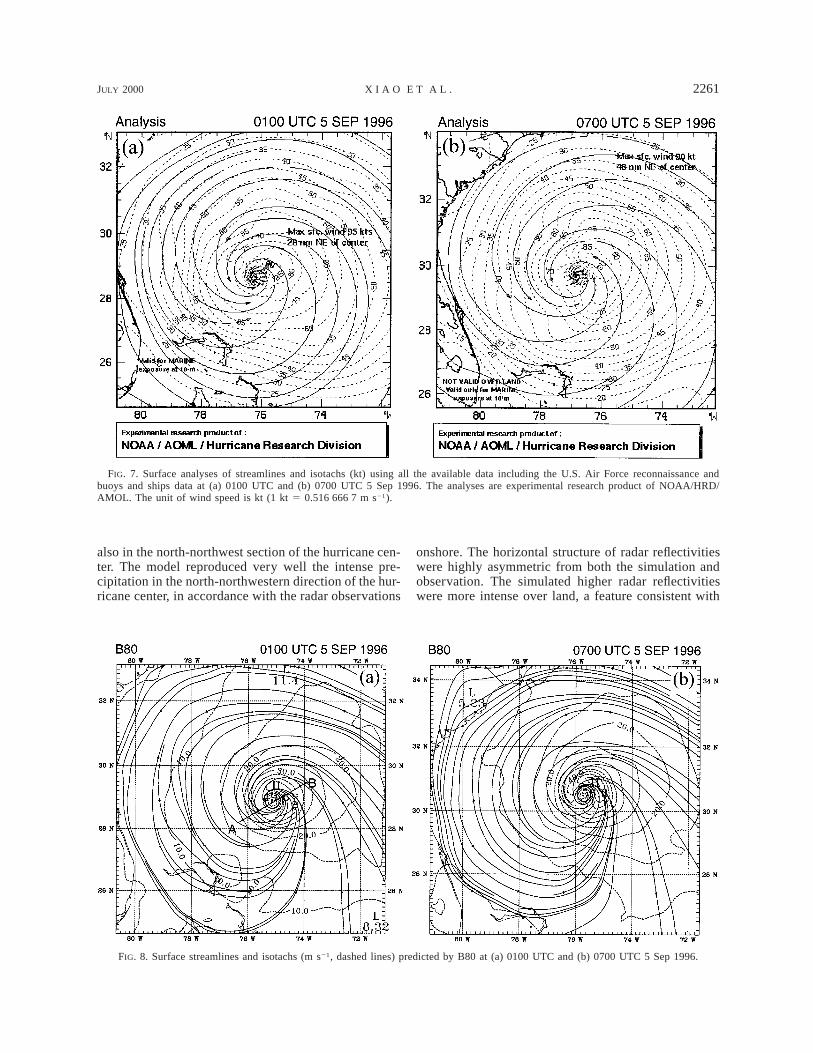
According to the HRD real-time surface wind anal-ysis and NHC aircraft reconnaissance (Pasch and Avila1999), Hurricane Fran had its maximum wind streakfrom the east to the north-northeast of the hurricanecenter. Figure 7 shows the surface analyses of thestreamlines and isotachs (kt) at 0100 and 0700 UTC 5September 1996 using the available observations andthe aircraft reconnaissance by NOAA/HRD. The max-imum winds are observed to the northeast of the hur-ricane center. The maximum surface wind at 0100 UTCis 95 kt (49.1 m s21). It is 90 kt (46.5 m s21) at 0700
2260 VOLUME 128M O N T H L Y W E A T H E R R E V I E W
FIG. 6. Variations of (a) hurricane central SLP (hPa) and (b) max-imum low-level wind speed VpMax (m s21) predicted by CTL (dotted–dashed), B80 (dashed), A80 (dotted), and the observed intensity (sol-id) from 0000 UTC 3 Sep to 0600 UTC 6 Sep.
UTC 5 September 1996. The simulations of the hurri-cane surface wind fields at 0100 and 0700 UTC 5 Sep-tember 1996 are shown in Figs. 8a and 8b, respectively.We can see that the simulated maximum wind streakswere located in the northeast quadrant. The maximumsurface wind was 49.6 m s21 at 0000 UTC 5 Septemberand 56.3 m s21 at 0600 UTC 5 September 1999. Thesimulated wind features resemble the HRD real-timesurface wind analysis. However, the simulated RMW isslightly smaller than the observations.
To show the structures of the simulated Hurricane
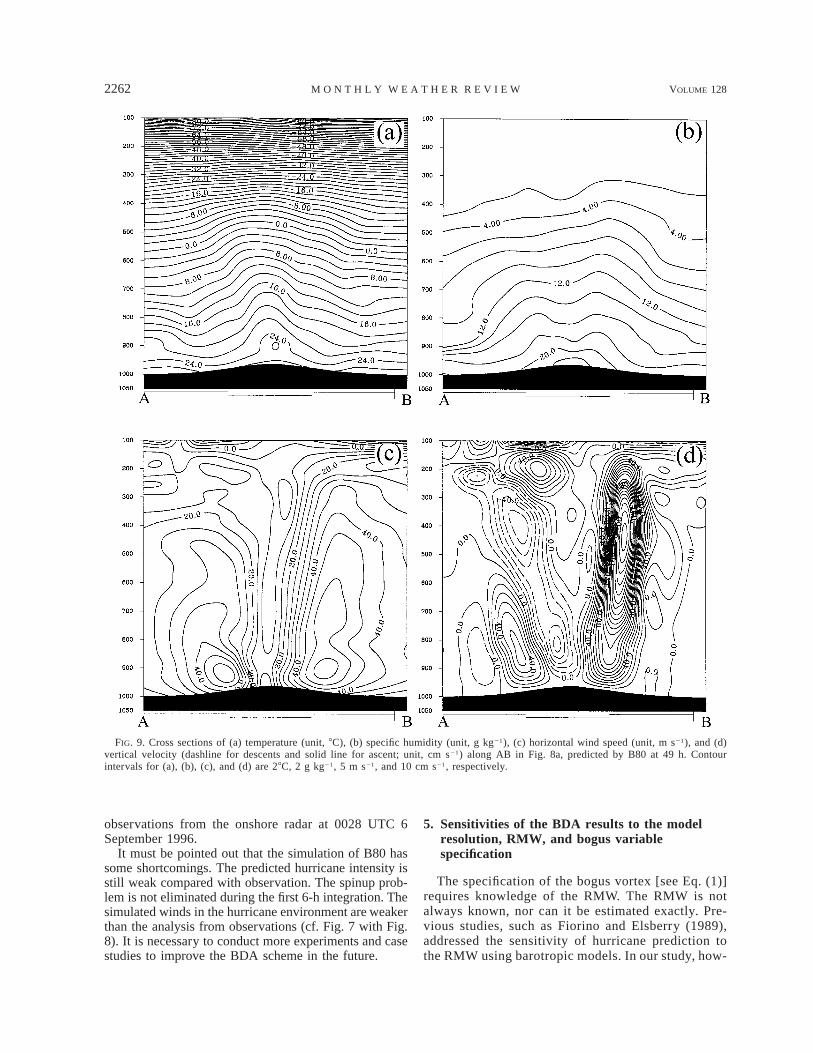
Fran, the vertical cross sections of temperature, specifichumidity, horizontal wind, and vertical velocity of theB80 simulated 49-h hurricane along line AB in Fig.8a are given in Fig. 9. The temperature field had anevident warm core above the hurricane (Fig. 9a) be-cause of compensating descent inside the hurricaneeye. The maximum value of specific humidity occurrednear the surface in the hurricane center (Fig. 9b). Theregions of maximum moisture were in the eyewallsfrom lower to middle troposphere. The hurricane centerarea was not as moist as the eyewall regions from 600to 950 hPa. As seen in Fig. 8a, the cross sections arealong the direction of the most asymmetric wind.Therefore, the wind fields in Fig. 9c also depict theasymmetric characteristics in the vertical distribution.The radius of the maximum wind increases with theheight. It is noted that the ascending motion (Fig. 9d)was also not axisymmetric. The axes of the ascendingmotion in the eyewall and the compensating descentin the hurricane eye were tilted. The maximum as-cending vertical motion occurred between 400 and 500hPa in the eyewall.
From the simulated results we can summarize thefollowing characteristics of the hurricane’s flow and itsthermodynamic structure. 1) The tangential or swirlingwind of the hurricane is strongly asymmetric. The max-imum wind speed occurred around 900 hPa. 2) Theascending vertical motion around the eye increases themoisture in that region, while the descent inside the eyemakes the area of the hurricane center drier in the lowerto middle troposphere. Near the surface at the hurricanecenter, the specific humidity reaches its maximum value.3) The compensating descent inside the hurricane eyeis the main reason for the formation of the warm core.Because the temperature increase does not occur in theeyewall where the convective latent heating releasetakes place, we suspect that convective latent heatingrelease is not the main reason for the formation of thehurricane’s warm core.
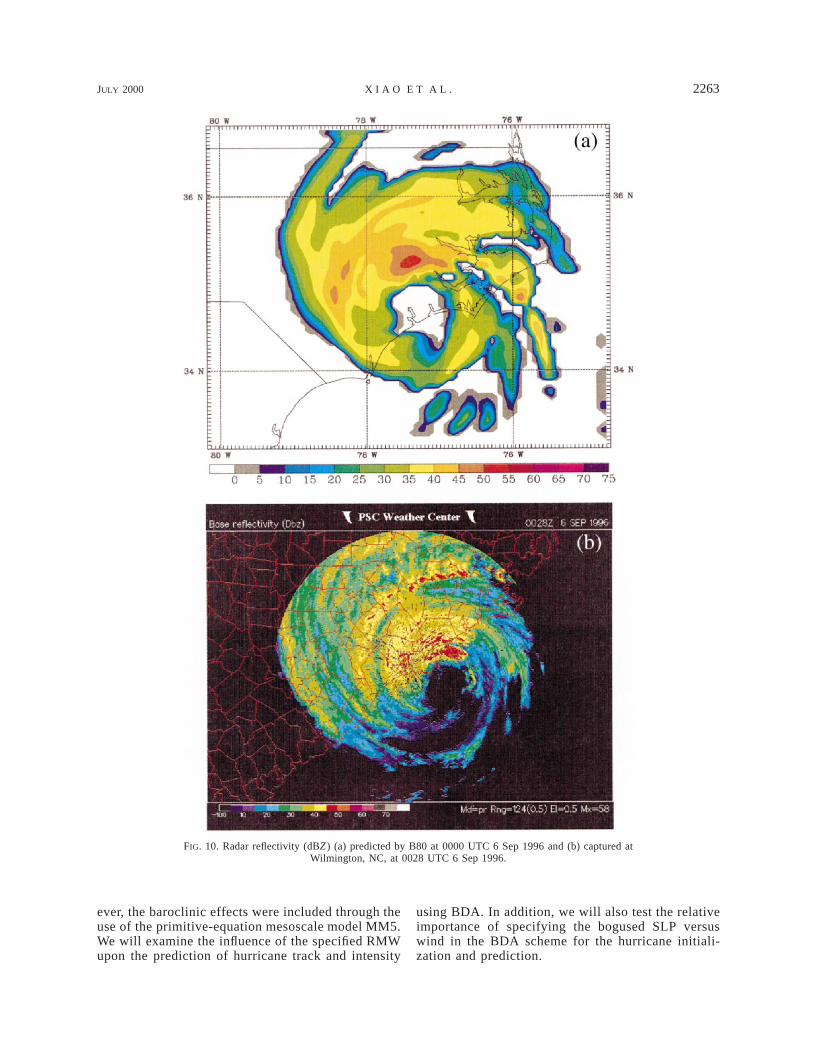
At 66 h of model integration, the 6-km grid-spacingdomain C was activated. Therefore, we obtain a detailedhurricane forecast structure that can be compared withthe onshore radar reflectivity distribution observed dur-ing the landfall of Hurricane Fran. The radar reflectivitywas estimated from the model cloud water, rainwater,and other ice particles such as graupel. The method forcalculation of the model reflectivity was the same asthat in Liu et al. (1997) and it was based on the R–Zrelation of Jorgenson and Wills (1982) and Fujiyoshi etal. (1990). Contributions of cloud water to reflectivitywere small and therefore neglected. For Hurricane Fran,the structure of the storm at landfall was well capturedby the WSR-88D radar onshore at North Carolina (Fig.10b). The radar-observed stronger reflectivity representsthe deep convection that occurred in the north-northwestarea of the hurricane center. The simulated reflectivitiesof Hurricane Fran immediately after its landfall (Fig.10a) showed that the simulated strong reflectivities were
JULY 2000 2261X I A O E T A L .
FIG. 7. Surface analyses of streamlines and isotachs (kt) using all the available data including the U.S. Air Force reconnaissance andbuoys and ships data at (a) 0100 UTC and (b) 0700 UTC 5 Sep 1996. The analyses are experimental research product of NOAA/HRD/AMOL. The unit of wind speed is kt (1 kt 5 0.516 666 7 m s21).
FIG. 8. Surface streamlines and isotachs (m s21, dashed lines) predicted by B80 at (a) 0100 UTC and (b) 0700 UTC 5 Sep 1996.
also in the north-northwest section of the hurricane cen-ter. The model reproduced very well the intense pre-cipitation in the north-northwestern direction of the hur-ricane center, in accordance with the radar observations
onshore. The horizontal structure of radar reflectivitieswere highly asymmetric from both the simulation andobservation. The simulated higher radar reflectivitieswere more intense over land, a feature consistent with
2262 VOLUME 128M O N T H L Y W E A T H E R R E V I E W
FIG. 9. Cross sections of (a) temperature (unit, 8C), (b) specific humidity (unit, g kg21), (c) horizontal wind speed (unit, m s21), and (d)vertical velocity (dashline for descents and solid line for ascent; unit, cm s21) along AB in Fig. 8a, predicted by B80 at 49 h. Contourintervals for (a), (b), (c), and (d) are 28C, 2 g kg21, 5 m s21, and 10 cm s21, respectively.
observations from the onshore radar at 0028 UTC 6September 1996.
It must be pointed out that the simulation of B80 hassome shortcomings. The predicted hurricane intensity isstill weak compared with observation. The spinup prob-lem is not eliminated during the first 6-h integration. Thesimulated winds in the hurricane environment are weakerthan the analysis from observations (cf. Fig. 7 with Fig.8). It is necessary to conduct more experiments and casestudies to improve the BDA scheme in the future.
5. Sensitivities of the BDA results to the modelresolution, RMW, and bogus variablespecification
The specification of the bogus vortex [see Eq. (1)]requires knowledge of the RMW. The RMW is notalways known, nor can it be estimated exactly. Pre-vious studies, such as Fiorino and Elsberry (1989),addressed the sensitivity of hurricane prediction tothe RMW using barotropic models. In our study, how-
JULY 2000 2263X I A O E T A L .
FIG. 10. Radar reflectivity (dBZ ) (a) predicted by B80 at 0000 UTC 6 Sep 1996 and (b) captured atWilmington, NC, at 0028 UTC 6 Sep 1996.
ever, the baroclinic effects were included through theuse of the primitive-equation mesoscale model MM5.We will examine the influence of the specified RMWupon the prediction of hurricane track and intensity
using BDA. In addition, we will also test the relativeimportance of specifying the bogused SLP versuswind in the BDA scheme for the hurricane initiali-zation and prediction.
2264 VOLUME 128M O N T H L Y W E A T H E R R E V I E W
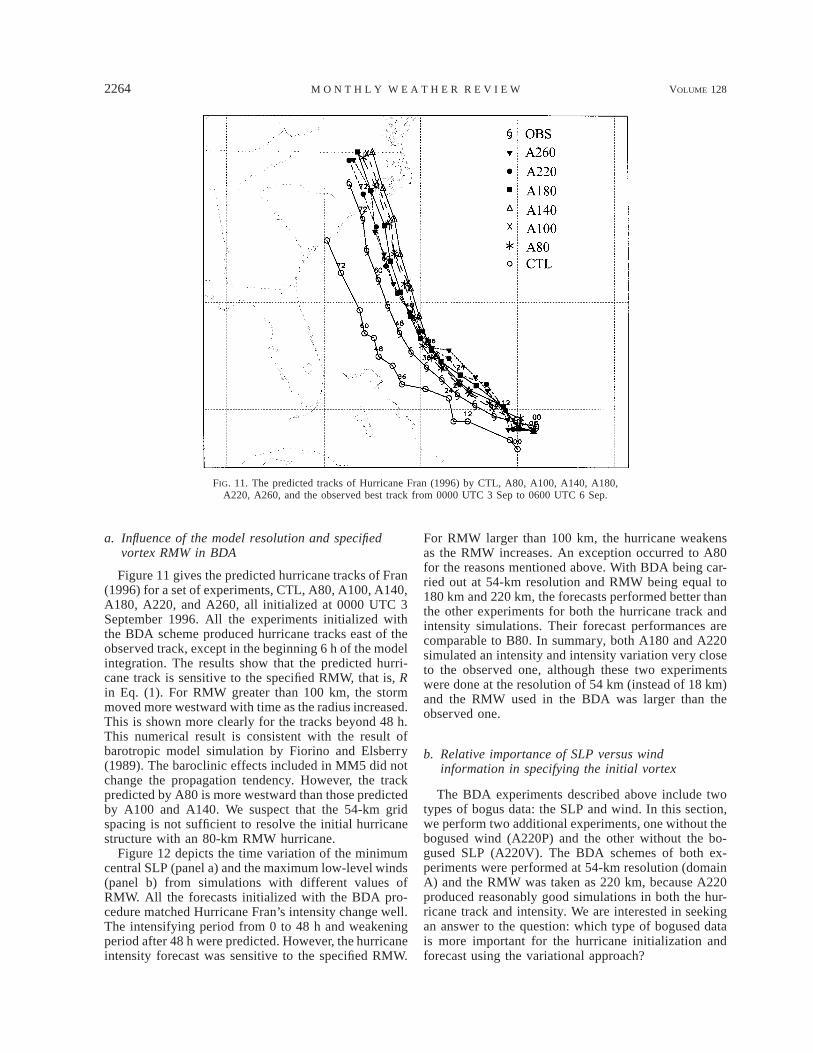
FIG. 11. The predicted tracks of Hurricane Fran (1996) by CTL, A80, A100, A140, A180,A220, A260, and the observed best track from 0000 UTC 3 Sep to 0600 UTC 6 Sep.
a. Influence of the model resolution and specifiedvortex RMW in BDA
Figure 11 gives the predicted hurricane tracks of Fran(1996) for a set of experiments, CTL, A80, A100, A140,A180, A220, and A260, all initialized at 0000 UTC 3September 1996. All the experiments initialized withthe BDA scheme produced hurricane tracks east of theobserved track, except in the beginning 6 h of the modelintegration. The results show that the predicted hurri-cane track is sensitive to the specified RMW, that is, Rin Eq. (1). For RMW greater than 100 km, the stormmoved more westward with time as the radius increased.This is shown more clearly for the tracks beyond 48 h.This numerical result is consistent with the result ofbarotropic model simulation by Fiorino and Elsberry(1989). The baroclinic effects included in MM5 did notchange the propagation tendency. However, the trackpredicted by A80 is more westward than those predictedby A100 and A140. We suspect that the 54-km gridspacing is not sufficient to resolve the initial hurricanestructure with an 80-km RMW hurricane.
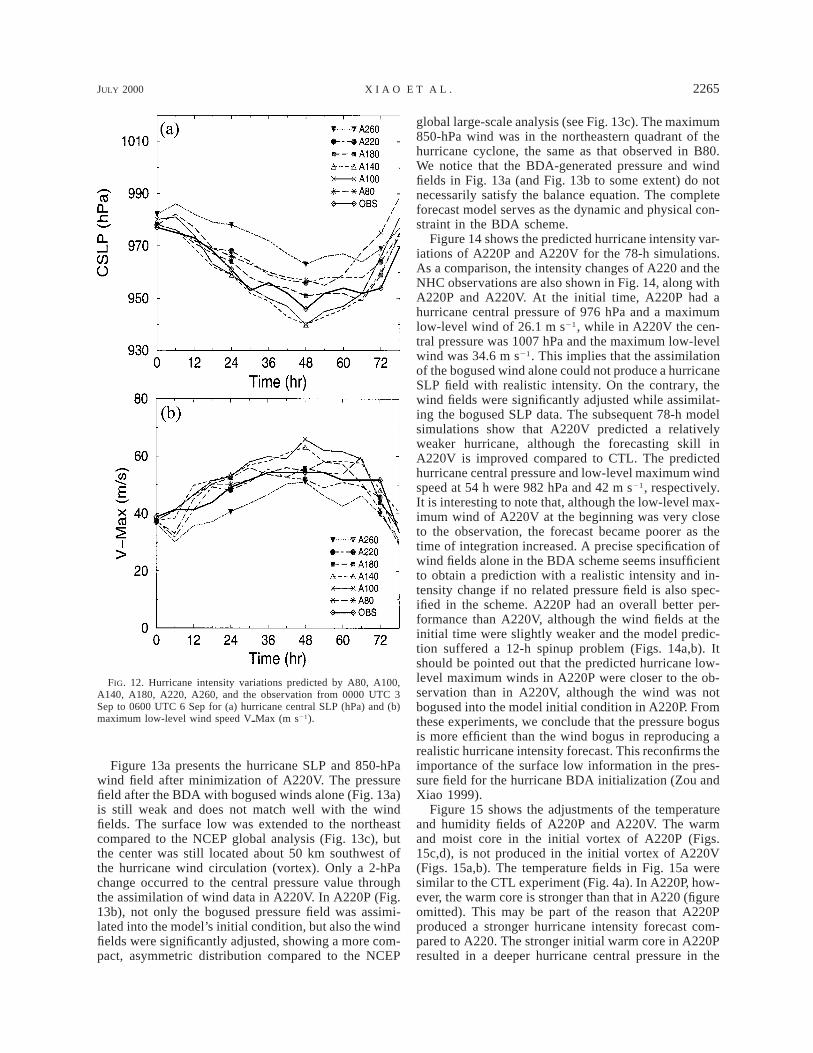
Figure 12 depicts the time variation of the minimumcentral SLP (panel a) and the maximum low-level winds(panel b) from simulations with different values ofRMW. All the forecasts initialized with the BDA pro-cedure matched Hurricane Fran’s intensity change well.The intensifying period from 0 to 48 h and weakeningperiod after 48 h were predicted. However, the hurricaneintensity forecast was sensitive to the specified RMW.
For RMW larger than 100 km, the hurricane weakensas the RMW increases. An exception occurred to A80for the reasons mentioned above. With BDA being car-ried out at 54-km resolution and RMW being equal to180 km and 220 km, the forecasts performed better thanthe other experiments for both the hurricane track andintensity simulations. Their forecast performances arecomparable to B80. In summary, both A180 and A220simulated an intensity and intensity variation very closeto the observed one, although these two experimentswere done at the resolution of 54 km (instead of 18 km)and the RMW used in the BDA was larger than theobserved one.
b. Relative importance of SLP versus windinformation in specifying the initial vortex
The BDA experiments described above include twotypes of bogus data: the SLP and wind. In this section,we perform two additional experiments, one without thebogused wind (A220P) and the other without the bo-gused SLP (A220V). The BDA schemes of both ex-periments were performed at 54-km resolution (domainA) and the RMW was taken as 220 km, because A220produced reasonably good simulations in both the hur-ricane track and intensity. We are interested in seekingan answer to the question: which type of bogused datais more important for the hurricane initialization andforecast using the variational approach?
JULY 2000 2265X I A O E T A L .
FIG. 12. Hurricane intensity variations predicted by A80, A100,A140, A180, A220, A260, and the observation from 0000 UTC 3Sep to 0600 UTC 6 Sep for (a) hurricane central SLP (hPa) and (b)maximum low-level wind speed VpMax (m s21).
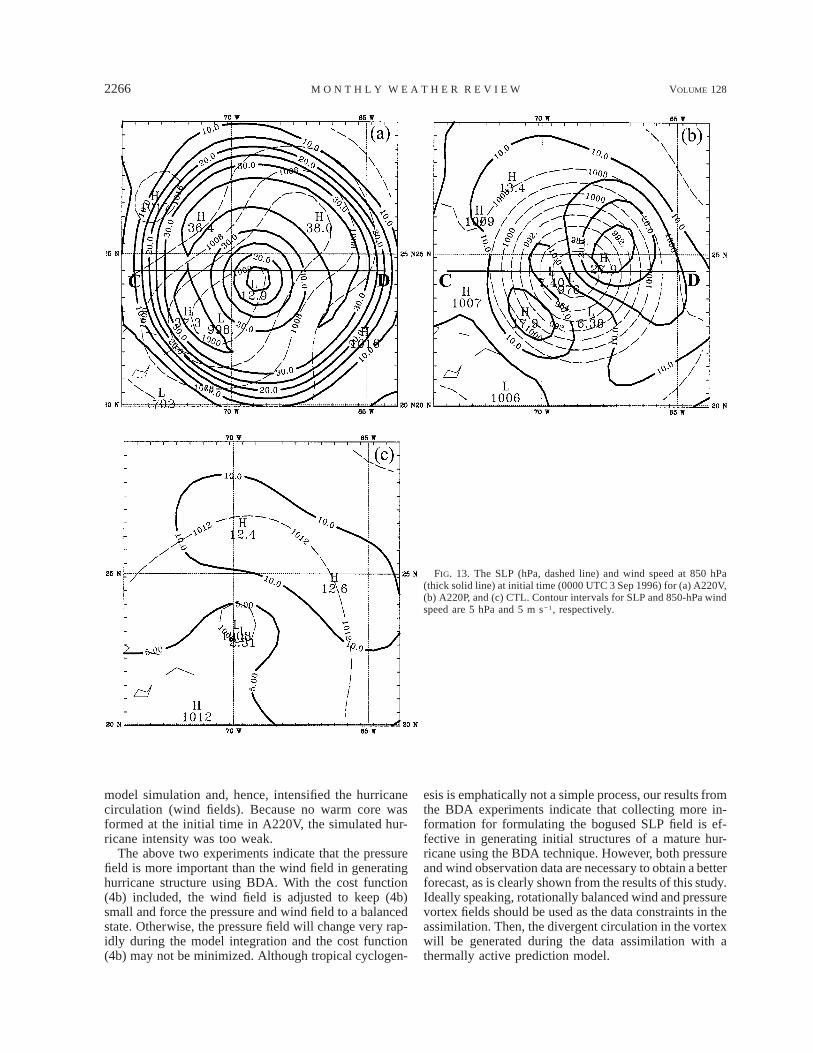
Figure 13a presents the hurricane SLP and 850-hPawind field after minimization of A220V. The pressurefield after the BDA with bogused winds alone (Fig. 13a)is still weak and does not match well with the windfields. The surface low was extended to the northeastcompared to the NCEP global analysis (Fig. 13c), butthe center was still located about 50 km southwest ofthe hurricane wind circulation (vortex). Only a 2-hPachange occurred to the central pressure value throughthe assimilation of wind data in A220V. In A220P (Fig.13b), not only the bogused pressure field was assimi-lated into the model’s initial condition, but also the windfields were significantly adjusted, showing a more com-pact, asymmetric distribution compared to the NCEP
global large-scale analysis (see Fig. 13c). The maximum850-hPa wind was in the northeastern quadrant of thehurricane cyclone, the same as that observed in B80.We notice that the BDA-generated pressure and windfields in Fig. 13a (and Fig. 13b to some extent) do notnecessarily satisfy the balance equation. The completeforecast model serves as the dynamic and physical con-straint in the BDA scheme.
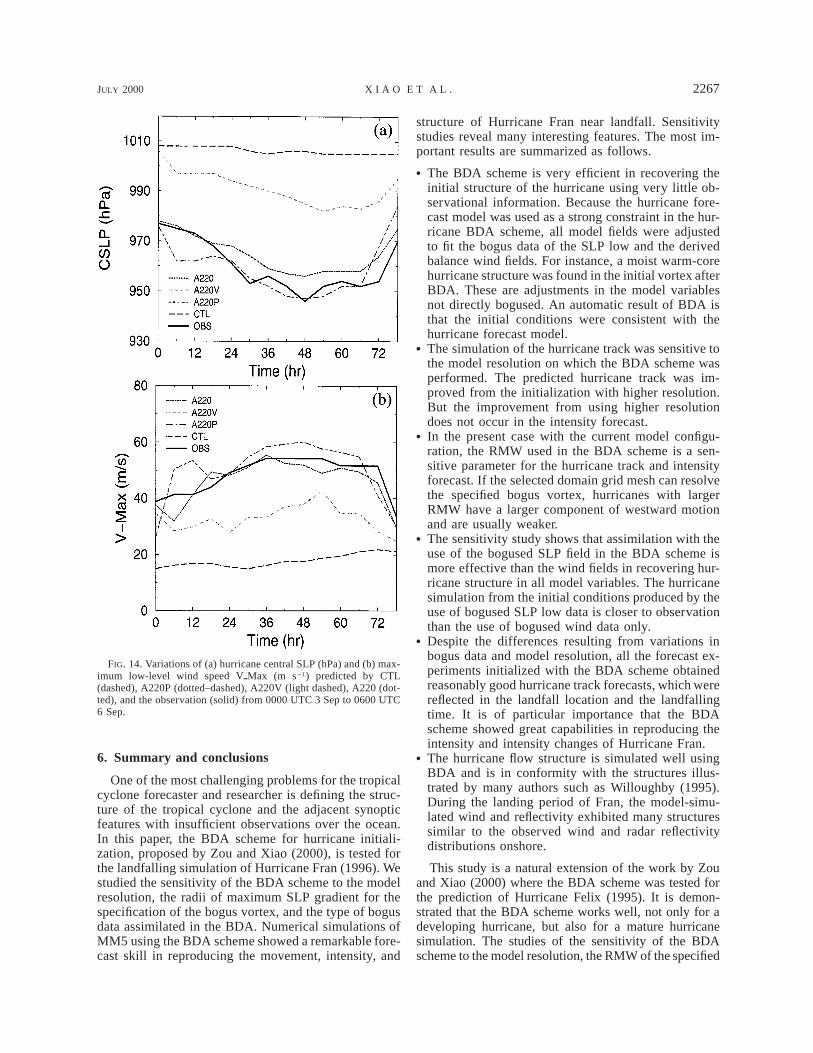
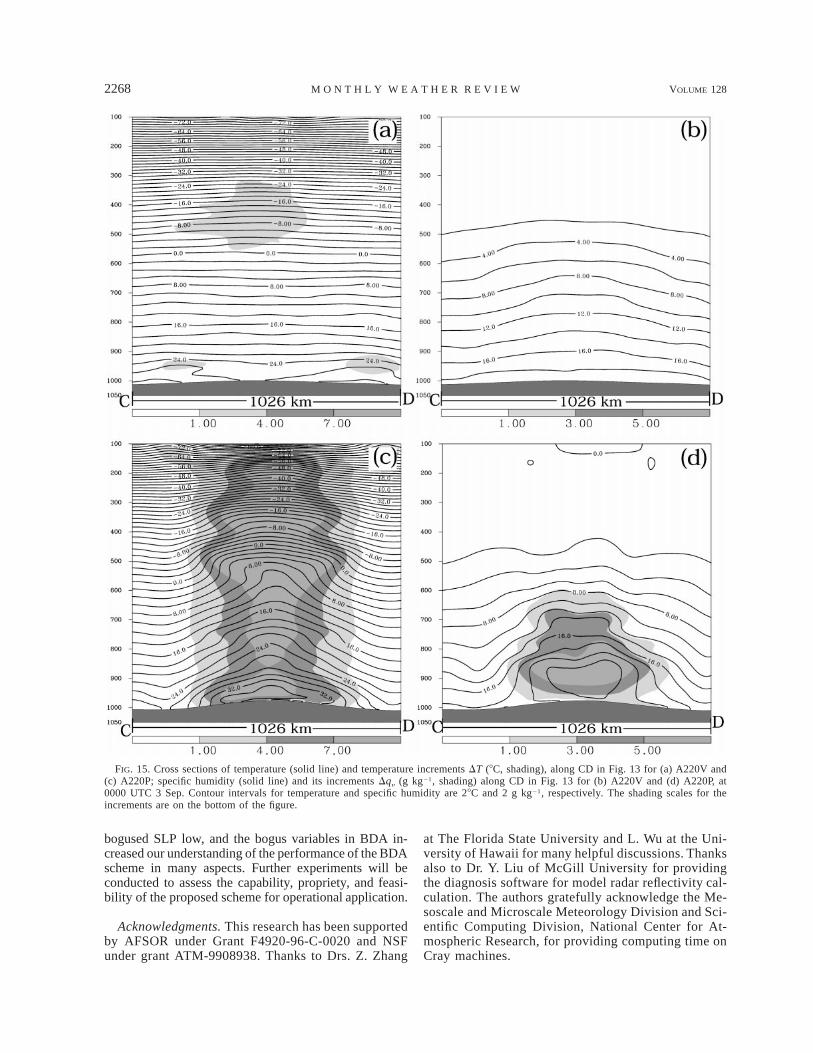
Figure 14 shows the predicted hurricane intensity var-iations of A220P and A220V for the 78-h simulations.As a comparison, the intensity changes of A220 and theNHC observations are also shown in Fig. 14, along withA220P and A220V. At the initial time, A220P had ahurricane central pressure of 976 hPa and a maximumlow-level wind of 26.1 m s21, while in A220V the cen-tral pressure was 1007 hPa and the maximum low-levelwind was 34.6 m s21. This implies that the assimilationof the bogused wind alone could not produce a hurricaneSLP field with realistic intensity. On the contrary, thewind fields were significantly adjusted while assimilat-ing the bogused SLP data. The subsequent 78-h modelsimulations show that A220V predicted a relativelyweaker hurricane, although the forecasting skill inA220V is improved compared to CTL. The predictedhurricane central pressure and low-level maximum windspeed at 54 h were 982 hPa and 42 m s21, respectively.It is interesting to note that, although the low-level max-imum wind of A220V at the beginning was very closeto the observation, the forecast became poorer as thetime of integration increased. A precise specification ofwind fields alone in the BDA scheme seems insufficientto obtain a prediction with a realistic intensity and in-tensity change if no related pressure field is also spec-ified in the scheme. A220P had an overall better per-formance than A220V, although the wind fields at theinitial time were slightly weaker and the model predic-tion suffered a 12-h spinup problem (Figs. 14a,b). Itshould be pointed out that the predicted hurricane low-level maximum winds in A220P were closer to the ob-servation than in A220V, although the wind was notbogused into the model initial condition in A220P. Fromthese experiments, we conclude that the pressure bogusis more efficient than the wind bogus in reproducing arealistic hurricane intensity forecast. This reconfirms theimportance of the surface low information in the pres-sure field for the hurricane BDA initialization (Zou andXiao 1999).
Figure 15 shows the adjustments of the temperatureand humidity fields of A220P and A220V. The warmand moist core in the initial vortex of A220P (Figs.15c,d), is not produced in the initial vortex of A220V(Figs. 15a,b). The temperature fields in Fig. 15a weresimilar to the CTL experiment (Fig. 4a). In A220P, how-ever, the warm core is stronger than that in A220 (figureomitted). This may be part of the reason that A220Pproduced a stronger hurricane intensity forecast com-pared to A220. The stronger initial warm core in A220Presulted in a deeper hurricane central pressure in the
2266 VOLUME 128M O N T H L Y W E A T H E R R E V I E W
FIG. 13. The SLP (hPa, dashed line) and wind speed at 850 hPa(thick solid line) at initial time (0000 UTC 3 Sep 1996) for (a) A220V,(b) A220P, and (c) CTL. Contour intervals for SLP and 850-hPa windspeed are 5 hPa and 5 m s21, respectively.
model simulation and, hence, intensified the hurricanecirculation (wind fields). Because no warm core wasformed at the initial time in A220V, the simulated hur-ricane intensity was too weak.
The above two experiments indicate that the pressurefield is more important than the wind field in generatinghurricane structure using BDA. With the cost function(4b) included, the wind field is adjusted to keep (4b)small and force the pressure and wind field to a balancedstate. Otherwise, the pressure field will change very rap-idly during the model integration and the cost function(4b) may not be minimized. Although tropical cyclogen-
esis is emphatically not a simple process, our results fromthe BDA experiments indicate that collecting more in-formation for formulating the bogused SLP field is ef-fective in generating initial structures of a mature hur-ricane using the BDA technique. However, both pressureand wind observation data are necessary to obtain a betterforecast, as is clearly shown from the results of this study.Ideally speaking, rotationally balanced wind and pressurevortex fields should be used as the data constraints in theassimilation. Then, the divergent circulation in the vortexwill be generated during the data assimilation with athermally active prediction model.
JULY 2000 2267X I A O E T A L .
FIG. 14. Variations of (a) hurricane central SLP (hPa) and (b) max-imum low-level wind speed VpMax (m s21) predicted by CTL(dashed), A220P (dotted–dashed), A220V (light dashed), A220 (dot-ted), and the observation (solid) from 0000 UTC 3 Sep to 0600 UTC6 Sep.
6. Summary and conclusions
One of the most challenging problems for the tropicalcyclone forecaster and researcher is defining the struc-ture of the tropical cyclone and the adjacent synopticfeatures with insufficient observations over the ocean.In this paper, the BDA scheme for hurricane initiali-zation, proposed by Zou and Xiao (2000), is tested forthe landfalling simulation of Hurricane Fran (1996). Westudied the sensitivity of the BDA scheme to the modelresolution, the radii of maximum SLP gradient for thespecification of the bogus vortex, and the type of bogusdata assimilated in the BDA. Numerical simulations ofMM5 using the BDA scheme showed a remarkable fore-cast skill in reproducing the movement, intensity, and
structure of Hurricane Fran near landfall. Sensitivitystudies reveal many interesting features. The most im-portant results are summarized as follows.
R The BDA scheme is very efficient in recovering theinitial structure of the hurricane using very little ob-servational information. Because the hurricane fore-cast model was used as a strong constraint in the hur-ricane BDA scheme, all model fields were adjustedto fit the bogus data of the SLP low and the derivedbalance wind fields. For instance, a moist warm-corehurricane structure was found in the initial vortex afterBDA. These are adjustments in the model variablesnot directly bogused. An automatic result of BDA isthat the initial conditions were consistent with thehurricane forecast model.
R The simulation of the hurricane track was sensitive tothe model resolution on which the BDA scheme wasperformed. The predicted hurricane track was im-proved from the initialization with higher resolution.But the improvement from using higher resolutiondoes not occur in the intensity forecast.
R In the present case with the current model configu-ration, the RMW used in the BDA scheme is a sen-sitive parameter for the hurricane track and intensityforecast. If the selected domain grid mesh can resolvethe specified bogus vortex, hurricanes with largerRMW have a larger component of westward motionand are usually weaker.
R The sensitivity study shows that assimilation with theuse of the bogused SLP field in the BDA scheme ismore effective than the wind fields in recovering hur-ricane structure in all model variables. The hurricanesimulation from the initial conditions produced by theuse of bogused SLP low data is closer to observationthan the use of bogused wind data only.
R Despite the differences resulting from variations inbogus data and model resolution, all the forecast ex-periments initialized with the BDA scheme obtainedreasonably good hurricane track forecasts, which werereflected in the landfall location and the landfallingtime. It is of particular importance that the BDAscheme showed great capabilities in reproducing theintensity and intensity changes of Hurricane Fran.
R The hurricane flow structure is simulated well usingBDA and is in conformity with the structures illus-trated by many authors such as Willoughby (1995).During the landing period of Fran, the model-simu-lated wind and reflectivity exhibited many structuressimilar to the observed wind and radar reflectivitydistributions onshore.
This study is a natural extension of the work by Zouand Xiao (2000) where the BDA scheme was tested forthe prediction of Hurricane Felix (1995). It is demon-strated that the BDA scheme works well, not only for adeveloping hurricane, but also for a mature hurricanesimulation. The studies of the sensitivity of the BDAscheme to the model resolution, the RMW of the specified
2268 VOLUME 128M O N T H L Y W E A T H E R R E V I E W
FIG. 15. Cross sections of temperature (solid line) and temperature increments DT (8C, shading), along CD in Fig. 13 for (a) A220V and(c) A220P; specific humidity (solid line) and its increments Dqy (g kg21, shading) along CD in Fig. 13 for (b) A220V and (d) A220P, at0000 UTC 3 Sep. Contour intervals for temperature and specific humidity are 28C and 2 g kg21, respectively. The shading scales for theincrements are on the bottom of the figure.
bogused SLP low, and the bogus variables in BDA in-creased our understanding of the performance of the BDAscheme in many aspects. Further experiments will beconducted to assess the capability, propriety, and feasi-bility of the proposed scheme for operational application.
Acknowledgments. This research has been supportedby AFSOR under Grant F4920-96-C-0020 and NSFunder grant ATM-9908938. Thanks to Drs. Z. Zhang
at The Florida State University and L. Wu at the Uni-versity of Hawaii for many helpful discussions. Thanksalso to Dr. Y. Liu of McGill University for providingthe diagnosis software for model radar reflectivity cal-culation. The authors gratefully acknowledge the Me-soscale and Microscale Meteorology Division and Sci-entific Computing Division, National Center for At-mospheric Research, for providing computing time onCray machines.
JULY 2000 2269X I A O E T A L .
REFERENCES
Bender, M. A., R. J. Ross, R. E. Tuleya, and Y. Kurihara, 1993:Improvements in tropical cyclone track and intensity forecastsusing the GFDL initialization system. Mon. Wea. Rev., 121,2046–2061.
Blackadar, A. K., 1979: High resolution models of the planetaryboundary layer. Advances in Environmental Science and Engi-neering, Vol. 1, 50–85.
Dudhia, J., 1993: A nonhydrostatic version of the Penn State–NCARmesoscale model: Validation tests and simulation of an Atlanticcyclone and cold front. Mon. Wea. Rev., 121, 1493–1513.
Elsberry, R. L., K. A. Emanuel, G. Holland, H. Gerrish, M. DeMaria,and C. Guard, 1992: Is there any hope for tropical cyclone in-tensity prediction? A panel discussion. Bull. Amer. Meteor. Soc.,73, 264–275.
Fiorino, M., and R. L. Elsberry, 1989: Some aspects of vortex struc-ture related to tropical cyclone motion. J. Atmos. Sci., 46, 975–990.
Fujita, T., 1952: Pressure distribution within a typhoon. Geophys.Mag., 23, 437–451.
Fujiyoshi, Y., T. Endoh, T. Yamada, K. Tsuboki, Y. Tachibana, andG. Wakahana, 1990: Determination of a Z–R relationship forsnowfall using a radar and high sensitivity snow gauges. J. Appl.Meteor., 29, 147–152.
Grell, G. A., 1993: Prognostic evaluation of assumptions used bycumulus parameterization. Mon. Wea. Rev., 121, 764–787., J. Dudhia, and D. R. Stauffer, 1994: A description of the fifthgeneration Penn State/NCAR mesoscale model (MM5). NCARTech Note NCAR/TN-3981STR, 138 pp.
Jorgenson, D. P., and P. T. Wills, 1982: A Z–R relationship for hur-ricanes. J. Appl. Meteor., 21, 356–366.
Krishnamurti, T. N., H. S. Bedi, and K. Ingles, 1993: Physical ini-tialization using SSM/I rain rates. Tellus, 45A, 247–269., S. K. Roy Bhowmik, D. Oosterhof, and G. Rohaly, 1995: Me-soscale signatures within the Tropics generated by physical ini-tialization. Mon. Wea. Rev., 123, 2771–2790., R. Correa-Torres, G. Rohaly, and D. Oosterhof, 1997: Physicalinitialization and hurricane ensemble forecasts. Wea. Forecast-ing, 12, 503–514., W. Han, B. Jha, and H. S. Bedi, 1998: Numerical predictionof Hurricane Opal. Mon. Wea. Rev., 126, 1347–1363.
Kurihara, Y., and R. J. Ross, 1993: An initialization scheme of hur-ricane models by vortex specification. Mon. Wea. Rev., 121,2030–2045., M. A. Bender, R. E. Tuleya, and R. J. Ross, 1995: Improvementsin the GFDL hurricane prediction system. Mon. Wea. Rev., 123,2791–2801.
Leslie, L. M., and G. J. Holland, 1995: On the bogusing of tropicalcyclones in numerical models: A comparison of vortex profiles.Meteor. Atmos. Phys., 56, 101–100.
Liu, D. C., and J. Nocedal, 1989: On the limited memory BFGSmethod for large scale optimization. Math. Programming, 45,503–528.
Liu, Y., D.-L. Zhang, and M. K. Yau, 1997: A multiscale study ofHurricane Andrew (1992). Part I: Explicit simulation and veri-fication. Mon. Wea. Rev., 125, 3073–3093.
Mathur, M. B., 1991: The National Meteorological Center’s quasi-Lagrangian model for hurricane prediction. Mon. Wea. Rev., 109,1419–1447.
Molinari, J., and M. Dudek, 1992: Parameterization of convectiveprecipitation in mesoscale numerical models: A critical review.Mon. Wea. Rev., 120, 326–344.
Navon, I. M., X. Zou, J. Derber, and J. Sela, 1992: Variational dataassimilation with an adiabatic version of the NMC spectral mod-el. Mon. Wea. Rev., 120, 1433–1446.
Pasch, R. J., and L. A. Avila, 1999: Atlantic hurricane season of1996. Mon. Wea. Rev., 127, 581–610.
Peng, M. S., B.-F. Jeng, and C.-P. Chang, 1993: Forecast of typhoonmotion in the vicinity of Taiwan during 1989–90 using a dy-namical model. Wea. Forecasting, 8, 309–325.
Ross, R. J., and Y. Kurihara, 1995: A numerical study on influencesof Hurricane Gloria (1985) on the environment. Mon. Wea. Rev.,123, 332–346.
Serrano, E., and P. Unden, 1994: Evaluation of a tropical cyclonebogusing method in data assimilation and forecasting. Mon. Wea.Rev., 122, 1523–1547.
Ueno, M., 1989: Operational bogussing and numerical prediction ofTyphoon in JMA. JMA/NPD Tech. Rep. 28, 48 pp. [Availablefrom Japan Meteorological Agency, Numerical Prediction Di-vision, 1-3-4; Ote-Machi, Chiyodaku, Tokyo, 100, Japan.]
Wang, Y., 1998: On the bogusing of tropical cyclones in numericalmodels: The influence of vertical structure. Meteor. Atmos.Phys., 65, 153–170.
Willoughby, H. E., 1995: Mature structure and evolution. GlobalPerspectives on Tropical Cyclones, WMO Tech. Doc. WMO/TD-No. 693, 21–62.
Zhang, D.-L., and R. A. Anthes, 1982: A high-resolution model ofthe planetary boundary layer-sensitivity tests and comparisonswith SESAME-79 data. J. Appl. Meteor., 21, 1594–1609., E.-Y. Hsie, and M. W. Moncrieff, 1988: A comparison of ex-plicit and implicit predictions of convective and stratiform pre-cipitating weather system with a meso-b scale numerical model.Quart. J. Roy. Meteor. Soc., 114, 31–60.
Zou, X., and Q. Xiao, 2000: Studies on the initialization and simu-lation of a mature hurricane using a variational bogus data as-similation scheme. J. Atmos. Sci., 57, 836–860., F. Vandenberghe, M. Pondeca, and Y.-H. Kuo, 1997: Intro-duction to adjoint techniques and the MM5 adjoint modelingsystem. NCAR Tech. Note NCAR/TN-435-STR, 110 pp.
Related Documents

![CloudSat measurements of landfalling hurricanes Gustav and ... - jgr.pdfabout hurricanes over the land areas [e.g.,Skwira et al., 2005]. Another reason for this choice is that landfalling](https://static.cupdf.com/doc/110x72/5ec7734240598b5fd82e2074/cloudsat-measurements-of-landfalling-hurricanes-gustav-and-jgrpdf-about-hurricanes.jpg)