Cancer Cell Article Inhibition of De Novo NAD + Synthesis by Oncogenic URI Causes Liver Tumorigenesis through DNA Damage Krishna S. Tummala, 1 Ana L. Gomes, 1 Mahmut Yilmaz, 1 Osvaldo Gran ˜ a, 2 Latifa Bakiri, 3 Isabel Ruppen, 4 Pilar Xime ´ nez-Embu ´ n, 4 Vinayata Sheshappanavar, 5 Manuel Rodriguez-Justo, 6 David G. Pisano, 2 Erwin F. Wagner, 3 and Nabil Djouder 1, * 1 Growth Factors, Nutrients and Cancer Group, BBVA Foundation-Cancer Cell Biology Programme, Spanish National Cancer Research Centre, CNIO, 28029 Madrid, Spain 2 Bioinformatics Unit, Structural Biology and Biocomputing Programme, Spanish National Cancer Research Centre, CNIO, 28029 Madrid, Spain 3 Genes, Development, and Disease Group, BBVA Foundation-Cancer Cell Biology Programme, Spanish National Cancer Research Centre, CNIO, 28029 Madrid, Spain 4 Proteomics Core Unit, ProteoRed ISCIII, Biotechnology Programme, Spanish National Cancer Research Centre, CNIO, 28029 Madrid, Spain 5 Department of Pathology, Royal London Hospital, London E1 1BB, UK 6 Department of Cellular Pathology, University College London NHS Trust, London NW1 2BU, UK *Correspondence: [email protected] http://dx.doi.org/10.1016/j.ccell.2014.10.002 SUMMARY Molecular mechanisms responsible for hepatocellular carcinoma (HCC) remain largely unknown. Using genetically engineered mouse models, we show that hepatocyte-specific expression of unconventional pre- foldin RPB5 interactor (URI) leads to a multistep process of HCC development, whereas its genetic reduction in hepatocytes protects against diethylnitrosamine (DEN)-induced HCC. URI inhibits aryl hydrocarbon (AhR)- and estrogen receptor (ER)-mediated transcription of enzymes implicated in L-tryptophan/kynurenine/ nicotinamide adenine dinucleotide (NAD + ) metabolism, thereby causing DNA damage at early stages of tumorigenesis. Restoring NAD + pools with nicotinamide riboside (NR) prevents DNA damage and tumor formation. Consistently, URI expression in human HCC is associated with poor survival and correlates nega- tively with L-tryptophan catabolism pathway. Our results suggest that boosting NAD + can be prophylactic or therapeutic in HCC. INTRODUCTION Hepatocellular carcinoma (HCC) is the commonest, usually lethal, human primary liver neoplasm (GLOBOCAN v2.0, 2008). The early stage is characterized by low- to high-grade dysplastic nodules, ‘‘preneoplastic lesions’’ (Kudo, 2009). These frequently develop in chronic inflammatory liver disease or hepatitis, which can pro- mote fibrosis, cirrhosis, and progression to HCC. Thus, precan- cerous lesions have clinical value for HCC prediction (Libbrecht et al., 2001), but therapeutic options are limited (El-Serag, 2011). In early stages of many cancers, including HCC, oncogene activation induces replicative stress, resulting in DNA damage leading to chromosomal instability (CIN), which accelerates tumor development (Teoh et al., 2008). DNA damage elicits a key repair mechanism, the DNA damage response (DDR), initi- ated by phosphorylation of checkpoint proteins Chk1, Chk2, and p53 (Reinhardt and Schumacher, 2012). p53-dependent responses, including cell cycle arrest and/or senescence, are induced, limiting preneoplastic lesions’ growth. When DNA dam- age is too pronounced, p53 engages an apoptotic program by Significance HCC is the third leading cause of cancer death worldwide with limited therapeutic options. Here we demonstrate that NAD + deficit-induced genotoxic stress is critical to initiate liver tumorigenesis and unravel a critical link between nutrient meta- bolism and genome integrity. Because our findings are relevant in human HCC, we propose that nutritional supplementation of NR, a vitamin B3 derivative, or other NAD + boosters can be used as preventive and curative therapies in oncogene- induced NAD + depletion-mediated DNA damage and carcinogenesis, especially in patients with precancerous lesions. Therapeutic intervention on metabolic alterations prior to genomic instability should be further considered to prevent tumorigenesis. Cancer Cell 26, 1–14, December 8, 2014 ª2014 Elsevier Inc. 1 Please cite this article in press as: Tummala et al., Inhibition of De Novo NAD + Synthesis by Oncogenic URI Causes Liver Tumorigenesis through DNA Damage, Cancer Cell (2014), http://dx.doi.org/10.1016/j.ccell.2014.10.002

Welcome message from author
This document is posted to help you gain knowledge. Please leave a comment to let me know what you think about it! Share it to your friends and learn new things together.
Transcript

Please cite this article in press as: Tummala et al., Inhibition of De Novo NAD+ Synthesis by Oncogenic URI Causes Liver Tumorigenesis through DNADamage, Cancer Cell (2014), http://dx.doi.org/10.1016/j.ccell.2014.10.002
Cancer Cell
Article
Inhibition of De Novo NAD+ Synthesisby Oncogenic URI Causes LiverTumorigenesis through DNA DamageKrishna S. Tummala,1 Ana L. Gomes,1 Mahmut Yilmaz,1 Osvaldo Grana,2 Latifa Bakiri,3 Isabel Ruppen,4
Pilar Ximenez-Embun,4 Vinayata Sheshappanavar,5 Manuel Rodriguez-Justo,6 David G. Pisano,2 Erwin F. Wagner,3
and Nabil Djouder1,*1Growth Factors, Nutrients and Cancer Group, BBVA Foundation-Cancer Cell Biology Programme, Spanish National Cancer ResearchCentre, CNIO, 28029 Madrid, Spain2Bioinformatics Unit, Structural Biology and Biocomputing Programme, Spanish National Cancer Research Centre, CNIO, 28029 Madrid,
Spain3Genes, Development, and Disease Group, BBVA Foundation-Cancer Cell Biology Programme, Spanish National Cancer Research Centre,CNIO, 28029 Madrid, Spain4Proteomics Core Unit, ProteoRed ISCIII, Biotechnology Programme, Spanish National Cancer Research Centre, CNIO, 28029Madrid, Spain5Department of Pathology, Royal London Hospital, London E1 1BB, UK6Department of Cellular Pathology, University College London NHS Trust, London NW1 2BU, UK*Correspondence: [email protected]
http://dx.doi.org/10.1016/j.ccell.2014.10.002
SUMMARY
Molecular mechanisms responsible for hepatocellular carcinoma (HCC) remain largely unknown. Usinggenetically engineered mouse models, we show that hepatocyte-specific expression of unconventional pre-foldin RPB5 interactor (URI) leads to amultistep process of HCC development, whereas its genetic reductionin hepatocytes protects against diethylnitrosamine (DEN)-induced HCC. URI inhibits aryl hydrocarbon (AhR)-and estrogen receptor (ER)-mediated transcription of enzymes implicated in L-tryptophan/kynurenine/nicotinamide adenine dinucleotide (NAD+) metabolism, thereby causing DNA damage at early stages oftumorigenesis. Restoring NAD+ pools with nicotinamide riboside (NR) prevents DNA damage and tumorformation. Consistently, URI expression in human HCC is associated with poor survival and correlates nega-tively with L-tryptophan catabolism pathway. Our results suggest that boosting NAD+ can be prophylactic ortherapeutic in HCC.
INTRODUCTION
Hepatocellular carcinoma (HCC) is the commonest, usually lethal,
humanprimary liver neoplasm (GLOBOCANv2.0, 2008). Theearly
stage is characterized by low- to high-grade dysplastic nodules,
‘‘preneoplastic lesions’’ (Kudo, 2009). These frequently develop
in chronic inflammatory liver disease or hepatitis, which can pro-
mote fibrosis, cirrhosis, and progression to HCC. Thus, precan-
cerous lesions have clinical value for HCC prediction (Libbrecht
et al., 2001), but therapeutic options are limited (El-Serag, 2011).
Significance
HCC is the third leading cause of cancer death worldwide withdeficit-induced genotoxic stress is critical to initiate liver tumobolism and genome integrity. Because our findings are relevantof NR, a vitamin B3 derivative, or other NAD+ boosters can binduced NAD+ depletion-mediated DNA damage and carcinoTherapeutic intervention on metabolic alterations prior to getumorigenesis.
In early stages of many cancers, including HCC, oncogene
activation induces replicative stress, resulting in DNA damage
leading to chromosomal instability (CIN), which accelerates
tumor development (Teoh et al., 2008). DNA damage elicits a
key repair mechanism, the DNA damage response (DDR), initi-
ated by phosphorylation of checkpoint proteins Chk1, Chk2,
and p53 (Reinhardt and Schumacher, 2012). p53-dependent
responses, including cell cycle arrest and/or senescence, are
induced, limiting preneoplastic lesions’ growth. When DNA dam-
age is too pronounced, p53 engages an apoptotic program by
limited therapeutic options. Here we demonstrate that NAD+
rigenesis and unravel a critical link between nutrient meta-in humanHCC, we propose that nutritional supplementatione used as preventive and curative therapies in oncogene-genesis, especially in patients with precancerous lesions.nomic instability should be further considered to prevent
Cancer Cell 26, 1–14, December 8, 2014 ª2014 Elsevier Inc. 1

Cancer Cell
URI-Induced NAD+ Depletion Causes HCC Development
Please cite this article in press as: Tummala et al., Inhibition of De Novo NAD+ Synthesis by Oncogenic URI Causes Liver Tumorigenesis through DNADamage, Cancer Cell (2014), http://dx.doi.org/10.1016/j.ccell.2014.10.002
upregulation of Bcl-2 family proteins (Noxa, Puma, Bid, and/or
Bax). p53 dysfunctions allow tumor cells to escape apoptosis,
and thus, mutations inactivating p53 are themost common alter-
ations observed in HCC (Reinhardt and Schumacher, 2012).
In pathophysiological situations, the balance between cell pro-
liferation and apoptosis can be altered, perturbing tissue homeo-
stasis. Apoptotic dysregulations are important in liver disease.
Insufficient apoptosis, eliminating mutated cells, combined
with inflammation-mediated proliferation can promote liver can-
cer development. Excessive or sustained apoptosis causes liver
injuries, increased hepatocyte regeneration, which enhances ge-
netic errors and predisposes to HCC (Malhi and Gores, 2008).
Still, the initiating hepatocarcinogenesis events remain unclear.
Developing experimental models mimicking distinct stages of
HCC development would help to explore molecular mechanisms
linking histopathological changes to hepatocarcinogenesis.
Unconventional prefoldin RBP5 interactor (URI), a member
of the R2TP/URI-prefoldin (PFD)-like complex containing the
heat shock protein 90 (HSP90) (Boulon et al., 2010), is an onco-
gene amplified in human ovarian carcinomas and downstream
effector of the growth factor and nutrient-regulated mTOR/
S6K1 signaling cascade (Theurillat et al., 2011). URI inhibits
phosphatase PP1g, thereby increasing S6K1 activity-dependent
survival signaling. Thus, URI/PP1g complexes maintain the
mitochondrial threshold for apoptosis in accordance to nutrient
availability. URI overexpression promotes survival, while its dele-
tion enhances cancer cell death (Djouder et al., 2007; Theurillat
et al., 2011). Prompted by these observations, and the fact
that HCC occurs on the basis of mitochondrial dysfunction-
mediated hepatocyte death and liver injury (Luedde et al.,
2014; Malhi and Gores, 2008), we investigate the role of URI in
hepatocarcinogenesis.
RESULTS
URI Expression in Mouse Hepatocytes InducesSpontaneous Liver TumorsWe generated a Col1a1 knockin mouse (Figures S1A and S1B
available online), expressing human URI (hURI) via a tetracy-
cline-dependent transactivator controlled by the hepatocyte-
specific liver activated protein promoter (Figures S1C–S1E).
These mice, designated hURI-tetOFFhep, and littermates lacking
hURI expression are referred to hereafter as ‘‘mutants’’ and
‘‘controls,’’ respectively. Without doxycycline, hURI was ex-
pressed specifically in hepatocytes from one allele from E10.5
(Carpenter et al., 2005), roughly twice as much as mouse
URI (Figures 1A, S1F, and S1G), similar to the increase of URI
expression in human HCC (see below).
We observed no pathological signs in 3-week-old mutants. In
8-week-old mutants, hematoxylin and eosin (H&E) staining re-
vealed anisokaryotic clusters (Figure 1B) resembling low-grade
dysplastic nodules observed in human hepatitis (Libbrecht
et al., 2001). At 12 weeks the clusters developed into high-grade
dysplastic nodules (Figures 1B, S1H, and S1I), similar to human
large liver cell dysplasia (LLCD) (Libbrecht et al., 2001). Fibrosis
was detected at 8 weeks and increased over time until 24 weeks,
as assessed by Sirius Red (SR), Masson Trichrome, alpha
smooth muscle actin, type I collagen (COL1A1), and reticulin
staining (Figure S1J). Quantification showed that about 1% to
2 Cancer Cell 26, 1–14, December 8, 2014 ª2014 Elsevier Inc.
3% of livers were SR positive in mutants, representing 100%
to 300% increase over littermates (Figure S1K). Increases in
fibroticmarkers weremeasured by quantitative RT-PCR (Figures
S1L–S1N), but serum alanine aminotransferase (ALT) values
remained unchanged (Figure S1O).
Between 24–54 weeks macroscopic lesions including ade-
noma and early HCC emerged. Recent reports described malig-
nant transformation of human adenomas, but tumors in our
model developed simultaneously (Pilati et al., 2014). Between
54–65 weeks low-grade and differentiated HCC were fully
apparent, and between 65–75 weeks, 40% of mutants devel-
oped macroscopic high-grade tumors occupying 20%–60%
of the liver (Figures 1B, 1C, and S1P). There were 25%–50% of
hepatocytes that were Ki67-positive, suggesting aggressive
tumors (data not shown). According to World Health Organi-
zation criteria (WHO, 2008), all tumors were well/moderately
differentiated: 20% glandular/acinar, indicative of telangiectatic
variants, and 80% trabecular. No cholangiocarcinoma were
detected (Figure 1C). Serum glucose, ALT, and total bile
acids were affected (Figure S1Q). Surprisingly, serum albumin
was increased, suggesting that liver function might not be fully
compromised (Figure S1Q).
All mutants died at �85 weeks, with a median survival
of 76 weeks before complete liver failure (Figure 1D). Immuno-
histochemistry (IHC) and pathological analyses revealed hURI-
positive hepatocyte-like cells in 30% of mutant lungs with
HCC, indicating aggressive metastases (Figures S1R and S1S).
Histopathological characterization confirmed the presence of
heterogeneous tumorswith collapsed reticulin fibers, suggesting
increased hepatocyte death and proliferation, as indicated by
Ki67 (Figure 1E). Increases in alpha fetoprotein (AFP) levels, a
clinical marker for human HCC varied, but all tumors displayed
dramatic increases in p53 abundance and phosphorylation (Fig-
ures 1E and 1F), suggesting that p53 may either carry mutations
or may be improperly folded (Trinidad et al., 2013), thus possibly
inactive.
Fully developed HCC appeared at 30 weeks in hepatocarcino-
gen diethylnitrosamine (DEN)-treated hURI-tetOFFhepmice (Ves-
selinovitch and Mihailovich, 1983) (Figure S1T). When hURI was
expressed from two alleles, increasing its expression to 6-fold
compared to heterozygous hURI-tetOFFhep mice, HCC were
detected at 10 weeks (Figure S1U), highlighting the importance
of URI dosage. Embryonic development was not involved
because liver tumors were also detected in mice kept on doxy-
cycline until 8 weeks (expressing hURI from 8 weeks) then trans-
ferred to normal (chow) diet (Figure S1V). Thus, hURI expression
in mouse hepatocytes induces spontaneous HCC.
Continuous URI Expression Is Essential forHepatocarcinogenesisCeasing hURI expression in 8-week-old mutants for 24 weeks
reduced fibrosis and abolished dysplastic foci and prevented
early tumors, without affecting liver-to-body weight ratios (Fig-
ures 2A–2D and S2A). S6K1 activity was increased in 24-week-
old mice, but remained constant when hURI expression ceased,
indicating that mTOR/S6K1 activation was hURI-independent
(Figure 2B). Switching hURI expression off until 60 weeks pre-
vented tumor development and normalized ALT levels (Figures
S2B–S2E). Similarly, when hURI was expressed for 24 weeks,

Figure 1. URI Expression in Mouse Hepatocytes Induces Spontaneous Liver Tumors
(A) Representative images of IHC stained liver sections from 3-week-old hURI-tetOFFhep mice using hURI and FLAG antibodies. Insets represent the periportal
area, showing hepatocyte specific hURI expression. (n > 10).
(B) Representative images of H&E stained liver sections from 3- (n > 6), 8- (n > 19), 12- (n > 11), and 32-week-old (n > 7) hURI-tetOFFhepmice. Bottom two rows are
representative images of whole livers from hURI-tetOFFhep mice at 32 and 75 weeks of age. Black dotted circles mark LLCD-like lesions and black arrows point
anisokaryotic clusters in mutant hURI-tetOFFhep mice. Yellow dotted circles depict adenoma and HCC at 32 and 75 weeks of age, respectively.
(C) Percentage of control and mutant hURI-tetOFFhep mice bearing liver abnormalities in 60- to 75-week-old-mice.
(D) Kaplan Meier curve of control (n = 17) and mutant (n = 17) hURI-tetOFFhep mice. Log rank test p = 0.0036; Hazard ratio = 0.1603.
(E) Representative images of H&E, IHC, and reticulin stained liver sections from control and four tumors derived from one mutant hURI-tetOFFhep. NT, PT, and
T denote nontumoral, peritumoral, and tumoral tissues, respectively.
(F) WB analysis of control and mutant hURI-tetOFFhep livers. ‘‘T’’ denotes tumor.
See also Figure S1.
Cancer Cell
URI-Induced NAD+ Depletion Causes HCC Development
Please cite this article in press as: Tummala et al., Inhibition of De Novo NAD+ Synthesis by Oncogenic URI Causes Liver Tumorigenesis through DNADamage, Cancer Cell (2014), http://dx.doi.org/10.1016/j.ccell.2014.10.002
until high-grade dysplastic nodules/early HCC and adenomas
were apparent, then, switched-off for 28 weeks, only residual
anisokaryotic clusters were detected, but no adenomas or
HCCs (Figure 2E). However, ultrasound analysis demonstrated
that well/moderately differentiated HCC (above 60 weeks) did
not regress when hURI expression was ceased for 5 weeks (Fig-
ures S2F–S2H). Thus, continuous hURI expression is required for
the maintenance of preneoplastic lesions and early tumors.
Aggressive HCCs with sufficient genetic mutations become
URI independent, even though ceasing URI expression for a
longer time remains to be tested.
We genetically inactivated URI specifically in hepatocytes by
crossing URI(lox/lox) and serum albumin (SA)-CreERT2 mice
(Schuler et al., 2004). URI deletion in hepatocytes after tamoxifen
treatment to obtain URI(+/D)hep or URI(D/D)hepmice, was confirmed
by IHC and western blotting (WB) (Figures 2F and 2G). Homozy-
gous deletion of URI led to death of URI (D/D)hep mice around
10 days (Figure S2I). Disruption of tissue architecture, presence
of atypia, dilated veins with intrahepatic bleeding, signs of
necrosis, and inflammatory cell infiltration were observed by
H&E staining. Additionally, SR staining, collapsed reticulin
fibers, and increased ALT indicated that hepatocytes underwent
Cancer Cell 26, 1–14, December 8, 2014 ª2014 Elsevier Inc. 3
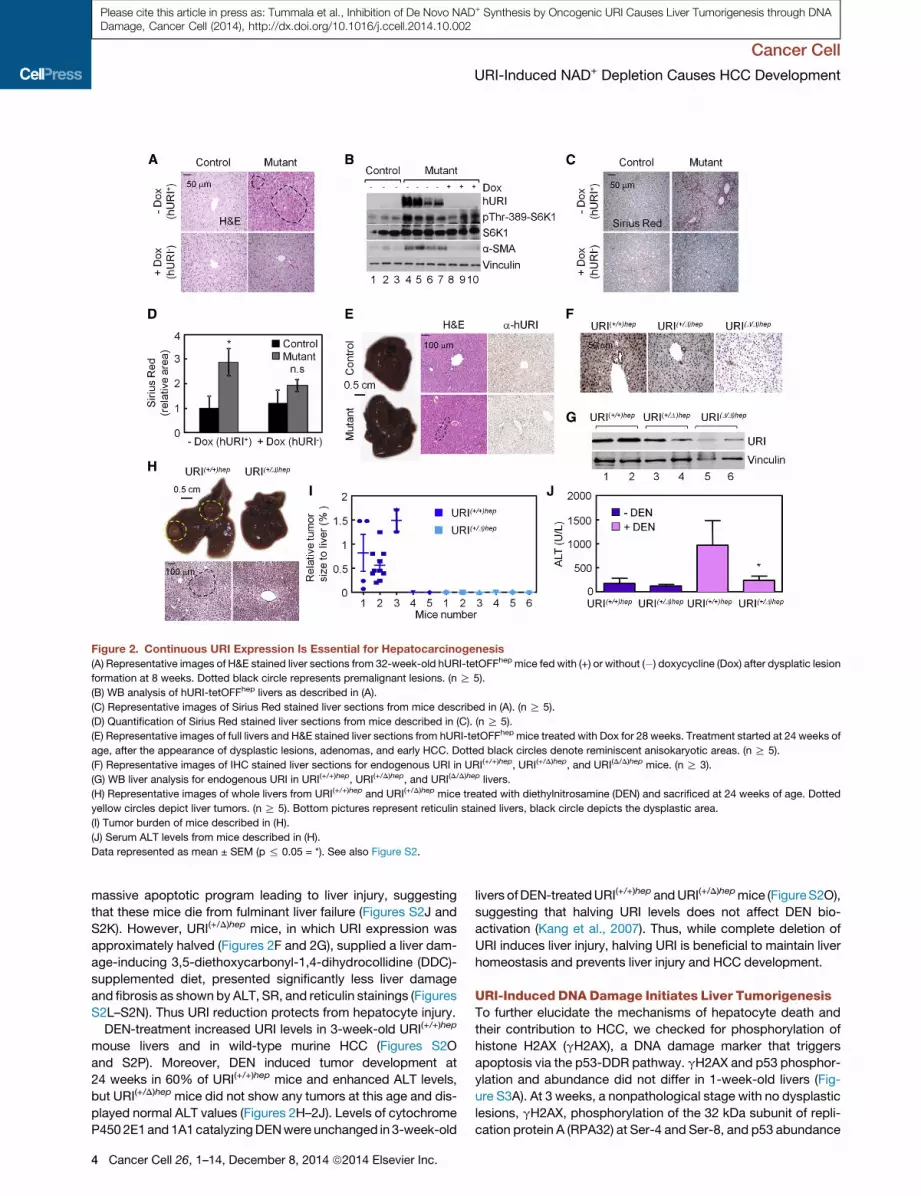
Figure 2. Continuous URI Expression Is Essential for Hepatocarcinogenesis
(A) Representative images of H&E stained liver sections from 32-week-old hURI-tetOFFhep mice fed with (+) or without (�) doxycycline (Dox) after dysplatic lesion
formation at 8 weeks. Dotted black circle represents premalignant lesions. (n R 5).
(B) WB analysis of hURI-tetOFFhep livers as described in (A).
(C) Representative images of Sirius Red stained liver sections from mice described in (A). (n R 5).
(D) Quantification of Sirius Red stained liver sections from mice described in (C). (n R 5).
(E) Representative images of full livers and H&E stained liver sections from hURI-tetOFFhep mice treated with Dox for 28 weeks. Treatment started at 24 weeks of
age, after the appearance of dysplastic lesions, adenomas, and early HCC. Dotted black circles denote reminiscent anisokaryotic areas. (n R 5).
(F) Representative images of IHC stained liver sections for endogenous URI in URI(+/+)hep, URI(+/D)hep, and URI(D/D)hep mice. (n R 3).
(G) WB liver analysis for endogenous URI in URI(+/+)hep, URI(+/D)hep, and URI(D/D)hep livers.
(H) Representative images of whole livers from URI(+/+)hep and URI(+/D)hep mice treated with diethylnitrosamine (DEN) and sacrificed at 24 weeks of age. Dotted
yellow circles depict liver tumors. (n R 5). Bottom pictures represent reticulin stained livers, black circle depicts the dysplastic area.
(I) Tumor burden of mice described in (H).
(J) Serum ALT levels from mice described in (H).
Data represented as mean ± SEM (p % 0.05 = *). See also Figure S2.
Cancer Cell
URI-Induced NAD+ Depletion Causes HCC Development
Please cite this article in press as: Tummala et al., Inhibition of De Novo NAD+ Synthesis by Oncogenic URI Causes Liver Tumorigenesis through DNADamage, Cancer Cell (2014), http://dx.doi.org/10.1016/j.ccell.2014.10.002
massive apoptotic program leading to liver injury, suggesting
that these mice die from fulminant liver failure (Figures S2J and
S2K). However, URI(+/D)hep mice, in which URI expression was
approximately halved (Figures 2F and 2G), supplied a liver dam-
age-inducing 3,5-diethoxycarbonyl-1,4-dihydrocollidine (DDC)-
supplemented diet, presented significantly less liver damage
and fibrosis as shown by ALT, SR, and reticulin stainings (Figures
S2L–S2N). Thus URI reduction protects from hepatocyte injury.
DEN-treatment increased URI levels in 3-week-old URI(+/+)hep
mouse livers and in wild-type murine HCC (Figures S2O
and S2P). Moreover, DEN induced tumor development at
24 weeks in 60% of URI(+/+)hep mice and enhanced ALT levels,
but URI(+/D)hep mice did not show any tumors at this age and dis-
played normal ALT values (Figures 2H–2J). Levels of cytochrome
P4502E1and1A1catalyzingDENwere unchanged in 3-week-old
4 Cancer Cell 26, 1–14, December 8, 2014 ª2014 Elsevier Inc.
livers ofDEN-treatedURI(+/+)hepandURI(+/D)hepmice (FigureS2O),
suggesting that halving URI levels does not affect DEN bio-
activation (Kang et al., 2007). Thus, while complete deletion of
URI induces liver injury, halving URI is beneficial to maintain liver
homeostasis and prevents liver injury and HCC development.
URI-Induced DNADamage Initiates Liver TumorigenesisTo further elucidate the mechanisms of hepatocyte death and
their contribution to HCC, we checked for phosphorylation of
histone H2AX (gH2AX), a DNA damage marker that triggers
apoptosis via the p53-DDR pathway. gH2AX and p53 phosphor-
ylation and abundance did not differ in 1-week-old livers (Fig-
ure S3A). At 3 weeks, a nonpathological stage with no dysplastic
lesions, gH2AX, phosphorylation of the 32 kDa subunit of repli-
cation protein A (RPA32) at Ser-4 and Ser-8, and p53 abundance
Figure 3. URI-Induced DNA Damage Initiates Liver Tumorigenesis
(A) Representative images of gH2AX IHC stained liver sections from 3-week-old hURI-tetOFFhep mice. Insets denote gH2AX positive nuclei. (n = 5).
(B) Quantification of (A).
(C) WB analysis of 3-week-old hURI-tetOFFhep livers.
(D) Representative images of gH2AX IHC stained liver sections from 8-week- and 12-week-old hURI-tetOFFhep mice. Dotted black shapes depict anisokaryotic
clusters positive for gH2AX. (n = 6).
(E) Quantification of (D).
(F) WB analysis of 8-week-old hURI-tetOFFhep livers
(G) WB analysis of 8-week-old hURI-tetOFFhep livers, with or without p53 inactivation.
(H) Reticulin and Sirius Red stained livers described in (G).
(I) Serum ALT levels of mutant mice with or without p53 inactivation. (n > 4).
(J) Kaplan-Meier survival curve of control and mutant hURI-tetOFFhep mice with and without p53 inactivation. (Log rank test p % 0.001.)
(K) Percentage of tumor incidence in hURI-tetOFFhep mice with or without p53 inactivation.
Data represented as mean ± SEM (*p % 0.05 and **p % 0.01). See also Figure S3.
Cancer Cell
URI-Induced NAD+ Depletion Causes HCC Development
Please cite this article in press as: Tummala et al., Inhibition of De Novo NAD+ Synthesis by Oncogenic URI Causes Liver Tumorigenesis through DNADamage, Cancer Cell (2014), http://dx.doi.org/10.1016/j.ccell.2014.10.002
and phosphorylation were higher in mutants (Figures 3A–3C),
suggesting that DDR precedes precancerous lesions. While
p53-dependent apoptosis occurred in cells that unsuccessfully
repair DNA (cleaved caspase 3; Figure 3C), hepatocyte prolifer-
ation rate was reduced (Figures S3B and S3C), suggesting that
high proliferation is not the initial hepatocarcinogenic event.
gH2AX-positive nuclei were more abundant in older mutant
livers (8- to 12-week-old) with obvious dysplastic lesions.
Furthermore, Ser-345 phosphorylation (and hence activation)
of Chk1 was enhanced in mutants, but not Thr-68 phosphoryla-
tion of Chk2, suggesting single strand break (Reinhardt and
Schumacher, 2012) (Figures 3D–3F). Enhanced p53 phosphory-
lation at Ser-18 (Chk1 target), acetylation at Ac-lys379 (Ito et al.,
2001) (Figure 3F), and expression of p19ARF (Reinhardt and
Schumacher, 2012) (Figure S3D) indicate p53 stabilization.
Senescence-associated b-galactosidase activity, expression
of several p53 target genes, BAX, and p21 protein abundance
were increased in 8- and 12-week-old mutants, while expression
of Xiapwas decreased (Figures 3F, S3E, and S3F) (Reinhardt and
Schumacher, 2012), suggesting increased hepatocyte death as
also shown by collapsed reticulin fibers (Figure S3G). Increased
abundance of proliferating cell nuclear antigen, cyclin D1, and
Ki67-positive nuclei suggested compensatory proliferation (Fig-
ures 3F and S3H). Finally, MAD2, a CIN marker and downstream
effector of cyclin D1, was increased (Figure 3F). Thus, hURI
expression in hepatocytes induces genotoxic stress, apoptosis,
compensatory proliferation, and CIN.
To assess genotoxic stress-induced apoptosis in HCC devel-
opment, p53 was inactivated in hURI-tetOFFhep mice. In p53-in-
activated 8-week-old mutants (hURI (+/Ki); p53ERTAM (+/Ki)),
Cancer Cell 26, 1–14, December 8, 2014 ª2014 Elsevier Inc. 5
Cancer Cell
URI-Induced NAD+ Depletion Causes HCC Development
Please cite this article in press as: Tummala et al., Inhibition of De Novo NAD+ Synthesis by Oncogenic URI Causes Liver Tumorigenesis through DNADamage, Cancer Cell (2014), http://dx.doi.org/10.1016/j.ccell.2014.10.002
cleaved caspase 3, Bax expression, and collapsed fibers were
decreased (Figures 3G and 3H). Furthermore, SR staining and
ALT levels were reduced (Figures 3H and 3I), indicating that
DNA damage-activated p53 is required for hepatocyte death
and liver injury. While apoptosis was drastically suppressed,
inactivation of p53 significantly reduced survival and accelerated
liver tumorigenesis (Figure 3J): 80% of mice displayed aggres-
sive HCC (Figure 3K). Deletion of Cdkn2a did not modify mouse
survival or tumor burden (data not shown). Thus, genotoxic
stress, rather than excessive apoptosis, is the critical initiating
event in liver carcinogenesis.
URI Causes DNA Damage and Liver Tumorigenesis byInhibiting De Novo NAD+ SynthesisTo identify URI-mediated hepatocarcinogenetic events, we first
examined mTOR activation, which had been implicated in HCC
development via DNAdamage (Menon et al., 2012). No increases
in S6K1 activity were detected at 1 week (Figure S4A). In sequen-
tial immunoprecipitation experiments, using 1-week-old liver ex-
tracts, free hURI molecules were revealed by WB after complete
depletion of PP1g (Figures S4B and S4C), and vice versa (data
not shown). When 3-week-old mice were supplied a rapamy-
cin-containing diet, progression to preneoplastic abnormalities
continued, if not further pronounced (data not shown). Thus,
although a fraction of hURI binds PP1g, hURI apparently has a
PP1g-independent role in DNA damage and liver tumorigenesis.
Additionally, no differences in reactive oxygen species (ROS)
were observed in 1- and 8-week-old livers (Figures S4D and
S4E), suggesting that DNA damage is ROS-independent.
Global transcriptomic and proteomic profiling were performed
in a very early nonpathological stage and early premalignant
state (1- and 8-week-old livers). Transcripts’ sequencing re-
vealed small fractions of genes differentially expressed upon
hURI expression: 303 out of 12,295 genes at 1 week, and 740
out of 11,133 (false discovery rate [FDR] < 0.05) at 8 weeks (Fig-
ures 4A and S4F). Similarly, isobaric tags for relative and abso-
lute quantification (iTRAQ) identified 2,394 proteins: 122 and
597 of which were differentially expressed in 1- and 8-week
livers, respectively (Figures 4B and S4G; Table S1).
Heatmapping revealed that most differentially expressed pro-
teins were downregulated (Figure S4H). Significant overlaps in
the differentially expressed transcripts and proteins at 1 and
8 weeks (Figures S4I and S4J), indicated hURI-dependent tran-
scriptional repression mechanisms. Ingenuity pathway analysis
(IPA) revealed that among canonical metabolic pathways, the
L-tryptophan/kynurenine catabolism leading to de novo nicotin-
amide adenine dinucleotide (NAD+) synthesis was one of the
most significant downregulated pathways (Figures 4C and S4K).
Enzymes implicated in the L-tryptophan/kynurenine degrada-
tion, including tryptophan 2,3-dioxygenase (TDO2) and arylfor-
mamidase (AFMID) catalyzing the initial rate-limiting step and
kynurenine 3-monooxygenase (KMO), kynureninase (KNYU), and
3-hydroxyanthranilate 3,4-dioxygenase (HAAO) were all downre-
gulated (Figure 4D). Gene set enrichment analysis (GSEA) (Subra-
manian et al., 2005), using the RNA sequencing data and Kyoto
Encyclopedia of Genes and Genomes database, corroborated
these defects (data not shown). WB confirmed that TDO2 and
AFMID expression was reduced >50% in these livers (Figures 4E
and S4L) and in adult livers expressing hURI (Figure S4M).
6 Cancer Cell 26, 1–14, December 8, 2014 ª2014 Elsevier Inc.
NAD+ concentrations were reduced in 3- and 6-week mutant
livers (Figures 4F and S4N), while increases in TDO2, AFMID,
and NAD+ levels were detected in URI(+/D)hep livers (Figures 4G
and 4H). Consistent with previous observations (Konishi et al.,
1986), liver NAD+ levels were depleted in DEN-treated mice,
and URI reduction enhanced NAD+ levels (Figure S4O). Thus,
URI reduction enhances NAD+ de novo synthesis, potentially ex-
plaining the protective effect of URI deletion in HCC. Further-
more, NAD+ concentrations inversely correlated with URI levels
in four human HCC cell lines (Huh-7, HepG2, SNU-398, and
SNU-449). While URI depletion significantly increased NAD+
levels, URI overexpression reduced NAD+ values (Figure S4P).
URI overexpression in SNU-449 cells, which had high NAD+
values and low endogenous URI levels, increased their growth,
whereas URI depletion in Huh-7 and HepG2 cells displaying
high endogenous URI, significantly reduced their growth (Fig-
ure S4Q). URI-regulating NAD+ levels may therefore be relevant
for human liver tumorigenesis.
Depleting TDO2 and AFMID in HCC cell line SNU-449
significantly reduced NAD+ levels (Figure S4R). Importantly, 14C-
labeled NAD+ levels in four human HCC cell lines incubated with14C-tryptophan reduced significantly following AFMID depletion
(Figure S4S), indicating that L-tryptophan degradation accounts
for de novo NAD+ synthesis. Furthermore, expression of key en-
zymes of three other pathways implicated in oncogenesis was
unaffected by hURI expression: SHMT1, G6PD, and GOT1 of
the glycine/serine/threonine, pentose phosphate and glutamine/
aspartate pathways, respectively (FigureS4T). Finally, expression
of nicotinamide phosphoribosyltransferase (NAMPT, implicated
in NAD+ biosynthesis through salvage reactions, Figure S4U)
and activity of poly (ADP-ribose) polymerase (PARP), the main
NAD+-consuming enzyme (Figure S4U) were not affected at early
stages (1week), and levels of NADH and several dehydrogenases
that reduce NAD+ to NADH were decreased (Figure S4U;
Table S2). Reduction of NAD+ is thus mainly due to downregula-
tion of L-tryptophan/kynurenine catabolism.
We next induced liver injury and hepatocyte proliferation in
C57BL/6 mice with DDC-supplemented diet for 4 days, treated
them with DMSO or Ro-61-8048, a KMO inhibitor, for the next
3 days, and sacrificed mice on day 8 (Figures S4V and S4W).
NAD+ concentrations were reduced and DNA damage foci
significantly elevated in Ro-61-8048-treated livers (Figures 4I–
4K). Thus, L-tryptophan/kynurenine pathway inhibition in vivo
leads to reduced NAD+ concentrations and DNA damage, reca-
pitulating effects of hURI expression. Finally, nontumorigenic
mouse liver cells AML-12, stably depleted of TDO2 and AFMID
and transplanted into immunodeficient mice, formed aggressive
tumors (Figure S4X), suggesting that inhibition of L-tryptophan
pathway leads to transformation and tumorigenesis.
We assessed whether DNA damage was a consequence
of inactivation of NAD+-consuming enzymes, such as SIRT1 or
PARP (Durkacz et al., 1980; Herranz et al., 2010). In SNU-449
cells, SIRT1 inhibition by EX-527, which may enhance NAD+,
reduced RPA32 phosphorylation, whereas activating SIRT1
with resveratrol, whichmay lower NAD+, increased phosphoryla-
tion of RPA32 (Figure S4Y). Because in our model NAD+ deficits
increased replicative stress, DNA damage is unlikely due
to SIRT1 inhibition alone. Additionally, in URI-overexpressing
SNU-449 cells, in which NAD+ levels were lowered (Figure S4P),

Figure 4. URI Causes DNA Damage and Liver Tumorigenesis by Inhibiting De Novo NAD+ Synthesis
(A) Volcano plots from RNA sequencing representing differentially expressed significant (blue) and unchanged (red) mRNA species in livers from 1- and 8-week-
old hURI-tetOFFhep mice. (n > 3).
(B) Histogram of differentially expressed proteins analyzed by iTRAQ in livers from 1- and 8-week-old hURI-tetOFFhep mice. Numbers of proteins significantly
downregulated (green) and upregulated (red) are shown. (n = 5).
(C) Top downregulated canonical metabolic pathways based on iTRAQ data from 8-week-old mice, analyzed by using IPA software.
(D) Scheme of de novo NAD+ synthesis. Fold change of protein expression detected in iTRAQ are represented within the brackets. Ro-61-8048 is an inhibitor
for KMO.
(E) WB analysis (left) and quantification of reduction (mutant over control, right) of TDO2 and AFMID of 8-week-old hURI-tetOFFhep livers.
(F) Liver NAD+ concentrations in 3-week-old hURI-tetOFFhep mice. (n R 10).
(G) WB analysis of URI(+/+)hep and URI(+/D)hep livers.
(H) NAD+ levels in livers from URI(+/+)hep and URI(+/D)hep mice. (n = 5).
(I) Liver NAD+ levels in C57BL/6 mice previously fed with DDC and treated with either DMSO (1%) or Ro-61-8048 (25 mg/Kg) compound. (n R 5).
(J) Representative images of gH2AX IHC stained liver sections from C57BL/6 mice described in (I). (n = 5).
(K) Quantification of (J).
Data represented as mean ± SEM (*p % 0.05 and ***p % 0.001). See also Figure S4 and Tables S1 and S2.
Cancer Cell
URI-Induced NAD+ Depletion Causes HCC Development
Please cite this article in press as: Tummala et al., Inhibition of De Novo NAD+ Synthesis by Oncogenic URI Causes Liver Tumorigenesis through DNADamage, Cancer Cell (2014), http://dx.doi.org/10.1016/j.ccell.2014.10.002
SIRT1 activation further increased RPA32 phosphorylation.
Thus, modulating SIRT1 activity may affect PARP activity either
via modulation of NAD+ levels or through regulation of acet-
ylation-dependent PARP1 activity (Rajamohan et al., 2009).
Notably, URI overexpression increased RPA32 phosphorylation,
which was not further enhanced when PARP was inhibited (Fig-
ure S4Y). Finally, PARP activity was reduced in 3-week-old
mutants, while NAMPT expression remained unchanged (Fig-
ure S4Z). Thus, hURI-mediated NAD+ depletion may induce
DNA damage via PARP inhibition.
Restoring NAD+ Pools Protects from DNA Damage andPrevents Tumor FormationTo investigate whether restoring NAD+ pools would prevent
dysplastic nodules and tumor formation, 3-week-old hURI-
tetOFFhep mice were supplied with a nicotinamide riboside
(NR) diet. NR significantly increased hepatic NAD+ concentra-
tions (Figure S5A) without affecting liver-to-body weight ratio
(Figure S5B). We detected dysplastic lesions and DNA damage
in all mutants on chow, but not in those on NR, which also had
reduced fibrosis, p53 abundance, and Ser-18 phosphorylation
(Figures 5A–5D, S5C, and S5D). Prolonged NR treatment pre-
vented tumor development and reduced ALT levels (Figures
5E–5G). Similarly liver tumors were prevented in 30-week-old
homozygous mutants with higher URI levels (Figure S5E).
Thus, restoring NAD+ pools protects from hURI-induced DNA
damage, preneoplastic lesions, and tumor development. Sur-
prisingly, 12-week-old homozygous mutants with full blown tu-
mors then on 48 weeks of NR regimen showed significant tumor
regression (Figures S5F and S5G), and their livers had high levels
Cancer Cell 26, 1–14, December 8, 2014 ª2014 Elsevier Inc. 7

Figure 5. Restoring NAD+ Pools Protects from DNA Damage and Prevents Tumor Formation
(A) Representative images of H&E and gH2AX IHC stained liver sections from 12-week-old hURI-tetOFFhep mice fed with either chow (nR 15) or NR diets started
at 3 weeks of age (n R 15). Dotted black lines indicate anisokaryotic clusters present in mutant hURI-tetOFFhep mice under chow diet.
(B) Quantification of dysplastic lesions in the hURI-tetOFFhep mice described in (A).
(C) Quantification of gH2AX positive nuclei in the hURI-tetOFFhep mice described in (A).
(D) WB analysis of mutant hURI-tetOFFhep livers as described in (A).
(E) Representative images of whole livers and H&E stained liver sections from 30- or 60-week-old hURI-tetOFFhep mice supplemented with NR diet from 3 weeks
of age until mice were sacrificed. (n R 10 for chow fed or NR fed.) Yellow dotted circles depict early tumors and black arrows point mitotic bodies.
(F) Tumor burden of 60-week-old mice described in (E).
(G) Serum ALT levels of 60-week-old mice described in (E).
(H) WB analysis of hURI-tetOFFhep mice expressing hURI for 8 weeks and switched OFF for 24 weeks.
(I) gH2AX IHC stained liver sections from 32-week-oldmutant hURI-tetOFFhepmice fedwith either chow or Dox diets. (n = 5). Red arrows point to DNAdamage foci.
Data represented as mean ± SEM (*p % 0.05 and ***p % 0.001). See also Figure S5.
Cancer Cell
URI-Induced NAD+ Depletion Causes HCC Development
Please cite this article in press as: Tummala et al., Inhibition of De Novo NAD+ Synthesis by Oncogenic URI Causes Liver Tumorigenesis through DNADamage, Cancer Cell (2014), http://dx.doi.org/10.1016/j.ccell.2014.10.002
of cleaved caspase 3 (Figure S5H), suggesting that boosting
NAD+ levels may be cytotoxic for tumor cells.
Furthermore, ceasing hURI expression in 8-week-old mice for
24 weeks restored AFMID levels, suppressed DNA damage,
abolished the DDR, and reduced acetylation of p53 at Lys-379,
possibly due to activated NAD+-dependent SIRT1 (Luo et al.,
2001) (Figures 5H and 5I). Thus, continuous hURI expression
and consequent inhibition of de novo NAD+ synthesis is essential
for abolishing DNA repair and accelerating tumor formation.
Next, we explored whether other oncogenes had similar ef-
fects. Ela-1-myc mice, unlike K-RasG12V mice, develop pancre-
atic adenocarcinomas with high levels of DNA damage, while
pancreatic tumors initiated by K-RasG12V show no signs of repli-
cative stress (Murga et al., 2011). In early stages of tumori-
genesis, c-Myc, but not K-RASG12V, expression induced DNA
damage (Figures S5I and S5J). TOD2 and AFMID were clearly
downregulated in Ela-1-myc, but not in K-RasG12V pancreas (Fig-
8 Cancer Cell 26, 1–14, December 8, 2014 ª2014 Elsevier Inc.
ure S5K). In 3-week-old Ela-1-myc mice, 4 weeks of NR diet did
not affect acinar-to-ductal metaplasia (ADM), but 12 weeks of
NR diet decreased ADM and carcinomas formation compared
to chow fed mice (Figures S5L–S5O). Importantly pancreatic
NAD+ levels were significantly reduced in Ela-1-myc mutants
on chow diet, but restored to almost control levels on NR diet
(Figure S5P). Thus, oncogene-induced DNA damage has a
common bearing on NAD+ levels.
URI Regulates Kynurenine Metabolism by ModulatingAhR and ER ActivityWe found significant overlaps in differentially expressed tran-
scripts between our RNA sequencing and published microarray
data sets for livers from aryl hydrocarbon receptor (AhR) and es-
trogen receptor (ER) knockout mice (Figures 6A, S6A, and S6B),
suggesting that AhR and ER mediate hURI-induced transcrip-
tional repression of L-tryptophan/kynurenine catabolism. TDO2

Figure 6. URI Regulates Kynurenine Metabolism by Modulating AhR and ER Activity
(A) GSEA using microarray data from Ahr�/� and Esr�/� livers and RNA sequencing data from 1 week hURI-tetOFFhep mice.
(B) WB analysis of human HepG2 cells transfected with scramble (siCtr) or siRNA against URI (siURI), AhR (siAhR), or ER (siER).
(C) Immunoprecipitation of cytosolic liver fractions from 1 week hURI-tetOFFhep mice and WB analysis.
(D) WB analysis of cytosolic fractions in livers from 1 week hURI-tetOFFhep mice.
(E) AhR and ER immunofluorescence of 1 week hURI-tetOFFhep liver sections. DAPI was used for nuclear staining. Lower panels depict nuclear colocalization
performed by using Image J. (n = 5).
(F) Quantification of nuclear colocalization of AhR and ER shown in (E).
Data represented as mean ± SD (**p % 0.01). See also Figure S6.
Cancer Cell
URI-Induced NAD+ Depletion Causes HCC Development
Please cite this article in press as: Tummala et al., Inhibition of De Novo NAD+ Synthesis by Oncogenic URI Causes Liver Tumorigenesis through DNADamage, Cancer Cell (2014), http://dx.doi.org/10.1016/j.ccell.2014.10.002
was also found deregulated in the core enriched Esr�/� data sets
in GSEA analysis. Depletion of AhR and ER in HepG2 cells
reduced expression of TDO2 (and AFMID), while URI downregu-
lation increased their abundance (Figure 6B). ALGGEN-PROMO
v3.0 software predicted several AhR and ER binding sites in
genomic sequences 5 kilobases upstream of the transcriptional
start sites of TDO2 and AFMID. Chromatin immunoprecipitation
assays revealed that both AhR and ER bound to these promoters
in SNU-449 cells (Figures S6C and S6D). We also verified hURI-
induced downregulation of other AhR and ER targets detected
in the RNA sequencing and iTRAQ analyses, including car-
bomyl-phosphate synthase 1, glutayl-CoA dehydrogenase,
and glycine N-methyltransferase 1 (GNMT1) (Figures S6E and
S6F). Notably, Gnmt1�/� mice develop chronic hepatitis and
spontaneous HCC (Liao et al., 2009). Thus, hURI can repress
AhR and ER transcriptional activity, implicated in transcription
of several metabolic enzymes in particular from the L-tryptophan
catabolism pathway.
AhR and ER are in an inactive cytoplasmic complex with
HSP90, a member of the URI prefoldin complex (Boulon
et al., 2010; Knoblauch and Garabedian, 1999; Perdew, 1988).
Reciprocal coimmunoprecipitation experiments confirmed that
hURI and HSP90 interact with AhR or ER in cytosolic extracts
of 1-week-old mutant livers (Figure 6C). Cytoplasmic fractions
of mutant livers were also enriched with both nuclear receptors
(Figure 6D). Immunofluorescence analysis detected significant
reductions in nuclear AhR and ER in hepatocytes of 1-week-
old mutants (Figures 6E, 6F, and S6G). Finally, nuclear and
cytoplasmic fractionation of livers from 3-week-old DEN-
treated URI(+/+)hep mice showed a positive correlation between
URI expression and cytoplasmic AhR/ER localization, but
an inverse correlation between nuclear URI and AhR/ER. In
DEN-treated URI(+/D)hep livers, AhR and ER were enriched in
the nucleus (Figures S6H and S6I). Thus, hURI/HSP90 inhibitory
cytoplasmic complex prevents AhR and ER transcriptional
activity.
Cancer Cell 26, 1–14, December 8, 2014 ª2014 Elsevier Inc. 9
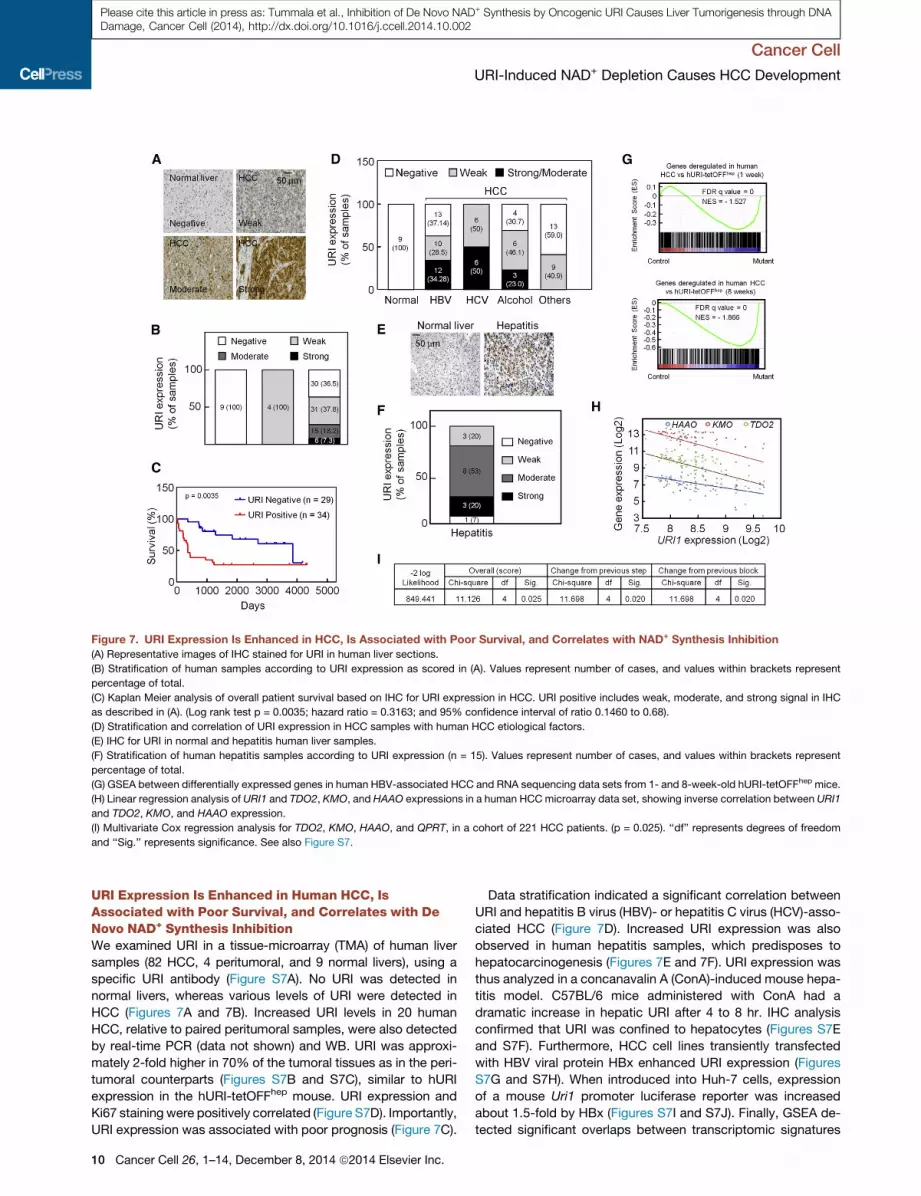
Figure 7. URI Expression Is Enhanced in HCC, Is Associated with Poor Survival, and Correlates with NAD+ Synthesis Inhibition
(A) Representative images of IHC stained for URI in human liver sections.
(B) Stratification of human samples according to URI expression as scored in (A). Values represent number of cases, and values within brackets represent
percentage of total.
(C) Kaplan Meier analysis of overall patient survival based on IHC for URI expression in HCC. URI positive includes weak, moderate, and strong signal in IHC
as described in (A). (Log rank test p = 0.0035; hazard ratio = 0.3163; and 95% confidence interval of ratio 0.1460 to 0.68).
(D) Stratification and correlation of URI expression in HCC samples with human HCC etiological factors.
(E) IHC for URI in normal and hepatitis human liver samples.
(F) Stratification of human hepatitis samples according to URI expression (n = 15). Values represent number of cases, and values within brackets represent
percentage of total.
(G) GSEA between differentially expressed genes in human HBV-associated HCC and RNA sequencing data sets from 1- and 8-week-old hURI-tetOFFhep mice.
(H) Linear regression analysis of URI1 and TDO2, KMO, and HAAO expressions in a human HCCmicroarray data set, showing inverse correlation between URI1
and TDO2, KMO, and HAAO expression.
(I) Multivariate Cox regression analysis for TDO2, KMO, HAAO, and QPRT, in a cohort of 221 HCC patients. (p = 0.025). ‘‘df’’ represents degrees of freedom
and ‘‘Sig.’’ represents significance. See also Figure S7.
Cancer Cell
URI-Induced NAD+ Depletion Causes HCC Development
Please cite this article in press as: Tummala et al., Inhibition of De Novo NAD+ Synthesis by Oncogenic URI Causes Liver Tumorigenesis through DNADamage, Cancer Cell (2014), http://dx.doi.org/10.1016/j.ccell.2014.10.002
URI Expression Is Enhanced in Human HCC, IsAssociated with Poor Survival, and Correlates with DeNovo NAD+ Synthesis InhibitionWe examined URI in a tissue-microarray (TMA) of human liver
samples (82 HCC, 4 peritumoral, and 9 normal livers), using a
specific URI antibody (Figure S7A). No URI was detected in
normal livers, whereas various levels of URI were detected in
HCC (Figures 7A and 7B). Increased URI levels in 20 human
HCC, relative to paired peritumoral samples, were also detected
by real-time PCR (data not shown) and WB. URI was approxi-
mately 2-fold higher in 70% of the tumoral tissues as in the peri-
tumoral counterparts (Figures S7B and S7C), similar to hURI
expression in the hURI-tetOFFhep mouse. URI expression and
Ki67 staining were positively correlated (Figure S7D). Importantly,
URI expression was associated with poor prognosis (Figure 7C).
10 Cancer Cell 26, 1–14, December 8, 2014 ª2014 Elsevier Inc.
Data stratification indicated a significant correlation between
URI and hepatitis B virus (HBV)- or hepatitis C virus (HCV)-asso-
ciated HCC (Figure 7D). Increased URI expression was also
observed in human hepatitis samples, which predisposes to
hepatocarcinogenesis (Figures 7E and 7F). URI expression was
thus analyzed in a concanavalin A (ConA)-induced mouse hepa-
titis model. C57BL/6 mice administered with ConA had a
dramatic increase in hepatic URI after 4 to 8 hr. IHC analysis
confirmed that URI was confined to hepatocytes (Figures S7E
and S7F). Furthermore, HCC cell lines transiently transfected
with HBV viral protein HBx enhanced URI expression (Figures
S7G and S7H). When introduced into Huh-7 cells, expression
of a mouse Uri1 promoter luciferase reporter was increased
about 1.5-fold by HBx (Figures S7I and S7J). Finally, GSEA de-
tected significant overlaps between transcriptomic signatures
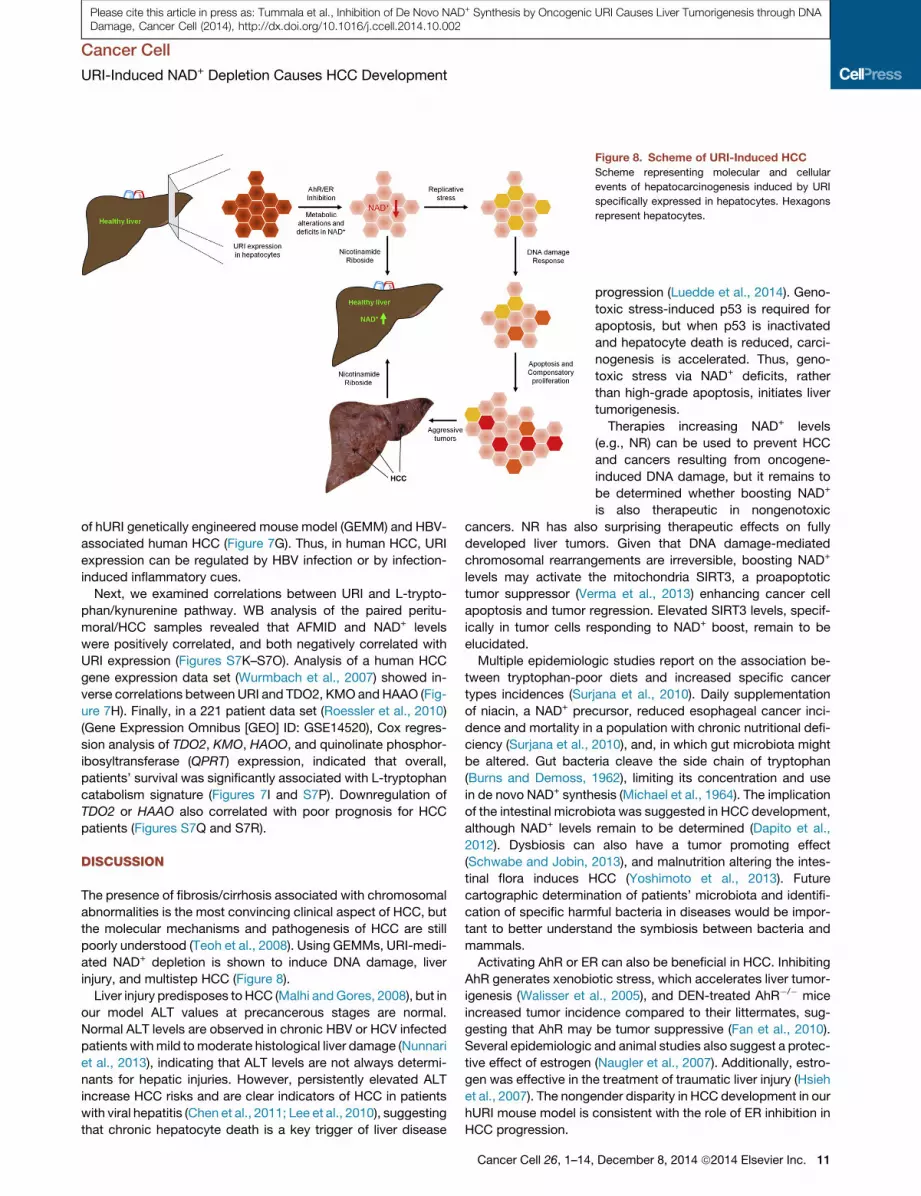
Figure 8. Scheme of URI-Induced HCC
Scheme representing molecular and cellular
events of hepatocarcinogenesis induced by URI
specifically expressed in hepatocytes. Hexagons
represent hepatocytes.
Cancer Cell
URI-Induced NAD+ Depletion Causes HCC Development
Please cite this article in press as: Tummala et al., Inhibition of De Novo NAD+ Synthesis by Oncogenic URI Causes Liver Tumorigenesis through DNADamage, Cancer Cell (2014), http://dx.doi.org/10.1016/j.ccell.2014.10.002
of hURI genetically engineered mouse model (GEMM) and HBV-
associated human HCC (Figure 7G). Thus, in human HCC, URI
expression can be regulated by HBV infection or by infection-
induced inflammatory cues.
Next, we examined correlations between URI and L-trypto-
phan/kynurenine pathway. WB analysis of the paired peritu-
moral/HCC samples revealed that AFMID and NAD+ levels
were positively correlated, and both negatively correlated with
URI expression (Figures S7K–S7O). Analysis of a human HCC
gene expression data set (Wurmbach et al., 2007) showed in-
verse correlations between URI and TDO2, KMOandHAAO (Fig-
ure 7H). Finally, in a 221 patient data set (Roessler et al., 2010)
(Gene Expression Omnibus [GEO] ID: GSE14520), Cox regres-
sion analysis of TDO2, KMO, HAOO, and quinolinate phosphor-
ibosyltransferase (QPRT) expression, indicated that overall,
patients’ survival was significantly associated with L-tryptophan
catabolism signature (Figures 7I and S7P). Downregulation of
TDO2 or HAAO also correlated with poor prognosis for HCC
patients (Figures S7Q and S7R).
DISCUSSION
The presence of fibrosis/cirrhosis associated with chromosomal
abnormalities is the most convincing clinical aspect of HCC, but
the molecular mechanisms and pathogenesis of HCC are still
poorly understood (Teoh et al., 2008). Using GEMMs, URI-medi-
ated NAD+ depletion is shown to induce DNA damage, liver
injury, and multistep HCC (Figure 8).
Liver injury predisposes to HCC (Malhi andGores, 2008), but in
our model ALT values at precancerous stages are normal.
Normal ALT levels are observed in chronic HBV or HCV infected
patients withmild tomoderate histological liver damage (Nunnari
et al., 2013), indicating that ALT levels are not always determi-
nants for hepatic injuries. However, persistently elevated ALT
increase HCC risks and are clear indicators of HCC in patients
with viral hepatitis (Chen et al., 2011; Lee et al., 2010), suggesting
that chronic hepatocyte death is a key trigger of liver disease
Cancer Cell 26, 1–14
progression (Luedde et al., 2014). Geno-
toxic stress-induced p53 is required for
apoptosis, but when p53 is inactivated
and hepatocyte death is reduced, carci-
nogenesis is accelerated. Thus, geno-
toxic stress via NAD+ deficits, rather
than high-grade apoptosis, initiates liver
tumorigenesis.
Therapies increasing NAD+ levels
(e.g., NR) can be used to prevent HCC
and cancers resulting from oncogene-
induced DNA damage, but it remains to
be determined whether boosting NAD+
is also therapeutic in nongenotoxic
cancers. NR has also surprising therapeutic effects on fully
developed liver tumors. Given that DNA damage-mediated
chromosomal rearrangements are irreversible, boosting NAD+
levels may activate the mitochondria SIRT3, a proapoptotic
tumor suppressor (Verma et al., 2013) enhancing cancer cell
apoptosis and tumor regression. Elevated SIRT3 levels, specif-
ically in tumor cells responding to NAD+ boost, remain to be
elucidated.
Multiple epidemiologic studies report on the association be-
tween tryptophan-poor diets and increased specific cancer
types incidences (Surjana et al., 2010). Daily supplementation
of niacin, a NAD+ precursor, reduced esophageal cancer inci-
dence and mortality in a population with chronic nutritional defi-
ciency (Surjana et al., 2010), and, in which gut microbiota might
be altered. Gut bacteria cleave the side chain of tryptophan
(Burns and Demoss, 1962), limiting its concentration and use
in de novo NAD+ synthesis (Michael et al., 1964). The implication
of the intestinal microbiota was suggested in HCC development,
although NAD+ levels remain to be determined (Dapito et al.,
2012). Dysbiosis can also have a tumor promoting effect
(Schwabe and Jobin, 2013), and malnutrition altering the intes-
tinal flora induces HCC (Yoshimoto et al., 2013). Future
cartographic determination of patients’ microbiota and identifi-
cation of specific harmful bacteria in diseases would be impor-
tant to better understand the symbiosis between bacteria and
mammals.
Activating AhR or ER can also be beneficial in HCC. Inhibiting
AhR generates xenobiotic stress, which accelerates liver tumor-
igenesis (Walisser et al., 2005), and DEN-treated AhR�/� mice
increased tumor incidence compared to their littermates, sug-
gesting that AhR may be tumor suppressive (Fan et al., 2010).
Several epidemiologic and animal studies also suggest a protec-
tive effect of estrogen (Naugler et al., 2007). Additionally, estro-
gen was effective in the treatment of traumatic liver injury (Hsieh
et al., 2007). The nongender disparity in HCC development in our
hURI mouse model is consistent with the role of ER inhibition in
HCC progression.
, December 8, 2014 ª2014 Elsevier Inc. 11

Cancer Cell
URI-Induced NAD+ Depletion Causes HCC Development
Please cite this article in press as: Tummala et al., Inhibition of De Novo NAD+ Synthesis by Oncogenic URI Causes Liver Tumorigenesis through DNADamage, Cancer Cell (2014), http://dx.doi.org/10.1016/j.ccell.2014.10.002
URI inhibition may thus represent a therapeutic option at early
stages of liver tumorigenesis, and combined therapies that syn-
ergistically activate AhR and ER should be tested in preclinical
models for HCC treatment, in particular in patients with high
URI expression. Finally, the development of more efficient and
stable NAD+ boosters could provide therapies to prevent or
cure cancers and associated metabolic dysfunctions.
EXPERIMENTAL PROCEDURES
Generation and Handling of Mice
All mice have been backcrossed to C57BL/6 for at least seven generations and
housed in pathogen-free conditions. All experiments were approved by the
Centro Nacional de Investigaciones Oncologicas (CNIO)-Instituto de Salud
Carlos III Ethics Committee and performed in accordance with the guidelines
for ethical conduct in the care and use of animals as stated in the international
guiding principles for biomedical research involving animals, developed by the
Council for International Organizations of Medical Sciences. Littermates were
always used as controls.
Liver Carcinogenesis, Injury Models, and Mouse Treatments
Fourteen-day-old mice were injected intraperitoneally with 25 mg/kg of DEN
(Sigma) (Vesselinovitch and Mihailovich, 1983).
For ConA treatment, 8-week-old C57/BL6 male mice were intravenously in-
jected with 15 mg/kg of ConA (Sigma Aldrich) and sacrificed at 2 hr intervals.
DDC was mixed with chow diet to a final concentration of 0.5% w/w (Harlan)
and supplied as indicated in the experiment.
Ro-61-8048 (Sigma-Aldrich, SML0233) was dissolved to 593 mM in DMSO.
The 9-week-old C57BL/6 mice were given DDC for 4 days and then switched
to chow and injected with either Ro-61-8048/Sunflower Seed Oil (25mg/Kg) or
DMSO/Sunflower Seed Oil (1:100) intraperitoneally for three consecutive days.
Nicotinamide riboside (97% purity, Waterstonetech Pharma) was dissolved
in ice cold water and immediately mixed thoroughly with cold amorphous
chow diet (Harlan) at 500 mg/kg/day and supplied ad-libitum.
Tumor Quantification
Macroscopically visible tumor nodules were counted and sizes measured with
Vernier calipers. Total liver size was measured in the same position, and rela-
tive tumor burden was expressed as percentage of tumor volume relative to
the whole liver.
Human Samples
Human samples were obtained from the histopathology files of University Col-
lege Hospital, University College London (UCL), from patients after approval
by the Institutional Research Ethics Committee (Central London REC 3, Refer-
ence 06/Q0512/106) and from the CNIO-Biobank. The construction and anal-
ysis of a tissue microarray of HCC was approved by the appropriate ethics
committee, and informed consent was obtained from all subjects.
[14C]-Tryptophan Metabolic Tracing
HCC cells were transfected with siCtr or siAFMID grown in a 12 well plate
until they reached 60% confluence and starved for 5 hr for tryptophan
in tryptophan-free media. 2.5 mM of [benzene-ring-U-14C]-tryptophan was
provided to cells and incubated at 37�C for 5 hr. Cells were then washed
three times with cold PBS, and metabolites extracted in a methanol and
water (80:20) mixture and incubated for 10 min at 4�C. Metabolic lysates
were centrifuged at maximum speed for 20 min at 4�C. Radiolabeled sam-
ples were separated by thin layer chromatography (TLC) using ammonium
acetate (1M, pH5) and ethanol (30:70) and cellulose F plates. Labeled
NAD+-[carbonyl-14C] was used as positive control to calibrate the relative
migration of labeled metabolites. TLC plates were dried and exposed to a
PhosphorImager.
Proteomic Analysis
Extracted liver proteins were digested using a modified filter aided sample
prep protocol. Peptides were labeled with iTRAQ reagents and samples
were pooled. The complex mixture was subjected to isoelectric focusing frac-
12 Cancer Cell 26, 1–14, December 8, 2014 ª2014 Elsevier Inc.
tionation. The resulting fractions were separated by on-line nano-liquid chro-
matography and analyzed by electrospray mass spectrometry (MS)/MS using
a linear trap quadrupole Orbitrap Velos mass spectrometer (Thermo Scienti-
fic). Raw files were searched against UniProtKB/Swiss-Prot mouse database
(release date, October 19, 2011; 16,407 entries) using MASCOT (Matrix Sci-
ence, 2013). Peptides were filtered at 1% FDR using a concatenated database
(see also Supplemental Experimental Procedures).
Reporter Assays
Evolutionarily conserved, 440 base pairs regulatory sequence of URI ORF
were cloned in pGL4.10-Luc vector to generate the URI reporter plasmid.
Huh-7 cells were transfected with 200 ng URI reporter and 5 ng Renilla encod-
ing plasmids using Lipofectamine 2000. After 2 days of transfection, cells
were analyzed using the Dual-Luciferase Reporter Assay System (#E1960,
Promega). Values after pCDNA3-GFP or pCDNA3-HA-HBx transfection were
normalized to a Renilla control.
Statistical Analyses
Statistical analyses were performed using GraphPad Prism V5.0 software
(GraphPad Software, 2007). Statistical significance (p) (p % 0.05 = *, p %
0.01 = **, p% 0.001 = ***, and p% 0.0001 = ****) between the means of a min-
imum of three groups was determined using unpaired two-tailed Student’s
t test. Results are expressed as the mean value ± SD or ± SEM as indicated.
All results including WB analysis are representative of at least three indepen-
dent experiments. The Kaplan-Meier method was used to estimate survival
curves for mouse and human, and log rank was used to evaluate statistical dif-
ferences. Statistical parameter (FDR) estimates the probability of a gene set
with false positive finding. Normalized enrichment score allows comparison
of enrichment analysis results across gene sets. Cox regression and survival
analysis were performed for target genes in human HCC data sets, using
SPSS software (v20) (IBM, 2011).
ACCESSION NUMBERS
The proteomic data are deposited to the ProteomeXchange Consortium
(http://proteomecentral.proteomexchange.org) via the PRIDE partner reposi-
tory with the data set identifier PXD000296 (Vizcaino et al., 2013). RNA
sequencing data are available from GEO (http://www.ncbi.nlm.nih.gov/geo)
with the accession number GSE48654.
SUPPLEMENTAL INFORMATION
Supplemental Information includes Supplemental Experimental Procedures,
seven figures, and two tables and can be found with this article online at
http://dx.doi.org/10.1016/j.ccell.2014.10.002.
AUTHOR CONTRIBUTIONS
K.S.T. designed and performed most of the experiments. K.S.T. and N.D. en-
gineered the ColhURI allele and generated the hURI-tetOFFhepmouse. A.L.G.
analyzed fibrosis data. M.Y. and N.D. engineered the URI(lox/lox) allele and
analyzed the URI promoter. O.G. and D.G.P. performed the bioinformatic
analysis. L.B. and E.W. helped in generating the ColhURI allele. I.R. and
P.X.E. performed the iTRAQ experiment. V.S. and M.R.J. analyzed the human
liver samples. K.S.T. and N.D. analyzed all the data. N.D. designed the exper-
iments and conceived, developed, and wrote the project and the manuscript.
Funding was secured by N.D.
ACKNOWLEDGMENTS
We are thankful to F. Real and M. Barbacid for providing the Ela-1-myc and
K-RasG12V pancreatic models, respectively. We thank R. Ricci, M. Serrano,
R. Hamacher, G. Gomes, S. Wurm, F. Diaz, and S. Anderson for support
and advice. K.S.T. is a recipient of La Caixa predoctoral fellowship. A.L.G. is
a recipient of the Caja Navarra postdoctoral fellowship. P.X.E. is a recipient
of the Fondo de Investigaciones Sanitarias grant (CA10/01231). M.R.J. is sup-
ported by UCL Hospitals Biomedical Research Centre. The E.F.W. lab is

Cancer Cell
URI-Induced NAD+ Depletion Causes HCC Development
Please cite this article in press as: Tummala et al., Inhibition of De Novo NAD+ Synthesis by Oncogenic URI Causes Liver Tumorigenesis through DNADamage, Cancer Cell (2014), http://dx.doi.org/10.1016/j.ccell.2014.10.002
supported by F-BBVA, the Spanish Ministry of Economy and Competitiveness
(BFU201240230) and the European Research Council (ERC)-Advanced grant
(ERC-FCK/2008/37). N.D. is a recipient of the Spanish Ramon y Cajal
fellowship. This work was supported by the Spanish Ministry of Economy
and Competitiveness (SAF2010 - 18518), the Association for International
Cancer Research AICR-UK (11-0242), CNIO (BC1104-08), and the European
Foundation for the Study of Diabetes.
Received: March 22, 2014
Revised: July 23, 2014
Accepted: October 2, 2014
Published: November 20, 2014
REFERENCES
Boulon, S., Pradet-Balade, B., Verheggen, C., Molle, D., Boireau, S.,
Georgieva, M., Azzag, K., Robert, M.C., Ahmad, Y., Neel, H., et al. (2010).
HSP90 and its R2TP/Prefoldin-like cochaperone are involved in the cyto-
plasmic assembly of RNA polymerase II. Mol. Cell 39, 912–924.
Burns, R.O., and Demoss, R.D. (1962). Properties of tryptophanase from
Escherichia coli. Biochim. Biophys. Acta. 65, 233–244.
Carpenter, B., Lin, Y., Stoll, S., Raffai, R.L., McCuskey, R., and Wang, R.
(2005). VEGF is crucial for the hepatic vascular development required for lipo-
protein uptake. Development 132, 3293–3303.
Chen, C.F., Lee, W.C., Yang, H.I., Chang, H.C., Jen, C.L., Iloeje, U.H., Su, J.,
Hsiao, C.K., Wang, L.Y., You, S.L., et al. (2011). Changes in serum levels of
HBV DNA and alanine aminotransferase determine risk for hepatocellular car-
cinoma. Gastroenterology 141, 1240–1248, 1248 e1241–1242.
Dapito, D.H., Mencin, A., Gwak, G.Y., Pradere, J.P., Jang,M.K., Mederacke, I.,
Caviglia, J.M., Khiabanian, H., Adeyemi, A., Bataller, R., et al. (2012).
Promotion of hepatocellular carcinoma by the intestinal microbiota and
TLR4. Cancer Cell 21, 504–516.
Djouder, N., Metzler, S.C., Schmidt, A., Wirbelauer, C., Gstaiger, M.,
Aebersold, R., Hess, D., and Krek, W. (2007). S6K1-mediated disassembly
of mitochondrial URI/PP1gamma complexes activates a negative feedback
program that counters S6K1 survival signaling. Mol. Cell 28, 28–40.
Durkacz, B.W., Omidiji, O., Gray, D.A., and Shall, S. (1980). (ADP-ribose)n par-
ticipates in DNA excision repair. Nature 283, 593–596.
El-Serag, H.B. (2011). Hepatocellular carcinoma. N. Engl. J. Med. 365, 1118–
1127.
Fan, Y., Boivin, G.P., Knudsen, E.S., Nebert, D.W., Xia, Y., and Puga, A. (2010).
The aryl hydrocarbon receptor functions as a tumor suppressor of liver carci-
nogenesis. Cancer Res. 70, 212–220.
Herranz, D., Munoz-Martin, M., Canamero,M., Mulero, F., Martinez-Pastor, B.,
Fernandez-Capetillo, O., and Serrano, M. (2010). Sirt1 improves healthy
ageing and protects from metabolic syndrome-associated cancer. Nat.
Commun. 1, 3.
Hsieh, Y.C., Yu, H.P., Frink, M., Suzuki, T., Choudhry, M.A., Schwacha, M.G.,
and Chaudry, I.H. (2007). G protein-coupled receptor 30-dependent protein ki-
nase A pathway is critical in nongenomic effects of estrogen in attenuating liver
injury after trauma-hemorrhage. Am. J. Pathol. 170, 1210–1218.
Ito, A., Lai, C.H., Zhao, X., Saito, S., Hamilton, M.H., Appella, E., and Yao, T.P.
(2001). p300/CBP-mediated p53 acetylation is commonly induced by p53-
activating agents and inhibited by MDM2. EMBO J. 20, 1331–1340.
Kang, J.S., Wanibuchi, H., Morimura, K., Gonzalez, F.J., and Fukushima, S.
(2007). Role of CYP2E1 in diethylnitrosamine-induced hepatocarcinogenesis
in vivo. Cancer Res. 67, 11141–11146.
Knoblauch, R., and Garabedian, M.J. (1999). Role for Hsp90-associated
cochaperone p23 in estrogen receptor signal transduction. Mol. Cell. Biol.
19, 3748–3759.
Konishi, Y., Takahashi, S., Nakae, D., Uchida, K., Tsutsumi, M., Shiraiwa, K.,
and Denda, A. (1986). Possible model of liver carcinogenesis using inhibitors
of NAD+ ADP ribosyl transferase in rats. Toxicol. Pathol. 14, 483–488.
Kudo, M. (2009). Multistep human hepatocarcinogenesis: correlation of imag-
ing with pathology. J. Gastroenterol. 44 (Suppl 19 ), 112–118.
Lee, M.H., Yang, H.I., Lu, S.N., Jen, C.L., Yeh, S.H., Liu, C.J., Chen, P.J., You,
S.L., Wang, L.Y., Chen, W.J., and Chen, C.J. (2010). Hepatitis C virus sero-
markers and subsequent risk of hepatocellular carcinoma: long-term predic-
tors from a community-based cohort study. J. Clin. Oncol. 28, 4587–4593.
Liao, Y.J., Liu, S.P., Lee, C.M., Yen, C.H., Chuang, P.C., Chen, C.Y., Tsai, T.F.,
Huang, S.F., Lee, Y.H., and Chen, Y.M. (2009). Characterization of a glycine
N-methyltransferase gene knockout mouse model for hepatocellular carci-
noma: Implications of the gender disparity in liver cancer susceptibility. Int.
J. Cancer 124, 816–826.
Libbrecht, L., Craninx, M., Nevens, F., Desmet, V., and Roskams, T. (2001).
Predictive value of liver cell dysplasia for development of hepatocellular carci-
noma in patients with non-cirrhotic and cirrhotic chronic viral hepatitis.
Histopathology 39, 66–73.
Luedde, T., Kaplowitz, N., and Schwabe, R.F. (2014). Cell death and cell
death responses in liver disease: Mechanisms and clinical relevance.
Gastroenterology 147, 765, e4.
Luo, J., Nikolaev, A.Y., Imai, S., Chen, D., Su, F., Shiloh, A., Guarente, L., and
Gu, W. (2001). Negative control of p53 by Sir2alpha promotes cell survival
under stress. Cell 107, 137–148.
Malhi, H., and Gores, G.J. (2008). Cellular and molecular mechanisms of liver
injury. Gastroenterology 134, 1641–1654.
Menon, S., Yecies, J.L., Zhang, H.H., Howell, J.J., Nicholatos, J., Harputlugil,
E., Bronson, R.T., Kwiatkowski, D.J., and Manning, B.D. (2012). Chronic acti-
vation of mTOR complex 1 is sufficient to cause hepatocellular carcinoma in
mice. Sci. Signal. 5, ra24.
Michael, A.F., Drummond, K.N., Doeden, D., Anderson, J.A., and Good, R.A.
(1964). Tryptophan metabolism in man. J. Clin. Invest. 43, 1730–1746.
Murga, M., Campaner, S., Lopez-Contreras, A.J., Toledo, L.I., Soria, R.,
Montana, M.F., D’Artista, L., Schleker, T., Guerra, C., Garcia, E., et al.
(2011). Exploiting oncogene-induced replicative stress for the selective killing
of Myc-driven tumors. Nat. Struct. Mol. Biol. 18, 1331–1335.
Naugler, W.E., Sakurai, T., Kim, S., Maeda, S., Kim, K., Elsharkawy, A.M., and
Karin, M. (2007). Gender disparity in liver cancer due to sex differences in
MyD88-dependent IL-6 production. Science 317, 121–124.
Nunnari, G., Pinzone, M.R., and Cacopardo, B. (2013). Lack of clinical
and histological progression of chronic hepatitis C in individuals with true
persistently normal ALT: the result of a 17-year follow-up. J. Viral Hepat.
20, e131–e137.
Perdew, G.H. (1988). Association of the Ah receptor with the 90-kDa heat
shock protein. J. Biol. Chem. 263, 13802–13805.
Pilati, C., Letouze, E., Nault, J.C., Imbeaud, S., Boulai, A., Calderaro, J.,
Poussin, K., Franconi, A., Couchy, G., Morcrette, G., et al. (2014). Genomic
profiling of hepatocellular adenomas reveals recurrent FRK-activating
mutations and the mechanisms of malignant transformation. Cancer Cell 25,
428–441.
Rajamohan, S.B., Pillai, V.B., Gupta, M., Sundaresan, N.R., Birukov, K.G.,
Samant, S., Hottiger, M.O., and Gupta, M.P. (2009). SIRT1 promotes cell
survival under stress by deacetylation-dependent deactivation of poly(ADP-
ribose) polymerase 1. Mol. Cell. Biol. 29, 4116–4129.
Reinhardt, H.C., and Schumacher, B. (2012). The p53 network: cellular and
systemic DNA damage responses in aging and cancer. Trends Genet. 28,
128–136.
Roessler, S., Jia, H.L., Budhu, A., Forgues, M., Ye, Q.H., Lee, J.S.,
Thorgeirsson, S.S., Sun, Z., Tang, Z.Y., Qin, L.X., and Wang, X.W. (2010).
A unique metastasis gene signature enables prediction of tumor relapse
in early-stage hepatocellular carcinoma patients. Cancer Res. 70, 10202–
10212.
Schuler, M., Dierich, A., Chambon, P., andMetzger, D. (2004). Efficient tempo-
rally controlled targeted somatic mutagenesis in hepatocytes of the mouse.
Genesis 39, 167–172.
Schwabe, R.F., and Jobin, C. (2013). The microbiome and cancer. Nature
Reviews 13, 800–812.
Subramanian, A., Tamayo, P., Mootha, V.K., Mukherjee, S., Ebert, B.L.,
Gillette, M.A., Paulovich, A., Pomeroy, S.L., Golub, T.R., Lander, E.S., and
Cancer Cell 26, 1–14, December 8, 2014 ª2014 Elsevier Inc. 13

Cancer Cell
URI-Induced NAD+ Depletion Causes HCC Development
Please cite this article in press as: Tummala et al., Inhibition of De Novo NAD+ Synthesis by Oncogenic URI Causes Liver Tumorigenesis through DNADamage, Cancer Cell (2014), http://dx.doi.org/10.1016/j.ccell.2014.10.002
Mesirov, J.P. (2005). Gene set enrichment analysis: a knowledge-based
approach for interpreting genome-wide expression profiles. Proc. Natl.
Acad. Sci. USA 102, 15545–15550.
Surjana, D., Halliday, G.M., and Damian, D.L. (2010). Role of nicotinamide
in DNA damage, mutagenesis, and DNA repair. J. Nucleic Acids 2010,
2010.
Teoh, N.C., Dan, Y.Y., Swisshelm, K., Lehman, S., Wright, J.H., Haque, J., Gu,
Y., and Fausto, N. (2008). Defective DNA strand break repair causes chromo-
somal instability and accelerates liver carcinogenesis in mice. Hepatology 47,
2078–2088.
Theurillat, J.P., Metzler, S.C., Henzi, N., Djouder, N., Helbling, M.,
Zimmermann, A.K., Jacob, F., Soltermann, A., Caduff, R., Heinzelmann-
Schwarz, V., et al. (2011). URI is an oncogene amplified in ovarian cancer cells
and is required for their survival. Cancer Cell 19, 317–332.
Trinidad, A.G., Muller, P.A., Cuellar, J., Klejnot, M., Nobis, M., Valpuesta, J.M.,
and Vousden, K.H. (2013). Interaction of p53 with the CCT complex promotes
protein folding and wild-type p53 activity. Mol. Cell 50, 805–817.
Verma, M., Shulga, N., and Pastorino, J.G. (2013). Sirtuin-3 modulates Bak-
and Bax-dependent apoptosis. J. Cell Sci. 126, 274–288.
Vesselinovitch, S.D., and Mihailovich, N. (1983). Kinetics of diethylnitrosamine
hepatocarcinogenesis in the infant mouse. Cancer Res. 43, 4253–4259.
14 Cancer Cell 26, 1–14, December 8, 2014 ª2014 Elsevier Inc.
Vizcaino, J.A., Cote, R.G., Csordas, A., Dianes, J.A., Fabregat, A., Foster, J.M.,
Griss, J., Alpi, E., Birim, M., Contell, J., et al. (2013). The PRoteomics
IDEntifications (PRIDE) database and associated tools: status in 2013.
Nucleic Acids Res. 41, D1063–D1069.
Walisser, J.A., Glover, E., Pande, K., Liss, A.L., and Bradfield, C.A. (2005). Aryl
hydrocarbon receptor-dependent liver development and hepatotoxicity are
mediated by different cell types. Proc. Natl. Acad. Sci. USA 102, 17858–17863.
WHO. (2008). Tumours of the liver and intrahepatic bile ducts. In Pathology
and Genetics of Tumors of the Digestive System, S.R. Hamilton and L.A.
Aaltonen, eds. (IARC Press). http://www.iarc.fr/en/publications/pdfs-online/
pat-gen/bb2/BB2.pdf.
Wurmbach, E., Chen, Y.B., Khitrov, G., Zhang, W., Roayaie, S., Schwartz, M.,
Fiel, I., Thung, S., Mazzaferro, V., Bruix, J., et al. (2007). Genome-wide
molecular profiles of HCV-induced dysplasia and hepatocellular carcinoma.
Hepatology 45, 938–947.
Yoshimoto, S., Loo, T.M., Atarashi, K., Kanda, H., Sato, S., Oyadomari, S.,
Iwakura, Y., Oshima, K., Morita, H., Hattori, M., et al. (2013). Obesity-induced
gut microbial metabolite promotes liver cancer through senescence secre-
tome. Nature 499, 97–101.

Cancer Cell, Volume 26
Supplemental Information
Inhibition of De Novo NAD+ Synthesis
by Oncogenic URI Causes Liver
Tumorigenesis through DNA Damage
Krishna S. Tummala, Ana L. Gomes, Mahmut Yilmaz, Osvaldo Graña, Latifa Bakiri, Isabel Ruppen, Pilar Ximénez-Embún, Vinayata Sheshappanavar, Manuel Rodriguez-Justo, David G. Pisano, Erwin F. Wagner, and Nabil Djouder

1
SUPPLEMENTAL DATA

2

3

4
Figure S1, related to Figure 1. URI Expression in Mouse Hepatocytes Induces
Spontaneous Liver Tumors

5
(A) Scheme of knock-in strategy of hURI in the Col1a1 locus. Red line depicts 3’ probe
used.
(B) Southern blot analysis using 3’probe showing correct targeting of hURI in the Col1a1
locus.
(C) Schematic representation of the model hURI-tetOFFhep mouse in which URI expression
is under the control of the hepatocyte-specific LAP promoter.
(D) Quantification of hURI mRNA expression in different organs derived from hURI-
tetOFFhep mice. Denote hepatic specificity of the model. (n ≥ 5).
(E) WB analysis of hURI expression in different organs derived from hURI-tetOFFhep mice.
(F) WB analysis of hURI and endogenous URI (mURI) expression in livers from control and
mutant hURI-tetOFFhep mice.
(G) Quantification of (F).
(H) Hematoxylin stained liver sections in 12-week-old mutant hURI-tetOFFhep mice. Image
displays characteristics of human Large Liver Cell Dysplasia (LLCD) like lesions. Insets
show nuclear pseudo inclusions, large pleomorphic nuclei and hepatocytes with binucleus
and prominent nucleoli. (n ≥ 5).
(I) Table showing disease progression with age in mutant hURI-tetOFFhep mice, and
resembling the human pathological state.
(J) Representative images of Sirius Red (with/without green color), Masson Trichrome, alpha
smooth muscle actinACTA2), collagen, type 1 (COL1A1) and Reticulin stained livers
showing the fibrotic area in 8-, 12- and 24-week-old hURI-tetOFFhep mice. (n ≥ 5).
(K) Quantification of Sirius Red positive area in 8-, 12-, 24-, 32- and 54-week-old hURI-
tetOFFhep mice. (n ≥ 5).

6
(L-N) qRT-PCR analysis of (Acta2) (L), collagen, type1, alpha 1 (Col1a1) (M) and tissue
inhibitor of metalloproteinase 1 (Mmp1) (N) transcripts expressed in livers of mice at 8, 12
and 24 weeks of age. -Actin was used as housekeeping gene. (n ≥ 5).
(O) Serum alanine aminotransferase (ALT) from 8-, 12- and 24-week-old hURI-tetOFFhep
mice.
(P) Tumor burden defined as tumor size relative to the total liver size and total number of
tumors per liver in hURI-tetOFFhep mutant mice. (n = 12).
(Q) Quantification of ALT, albumin, bile acids and glucose in serum from 65-week-old
hURI-tetOFFhep mice. (n ≥ 5).
(R) Representative images of lungs from hURI-tetOFFhep mice at 75 weeks of age. Yellow
arrows depict lung metastasis. Insets show H&E images with macro metastatic nodules in
mutant lungs (dotted yellow circles). Lower images represent immunohostochemistry (IHC)
for hURI in lung tissues. Hepatocyte-like cells are positively stained for hURI.
(S) Percentage of mice presenting lung metastasis in control and mutant hURI-tetOFFhep
mice. (n ≥ 5).
(T) Scheme of DEN treatment in control and mutant hURI-tetOFFhep mice. Right panel
depicts WB analysis in hURI-tetOFFhep mice treated with the carcinogen DEN. Bottom left
panel represents pictures of full livers and H&E stained sections from hURI-tetOFFhep mice
treated with DEN. Dotted yellow circle denotes liver tumor. Dotted black line in the mutant
H&E picture denotes border between HCC and peritumoral (PT) tissue. Bottom right panel
represents histogram of tumor incidence observed in hURI-tetOFFhep mice treated with DEN.
(n ≥ 5).
(U) WB analysis for hURI in livers derived from 12-week-old hURI-tetOFFhep mice. Right
histogram represents hURI quantification. Bottom left panel represents pictures of full livers
7
and H&E stained sections from hURI-tetOFFhep mice at 10 weeks of age. Dotted black line in
the mutant H&E picture denotes border between HCC and peritumoral (PT) tissue. Bottom
right histogram depicts tumor incidence in hURI-tetOFFhep mice of 10 weeks of age. (n ≥ 5).
(V) Schematic representation of the doxycycline treatment used in hURI-tetOFFhep mice as to
take advantage of the switch-ability system. Mice were kept in doxycycline (Dox) diet until 8
weeks of age (+ doxycycline (hURI-)). From 8 weeks on, mice were fed chow diet for hURI
expression in adult stage (- doxycycline (hURI+)) and sacrificed for analysis from 70 weeks
of age. Top right panel represents pictures of hURI IHC from 9-week-old hURI-tetOFFhep
liver sections. (n ≥ 5). Bottom left panel represents pictures of full livers and H&E stained
liver sections from hURI-tetOFFhep mice. Red arrows in mutant H&E picture denote tumoral
and necrotic areas. Bottom right panel represents tumor incidence of mice. (n ≥ 5).
Data represented as mean ± SD. (p ≤ 0.05 = *, p ≤ 0.01 = ** and p ≤ 0.001 = ***).
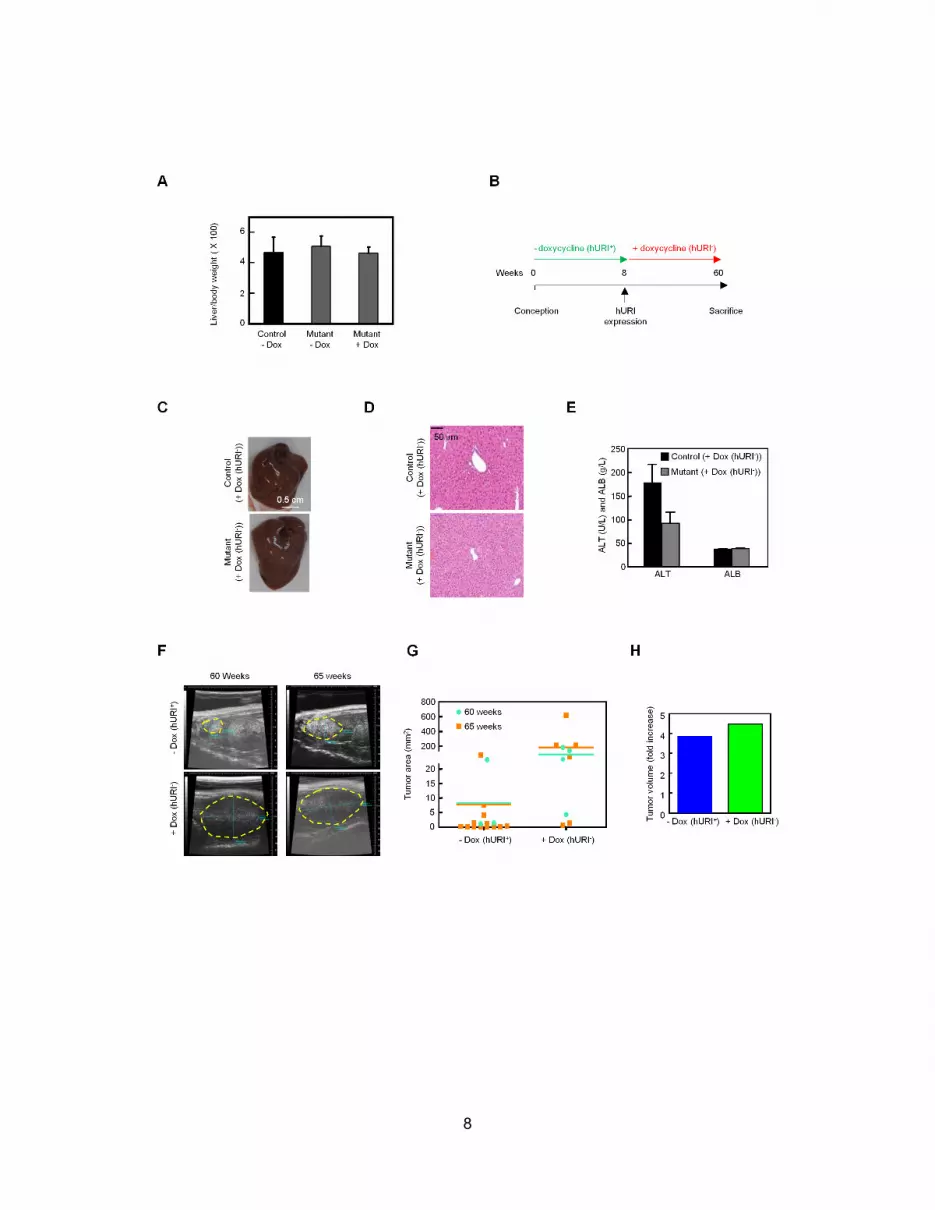
8
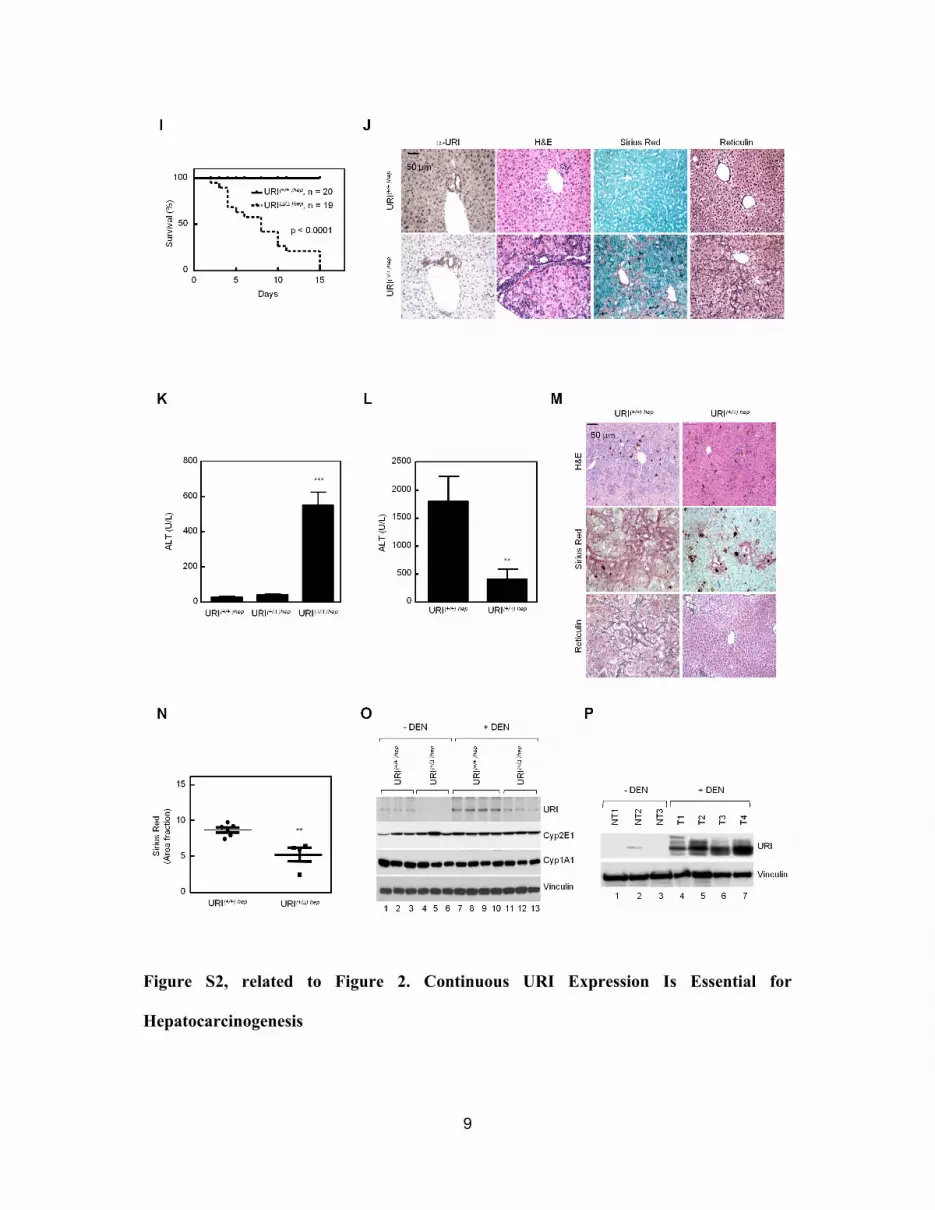
9
Figure S2, related to Figure 2. Continuous URI Expression Is Essential for
Hepatocarcinogenesis

10
(A) Liver to body weight ratio of hURI-tetOFFhep mice treated with doxycycline for 24
weeks. Treatment started at 8 weeks of age, after the appearance of anisokaryotic
hepatocytes. (n ≥ 5). Error bars represent ± SD.
(B) Schematic representation of the long term doxycycline treatment of hURI-tetOFFhep
mice. Treatment started at 8 weeks of age, after the appearance of anisokaryotic hepatocytes
and mice were sacrificed at 60 weeks of age.
(C and D) Representative images of full livers (C) and H&E stained liver sections (D) from
hURI-tetOFFhep mice described in (B).
(E) Serum ALT and Albumin levels of the mice described in (B). Error bars represent ± SD.
(F) Representative images of ultrasound analysis of 60-week-old hURI-tetOFFhep mutants fed
with normal or doxycycline diet for the following 5 weeks (65 weeks). Yellow dotted circles
represent the tumoral area.
(G) Tumor area in 60 week-old hURI-tetOFFhep mutants described in (F). Each dots represent
individual tumors. (n ≥ 5).
(H) Fold increase in total tumor area of mice described in (F). (n ≥ 5).
(I) Kaplan Meier curve of URI(+/+)hep (n = 20) and URI(hep (n = 19) mice .
(J) Representative images of IHC for endogenous URI, H&E, Sirius Red and Reticulin
stained liver sections from URI(+/+)hep and URI(+hep mice. (n ≥ 5).
(K) Quantification of ALT in serum from URI(+/+)hep, URI(+hep and URI(hep mice. (n ≥
5). Error bars represent ± SEM.
(L) Quantification of ALT in serum from URI(+/+)hep and URI(+hep mice treated with DDC
for 1 month. (n ≥ 5). Error bars represent ± SEM.

11
(M) Representative images of Sirius Red and Reticulin stained liver sections from URI(+/+)hep
and URI(+hep mice treated with DDC for 1 month. (n ≥ 5).
(N) Quantification of fibrotic area. Denote decreased fibrotic area with reduction of URI
protein levels. (n ≥ 5). Error bars represent ± SEM.
(O) WB analysis of livers from 3 week-old URI(+/+)hep, URI(+hep mice treated with/without
DEN.
(P) WB analysis for URI in liver tumors from C57Bl/6 mice treated with the carcinogen
DEN. (n = 3 without DEN and n = 4 with DEN).
Data represented as mean ± SEM or ± SD, as indicated. (p ≤ 0.01 = **, p ≤ 0.001 = *** and p
≤ 0.0001 = ****).

12

13
Figure S3, related to Figure 3. URI-Induced DNA Damage Initiates Liver
Tumorigenesis
(A) WB liver analysis of 1 week hURI-tetOFFhep mice.
(B) Representative images of Ki67 stained liver sections of 3-week-old hURI-tetOFFhep mice.
(n ≥ 5).
(C) Quantification of (B). Error bars represent ± SEM.
(D) WB liver analysis of 8-week-old hURI-tetOFFhep mice.
(E) Representative images of -gal stained liver sections in 12-week-old hURI-tetOFFhep
mice. (n ≥ 5).
(F) qRT-PCR analysis of pro-apoptotic p53 upregulated modulator of apoptosis (Bbc3) and
Bcl-2-associated X protein (Bax) and anti-apoptotic X-linked inhibitor of apoptosis protein
(Xiap) transcripts expressed in livers from 8-week-old hURI-tetOFFhep mice. -Actin was
used as housekeeping gene. (n ≥ 5). Error bars represent ± SD.
(G) Representative images of reticulin stained liver sections in 8- and 12-week-old hURI-
tetOFFhep mice. (n ≥ 5).
(H) Quantification of Ki67 positive nuclei in the liver, detected by IHC in 8- and 12-week-old
hURI-tetOFFhep mice. (n ≥ 5). Error bars represent ± SEM.
Data represented as mean ± SEM or ± SD, as indicated. (p ≤ 0.01 = ** and p ≤ 0.001 = ***).

14
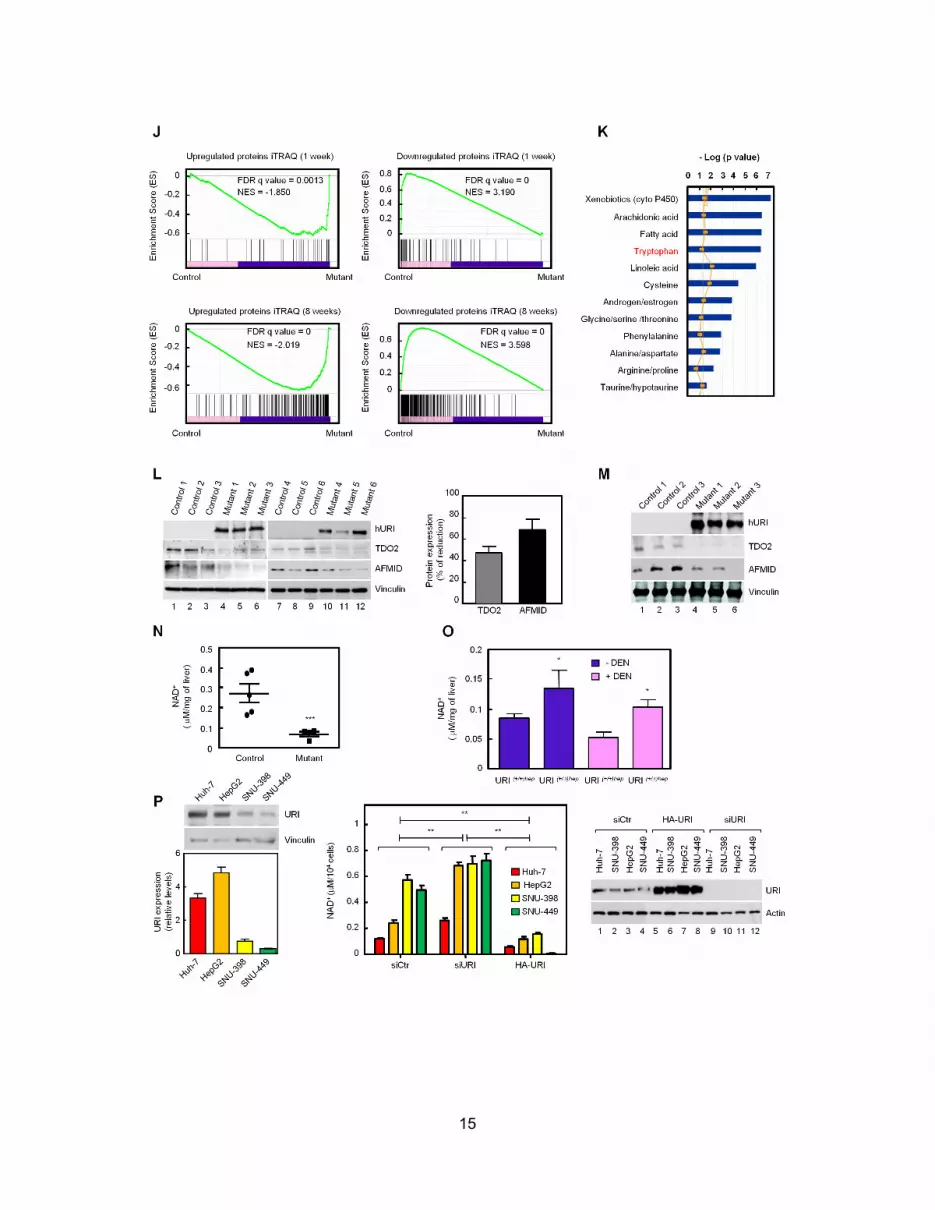
15
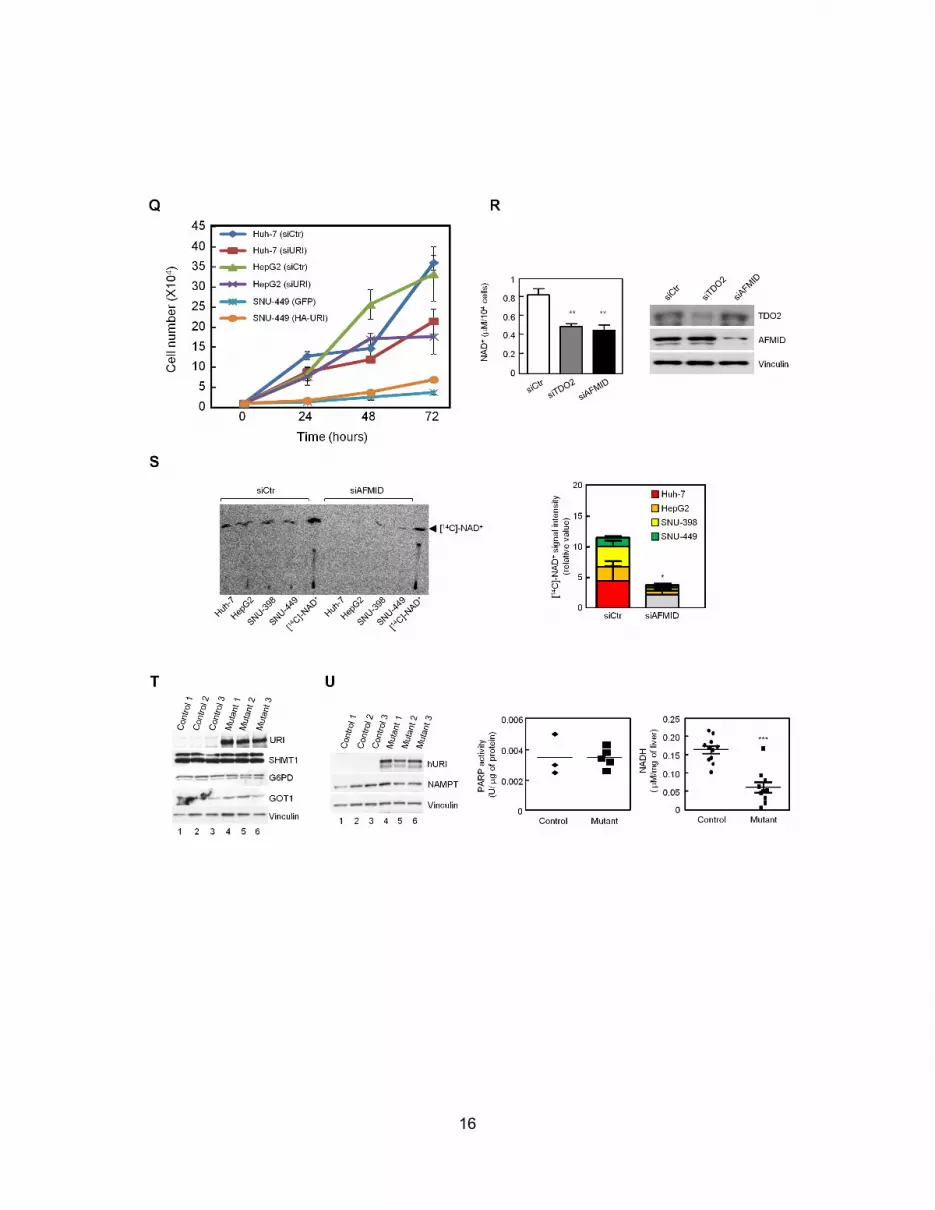
16

17

18
Figure S4, related to Figure 4. URI Causes DNA Damage and Liver Tumorigenesis by
Inhibiting De Novo NAD+ Synthesis
(A) WB analysis of livers derived from 1-week-old control and mutant hURI-tetOFFhep mice.
(B) Sequential immunoprecipitation (I.P) of PP1 in livers from 1 week hURI-tetOFFhep
mice.
(C) WB analysis of inputs before the first I.P and output after the last I.P performed in (B).
Denote the presence of hURI after complete depletion of PP1 (samples 11, 12).
(D) Quantification of reactive oxygen species (ROS) in 1-week-old hURI-tetOFFhep livers. (n
≥ 4). Error bars represent ± SEM.
(E) Quantification of reactive oxygen species (ROS) in 8-week-old hURI-tetOFFhep livers. (n
≥ 4). Error bars represent ± SEM.
(F) Scatter plots representing liver transcripts from 1 and 8 weeks hURI-tetOFFhep mice.
(G) Dot plots of differentially expressed liver proteins analyzed in iTRAQ of 1- and 8-week-
old hURI-tetOFFhep mice.
(H) Heatmaps of downregulated (green) and upregulated (red) liver proteins analyzed in
iTRAQ of 1- and 8-week-old hURI-tetOFFhep mice.
(I) Scatter plots of differentially expressed transcripts and proteins from 1 and 8 weeks RNA
sequencing and iTRAQ data. iTRAQ data set was plotted on x-axis as log (fold change) and
RNA sequencing data set was plotted on y-axis.
(J) GSEA between upregulated and downregulated proteins analyzed in iTRAQ and
upregulated transcripts analyzed in RNA sequencing in livers from 1- and 8-week-old hURI-
tetOFFhep mice.
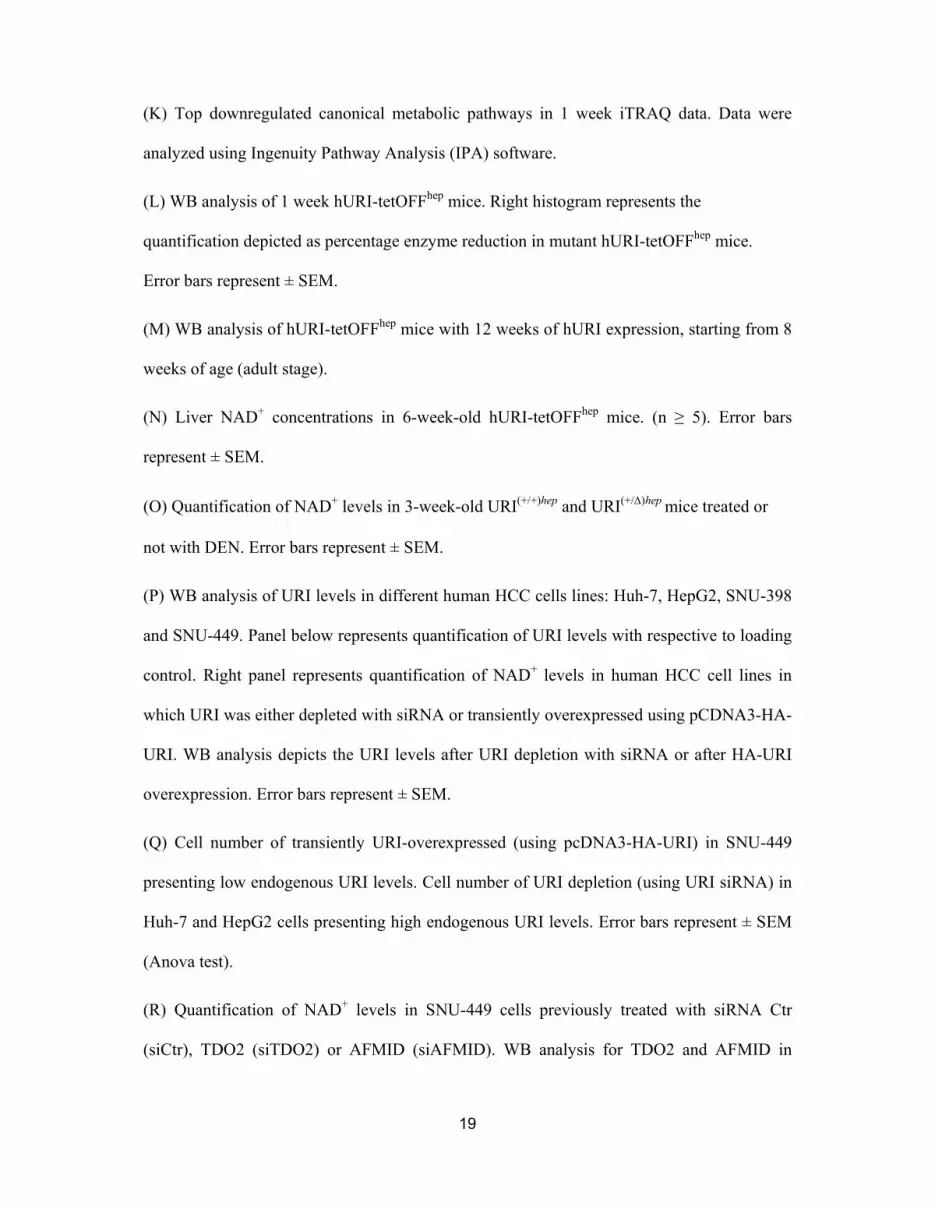
19
(K) Top downregulated canonical metabolic pathways in 1 week iTRAQ data. Data were
analyzed using Ingenuity Pathway Analysis (IPA) software.
(L) WB analysis of 1 week hURI-tetOFFhep mice. Right histogram represents the
quantification depicted as percentage enzyme reduction in mutant hURI-tetOFFhep mice.
Error bars represent ± SEM.
(M) WB analysis of hURI-tetOFFhep mice with 12 weeks of hURI expression, starting from 8
weeks of age (adult stage).
(N) Liver NAD+ concentrations in 6-week-old hURI-tetOFFhep mice. (n ≥ 5). Error bars
represent ± SEM.
(O) Quantification of NAD+ levels in 3-week-old URI(+/+)hep and URI(+hep mice treated or
not with DEN. Error bars represent ± SEM.
(P) WB analysis of URI levels in different human HCC cells lines: Huh-7, HepG2, SNU-398
and SNU-449. Panel below represents quantification of URI levels with respective to loading
control. Right panel represents quantification of NAD+ levels in human HCC cell lines in
which URI was either depleted with siRNA or transiently overexpressed using pCDNA3-HA-
URI. WB analysis depicts the URI levels after URI depletion with siRNA or after HA-URI
overexpression. Error bars represent ± SEM.
(Q) Cell number of transiently URI-overexpressed (using pcDNA3-HA-URI) in SNU-449
presenting low endogenous URI levels. Cell number of URI depletion (using URI siRNA) in
Huh-7 and HepG2 cells presenting high endogenous URI levels. Error bars represent ± SEM
(Anova test).
(R) Quantification of NAD+ levels in SNU-449 cells previously treated with siRNA Ctr
(siCtr), TDO2 (siTDO2) or AFMID (siAFMID). WB analysis for TDO2 and AFMID in
20
SNU-449 cells previously treated with siCtr, siTDO2 or siAFMID. Error bars represent ±
SEM.
(S) Thin Layer Chromatography (TLC) of [14C]-Tryptophan incorporation into [14C]-NAD+.
Right panel represents quantification of [14C]-NAD+ signal over several TLC experiments. (n
≥ 5). Error bars represent ± SEM.
(T) WB of enzymes from other pathways predicted to be downregulated in IPA in 1-week-old
hURI-tetOFFhep livers.
(U) WB of NAMPT (NAD+ salvage pathway) enzyme in 1-week-old hURI-tetOFFhep liver
extracts. Right panels represent quantification of PARP activity and liver NADH levels in 1
week hURI-tetOFFhep mice. Error bars represent ± SEM.
(V) DDC followed by DMSO (1 %) or Ro-61-8048 (25 mg/kg) treatment in C57BL/6 mice.
(W) Representative images of Ki67-stained liver sections from C57Bl/6 mice treated
with/without DDC-containing diet and its quantification (n ≥ 5). Error bars represent ± SEM.
(X) WB analysis of TDO2 and AFMID downregulation in AML-12 cells using three different
shRNA. Separate pools of puromycin-selected AML-12 cells depleted for TDO2 and AFMID
were generated and finally mixed in order to have one pool of three AML-12 cell pools for
TDO2 downregulation (AML-12-shTDO2) and one pool of three AML-12 cells for AFMID
downregulation (AML-12-shAFMID). AML-12-shTDO2 and AML-12-shAFMID pooled
cells were injected subcutaneously into the left and right flanks of 5-week-old female athymic
nude mice. Histograms represent percentage of tumors implanted and tumor volume (mm3)
after 5 months. H&E Pictures are representative of anaplastic lesions and lung metastases.
(shCtr n = 5; shTDO2 n = 14; shAFMID; n = 13). Error bars represent ± SEM.

21
(Y) WB analysis of whole SNU-449 cell extracts treated for 48 hr with Sirt1 inhibitor (EX-
527; 10 M), Sirt1 activator (Resveratrol; 10 M) or PARP inhibitor (10 M; Olaparib) with
or without transient URI overexpression using pCDNA3-HA-URI.
(Z) Quantification of PARP activity and WB liver analysis of the NAMPT levels in 3-week-
old hURI-tetOFFhep mice. Error bars represent ± SEM.
Data represented as mean ± SEM or ± SD, as indicated. (p ≤ 0.05 = *, p ≤ 0.01 = ** and p ≤
0.001 = ***).

22
Table S1, related to Figure 4. iTRAQ Data, provided as an Excel File.
Table S2, related to Figure 4. Dehydrogenases Significantly Downregulated in iTRAQ
Datasets
Protein symbol Fold change* Protein symbol Fold change*Ldhb 0.5 Hsd3b5 0.05
Hasd17b6 0.53 Hsd17b6 0.35Hsd17b11 0.64 Gldc 0.39
G6pd 0.7 Dhtkd1 0.42Aldh16a1 0.53Hsd3b2 0.54Aspdh 0.55
Hsd17b2 0.57Gcdh 0.57Hpgd 0.57Rdh7 0.58Idh2 0.59Ldhd 0.6
Ndufv3 0.61Aldhli1 0.61Hibadh 0.62
Hsdll1b1 0.62Sardh 0.62
Ivd 0.66Prodh 0.66Pdk2 0.66
Acadsb 0.66Aldh6a1 0.66
Dhdh 0.67Ndufa12 0.68L2hgdh 0.68Sdhc 0.7Idh1 0.71
*Fold change represents the protein expression in mutant samples relative to the controls in iTRAQ analysis

23
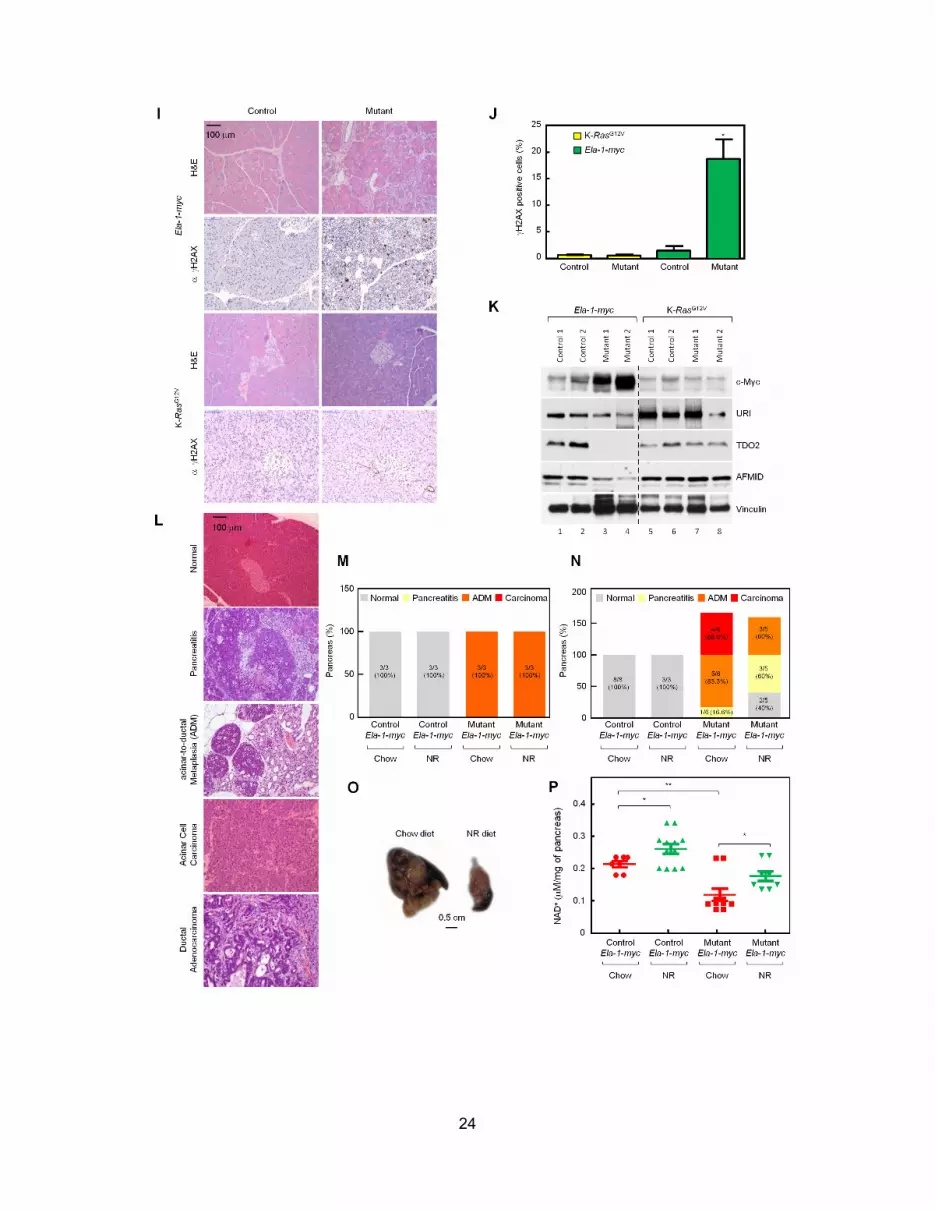
24
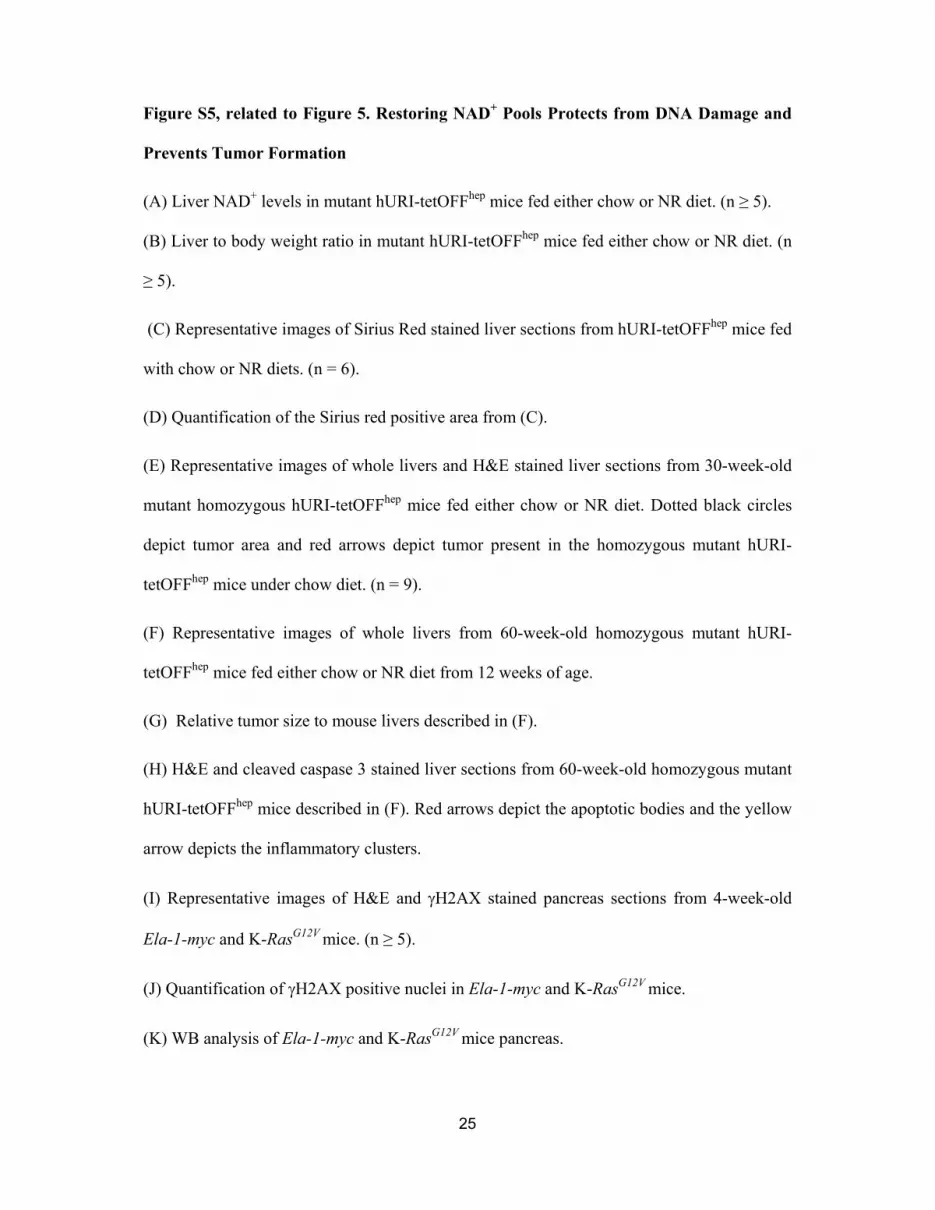
25
Figure S5, related to Figure 5. Restoring NAD+ Pools Protects from DNA Damage and
Prevents Tumor Formation
(A) Liver NAD+ levels in mutant hURI-tetOFFhep mice fed either chow or NR diet. (n ≥ 5).
(B) Liver to body weight ratio in mutant hURI-tetOFFhep mice fed either chow or NR diet. (n
≥ 5).
(C) Representative images of Sirius Red stained liver sections from hURI-tetOFFhep mice fed
with chow or NR diets. (n = 6).
(D) Quantification of the Sirius red positive area from (C).
(E) Representative images of whole livers and H&E stained liver sections from 30-week-old
mutant homozygous hURI-tetOFFhep mice fed either chow or NR diet. Dotted black circles
depict tumor area and red arrows depict tumor present in the homozygous mutant hURI-
tetOFFhep mice under chow diet. (n = 9).
(F) Representative images of whole livers from 60-week-old homozygous mutant hURI-
tetOFFhep mice fed either chow or NR diet from 12 weeks of age.
(G) Relative tumor size to mouse livers described in (F).
(H) H&E and cleaved caspase 3 stained liver sections from 60-week-old homozygous mutant
hURI-tetOFFhep mice described in (F). Red arrows depict the apoptotic bodies and the yellow
arrow depicts the inflammatory clusters.
(I) Representative images of H&E and H2AX stained pancreas sections from 4-week-old
Ela-1-myc and K-RasG12V mice. (n ≥ 5).
(J) Quantification of H2AX positive nuclei in Ela-1-myc and K-RasG12V mice.
(K) WB analysis of Ela-1-myc and K-RasG12V mice pancreas.

26
(L) H&E representative images of normal, acinar-to-ductal metaplasia (ADM), acinar cell
carcinomas and ductal adenocarcinomas from 15-week-old Ela-1-myc mice.
(M) Percentage of normal pancreas or pancreas with pancreatitis and ADM in 7-week-old
mice under chow or NR diet for 4 weeks, starting from 3 weeks of age. (n = 3)
(N) Percentage of normal pancreas or pancreas with pancreatitis, ADM and carcinomas in 15-
week-old mice under chow or NR diets for 12 weeks, starting from 3 weeks of age (n ≥ 3).
(O) Representative images of pancreas from 15-week-old mutants Ela-1-myc supplemented
with either chow or NR diets for 12 weeks, starting from 3 weeks of age.
(P) Pancreatic NAD+ levels in 15-week-old Ela-1-myc mice fed either chow or NR diet for 12
weeks. (n ≥ 7).
Data represented as mean ± SEM. (p ≤ 0.05 = * and p ≤ 0.01 = **)
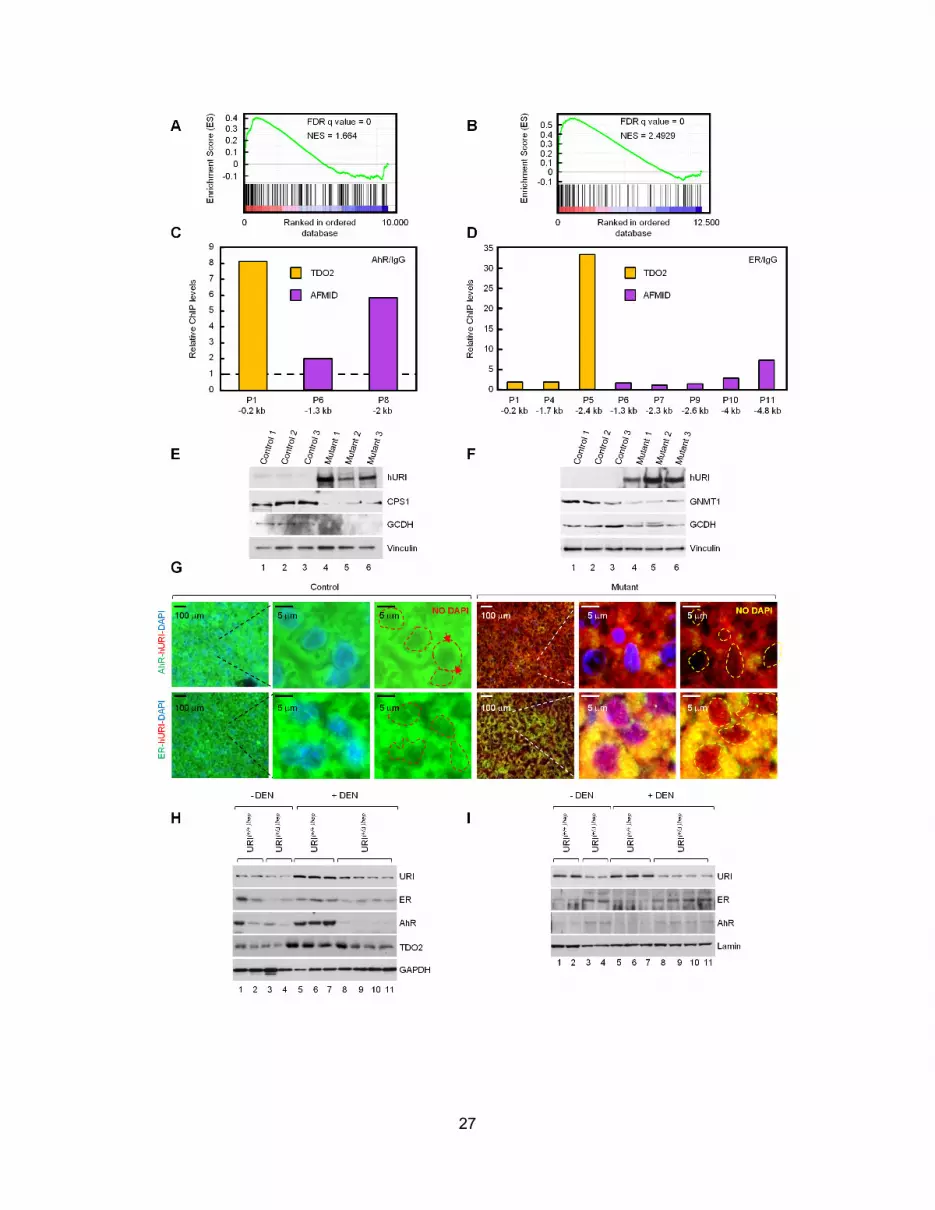
27
28
Figure S6, related to Figure 6. URI Regulates Kynurenine Metabolism by Modulating
AhR and ER Activity
(A and B) GSEA analysis between liver gene arrays of Ahr-/- (A) and Esr-/- (B) mice and liver
RNA sequencing data from 8-week-old hURI-tetOFFhep mice.
(C and D) ChIP assays showing association of AhR (C) and ER (D) with promoters of TDO2
and AFMID in SNU-449 cells. Semi-quantitative PCR of the intragenic region of
chromosome 3 was used for normalization.
(E and F) WB analysis of 1- (E) and 8- (F) week-old hURI-tetOFFhep mice.
(G) Co-immunofluorescence of AhR or ER and hURI in 1-week-old hURI-tetOFFhep mice.
DAPI was used for nuclear staining. Dotted red circles represent colocalization between AhR
or ER and hURI while dotted yellow circles represent the decrease in colocalization between
AhR or ER and hURI.
(H and I) WB analysis of cytosolic (H) and nuclear (I) fractions from 3-week-old URI(+/+)hep
and URI(+hep mice treated or not with DEN. Immunoblots was performed with the indicated
antibodies.

29

30

31
Figure S7, related to Figure 7. URI Expression Is Enhanced in Human HCC, Is
Associated with Poor Survival and Correlates with De Novo NAD+ Synthesis Inhibition
(A) Characterization of URI mouse monoclonal antibody by WB and IHC. Endogenous URI
was knock-downed in HEK-293T and in HeLa cells using siRNA against URI mRNA. IHC
using URI antibody in HEK-293T cells previously depleted for URI.
(B) WB analysis for URI expression in paired peritumoral (PT) and tumoral (T) liver samples
derived from human patients.
(C) Quantification of (B). Denote increased URI levels in tumoral (T) compared to the paired
peritumoral (PT) samples. (p = 0.0086)
(D) Stratification of human HCC liver samples according to Ki67 levels (less aggressive
(Ki67 < 10%) and more aggressive (Ki67 > 10%)) in tumors with weak, moderate or high
URI expression.
(E) WB analysis of URI expression in Concanavalin A (ConA) treated C57BL/6 mouse livers
at different time points (0, 2, 4 and 8 hr).
(F) IHC analysis of URI expression in ConA treated C57BL/6 mouse liver tissues at different
time points (0, 2, 4 and 8 hr).
(G and H) WB analysis for URI expression in Huh-7 (G) and HepG2 (H) cells transiently
transfected with either pCDNA3-GFP or pCDNA3-HA-HBx.
(I) Scheme representing URI promoter cloned in frame with the luciferase reporter.
(J) Luminescence ratio of luciferase reporter and background renilla in Huh-7 cells that were
co-transfected with either the reporter plasmid and with pCDNA3 or with the reporter
plasmid and with different concentrations of pCDNA3-HA-HBx. Right panel represents the
relative URI luciferase reporter activity after transfecting 16 ng of pCDNA3-HA-HBx.

32
(K) WB analysis of paired peritumoral (PT) and tumoral (T) liver samples from human
patients.
(L) Pearson correlation analysis between URI and AFMID protein levels in peritumoral (PT)
and tumoral (T) human liver sample. Denote a significant inverse correlation between URI
and AFMID levels. (p = 0.0047)
(M) Quantification of liver NAD+ levels in the peritumoral (PT) and tumoral (T) paired
samples used in (B). (n ≥ 5).
(N) Pearson correlation analysis between URI protein and NAD+ levels in peritumoral (PT)
and tumoral (T) human liver samples. (p = 0.0136)
(O) Pearson correlation analysis of AFMID protein and NAD+ levels in peritumoral (PT) and
tumoral (T) human liver samples. (p = 0.0173)
(P) Linear regression analysis of URI1 and HAAO, KMO, TDO2 and QPRT expressions in a
human HCC microarray dataset, showing inverse correlation between URI1 and HAAO,
KMO, TDO2 and QPRT expression.
(Q and R) Kaplan Meier curve analysis of human HCC patients based on gene expression of
TDO2 (Q) and HAAO (R). “df” represents degrees of freedom and “Sig.” represents
significance.
Data represented as mean ± SEM.

33
SUPPLEMENTAL EXPERIMENTAL PROCEDURES
Generation and Handling of Mice
hURI knock-in mouse model (ColhURI) has been generated by flippase-mediated targeting
and recombination of inducible human URI (hURI) cDNA tagged with the Flag peptide in the
3’ untranslated region of the homing locus of the collagen type I, alpha 1 locus (Col1a1)
Cola1 gene in KH2 embryonic stem cells (ESCs), having a tetracycline operator (Tet-op). In
order to express hURI specifically in hepatocytes, ColhURI mouse has been crossed with a
line containing the tetracycline-dependent transactivator (tTA) under the control of the liver
activated protein (LAP) promoter to generate LAP-tTA/hURItetOFF mouse, named hURI-
tetOFFhep mouse (Kistner et al., 1996). Hepatocyte-specific ectopic hURI expression can be
switched off by administration of doxycycline. hURI is expressed since conception and mice
were off doxycycline, unless otherwise stated. The URI conditional knockout mouse with uri
floxed allele was generated by homologous recombination in embryonic stem (ES) cells (URI
lox). In this allele, the exon 4 of uri was flanked by two LoxP sites. In addition, a neomycin
resistance gene (Neo) flanked by two FRT sites was inserted before the second LoxP site for
drug selection and was removed by expressing Flp recombinase. Expression of Cre
recombinase deletes the targeted exon 4 and generates a delta allele (URI, leading of
inactivation of the URI gene. The germ line transmission of the founder mouse generated
through an intercross between the chimeras and the Flp-deleter strain in order to remove the
neomycin cassette was checked by Southern blot (5’ and 3’ arms were checked) and PCR
analysis. Deletion of one allele by Cre recombinase in heterozygous ES cells was verified by
reduced URI expression via WB analysis. Homozygous (lox/lox) and heterozygous (+/lox)
mice carrying the URI lox allele were viable, fertile, and exhibited no overt abnormalities.
Crossing URI (+/lox) heterozygous mice with a Mox-Cre line, to deplete URI ubiquitously,
generated viable URI (+/) mice (homozygotes obtained from intercrosses were non-

34
viable). p53 inactivation in the hURI-tetOFFhep mouse was performed by crossing hURI-
tetOFFhep mice with p53ERTAM mice, in which p53 activation requires ectopic 4-
hydroxytamoxifen provision (Christophorou et al., 2005).
Food (Harlan Laboratories) and water were provided ad libitum. Same experiments have
been performed by sacrifying mice at the same time and same lobes were used for the same
experiment.
Mouse Treatments
Food containing either doxycycline for LAP-tTA inhibition or tamoxifen for CreERT2-
mediated recombination was prepared by Harlan Laboratories and mice were dietary fed.
Mice were supplied with tamoxifen-containing diet for 2 weeks and then transferred to chow
diet. For DEN-treated mice, tamoxifen was previously administered at 1 week of age by
intraperitoneally injection (1 mg per dose; 1 dose/day for 2 days) and DEN injection was
applied at 2 weeks of age.
Rapamycin (Sirolimus) was purchased from TOKU-E biosciences (R001) and stored at 4 oC.
Rapamycin diet was prepared by Harlan laboratories to a final concentration of 14 mg/kg of
food. Mice were fed 2.24 mg/kg of body weight per day (Menon et al., 2012).
Ultrasound Imaging
Animals were anesthetized with Isofluorane (Isovet, Braun Vetcare) (4 % during anesthetic
induction and 2 % as maintenance level) and livers were scanned (Vevo 770, 40 Mhz
frequency) for structural alterations, including echogenicity variations, by using the probe
RMV707b (Visualsonics, Canada). The frame rate used is in the range of 60 Hz and 11X11
mm FOV (field of view). The biggest and lowest diameters were chosen for all liver
structural anomalies.

35
Antibodies
Antibodies recognizing hURI and mURI have been described previously (Djouder et al.,
2007). Ki67 (1:1) and Cyclin D1 (1:1000) were purchased from Dako. MAD2 (1:250),
PCNA (1:1000), ACTA2 (1:1000) and p65 (1:1000) were purchased from Santa Cruz.
Phospho-S6K1 (Thr389) (1:1000), BAX (1:1000), phospho-p53 (Ser18) (1:500), p53 (1:500),
acetyl-p53 (Lys379) (1:500), cleaved caspase3 (1:500), phospho-Chk1 (Ser345) (1:500),
Lamin (1:1000) and HSP90 (1:1000) were from Cell Signaling Technology. Phospho-H2AX
(Ser139) (1:1000) was purchased from Merck Millipore. Phospho-Chk2 (Thr68) (1:500),
Chk1 (1:500), Chk2 (1:500), Cyp2E1 (1:2000) and Cyp1A1 (1:2000) were purchased from
Upstate (Millipore). S6K1 (1:1000), c-Myc (1:200) and GAPDH (1:2000) were from Abcam.
Flag antibody (1:1000) was from Agilent. p21 (1:1000) was from BD-Pharmingen. Vinculin
(1:1000) was purchased from Sigma. TDO2 (1:1000), AFMID (1:500), GCDH (1:500), CPS1
(1:1000), GNMT1 (1:1000) and NAMPT (1:1000) were purchased from Proteintech. AhR
(1:1000) was from Enzo life sciences and ER (1:1000) was from Bethyl laboratories. AFP
(1:500) was from R&D systems. HA (1:1000) was obtained from Covance.
Cell Culture, siRNA, shRNA, Plasmids and Xenografts Studies
HEK-293T, HeLa, HepG2, Huh-7, SNU-398 and SNU-449 were grown in complete DMEM
medium (Lifetechnologies) supplemented with 10 % fetal calf serum and 100 units/ml
penicillin and 0.1 mg/ml streptomycin purchased from Gibco. Non tumorigenic alpha mouse
liver (AML)-12 cells were grown in DMEM/F12 supplemented with 10 % fetal calf serum,
100 units/ml penicillin and 0.1 mg/ml streptomycin, 0.005 mg/ml insulin, 0.005 mg/ml
transferrin, 5 ng/ml selenium, and 40 ng/ml dexamethasone purchased from Gibco (Wu et
al., 1994). Plasmid transfections were performed using FUGENE 6 following the
manufacturer instructions. siRNA transfections were performed using Lipofectamin
36
RNAiMAX following the manufacturer’s instructions. pCDNA3-HA-HBx purchased from
Addgene was used (http://www.addgene.org/24930/). Cell number, size and diameter were
measured in triplicates at the indicated times using CASY® cell counter.
Knockdown experiments were performed using ON-TARGET plus SMART pool siRNA
targeting human AhR, ER, TDO2, AFMID and URI as well as control siRNA purchased
from Dharmacon.. Three different murine TDO2 and AFMID MISSION shRNA Lentiviral
Transduction Particles (pLKO-puro-shRNA system) were purchased from Sigma Aldrich.
AML-12 cells were infected according to the manufacturer instructions. Separate pools of
puromycin-selected AML-12 cells depleted for TDO2 and AFMID were generated (levels of
depletion were checked by WB) and finally mixed in order to have one pool of three AML-12
cell pools for TDO2 downregulation (AML-12-shTdo2) and one pool of three AML-12 cells
for AFMID downregulation (AML-12-shAfmid). AML-12 cells harvested from culture were
resuspended in PBS at a concentration of 5.106 cells/0.1 ml and were injected subcutaneously
into the left and right flanks of 5-week-old female athymic nude mice purchased from Harlan
laboratories. Tumor volume was monitored over 5 months. The following hairpins shRNA
sequences were used: sh1Tdo2
(CCGGCCAAAGATGAATCCGATCATTCTCGAGAATGATCGGATTCATCTTTGGTTT
TTG); sh2Tdo2
(CCGGGCTGGAAAGAACACCTGGTTTCTCGAGAAACCAGGTGTTCTTTCCAGCTT
TTTG); sh3Tdo2
(CCGGGCGCAAGAACTTCAGAGTGAACTCGAGTTCACTCTGAAGTTCTTGCGCTT
TTTG). Sh1Afmid
(CCGGGTTGGGAACTTCGTGCAGATACTCGAGTATCTGCACGAAGTTCCCAACTT
TTTG); sh2Afmid
(CCGGCCCTGGAAGATGCTCAGAGAACTCGAGTTCTCTGAGCATCTTCCAGGGTT

37
TTTG); sh3Afmid
(CCGGCCGGCAGTCCAAGGAGTTCTACTCGAGTAGAACTCCTTGGACTGCCGGTT
TTTG).
Cytoplasmic Fractionation
For cytoplasmic extracts, livers were homogenized with the cytoplasmic buffer (10 mM
Hepes pH 7.4, 3 mM MgCl2, 40 mM KCl, 5 % Glycerol, 0.5% NP-40, 2 mM DTT)
supplemented with protease inhibitors. Pellets were incubated on ice 5 min and centrifuged
for 5min at 1500 rpm at 4°C. The supernatant fractions correspond to the cytoplasmic
fractions. Protein concentrations of the fractions were determined using Bradford assay
(BioRad) and equal amounts of each fraction were subjected for SDS-PAGE and blotted to
nitrocellulose membranes for Western blotting with the indicated proteins.
Immunoblotting and Immunoprecipitation
For immunoblotting, liquid N2 snap frozen liver tissues were used to prepare lysates. 50 to
100 mg of tissues were lysed using RIPA lysis buffer containing 10 mM Tris pH 7.5, 100
mM NaCl, 1 mM EDTA, 1 mM EGTA, 1 mM NaF, 20 mM Na4P2O7, 2 mM Na3VO4, 0.1%
SDS, 0.5 % sodium deoxycholate, 1 % Triton-X 100, 10 % glycerol and supplemented with
10 mg/ml proteases inhibitor aprotinin and 1 mM PMSF followed by homogenization using
Precellys 24 Bead Mill homogenizer (Bertin Technologies) (15 x 2 s, power set to 5500 w)
and then clarified by centrifugation at 4 ºC and 10.000 g for 10 min. Protein concentration
was measured by using Bio-Rad Bradford reagent (Bio-Rad) and bovin serum albumin (BSA)
as standard protein. 1 mg/ml concentrated lysates were made by boiling the appropriate
amount of protein lysates with 2X laemmli buffer (4 % SDS, 20 % glycerol, 10 % -
mercaptoethanol, 0.004 % bromophenol blue in 0.2 M Tris-HCL of pH 7) at 70 ºC, for 10

38
min. 10-30 g of protein lysates were subjected into SDS-PAGE gels, and transferred to
nitrocellulose membranes. The membranes were blocked with 5 % nonfat milk in Tris-
buffered saline containing 1 % Tween 20 for 1h at room temperature. Blots were immune-
stained with indicated antibodies. Immunoblots were processed by ECL (Amersham)
according to the manufacturer's instructions.
For immunoprecipitation, samples and assays were performed as described previously
(Djouder et al., 2007).
Chromatin Immunoprecipitation (ChIP)
For Chromatin Immunoprecipitation (ChIP) assay, 6.107 SNU-449 cells were cross-linked for
10 min at RT in 1 % formaldehyde. Cross-linking reactions were stopped by adding 1.25 M
glycine to a final concentration of 125 mM. Cells were centrifuged for 10 min at 4 0C and
then washed in cold PBS. Cells were lysed with 1 ml of lysis buffer-1 (50 mM HEPES-KOH,
pH 7.5, 140 mM NaCl, 1 mM EDTA, 10 % glycerol, 0.5 % NP-40, 0.25 % Triton X-100, 1 X
protease inhibitor) followed by centrifugation at 4 0C and resuspension of the pellet in lysis
buffer-2 (10 mM Tris-HCl, pH 8.0, 200 mM NaCl, 1 mM EDTA, 0.5 mM EGTA, 1 X
protease inhibitors. Finally the pellets were resuspended in 1 mL of lysis buffer-3 (10 mM
Tris-HCl, pH8.0, 100 mM NaCl, 1 mM EDTA, 0.5 mM N-lauroylsarcosine, 1 X protease
inhibitors), and 100 l of 10 % Triton X-100 were added and sonicated for 20 min in a
Covaris sonicator. The soluble fraction was quantified with Bradford, and 400 g was used to
immunoprecipitate the transcription factors and IgG’s used as a control. Chromatin and
antibody mixtures were incubated overnight at 4 0C in total volume of 500 l.
Immunoprecipitated mixture was washed with a low salt buffer (20 mM Tris-HCl, pH 8.0,
150 mM Nacl, 2 mM EDTA, 0.1 % SDS and 1 % Triton X-100), followed by high salt buffer
(20 mM Tris-HCl, pH 8.0, 500 mM NaCl, 2 mM EDTA, 0.1% SDS and 1 % Triton X-100)

39
and finally with LiCl wash buffer (10 mM Tris-HCl, pH 8.0, 250 mM LiCl, 1 mM EDTA, 1
% Na-Deoxycholate and 1 % NP-40). Samples were decross-linked by resuspending the
beads in 210 l of elution buffer (50 mM Tris-HCl, pH 8.0, 10 mM EDTA and 1 % SDS),
incubating at 65 0C for 15 min and treating with 2.5 ul (from 32 mg/mL) of RNAse A for 2
hr. Next, 4 l of (20 mg/ml of stock) of Proteinase K was added and incubated at 55 0C for 2
hr. DNA was extracted by phenol/chloroform/isoamylalcohol mixtures, washed with 80 %
EtOH and resuspended in 200 l of TE buffer. This was followed by quantitative real-time
PCR. The specific primers used are listed below.
P1-TDO2-F (AGGAGACTACACTACTGGGAGAAG); P1-TDO2-R-
(CTTGTTTGCTAGCAGGGCGT); P4-TDO2-F (TTGTCTATGGGCAGGGTGAT); P4-
TDO2-R (GCCTGGTGCGAAAAACGAG); P5-TDO2-F
(CTCCTGTAAGGACCTACCTAGC); P5-TDO2-R (ACCAAACTCCTCTGGCGTATC);
P6-AFMID-F (CTAGAGGCTAGCAGCAGTGTG); P6-AFMID-
R (CTTCCAGATCGCCCAGTACA); P7-AFMID-F (CAGGCACAGTTGGATCTCT); P7-
AFMID-R (AGAGGACAGCCTCGGGTTAT); P8-AFMID-F
(GCGGGTGTATGGTTACCTGT); P8-AFMID-R (ATGCCCGAGTGTTGTGTTGT); P9-
AFMID-F (GCCTCAGTAAATGGGTTGAGAGA); P9-AFMID-R
(CTGCACGCTACTTGCTTGTC); P10-AFMID-F (CACTGAGGCCAAGGCTAGAG);
P10-AFMID-R (AGGAACACCATGGACGCATT); P11-AFMID-F
(TAAAAGCAGCCCAATGCGGG); P11-AFMID-R (GTCGACCTCTGACCTCCACAT)
Chr3-intron-F (CTTGGCCCTTCCTCTCCTAA); Chr3-intron-R
(TGCAGTGGTCAGAAGATGTGT)
Immunohistochemistry and Immunofluorescence
40
Freshly harvested murine livers were fixed immediately in 10 % buffered formalin solution
overnight and embedded in paraffin. Sections of 3 m were deparafinized, rehydrated and
antigen retrieved by using 1 M sodium citrate buffer (pH 6.5). After blocking endogenous
peroxidase using 3 % H2O2 (in methanol) for 5 min, sections were then blocked with 1:200
goat serum 5 % BSA/PBST for 1h at RT. Furthermore, sections were incubated with primary
antibodies overnight at 4 ºC, after which Vectastain ABC kit (Vector Laboratories, Inc) was
used, following manufacturer’s instructions. Sections were then incubated with 33-
diaminobenzidinetetracloride (DBA) and counterstained with hematoxylin. In the case of
immunofluorescence, sections were incubated with PE-conjugated secondary antibodies
(1:500) for 1 hr at RT, followed by DAPI staining. Quantification was performed either by
counting the number of positive cells in a minimum of six 10X or 20X microscopic fields, or
the percentage of positive area using Color Deconvolution plug-in in Image J.
Reactive Oxygen Species (ROS), NAD+ and PARP Activity Determination
Reactive oxygen species (ROS) using the commercial kit OxiSelect™ Intracellular ROS
(Green Fluorescence) purchased from Cell Biolabs.
NAD+ levels were determined using a commercial kit (Enzychrom, BioAssays Systems, CA),
as previously described (Canto et al., 2012). NAD+/NADH assay kit is based on a lactate
dehydrogenase cycling reaction, in which the formed NADH reduces a formazan (MTT)
reagent.
PARP activity was measured from the liver lysates using TRIVIGEN colorimetric assay
(4677-096-K). In brief, fresh livers were lysed in PARP buffer, and 10 g of the protein from
the supernatant was used. 96 well plate coated with histones were rehydrated and the sample
mixtures were prepared using 10 l of protein lysate, 15 l of water and 25 l of PARP
cocktail (biotinylated NAD+). Additionally, protein standards were also added to the wells by

41
diluting 25 l standards and 25 l PARP cocktail. After washing with PBS and 0.1 % Triton
X-100 followed by 2 washes of PBS, diluted strep-HRP was added and incubated for 60 min.
Finally, color was developed by adding TACS-Sapphire colorimetric substrate and reading
the absorbance at 450 nm.
Genotyping and qRT-PCR
For genotyping tail DNA was extracted by overnight incubation of tails with the following
buffer (1 % SDS, 0.1 M NaCl, 0.1 M EDTA and 0.05 M Tris (pH 8)). Extracted DNA was
precipitated using ice-cold isopropanol which was further washed with 70% ethanol. The
DNA pellet was further dried and resuspended in 400 l of water. 1 l of DNA was used for
genotyping. For the ColhURI locus the following primers were used: P1-F:
GCACAGCATTGCGGACATGC; P2-R: CCCTCCATGTGTGACCAAGG; P3-R:
GCAGAAGCGCGGCCGTCTGG. For the LaptTA transactivator locus the following primers
were used: P1-F: TCTGAGCATGGCCTCTAA; P2-R: GCTGGAGTAAATTTCACAGTG;
P3-R: TCTCACTCGGAAGGACAT.
For qRT-PCR, total RNA was extracted from 20-50 mg snap frozen liver tissue, using Trizol
(Sigma). First strand cDNA synthesis was performed by using Ready-to-go first strand beads
(GE Healthcare). qRT-PCR was performed using an ABI PRISM 7700 (Life Technologies),
and GoTaq Real-Time qPCR mix (Promega). Fold changes have been determined by using 2-
CT (Livak and Schmittgen, 2001) and normalized to -actin. Finally, the fold changes were
obtained by converting the logarithmic scale to an exponential scale (2^CT). The
following primers were used Actin-F: CACAGCTGAGAGGGAAATCG. Actin-R:
AGTTTCATGGATGCCACAGG. Timp1-F: AGGTGGTCTCGTTGATTCGT. Timp1-R
GTAAGGCCTGTAGCTGTGCCActa2-F: CAATGGCTCTGGGCTCTGTA. Acta2-R:
42
TCATCCCCCACATAGCTGTC. Col1a1-F: AGGGCCAGGGGGTCCAGCATTTC.
Col1a1-R: GGTGCCCCCGGTCTTCAG. Bax-F: GTGAGCGGCTGCTTGTCT. Bax-R:
GGTCCCGAAGTAGGAGAGGA. Xiap-F: GAGGCAGGAAGCTAACGTTTT. Xiap-R:
GCAGCTCGTCTGAGATCAATG. Bbc3-F: CTGTATCCTGCAGCCTTTGC Bbc3-R:
ACGGGCGACTCTAAGTGCT.
RNA Extraction and Sequencing
For RNA extraction, 20 livers (5 per group) were individually extracted. RNA Integrity
Numbers were 8.3 on average (range 7.5 to 9.2) when assayed by Lab-chip technology on a
2100 Bioanalyzer (Agilent). Sequencing libraries were prepared as in "TruSeq RNA Sample
Preparation Guide" (Part # 15008136 Rev. A) with final PCR amplification limited to 10
cycles. The resulting purified cDNA libraries were sequenced on a Genome Analyzer IIx,
following manufacturer's protocols. Samples were analyzed in different paired end
sequencing runs. In order to balance read length and adjust base calling quality within
conditions, reads from 8-week samples were trimmed to 50 bases. Likewise, reads from 1-
week samples were adjusted to 78 bases. Reads were aligned to the mouse genome
(NCBI37/mm9) with Tophat (Trapnell et al., 2012) version 1.3.1 (including Bowtie 0.12.7
(Langmead et al., 2009) and Samtools version 0.1.16 (Li et al., 2009) ) allowing a maximum
of 2 mismatches and 5 multihits for each read. The RNA fragment length was 230bp on
average. Transcripts were assembled and their abundances estimated with Cufflinks version
1.0.3 (Trapnell et al., 2012). After that, we performed a differential expression analysis with
Cuffdiff 1.0.3.
iTRAQ

43
For protein extraction, 20 mouse livers (5 per group) were individually processed. Lysis
solution (4 % SDS, 10 mM DTT, 100 mM HEPES, pH 7.6) including 0.1 % Benzonase
Nuclease (Novagen) plus a cocktail of protease inhibitors was added to small pieces of tissue
(1 mg tissue: 20 µL buffer). Samples were homogenized in a Precellys 24 Bead Mill
Homogenizer (Bertin Technologies) (15 x 2 s, power set to 5500 w) and then clarified by
centrifugation at 4 ºC and 16000 rpm for 15 min. Recovered supernatants were cleaned-up by
methanol-chloroform extraction (Kline et al., 2008) and pellets were dissolved in 7 M urea 2
M tiourea 0.1 M TEAB by sonication and vortexing. The protein concentration of the
samples was determined according to the Bradford assay using BSA as standard (Protein
Assay Kit, Bio-Rad). Samples for each group were prepared by pooling an equal amount of
protein from each individual.
Protein Digestion and Labelling with iTRAQ Reagents
Samples were digested using the filter aided sample preparation (FASP) method (Wisniewski
et al., 2009) with some modifications. Briefly, 100 ug of each sample dissolved in 7M urea 2
M tiourea was loaded on the filter, reduced with 10 mM DTT for 1 h at 37 ºC and alkylated
using 50 mM iodoacetamide for 20 min in the dark. The excess of reduction and alkylation
reagents was washed. The proteins were digested overnight at RT using endoproteinase Lys-
C from Acromobacter lyticus M497-1 (Wako Pure Chemical Industries) with 1:50 enzyme to
protein ratio. Finally, trypsin (Promega) was added and samples were subjected to a second
digestion for 6 h. Each tryptic digest was labeled according to the manufacturer's instructions
(ABSciex) with one isobaric amine-reactive tag as follows: liver peptides from 1 week
control mice were tagged with Tag114. Tag115 was used for 8 week control mice. Tag116
was used for 8 week mutant mice and Tag117 for 1 week mutant mice. After 1 h incubation,
labeled samples were pooled, and evaporated to dryness in a vacuum centrifuge. The iTRAQ

44
sample was cleaned up using a Sep-Pak C18 cartridge for SPE (Waters Corp) (Ernoult et al.,
2008). Eluted peptides were vacuum-dried and reconstituted in OFFGEL solution (5 %
glycerol, 1 % ampholytes pH 3-10) prior to electrofocusing.
OFFGEL Fractionation
For pI-based peptide separation, we used the 3100 OFFGEL Fractionator system (Agilent
Technologies) with a 24-well set-up. The IPG gel strips of 24 cm-long (GE Healthcare) with
a 3–10 linear pH range were rehydrated for 15 min with the Peptide IPG Strip Rehydratation
Solution according to the protocol of the manufacturer. Subsequently, 150 μL of sample was
loaded in each well. Electrofocusing of the peptides was performed at 20 °C and 50 μA until
the 50 kVh level was reached. After focusing, the 24 peptide fractions were withdrawn and
the wells rinsed with 100 μL of a solution of 0.1%TFA. Rinsing solutions were pooled with
their corresponding peptide fraction. All fractions were evaporated by centrifugation under
vacuum. Solid phase extraction and salt removal was performed with home–made columns
based on Stage Tips with C8 Empore Disks (3M) (Rappsilber et al., 2003) filled with Poros
Oligo R3 resin (Life Technologies). Eluates were evaporated to dryness and maintained at 4
°C. Just prior nano-LC, the fractions were resuspended in 0.1 % formic acid (FA).
Peptide Analysis by NanoLC-MS/MS
Digested samples were separated by on-line reversed-phase nanoscale capillary LC and
analyzed by electrospray MS/MS. The experiments were performed on an Eksigent nano LC
system (Eksigent technologies) coupled to an LTQ Orbitrap Velos mass spectrometer
(Thermo Scientific) equipped with a nanoelectrospray ion source (Proxeon Biosystems).
Peptides were loaded from a cooled nanoLC AS-2 autosampler (Eksigent). In order to pre-
concentrate and desalt the samples before switching the pre-column in line with the

45
separation column, 5 μL from each sample was loaded onto a reversed-phase ReproSil Pur
C18-Aq 5 µm 0.3 x 10 mm trapping cartridge (SGE Analytical, Victoria, Australia), and
washed for 10 min at 2.5 μL/min with loading buffer (0.1% FA). The peptides were eluted
from a RP ReproSil Pur C18-AQ 3 µm 200 x 0.075 mm (Dr. Maisch GmbH) by application
of a binary gradient consisting of 2 % ACN in 0.1 % FA (buffer A) and 100 % ACN in 0.1 %
FA (buffer B), with a flow rate of 300 nL/min. Peptides were separated using the following
gradient: 0-5 min 2 % B, 5-150 min 60 % B and 150-165 min 98 % B. The column was
operated at a constant temperature of 30 ºC. The LTQ Orbitrap Velos was operated in
positive ionization mode. The MS survey scan was performed in the FT analyzer scanning a
window between 250 and 1750 m/z. The resolution was set to 60 000 FWHM at m/z 400. The
m/z values triggering MS/MS with a repeat count of 1 were put on an exclusion list for 60 s.
The minimum MS signal for triggering MS/MS was set to 1000 counts. In all cases, one
microscan was recorded. The lock mass option was enabled for both MS and MS/MS mode
and the polydimethylcyclosiloxane ions (PDMS, protonated (Si(CH3)2O))6; m/z 445.120025)
were used for internal recalibration of the mass spectra (Olsen et al., 2005). For the HCD, up
to the 15 most abundant isotope patterns with charge ≥ 2 from the survey scan were selected
with an isolation window of 2 m/z fragmented in the C-trap collision cell. Normalized
collision energy was set to 42 %, the Q value to 0.25 and an activation time to 0.10 ms.
Waveform filter was activated. The resulting fragments were detected in the Orbitrap system
with a resolution of 7500 FWHM at m/z 400. The maximum ion injection times for the
survey scan and the MS/MS scans were 500 ms and 250 ms respectively and the ion target
values were set to 1E6 and 5E4, respectively for each scan mode. The 24-fractions were run
in duplicates.
iTRAQ Data Analysis

46
The raw files were processed using the Proteome Discoverer 1.3.0.339 software suite
(Thermo Scientific). The fragmentation spectra were searched against the UniProtKB/Swiss-
Prot mouse database (released date: October 19, 2011; 16407 entries) using MASCOT
(Perkins et al., 1999) as the search engine (v 2.2) with the precursor and fragment mass
tolerances set to 10 ppm and 0.075 Da, respectively, and with up to two missed cleavages.
Lysine and peptide N-termini labeling with iTRAQ-4plex reagent as well as
carbamidomethylation of cysteine were considered as fixed modifications, while oxidation of
methionine was chosen as variable modification for database searching. Peptides
identification was filtered at 1% false discovery rate (FDR) and thus not dependent on the
peptide score. Only peptides with high confidence were considered. The results were then
exported into Excel for manual data interpretation. Although relative quantification and some
statistical data were provided by the Proteome Discoverer software, an additional 1.3-fold
change cut-off for all iTRAQ ratios (ratio < 0.77 or > 1.3) was selected to classify proteins as
up- or down-regulated (Chen et al., 2007; Gan et al., 2007; Ho et al., 2009). Proteins with
iTRAQ ratios below the low range (0.77) were considered to be under-expressed, while those
above the high range (1.3) were considered overexpressed. Only proteins identified with 2 or
more unique peptides and at least 3 iTRAQ peptide counts were considered. Gene Ontology
analyses of the identified proteins were performed.
SUPPLEMENTAL REFERENCES
Canto, C., Houtkooper, R.H., Pirinen, E., Youn, D.Y., Oosterveer, M.H., Cen, Y., Fernandez-
Marcos, P.J., Yamamoto, H., Andreux, P.A., Cettour-Rose, P., et al. (2012). The NAD(+)
precursor nicotinamide riboside enhances oxidative metabolism and protects against high-fat
diet-induced obesity. Cell Metab 15, 838-847.

47
Chen, Y., Choong, L.Y., Lin, Q., Philp, R., Wong, C.H., Ang, B.K., Tan, Y.L., Loh, M.C.,
Hew, C.L., Shah, N., et al. (2007). Differential expression of novel tyrosine kinase substrates
during breast cancer development. Mol Cell Proteomics 6, 2072-2087.
Christophorou, M.A., Martin-Zanca, D., Soucek, L., Lawlor, E.R., Brown-Swigart, L.,
Verschuren, E.W., and Evan, G.I. (2005). Temporal dissection of p53 function in vitro and in
vivo. Nat Genet 37, 718-726.
Ernoult, E., Gamelin, E., and Guette, C. (2008). Improved proteome coverage by using
iTRAQ labelling and peptide OFFGEL fractionation. Proteome Sci 6, 27.
Gan, C.S., Chong, P.K., Pham, T.K., and Wright, P.C. (2007). Technical, experimental, and
biological variations in isobaric tags for relative and absolute quantitation (iTRAQ). J
Proteome Res 6, 821-827.
Ho, J., Kong, J.W., Choong, L.Y., Loh, M.C., Toy, W., Chong, P.K., Wong, C.H., Wong,
C.Y., Shah, N., and Lim, Y.P. (2009). Novel breast cancer metastasis-associated proteins. J
Proteome Res 8, 583-594.
Kistner, A., Gossen, M., Zimmermann, F., Jerecic, J., Ullmer, C., Lubbert, H., and Bujard, H.
(1996). Doxycycline-mediated quantitative and tissue-specific control of gene expression in
transgenic mice. Proc Natl Acad Sci USA 93, 10933-10938.
Kline, K.G., Frewen, B., Bristow, M.R., Maccoss, M.J., and Wu, C.C. (2008). High quality
catalog of proteotypic peptides from human heart. J Proteome Res 7, 5055-5061.
Langmead, B., Trapnell, C., Pop, M., and Salzberg, S.L. (2009). Ultrafast and memory-
efficient alignment of short DNA sequences to the human genome. Genome Biol 10, R25.
Li, H., Handsaker, B., Wysoker, A., Fennell, T., Ruan, J., Homer, N., Marth, G., Abecasis,
G., and Durbin, R. (2009). The Sequence Alignment/Map format and SAMtools.
Bioinformatics 25, 2078-2079.

48
Livak, K.J., and Schmittgen, T.D. (2001). Analysis of relative gene expression data using
real-time quantitative PCR and the 2(-Delta Delta C(T)) Method. Methods 25, 402-408.
Olsen, J.V., de Godoy, L.M., Li, G., Macek, B., Mortensen, P., Pesch, R., Makarov, A.,
Lange, O., Horning, S., and Mann, M. (2005). Parts per million mass accuracy on an Orbitrap
mass spectrometer via lock mass injection into a C-trap. Mol Cell Proteomics 4, 2010-2021.
Perkins, D.N., Pappin, D.J., Creasy, D.M., and Cottrell, J.S. (1999). Probability-based protein
identification by searching sequence databases using mass spectrometry data. Electrophoresis
20, 3551-3567.
Rappsilber, J., Ishihama, Y., and Mann, M. (2003). Stop and go extraction tips for matrix-
assisted laser desorption/ionization, nanoelectrospray, and LC/MS sample pretreatment in
proteomics. Anal Chem 75, 663-670.
Trapnell, C., Roberts, A., Goff, L., Pertea, G., Kim, D., Kelley, D.R., Pimentel, H., Salzberg,
S.L., Rinn, J.L., and Pachter, L. (2012). Differential gene and transcript expression analysis
of RNA-seq experiments with TopHat and Cufflinks. Nat Protoc 7, 562-578.
Wisniewski, J.R., Zougman, A., Nagaraj, N., and Mann, M. (2009). Universal sample
preparation method for proteome analysis. Nat Methods 6, 359-362.
Wu, J.C., Merlino, G., and Fausto, N. (1994). Establishment and characterization of
differentiated, nontransformed hepatocyte cell lines derived from mice transgenic for
transforming growth factor alpha. Proc Natl Acad Sci USA 91, 674-678.
Related Documents