Inhibition of calcite growth by alginate L.Z. Lakshtanov a,b,⇑ , N. Bovet a , S.L.S. Stipp a a NanoGeoScience, Department of Chemistry, Copenhagen University, Universitetsparken 5, DK-2100 Copenhagen K, Denmark b Institute of Experimental Mineralogy, 142432 Chernogolovka, Russia Received 28 November 2010; accepted in revised form 13 April 2011; available online 20 April 2011 Abstract The kinetics of calcite precipitation in the presence of alginate was investigated using the constant composition technique. In the concentration range investigated (0.0002–0.005 g L 1 ), alginate inhibits calcite precipitation. The extent of inhibition increased with increased alginate concentration and decreased solution supersaturation. Alginate adsorption, derived from normalized calcite precipitation rates, is described satisfactorily by the Langmuir adsorption model. At lowest supersatura- tion, alginate adsorption onto calcite probably reaches its maximal uptake of 7.5E-4 g m 2 , corresponding to surface coverage of one molecule for each 200–300 nm 2 , depending on the molecular mass of alginate. This means that one alginate molecule can be bound over 100–150 Ca surface sites. Initially, on the surface of the inhibited calcite, XPS identified alginate but after further time in solution, when the system had recovered, XPS demonstrated that it disappeared from the surface, presumably buried under the newly formed calcite. The alginate affinity constant decreases with increasing supersaturation, evidence for incomplete adsorption. A simple model based on competition between growth and desorption effectively describes the observed change in the adsorption constant. Ó 2011 Elsevier Ltd. All rights reserved. 1. INTRODUCTION Calcite precipitation affects many environmental and geological systems. It is known to regulate the fate and mobility of anthropogenic pollutants, especially heavy met- als, by adsorption as well as incorporation during coprecip- itation (Davis et al., 1987; Tesoriero and Pankow, 1996; Rimstidt et al., 1998; Curti, 1999; Lakshtanov and Stipp, 2004). On the other hand, impurities or additives can have a significant effect on the rates of nucleation and growth, as well as on crystal size and morphology (House, 1986; Amjad, 1987; Didymus et al., 1993; Butler et al., 2006). In most cases, this effect manifests itself in the inhibition of crystal growth. Inhibitors of calcite precipitation are of interest in a number of fields, ranging from engineering sciences to med- icine and geochemistry and a lack of fundamental under- standing about how trace components interact with natural solids such as rocks, soil and sediments limits our ability to predict reactions in natural systems. In particular, the inhibitory effect of sea water species such as magnesium and orthophosphate (Baker et al., 1980; Wilbur and Bernhardt, 1984; Morse et al., 2007) could explain the ex- tremely slow recrystallization rates of chalk. Moreover, there is evidence that biopolymers produced by bacteria and algae, particularly the polysaccharides, significantly in- hibit crystallization of calcium carbonate (Gunthorpe and Sikes, 1986; Welch et al., 1999; Kanakis et al., 2001; Manoli and Dalas, 2002; Butler et al., 2006). Alginate is produced by brown algae and it is known to affect calcite growth. In the work reported here, we investi- gated the effect of the sodium salt of alginic acid, a linear copolymer of mannuronic (M) and guluronic (G) acids (Fig. 1). These appear as blocks of M and G in any sequence and of any length. Poly-G blocks are mainly responsible for chelating cations in the solution. Poly-M blocks are able to 0016-7037/$ - see front matter Ó 2011 Elsevier Ltd. All rights reserved. doi:10.1016/j.gca.2011.04.014 ⇑ Corresponding author at: NanoGeoScience, Department of Chemistry, Copenhagen University, Universitetsparken 5, DK- 2100 Copenhagen K, Denmark. Tel.: +45 35 32 02 19; fax: +7 49652 49687. E-mail addresses: [email protected], [email protected] (L.Z. Lakshtanov). www.elsevier.com/locate/gca Available online at www.sciencedirect.com Geochimica et Cosmochimica Acta 75 (2011) 3945–3955

Welcome message from author
This document is posted to help you gain knowledge. Please leave a comment to let me know what you think about it! Share it to your friends and learn new things together.
Transcript
Available online at www.sciencedirect.com
www.elsevier.com/locate/gca
Geochimica et Cosmochimica Acta 75 (2011) 3945–3955
Inhibition of calcite growth by alginate
L.Z. Lakshtanov a,b,⇑, N. Bovet a, S.L.S. Stipp a
a NanoGeoScience, Department of Chemistry, Copenhagen University, Universitetsparken 5, DK-2100 Copenhagen K, Denmarkb Institute of Experimental Mineralogy, 142432 Chernogolovka, Russia
Received 28 November 2010; accepted in revised form 13 April 2011; available online 20 April 2011
Abstract
The kinetics of calcite precipitation in the presence of alginate was investigated using the constant composition technique.In the concentration range investigated (0.0002–0.005 g L�1), alginate inhibits calcite precipitation. The extent of inhibitionincreased with increased alginate concentration and decreased solution supersaturation. Alginate adsorption, derived fromnormalized calcite precipitation rates, is described satisfactorily by the Langmuir adsorption model. At lowest supersatura-tion, alginate adsorption onto calcite probably reaches its maximal uptake of 7.5E-4 g m�2, corresponding to surface coverageof one molecule for each 200–300 nm2, depending on the molecular mass of alginate. This means that one alginate moleculecan be bound over 100–150 Ca surface sites. Initially, on the surface of the inhibited calcite, XPS identified alginate but afterfurther time in solution, when the system had recovered, XPS demonstrated that it disappeared from the surface, presumablyburied under the newly formed calcite. The alginate affinity constant decreases with increasing supersaturation, evidence forincomplete adsorption. A simple model based on competition between growth and desorption effectively describes theobserved change in the adsorption constant.� 2011 Elsevier Ltd. All rights reserved.
1. INTRODUCTION
Calcite precipitation affects many environmental andgeological systems. It is known to regulate the fate andmobility of anthropogenic pollutants, especially heavy met-als, by adsorption as well as incorporation during coprecip-itation (Davis et al., 1987; Tesoriero and Pankow, 1996;Rimstidt et al., 1998; Curti, 1999; Lakshtanov and Stipp,2004). On the other hand, impurities or additives can havea significant effect on the rates of nucleation and growth, aswell as on crystal size and morphology (House, 1986;Amjad, 1987; Didymus et al., 1993; Butler et al., 2006). Inmost cases, this effect manifests itself in the inhibition ofcrystal growth.
0016-7037/$ - see front matter � 2011 Elsevier Ltd. All rights reserved.
doi:10.1016/j.gca.2011.04.014
⇑ Corresponding author at: NanoGeoScience, Department ofChemistry, Copenhagen University, Universitetsparken 5, DK-2100 Copenhagen K, Denmark. Tel.: +45 35 32 02 19; fax: +749652 49687.
E-mail addresses: [email protected], [email protected] (L.Z.Lakshtanov).
Inhibitors of calcite precipitation are of interest in anumber of fields, ranging from engineering sciences to med-icine and geochemistry and a lack of fundamental under-standing about how trace components interact withnatural solids such as rocks, soil and sediments limits ourability to predict reactions in natural systems. In particular,the inhibitory effect of sea water species such as magnesiumand orthophosphate (Baker et al., 1980; Wilbur andBernhardt, 1984; Morse et al., 2007) could explain the ex-tremely slow recrystallization rates of chalk. Moreover,there is evidence that biopolymers produced by bacteriaand algae, particularly the polysaccharides, significantly in-hibit crystallization of calcium carbonate (Gunthorpe andSikes, 1986; Welch et al., 1999; Kanakis et al., 2001; Manoliand Dalas, 2002; Butler et al., 2006).
Alginate is produced by brown algae and it is known toaffect calcite growth. In the work reported here, we investi-gated the effect of the sodium salt of alginic acid, a linearcopolymer of mannuronic (M) and guluronic (G) acids(Fig. 1). These appear as blocks of M and G in any sequenceand of any length. Poly-G blocks are mainly responsible forchelating cations in the solution. Poly-M blocks are able to
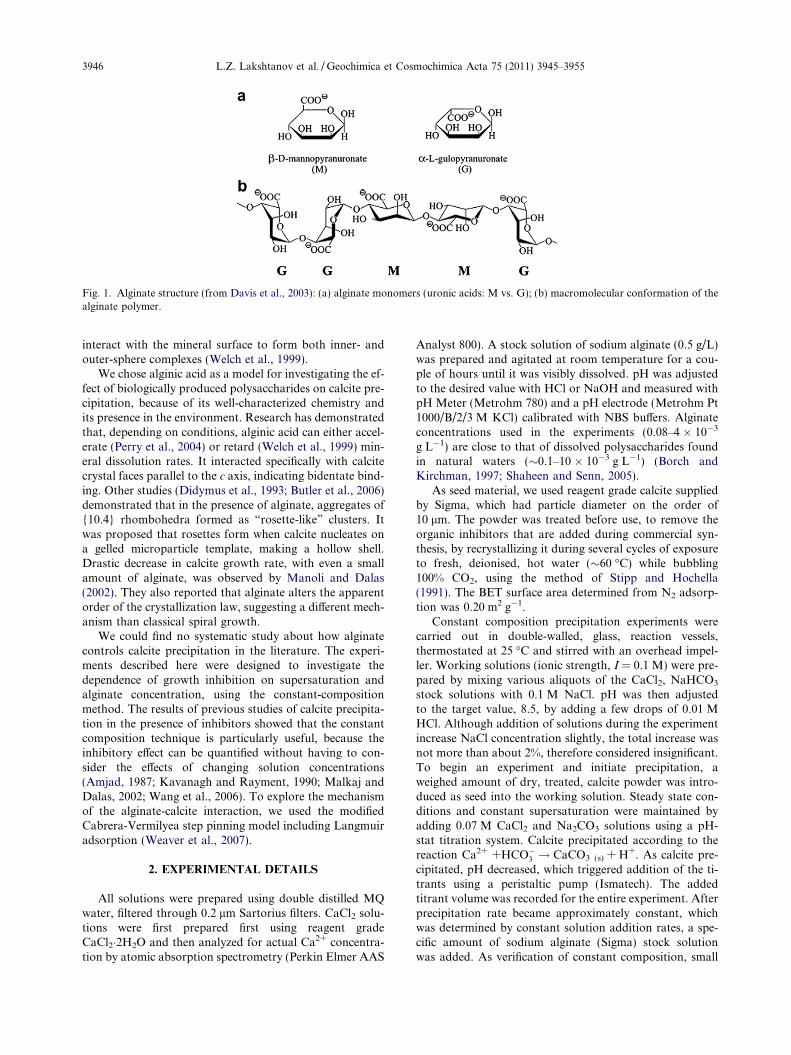
Fig. 1. Alginate structure (from Davis et al., 2003): (a) alginate monomers (uronic acids: M vs. G); (b) macromolecular conformation of thealginate polymer.
3946 L.Z. Lakshtanov et al. / Geochimica et Cosmochimica Acta 75 (2011) 3945–3955
interact with the mineral surface to form both inner- andouter-sphere complexes (Welch et al., 1999).
We chose alginic acid as a model for investigating the ef-fect of biologically produced polysaccharides on calcite pre-cipitation, because of its well-characterized chemistry andits presence in the environment. Research has demonstratedthat, depending on conditions, alginic acid can either accel-erate (Perry et al., 2004) or retard (Welch et al., 1999) min-eral dissolution rates. It interacted specifically with calcitecrystal faces parallel to the c axis, indicating bidentate bind-ing. Other studies (Didymus et al., 1993; Butler et al., 2006)demonstrated that in the presence of alginate, aggregates of{10.4} rhombohedra formed as “rosette-like” clusters. Itwas proposed that rosettes form when calcite nucleates ona gelled microparticle template, making a hollow shell.Drastic decrease in calcite growth rate, with even a smallamount of alginate, was observed by Manoli and Dalas(2002). They also reported that alginate alters the apparentorder of the crystallization law, suggesting a different mech-anism than classical spiral growth.
We could find no systematic study about how alginatecontrols calcite precipitation in the literature. The experi-ments described here were designed to investigate thedependence of growth inhibition on supersaturation andalginate concentration, using the constant-compositionmethod. The results of previous studies of calcite precipita-tion in the presence of inhibitors showed that the constantcomposition technique is particularly useful, because theinhibitory effect can be quantified without having to con-sider the effects of changing solution concentrations(Amjad, 1987; Kavanagh and Rayment, 1990; Malkaj andDalas, 2002; Wang et al., 2006). To explore the mechanismof the alginate-calcite interaction, we used the modifiedCabrera-Vermilyea step pinning model including Langmuiradsorption (Weaver et al., 2007).
2. EXPERIMENTAL DETAILS
All solutions were prepared using double distilled MQwater, filtered through 0.2 lm Sartorius filters. CaCl2 solu-tions were first prepared first using reagent gradeCaCl2�2H2O and then analyzed for actual Ca2+ concentra-tion by atomic absorption spectrometry (Perkin Elmer AAS
Analyst 800). A stock solution of sodium alginate (0.5 g/L)was prepared and agitated at room temperature for a cou-ple of hours until it was visibly dissolved. pH was adjustedto the desired value with HCl or NaOH and measured withpH Meter (Metrohm 780) and a pH electrode (Metrohm Pt1000/B/2/3 M KCl) calibrated with NBS buffers. Alginateconcentrations used in the experiments (0.08–4 � 10�3
g L�1) are close to that of dissolved polysaccharides foundin natural waters (�0.1–10 � 10�3 g L�1) (Borch andKirchman, 1997; Shaheen and Senn, 2005).
As seed material, we used reagent grade calcite suppliedby Sigma, which had particle diameter on the order of10 lm. The powder was treated before use, to remove theorganic inhibitors that are added during commercial syn-thesis, by recrystallizing it during several cycles of exposureto fresh, deionised, hot water (�60 �C) while bubbling100% CO2, using the method of Stipp and Hochella(1991). The BET surface area determined from N2 adsorp-tion was 0.20 m2 g�1.
Constant composition precipitation experiments werecarried out in double-walled, glass, reaction vessels,thermostated at 25 �C and stirred with an overhead impel-ler. Working solutions (ionic strength, I = 0.1 M) were pre-pared by mixing various aliquots of the CaCl2, NaHCO3
stock solutions with 0.1 M NaCl. pH was then adjustedto the target value, 8.5, by adding a few drops of 0.01 MHCl. Although addition of solutions during the experimentincrease NaCl concentration slightly, the total increase wasnot more than about 2%, therefore considered insignificant.To begin an experiment and initiate precipitation, aweighed amount of dry, treated, calcite powder was intro-duced as seed into the working solution. Steady state con-ditions and constant supersaturation were maintained byadding 0.07 M CaCl2 and Na2CO3 solutions using a pH-stat titration system. Calcite precipitated according to thereaction Ca2+ +HCO�3 ! CaCO3 (s) + H+. As calcite pre-cipitated, pH decreased, which triggered addition of the ti-trants using a peristaltic pump (Ismatech). The addedtitrant volume was recorded for the entire experiment. Afterprecipitation rate became approximately constant, whichwas determined by constant solution addition rates, a spe-cific amount of sodium alginate (Sigma) stock solutionwas added. As verification of constant composition, small
Inhibition of calcite growth by alginate 3947
samples of the solution were periodically withdrawn andanalyzed for Ca2+ concentration by AAS; it remained con-stant within ±5%.
At the end of the experiment, the suspension was col-lected, filtered, washed with calcite saturated solution andthen with ethanol, dried and characterized by various meth-ods including X-ray diffraction (XRD; STOE STADIP61146), scanning electron microscopy (SEM; Quanta200F) and X-ray photoelectron spectroscopy (XPS; KratosAxis Ultra with a monochromated Al Ka X-ray source;power = 150 W, hm = 1486.6 eV). XPS is a near surface sen-sitive technique (information depth �10 nm) that providesinformation about bonding structure and surfacecomposition.
Aqueous speciation and saturation index calculationsfor all experiments were performed using PHREEQC(Parkhurst and Appelo, 1999).
3. RESULTS AND DISCUSSION
3.1. Calcite precipitation rate
The driving force for calcite precipitation (crystalgrowth) is the difference in Gibbs free energy between initial(supersaturated) and final (equilibrium) indices:
DG ¼ RT lnX1=2 ¼ RT2
lnX; ð1Þ
where R is the gas constant, T represents temperature, 2 isthe number of ions in a formula unit and X, is the satura-tion index:
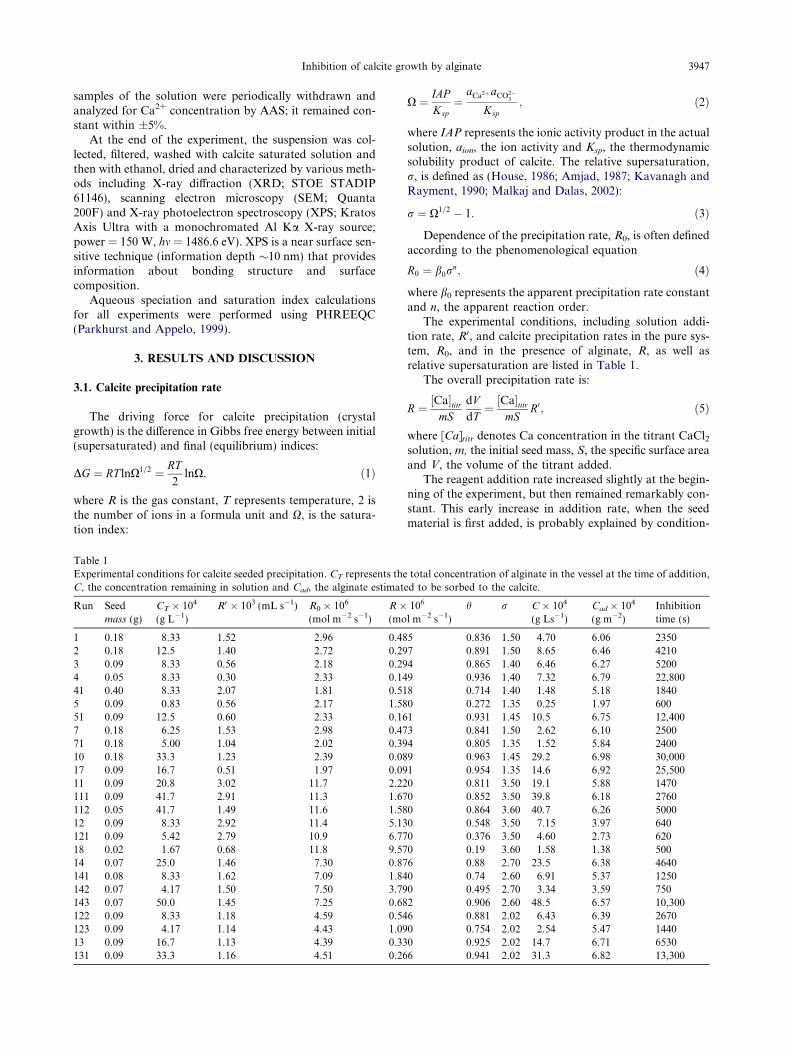
Table 1Experimental conditions for calcite seeded precipitation. CT represents theC, the concentration remaining in solution and Cad, the alginate estimat
Run Seedmass (g)
CT � 104
(g L�1)R0 � 103 (mL s�1) R0 � 106
(mol m�2 s�1)R �(mo
1 0.18 8.33 1.52 2.96 0.482 0.18 12.5 1.40 2.72 0.293 0.09 8.33 0.56 2.18 0.294 0.05 8.33 0.30 2.33 0.1441 0.40 8.33 2.07 1.81 0.515 0.09 0.83 0.56 2.17 1.5851 0.09 12.5 0.60 2.33 0.167 0.18 6.25 1.53 2.98 0.4771 0.18 5.00 1.04 2.02 0.3910 0.18 33.3 1.23 2.39 0.0817 0.09 16.7 0.51 1.97 0.0911 0.09 20.8 3.02 11.7 2.22111 0.09 41.7 2.91 11.3 1.67112 0.05 41.7 1.49 11.6 1.5812 0.09 8.33 2.92 11.4 5.13121 0.09 5.42 2.79 10.9 6.7718 0.02 1.67 0.68 11.8 9.5714 0.07 25.0 1.46 7.30 0.87141 0.08 8.33 1.62 7.09 1.84142 0.07 4.17 1.50 7.50 3.79143 0.07 50.0 1.45 7.25 0.68122 0.09 8.33 1.18 4.59 0.54123 0.09 4.17 1.14 4.43 1.0913 0.09 16.7 1.13 4.39 0.33131 0.09 33.3 1.16 4.51 0.26
X ¼ IAPKsp¼
aCa2þaCO2�3
Ksp; ð2Þ
where IAP represents the ionic activity product in the actualsolution, aion, the ion activity and Ksp, the thermodynamicsolubility product of calcite. The relative supersaturation,r, is defined as (House, 1986; Amjad, 1987; Kavanagh andRayment, 1990; Malkaj and Dalas, 2002):
r ¼ X1=2 � 1: ð3Þ
Dependence of the precipitation rate, R0, is often definedaccording to the phenomenological equation
R0 ¼ b0rn; ð4Þ
where b0 represents the apparent precipitation rate constantand n, the apparent reaction order.
The experimental conditions, including solution addi-tion rate, R0, and calcite precipitation rates in the pure sys-tem, R0, and in the presence of alginate, R, as well asrelative supersaturation are listed in Table 1.
The overall precipitation rate is:
R ¼ ½Ca�titrmS
dVdT¼ ½Ca�titr
mSR0; ð5Þ
where [Ca]titr denotes Ca concentration in the titrant CaCl2solution, m, the initial seed mass, S, the specific surface areaand V, the volume of the titrant added.
The reagent addition rate increased slightly at the begin-ning of the experiment, but then remained remarkably con-stant. This early increase in addition rate, when the seedmaterial is first added, is probably explained by condition-
total concentration of alginate in the vessel at the time of addition,ed to be sorbed to the calcite.
106
l m�2 s�1)h r C � 104
(g Ls�1)Cad � 104
(g m�2)Inhibitiontime (s)
5 0.836 1.50 4.70 6.06 23507 0.891 1.50 8.65 6.46 42104 0.865 1.40 6.46 6.27 52009 0.936 1.40 7.32 6.79 22,8008 0.714 1.40 1.48 5.18 18400 0.272 1.35 0.25 1.97 6001 0.931 1.45 10.5 6.75 12,4003 0.841 1.50 2.62 6.10 25004 0.805 1.35 1.52 5.84 24009 0.963 1.45 29.2 6.98 30,0001 0.954 1.35 14.6 6.92 25,5000 0.811 3.50 19.1 5.88 14700 0.852 3.50 39.8 6.18 27600 0.864 3.60 40.7 6.26 50000 0.548 3.50 7.15 3.97 6400 0.376 3.50 4.60 2.73 6200 0.19 3.60 1.58 1.38 5006 0.88 2.70 23.5 6.38 46400 0.74 2.60 6.91 5.37 12500 0.495 2.70 3.34 3.59 7502 0.906 2.60 48.5 6.57 10,3006 0.881 2.02 6.43 6.39 26700 0.754 2.02 2.54 5.47 14400 0.925 2.02 14.7 6.71 65306 0.941 2.02 31.3 6.82 13,300
R0 = 1E-6 σ1.8
0.0E+00
2.0E-06
4.0E-06
6.0E-06
8.0E-06
1.0E-05
1.2E-05
1.4E-05
1.0 1.5 2.0 2.5 3.0 3.5 4.0
σ
R0,
mo
l /m
2 s
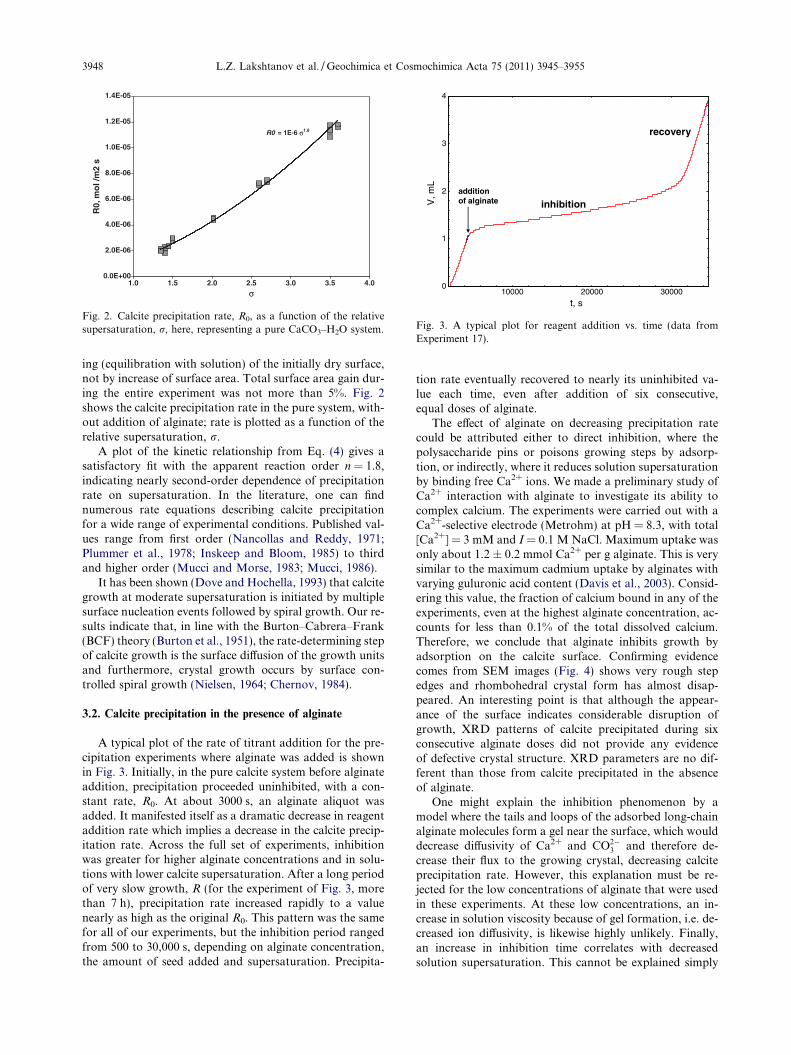
Fig. 2. Calcite precipitation rate, R0, as a function of the relativesupersaturation, r, here, representing a pure CaCO3–H2O system.
0
1
2
3
4
10000 20000 30000
t, s
V, m
L
additionof alginate inhibition
recovery
Fig. 3. A typical plot for reagent addition vs. time (data fromExperiment 17).
3948 L.Z. Lakshtanov et al. / Geochimica et Cosmochimica Acta 75 (2011) 3945–3955
ing (equilibration with solution) of the initially dry surface,not by increase of surface area. Total surface area gain dur-ing the entire experiment was not more than 5%. Fig. 2shows the calcite precipitation rate in the pure system, with-out addition of alginate; rate is plotted as a function of therelative supersaturation, r.
A plot of the kinetic relationship from Eq. (4) gives asatisfactory fit with the apparent reaction order n = 1.8,indicating nearly second-order dependence of precipitationrate on supersaturation. In the literature, one can findnumerous rate equations describing calcite precipitationfor a wide range of experimental conditions. Published val-ues range from first order (Nancollas and Reddy, 1971;Plummer et al., 1978; Inskeep and Bloom, 1985) to thirdand higher order (Mucci and Morse, 1983; Mucci, 1986).
It has been shown (Dove and Hochella, 1993) that calcitegrowth at moderate supersaturation is initiated by multiplesurface nucleation events followed by spiral growth. Our re-sults indicate that, in line with the Burton–Cabrera–Frank(BCF) theory (Burton et al., 1951), the rate-determining stepof calcite growth is the surface diffusion of the growth unitsand furthermore, crystal growth occurs by surface con-trolled spiral growth (Nielsen, 1964; Chernov, 1984).
3.2. Calcite precipitation in the presence of alginate
A typical plot of the rate of titrant addition for the pre-cipitation experiments where alginate was added is shownin Fig. 3. Initially, in the pure calcite system before alginateaddition, precipitation proceeded uninhibited, with a con-stant rate, R0. At about 3000 s, an alginate aliquot wasadded. It manifested itself as a dramatic decrease in reagentaddition rate which implies a decrease in the calcite precip-itation rate. Across the full set of experiments, inhibitionwas greater for higher alginate concentrations and in solu-tions with lower calcite supersaturation. After a long periodof very slow growth, R (for the experiment of Fig. 3, morethan 7 h), precipitation rate increased rapidly to a valuenearly as high as the original R0. This pattern was the samefor all of our experiments, but the inhibition period rangedfrom 500 to 30,000 s, depending on alginate concentration,the amount of seed added and supersaturation. Precipita-
tion rate eventually recovered to nearly its uninhibited va-lue each time, even after addition of six consecutive,equal doses of alginate.
The effect of alginate on decreasing precipitation ratecould be attributed either to direct inhibition, where thepolysaccharide pins or poisons growing steps by adsorp-tion, or indirectly, where it reduces solution supersaturationby binding free Ca2+ ions. We made a preliminary study ofCa2+ interaction with alginate to investigate its ability tocomplex calcium. The experiments were carried out with aCa2+-selective electrode (Metrohm) at pH = 8.3, with total[Ca2+] = 3 mM and I = 0.1 M NaCl. Maximum uptake wasonly about 1.2 ± 0.2 mmol Ca2+ per g alginate. This is verysimilar to the maximum cadmium uptake by alginates withvarying guluronic acid content (Davis et al., 2003). Consid-ering this value, the fraction of calcium bound in any of theexperiments, even at the highest alginate concentration, ac-counts for less than 0.1% of the total dissolved calcium.Therefore, we conclude that alginate inhibits growth byadsorption on the calcite surface. Confirming evidencecomes from SEM images (Fig. 4) shows very rough stepedges and rhombohedral crystal form has almost disap-peared. An interesting point is that although the appear-ance of the surface indicates considerable disruption ofgrowth, XRD patterns of calcite precipitated during sixconsecutive alginate doses did not provide any evidenceof defective crystal structure. XRD parameters are no dif-ferent than those from calcite precipitated in the absenceof alginate.
One might explain the inhibition phenomenon by amodel where the tails and loops of the adsorbed long-chainalginate molecules form a gel near the surface, which woulddecrease diffusivity of Ca2+ and CO2�
3 and therefore de-crease their flux to the growing crystal, decreasing calciteprecipitation rate. However, this explanation must be re-jected for the low concentrations of alginate that were usedin these experiments. At these low concentrations, an in-crease in solution viscosity because of gel formation, i.e. de-creased ion diffusivity, is likewise highly unlikely. Finally,an increase in inhibition time correlates with decreasedsolution supersaturation. This cannot be explained simply
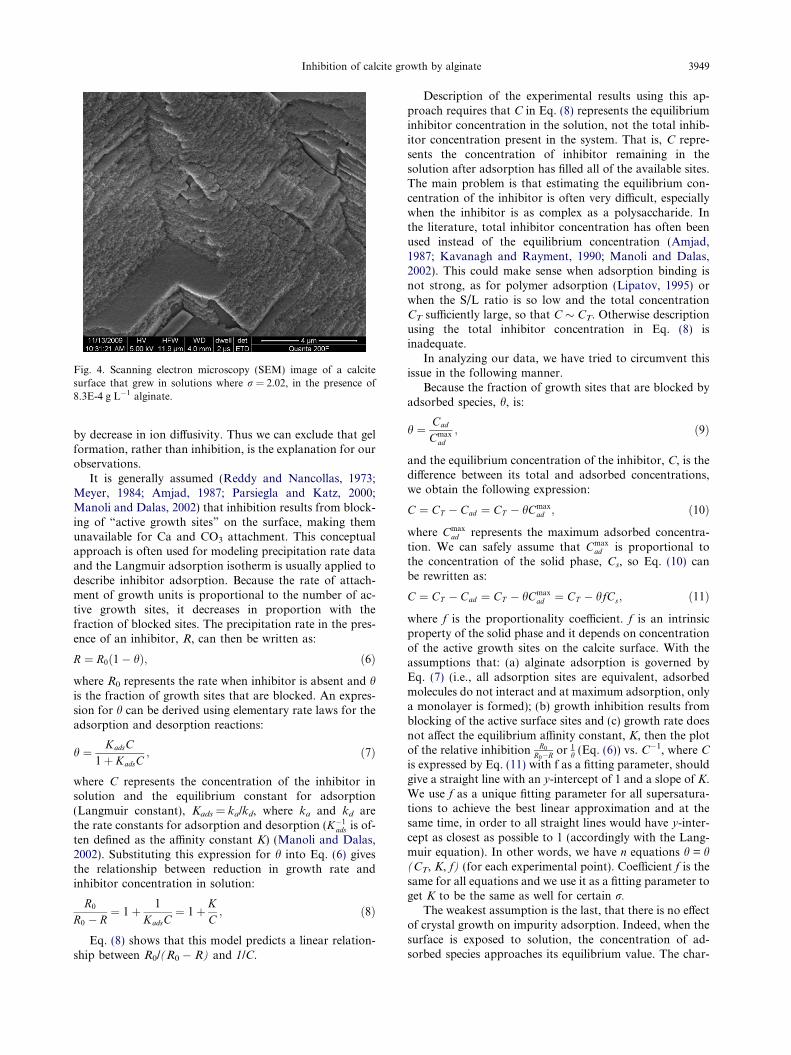
Fig. 4. Scanning electron microscopy (SEM) image of a calcitesurface that grew in solutions where r = 2.02, in the presence of8.3E-4 g L�1 alginate.
Inhibition of calcite growth by alginate 3949
by decrease in ion diffusivity. Thus we can exclude that gelformation, rather than inhibition, is the explanation for ourobservations.
It is generally assumed (Reddy and Nancollas, 1973;Meyer, 1984; Amjad, 1987; Parsiegla and Katz, 2000;Manoli and Dalas, 2002) that inhibition results from block-ing of “active growth sites” on the surface, making themunavailable for Ca and CO3 attachment. This conceptualapproach is often used for modeling precipitation rate dataand the Langmuir adsorption isotherm is usually applied todescribe inhibitor adsorption. Because the rate of attach-ment of growth units is proportional to the number of ac-tive growth sites, it decreases in proportion with thefraction of blocked sites. The precipitation rate in the pres-ence of an inhibitor, R, can then be written as:
R ¼ R0ð1� hÞ; ð6Þ
where R0 represents the rate when inhibitor is absent and his the fraction of growth sites that are blocked. An expres-sion for h can be derived using elementary rate laws for theadsorption and desorption reactions:
h ¼ KadsC1þ KadsC
; ð7Þ
where C represents the concentration of the inhibitor insolution and the equilibrium constant for adsorption(Langmuir constant), Kads = ka/kd, where ka and kd arethe rate constants for adsorption and desorption (K�1
ads is of-ten defined as the affinity constant K) (Manoli and Dalas,2002). Substituting this expression for h into Eq. (6) givesthe relationship between reduction in growth rate andinhibitor concentration in solution:
R0
R0 � R¼ 1þ 1
KadsC¼ 1þ K
C; ð8Þ
Eq. (8) shows that this model predicts a linear relation-ship between R0/(R0 � R) and 1/C.
Description of the experimental results using this ap-proach requires that C in Eq. (8) represents the equilibriuminhibitor concentration in the solution, not the total inhib-itor concentration present in the system. That is, C repre-sents the concentration of inhibitor remaining in thesolution after adsorption has filled all of the available sites.The main problem is that estimating the equilibrium con-centration of the inhibitor is often very difficult, especiallywhen the inhibitor is as complex as a polysaccharide. Inthe literature, total inhibitor concentration has often beenused instead of the equilibrium concentration (Amjad,1987; Kavanagh and Rayment, 1990; Manoli and Dalas,2002). This could make sense when adsorption binding isnot strong, as for polymer adsorption (Lipatov, 1995) orwhen the S/L ratio is so low and the total concentrationCT sufficiently large, so that C � CT. Otherwise descriptionusing the total inhibitor concentration in Eq. (8) isinadequate.
In analyzing our data, we have tried to circumvent thisissue in the following manner.
Because the fraction of growth sites that are blocked byadsorbed species, h, is:
h ¼ Cad
Cmaxad
; ð9Þ
and the equilibrium concentration of the inhibitor, C, is thedifference between its total and adsorbed concentrations,we obtain the following expression:
C ¼ CT � Cad ¼ CT � hCmaxad ; ð10Þ
where Cmaxad represents the maximum adsorbed concentra-
tion. We can safely assume that Cmaxad is proportional to
the concentration of the solid phase, Cs, so Eq. (10) canbe rewritten as:
C ¼ CT � Cad ¼ CT � hCmaxad ¼ CT � hfCs; ð11Þ
where f is the proportionality coefficient. f is an intrinsicproperty of the solid phase and it depends on concentrationof the active growth sites on the calcite surface. With theassumptions that: (a) alginate adsorption is governed byEq. (7) (i.e., all adsorption sites are equivalent, adsorbedmolecules do not interact and at maximum adsorption, onlya monolayer is formed); (b) growth inhibition results fromblocking of the active surface sites and (c) growth rate doesnot affect the equilibrium affinity constant, K, then the plotof the relative inhibition R0
R0�R or 1h (Eq. (6)) vs. C�1, where C
is expressed by Eq. (11) with f as a fitting parameter, shouldgive a straight line with an y-intercept of 1 and a slope of K.We use f as a unique fitting parameter for all supersatura-tions to achieve the best linear approximation and at thesame time, in order to all straight lines would have y-inter-cept as closest as possible to 1 (accordingly with the Lang-muir equation). In other words, we have n equations h = h(CT, K, f) (for each experimental point). Coefficient f is thesame for all equations and we use it as a fitting parameter toget K to be the same as well for certain r.
The weakest assumption is the last, that there is no effectof crystal growth on impurity adsorption. Indeed, when thesurface is exposed to solution, the concentration of ad-sorbed species approaches its equilibrium value. The char-
3950 L.Z. Lakshtanov et al. / Geochimica et Cosmochimica Acta 75 (2011) 3945–3955
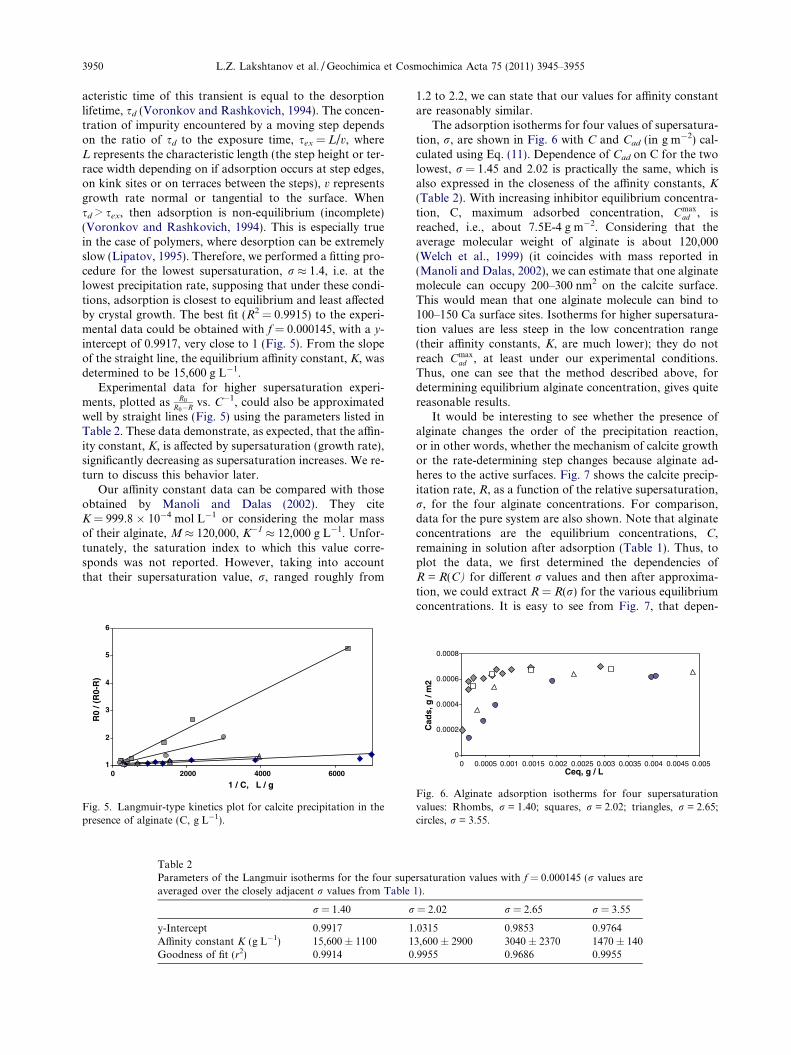
acteristic time of this transient is equal to the desorptionlifetime, sd (Voronkov and Rashkovich, 1994). The concen-tration of impurity encountered by a moving step dependson the ratio of sd to the exposure time, sex = L/v, whereL represents the characteristic length (the step height or ter-race width depending on if adsorption occurs at step edges,on kink sites or on terraces between the steps), v representsgrowth rate normal or tangential to the surface. Whensd > sex, then adsorption is non-equilibrium (incomplete)(Voronkov and Rashkovich, 1994). This is especially truein the case of polymers, where desorption can be extremelyslow (Lipatov, 1995). Therefore, we performed a fitting pro-cedure for the lowest supersaturation, r � 1.4, i.e. at thelowest precipitation rate, supposing that under these condi-tions, adsorption is closest to equilibrium and least affectedby crystal growth. The best fit (R2 = 0.9915) to the experi-mental data could be obtained with f = 0.000145, with a y-intercept of 0.9917, very close to 1 (Fig. 5). From the slopeof the straight line, the equilibrium affinity constant, K, wasdetermined to be 15,600 g L�1.
Experimental data for higher supersaturation experi-ments, plotted as R0
R0�R vs. C�1, could also be approximatedwell by straight lines (Fig. 5) using the parameters listed inTable 2. These data demonstrate, as expected, that the affin-ity constant, K, is affected by supersaturation (growth rate),significantly decreasing as supersaturation increases. We re-turn to discuss this behavior later.
Our affinity constant data can be compared with thoseobtained by Manoli and Dalas (2002). They citeK = 999.8 � 10�4 mol L�1 or considering the molar massof their alginate, M� 120,000, K�1 � 12,000 g L�1. Unfor-tunately, the saturation index to which this value corre-sponds was not reported. However, taking into accountthat their supersaturation value, r, ranged roughly from
1
2
3
4
5
6
6000400020000
1 / C, L / g
R0
/ (R
0-R
)
Fig. 5. Langmuir-type kinetics plot for calcite precipitation in thepresence of alginate (C, g L�1).
Table 2Parameters of the Langmuir isotherms for the four supeaveraged over the closely adjacent r values from Table
r = 1.40 r
y-Intercept 0.9917 1Affinity constant K (g L�1) 15,600 ± 1100 1Goodness of fit (r2) 0.9914 0
1.2 to 2.2, we can state that our values for affinity constantare reasonably similar.
The adsorption isotherms for four values of supersatura-tion, r, are shown in Fig. 6 with C and Cad (in g m�2) cal-culated using Eq. (11). Dependence of Cad on C for the twolowest, r = 1.45 and 2.02 is practically the same, which isalso expressed in the closeness of the affinity constants, K
(Table 2). With increasing inhibitor equilibrium concentra-tion, C, maximum adsorbed concentration, Cmax
ad , isreached, i.e., about 7.5E-4 g m�2. Considering that theaverage molecular weight of alginate is about 120,000(Welch et al., 1999) (it coincides with mass reported in(Manoli and Dalas, 2002), we can estimate that one alginatemolecule can occupy 200–300 nm2 on the calcite surface.This would mean that one alginate molecule can bind to100–150 Ca surface sites. Isotherms for higher supersatura-tion values are less steep in the low concentration range(their affinity constants, K, are much lower); they do notreach Cmax
ad , at least under our experimental conditions.Thus, one can see that the method described above, fordetermining equilibrium alginate concentration, gives quitereasonable results.
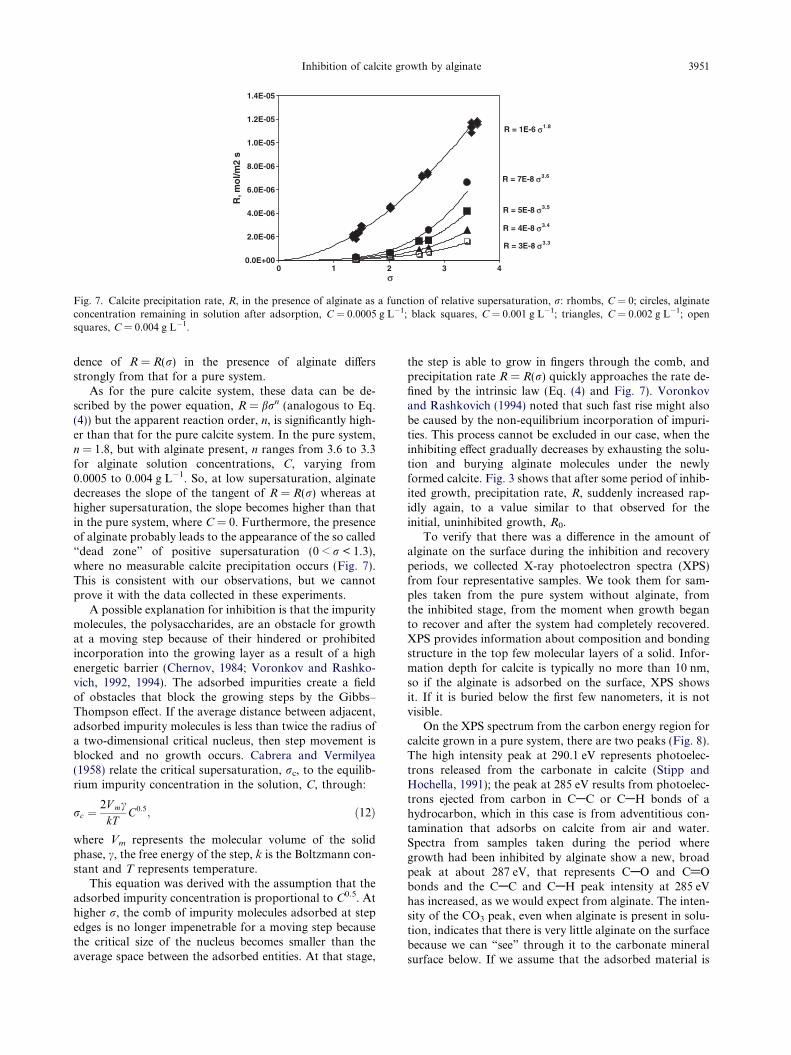
It would be interesting to see whether the presence ofalginate changes the order of the precipitation reaction,or in other words, whether the mechanism of calcite growthor the rate-determining step changes because alginate ad-heres to the active surfaces. Fig. 7 shows the calcite precip-itation rate, R, as a function of the relative supersaturation,r, for the four alginate concentrations. For comparison,data for the pure system are also shown. Note that alginateconcentrations are the equilibrium concentrations, C,remaining in solution after adsorption (Table 1). Thus, toplot the data, we first determined the dependencies ofR = R(C) for different r values and then after approxima-tion, we could extract R = R(r) for the various equilibriumconcentrations. It is easy to see from Fig. 7, that depen-
rsaturation values with f = 0.000145 (r values are1).
= 2.02 r = 2.65 r = 3.55
.0315 0.9853 0.97643,600 ± 2900 3040 ± 2370 1470 ± 140.9955 0.9686 0.9955
0
0.0002
0.0004
0.0006
0.0008
0 0.0005 0.001 0.0015 0.002 0.0025 0.003 0.0035 0.004 0.0045 0.005Ceq, g / L
Cad
s, g
/ m
2
Fig. 6. Alginate adsorption isotherms for four supersaturationvalues: Rhombs, r = 1.40; squares, r = 2.02; triangles, r = 2.65;circles, r = 3.55.
R = 4E-8 σ3.4
R = 3E-8 σ3.3
R = 5E-8 σ3.5
R = 1E-6 σ1.8
R = 7E-8 σ3.6
0.0E+00
2.0E-06
4.0E-06
6.0E-06
8.0E-06
1.0E-05
1.2E-05
1.4E-05
0 1 2 3 4σ
R, m
ol/m
2 s
Fig. 7. Calcite precipitation rate, R, in the presence of alginate as a function of relative supersaturation, r: rhombs, C = 0; circles, alginateconcentration remaining in solution after adsorption, C = 0.0005 g L�1; black squares, C = 0.001 g L�1; triangles, C = 0.002 g L�1; opensquares, C = 0.004 g L�1.
Inhibition of calcite growth by alginate 3951
dence of R = R(r) in the presence of alginate differsstrongly from that for a pure system.
As for the pure calcite system, these data can be de-scribed by the power equation, R = brn (analogous to Eq.(4)) but the apparent reaction order, n, is significantly high-er than that for the pure calcite system. In the pure system,n = 1.8, but with alginate present, n ranges from 3.6 to 3.3for alginate solution concentrations, C, varying from0.0005 to 0.004 g L�1. So, at low supersaturation, alginatedecreases the slope of the tangent of R = R(r) whereas athigher supersaturation, the slope becomes higher than thatin the pure system, where C = 0. Furthermore, the presenceof alginate probably leads to the appearance of the so called“dead zone” of positive supersaturation (0 < r < 1.3),where no measurable calcite precipitation occurs (Fig. 7).This is consistent with our observations, but we cannotprove it with the data collected in these experiments.
A possible explanation for inhibition is that the impuritymolecules, the polysaccharides, are an obstacle for growthat a moving step because of their hindered or prohibitedincorporation into the growing layer as a result of a highenergetic barrier (Chernov, 1984; Voronkov and Rashko-vich, 1992, 1994). The adsorbed impurities create a fieldof obstacles that block the growing steps by the Gibbs–Thompson effect. If the average distance between adjacent,adsorbed impurity molecules is less than twice the radius ofa two-dimensional critical nucleus, then step movement isblocked and no growth occurs. Cabrera and Vermilyea(1958) relate the critical supersaturation, rc, to the equilib-rium impurity concentration in the solution, C, through:
rc ¼2V mc
kTC0:5; ð12Þ
where Vm represents the molecular volume of the solidphase, c, the free energy of the step, k is the Boltzmann con-stant and T represents temperature.
This equation was derived with the assumption that theadsorbed impurity concentration is proportional to C0.5. Athigher r, the comb of impurity molecules adsorbed at stepedges is no longer impenetrable for a moving step becausethe critical size of the nucleus becomes smaller than theaverage space between the adsorbed entities. At that stage,
the step is able to grow in fingers through the comb, andprecipitation rate R = R(r) quickly approaches the rate de-fined by the intrinsic law (Eq. (4) and Fig. 7). Voronkovand Rashkovich (1994) noted that such fast rise might alsobe caused by the non-equilibrium incorporation of impuri-ties. This process cannot be excluded in our case, when theinhibiting effect gradually decreases by exhausting the solu-tion and burying alginate molecules under the newlyformed calcite. Fig. 3 shows that after some period of inhib-ited growth, precipitation rate, R, suddenly increased rap-idly again, to a value similar to that observed for theinitial, uninhibited growth, R0.
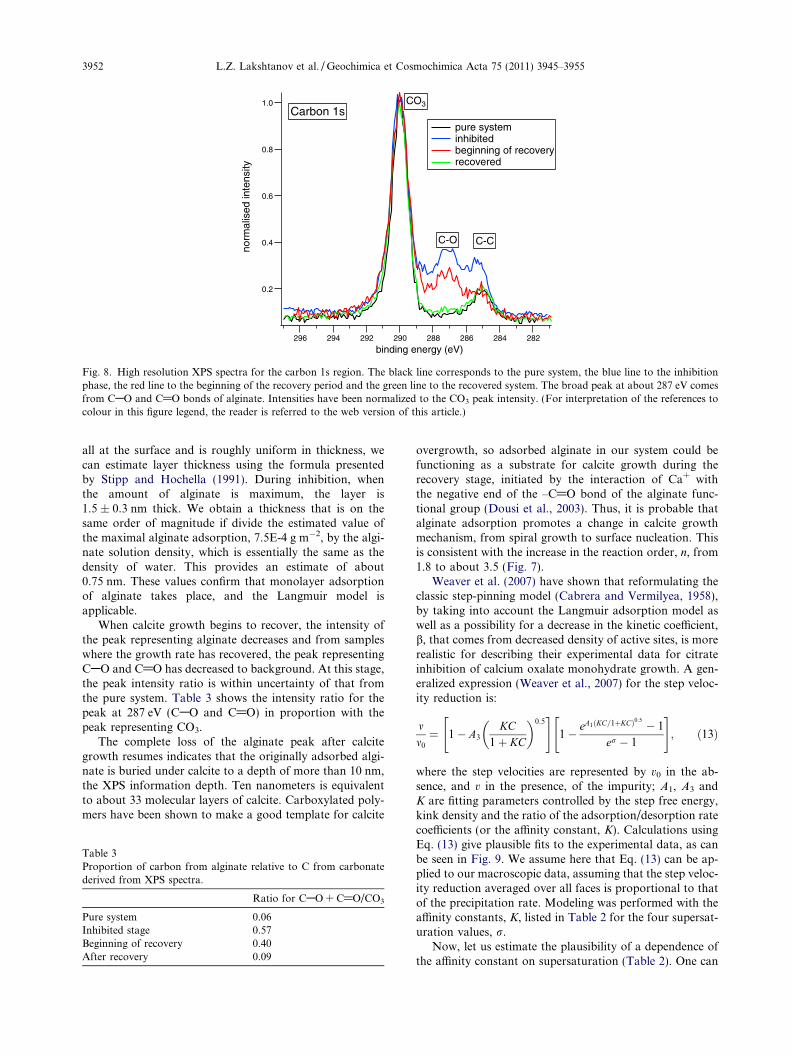
To verify that there was a difference in the amount ofalginate on the surface during the inhibition and recoveryperiods, we collected X-ray photoelectron spectra (XPS)from four representative samples. We took them for sam-ples taken from the pure system without alginate, fromthe inhibited stage, from the moment when growth beganto recover and after the system had completely recovered.XPS provides information about composition and bondingstructure in the top few molecular layers of a solid. Infor-mation depth for calcite is typically no more than 10 nm,so if the alginate is adsorbed on the surface, XPS showsit. If it is buried below the first few nanometers, it is notvisible.
On the XPS spectrum from the carbon energy region forcalcite grown in a pure system, there are two peaks (Fig. 8).The high intensity peak at 290.1 eV represents photoelec-trons released from the carbonate in calcite (Stipp andHochella, 1991); the peak at 285 eV results from photoelec-trons ejected from carbon in CAC or CAH bonds of ahydrocarbon, which in this case is from adventitious con-tamination that adsorbs on calcite from air and water.Spectra from samples taken during the period wheregrowth had been inhibited by alginate show a new, broadpeak at about 287 eV, that represents CAO and C@Obonds and the CAC and CAH peak intensity at 285 eVhas increased, as we would expect from alginate. The inten-sity of the CO3 peak, even when alginate is present in solu-tion, indicates that there is very little alginate on the surfacebecause we can “see” through it to the carbonate mineralsurface below. If we assume that the adsorbed material is
1.0
0.8
0.6
0.4
0.2
ytisnetnidesila
mron
296 294 292 290 288 286 284 282
binding energy (eV)
pure system inhibited beginning of recovery recovered
Carbon 1s
C-O
CO3
C-C
Fig. 8. High resolution XPS spectra for the carbon 1s region. The black line corresponds to the pure system, the blue line to the inhibitionphase, the red line to the beginning of the recovery period and the green line to the recovered system. The broad peak at about 287 eV comesfrom CAO and C@O bonds of alginate. Intensities have been normalized to the CO3 peak intensity. (For interpretation of the references tocolour in this figure legend, the reader is referred to the web version of this article.)
3952 L.Z. Lakshtanov et al. / Geochimica et Cosmochimica Acta 75 (2011) 3945–3955
all at the surface and is roughly uniform in thickness, wecan estimate layer thickness using the formula presentedby Stipp and Hochella (1991). During inhibition, whenthe amount of alginate is maximum, the layer is1.5 ± 0.3 nm thick. We obtain a thickness that is on thesame order of magnitude if divide the estimated value ofthe maximal alginate adsorption, 7.5E-4 g m�2, by the algi-nate solution density, which is essentially the same as thedensity of water. This provides an estimate of about0.75 nm. These values confirm that monolayer adsorptionof alginate takes place, and the Langmuir model isapplicable.
When calcite growth begins to recover, the intensity ofthe peak representing alginate decreases and from sampleswhere the growth rate has recovered, the peak representingCAO and C@O has decreased to background. At this stage,the peak intensity ratio is within uncertainty of that fromthe pure system. Table 3 shows the intensity ratio for thepeak at 287 eV (CAO and C@O) in proportion with thepeak representing CO3.
The complete loss of the alginate peak after calcitegrowth resumes indicates that the originally adsorbed algi-nate is buried under calcite to a depth of more than 10 nm,the XPS information depth. Ten nanometers is equivalentto about 33 molecular layers of calcite. Carboxylated poly-mers have been shown to make a good template for calcite
Table 3Proportion of carbon from alginate relative to C from carbonatederived from XPS spectra.
Ratio for CAO + C@O/CO3
Pure system 0.06Inhibited stage 0.57Beginning of recovery 0.40After recovery 0.09
overgrowth, so adsorbed alginate in our system could befunctioning as a substrate for calcite growth during therecovery stage, initiated by the interaction of Ca+ withthe negative end of the –C@O bond of the alginate func-tional group (Dousi et al., 2003). Thus, it is probable thatalginate adsorption promotes a change in calcite growthmechanism, from spiral growth to surface nucleation. Thisis consistent with the increase in the reaction order, n, from1.8 to about 3.5 (Fig. 7).
Weaver et al. (2007) have shown that reformulating theclassic step-pinning model (Cabrera and Vermilyea, 1958),by taking into account the Langmuir adsorption model aswell as a possibility for a decrease in the kinetic coefficient,b, that comes from decreased density of active sites, is morerealistic for describing their experimental data for citrateinhibition of calcium oxalate monohydrate growth. A gen-eralized expression (Weaver et al., 2007) for the step veloc-ity reduction is:
mm0
¼ 1� A3
KC1þ KC
� �0:5" #
1� eA1ðKC=1þKCÞ0:5 � 1
er � 1
" #; ð13Þ
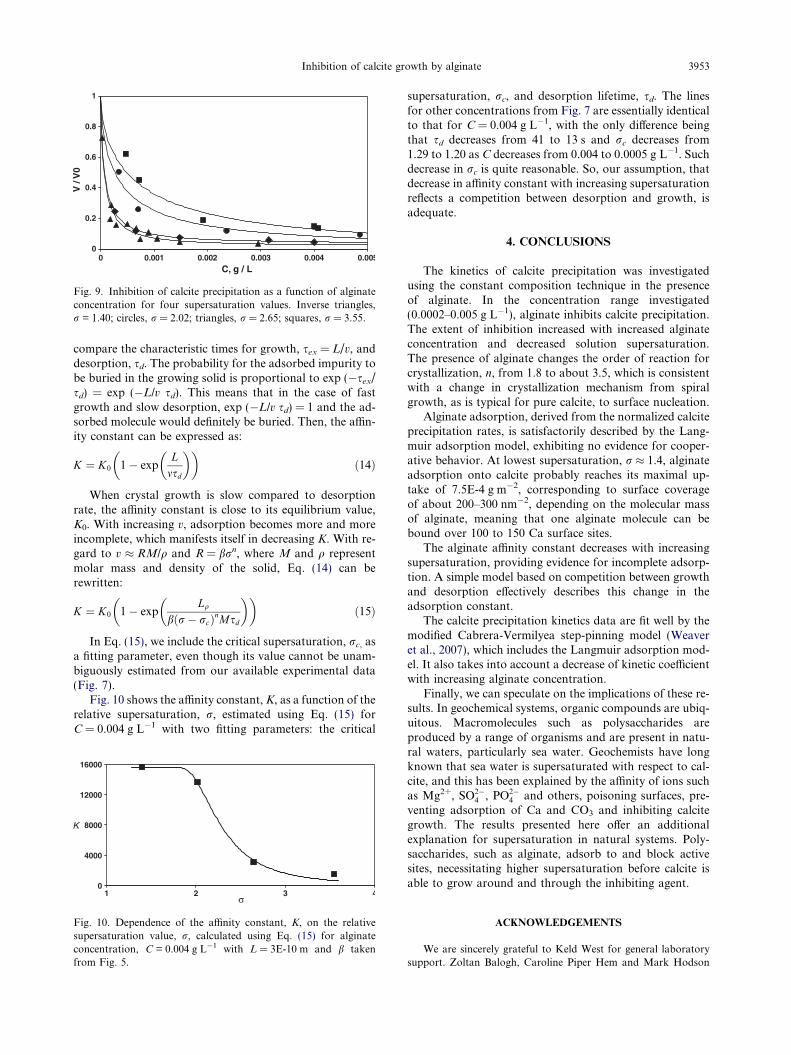
where the step velocities are represented by v0 in the ab-sence, and v in the presence, of the impurity; A1, A3 andK are fitting parameters controlled by the step free energy,kink density and the ratio of the adsorption/desorption ratecoefficients (or the affinity constant, K). Calculations usingEq. (13) give plausible fits to the experimental data, as canbe seen in Fig. 9. We assume here that Eq. (13) can be ap-plied to our macroscopic data, assuming that the step veloc-ity reduction averaged over all faces is proportional to thatof the precipitation rate. Modeling was performed with theaffinity constants, K, listed in Table 2 for the four supersat-uration values, r.
Now, let us estimate the plausibility of a dependence ofthe affinity constant on supersaturation (Table 2). One can
0
0.2
0.4
0.6
0.8
1
0 0.001 0.002 0.003 0.004 0.005C, g / L
V /
V0
Fig. 9. Inhibition of calcite precipitation as a function of alginateconcentration for four supersaturation values. Inverse triangles,r = 1.40; circles, r = 2.02; triangles, r = 2.65; squares, r = 3.55.
Inhibition of calcite growth by alginate 3953
compare the characteristic times for growth, sex = L/v, anddesorption, sd. The probability for the adsorbed impurity tobe buried in the growing solid is proportional to exp (�sex/sd) = exp (�L/v sd). This means that in the case of fastgrowth and slow desorption, exp (�L/v sd) = 1 and the ad-sorbed molecule would definitely be buried. Then, the affin-ity constant can be expressed as:
K ¼ K0 1� expL
msd
� �� �ð14Þ
When crystal growth is slow compared to desorptionrate, the affinity constant is close to its equilibrium value,K0. With increasing v, adsorption becomes more and moreincomplete, which manifests itself in decreasing K. With re-gard to v � RM/q and R = brn, where M and q representmolar mass and density of the solid, Eq. (14) can berewritten:
K ¼ K0 1� expLq
bðr� rcÞnMsd
� �� �ð15Þ
In Eq. (15), we include the critical supersaturation, rc, asa fitting parameter, even though its value cannot be unam-biguously estimated from our available experimental data(Fig. 7).
Fig. 10 shows the affinity constant, K, as a function of therelative supersaturation, r, estimated using Eq. (15) forC = 0.004 g L�1 with two fitting parameters: the critical
0
4000
8000
12000
16000
4321σ
K
Fig. 10. Dependence of the affinity constant, K, on the relativesupersaturation value, r, calculated using Eq. (15) for alginateconcentration, C = 0.004 g L�1 with L = 3E-10 m and b takenfrom Fig. 5.
supersaturation, rc, and desorption lifetime, sd. The linesfor other concentrations from Fig. 7 are essentially identicalto that for C = 0.004 g L�1, with the only difference beingthat sd decreases from 41 to 13 s and rc decreases from1.29 to 1.20 as C decreases from 0.004 to 0.0005 g L�1. Suchdecrease in rc is quite reasonable. So, our assumption, thatdecrease in affinity constant with increasing supersaturationreflects a competition between desorption and growth, isadequate.
4. CONCLUSIONS
The kinetics of calcite precipitation was investigatedusing the constant composition technique in the presenceof alginate. In the concentration range investigated(0.0002–0.005 g L�1), alginate inhibits calcite precipitation.The extent of inhibition increased with increased alginateconcentration and decreased solution supersaturation.The presence of alginate changes the order of reaction forcrystallization, n, from 1.8 to about 3.5, which is consistentwith a change in crystallization mechanism from spiralgrowth, as is typical for pure calcite, to surface nucleation.
Alginate adsorption, derived from the normalized calciteprecipitation rates, is satisfactorily described by the Lang-muir adsorption model, exhibiting no evidence for cooper-ative behavior. At lowest supersaturation, r � 1.4, alginateadsorption onto calcite probably reaches its maximal up-take of 7.5E-4 g m�2, corresponding to surface coverageof about 200–300 nm�2, depending on the molecular massof alginate, meaning that one alginate molecule can bebound over 100 to 150 Ca surface sites.
The alginate affinity constant decreases with increasingsupersaturation, providing evidence for incomplete adsorp-tion. A simple model based on competition between growthand desorption effectively describes this change in theadsorption constant.
The calcite precipitation kinetics data are fit well by themodified Cabrera-Vermilyea step-pinning model (Weaveret al., 2007), which includes the Langmuir adsorption mod-el. It also takes into account a decrease of kinetic coefficientwith increasing alginate concentration.
Finally, we can speculate on the implications of these re-sults. In geochemical systems, organic compounds are ubiq-uitous. Macromolecules such as polysaccharides areproduced by a range of organisms and are present in natu-ral waters, particularly sea water. Geochemists have longknown that sea water is supersaturated with respect to cal-cite, and this has been explained by the affinity of ions suchas Mg2+, SO2�
4 , PO2�4 and others, poisoning surfaces, pre-
venting adsorption of Ca and CO3 and inhibiting calcitegrowth. The results presented here offer an additionalexplanation for supersaturation in natural systems. Poly-saccharides, such as alginate, adsorb to and block activesites, necessitating higher supersaturation before calcite isable to grow around and through the inhibiting agent.
ACKNOWLEDGEMENTS
We are sincerely grateful to Keld West for general laboratorysupport. Zoltan Balogh, Caroline Piper Hem and Mark Hodson
3954 L.Z. Lakshtanov et al. / Geochimica et Cosmochimica Acta 75 (2011) 3945–3955
provided SEM, XRD and BET results. The manuscript was im-proved by comments from Lars Lovgren and two anonymousreviewers. Funding was provided by Maersk Oil and Gas A/Sand the Danish National Advanced Technology Foundation(HTF).
REFERENCES
Amjad Z. (1987) Kinetic study of the seeded growth of calciumcarbonate in the presence of benzene polycarboxylic acids.Langmuir 3, 224–228.
Baker P. A., Kastner M., Byerlee J. D. and Lockner D. A. (1980)Pressure solution and hydrothermal recrystallization of car-bonate sediments – an experimental study. Mar. Geol. 38, 185–
203.
Borch N. H. and Kirchman D. L. (1997) Concentration andcomposition of dissolved combined neutral sugars (polysaccha-rides) in seawater determined by HPLC-PAD. Mar. Chem. 57,
85–95.
Burton W. K., Cabrera N. and Frank F. C. (1951) The growth ofcrystals and the equilibrium structure of their surfaces. Phil.
Trans. R. Soc. A. 243, 299–358.
Butler M. F., Glaser N., Weaver A. C., Kirkland M. andHeppenstall-Butler M. (2006) Calcium carbonate crystallizationin the presence of biopolymers. Crystal Growth Des. 6, 781–794.
Cabrera N. and Vermilyea D. A. (1958) Growth of crystals from
solution. In: Growth and perfection of crystals. Chapman & Hall,London, pp. 393–410.
Chernov A.A. (1984) Modern Crystallography III: Crystal Growth.Springer, 1984.
Curti E. (1999) Coprecipitation of radionuclides with calcite:estimation of partition coefficients based on a review oflaboratory investigations and geochemical data. Appl. Geo-
chem. 14, 433–445.
Davis J. A., Fuller C. C. and Cook A. D. (1987) A model for tracemetal sorption processes at the calcite surface. Adsorption ofCd2+ and subsequent solid solution formation. Geochim.
Cosmochim. Acta 51, 1477–1490.
Davis T. A., Llanes F., Volesky B. and Mucci A. (2003) Metalselectivity of Sargassum spp. And their alginates in relation totheir a-L-guluronic acid content and conformation. Environ.
Sci. Technol. 37, 261–267.
Didymus J. M., Oliver P., Mann S., DeVries A. L., Hauschka P. V.and Westbroek P. (1993) Influence of low-molecular-weight andmacromolecular organic additives on the morphology of calciumcarbonate. J. Chem. Soc. Faraday Trans. 89, 2891–2900.
Dousi E., Kallitsis J., Chrissanthopoulos A., Mangood A. H. andDalas E. J. (2003) Calcite overgrowth on carboxylated poly-mers. J. Crystal Growth 253, 496–503.
Dove P. M. and Hochella, Jr, M. F. (1993) Calcite precipitationmechanisms and inhibition by orthophosphate: In situ obser-vations by scanning force microscopy. Geochim. Cosmochim.
Acta 57, 705–714.
Gunthorpe M. E. and Sikes C. S. (1986) Potent natural inhibitorsof CaCO3 crystallization from chalk deposits. Ohio J. Sci. 86,
106–110.
House W. A. (1986) Inhibition of calcite crystal growth byinorganic phosphate. J. Colloid Interface Sci. 119, 505–511.
Inskeep W. P. and Bloom P. R. (1985) An evaluation of rateequation for calcite precipitation kinetics at PCO2 less than0.01 atm and pH greater than 8. Geochim. Cosmochim. Acta 49,
2165–2180.
Kanakis J., Malkaj P., Petroheilos J. and Dalas E. (2001) Thecrystallization of calcium carbonate on porcine and human
cardiac valves and the anti mineralization effect of sodiumalginate. J. Crystal Growth 223, 557–564.
Kavanagh A. M. and Rayment T. J. (1990) Inhibitor effects oncalcite growth at low supersaturations. Chem. Soc. Faraday
Trans. 86, 965–972.
Lakshtanov L. Z. and Stipp S. L. S. (2004) Experimental study ofeuropium (III) coprecipitation with calcite. Geochim. Cosmo-
chim. Acta 68, 819–827.
Lipatov Yu. S. (1995) Polymer Reinforcement. ChemTec Publish-ing, Toronto-Scarborough-Ontario.
Malkaj P. and Dalas E. J. (2002) Effect of metallocene dichlorideson the crystal growth of calcium carbonate. J. Crystal Growth
242, 405–411.
Manoli F. and Dalas E. J. (2002) The effect of sodium alginate onthe crystal growth of calcium carbonate. Mater. Sci. Med. 13,
155–158.
Meyer H. J. (1984) The influence of impurities on the growth rateof calcite. J. Crystal Growth 66, 639–646.
Morse J. W., Arvidson R. S. and Luttge A. (2007) Calciumcarbonate formation and dissolution. Chem. Rev. 107, 342–381.
Mucci A. and Morse J. W. (1983) The incorporation of Mg2+ andSr2+ into calcite overgrowths: Influence of growth rate andsolution composition. Geochim. Cosmochim. Acta 47, 217–233.
Mucci A. (1986) Growth kinetics and composition of magnesiancalcite overgrowths precipitated from seawater: quantitativeinfluence of orthophosphate ions. Geochim. Cosmochim. Acta
50, 2255–2265.
Nancollas G. H. and Reddy M. M. J. (1971) The crystallization ofcalcium carbonate II. Calcite growth mechanism. J. Colloid
Interface Sci. 37, 824–830.
Nielsen A.E. Kinetics of Precipitation, Pergamon, 1964.Parkhurst D. L. and Appelo C. A. J. (1999) User’s guide to
PHREEQC (Version 2) – a computer program for speciation,
bath-reaction, one-dimension transport, and inverse geochemical
calculations. Water-Resources Investigations Report 99–4259.USGS, Denver CO, USA.
Parsiegla K. I. and Katz J. L. (2000) Calcite growth inhibition bycopper(II) II. Effect of solution composition. J. Crystal Growth
213, 368–380.
Perry, IV, T. D., Duckworth O. W., McNamara C. J., Martin S. T.and Mitchell R. (2004) Effects of the biologically producedalginic acid on macroscopic and microscopic calcite dissolutionrates. Environ. Sci. Technol. 38, 3040–3046.
Plummer L. N., Wigley T. M. L. and Parkhurst D. L. (1978) Thekinetics of calcite dissolution in CO2–water systems at 5 to60 �C and 0.0 to 1.0 atm CO2. Amer. J. Sci. 278, 179–216.
Reddy M. M. and Nancollas G. H. (1973) Calcite crystal growthinhibition by phosphonates. Desalination 12, 61–73.
Rimstidt J. D., Balog A. and Webb J. (1998) Distribution of traceelements between carbonate minerals and aqueous solutions.Geochim. Cosmochim. Acta 62, 1851–1863.
Stipp S. L. S. and Hochella, Jr., M. F. (1991) Structure andbonding environments at the calcite surface as observed withX-ray photoelectron spectroscopy (XPS) and low energyelectron diffraction (LEED). Geochim. Cosmochim. Acta 55,
1723–1736.
Tesoriero A. and Pankow J. (1996) Solid solution partitioning ofSr2+, Ba2+, and Cd2+ to calcite. Geochim. Cosmochim. Acta 60,
1053–1063.
Shaheen R. and Senn J. P. (2005) Quantification of polysaccharidesin water using capillary electrophoresis. Int. J. Environ. Anal.
Chem. 85, 177–198.
Voronkov V. V. and Rashkovich L. N. (1992) Effect of mobileadsorbed impurity on step movement. Sov. Phys.-Crystallogr.
37, 559–570.
Inhibition of calcite growth by alginate 3955
Voronkov V. V. and Rashkovich L. N. (1994) Step kinetics in thepresence of mobile adsorbed impurity. J. Crystal Growth 144,
107–115.
Wang L., De Yoreo J. J., Guan X., Qiu S. R., Hoyer J. R. andNancollas G. H. (2006) Constant composition studies verify theutility of the Cabrera–Vermilyea (C–V) model in explainingmechanisms of calcium oxalate monohydrate crystallization.Crystal growth Des. 6, 1769–1775.
Weaver M. L., Qiu S. R., Hoyer J. R., Casey W. H., Nancollas G.H. and De Yoreo J. J. (2007) Inhibition of calcium oxalatemonohydrate growth by citrate and the effect of the back-ground electrolyte. J. Crystal Growth 306, 135–145.
Welch S. A., Barker W. W. and Banfield J. F. (1999) Microbialextracellular polysaccharides and plagioclase dissolution. Geo-
chim. Cosmochim. Acta 63, 1405–1419.
Wilbur K. M. and Bernhardt A. M. (1984) Effects of amino acids,magnesium, and molluscan extrapallial fluid on crystallizationof calcium carbonate: in vitro experiments. Biol. Bull. 166, 251–
259.
Associate editor: Robert H. Byrne
Related Documents