205 Inhaled Technosphere ® Insulin in Comparison to Subcutaneous Regular Human Insulin: Time Action Profile and Variability in Subjects with Type 2 Diabetes Klaus Rave, M.D., 1 Tim Heise, M.D., 1 Lutz Heinemann, Ph.D., 1 and Anders H. Boss, M.D. 2 Author Affiliations: 1 Profil Institute for Metabolic Research, Neuss, Germany, and 2 MannKind Corporation, Paramus, New Jersey Abbreviations: (AUC) area under the curve, (BMI) body mass index, (Cmax) maximum plasma concentration, (CV) coefficient of variation, (FDKP) fumaryl diketopiperazine, (GIR) glucose infusion rate, (HbA1c) hemoglobin A1c, (INS) insulin, (sc RHI) subcutaneous regular human insulin, (TI) Technosphere Insulin, (TIU) Technosphere Insulin unit Keywords: absorption, diabetes, inhaled insulin, postprandial glucose, Technosphere Insulin, variability Corresponding Author: Klaus Rave, M.D., Profil Institute for Metabolic Research, Hellersbergstr. 9, 41460 Neuss, Germany; email address klaus.rave@profil-research.de Journal of Diabetes Science and Technology Volume 2, Issue 2, March 2008 © Diabetes Technology Society ORIGINAL ARTICLES Abstract Background: This study assessed time action profile and within- and between-subject variability of inhaled Technosphere ® Insulin (TI) compared with subcutaneous regular human insulin (sc RHI). Methods: Thirteen subjects with type 2 diabetes (age 56 ± 7 years, body mass index 30.4 ± 3.0 kg·m -2 ; hemoglobin A1c 6.9 ± 0.9%; mean ± SD) participated in this six-period crossover isoglycemic glucose clamp study. In randomized order, each subject received three single doses of TI and sc RHI on separate study days. Results: Inhalation of TI resulted in a higher maximum serum insulin concentration (858 vs 438 pmol·liter -1 ; p = 0.0001) and shorter intervals to maximum insulin concentration (17 vs 135 minutes; p = 0.0001) than sc RHI. Overall, 48 units of TI and 24 units of sc RHI provided comparable 3-hour insulin exposure (INS area under the curve 0-3 h 55.8 vs 60.0 nmol·min·liter -1 , respectively). Time to maximum metabolic effect was shorter (79 vs 293 minutes; p < 0.0001), and percentage of glucose disposal during the first 3 hours was higher for TI compared with sc RHI (59 vs 27%). Within-subject variabilities of insulin exposure following inhalation of TI for 2 and 3 hours and end of study period were 19, 18, and 16% as compared with 27, 25, and 15% after sc RHI injection (p = not significant). Conclusion: Technosphere Insulin has a more rapid onset of action than sc RHI. About 60% of the glucose-lowering effect of TI occurs during the first 3 hours after application. In contrast, <30% of the glucose-lowering effect of sc RHI occurs in this period. Technosphere Insulin demonstrated a lower intrasubject variability during the 3-hour postprandial period, without reaching statistical significance. J Diabetes Sci Technol 2008;2(2):205-212

Welcome message from author
This document is posted to help you gain knowledge. Please leave a comment to let me know what you think about it! Share it to your friends and learn new things together.
Transcript

205
Inhaled Technosphere® Insulin in Comparison to Subcutaneous Regular Human Insulin: Time Action Profile and Variability
in Subjects with Type 2 Diabetes
Klaus Rave, M.D.,1 Tim Heise, M.D.,1 Lutz Heinemann, Ph.D.,1 and Anders H. Boss, M.D.2
Author Affiliations: 1Profil Institute for Metabolic Research, Neuss, Germany, and 2MannKind Corporation, Paramus, New Jersey
Abbreviations: (AUC) area under the curve, (BMI) body mass index, (Cmax) maximum plasma concentration, (CV) coefficient of variation, (FDKP) fumaryl diketopiperazine, (GIR) glucose infusion rate, (HbA1c) hemoglobin A1c, (INS) insulin, (sc RHI) subcutaneous regular human insulin, (TI) Technosphere Insulin, (TIU) Technosphere Insulin unit
Keywords: absorption, diabetes, inhaled insulin, postprandial glucose, Technosphere Insulin, variability
Corresponding Author: Klaus Rave, M.D., Profil Institute for Metabolic Research, Hellersbergstr. 9, 41460 Neuss, Germany; email address [email protected]
Journal of Diabetes Science and Technology Volume 2, Issue 2, March 2008 © Diabetes Technology Society
ORIGINAL ARTICLES
AbstractBackground:This study assessed time action profile and within- and between-subject variability of inhaled Technosphere® Insulin (TI) compared with subcutaneous regular human insulin (sc RHI).
Methods:Thirteen subjects with type 2 diabetes (age 56 ± 7 years, body mass index 30.4 ± 3.0 kg·m-2; hemoglobin A1c 6.9 ± 0.9%; mean ± SD) participated in this six-period crossover isoglycemic glucose clamp study. In randomized order, each subject received three single doses of TI and sc RHI on separate study days.
Results:Inhalation of TI resulted in a higher maximum serum insulin concentration (858 vs 438 pmol·liter-1; p = 0.0001) and shorter intervals to maximum insulin concentration (17 vs 135 minutes; p = 0.0001) than sc RHI. Overall, 48 units of TI and 24 units of sc RHI provided comparable 3-hour insulin exposure (INS area under the curve0-3 h
55.8 vs 60.0 nmol·min·liter-1, respectively). Time to maximum metabolic effect was shorter (79 vs 293 minutes; p < 0.0001), and percentage of glucose disposal during the first 3 hours was higher for TI compared with sc RHI (59 vs 27%). Within-subject variabilities of insulin exposure following inhalation of TI for 2 and 3 hours and end of study period were 19, 18, and 16% as compared with 27, 25, and 15% after sc RHI injection (p = not significant).
Conclusion:Technosphere Insulin has a more rapid onset of action than sc RHI. About 60% of the glucose-lowering effect of TI occurs during the first 3 hours after application. In contrast, <30% of the glucose-lowering effect of sc RHI occurs in this period. Technosphere Insulin demonstrated a lower intrasubject variability during the 3-hour postprandial period, without reaching statistical significance.
J Diabetes Sci Technol 2008;2(2):205-212

206
Inhaled Technosphere® Insulin in Comparison to Subcutaneous Regular Human Insulin: Time Action Profile and Variability in Subjects with Type 2 Diabetes Rave
www.journalofdst.orgJ Diabetes Sci Technol Vol 2, Issue 2, March 2008
Introduction
The therapeutic goal in subjects with diabetes on insulin treatment is to maintain a tight glycemic control preferentially through an insulin regimen that closely mimics physiological insulin secretion. The Diabetes Control and Complications Trial firmly established the value of tight glycemic control in preventing or delaying the development of long-term diabetes-related complications.1 During recent years, a body of evidence has emerged that postprandial hyperglycemia, as distinct from overall glycemia, is a direct and independent risk factor for diabetes-related diseases.2–7
Using conventional subcutaneous regular human insulin (sc RHI) to cover postprandial insulin needs has some drawbacks. For instance, sc RHI has a slower onset of action, a later maximum activity, and a longer duration of action than rapid-acting insulin analogs and inhaled insulin formulations.8–11 Furthermore, there is considerable variability in the metabolic effects of insulin formulations, both from dose to dose within one subject (within-subject variability) and between subjects (between-subject variability). The development of inhaled insulin has raised the hope of a lower variability because insulin is absorbed from the lungs in a kinetically more advantageous manner than from the subcutaneous injection site.12 However, in healthy subjects, the reproducibility of the effect of inhaled insulin was comparable to that of sc RHI.13 Likewise, studies in subjects with type 2 diabetes showed no differences in variability between an inhaled insulin formulation and sc RHI.14,15 In contrast, a slightly lower within-subject variability of an inhaled insulin, with respect to its pharmacokinetic and pharmacodynamic summary measures, could be demonstrated in one study in subjects with type 1 diabetes.16
Technosphere® Insulin (TI; MannKind Corporation, Valencia, CA) is a formulation of RHI designed for efficient pulmonary administration of insulin17 that demonstrates unique pharmacokinetic and pharmacodynamic properties compared with sc RHI, insulin analogs, and other inhaled insulins.18 This inhalation dry powder was prepared by loading recombinant human insulin (Sanofi-Aventis, Frankfurt/Main, Germany) onto microparticles of self-assembled fumaryl diketopiperazine (FDKP) molecules.17 The time to maximum serum insulin concentration with TI is approximately 10–14 minutes and almost complete insulin absorption occurs within 3 hours.19,20 The aim of this study was to compare the time action profiles of TI in conjunction with the within- and between-subject
variability of insulin absorption and the metabolic effect of repeated doses of TI vs sc RHI in subjects with type 2 diabetes.
Method
Study Design and VolunteersThirteen nonsmoking subjects with type 2 diabetes of either gender, between the ages of 18 and 65 years, with a body mass index (BMI) <35 kg·m-2 and hemoglobin A1c (HbA1c) ≤9% were enrolled in the study. Subjects were required to have normal pulmonary function (at least 80% of predicted forced vital capacity, forced expiratory volume in 1 second, and vital capacity) and to have followed a regimen of intensified insulin therapy (defined as separate injections of basal and prandial insulin with at least three insulin injections per day) for the last 6 months. Exclusion criteria included prandial regular insulin doses of >30 units, treatment with oral antidiabetic agents, evidence of severe secondary diabetes complications, and history of chronic pulmonary diseases. The study was approved by the local ethics committee and was carried out in accordance with the principles of the Declaration of Helsinki and of Good Clinical Practice. Subjects gave written informed consent after a detailed oral and written explanation of the study procedures.
This prospective, controlled, open-label, randomized, replicated, six-period crossover study was conducted at one study center (Profil Institute for Metabolic Research, Neuss, Germany). The sample size was decided empirically, and triplicate administration of each study drug was implemented to provide additional power. There were a total of eight visits, including an initial screening visit (visit 0) and a final visit (visit 7), during which subjects underwent a physical examination, 12-lead electrocardiogram recording, and clinical laboratory tests. Pulmonary function was measured at each visit (PC Classic Spirometrics, MannKind Corporation). At the treatment visits (visits 1–6), isoglycemic glucose clamp procedures were performed. At each visit, subjects received either 48 units of TI (48 TIU) or 24 units of sc RHI (U100 Actrapid HM®, Novo Nordisk, Bagsvaerd, Denmark), so that each subject received three doses of TI and three doses of sc RHI. The TI dose was selected based on a previous meal challenge study that supported 48 TIU as a relevant clinical dose.21 The sc RHI dose was estimated to provide similar glucose-lowering activity over 3 hours, which would be a clinically relevant time

207
Inhaled Technosphere® Insulin in Comparison to Subcutaneous Regular Human Insulin: Time Action Profile and Variability in Subjects with Type 2 Diabetes Rave
www.journalofdst.orgJ Diabetes Sci Technol Vol 2, Issue 2, March 2008
for comparison. TI was administered via a MedTone® inhaler (MannKind Corporation), and sc RHI was injected in the abdominal region by means of a syringe. The treatment visits were separated by a washout period of 2–14 days. On the evening prior to the study days—during which, apart from the study medication applied, an identical experimental procedure was followed—no food intake was permitted after 8 p.m. At this time, subjects injected their last dose of basal insulin. Subjects taking insulin glargine injected their last dose no later than 7 a.m. on the previous morning. At 2 a.m. on the day of the glucose clamp procedure, subjects measured their blood glucose concentration and were instructed to inject no more than 10 units of sc RHI in case the blood glucose measured >151 mg/dl. Subjects randomized to receive TI were trained in the correct use of the MedTone inhaler using empty cartridges prior to study drug administration.
Technosphere Insulin was provided in standardized cartridges containing 24 TIU each. The cartridges are designed specifically for the MedTone inhaler, which is a high-resistance, dry powder device.
Glucose Clamp ProcedureAt 4–6 hours before administration of the study drug, an individual intravenous insulin infusion (Actrapid HM) was administered by means of a precision pump (infusion pump, Midpress TE*171CW3, Terumo, Tokyo, Japan) in order to adjust the subject’s blood glucose to a target level of 120 ± 18 mg/dl. One hour prior to study drug administration, the insulin infusion rate was lowered to a minimum level where blood glucose remained stable within the target range. All insulin infusion was stopped completely at the time of study drug administration. At time point zero, subjects either inhaled TI via the MedTone inhaler or injected sc RHI into the lower right quadrant of the abdomen.
Following drug administration, an isoglycemic glucose clamp procedure was commenced using a Biostator (glucose-controlled insulin infusion system; Life Science Instruments, Elkhardt, IN) to keep constant arterialized venous blood glucose at 120 ± 18 mg/dl. Continuous sampling of arterialized venous blood by the Biostator was enabled by placing the subject’s left hand in a box warmed to an air temperature of 55°C. Glucose requirements were calculated on the basis of the actual blood glucose concentrations measured by the Biostator on a minute-to-minute basis. A 20% glucose solution matching the subject’s glucose requirements was automatically infused by the Biostator using its built-
in pumps with glucose infusion rates registered for 9 hours. Blood glucose measurements by the Biostator were cross-checked in 30-minute intervals using blood glucose measurements based on a glucose oxidase reference method (Super GL, Hitado Dellecke-Möhnesee, Germany).
Blood samples were collected at regular intervals for later measurement of serum insulin, C-peptide, and FDKP concentrations. Serum insulin was measured using a microparticle enzyme immunoassay (IMx Insulin Assay, Abbott Laboratories, Wiesbaden, Germany). The C-peptide concentration was measured using a commercially available human C-peptide radioimmunoassay kit (Linco Research, St. Charles, MO). FDKP analysis was performed at XenoBiotic Laboratories, Inc. (Plainsboro, NJ).
Statistical AnalysisPharmacokinetic parameters, including maximum serum insulin concentration (INS-Cmax), time to INS-Cmax (INS-Tmax), time from INS-Tmax to 50% of INS-Cmax (late 50% INSmax), and fractional and total insulin areas under the curve (INS-AUC0-2 h, INS-AUC0-3 h, and INS-AUC0-9 h), were derived from the serum insulin profiles. The pharmacodynamic parameters, including maximum glucose infusion rate (GIRmax), time to GIRmax (GIR-Tmax), and fractional and total GIR AUCs (GIR-AUC0-2 h, GIR-AUC0-3 h, GIR-AUC0-6 h, and GIR-AUC0-9 h), were derived from the GIR profiles. No adjustment for baseline values was made calculating pharmacokinetic or pharmacodynamic parameters because the basal intravenous insulin infusion was discontinued at dosing; therefore, insulin levels measured after this time point would represent the experimental drug. After discontinuation of the basal insulin dose, there is a brief period until this insulin is cleared; however, the very short half-life of intravenous insulin and the very low starting insulin concentration relative to that generated by the experimental drug make this contribution negligible. All AUCs were calculated applying the trapezoidal rule. GIR profiles were smoothed using a polynominal function of the sixth order to allow the assessment of GIRmax and GIR-Tmax. The pharmacokinetic and pharmacodynamic parameters were analyzed using a mixed-effect analysis of variance with factors for treatment sequence, subjects (nested within sequence), period, and treatment included in the model. Within- and between-subject variability of TI and sc RHI treatments across pharmacokinetic and pharmacodynamic summary measures were calculated using a mixed model based on untransformed data and were expressed as the coefficient of variation (CV [%]=SD/mean × 100). The between-subject variability

208
Inhaled Technosphere® Insulin in Comparison to Subcutaneous Regular Human Insulin: Time Action Profile and Variability in Subjects with Type 2 Diabetes Rave
www.journalofdst.orgJ Diabetes Sci Technol Vol 2, Issue 2, March 2008
was estimated after adjusting for the within-subject variability. For comparison of CV%, a t test was used owing to the relative robustness for assumptions of normal distribution. The confidence interval for CV was calculated as CV/sqrt(2* ). All volunteers who completed the study were included in the pharmacokinetic and pharmacodynamic analyses. Safety analyses were based on all enrolled subjects. Statistical analyses were done using SAS (version 8.02; SAS Institute, Cary, NC). A p value <0.05 was regarded as statistically significant. Values given are mean ± SD throughout the text.
ResultsThirteen subjects with type 2 diabetes (10 males, 3 females, age 56 ± 7 years, BMI 30.4 ± 3.0 kg·m-2, HbA1c 6.9 ± 0.9%) were enrolled in the study. One subject (female) was excluded after visit 3 because of a serious adverse event (pneumonia); 12 subjects in all completed the study. Mean blood glucose during isoglycemic glucose clamp procedures was maintained close to the target level of 120 ± 18 mg/dl for TI inhalation and sc RHI injection (124 ± 4 vs 121 ± 2 mg/dl). Also, cumulative insulin infusion rates prior to the application of either TI or sc RHI were comparable (6.9 ± 4.0 vs 7.2 ± 3.7 U), as were
the basal insulin levels (146.5 ± 93.8 and 159.7 ± 102.8 pmol·liter-1).
PharmacokineticsTime to maximum insulin concentration (INS-Tmax) and time to late 50% INSmax were approximately 120 and 320 minutes shorter with 48 TIU than with 24 units of sc RHI (both p < 0.0001; Table 1, Figure 1A). The maximum serum insulin concentration (INS-Cmax) was about twice as high with TI as with sc RHI (p = 0.0001). Insulin exposure during the first 3 hours (INS-AUC0-3 h) was comparable for TI and sc RHI (55.8 vs 60.0 nmol·min·liter-1). In contrast, total insulin exposure (INS-AUC0-9 h) was lower with TI than with sc RHI (p < 0.0001).
Within-subject variability of early insulin exposure (i.e., for the first 2 or 3 hours following administration) was numerically lower with TI than with sc RHI (Table 2). Within-subject variability for the 9-hour study duration was similar for the two treatments. Within-subject variability of INS-Cmax was numerically lower with TI than with
Table 1.Pharmacokinetic and Pharmacodynamic Summary Measures after Inhalation of 48 TIU or 24 Units of sc RHI a
Inhaled TI sc RHI
Pharmacokinetics
INS-Cmax (pmol·liter -1) 858 ± 306* 438 ± 70
INS-Tmax (min) 17 ± 6* 135 ± 68
Late 50% INSmax (min) 51 ± 20* 368 ± 190
INS-AUC0-2 h (nmol·min·liter -1) 48.4 ± 15.5* 38.3 ± 7.6
INS-AUC0-3 h (nmol·min·liter -1) 55.8 ± 17.8 60.0 ± 10.0
INS-AUC0-9 h (nmol·min·liter -1) 86.0 ± 30.1* 155.5 ± 30.6
Pharmacodynamics
GIRmax (mg·min·kg-1) 4.5 ± 1.0* 5.5 ± 1.4
GIR-Tmax (min) 79 ± 47* 293 ± 83
GIR-AUC0-2 h (mg·kg-1) 265 ± 83 211 ± 84
GIR-AUC0-3 h (mg·kg-1) 355 ± 119 363 ± 153
GIR-AUC0-6 h (mg·kg-1) 503 ± 195* 920 ± 388
GIR-AUC0-9 h (mg·kg-1) 601 ± 229* 1325 ± 474
a Mean ± SD of three different study days for TI and sc RHI in 12 subjects with type 2 diabetes.
*p < 0.05 TI vs sc RHI.
Figure 1. (A) Mean serum insulin concentrations and (B) glucose infusion rates (GIRs, polynomial function applied) registered in 12 subjects with type 2 diabetes during three isoglycemic glucose clamp procedures each after inhalation of 48 TIU (black line) or 24 units of sc RHI (gray line).
seru
m in
sulin
(pm
ol·li
ter -1
)G
IR (m
g·kg
-1·m
in-1)
A
B

209
Inhaled Technosphere® Insulin in Comparison to Subcutaneous Regular Human Insulin: Time Action Profile and Variability in Subjects with Type 2 Diabetes Rave
www.journalofdst.orgJ Diabetes Sci Technol Vol 2, Issue 2, March 2008
sc RHI (20.4 vs 29.2%). Between-subject variability was greater with TI than with sc RHI at 0–3 and 0–9 hours, as was between-subject variability in INS-Cmax (p < 0.01).
PharmacodynamicsThe GIR AUC0-3 h was similar for the two treatments, but the distribution of the total glucose-lowering effect was significantly different between TI and RHI (p < 0.05; Table 1, Figure 1B). The GIR-Tmax was approximately 200 minutes earlier with TI than with sc RHI (p < 0.0001). Although total and maximal glucose disposals (GIR-AUC0-9 h
and GIRmax) were less with TI than with sc RHI (p < 0.0001 and p = 0.004, respectively), the majority (i.e., 59%) of the total glucose-lowering effect of TI (GIR-AUC0-9 h) was delivered during the 0- to 3-hour postdosing period, compared with only about 27% of the total effect of sc RHI.
Within-subject variability of glucose disposal for the first 2–3 hours following administration (GIR-AUC0-2 h and GIR-AUC0-3 h) tended to be lower with TI than with sc RHI (p = not significant; Table 2, Figures 2A and 2B). Conversely, within-subject variability of total and maximum glucose (GIR-AUC0-9 h and GIRmax) disposal was numerically higher with TI than with sc RHI. Between-subject variability for GIR-AUC0-9 h was greater than within-subject variability and was similar for both treatments.
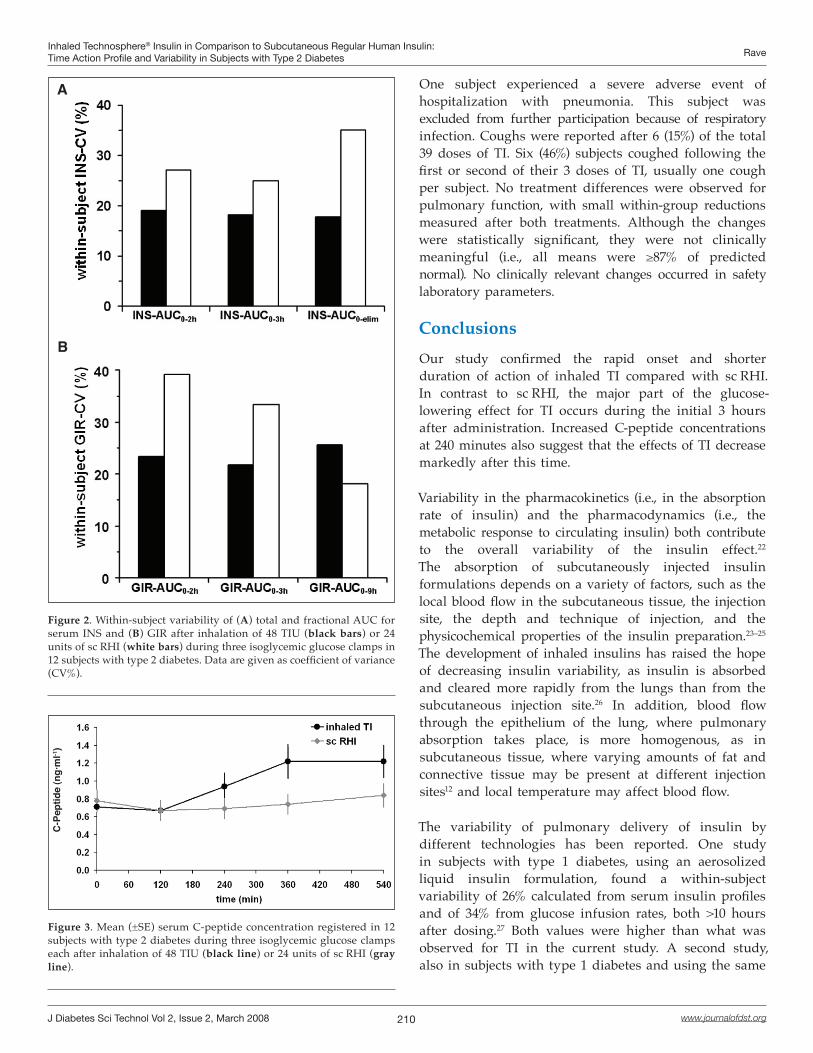
C-peptideSerum C-peptide concentrations did not increase significantly above baseline levels during the 9 hours following sc RHI treatment. In contrast, there was a substantial increase after 2 hours, reaching maximal values 6 hours following TI treatment that were sustained during the rest of the observation period. This indicates a transition from an exogenous to an endogenous source of insulin levels measured (Figure 3). Using GIR-AUC0-6 h as an estimate of the total TI-induced effect, the fraction of the effect delivered by TI within the initial 3 hours was approximately 71%.
Fumaryl Diketopiperazine The profile of FDKP in plasma was similar at the first and last administrations of TI (data not shown). Maximum concentrations of FDKP were reached by 15 minutes postdose, and the mean half-life was about 157 minutes. At 9 hours postdose, FDKP concentrations were about 10% of the maximum values.
SafetyOverall, seven treatment-emergent adverse events occurred during the study, five of them during periods following sc RHI treatment and two following TI treatment. Most were mild to moderate in severity and none were considered related to the study drug.
Table 2.Within- and Between-Subject Variability of Pharmacokinetic and Pharmacodynamic Summary Measures after Inhalation of 48 TIU or 24 Units of sc RHI a
Inhaled TI sc RHI
Within-subject CV (%) Between-subject CV (%) Within-subject CV (%) Between-subject CV (%)
Pharmacokinetics
INS-Cmax 20.4 [12.1, 28.8] 25.8 [15.2, 36.3]* 29.2 [17.3, 41.2] 7.8 [4.6, 11.0]
INS-AUC0-2 h 19.1 [11.3, 26.9] 25.1 [14.8, 35.3] 27.1 [16.1, 38.2] 14.9 [8.8, 21.0]
INS-AUC0-3 h 18.2 [10.8, 25.6] 24.7 [14.6, 34.7]* 25.0 [14.8, 35.2] 10.2 [6.0, 14.3]
INS-AUC0-9 h 15.9 [9.4, 22.3] 26.1 [15.4, 36.8]* 14.7 [8.7, 20.8] 10.2 [6.0, 14.3]
Pharmacodynamics
GIRmax 22.0 [13.0, 30.9] 20.1 [11.9, 28.3] 17.3 [10.3, 24.4] 25.9 [20.6, 31.2]
GIR-AUC0-2 h 23.4 [13.9, 33.0] 31.0 [18.4, 43.7] 39.2 [23.2, 55.2] 35.8 [21.2, 50.4]
GIR-AUC0-3 h 21.7 [12.9, 30.6] 34.4 [20.4, 48.5] 33.4 [19.8, 47.1] 39.7 [23.5, 55.9]
GIR-AUC0-6 h 24.8 [15.5, 34.1] 39.5 [28.9, 50.2] 21.8 [17.4, 26.2] 42.8 [37.4, 48.2]
GIR-AUC0-9 h 25.7 [15.2, 36.1] 37.8 [22.4, 53.3] 18.1 [10.7, 25.5] 38.2 [22.6, 53.8]
a Mean of three different study days for TI or sc RHI in 12 subjects with type 2 diabetes. Coefficient of variation (%) [95% confidence interval].
*p < 0.01 for TI vs sc RHI.
210
Inhaled Technosphere® Insulin in Comparison to Subcutaneous Regular Human Insulin: Time Action Profile and Variability in Subjects with Type 2 Diabetes Rave
www.journalofdst.orgJ Diabetes Sci Technol Vol 2, Issue 2, March 2008
One subject experienced a severe adverse event of hospitalization with pneumonia. This subject was excluded from further participation because of respiratory infection. Coughs were reported after 6 (15%) of the total 39 doses of TI. Six (46%) subjects coughed following the first or second of their 3 doses of TI, usually one cough per subject. No treatment differences were observed for pulmonary function, with small within-group reductions measured after both treatments. Although the changes were statistically significant, they were not clinically meaningful (i.e., all means were ≥87% of predicted normal). No clinically relevant changes occurred in safety laboratory parameters.
ConclusionsOur study confirmed the rapid onset and shorter duration of action of inhaled TI compared with sc RHI. In contrast to sc RHI, the major part of the glucose-lowering effect for TI occurs during the initial 3 hours after administration. Increased C-peptide concentrations at 240 minutes also suggest that the effects of TI decrease markedly after this time.
Variability in the pharmacokinetics (i.e., in the absorption rate of insulin) and the pharmacodynamics (i.e., the metabolic response to circulating insulin) both contribute to the overall variability of the insulin effect.22 The absorption of subcutaneously injected insulin formulations depends on a variety of factors, such as the local blood flow in the subcutaneous tissue, the injection site, the depth and technique of injection, and the physicochemical properties of the insulin preparation.23–25 The development of inhaled insulins has raised the hope of decreasing insulin variability, as insulin is absorbed and cleared more rapidly from the lungs than from the subcutaneous injection site.26 In addition, blood flow through the epithelium of the lung, where pulmonary absorption takes place, is more homogenous, as in subcutaneous tissue, where varying amounts of fat and connective tissue may be present at different injection sites12 and local temperature may affect blood flow.
The variability of pulmonary delivery of insulin by different technologies has been reported. One study in subjects with type 1 diabetes, using an aerosolized liquid insulin formulation, found a within-subject variability of 26% calculated from serum insulin profiles and of 34% from glucose infusion rates, both >10 hours after dosing.27 Both values were higher than what was observed for TI in the current study. A second study, also in subjects with type 1 diabetes and using the same
Figure 2. Within-subject variability of (A) total and fractional AUC for serum INS and (B) GIR after inhalation of 48 TIU (black bars) or 24 units of sc RHI (white bars) during three isoglycemic glucose clamps in 12 subjects with type 2 diabetes. Data are given as coefficient of variance (CV%).
A
B
Figure 3. Mean (±SE) serum C-peptide concentration registered in 12 subjects with type 2 diabetes during three isoglycemic glucose clamps each after inhalation of 48 TIU (black line) or 24 units of sc RHI (gray line).
C-P
eptid
e (n
g·m
l-1)

211
Inhaled Technosphere® Insulin in Comparison to Subcutaneous Regular Human Insulin: Time Action Profile and Variability in Subjects with Type 2 Diabetes Rave
www.journalofdst.orgJ Diabetes Sci Technol Vol 2, Issue 2, March 2008
formulation, found a within-subject variability of 27% for insulin absorption and 30% for glucose infusion.16 Finally, the within-subject variability of liquid aerosol-inhaled insulin, using an electronic nebulizer, was compared with that of sc RHI in subjects with type 2 diabetes. The within-subject variability for the appearance of insulin and total metabolic effect was 16 and 22%, respectively, and was comparable to that obtained by sc RHI.14 In our study, the within-subject variability of insulin exposure with TI was numerically lower than with sc RHI over the 0- to 2-hour and 0- to 3-hour time intervals. In the case of pharmacokinetic and pharmacodynamic studies, the sample sizes usually preclude having enough power to make definitive conclusions, particularly because of the larger variability in pharmacodynamic parameters; such was also the case with this study. We recognize these limitations, but believe that the consistent results in the current study permit a qualitative interpretation. The within-subject variability for the entire study period (9 hours) was similar for TI and RHI. The within-subject variability in the metabolic effect was also numerically lower with TI than with sc RHI in the earlier time intervals, but it was slightly higher over the 0- to 9-hour interval. Various elements of normal day-to-day activities may also affect the variability of inhaled insulin, although currently available information is very limited.
Technosphere Insulin delivered the majority of the glucose-lowering effect during the first 3 hours after inhalation (represented by approximately 71% of total GIR), in contrast to sc RHI, which only delivered 27% of GIR. This is because of the very fast and steep onset of action with TI approaching that of the intravenous injection of RHI.20 No other clinically useful insulin formulation has demonstrated a similarly rapid onset of action.17 To obtain a similar glucose-lowering activity as TI during the crucial initial 3 hours following sc RHI administration, a larger total dose of sc RHI would be required. The large residual activity (i.e., 73%) following sc RHI administration after 3 hours might easily require the intake of an additional snack to prevent late hypoglycemia.
In contrast, the pharmacokinetic and pharmacodynamic profiles of TI seem to be more suitable to cover prandial insulin requirements, although this remains to be shown under daily live conditions in adequately designed long-term outpatient studies.
The safety profile of TI observed in this study did not cause any clinical concerns. No adverse event was judged to be inhaler or drug related, and no clinically significant
changes in lung function (forced vital capacity, forced expiratory volume in 1 second, and vital capacity) or clinical chemistry were observed throughout the study. A reduction in hemoglobin and hematocrit was observed, which was considered related to the blood draw volume during the study (525 ml). Cough, which is a common epiphenomenon of inhaled insulin therapy, occurred after 15% of doses were administered, usually as a single episode per subject after one of their three doses. Subjects experiencing cough did not have any symptom suggestive of respiratory distress. An assessment of the long-term safety of TI will require appropriately designed long-term studies.
The tendency for a lower variability in insulin absorption, rapid onset of action, and shorter duration of effects makes this drug more suitable for the replacement of prandial insulin secretion in subjects with type 2 diabetes. It is also possible that these characteristics may translate into a lower risk of postprandial hypoglycemia. These findings will need to be confirmed in larger, long-term trials of clinical use.
Funding:
This study was funded by MannKind Corporation, Valencia, California.
Disclosure:
Dr. Boss is employed by MannKind Corporation.
References:
1. The Diabetes Control and Complications Trial Research Group. The effect of intensive treatment of diabetes on the development and progression of long-term complications in insulin-dependent diabetes mellitus. N Engl J Med. 1993;329(14):977-86.
2. de Vegt F, Dekker JM, Ruhe HG, Stehouwer CD, Nijpels G, Bouter LM, Heine RJ. Hyperglycaemia is associated with all-cause and cardiovascular mortality in the Hoorn population: the Hoorn Study. Diabetologia. 1999;42(8):926-31.
3. Hanefeld M, Koehler C, Schaper F, Fuecker K, Henkel E, Temelkova-Kurktschiev T. Postprandial plasma glucose is an independent risk factor for increased carotid intima-media thickness in non-diabetic individuals. Atherosclerosis. 1999;144(1):229-35.
4. Temelkova-Kurktschiev TS, Koehler C, Henkel E, Leonhardt W, Fuecker K, Hanefeld M. Postchallenge plasma glucose and glycemic spikes are more strongly associated with atherosclerosis than fasting glucose or HbA1c level. Diabetes Care. 2000;23(12):1830-4.
5. Ceriello A. The possible role of postprandial hyperglycaemia in the pathogenesis of diabetic complications. Diabetologia. 2003;46 Suppl 1:M9-16.
6. Home P. Contributions of basal and post-prandial hyperglycaemia to micro- and macrovascular complications in people with type 2 diabetes. Curr Med Res Opin. 2005;21(7):989-98.

212
Inhaled Technosphere® Insulin in Comparison to Subcutaneous Regular Human Insulin: Time Action Profile and Variability in Subjects with Type 2 Diabetes Rave
www.journalofdst.orgJ Diabetes Sci Technol Vol 2, Issue 2, March 2008
7. Qiao Q, Pyorala K, Pyorala M, Nissinen A, Lindstrom J, Tilvis R, Tuomilehto J. Two-hour glucose is a better risk predictor for incident coronary heart disease and cardiovascular mortality than fasting glucose. Eur Heart J. 2002;23(16):1267-75.
8. Heise T, Heinemann L. Rapid and long-acting analogues as an approach to improve insulin therapy: an evidence-based medicine assessment. Curr Pharm Des. 2001;7(14):1303-25.
9. Hirsch IB. Insulin analogues. N Engl J Med. 2005;352(2):174-83.
10. Heinemann L, Traut T, Heise T. Time-action profile of inhaled insulin. Diabet Med. 1997;14(1):63-72.
11. Heise T, Kapitza C, Hompesch M, Heinemann L. Inhaled insulin as alternative delivery system for subjects with diabetes--a literature review. Av Diabetol. 2005;21:91-102.
12. Patton JS, Bukar J, Nagarajan S. Inhaled insulin. Adv Drug Deliv Rev. 1999;35(2-3):235-47.
13. Heinemann L, Klappoth W, Rave K, Hompesch B, Linkeschowa R, Heise T. Intra-individual variability of the metabolic effect of inhaled insulin together with an absorption enhancer. Diabetes Care. 2000;23(9):1343-7.
14. Perera AD, Kapitza C, Nosek L, Fishman RS, Shapiro DA, Heise T, Heinemann L. Absorption and metabolic effect of inhaled insulin: intrapatient variability after inhalation via the Aerodose insulin inhaler in patients with type 2 diabetes. Diabetes Care. 2002;25(12):2276-81.
15. Kim D, Mudaliar S, Chinnapongse S, Chu N, Boies SM, Davis T, Perera AD, Fishman RS, Shapiro DA, Henry R. Dose-response relationships of inhaled insulin delivered via the Aerodose insulin inhaler and subcutaneously injected insulin in patients with type 2 diabetes. Diabetes Care. 2003;26(10):2842-7.
16. Kapitza C, Hompesch M, Scharling B, Heise T. Intrasubject variability of inhaled insulin in type 1 diabetes: a comparison with subcutaneous insulin. Diabetes Technol Ther. 2004;6(4):466-72.
17. Pfützner A, Forst T. Pulmonary insulin delivery by means of the Technosphere drug carrier mechanism. Expert Opin Drug Deliv. 2005;2(6):1097-106.
18. Heinemann L, Heise T. Current status of the development of inhaled insulin. Br J Diabetes Vasc Dis. 2004;4:295-301.
19. Pfützner A, Mann AE, Steiner SS. Technosphere/Insulin--a new approach for effective delivery of human insulin via the pulmonary route. Diabetes Technol Ther. 2002;4(5):589-94.
20. Steiner S, Pfützner A, Wilson BR, Harzer O, Heinemann L, Rave K. Technosphere/Insulin--proof of concept study with a new insulin formulation for pulmonary delivery. Exp Clin Endocrinol Diabetes. 2002;110(1):17-21.
21. Rave K, Heise T, Pfützner A, Boss AH. Coverage of postprandial blood glucose excursions with inhaled technosphere insulin in comparison to subcutaneously injected regular human insulin in subjects with type 2 diabetes. Diabetes Care. 2007;30(9):2307-8.
22. Heinemann L. Variability of insulin absorption and insulin action. Diabetes Technol Ther. 2002;4(5):673-82.
23. Galloway JA, Spradlin CT, Nelson RL, Wentworth SM, Davidson JA, Swarner JL. Factors influencing the absorption, serum insulin concentration, and blood glucose responses after injections of regular insulin and various insulin mixtures. Diabetes Care. 1981;4(3):366-76.
24. Hildebrandt P. Subcutaneous absorption of insulin in insulin-dependent diabetic patients. Influence of species, physico-chemical properties of insulin and physiological factors. Dan Med Bull. 1991;38(4):337-46.
25. Gin H, Hanaire-Broutin H. Reproducibility and variability in the action of injected insulin. Diabetes Metab. 2005;31(1):7-13.
26. Patton JS, Fishburn CS, Weers JG. The lungs as a portal of entry for systemic drug delivery. Proc Am Thorac Soc. 2004;1:338-44.
27. Brunner GA, Balent B, Ellmerer M, Schaupp L, Siebenhofer A, Jendle JH, Okikawa J, Pieber TR. Dose-response relation of liquid aerosol inhaled insulin in type I diabetic patients. Diabetologia. 2001;44(3):305-8.
Related Documents