Report No 25992-MOR KINGDOM OF MOROCCO COST ASSESSMENT OF ENVIRONMENTAL DEGRADATION June 30, 2003 Middle East and North Africa Region Water, Environment, Social and Rural Development Department Document of the World Bank

Welcome message from author
This document is posted to help you gain knowledge. Please leave a comment to let me know what you think about it! Share it to your friends and learn new things together.
Transcript
Report No 25992-MOR KINGDOM OF MOROCCO COST ASSESSMENT OF ENVIRONMENTAL DEGRADATION June 30, 2003 Middle East and North Africa Region Water, Environment, Social and Rural Development Department
Document of the World Bank

ii
Currency Equivalent
(Exchange rate effective January 2003)
Currency = Moroccan Dirham (Dh) US$1.00 = Dh 10.4
Fiscal Year July 1 - June 30
Vice-President: Jean-Louis Sarbib Maghreb Director: Théodore O. Ahlers Sector Director: Letitia A. Obeng Task Team Leader: Maria Sarraf
iii
Acknowledgements This report was prepared by a team consisting of Maria Sarraf (Task Team Leader) from the Water, Environment, Social and Rural Development Department in the Middle East and North Africa Region at the World Bank, Mr. Mohammed Belhaj (Environmental Economist, Consultant); and Mr. Abdeljaouad Jorio (Environmental Economist, Consultant). The team would like to thank for their support H.E. Mr. Mohamed El Yazghi, Minister of Urban Planning, Water and Environment (MATEE); Mr. Mohamed El Morabit, Secretary of State for Environmental Affairs; Mr. Ahmed Bouhaouli, Secretary General of the Secretariat of State for Environmental Affairs; Mr. Taha Belafrej, Director of the Secretariat of State for Environmental Affairs; Mr. Abdelfetah Sahibi, Head of the International Cooperation Division, and Mr. El Hassan Doumi, Administrator of the International Cooperation Division. The team would like to gratefully acknowledge all persons and institutions consulted during the preparation of this study. Contributions and observations to the study have been provided by Mr. Sherif Arif (Regional Environmental Coordinator, World Bank), Mr. Aziz Bouzaher (Lead Environmental Economist and Peer Reviewer), Mr. Bjorn Larsen (Environmental Economist, Consultant), and Mr. Anil Markandya (Lead Environmental Economist and Peer Reviewer). This report has been translated from its original French version. The team would also like to thank Ms. Anne Carlin for editing the report and Ms. Magalie Pradel for overall assistance.

iv
Table of contents Acronyms ……………………………………………………………………………………………………….vi Abstract 1. Introduction………………………………………………………………………………………….….2
1.1 Economic, political and social background 1.2 Environmental background 1.3 Cost of environmental degradation
2. Methodological framework …………………………………………………………………..…………6 2.1 Definition 2.2 General methodological approach 2.3 Categories of analysis
2.4 Assumptions 2.5 Monetary evaluation 2.6 Damage and remediation costs 2.7 Marginal analysis
3. Water…………………………………………………………………………….……………………….11 3.1 Water resources 3.2 Water and environment 3.3 Cost of degradation
3.3.1 Health and quality of life 3.3.2 Natural resources
3.4 Remediation costs 4. Air …………………………………………………………………………….………………………… 17 4.1 Sources of pollution
4.2 Environment and air pollution 4.3 Cost of air quality degradation
4.3.1 Urban air pollution 4.3.2 Indoor air pollution
4.4 Cost of remediation 5. Land and forests………………………………………………………………….………………..…….23 5.1 Land degradation
5.1.1 Method for estimating land degradation 5.1.2 Degradation of agricultural land 5.1.3 Rangeland degradation 5.1.4 Total cost of land degradation
5.2 Deforestation 5.2.1 Pressures on the forest 5.2.2 Forest functions 5.2.3 Estimating the cost of forest degradation
5.3 Remediation cost
6. Waste …………………………………..………………………………….………..……………..…….30 6.1 Pressures on the environment 6.2 Damage costs
6.2.1 Impact on health 6.2.2 Impact on natural resources 6.2.3 Total damage cost
v
7. Coastal zones and global environment…………………..………………..…………..………..……..33 7.1 Coastal zones 7.1.1 Coast and environment
7.1.2 Cost of degradation 7.2 Global environment
8. Conclusion…………………..……………………….…………………………………...………..…….37 Bibliography …………………..……………………….…………….……………………………………..…….40 Annexes Annex I Damage and remediation cost estimates Annex II Detailed estimates of indoor and urban air pollution, water, land, forest and coastal pollution List of Tables Table 1.1 Select performance indicators Table 2.1 Economic data, 2000 Table 3.1 Evolution of liquid discharges, 1992-2020 Table 3.2 Water: Annual damage costs (mean estimate, 2000) Table 3.3 Water: Annual remediation cost estimates Table 4.1 Demographic and transport sector data, 1970-2000 Table 4.2 Consumption of wood energy, 1994 Table 4.3 Air: dose-response coefficients Table 4.4 Air: estimate of DALYs Table 4.5 Air: annual damage costs (mean estimate, 2000) Table 4.6 Air: annual remediation costs Table 5.1 Land: level of degradation Table 5.2 Land: degree, spread, ranges and ranks of degradation according to FAO Table 5.3 Land degradation in Morocco (FAO, 2000) Table 5.4 Land degradation in Morocco due to agricultural activities (FAO, 2000) Table 5.5 Cost estimate of degraded cultivated land Table 5.6 Distribution of pastureland (million of hectares) Table 5.7 Loss in fodder production Table 5.8 Damage cost of rangeland degradation in 2000 Table 5.9 Use value and non-use values of the forest Table 5.10 Land and forests: Annual damage costs (mean estimate, 2000) Table 5.11 Annual remediation costs Table 6.1 Waste production estimates in 2000 Table 6.2 Environmental impacts of waste Table 6.3 Estimate of the quantity of water polluted by leachates Table 6.4 Waste: Annual damage cost (mean estimate, 2000) Table 7.1 Tourist arrivals in Morocco (thousands) Table 7.2 Evolution of catches from coastal fishing between 1995 and 2000 (tons) Table 7.3 Coast: annual damage cost (mean estimate, 2000) Table 8.1 Annual damage cost by environmental category in 2000 (mean estimate, percentage of GDP) List of Figures Figure 8.1 Annual damage cost by environmental category in 2000 (mean estimate percentage of GDP) Figure 8.2 Annual damage cost by economic category in 2000 (mean estimate percentage of GDP) List of Boxes Box 1. The difference between environmental degradation costs estimated in the 1992 Strategy and those of the present study.

vi
Acronyms
BOD5 Biological Oxygen Demand (after 5 days of sampling) COD Chemical Oxygen Demand CMPP Moroccan Center of Cleaner Production CVM Contingent valuation method DALY Disability adjusted life year Dh Moroccan dirham EIA Environmental Impact Assessment FAO United Nations Food and Agriculture Organization FNE National Environmental Fund FODEP Fund of Industrial Depollution FU Forage unit GDP Gross domestic product m3 Cubic meters MADREF Ministry of Agriculture, Rural Development, Water and Forests MAMVA Ministry of Agriculture and Agricultural Development MARD Ministry of Agriculture and Rural Development MATEE Ministry of Urban Planning, Water and Environment MENA Middle East North Africa Region (of the World Bank) METAP Mediterranean Environmental Technical Assistance Program MPS Matter and particles in suspension n.a. Not available NEAP National Environmental Action Plan NUV Non-use value OECD Organization for Economic Cooperation and Development ONEM National Environment Observatory of Morocco PM10 Particulate matter (matter and particles in suspension of less than 10 micro-meters) PS Particles in suspension ql Quintal (100 kg) qx Quintals RC Remediation cost REEM National State of the Environment Report in Morocco SIDE Système d’information et données sur l’environnement SO2 Sulfur dioxide TOE Ton of oil equivalent UNDP United Nations Development Program US$ United States dollar UV Use value WHO World Health Organization
WTP Willingness to pay

Unofficial translation of the original French version 1
Abstract This report is the first step in a process toward using environmental damage cost assessments for priority setting and as an instrument for integrating environmental issues into economic and social development. The report provides estimates of damage costs for several areas of the environment. The estimates should be considered as orders of magnitude and a range is provided to indicate the level of uncertainty. As areas of priority are identified, further analysis will be required to obtain more accurate estimates. The annual damage cost of environmental degradation in Morocco for 2000 is estimated at 2.75 to 4.65 percent of GDP, with a mean estimate of 3.7 percent of GDP,1 or close to Dh 13 billion per year. The cost of water resource degradation, and inadequate potable water, sanitation and hygiene is assessed at 1.0 to 1.45 percent of GDP. The cost of air pollution, both indoor and outdoor, is estimated at 0.6 to 1.5 percent of GDP. The cost of coastal zone degradation, inadequate solid waste management and soil degradation is estimated at around 0.5 percent of GDP. Of total damage, about 70 percent is from damage to health and quality of life, and 30 percent from natural resource degradation. Global damage associated with climate change caused by emissions of carbon dioxide is estimated at 0.9 percent of GDP. It should be noted that the damage cost of environmental degradation has not been estimated in several areas of the environment due to data limitations. These areas include industrial, hazardous and hospital waste
1 A similar exercise was undertaken in other Middle
Eastern and North African countries. The results showed that the average environmental damage cost in Egypt was estimated at 4.8 percent of GDP in 1999 (World Bank, 2002), 3.6 percent in 1999 in Algeria (MATE, 2002), 3.5 percent in 2001 in Syria (unpublished METAP report), 3.4 percent in 2000 in Lebanon (unpublished METAP report), and at 2.1 percent in 1999 in Tunisia (unpublished METAP report).
disposal, unsanitary landfills, degradation of natural ecosystems and biodiversity, and groundwater resource degradation and over-extraction. In addition, and due to the complexity of the problem, the report only partially captures damage resulting from soil degradation. The report points to the need to further assess and quantify current and future damage costs related to those impacts.
Damage costs by environmental category in 2000 (mean estimates, percent of GDP)
0.0%0.2%0.4%0.6%0.8%1.0%1.2%1.4%
Water Air Coast Waste Soil,Forest
Damage cost by economic category in 2000 (mean estimates, percent of GDP)
0.0%
0.4%
0.8%
1.2%
1.6%
2.0%
2.4%
2.8%
Health, Quality of life Natural resources
Unofficial translation of the original French version 2
1. Introduction 1.1 ECONOMIC, POLITICAL AND SOCIAL BACKGROUND 1.01 Morocco is currently witnessing a political transition where respect for the rule of law and fundamental liberties are increasing. The political openness of state officials and the emergence and development of civil society are further rooting the democratic process in Morocco. A major factor in this transition is the commitment of Morocco to universal human rights, as recorded in the Moroccan Constitutions of 1992 and 1996. An increase in decentralization allows responsibilities to be shared between central and local governments. The constitution also facilitates local community participation in the development process, as was spelled out in the 1976 council charter. New language will strengthen their role. Regionalization is stressed in this transition, and law 47/96 facilitates community action for the establishment of a regional development plan. 1.02 During the 1980s, the establishment of a structural adjustment program and related policies improved the macro-economic situation and restored fundamental balances. Current and budget deficits decreased, as did external debt. The dirham recovered its value. Among measures taken to encourage investment, it is important to mention the recent establishment of regional investment centers that act as real investment catalysts for the region through the information they provide and their commitment to facilitating administrative procedures. Creation of these centers reflects the willingness of politicians to modernize the Moroccan administration and make it an efficient tool to support socioeconomic development in Morocco. 1.03 Despite macroeconomic progress, economic growth did not achieve the level desired by state officials. The 3.1 percent growth rate (average for the period 1984 to 2000, 1995 U.S. dollars) was in fact inferior to the six percent rate considered necessary to support
population growth and living conditions for the people. Unequal distribution of growth, mostly reflected by increased poverty, especially in rural areas, adds to the existing situation. To survive, Moroccan farmers are forced to adopt unsustainable agricultural practices (lack of crop rotation, slope cultivation, exploiting soils of low ecological quality, etc.) that deplete the soil. The same behavior takes place in Moroccan forests that are also overexploited for energy purposes, explained to some degree by the rural populations’ limited access to electricity. On the other hand, intensification of agriculture through irrigation leads to water waste (propelled to some extent by under pricing) and the uncontrolled and excessive use of phytosanitary products and fertilizers, which have harmful effects on the environment and cause soil salinity and underground water pollution. 1.04 Access to basic social services (education, health, water, purification, energy, etc.) remains problematic for many Moroccans. Urbanization, fueled by rural migration that has been accelerated by ten years of drought, is reflected in the creation of suburban districts where public health conditions and hygiene remain critical issues due to water scarcity, water impurities and poor solid waste management. 1.05 Despite an increase in life expectancy over the last ten years (from 58 years in 1990 to 68 years in 2000), the health status of the Moroccan population is still of concern. Malnutrition mostly affects poor populations and infectious diseases are generally present. Given that poverty, a high level of illiteracy among women (table 1.1), and vulnerability help explain this situation, environmental degradation also negatively impacts health. Air pollution, caused by industries that have not integrated environmental concerns into their calculations and a transport sector characterized by an ageing and mostly diesel-powered vehicle fleet, is one of the reasons for respiratory illness. Due to failing solid and liquid waste purification

Unofficial translation of the original French version 3
systems, water pollution is reflected in the prevalence of waterborne diseases. 1.06 As indicated in table 1.1, CO2 consumption has increased considerably over the last ten years, the principle source of CO2 being fossil energy combustion followed by firewood and cement production. Table 1.1 Select performance indicators
Morocco 1990
Morocco 2000
MENA 2000
Rate of child mortality <5 yr (1,000 births)
85 46 56
GDP growth (annual average between 1990-2000)
2.6% 3.7%
Population growth (average between 1990-2000)
1.8% 2.3%
Life expectancy at birth (no. of years)
58 68 68
Illiteracy rates in adult females (% of women >15 yr)
75% 64% 47%
CO2 emission per capita (metric ton/capita.)
0.97 1.3 4.0
Energy efficiency GDP/unit of energy used (1995 $ /kg oil equivalent)
4.6 3.8 1.6
Source: World Bank, 2001 1.2 ENVIRONMENTAL BACKGROUND 1.07 Like other Mediterranean countries, Morocco faces environmental degradation that threatens the health of its population and risks impacting its future development. In response to increased environmental degradation in the 1980s and 1990s, Morocco prepared intervention plans and programs that had only minimal success due to their lack of focus. 1.08 1992 marked a turning point in political commitment with the creation of a ministerial department responsible for the environment and a restructuring of the National Council for the Environment, with the objective of improving and increasing the effectiveness of environmental policies and management.
1.09 Subsequently, an arsenal of legal measures was adopted. They are complemented with a series of legal texts and decrees addressing environmental pollution, waste and environmental protection. However, Moroccan environmental legislation was not able to slow environmental degradation sufficiently because a number of obstacles restrained its application. In fact, the national legal framework is out of date and filled with loopholes. It is also fragmented and characterized by shortcomings in the internal integration of provisions relating to international environmental conventions. Similarly, a number of application decrees have not come into effect yet. An example is law 10/95 relating to water, which predicts the application of the “polluter pays” principle. The law has not been implemented due to a lack of application texts. 1.10 The National Strategy for the Protection of the Environment and Sustainable Development2 was published in 1995. One of the strategy’s main objectives was to stabilize by 2005 the level of environmental degradation to 1992 levels, and then to further reduce degradation by 2020. 1.11 In 2002, Morocco developed a National Environmental Action Plan (NEAP, 2002). This plan was published following a series of actions conducted under the framework of “Capacity 21,” in which UNDP3 aims at strengthening the institutional capacities of developing countries. These actions, called “Action 30,” aim at mobilizing all actors (state, private enterprise and civil society) to implement projects centered on “Action 30.” They also propose the implementation of principles included in the National Strategy for Environmental Protection and Sustainable Development. 1.12 The NEAP follows up on the plans and programs launched during the 1980s and 1990s with an integrated and global vision. The programs include: the National Action Plan to Combat Desertification, the National Action 2 Ministry of Environment, 1995 3 United Nations Development Program

Unofficial translation of the original French version 4
Plan for the Protection of Biodiversity, the National Plan for Watershed Management, and the National Steering Plan for Reforestation. NEAP constitutes the outcome of the consultation process in which priority actions for environmental protection were identified. The cost of these actions is estimated at Moroccan Dh 2,233 million. NEAP also confirms international commitments to Morocco in the area of environmental protection through the signing and ratification of environmental conventions and international protocols. 1.13 An important effort is supplied in the area of environmental knowledge through the creation of the National Environment Observatory of Morocco (ONEM) and the establishment of a pollution control network. To centralize information and reduce duplication, an Environmental Data and Information System (Système d’Information et Données sur l’Environnement or SIDE) was created to collect all environmental data supplied by ministerial departments. 1.14 A series of actions was undertaken to encourage environmental protection and partner with the private sector. This included the creation of Funds for Industrial Depollution (FODEP), the Moroccan Center of Cleaner Production (CMPP), and the preparation of the National Environmental Fund (FNE) as an economic tool for environmental management to match, among other things, the demand of local communities. 1.3 COST OF ENVIRONMENTAL DEGRADATION 1.15 The “National Strategy for the Protection of the Environment and Sustainable Development” highlighted the necessity of conducting a series of actions for environmental protection. The strategy showed that in the absence of such action, environmental degradation in Morocco would be reflected in higher costs due to a lack of profit in the absence of an environmental protection policy focusing on preventive rather than remedial actions. The strategy cited the negative impacts of water
degradation (insufficient water purification) and air degradation on health that comprised the main component of the cost of environmental degradation in Morocco. 1.16 The strategy presented, for the first time, an assessment of the cost of environmental degradation for 1992. These costs reached Dh 19.7 billion or 8.2 percent of GDP. With the accumulation of data on the state of the environment and an improvement in estimation methodology, it became necessary to calculate the cost of environmental degradation on the bases of new informational and methodological approaches. This estimate is necessary to justify, from a socioeconomic and environmental point of view, actions aimed at protecting the environment and laying sustainable bases for growth. The difference between the results obtained in the 1992 strategy (8.2 percent of GDP) and those of the present study (3.7 percent of GDP) is explained mainly through improved methodologies used to estimate the costs of environmental degradation. In this way, the results of the two studies are not comparable because they utilize different evaluation methods. A special note concerning the subject is found in chapter 8 of this study. 1.17 The preparation of this study was initiated in August 2002. The objectives of the study are: • To assess the cost of environmental
degradation in Morocco, using the most recent data available (2000);
• To provide an analytical framework that can be applied periodically by professionals in Morocco to update and refine environmental assessments over time;
• To provide a basis for training programs for ministries and agencies to incorporate assessments of the cost of environmental degradation into the management of environmental resources.
1.18 A training manual that builds on the methodologies and results of the present study and those of other regional studies has been This manual has been used for training program in environmental economics in Morocco.

Unofficial translation of the original French version 5
1.19 Statistical data and calculations are presented in annex I. This file will allow Moroccan executives to familiarize themselves with calculation methods and the ability to update future estimates. 1.20 Finally, this study is part of a series of studies on environmental damage cost assessments supported by the Mediterranean Environmental Technical Assistance Program (METAP) that works in seven Middle East and North African countries: Algeria, Egypt, Jordan, Lebanon, Morocco, Tunisia and Syria.

Unofficial translation of the original French version 6
2. Methodological framework 2.1 DEFINITION 2.01 The objective of this section is to present the general methodological framework supporting the cost of environmental degradation estimates. 2.02 This study attempted to review the environmental problems generating the greatest environmental degradation costs. However, where data were not available, evaluation of certain environmental impacts was not possible. 2.03 Conceptually, the identification of environmental priorities is based on the analysis of efficiency measures (institutional and investment) to reduce environmental degradation and the establishment of a control and prevention system to conserve a desirable environmental quality (reflected by establishment of standards and laws). On a practical level, this requires an evaluation and comparison of environmental degradation costs, called damage costs, and the costs of reducing this degradation, remediation costs. 2.04 In this study, the assessment of remediation costs is incomplete (see section 2.4), and the comparison of a cost-benefit relationship for an environmental intervention was not possible. The main aim of this study is limited to the evaluation of damage costs related to environmental degradation. 2.05 The cost of environmental degradation can be understood as a measure of the lost welfare4 of a nation due to environmental degradation. Such a loss in welfare includes (but is not necessarily limited to):
(a) Loss of healthy life and well being of the population (e.g. premature death, increased health problems, absence of a clean environment, etc.);
4 Welfare loss
(b) Economic losses (e.g. reduced agricultural soil productivity, lower tourism revenues);
(c) Loss of environmental opportunities (e.g.: reduced recreational value of lakes, rivers, beaches, forests).
2.06 In this report, the cost of environmental degradation is expressed as a percentage of GDP.5 The latter is the market value of all goods and services produced during a year in Morocco. It is important to note that damage costs, as estimated in this study, are not an integral part of GDP. They were expressed as a percentage of GDP to compare them to other national economic indicators, such as the state budget or public spending in the field of the environment. This allows for a comparison of long term impacts. 2.07 If the cost of degradation (as a percentage of GDP) increases over time, it suggests that the welfare loss from environmental degradation is growing faster than GDP - that economic and human activity are having increasingly negative (environmental) impacts on a country relative to economic affluence. If the contrary is the case, it suggests that environmental impacts are decreasing relative to economic affluence. 2.2 GENERAL METHODOLOGICAL APPROACH 2.08 Environmental problems in Morocco result in direct negative impacts not only on economic activity and efficiency, but also on the population’s health and quality of life. The degradation of soil, forest and biodiversity affects agricultural productivity, the sustainability of natural resources and the constituents of ecosystems. Biological and
5 In 2000, GDP was estimated at Dh. 354 billion (World
Bank, 2001).

Unofficial translation of the original French version 7
chemical pollution of water resources is the main cause of diarrheal disease and the degradation of aquatic ecosystems (with consequences on fishery resources, and the development of the tourism sector, etc.). Air pollution has a considerable impact upon public health (respiratory and cardiovascular diseases) due to dust and other pollutants originating from various industrial activities and the transport sector. Inadequate waste management also has negative impacts upon life expectancy, ecosystems and health. 2.09 Consequently, the situation was quantified in a way to estimate damage costs and remediation costs.6 Damage costs estimate profits lost, which could be regained through healthier environmental management. Remediation costs provide an estimate of investments needed to maintain or restore an environment to an acceptable quality. 2.10 Generally, a socioeconomic evaluation consists of several steps:
(a) Identification, inventory and physical quantification of damage (e.g. air pollutants, wastewater, soil erosion, waste production, etc.);
(b) Quantification of environmental degradation (e.g. negative impacts on health from air pollution, a decrease in soil productivity, reduced tourism potential, etc.);
(c) A monetary valuation of the consequences (e.g. estimating the cost of respiratory illnesses, soil productivity losses, reduced recreational value, etc.).
2.11 Environmental science, natural resource science, health science and epidemiology, economics and other sciences are often applied to quantify the environment’s degradation and the resulting consequences. For valuation of the consequences of environmental degradation,
6 The concept of “remediation” or “substitution” cost is
linked to the “cost of remediation” methodology developed mainly by Inhaber (1976) and Rogers et al. (1997); cf. PNAE-DD Algeria, GTZ-World Bank, 2002.
environmental economics and natural resource economics are applied. 2.12 This study is based on data available in Morocco. If, in some cases, information is not available, an extrapolation from regional studies or expert judgment is applied. 2.3 CATEGORIES OF ANALYSIS 2.13 To estimate the cost of environmental degradation for various aspects of the environment, analysis and estimates are organized to the following six environmental categories:
(a) Water (b) Air (c) Land, forest and biodiversity (d) Waste (e) Coastal zones (f) Global environment.
2.14 Each of the environmental categories is divided into two economic categories:
(a) Impact on health and quality of life (b) Impact on natural resources.
2.4 ASSUMPTIONS 2.15 It is important to note that damage cost and remediation cost estimates were subject to various assumptions and simplifications. The resulting estimates are approximate. An estimate range was used to show their uncertainty. In general, the main hypotheses adopted are the following:
• “Damage costs” include the impact on health and quality of life (mortality, morbidity, productivity loss, life expectancy, and recreation), as well as the impact on natural resources (ecosystem and soil degradation, loss in agricultural productivity, etc.).
• Some impacts – such as the impact of hazardous waste on health – could not be evaluated. Therefore, only a fraction of the cost of total degradation was taken into

Unofficial translation of the original French version 8
account. Consequently, the results obtained tend to underestimate the real cost of degradation.
• The impact of environmental degradation on health is estimated relative to disability adjusted life years (DALY).7 This method was developed and used by the World Health Organization (WHO) and the World Bank in collaboration with international experts to provide a common measure for various illnesses and premature mortality. One DALY represents one year of good health. A slight illness represents a small percentage of a DALY, whereas a more severe illness would represent a larger percentage. One year lost due to a premature death represents one DALY. Future years lost are updated at a fixed discount rate. The assessment of lost DALYs due to water and air pollution is provided in a special note in annex II.
• As for “remediation costs,” two important implicit assumptions are raised: (i) the concept of remediation costs used is closer to the elimination cost or “end of pipe” of damage caused than to the cost of prevention or change in “process;” (ii) remediation costs are not always representative of the best technology at a lower cost.
• Remediation costs are in some cases insufficient to reflect environmental damage. In other cases, they overestimate the action required to remedy damage.
• In reality, environmental problems cannot be allocated in distinct categories (water, air, waste, etc.) as presented in this study. Problems are often interlinked, making direct comparisons between damage and remediation costs complex.
• Theoretically, a marginal analysis could be applied to identify remediation costs that lead to greater profit per unit of investment.
• All estimates are presented in annual values. For remediation costs, investments have been changed to annual values according to
7 DALY: Disability adjusted life years.
their lifetime (from 5 to 15 years) at a discount rate of 10 percent.
• All results are expressed in Moroccan dirhams and as a percentage of the country’s GDP.
• The year 2000 is the reference year for all calculations.
• Table 2.1 presents the basic economic data used for the estimates.
Table 2.1 Economic data, 2000
Population 28,787,000 Urban population 55% Number of persons/household 5.6 Current GDP (US$ millions) 33,3450 GDP/ inhabitant (US$) 1,160 GDP (millions of dirhams) 354,316 GDP/ inhabitant (dirhams) 12,308 Parity (dirham/US$) 10.63
Source: World Bank, World Development Indicators, 2001 and the Ministry of Health, Santé en Chiffres, 2001. 2.5 MONETARY EVALUATION 2.16 To reach a monetary evaluation of the consequences of environmental degradation, various methodologies of environmental and natural resource economics have been applied. Annexes I and II and the notes that follow provide a brief explanation of the estimated cost of degradation. A range has been used for most estimates to reflect uncertainties. Some monetary evaluation assessments are presented below. 2.17 Among the valuation approaches, we distinguish between methods of “expressed preferences” and “revealed preferences.” Of the “expressed preferences,” the hedonic price method, the travel cost method, and a change in production are reviewed. Of “revealed preferences,” the most common approach is that of the contingent valuation method. The latter consists essentially of estimating a demand for environmental quality by observing the value people place on environmental attributes through the use of questionnaires when buying a good or service and their willingness to pay (WTP) for
Unofficial translation of the original French version 9
this good or to accept its loss (willingness to accept). The contingent valuation method is particularly attractive because it estimates values when there is no market and no substitute exists on the market. For these reasons, the contingent valuation method is used widely to measure existence, option, indirect use and non-use values. Willingness to pay is part of the contingent valuation method.8 2.18 Impact costs on health (or the cost of one DALY lost) have been estimated according to two approaches: GDP per inhabitant and willingness to pay. GDP per inhabitant is used in some cases as a lower bound and in other cases as a higher bound. The use of this method is explained by the fact that the economic value of a year lost due to disease or a premature death is equivalent to the production value of the year in question, which is approximately equal to GDP per inhabitant. It is important to note that this evaluation method does not take into account the non-economic value of life. Another approach to estimate a DALY is that of the willingness to pay of an individual to reduce mortality risk. Studies undertaken in the U.S. and Europe show that WTP is higher than GDP per capita (especially in cases concerning adults). To assess one DALY, WTP was used in certain cases as a higher bound. 2.19 In this study, the assessment of one DALY lost due to child mortality differs from that of a DALY lost due to adult mortality. Few studies have been done to evaluate child mortality. As an example, if DALYs for adults and children are equal, (represented through GDP per capita), this would imply that a child’s death would be valued at two to three times more than that of an adult. This is not necessarily the case in many households where “the value” of an adult who earns a salary is often, by necessity, higher than that of a child. Thus, GDP per capita was used as a higher bound to estimate the value of one DALY lost for children. As a lower bound, 50 percent of GDP per capita was applied. This range of evaluation was used to estimate mortality and morbidity for children as a result of a lack of 8 IUCN website
drinking water and water purification systems, and indoor air pollution. 2.20 To assess one DALY lost due to adult mortality, GDP per capita was used as the lower bound and WTP as the higher bound. The WTP approach is based on American and European studies. It is further adjusted to take into consideration the difference in GDP per capita in Morocco. This estimate is used for indoor and urban pollution. 2.21 It should be noted that the WTP approach provides a cost of mortality in this report that is about 5 times higher than the approach of DALYs valued at GDP per capita. Thus the lower bound estimate of the cost of a DALY lost due to adult mortality would be a gross understatement of the cost of environmental degradation if WTP provides a better representation of welfare cost. 2.22 For pollution resulting from unsanitary landfills and a lack of hazardous waste treatment, a monetary valuation of impacts could not be undertaken in the framework of the study. Thus, the analysis would tend to underestimate total costs of environmental degradation. 2.6 DAMAGE AND REMEDIATION COSTS 2.23 As previously stated, damage costs express the national welfare loss associated with environmental degradation. Damage costs also provide a perspective on the extent of the potential benefits that could occur with good environmental management. 2.24 An assessment of remediation costs provides an indication of the investment required to partially avoid current levels of environmental degradation. Since estimates of remediation costs are limited to certain environmental categories, it would be risky to establish a direct relationship between remediation costs and potential benefits. Further analysis is necessary to make a meaningful comparison.

Unofficial translation of the original French version 10
2.7 MARGINAL ANALYSIS 2.25 A marginal analysis should be applied to assess the benefits (reductions in the cost of environmental degradation) and costs of remedial action. Only in specific situations, can it be expected that incremental benefits from additional remedial action be the same as for a previous action. In most cases, incremental benefits decline and it becomes increasingly costly to improve environmental quality. Thus, investing in environmental action with the highest benefit per unit of cost should be implemented first. This process should be continued up to the point where benefits of an action equal the cost. Implementing action to improve the environment beyond this point would result in a net welfare loss. 2.26 In practice, it is often difficult to assess benefits and costs to apply the principle of marginal analysis. In such cases, other principles based on the irreversibility of environmental damage, intergenerational concerns, poverty alleviation and social balance should be applied. These principles may also be combined with marginal analysis for cases in which benefits and costs can be quantified.

Unofficial translation of the original French version 11
3. Water 3.1 WATER RESOURCES 3.01 Available water resources in Morocco are limited due to the country’s geographical location. However, the situation is intensified by population growth and resource wastage. Water pollution and deforestation impose increasing pressure on water quality and undermine ecological equilibrium. 3.02 Total water precipitation in Morocco is estimated at an annual average of 150 billion cubic meters (m3), of which there are losses of 121 billion cubic meters due to evapo-transpiration and 29 billion cubic meters to surface and underground flows. Underground water resources are estimated at around four billion cubic meters.9 3.03 Distribution of water resources in Morocco is relatively equal east and south of the Atlas Mountain Range where 19 percent of the population uses 18 percent of the water resources. However, distribution is unequal in the northwest and central west where 35 percent and 46 percent of the population use 46 percent and 36 percent of the water resources respectively. This distribution is also unbalanced. The Sebou, Oum Er-Rbia and Moulouya basins represent more than 60 percent of mobilized resources. 3.04 One-third of mobilized water resources come from underground water which is generally of good quality. Underground water generally provides drinking water, except in the Atlantic coastal areas between Kénitra and Safi, in the plains of Souss and Tensift, and in the southern and southeastern oasis where they are overexploited for irrigation. Underground water constitutes an essential resource for certain urban zones such as Fès, Marrakech, Agadir and Oujda.
9 REEM, 2001.
However, a surplus in the resource-employment global ratio10 and strong regional disparities are sometimes observed: the groundwater of Haouz, Sous and Chtoukas are in deficit due to overexploitation. For example, in 1992, mobilized sources in Morocco reached nearly 11.71 billion cubic meters. Irrigation consumed 87 percent of water resources distributed over six large watershed basins supplying nine large irrigated areas (with a total surface of 4.5 million hectares) and small and medium size irrigated areas (with a total surface of 1.2 million hectares). The remaining 13 percent of mobilized resources supplied households and industry. 3.05 According to the General Directorate of Hydraulics, renewable water resources are estimated at 29 billion cubic meters or slightly more than 1,000 cubic meters per capita per year. However, the resources that were technically and economically mobilized in 1996 did not exceed 21 billion cubic meters per year or 830 cubic meters per capita per year and will likely not exceed 411 cubic meters per capita per year in 2020.11 3.06 Over the past twenty years, Morocco has suffered more than once from water shortages which have affected negatively the economic situation at the national level. In 1999, for example, drought resulted in a growth rate of only 0.6 percent when 6.8 percent was expected. 3.07 To absorb the negative impacts of the water shortage, Morocco developed hydraulic infrastructure the equivalent of 103 large dams12 with a total storage capacity of 10 billion cubic meters. This system supplies approximately 6.5 billion cubic meters of surface water on average annually. However, despite these efforts,
10Ministry of Environment, 1995. 11 REEM, 2001. 12High Council for Water and Climate, La gestion de
l’économie de l’eau, 2001.

Unofficial translation of the original French version 12
Morocco still faces a water shortage affecting its economic, social and environment sectors. 3.2 WATER AND ENVIRONMENT 3.08 The quality of surface water in Morocco depends upon increases in and the continuous pressure of agricultural, household and industrial demand. In general, the quality of surface water varies according to the characteristics of the watershed basin. The quality of surface water observed in 1998 and 1999 was good to very good in 53 percent of sampling stations and medium in 10 percent. However, the quality of water was degraded in 37 percent of sampling stations.13 Almost all water flows are affected by urban and industrial discharge. It is the case in the medium downstream waterflow of the Oued Sebou, the medium water flows of Oum Er-Rbia, and the downstream flows of the Tangerois and Martil wadis. The auto-purifying power becomes precarious, especially during low summer water levels, olive production campaigns and wintertime when high water levels dissolve heavy metals fixed to sediments. 3.09 Underground waters, often geologically protected, are generally of better quality. However, important underground water aquifers on the Atlantic coast are polluted due to the excessive use of fertilizers and pesticides in the agriculture sector. Underground water quality is also becoming more saline due to excessive pumping, especially on the coastal border. 3.10 As table 3.1 shows, used household waters constitute the principal source of organic pollution (BOD5 and COD).14 Nitrate and phosphate pollution is of domestic and agricultural origin. 3.11 If measures for pollution reduction are not taken immediately, discharge will likely double or triple in volume by 2020. Some zones can expect catastrophic results. The Tensift, Loukkos and Oum-Er-Rbia basins will receive
13 REEM, 2001. 14 BOD5 Biological Oxygen Demand (after 5 days of
sampling) and COD Chemical Oxygen Demand.
the same pollution flows as the Sebou basin. Nitrate contents of 54 to 60 milligrams per liter, higher than acceptable WHO and Moroccan thresholds of 50 milligrams per liter, are expected to occur.15 Table 3.1 Evolution of liquid discharges 1992-2020
Liquid discharges (thousands of tons
per year)
%
Pollutant
Source of pollution
1992 2005 2020 2020/ 1992
BOD5 Industrial Household Total
59 229 288
99 321 420
177 469 646
200 105 124
COD Industrial Household Total
101 598 699
169 835 1006
303 1226 1529
200 105 119
Nitrogen Industrial Household Agriculture Total
3 51 28 82
5 71 36 112
9 105 46 160
200 106 64 95
Phosphate Industrial Household Agriculture Total
0.2 13 8 21
0.3 18 10 28
0.6 27 13 41
200 108 63 95
Chromium Industrial Total
0.4 0.4
0.7 0.7
1.2 1.2
200 200
Source: Ministry of Environment, 1995. Table 3.1 is based on the following: annual industrial growth of 4 percent, annual urban population growth of 2.6 percent, annual fertilizer consumption of one percent as well as an increase in total irrigated area of 2.5 percent. 3.12 Discharge and urban pollution. Insufficient purification and decontamination are the principle cause of underground, surface and marine water degradation. Economic growth is reflected by increased water use and sewerage per inhabitant. Wastewater pollutes underground, surface and sea water due to a lack of investment in their collection, treatment and evacuation. The sea receives the greatest share of domestic discharge because principal cities are located in coastal area. The economic regions of the center (Casablanca) and the northwest (Rabat-Tangiers) are responsible for 60 percent of domestic sewerage. 3.13 Agricultural waste and pollution. The level of phosphate and nitrate pollution due to agriculture is approximately 10,000 tons per
15Ministry of Environment,1995.

Unofficial translation of the original French version 13
year.16 The calculation of agricultural waste is based only on irrigated areas that utilize fertilizer. It is important to note that the leaching of phytosanitary products contaminates waters with toxic substances. It is estimated that 0.5 to 1 percent of phytosanitary products are found in water flows (REEM, 2001). Untreated wastewater irrigates more than 7,200 hectares17 of vegetable, cereal and fruit crops. Products grown on this land can be harmful to health. 3.14 Industrial wastes and pollution. Three types of pollution are generally associated with solid and liquid industrial discharge: toxic, biodegradable and eutrophic. The main pollutants contained in liquid discharge contain organic compounds with COD of 100,000 tons per year and BOD5 of 58,000 tons per year. Additionally, solid waste was estimated at 800,000 tons in 1993, of which 40,000 tons or five percent was sent to public landfills.18 3.15 Industrial waste with the highest BOD5 is located in the Sebou basin and the Atlantic Ocean. The Sebou basin faces organic pollution (due to olive oil factories) and chromium pollution (originating from tanneries). The Tensift basin receives hard metals (originating from mines of lead, zinc and copper). The basins of Moulouya, Loukkos, Bou-Regreg and Souss-Massa remain the least affected by industrial discharge. 3.16 Accidental pollution. In addition to water resource pollution caused by the above-mentioned sources, water quality degradation may be due to other factors such as accidents. Thirty accidents were reported by the General Directorate of Hydraulics between 1985 and 1999, of which 21 were maritime transport accidents and two were industrial accidents. The majority (76 percent) were concerned with hydrocarbon discharge and emissions of acid and bitumen.
16 World Bank, 1999. 17Higher Council for Water and Climate, 1994. 18High Council for Water and Climate, la gestion de
l’économie de l’eau, 2001.
3.3 COST OF DEGRADATION 3.17 In Morocco, water issues are the main environmental problem since water pollution negatively impacts health and water demand pressures resources. This section assesses the cost of water degradation on health and well-being as well as on natural resources. The cost assessment of degradation will allow measured and expressed as a percentage of Morocco’s GDP in 2000. 3.3.1 Health and quality of life 3.18 Sub-standard quality and an inadequate quantity of potable water for drinking and hygiene purposes, inadequate sanitation facilities and sanitary practices and inadequate personal, food and domestic hygiene have a cost to society. It is well known that these factors are associated with waterborne illnesses and mortality (Esrey et al, 1991). The most common of these illnesses being diarrhea. The impact assessment presented below is linked mainly to mortality and morbidity in children younger than five years due to diarrheal diseases. 3.19 Mortality. In 2000, children under five years of age totaled three million (Santé en Chiffres, 2001) and mortality in this category reached 46 per 1,000 live births (World Bank, 2001). At the beginning of the 1990s, the main cause of child mortality in Morocco was diarrheal diseases, responsible for 40 percent of deaths in children under five (Santé et Environnement, 1997). However, considerable efforts employed to fight diarrheal diseases (such as awareness campaigns) and the marginal improvements in drinking water19 access and purification20 have contributed to decrease the impact of diarrheal on child mortality. Despite the absence of studies on child mortality due to 19 In urban areas, the percentage of the population with
access to drinking water increased from 94 percent in 1990 to 100 percent in 2000 and remains at 58 percent in rural areas (World Bank, 2001).
20 In urban areas, the percentage of population with access to sanitation increased from 95 percent in 1990 to 100 percent in 2000. In rural areas, services increased from 31 percent to 42 percent (World Bank, 2001).
Unofficial translation of the original French version 14
diarrheal diseases, it is estimated that child mortality has been reduced by half between 1997 and 2000. This implies that in 2000, diarrheal diseases were responsible for the deaths of around 6,000 children under the age of five. 3.20 Using the formula and assumptions in the Global Burden of Disease (Murray et Lopez, 1996), it is calculated that the death of a child under five represents the loss of 35 DALYs (disability adjusted life years). Thus diarrheal deaths are responsible for an annual loss of 196,000 DALYs (annexes I and II). 3.21 Morbidity. Many more cases of non-fatal diarrheal disease occur in Morocco each year, causing discomfort to victims and imposing the costs of treatment and the time of caregivers. Discomfort associated with diarrheal illness is estimated in terms of DALYs. 3.22 A National Survey on the Health of Mother and Child (ENSME, 1997), conducted in 1997 by the Ministry of Health, has reported that over a sample of 3,750 children under five, 21 percent had diarrhea during the two weeks preceding the survey and 9 percent in the preceding 24 hours. Most affected children are from the regions of Marrakech-Tensift-Al Haouz, Doukkala-Abda, Tangiers-Tetouan and Taza-Al Hceima-Taounate. Based on this study, it is estimated that there are 100 million days per year where children are affected by diarrhea. A severity weight of 0.2 was assigned to diarrhea. Therefore, DALYs lost from one day of diarrhea is 0.2 divided by 365 days per year. Thus, the total number of DALYs lost due to morbidity was estimated to be 55,000 per year (annexes I and II). 3.23 Valuation. Mortality and morbidity associated with diarrheal illness have a cost to individuals, families and society at large. The cost is not only in the form of medical costs, but includes the cost of pain, suffering and loss of life. 3.24 For mortality, a monetary cost cannot be placed on the loss of life. However, valuation techniques have been developed to provide a
monetary measure of an individual’s (or household’s) willingness-to-pay (WTP) to reduce the risk of mortality. The sum of WTP of individuals and households is then used as a measure of the cost to society of a particular risk of mortality. This approach has increasingly been applied in many countries in Europe and North America for more than 20 years to improve safety standards and environmental regulations. 3.25 The WTP approach has been largely applied in studies of adult mortality risk. Valuing the cost to society of child mortality risk is more difficult because very few studies are conducted in this area. An alternate valuation technique is the human capital approach (HCA). This approach estimates the cost of mortality as the loss of an individual’s lifetime income from the time of death. This approach was used to estimate deaths from diarrhea in children. The loss ranges from Dh 1.2 to 2.4 billion, or 0.3 to 0.7 percent of GDP. 3.26 Several approaches are available to measure morbidity. Morbidity results in discomfort to victims, medical expenses for treatment and a loss of time for caregivers. To estimate discomfort (loss of well-being, loss of a working day, etc.) a value is assigned to the number of lost DALYs. In this study, a number ranging from 50 to 100 percent of GDP is assigned to 55,000 DALYs lost. This results in an estimate that ranges from Dh 340 million to 680 million, or 0.1 to 0.2 percent of GDP. 3.27 Cost of treatment and care giving. Patients suffering severe attacks of diarrhea are often taken to a health clinic for treatment. According to the survey conducted in 1997 (ENSME, 1997) 20 percent of children are treated in public clinics and 7 percent consult a private doctor. Therefore about 5.5 million diarrhea cases are treated in either a private or public health center. The economic cost of a medical visit is on average Dh 70 and the cost of medication is around Dh 100 per case. Thus the total cost of treating severe cases of diarrhea reaches Dh 950 million (annexes I and II).

Unofficial translation of the original French version 15
3.28 In addition to medical expenses one should also add the time spend by a parent to take care of sick children. This time has an opportunity cost, either in terms of leisure or other activities. For each case of severe diarrhea, it is assumed that one day is taken by a caregiver to look after a child. This time is valued using the average rural income (of Dh 1,500 per month). Therefore one day would be valued at approximately Dh 60. Thus, the value of the time spent to take care of sick children is about Dh 330 millions. 3.29 Children with mild cases of diarrhea are generally not taken to health clinics. According to ENSME (1997), around 30 percent of children affected by diarrhea undertook oral rehydration therapy (ORT). Thus, around 6 million cases of mild diarrhea were treated through ORT at an average cost of Dh 60 per case. Therefore, the total cost of treatment is estimated at Dh 360 millions, or 0.1 percent of GDP. 3.30 Quality of life. In addition to health concerns, water pollution reduces quality of life. For example, waterways possess a recreational value which diminishes with pollution. Despite the lack of information on the recreational value of waterways in Morocco, the present study is based on the results of a survey of the willingness to pay of individuals to preserve the esthetic, ecological and recreational properties of the Merja Zerga wetland (European Commission, 1998). By using the contingent valuation method, the objective of the study was to quantify the recreational quality of the natural environment. In this study, a hypothetical market describes the danger of degradation that threatens visual beauty and proposes rehabilitation measures to ensure the sustainability of esthetic qualities as well as the ecological and service functions of the site. The survey conducted consisted of measuring citizens’ willingness to pay for site preservation. The study of Merja Zerga revealed a willingness to pay of Dh 187 per household per year. Half of this value was adopted to reflect recreational values for all wetlands in Morocco.
3.3.2 Natural resources 3.31 Silting of dams. In Morocco, dams are subject to sedimentation. It is estimated that 50 million cubic meters of an annual controlled volume of 11 billion cubic meters of water is lost each year due to silting. This corresponds to a decrease of 0.5 percent per year or an annual irrigation capacity loss of 5,000 hectares annually (REEM, 2001). The loss in water storage capacity has been evaluated by the potential loss in electricity and potable water. This potential is estimated at 60 million kilowatt hours of electricity and 40 million cubic meters of drinking and industrial-use water. Assuming that one cubic meter21 of water costs Dh 2 and one kilowatt hour costs Dh 0.7, the cost of silting is Dh 122 million, or 0.03 percent of GDP. 3.32 The annual cost of water quality degradation, and the lack of water supply and sanitation ranges from Dh 3.6 billion to 5.1 billion, with an average of 4.3 billion. In 2000, this corresponded to 1.2 percent of Morocco’s GDP. Table 3.2 Water: Annual damage costs (mean estimate, 2000)22
Dh (millions)
% GDP
Health/Quality of life Mortality (DALYs lost) Morbidity (DALYs lost) Cost of treatment Recreational value
1,809 508
1,636 297
0.51 0.14 0.46 0.08
Natural Resources Silting of dams
122
0.03
Total 4,372 1.23 3.4 REMEDIATION COSTS 3.33 Measures have been taken in Morocco to make water pricing more efficient. However, much remains to be done to reduce the health and environmental impacts of deteriorating water quality in urban and rural areas. Table 3.3
21ONEP delivers drinking water to “régies de distribution” at prices ranging from Dh 3 to 5 per cubic meter. 22 See annex I for more details.

Unofficial translation of the original French version 16
shows the main actions identified by the NEAP (2002) and foreseen for the next 5 to 10 years. 3.34 Even though it is difficult to make a direct comparison between damage and remediation costs, tables 3.2 and 3.3 indicate that the benefits of efficient water management is likely to be much higher than the costs. Better water management reduces waterborne diseases, improves environmental sustainability and provides a better quality of life. Better water resource management can be achieved through technical means such as investments in water treatment facilities, but also through non-technical means such as information and awareness campaigns, education and capacity building, especially in rural areas. Table 3.3 Water: Annual remediation cost estimates23
Investment costs24 Dh Millions per year
Improve access to drinking water for rural populations
1,000
Improve drinking water distribution networks
5
Reduce water pollution 0.9
Quality of water and hygiene
Improve rural hygiene 1.2 Agriculture Control agriculture
pollution
0.8
Collection of rainwater 1 Non -conventional waters
Reutilization of wastewater 0.8
Stock management of obsolete phytosanitary products and treatment of wastewater
2
Obsolete products and used waters
490 Ecological system
Conservation of tropical and humid zones
12
Source: NEAP, 2002
23Since remediation costs are not comparable to damage
costs (section 2.4 and 2.24), the table does not show the sum of remediation costs in order to avoid such comparison.
24 See annex I for more details.
Unofficial translation of the original French version 17
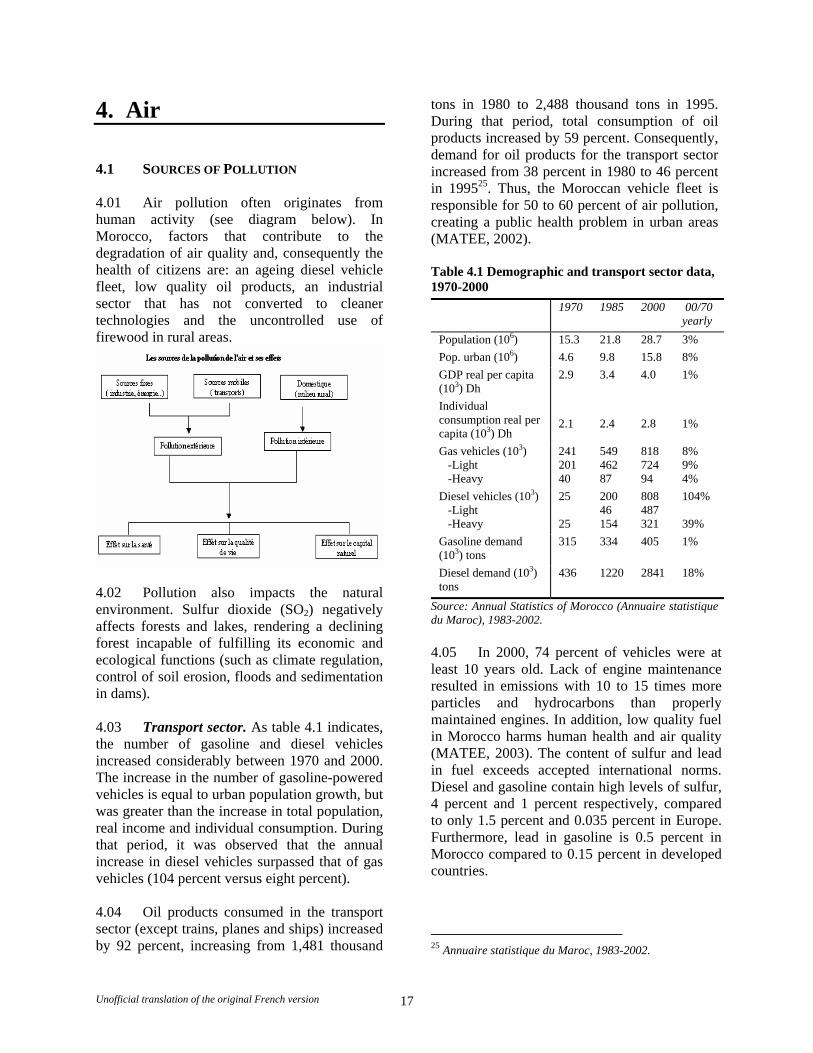
4. Air 4.1 SOURCES OF POLLUTION 4.01 Air pollution often originates from human activity (see diagram below). In Morocco, factors that contribute to the degradation of air quality and, consequently the health of citizens are: an ageing diesel vehicle fleet, low quality oil products, an industrial sector that has not converted to cleaner technologies and the uncontrolled use of firewood in rural areas.
4.02 Pollution also impacts the natural environment. Sulfur dioxide (SO2) negatively affects forests and lakes, rendering a declining forest incapable of fulfilling its economic and ecological functions (such as climate regulation, control of soil erosion, floods and sedimentation in dams). 4.03 Transport sector. As table 4.1 indicates, the number of gasoline and diesel vehicles increased considerably between 1970 and 2000. The increase in the number of gasoline-powered vehicles is equal to urban population growth, but was greater than the increase in total population, real income and individual consumption. During that period, it was observed that the annual increase in diesel vehicles surpassed that of gas vehicles (104 percent versus eight percent). 4.04 Oil products consumed in the transport sector (except trains, planes and ships) increased by 92 percent, increasing from 1,481 thousand
tons in 1980 to 2,488 thousand tons in 1995. During that period, total consumption of oil products increased by 59 percent. Consequently, demand for oil products for the transport sector increased from 38 percent in 1980 to 46 percent in 199525. Thus, the Moroccan vehicle fleet is responsible for 50 to 60 percent of air pollution, creating a public health problem in urban areas (MATEE, 2002). Table 4.1 Demographic and transport sector data, 1970-2000
1970 1985 2000 00/70 yearly
Population (106) 15.3 21.8 28.7 3% Pop. urban (106) 4.6 9.8 15.8 8% GDP real per capita (103) Dh
2.9 3.4 4.0 1%
Individual consumption real per capita (103) Dh
2.1
2.4
2.8
1%
Gas vehicles (103) -Light -Heavy
241 201 40
549 462 87
818 724 94
8% 9% 4%
Diesel vehicles (103) -Light -Heavy
25 25
200 46 154
808 487 321
104% 39%
Gasoline demand (103) tons
315 334 405 1%
Diesel demand (103) tons
436 1220 2841 18%
Source: Annual Statistics of Morocco (Annuaire statistique du Maroc), 1983-2002. 4.05 In 2000, 74 percent of vehicles were at least 10 years old. Lack of engine maintenance resulted in emissions with 10 to 15 times more particles and hydrocarbons than properly maintained engines. In addition, low quality fuel in Morocco harms human health and air quality (MATEE, 2003). The content of sulfur and lead in fuel exceeds accepted international norms. Diesel and gasoline contain high levels of sulfur, 4 percent and 1 percent respectively, compared to only 1.5 percent and 0.035 percent in Europe. Furthermore, lead in gasoline is 0.5 percent in Morocco compared to 0.15 percent in developed countries.
25 Annuaire statistique du Maroc, 1983-2002.

Unofficial translation of the original French version 18
4.06 Energy and industrial sectors. In addition to vehicle emissions, the industrial sector generates gaseous emissions and air pollution from the production and utilization of fuel oil (such as carbon and petroleum products). Morocco’s industrial sector comprises 6,500 establishments. Casablanca alone has more than 2,600 establishments, 43 percent of the total, of which 231 are large enterprises. The most polluting sectors are the following (MATEE, 2003):
• Energy installations (thermal energy centers and oil refineries)
• Chemical and para-chemical industries • Textile and leather industries • Agro-industries • Electrical and electronic industries • Metal and metallurgical industries.
4.07 Power companies in Morocco consume high amounts of fossil fuels (carbon and fuel oil, rich in sulfur) therefore, they are responsible for emitting the greatest share of untreated atmospheric pollutants. Moreover, the country has few laws regulating air pollution. 4.08 Firewood. Rural populations have limited access to conventional energy supplies. This has lead to firewood consumption in the rural areas to be up to 8 times greater than in urban areas (table 4.2). Besides rural households, handcraft industries such as pottery and hammams (baths) are also significant firewood consumers. Table 4.2 Consumption of wood energy (1994)26
Tons/year TOE27 Urban 1,274,000 407,600 Rural 10,030,000 3,209,500
4.09 Biomass consumption reached about 4.2 million tons of oil equivalent (TOE) in 1999, of which 89 percent is consumed in rural areas (or 3.7 million TOE). Firewood therefore constitutes the second energy source in Morocco (after oil) and represents 30 percent of the
26Data were obtained from experts in Morocco’s Ministry
of Equipment in April 2003. 27 Ton of oil equivalent
energy sector. Fifty-eight percent of annual wood consumption comes from forests. This is the equivalent of 6 million tons (or 6 to 7 million cubic meters). However, sustainable firewood production is only 3 million cubic meters annually. This results in overexploitation of firewood of 3 to 4 million cubic meters annually. 4.2 ENVIRONMENT AND AIR POLLUTION 4.10 Among air quality studies carried out in some Moroccan cities, it is important to note the eco-epidemiological studies of Casa-Airpol28 and Mohammedia-Airpol,29 and the atmospheric pollution study of the Safi30 region. These studies have, for the first time, established a correlation between air pollution and impacts on health (morbidity and premature mortality) in Morocco. The main results of the Casa-Airpol study show that when levels of black smoke31 increase from 9µg/m3 to 22 µg/m3, the level of crude mortality increases by two percent, medical consultations for conjunctivitis-affected children under five increase by six percent and consultations for mild and acute respiratory infections for children under five increase by seven percent and two percent respectively. When black smoke levels increase further, reported mortality and respiratory infections also increase. 4.11 The Safi Study showed the existence of a significant correlation between bronchitis and matter and particles in suspension (MPS). 28Casa Airpol, Etude de la Pollution Atmosphérique et de
son Impact sur la Santé des Populations à Casablanca, Ministry of Land Use Planning, Environment, Urbanism and Habitat, and the Ministry of Health, 2000.
29Mohammedia Airpol, Etude de la Pollution Atmosphérique et de son Impact sur la Santé des Enfants Asthmatiques de Mohammedia, Ministry of Land Reclamation, Water and Environment and the Ministry of Health, 2002.
30Ministry of Health, Etude de la pollution atmosphérique et de son impact sur la santé de la population de Safi, 1998.
31Black smoke is defined as very small particles suspended in the air (less than three thousandths of a millimeter). These fine particles cause respiratory diseases, asthma, reduced resistance to infection, and premature mortality.
Unofficial translation of the original French version 19
Similarly, the Mohammedia-Airpol Study confirms the negative impact of air pollution on the health of the local population, most particularly upon asthmatic children. This shows that an average increase of 10ug/m3 of S02 over three days leads to an increase in asthma attacks of at least ten percent and of nocturnal dry cough incidents of at least 11 percent (MATEE, 2002). 4.12 If no measures are taken, pollutant emissions will continue to increase at very high levels and their impacts upon health will become even more serious. Using 1982 as a base year, the Ministry of Environment predicts the following increases by 2010: SO2 emissions from 142,000 tons to 586,000 tons; NOx emissions from 208,000 tons to 693,000 tons and air particle emissions from 15,000 to 56,000 tons. SO2 emissions originate primarily from the industrial sector, NOx emissions from the transport sector, and particulate emissions in the same proportion from both sectors. 4.3 COST OF AIR QUALITY DEGRADATION 4.13 In Morocco, air pollution damages the environment that in turn affects citizens’ health. In urban areas, the industrial and transport sectors are the major air polluters. In rural areas, smoke from firewood causes air pollution that results in respiratory diseases. This section aims to value the cost of air quality degradation on health and the quality of life. 4.3.1 Urban air pollution 4.14 A large number of international studies (and recently national studies) have established a link between air pollution and respiratory illnesses (such as chronic bronchitis) and premature deaths. Suspended particles (SP), especially those with a diameter of less than ten thousandths of a millimeter, have the greatest impact on health. Gaseous pollutants (such as SO2 and NOx) could have harmful consequences on health when they react with other substances in the atmosphere (such as ammonia) and form particles.
4.15 This study focuses on the effect of fine suspended particles that have a diameter less than ten micro meter. In general, there are five steps to quantify the effects of air pollution. The first is to measure the concentration of pollutants in the atmosphere. The second is to identify the population exposed to the pollutants. The third consists of assessing disease incidences based on epidemiological norms. The fourth and fifth consist of quantifying, monetarily, the effect on mortality and morbidity.
4.16 Step one: measure the concentration of atmospheric pollutants. Air quality data are available for Casablanca, the urban prefecture of Rabat-Sale, and the cities of Safi, Fès, Marrakech and Tangiers. For Casablanca, two sets of air quality monitoring data exist. The first is based upon observations made over 18 months from a fixed site (the school of Fine Arts) that is located in an area where medium pollution levels exist. The pollution indicator is measured according to fine particles in suspension (less than three micro-meter in diameter). Samples taken during 18 months of 1998 and 1999 revealed an average of 33 µg/ m3 (CasaAirpol, 2000). The second set of monitoring data indicate the level of particles in suspension in four stations (Ain Sebaa, Mohammedia, Maarif and P. Marechal)32. This set indicate an annual average of 244 µg/ m3 of particles in suspension (REEM, 2001). 4.17 For the city of Rabat, monitoring data were provided from seven stations (Wilaya, Bab Chellah, Bab Elhad, Ab Lincoln, Bab Rouah, Gare Routière and Dar Essalam) and the statistics indicate an average of 243 µg/ m3 of particles in suspension (REEM, 2001). For the city of Safi, brief sampling campaigns were carried out between 1996 and 1997 in two areas (Kaouki et Biada). Results gave an average of 277 µg/ m3 particles in suspension (Ministry of Public Health, 1998). For the cities of Fès, Tangiers and Marrakech, data on suspended particles do not exist. Analogies were therefore drawn to compare theses cities with other Moroccan cities where data exist.
32These stations are “proximity” stations because they are
located near arterial roads and crossroads.

Unofficial translation of the original French version 20
4.18 Step two: identify populations vulnerable to pollution. The urban populations of the six cities mentioned above were taken into account. Population data come from the Ministry of Health (Santé en chiffres, 2001). Certain impacts affect more particularly a certain portion of the population (for example, the elderly and children under five years of age). The demographic distribution of the six cities was estimated by extrapolation from national averages. 4.19 Step three: assess the effect on health with the help of dose-response coefficients. Step three consists of evaluating the impact of fine suspended particles on health. This study is based on the results of various international studies. In the case of Casablanca only, estimates are based in part on significant correlations identified in the CasaAirpol study. A number of scientific studies have established a relation between levels of PM10 and mortality and morbidity. The main impacts on health are premature mortality, chronic bronchitis, hospitalization, emergency room visits for respiratory problems, restricted activity days for adults, and respiratory illness in children. Dose-response coefficients were taken from the study of Lvovsky et al (2000) and are presented in table 4.3. 4.20 Dose-response coefficients for morbidity are expressed by a change in health affected by concentrations of pollutants. Dose-response coefficients for mortality are expressed by a percentage change in the rate of all-cause mortality, which is 4.9 per 1,000 persons in Morocco (REEM, 2001). 4.21 Based on the above approach, it is estimated that annually, around 2,300 people in Morocco die prematurely due to air pollution. In addition, it is estimated that air pollution causes 14,000 chronic bronchitis cases, 26 million restricted activity days and 85 million cases of respiratory symptoms. Air pollution is responsible for a number of hospitalization and emergency room visits due to respiratory problems (see annex II for more details).
Table 4.3 Air: Dose-response coefficients
Annual Health Effect Dose response per 1 µg/m3 of
PM10 Mortality (percentage change in all-cause mortality rate) 0.084
Chronic bronchitis (per 100,000 adults) 3.06
Respiratory hospital admissions (per 100,000 people) 1.2
Emergency room visits (per 100,000 people) 23.5
Restricted activity days (per 100,000 people) 5,750
Lower respiratory illness in children (per 100,000 children) 169
Respiratory symptoms (per 100,000 adults) 18,300
Source: Lvovsky et al (2000) 4.22 The DALY, a common indicator, is used to compare mortality and morbidity. This indicator transforms mortality and morbidity into the number of years lost due to disability (check table 4.4). In Morocco, the number of DALYs lost per year due to mortality is estimated at 23,000. Moreover, the number of DALYs lost due to morbidity is estimated at 50,000 (see annex II for more details). Table 4.4 Air: Estimate of DALYs
Health effect DALYs lost per 10,000 cases
Mortality 100,000 Chronic bronchitis 12,037 Respiratory hospital admissions 264 Emergency room visits 3 Restricted activity days 3 Lower respiratory illness in children
3
Respiratory symptoms 3
Source: Lvovsky et al (2000) 4.23 Step four: assess mortality risk. Two approaches are used commonly to quantify mortality risk: the human capital approach and the willingness to pay (WTP) approach. The human capital approach evaluates revenue loss beginning with a person’s death. This approach is thus limited to the economic contribution of

Unofficial translation of the original French version 21
an individual to society. However, the WTP approach estimates the willingness of individuals to pay to reduce the risk of mortality. A number of studies in the U.S. and Europe have shown that WTP is often four to eight times higher than the results of the human capital approach. 4.24 In the case of Morocco, the study uses the human capital approach as a lower bound and the WTP as a higher bound. Thus, a DALY lost due to air pollution is estimated using GDP per capita as lower bound and WTP as an upper bound. As no studies exist in Morocco for WTP to reduce mortality risk, the study uses WTP as estimated in Europe and the U.S., adjusted for Morocco by the difference in GDP. 4.25 Step five: evaluate morbidity. Two approaches have been used for morbidity in the case of Morocco. The first consists of assessing one DALY at GDP per capita to account for people’s suffering associated with respiratory illnesses. The second consists of estimating the medical cost of treating respiratory diseases such as chronic bronchitis and lower respiratory illnesses in children (for more details, see annex II). 4.26 Recreational value. Even though the major impact of pollution is on health, there are negative impacts associated with a loss of visual and landscape beauty. A study (Belhaj, 2003) on the willingness to pay of Moroccan’s households to reduce air pollution by 50 percent in the region of Rabat-Salé revealed a WTP ranging from Dh 67 to 82 per household per month in 1995. WTP takes into account all impacts associated with air pollution. In theory, it is difficult to value each impact. However, according to the author of the Rabat- Salé study, WTP reflected widely the willingness to pay of the Rabat-Salé population to reduce the impact of air pollution on health. In order to reflect the WTP to improve the quality of life (aside from health effects), only ten percent have been adopted in this study. After updating data by taking inflation into account, a WTP ranging from Dh 7 to 9 per household per month was applied to the population of nine Moroccan cities comparable to Rabat-Salé in terms of
atmospheric pollution. These cities are Greater Casablanca, Rabat-Salé, Marrakech, Mekhnès, Fès, Greater Agadir, Tangiers, Oujda and Safi. 4.3.2 Indoor air pollution 4.27 As mentioned earlier, consumption of traditional fuels, particularly firewood and charcoal, in rural areas is high in Morocco. It represents close to 30 percent of total energy consumption (compared to 3 percent in Egypt and 12 percent in Tunisia). Even though no studies exist on the impact of firewood consumption on households, the present study is based on the methodology developed by Smith (2000). The methodology is briefly explained in annex II. The main effects on health include acute respiratory infections in children under five, obstructive chronic pulmonary diseases and cardiac illnesses in women. The study of Smith (2000) is limited to the effects on children under five and adult women, because they spend the majority of their time inside homes. Respiratory illnesses are transformed into DALYs. The total number of DALYs lost ranges from 40,000 to 65,000 for children and 15,000 to 40,000 for adult females. 4.28 Based on the methodologies presented above, the total effect of urban pollution is estimated between Dh 1.4 and 2.7 billion, or an average of Dh 2.1 million (0.6 percent of GDP). Indoor air pollution ranges from Dh 0.7 to 2.7 billion, or an average of Dh 1.5 billion (0.4 percent of GDP). Results of estimates are presented in table 4.5 and details are provided in annexes I and II. Table 4.5 Air: Annual damage costs (mean estimate, 2000)
Dh (millions)
% GDP
Health/Quality of life Urban pollution Mortality (lost DALYs) Morbidity (lost DALYs) Treatment cost Recreational value Indoor pollution Effect on children Effect on women
863 623 433 148
503
1,065
0.25 0.18 0.12 0.04
0.14 0.30
Total 3,635 1.03

Unofficial translation of the original French version 22
4.4 COST OF REMEDIATION 4.29 Over ten years, progress has been made in improving air quality. A number of studies were conducted that showed the continuous degradation of air quality, while bringing out its negative health impacts. However, a lot remains to be done on a practical level to reduce emissions that have harmful effects on the health of urban and rural populations. Table 4.6 shows the main actions identified in NEAP (2002) to control air pollution. More details are provided in annex 1. Table 4.6 Air: Annual remediation costs
Sources of costs Dh Millions/yr
% GDP
Air protection 470 0.13 Improvement of the urban and suburban environment
2,350 0.66
Transport sector 3 0 Energy sector 2 0 Indoor air pollution 0.8 0 Renewable energy 6.5 0
For more details, please see annex 1. 4.30 Even though it is difficult to make a direct comparison between damage and remediation costs, tables 4.5 and 4.6 indicate that the advantages of taking efficient measures to reduce emissions caused by transportation, the industrial sector and firewood are likely to outweigh the costs. It is recommended that cost-benefit studies for environmental interventions be undertaken to identify measures that will result in the greatest benefits for the least cost. 4.31 Remediation measures that result in large profits in terms of pollution reduction include: (a) Improving air quality monitoring: despite
progress to date, much still needs to be done in the area of air quality monitoring. Studies should be conducted not only to measure the concentration of air pollutants and track the effectiveness of pollution control mechanisms, but also to show the relationship between pollution and the environment, health, quality of life and
natural resources. Given the complexity of pollution, an overall index, such as the French “ATMO”33 index, should be created to provide an air quality indicator.
(b) Develop the use of instruments for environmental regulation for air pollution control: appropriate legislation and regulations, with the establishment of norms and means to control them, remain insufficient. Morocco should establish an environmental tax system aimed at encouraging economic agents to adopt less polluting behaviors. This tax system could concern both pollutant emissions and their sources (energy consumption, for example). The tax system associated with an assistance policy would encourage economic agents to acquire cleaner technologies.
(c) Encourage use of renewable energies. (d) Organize plans for urban circulation and
develop common transportation networks. (e) Facilitate the access of rural populations to
basic services. In this respect, implementation of the Rural Electrification Global Plan would diminish indoor pollution (and its effects on health) and ease pressure on forests.
33 This index is based on the concentration level of four pollutants (nitrogen dioxide, particulate matter, ozone and sulfur dioxide).
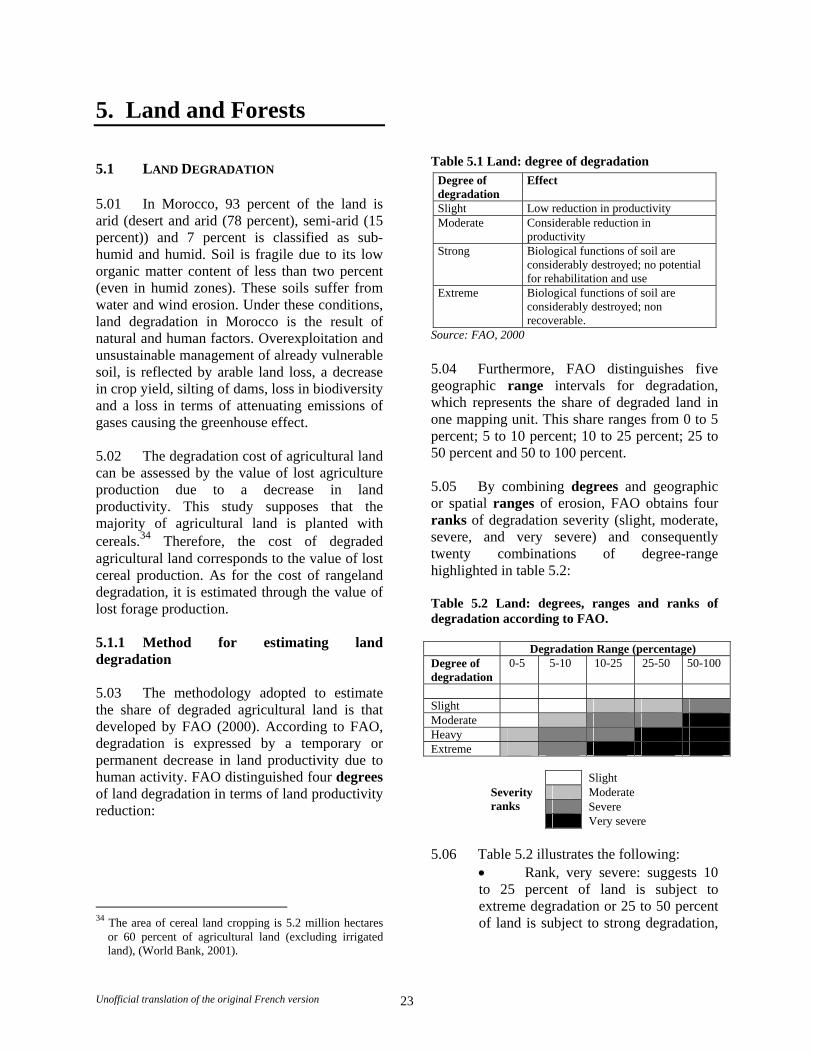
Unofficial translation of the original French version 23
5. Land and Forests 5.1 LAND DEGRADATION 5.01 In Morocco, 93 percent of the land is arid (desert and arid (78 percent), semi-arid (15 percent)) and 7 percent is classified as sub-humid and humid. Soil is fragile due to its low organic matter content of less than two percent (even in humid zones). These soils suffer from water and wind erosion. Under these conditions, land degradation in Morocco is the result of natural and human factors. Overexploitation and unsustainable management of already vulnerable soil, is reflected by arable land loss, a decrease in crop yield, silting of dams, loss in biodiversity and a loss in terms of attenuating emissions of gases causing the greenhouse effect. 5.02 The degradation cost of agricultural land can be assessed by the value of lost agriculture production due to a decrease in land productivity. This study supposes that the majority of agricultural land is planted with cereals.34 Therefore, the cost of degraded agricultural land corresponds to the value of lost cereal production. As for the cost of rangeland degradation, it is estimated through the value of lost forage production. 5.1.1 Method for estimating land degradation 5.03 The methodology adopted to estimate the share of degraded agricultural land is that developed by FAO (2000). According to FAO, degradation is expressed by a temporary or permanent decrease in land productivity due to human activity. FAO distinguished four degrees of land degradation in terms of land productivity reduction:
34 The area of cereal land cropping is 5.2 million hectares
or 60 percent of agricultural land (excluding irrigated land), (World Bank, 2001).
Table 5.1 Land: degree of degradation
Degree of degradation
Effect
Slight Low reduction in productivity Moderate Considerable reduction in
productivity Strong Biological functions of soil are
considerably destroyed; no potential for rehabilitation and use
Extreme Biological functions of soil are considerably destroyed; non recoverable.
Source: FAO, 2000 5.04 Furthermore, FAO distinguishes five geographic range intervals for degradation, which represents the share of degraded land in one mapping unit. This share ranges from 0 to 5 percent; 5 to 10 percent; 10 to 25 percent; 25 to 50 percent and 50 to 100 percent. 5.05 By combining degrees and geographic or spatial ranges of erosion, FAO obtains four ranks of degradation severity (slight, moderate, severe, and very severe) and consequently twenty combinations of degree-range highlighted in table 5.2: Table 5.2 Land: degrees, ranges and ranks of degradation according to FAO. Degradation Range (percentage) Degree of degradation
0-5 5-10 10-25 25-50 50-100
Slight Moderate Heavy Extreme
Slight Moderate Severe
Severity ranks
Very severe 5.06 Table 5.2 illustrates the following:
• Rank, very severe: suggests 10 to 25 percent of land is subject to extreme degradation or 25 to 50 percent of land is subject to strong degradation,

Unofficial translation of the original French version 24
or 50 to 100 percent of land is subject to moderate degradation. • Rank, severe: suggests 10 to 25 percent of land is subject to heavy degradation, or that 25 to 50 percent of land is subject to moderate degradation or that 50 to 100 percent is subject to slight degradation.
5.07 Application to the case of Morocco. Table 5.3 shows land degradation over all Moroccan territory (excluding the Saharan provinces). It shows that 19 percent of land (or 8.7 million hectares) is subject to severe degradation: Table 5.3 Land degradation in Morocco (FAO, 2000)
Degradation rank Area (thousands of hectares)
Percent (%)
None 2,000 4% Slight 4,200 9% Moderate 29,700 67% Severe 6,300 14% Very severe 2,400 5% Total 44,700
5.1.2 Degradation of agricultural land A. Estimation of degraded agricultural land 5.08 Agricultural activities and cultivation cause land degradation. FAO notes that land degradation also results from deforestation, overgrazing, overexploitation of biomass, and industrial activities. The contribution of each to total degradation was not calculated, however, it was possible to estimate degraded land due to agricultural activities.35 5.09 “Agricultural activities” signify the impact of agricultural activities on land degradation. Degraded land could be as much as 8.7 million hectares (see table 5.4), representing
35The survey conducted by FAO identified the main reason
for degradation for each geographical unit. One of the reasons mentioned is agricultural practices (FAO, 2000).
19 percent36 of total area (excluding the Saharan provinces). This corresponds to 100 percent37 of severely degraded land. Table 5.4 Land degradation in Morocco due to agricultural activities (FAO, 2000)
Degradation rank Morocco Total area (000 ha) 44,700 Land degradation Severe degradation (000ha) 6,300 Very severe degradation (000ha) 2,300 Total degradation (000ha) 8,700 Percent of total degraded area 19% Land degradation due to agricultural activities
Severe degradation (000ha) 8,700 Very severe degradation (000ha) Total degradation (000ha) 8,700 Percent of degraded area due to agricultural activities
100%
Percent of total degraded area due to agricultural activities
19%
5.10 According to table 5.4, the degradation of 8.7 million hectares is classified as “severe” According to table 5.2, “severe” corresponds to several degree combinations and degradation ranges. The following scenarios are thus possible:
• 10 to 25 percent of the land is severely degraded
• 25 to 50 percent of the land is moderately degraded
• 50 to 100 percent of the land is lightly degraded.
5.11 Of all surveys conducted on land degradation in Morocco, none show severe land degradation (or a non-recoverable loss of the soil’s biological function). Thus, only scenarios for moderate and light degradation are used in this analysis. 5.12 As an example, an FAO study of Morocco showed that since 1975, of 22.7 million hectares of side basins, only 8.2 million hectares are suitable for cultivation of which 50 percent require urgent soil conservation
36For Algeria, Tunisia and Egypt, the rate is estimated to be
13 percent, 31 percent and 5 percent, respectively. 37For Algeria, Tunisia and Egypt the rate is estimated to be
62 percent, 41 percent and 60 percent respectively.

Unofficial translation of the original French version 25
measures. In reality, that leaves 4.1 million hectares suitable for cultivation. The remaining 14.5 million hectares should not be cultivated at all. 5.13 Another survey conducted by the Ministry of Agriculture and Agricultural Development (MAMVA, 1996) found that 2.1 million hectares of agricultural land suffer from water erosion. This area is believed to be underestimated, however, since the report’s authors only studied priority sites requiring urgent intervention. The actual number of affected hectares is likely far greater than 2.1 million hectares. We can therefore consider that these hectares face “severe” to “very severe” degradation. B. Estimation of a decrease in agricultural yield 5.14 In a study to estimate the cost of land degradation in South Asia, Young (1994 and 1998) used the level of yield decrease in cereals corresponding to each degree of degradation: light degradation corresponded to a decrease of 5 percent in cereal yield, moderate degradation corresponded to a decrease of 20 percent and strong degradation corresponded to a decrease of 75 percent. However, only scenarios for slight and moderate degradation will be used in this analysis.38 5.15 From 1980 to 2000, the mean yield for cereals in Morocco was 10 quintals per hectare (based on official statistics for cereals, MADREF, 2001). By adopting this number as well as the slight to moderate level of decrease, the yield loss would be:
• Slight degradation: loss of 0.5 quintals per hectare (or a 5 percent decrease in cereal yield)
• Moderate degradation: loss of two quintals per hectare (or a 20 percent decrease in cereal yield).
38 In the same way, a study aimed at evaluating the impact
of soil erosion on cultivated land productivity in Africa showed that soil erosion lead to a decrease in productivity of 2 to 40 percent (Lal, 1995).
5.16 These yield decreases were confirmed by studying cereal production statistics in Morocco from 1980 to 2000. During this period, average production increased insignificantly, by 0.52 percent, not due to increased yield, but to an increase in cultivated area. 5.17 Based on a number of documents from the Ministry of Agriculture and Rural Development (MADR), a survey conducted in the Taounate province and discussions with experts at the ministry revealed that the margin for each quintal of the three major cereal crops,39 bread wheat, durum wheat and barley, reached 46 percent40 of the producers’ price41 on average. In 2000, the price of bread wheat, durum wheat and barley was Dh 257, 286 and 227 per quintal respectively, or an average of Dh 258 per quintal. A decrease in agricultural productivity results in diminishing yields, while the cost of inputs remains (in part) the same. Loss of agricultural revenue is thus equal to the number of lost quintals, evaluated at the selling price (wheat equivalent). C. Assessing the cost of degraded agricultural land 5.18 To estimate the cost of degradation, this study used the average of the lower bound of moderate and slight erosion and the average of the upper bound of moderate and slight erosion. According to table 5.5, the cost of degradation ranges from Dh 842 million to 1,683 million, averaging Dh 1,263 million (or 0.36 percent of GDP).
39The three crops use 94 percent of the useful agriculture
surface (Surface Agricole Utile) for national cultivation of cereals.
40This is a weighed average by share of each crop in total cereal production (excluding corn).
41These are prices paid to producers just after harvest. Each year, MADR publishes statistics relative to these prices under the title « Prix Payés aux Producteurs des Produits Agricoles ».

Unofficial translation of the original French version 26
Table 5.5 Cost estimate of degraded cultivated land Lower
limit Higher limit
Moderate erosion 25% 50% Degraded agricultural land (000 ha)
2,175 4 ,350
Level of decrease 20% 20% Decrease in yield (qx/ha) 2 2 Lost production (000 qx) 4,350 8,700 Lost value (millions of dirhams)
1,122 2,244
Slight erosion 50% 100% Degraded agricultural land (000 ha)
4,350 8,700
Level of decrease 5% 5% Decrease in yield (qx/ha) 0,5 0,5 Lost production (000qx) 2,175 4,350 Lost value (millions of dirhams)
561 1,122
Average (millions of dirhams)
842 1,683
5.1.3 Rangeland degradation 5.19 Morocco’s 65 million hectares of pastureland are the primary source of animal food, providing 30 percent of overall requirements. However, pastureland is under pressure from climatic factors (erosion, drought) as well as animal (overgrazing) and human factors (land clearing for cultivation, removal of woods). Table 5.6 provides the distribution of pasture land nationwide (as described in the REEM, 2001). 5.20 Degraded pastureland. The share of degraded pastureland will only be calculated for the area with dominant steppe and forest covers (excluding the Saharan region).42 These pasturelands cover an area of 12 million (58 minus 46) and 5.1 million hectares (according to table 5.6). The percent of degraded rangeland is 46 percent and 19 percent respectively. This is an average calculated based on data from MADREF and stated in REEM (2001).
42 Data is not available for other regions.
Table 5.6 Distribution of pastureland (millions of hectares) Area Forests Steppe Dominance steppe 58 0.64 57.4 Saharian 46 0 46 Presaharian 5.7 0.06 5.6 Oriental 5 0.3 4.7 North Atlas 1.3 0.29 1.01 Arganeraie 1.5 0.7 0.8 Dominance forest 5.1 4.7 0.4 Middle Atlas 1.2 1.0 0.2 High Atlas 2.2 2.0 0.2 Rif 0.9 0.9 0 Mamora, centr. plateau 0.8 0.8 0 Dominance cereal 0.1 0 0.1 (sahel pasture) Coastal Meseta 0.1 0 0.1 Total 64.7 6.1 58.1
5.21 Fodder productivity of pastures. Based on the “National Plan for Watershed Management” (MAMVA, 1994 and 1995), land productivity in steppe (excluding Saharan region) and forest regions was estimated at 79 and 558 forage units per hectare respectively.43 5.22 Loss of productivity due to rangeland degradation. The “National Plan for Watershed Management” adopted two levels of loss: six percent and ten percent. Based on these levels, the total loss in fodder production ranges between 26 to 44 million units in regions with steppe dominance and 32 to 54 million units regions with forest dominance. Table 5.7 Loss in fodder production.
Dom. steppe
Dom. Forest
Total
10 percent loss Pasture area (000 ha) 12,000 5,100 17,100 Percent of degraded area 46% 19% Forage production unit/ha/yr
79 558
Loss in yield 0.1 0.1 Loss (000 units) 44,096 54,070 98,166 6 percent loss Pasture area (000 ha) 12,000 5,100 17,100 Percent of degraded area 46% 19% Forage production unit/ha/yr
79 558
Loss in yield 0.06 0.06 Loss (000 units) 26,458 32,442 58,900
43 A forage unit corresponds approximately to one kilogram
of barley.

Unofficial translation of the original French version 27
5.23 Cost of rangeland degradation. With barley priced at Dh 227 per quintal, the total costs is estimated at an average of Dh 178 million or 0.05 percent of GDP in 2000. Table 5.8 Damage cost of rangeland degradation in 2000
Nature of rangeland Dom. steppe
Dom. forest
Total
Degraded pastures (thousands of hectares)
5,520 969 6,489
Damage cost (millions Dh) loss of 10%
100 123 223
Damage cost (millions Dh) loss of 6%
60 74 134
Damage cost (millions Dh) average
80 98 178
5.1.4 Total cost of land degradation 5.24 The total estimate for land degradation ranges from Dh 975 to 1,900 million, or an average of Dh 1,440 million (0.41 percent of GDP). It is important to note that this analysis is limited to degradation of cultivated land and does not include the impact of salinity on irrigated soil. Therefore estimates provided above are likely to underestimates the total impact of land degradation. 5.2 DEFORESTATION 5.2.1 Pressures on the forest 5.25 The Moroccan forest is subject to pressures from population growth and climatic conditions. • It is estimated that about 31,000 hectares of
forest are destroyed annually (MAMVA, 1996). About 4,500 ha are lost due to clearing of vegetation (essentially in the Rif, High Atlas and Souss regions), 22,000 hectares are lost due to energy needs (firewood) and 4,500 hectares due to fire.
• Firewood constitutes the second source of energy in Morocco (after oil) and represents 30 percent of energy usage. Annual firewood consumption is estimated at 11.3 million tons of which 58 percent from the forest (this is equivalent to 5.9 million tons
which is 6 million to 7 million cubic meters of firewood). However, sustainable production of firewood is only 3 million cubic meters per year. This results in an overexploitation of the forest of 3 to 4 million cubic meters per year due to uncontrolled felling.
• Rangelands in forests provide 17 percent of livestock food requirements or 1.7 billion forage units. Grazing is considered one of the major causes of forest ecosystem degradation: the animal load per hectare is three to five times greater than the sustainable level.
5.2.2 Forest functions 5.26 The forest provides both direct and indirect benefits. Direct benefits include wood products (wood and firewood) and non-wood products (mushrooms, honey, and medicinal plants). Indirect benefits include soil protection, erosion control, and control of sedimentation in dams. Forests store carbon dioxide which improves the atmosphere. It also provides recreational and aesthetic (landscape) benefits. Forests are also an integral part of the global ecosystem whose sustainability requires the presence and functions of the forest. 5.27 Economists distinguish between two types of valuation: use and non-use values. As an example, in the case of forest, wood production is considered as use value and biodiversity protection as non-use value. Table 5.9 further clarifies these values.

Unofficial translation of the original French version 28
Table 5.9 Use and non-use values of the forest Functions Type of
value Method of evaluation
Production functions UV Wood products UV Market price Non-wood products Market price/
Opportunity cost Environmental functions Recreational UV
Travel cost/ CVM
Landscape UV CVM Soil protection UV Pollution reduction UV Carbon sequestration UV Biodiversity (wildlife) NUV Existence of the forest NUV UV: use value; NUV: non-use value; CVM: contingent valuation method. 5.2.3 Estimating the cost of forest degradation 5.28 The cost of degradation corresponds to benefits lost due to deforestation, resulting in the inability of the forest to fulfill its ecological role. Due to a lack of information, it was not possible to estimate the cost related to each forest function and the study therefore distinguished between two cost categories: costs related to income from lost wood products (essentially wood) and that related to income from non-wood products. 5.29 Loss of wood products. Even though deforestation affects 31,000 hectares, only the portion lost to fire (4,500 hectares) has lost its value completely. Trees from forest areas felled to create agricultural fields (4,500 hectares) can be sold as wood to generate revenue. Forest area destroyed to produce energy (firewood) does not always generate revenue, though it can reduce a family’s financial burden. 5.30 Even though a destroyed forest surface has lost its “sustainable” annual wood yield, land has often been transformed into other uses. Therefore, in order to estimate the loss in wood value, the present value of the permanent loss of sustainable yield should be estimated and deduct from it the present value of the alternative land use. Estimating the value of permanent wood loss is complex, therefore, this study is limited to evaluating the stock value of lost wood due to forest fires. The total volume of standing trees
exceeding ten centimeters in diameter at chest height is estimated at 27 cubic meters per hectare (FAO, 2001). The economic value of timber is estimated at Dh 675 per cubic meter (World Bank, 1999b). Therefore, the lost in timber is estimated at Dh 82 million. 5.31 Loss of non-wood products. Benefits from non-wood products include recreational aspects, soil protection, pollution reduction and the existence value of the forest. According to a study that estimates forest richness (Kunt et all, 1998), the value of non-wood products ranges from $145 per hectare in developed countries to $112 per hectare in developing countries. Even though no study has been conducted yet to estimate the value of non-wood products, the present study will adopt the value of $112 per hectare, equivalent to Dh 1,200 per hectare. The loss of 31,000 hectares is reflected by a loss of non-wood products estimated at Dh 37 million. For comparison purposes, it is interesting to note that a study conducted by Chomitz, Brenes, and Constantino (1998) showed that in Costa Rica, non-wood forest products (excluding greenhouse gas effects) ranged from $43 to $94. 5.32 In conclusion, the total cost of land degradation and deforestation is estimated at Dh 1,560 million or 0.44 percent of GDP (see annexes I and II for details). Table 5.10 Land and forests: Annual damage costs (mean estimate, 2000)
Land Dh (millions)
% GDP
Natural capital Cultivated land Rangeland
1,263 178
0.36% 0.05%
Deforestation 119 0.03% Total 1,560 0.44%
5.3 REMEDIATION COST 5.33 To reduce soil degradation, the implementation of the measures identified in the National Plan for Watershed Management (MAMVA, 1995), requires Dh 150 million annually for 20 years.

Unofficial translation of the original French version 29
5.34 For deforestation, remediation costs correspond to the cost of reforestation of one hectare multiplied by the deforested area. The cost of reforestation was calculated on the basis of data from the evaluation of Morocco’s second forestry program implemented from 1992 to 1998 (World Bank, 1999b). This program consisted of three components: forest planning, forest operations and support activities. Evaluation of the program, conducted in 1998, showed that 14,285 hectares were reforested at a total cost of US$18 million, or US$1,254 per hectare. By taking into account inflation and exchange rates, the cost of reforestation is estimated at Dh 12,260/ha in 2000. Thus, the total cost of reforesting 31,000 hectares is estimated at Dh 380 million. 5.35 Remediation costs, including soil erosion control, reforestation, and other remedial actions identified in the NEAP (2002), are estimated at Dh 540 millions per year (table 5.11). It is important to note that total remediation costs are not comparable to damage costs. Due to a lack of data and the complexity of the operation, damage costs do not account for all environmental impacts linked to land and forest degradation. Similarly, remediation costs include only a few measures to reduce degradation. Therefore, it is recommended to invest more time and research effort to better understand the linkages between remedial investments and rate of degradation. Table 5.11 Annual remediation costs
Actions Dh (millions/
year) Erosion control 150 Agricultural pollution 1 Management of obsolete stocks of phytosanitary products
1
Desertification phenomenon 5 Reforestation 380 Saving ecosystems (nature reserves, etc.) 2 Energy substitution 3
See annex I for more details. 5.36 Despite measures taken in Morocco to reduce erosion, deforestation and desertification, more remains to be done. The benefits of
efficient land and forest management are likely to be greater than remediation costs. A better resource management policy would help reduce land degradation, deforestation and desertification. Since both land degradation and desertification negatively impact precipitation in the long term, an optimal resource management strategy should figure among the priorities for sustainable environmental management.
Unofficial translation of the original French version 30
6. Waste 6.1 PRESSURES ON THE ENVIRONMENT 6.01 In 2000, total production of solid waste in Morocco was estimated at 20,700 tons per day. The nature of waste is presented in table 6.1 below. Table 6.1 Waste production estimates in 2000
Type of waste Tons /day
Remarks
Household 17,800 69 percent is produced in urban centers
Industrial sector 2,670 of which 12 percent is considered hazardous (organic, liquid and solid mineral waste).
Health sector 33 3 to 10 percent are considered hazardous
Source: REEM, 2001 6.02 Municipal waste collection in urban areas varies between 70 to 100 percent. However, the disposal of waste in unsanitary landfills is problematic. In the absence of treatment and recycling (less than 2 percent is recycled), and taking into account waste composition (organic matter represents 50 to 70 percent with 70 percent humidity), household waste threatens health and the environment. The pressures will continue to increase, with household waste production estimated to increase to more than 32,000 tons per day by 2020 (JICA, 1997 and Jorio, 2000). Cleanliness of cities varies across cities. The percentage of cities with at least once-weekly street sweeping ranges from 30 to 100 percent (REEM, 2001). 6.03 Despite a lack of information, the REEM (2001) indicates that industrial waste collection has reached 100 percent. Waste collection is undertaken by production units, which stock around 72 percent of waste in factories (or a location belonging to the property of the factory and located nearby), recycle 23 percent and send 5 percent to dumps. However, due to incinerator failure, a significant portion of medical waste is transported to public dumps.
6.04 Shortcomings in waste collection (essentially household waste) and improper disposal in unsanitary landfills have negative impacts on public health and the environment. In Morocco, dumps lack proper lining and biogas and leachate collection to protect water resources and the soil. Table 6.2 presents the negative impacts of waste on human health and natural resources. Table 6.2 Environmental impacts of waste
Health Quality of life Natural resources
Multiplication of serious diseases through direct or indirect propagation agents (rats) Toxic gas emissions (methane, hydrogen sulfide)
Cleanliness of cities Landscape degradation
Impact on water quality Soil contamination
6.2 DAMAGE COSTS 6.05 In the context of this study, it was not possible to estimate every impact of waste on health, quality of life and natural resources. In particular the study was not able to tackle impacts related to untreated industrial, medical and hazardous wastes as well as the impact of waste on the recreational and the tourist value of natural sites. Due to the complexity of estimating these impacts, it is recommended to undertake further research in these areas in the future. 6.2.1 Impact on health 6.06 Municipal waste. In most Moroccan cities, inhabitants judge waste collection and cleanliness to be unsatisfactory. However, despite the lack of conventional markets for evaluating these services, the contingent valuation method could be used to estimate citizens’ WTP to achieve better municipal waste collection services. This was the case in 1995

Unofficial translation of the original French version 31
when a study was conducted in Rabat-Salé (Belhaj, 1995). The study created a hypothetical market in which improved and more efficient municipal services would be possible in the two cities if citizens were willing to pay monthly fees. Services would improve waste collection and city cleanliness. For the two cities, an average monthly WTP amount was estimated at Dh 40 per household. 6.07 To calculate the benefits of improved service at the national level, an extrapolation to other Moroccan cities was made. Consequently, the WTP of 1995 was adjusted for inflation level (an average of 1.9 percent from 1995 to 2000) and used in the frame of the present study. Thus, a monthly WTP of Dh 44 per household was adopted. This estimation, when applied to all urban households in Morocco, reaches Dh 1.5 billion or around 0.4 percent of GDP. 6.08 Unsanitary landfills. The effect of unsanitary landfills on the environment (through the danger to landfill workers, odors, proliferation of rodents and insects) can be estimated by the loss in land value in neighboring areas. By using the hedonic price method, a survey conducted in Tunisia revealed that the presence of unsanitary landfills (especially in urban and suburban areas), could result in a land price devaluation of 35 percent. However, in the framework of the present study, it was not possible to assess this impact in Morocco. 6.2.2 Impact on natural resources 6.09 Lack of treatment and proper disposal of hazardous wastes could lead to soil and water contamination. This impact is complex and difficult to properly estimate. The only impact that could be estimated in this present study was that of unsanitary landfills on underground water. 6.10 Impact of unsanitary landfills on underground water. The absence of an adequate system for waste treatment is reflected in the pollution of ground water through leachate, and the pollution of coastal and surface water due to direct waste dumping. In the context of the
present study, the cost of water resource degradation due to leachate infiltration originating from unsanitary landfills is presented.44 Estimates of polluted water quantity, as presented below, were the subject of discussions conducted with officials at the General Water Directorate in Morocco. 6.11 To estimate the quantity of ground water polluted, the following method was used: • Half the total amount of solid waste
generated has been considered (i.e. 10,000 tons per day).
• This quantity was transformed into volume (expressed in cubic meters) by dividing tonnage by volumetric weight of waste (0.4 tons per cubic meter).
• The level of leachates in wastes is approximately 50 percent. However, due to evaporation, an infiltration rate of 10 percent was considered.
• Many studies have shown that one cubic meter of wastewater pollutes 50 cubic meters of water. The same hypothesis was adopted in the case of leachates, even though the pollution load of leachates is more concentrated than that of wastewater.
Table 6.3 Estimate of the quantity of water polluted by leachates
Quantity of waste t/day 10,000 Volumetric weight t/ m3 0.4 Volume of waste m3/day 25,000 Leachate level 0.5 Quantity of leachates m3/day 12,500 Infiltration rate of leachate 0.1 Quantity of water polluted /m3 of leachates m3 50 Volume of water polluted by leachates m3/day 62,500 Volume of water polluted by leachates m3/yr 22,812,000
6.12 To assess the impact of polluted water, the additional costs to treat extremely polluted water were calculated. In the frame of the Sebou study (Sadoff, 1996), the average cost of treating polluted water in the Sebou basin was estimated
44 With the exception of Essaouira, dumps in Morocco do
not possess a system for leachate recovery.

Unofficial translation of the original French version 32
at Dh 15 per cubic meter, in comparison to water treatment costs of Dh 5 at the national level. Assuming the pollution load of leachates is at least equal to that calculated in the Sebou basin, we could consider that the additional cost of treatment due to extreme pollution is of Dh 10 per cubic meter.45 Thus, the cost of water degradation would reach Dh 228 million per year, or 0.06 percent of GDP. 6.2.3 Total damage cost 6.13 Even though damage costs, as presented in table 6.4, do not take into account all environmental damage, they remain high. The costs were estimated at Dh 1.7 billion (or 0.5 percent of GDP) in 2000. It is recommended that additional studies be undertaken to assess a) the impact of industrial, medical and untreated hazardous waste on human health and natural resources; b) the impact of unsanitary landfills on land value; and c) the impact of solid waste on the recreational value of natural sites. Table 6.4 Waste: Annual damage cost (mean estimate, 2000)
Dh (millions)
% GDP
Health /Quality of life Municipal waste collection Unsanitary landfills Industrial and hazardous wastes Natural resources Industrial and hazardous wastes Groundwater pollution due to unsanitary landfills
1,497 n.a. n.a.
n.a. 228
0.4
0.1
Total 1,725 0.5
45 This number was confirmed by officers at the General
Water Directorate.
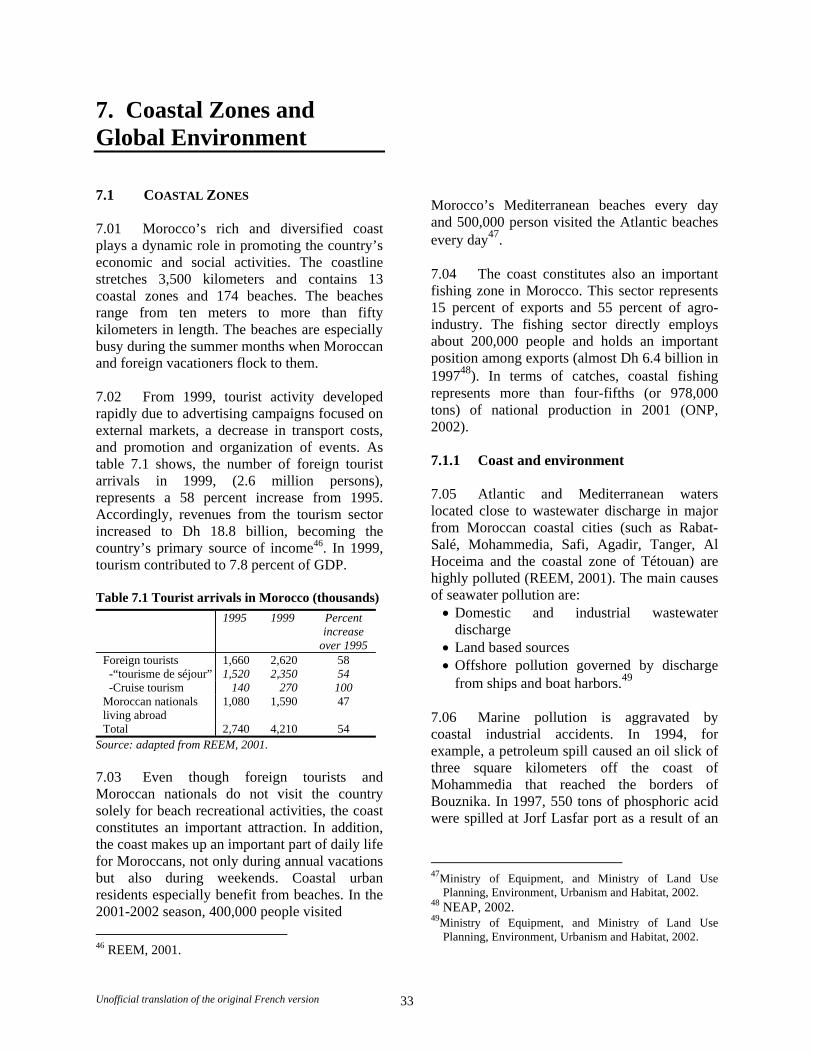
Unofficial translation of the original French version 33
7. Coastal Zones and Global Environment 7.1 COASTAL ZONES 7.01 Morocco’s rich and diversified coast plays a dynamic role in promoting the country’s economic and social activities. The coastline stretches 3,500 kilometers and contains 13 coastal zones and 174 beaches. The beaches range from ten meters to more than fifty kilometers in length. The beaches are especially busy during the summer months when Moroccan and foreign vacationers flock to them. 7.02 From 1999, tourist activity developed rapidly due to advertising campaigns focused on external markets, a decrease in transport costs, and promotion and organization of events. As table 7.1 shows, the number of foreign tourist arrivals in 1999, (2.6 million persons), represents a 58 percent increase from 1995. Accordingly, revenues from the tourism sector increased to Dh 18.8 billion, becoming the country’s primary source of income46. In 1999, tourism contributed to 7.8 percent of GDP. Table 7.1 Tourist arrivals in Morocco (thousands)
1995 1999 Percent increase
over 1995 Foreign tourists 1,660 2,620 58 -“tourisme de séjour” 1,520 2,350 54 -Cruise tourism 140 270 100 Moroccan nationals living abroad
1,080 1,590 47
Total 2,740 4,210 54 Source: adapted from REEM, 2001. 7.03 Even though foreign tourists and Moroccan nationals do not visit the country solely for beach recreational activities, the coast constitutes an important attraction. In addition, the coast makes up an important part of daily life for Moroccans, not only during annual vacations but also during weekends. Coastal urban residents especially benefit from beaches. In the 2001-2002 season, 400,000 people visited 46 REEM, 2001.
Morocco’s Mediterranean beaches every day and 500,000 person visited the Atlantic beaches every day47. 7.04 The coast constitutes also an important fishing zone in Morocco. This sector represents 15 percent of exports and 55 percent of agro-industry. The fishing sector directly employs about 200,000 people and holds an important position among exports (almost Dh 6.4 billion in 199748). In terms of catches, coastal fishing represents more than four-fifths (or 978,000 tons) of national production in 2001 (ONP, 2002). 7.1.1 Coast and environment 7.05 Atlantic and Mediterranean waters located close to wastewater discharge in major from Moroccan coastal cities (such as Rabat-Salé, Mohammedia, Safi, Agadir, Tanger, Al Hoceima and the coastal zone of Tétouan) are highly polluted (REEM, 2001). The main causes of seawater pollution are: • Domestic and industrial wastewater
discharge • Land based sources • Offshore pollution governed by discharge
from ships and boat harbors.49 7.06 Marine pollution is aggravated by coastal industrial accidents. In 1994, for example, a petroleum spill caused an oil slick of three square kilometers off the coast of Mohammedia that reached the borders of Bouznika. In 1997, 550 tons of phosphoric acid were spilled at Jorf Lasfar port as a result of an
47Ministry of Equipment, and Ministry of Land Use
Planning, Environment, Urbanism and Habitat, 2002. 48 NEAP, 2002. 49Ministry of Equipment, and Ministry of Land Use
Planning, Environment, Urbanism and Habitat, 2002.

Unofficial translation of the original French version 34
accident at the “Maroc Phosphore” factory (Sbai, 2001). 7.07 Coastal degradation harms human health (especially when people swim in polluted waters) as well as marine ecosystems and fish catches. For example, sardine resources along the coast of Safi decreased by six percent from 1995 to 2000 (see table 7.2), even though fishing activities increased during the same period. Following discussions with experts in marine fishing in Morocco, it was found that 30 percent of sardine losses could be attributed to water pollution (70 percent of losses are attributed to biological reasons such as migration). Table 7.2 Evolution of catches from coastal fishing between 1995 and 2000 (tons)
Capture in tons Change Species 1995 2000 (%)
Pelagic fish -sardines
629,000 556,000
604,000 523,000
-4 -6
White fish 48,000 75,000 58 Cephalopods 12,000 51,000 336 Crustaceans 3,000 3,000 0 Shellfish 0 461 461 Total 692,000 734,000 6
Source: Ministry of Maritime Fisheries, 2000 7.08 In 2002, an annual surveillance campaign, entitled Monitoring Bathing Beach Waters in the Kingdom of Morocco showed that 28 percent of beaches were unfit for swimming.50 7.09 In addition to natural marine and wind erosion, haphazard construction of summer houses and hotels along the coast contributes to coastal degradation. In the 1990s at Agadir beach, a retreat of the sea over an area of 1.5 hectares was recorded51. To limit beach erosion, the Ministry of Equipment and Transport proceeded to improve the management of maritime public estate by issuing a law on sand extraction in 1997. This law imposes a fine of Dh 500 per cubic meter of illegally extracted
50Ministry of Equipment, and Ministry of Land Use
Planning, Environment, Urbanism and Habitat, 2002. 51Information provided by an expert from de la Direction of
Ports and Public Maritime Domain at the Ministry of Equipment and Transport (in April, 2003).
sand (Ministry of Equipment and Transport, 2002)52. 7.1.2 Cost of degradation 7.10 Table 7.3 presents the costs of the most significant coastal degradation impacts. Costs are calculated for 2000 and are expressed in Moroccan dirhams as well as percentage of GDP. Concerning impacts on health, even though a correlation between polluted swimming waters and negative health impacts was confirmed by Moroccan experts, the present study does not provide any estimates. It would be desirable to conduct more detailed studies in the future to evaluate the impact of marine pollution on health and quality of life. In the case of natural capital, the value of coastal degradation was estimated by three methods:
(a) WTP of foreign tourists and Moroccan nationals living abroad to improve the coast (b) Lost recreational value for Moroccan residents (through the travel cost method) (c) Loss of coastal fishing (sardines).
A. WTP of foreign tourists and Moroccan nationals living abroad to improve the coast 7.11 A study conducted by Huybers and Bennett (2000) on British tourists revealed that British tourists are willing to pay US$70 per day (or 35 percent of their daily tourist expenses) for “unspoiled” destinations, as opposed to “slightly spoiled” and “very spoiled” destinations. The same proportion was applied to European and North American tourists visiting the Moroccan coast. Knowing that (a) of the 4.4 million tourists visiting Morocco each year, 1.3 million are North American and Western European; (b) their average stay on the coast ranges from two to four days, and (c) their tourist expenditures average Dh 950 per person per day, it is estimated that the WTP to improve the coastal area ranges between Dh 870 to 1,735 million annually. (See annex II for more details.)
52According to NEAP, 2002, the rehabilitation of Agadir’s
and Tangier’s bays that are threatened by erosion is estimated at Dh 150 millions.
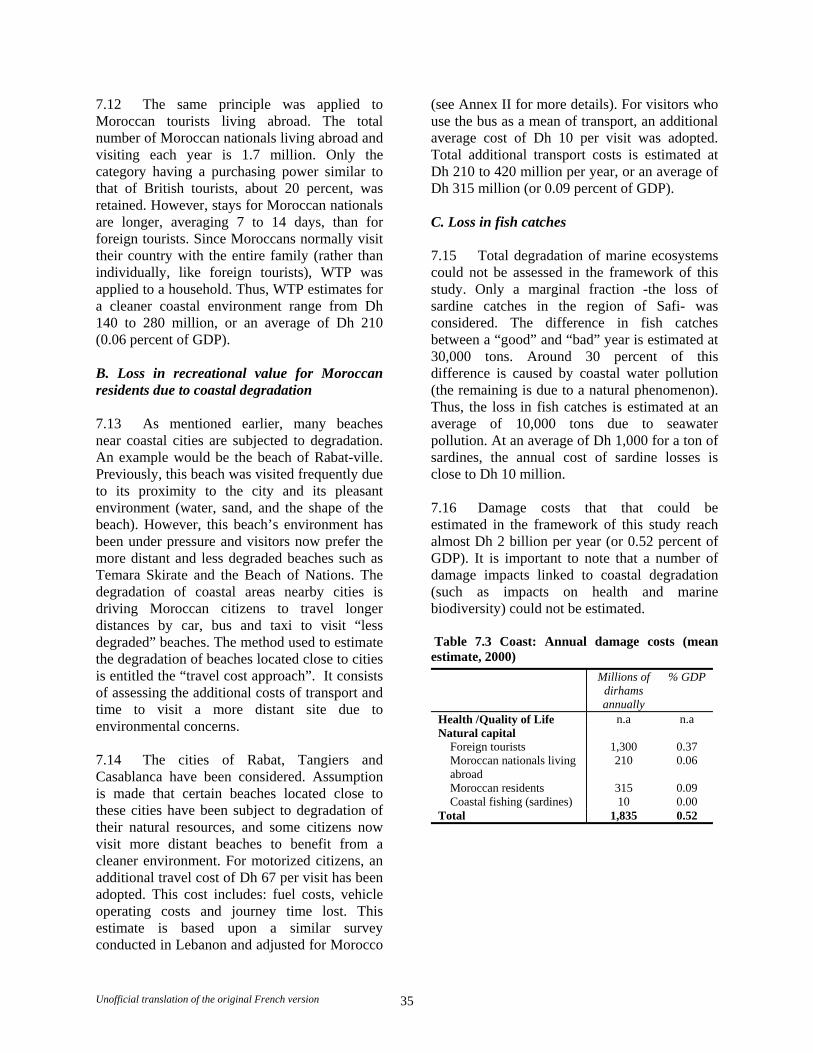
Unofficial translation of the original French version 35
7.12 The same principle was applied to Moroccan tourists living abroad. The total number of Moroccan nationals living abroad and visiting each year is 1.7 million. Only the category having a purchasing power similar to that of British tourists, about 20 percent, was retained. However, stays for Moroccan nationals are longer, averaging 7 to 14 days, than for foreign tourists. Since Moroccans normally visit their country with the entire family (rather than individually, like foreign tourists), WTP was applied to a household. Thus, WTP estimates for a cleaner coastal environment range from Dh 140 to 280 million, or an average of Dh 210 (0.06 percent of GDP). B. Loss in recreational value for Moroccan residents due to coastal degradation 7.13 As mentioned earlier, many beaches near coastal cities are subjected to degradation. An example would be the beach of Rabat-ville. Previously, this beach was visited frequently due to its proximity to the city and its pleasant environment (water, sand, and the shape of the beach). However, this beach’s environment has been under pressure and visitors now prefer the more distant and less degraded beaches such as Temara Skirate and the Beach of Nations. The degradation of coastal areas nearby cities is driving Moroccan citizens to travel longer distances by car, bus and taxi to visit “less degraded” beaches. The method used to estimate the degradation of beaches located close to cities is entitled the “travel cost approach”. It consists of assessing the additional costs of transport and time to visit a more distant site due to environmental concerns. 7.14 The cities of Rabat, Tangiers and Casablanca have been considered. Assumption is made that certain beaches located close to these cities have been subject to degradation of their natural resources, and some citizens now visit more distant beaches to benefit from a cleaner environment. For motorized citizens, an additional travel cost of Dh 67 per visit has been adopted. This cost includes: fuel costs, vehicle operating costs and journey time lost. This estimate is based upon a similar survey conducted in Lebanon and adjusted for Morocco
(see Annex II for more details). For visitors who use the bus as a mean of transport, an additional average cost of Dh 10 per visit was adopted. Total additional transport costs is estimated at Dh 210 to 420 million per year, or an average of Dh 315 million (or 0.09 percent of GDP). C. Loss in fish catches 7.15 Total degradation of marine ecosystems could not be assessed in the framework of this study. Only a marginal fraction -the loss of sardine catches in the region of Safi- was considered. The difference in fish catches between a “good” and “bad” year is estimated at 30,000 tons. Around 30 percent of this difference is caused by coastal water pollution (the remaining is due to a natural phenomenon). Thus, the loss in fish catches is estimated at an average of 10,000 tons due to seawater pollution. At an average of Dh 1,000 for a ton of sardines, the annual cost of sardine losses is close to Dh 10 million. 7.16 Damage costs that that could be estimated in the framework of this study reach almost Dh 2 billion per year (or 0.52 percent of GDP). It is important to note that a number of damage impacts linked to coastal degradation (such as impacts on health and marine biodiversity) could not be estimated. Table 7.3 Coast: Annual damage costs (mean estimate, 2000)
Millions of dirhams annually
% GDP
Health /Quality of Life n.a n.a Natural capital
Foreign tourists Moroccan nationals living abroad Moroccan residents Coastal fishing (sardines)
1,300 210
315 10
0.37 0.06
0.09 0.00
Total 1,835 0.52
Unofficial translation of the original French version 36
7.2. GLOBAL ENVIRONMENT 7.17 Impacts on the global environment are essentially linked to greenhouse gas emissions (GHG) causing gradual global warming of the planet. In Morocco, net emissions of GHG, expressed in CO2 equivalent (E-CO2), were estimated at 54 million tons in 1999 (MATUHE, 2001). 7.18 These emissions correspond to man-made GHG including carbon dioxide, methane and nitrous oxide. Emissions of carbon dioxide are considerably higher than those of methane and nitrous oxide. The main source of CO2 is the combustion of energy fuels, followed by firewood emissions and cement production. Methane emissions originate primarily from agriculture. 7.19 Based on international damage costs of US$20 per ton of carbon dioxide emitted, emissions from Morocco could correspond to damage costs estimated at close to 0.9 percent of GDP. This is an approximate estimate because the impacts of climate change vary considerably from one country to the other. In Morocco and according to the Initial National Communication Under the United Nations Framework Convention on Climate Change (MATUHE, 2001), the probable impacts of expected climate change include: “frequency and intensity of droughts, unusual devastating floods, reduction in the period of snow cover of the Rif and Atlas peaks, modification of the spatio-temporal distribution of rain, change in itinerary and passage dates of migratory birds, the appearance in Rabat of certain bird species that were not noticed except in south of Marrakech, and so on.”

Unofficial translation of the original French version 37
8. Conclusion 8.01 This study shows that the cost of environmental degradation in Morocco in 2000 was estimated to range from Dh 9.7 to 16.5 billion per year or 2.75 to 4.65 percent of GDP, with an average estimate of Dh 13.1 billion or 3.7 percent of GDP. In addition, damage costs to the global environment are valued at 0.9 percent of GDP. This value is 1.5 times higher than that of developed countries. Table 8.1 and figures 8.1 and 8.2 show the results by environmental and economic category. Table 8.1 Annual damage cost (mean estimate, 2000)
Environmental category Millions Dh/year
Percent of GDP
Water 4,354 1.23% Air 3,635 1.03% Coastal zone 1,835 0.52% Waste 1,725 0.49% Land and Forests 1,560 0.44%
Sub-total 13,109 3.71% Global environment 3,166 0.89%
Total 16,275 4.6%
8.02 Results of the present studies differ from those obtained in the 1992 strategy. The difference in results is mainly explained through improved methodologies used to estimate costs of environmental degradation. Thus, results of both studies are not comparable, since they use different evaluation methods. A special note on the subject is shown in box 1. 8.03 In the present study, environmental degradation having the greatest effects on society are: (i) water pollution, lack of adequate water supply and sanitation services and their impact on health (particularly diarrheal illnesses in children); and (ii) urban air pollution in main urban centers as well as indoor air pollution (and its impact, especially on the health of women and young children).
In addition, coastal zone and soil degradation as well as unsatisfactory waste management also have an impact on the quality of life of Moroccan citizens and the country’s natural resources. Figure 8.1 Annual damage cost by environmental category in 2000 (mean estimate, percentage of GDP)
0.00%
0.20%
0.40%
0.60%
0.80%
1.00%
1.20%
1.40%
Water Air Coastalzone
Waste Land,Forests
Figure 8.2 Annual damage cost by economic category in 2000 (mean estimate, percentage of GDP)
0.00%
0.40%
0.80%
1.20%
1.60%
2.00%
2.40%
2.80%
Health, Quality of life Natural resources
8.04 This study provides some of the remediation costs necessary to improve environmental management. These costs mainly come from the National Environmental Action Plan (2002). Even though it is still too early to make a direct comparison between remediation and damage costs, benefits from better
Unofficial translation of the original French version 38
environmental management are likely to be considerably greater than investment costs. 8.05 This study indicates which damage to the environment entails the highest degradation costs and requires priority intervention. However, cost-benefit analysis is recommended in order to identify investments capable of generating the highest benefits for the least cost. By proceeding with such a comparison, a few precautions should be considered: • Environmental degradation cannot be
completely eliminated, no matter to what extent remediation measures are in place
• Monetary quantification of environmental damage cannot be completely precise
• The principle of marginal analysis should be applied to identify remediation costs that will drive the highest profits per unit of investment.
8.06 It is important to note that due to the complexity linked to estimating certain impacts, this study does not show any impact assessment of underground water exploitation, unsanitary landfills, untreated industrial and hazardous waste and their effect on health and natural resources, and water pollution and its effect on natural ecosystems and biodiversity. Similarly, because of the complexity of land degradation and the lack of systematic data, only one side of the problem was estimated in this study. It is therefore, strongly recommended to undertake in-depth analyses of the above sectors to be able to generate a more thorough estimate of environmental degradation costs in the future.

Unofficial translation of the original French version 39
Box 1. The difference between environmental degradation costs estimated in the 1992 strategy and those of the present study. Sectors Annual Costs (millions Dh) 1992 % GDP 1992 % GDP 2000 Water 13,900 5.7% 1.2% Waste 575 0.3% 0.5% Air 4,500 1.9% 1% Land and Natural areas 710 0.3% 0.44% Coastal zone included in water/air/waste 0.5% The main difference is related to water sector. In the Strategy of 1992, child mortality due to diarrheal illnesses alone was estimated at 5.6% of GDP. While child mortality due to diarrheal illnesses is responsible for 0.5% of GDP in the present study. The difference is situated at two levels. On one hand, in 1992, diarrheal illnesses were responsible for the mortality of 10,800 children. By 2000, this number had decreased by half to reach, according to our estimates, 5,500 deaths. On the other hand, the method used to evaluate child mortality is different. In 1992, the method used was willingness to pay (WTP), with the standard being U.S. studies concerning willingness to pay to decrease the risk of adult, not child, mortality. This number reached Dh 1.26 million per death. In the present study, mortality risk assessment is based on the DALY methodology and human capital. Following these methods, mortality risk assessment in children ranges from Dh 200,000 to 450,000 per death (or four times lower than the 1992 figures). A special note justifying the use of these methods can be found in paragraph 2.19. Concerning the effects of air pollution: the Strategy of 1992 is based on a study conducted in Malaysia that was adjusted for Morocco. While the present study is based on pollution levels due to particulate matter Morocco’s main cities (such as Rabat-Sale and Casablanca), on the results of the recently completed studies: Casa-Airpol, Mohammedia-Airpol, and Safi as well as on dose-response coefficients established and acknowledged by the World Bank and WHO. Finally, with regard to the waste sector: the Strategy of 1992 is based on lack of profit due to non-recycling. The present study considers that benefits from recycling are primarily economic profit rather than environmental. The present study analyzes the impact of the lack of waste collection and cleanliness of cities as well as the impact of leachates on underground waters.
Unofficial translation of the original French version 40
Bibliography Annuaire Statistique du Maroc, Direction de la
Statistique, Ministère de la Prévision Economique et du Plan, divers année de 1983 à 2002.
Belhaj, M., The Willingness to pay for better water quality in Morocco, Gothenburg University, 1995.
Belhaj, M., Estimating the Benefits of Clean Air: Contingent Valuation and Hedonic Price Methods, Journal of Global Environment, 2003.
Bruner, A.G., R.E. Gullison, R.E. Rice, G.A.B. da Fonseca, Effectiveness of Parks in Protecting Tropical Biodiversity. Science, 291, pp. 125-128, 2001.
Casa Airpol, Etude de la Pollution Atmosphérique et de son Impact sur la Santé des Populations à Casablanca, Ministry of Land Reclamation, Water and Environment and the Ministry of Health, 2000.
Chomitz, Brenes, and Constantino Financing Environmental Services: the Costa Rican Experience and its Implications, 1998.
European Commission, Mediterranean Wetlands Socioeconomic Aspects, MedWet, 1998.
Conseil Supérieur de l’Eau et du Climat, La gestion de l’économie de l’eau, 2001.
Département du Tourisme, Le Secteur Touristique : Statistique 2000, 2000.
ENSME, Enquête Nationale sur la Santé de la Mère et de l’Enfant, PapChild, Ministry of Health, Kingdom of Morocco, 1997.
Esrey, J.,B. Potash, L. Roberts and C. Schiff, Effects of Improved Water Supply and Sanitation on Ascariasi, Diarrhea, Dracunculaisis, Hookworm Infection, Schistosomiasis, and Trachoma, WHO 1991.
FAO, Lutte Contre l'Erosion et Conservation du Sol au Maroc, Rome, 1975.
FAO, Land Resources Potential and Constraints at Regional and Country Level, World Soil Resources Report 90, Rome, 2000.
FAO, Situation des Forêts du Monde, 2001. Georgiu, S., D. Whittington, D. Pearce and D.
Moran, Economic Values and the Environment in the Developing World, Edward Elgar pour le FNUE, 1997.
Huybers, T. and Bernnett, Impact of the Environment on Holiday Destination Choices for Tropical North Queensland, Tourism Economics, 6(1), pp. 21-46, 2000.
JICA et Ministère de l’Environnement, Etude sur les
directives Nationales pour la Gestion des Déchets Solides au Royaume du Maroc, 1997.
Jorio A.., Modes de consommation, libre échange et environnement, cas du Maroc, study made for the Blue Plan, 2000.
Kunt et all, Estimating National Wealth: Methodology and Results”, Environmental Economics Series, paper N°57, World Bank, 1998.
Lal, R. Erosion-crop productivity relationships for soils of Africa. Soil Science Society of America Journal, 59, pp. 661-667, 1995.
Lvovsky, K., G. Hughes, D. Maddison, B. Ostro and D. Pearce, 2000. Environmental Costs of fossil Fuels. Environment Department Working Paper No. 78. October, Washington, D.C.: The World Bank, 2000.
MADR: Ministry of Agriculture and Rural Development. Prix Payés aux Producteurs des Produits Agricoles, Statistiques Annuelles, plusieurs années.
MADREF: Ministry of Agriculture, Rural Development, Water and Forests: « Statistiques Céréalières ». Rabat, 2001.
MAMVA: Ministry of Agriculture and Agricultural Development, Plan National d’Aménagement des Bassins Versants, Phase II, Volume 1, 1994.
MAMVA: Ministry of Agriculture and Agricultural Development, Plan National d’Aménagement des Bassins Versants Priorités régionales, Phase II Rapport de synthèse, 1995.
MAMVA: Ministry of Agriculture and Agricultural Development, Résultats de l'enquête nationale sur les terres agricoles soumises à l'érosion, Worck accomplished by Bouhouch.S, 1996.
Mathers et al, Global Burden of Disease, 2002.
MATEE: Ministry of Territorial Management, Water and Environment, Service of air and national environmental laboratory, Pollution Atmosphérique au Maroc, Situation en 2002. Study in progress (2003).
MATUHE : Ministry of Land Use Planning, Environment, Urbanism and Habitat, Surveillance de la Qualité de l'Air de la ville de Rabat, 1997.
MATUHE: Ministry of Land Use Planning, Environment, Urbanism and Habitat, Initial National Communication Under the United Nations Framework Convention on Climate Change, 2001.
Ministry of Land Use Planning and Environment, The People’s Democratic Republic of Algeria,

Unofficial translation of the original French version 41
National Action Plan for Environment and Sustainable Development (PNAE-DD), 2002.
Ministry of Environment, National Strategy for Environmental Protection and Sustainable Development, 1995.
Ministry of Equipment and, Ministry of Land Use Planning, Environment, Urbanism and Habitat Surveillance de la Qualité des Plages, 2002.
Ministry of Equipment and Transport, Réalisation et Stratégies pour la Protection de la Mer, des zones Côtières et la Gestion des Ressources Halieutiques, Direction des Ports et du Domaine Public Maritime, 2002.
Ministry of Maritime Fisheries, La mer en chiffres, 2000.
Ministry of Health, Etude de la pollution atmosphérique et de son impact sur la santé de la population de Safi, 1998.
Mohammedia Airpol, Etude de la Pollution Atmosphérique et de son Impact sur la Santé des Enfants Asthmatiques de Mohammedia, Ministry of Equipment and, Ministry of Land Use Planning, Environment, Urbanism and Habitat and Ministry of Health, 2002.
Murray, J., et A. Lopez, 1996. The global burden of disease: a comprehensive assessment of mortality and disability from diseases, injuries, and risk factors in 1990 and projected to 2020. Harvard University Press.
Niederman, M. et al., Treatment Cost of Acute Exacerbations of Chronic Bronchitis. Clinical Therapy, 21(3): pp. 576-591, 1999.
Nielsen, J. B., Gyrd-Hansen D., Kristiansen I. S. and Nexøe J., Impact of Socio-demographic Factors on Willingness to Pay for the Reduction of a Future Health Risk, Journal of Environmental Planning & Management, Vol. 46, Issue 1, 2003.
OMS/EHG/96.5, A Methodology for estimating Air Pollution-Health Effects.
ONP: National Office of Fisheries, Rapport d’Activité, 2002.
Ostro B. Estimating the Health Effects of Air Pollution: A Method with an Application to Jakarta. Work document devoted to research on policies, World Bank, Washington, D.C., 1994.
NEAP: National Environmental Action Plan, Ministry of Land Use Planning, Environment, Urbanism and Habitat, 2002.
REEM: Rapport sur l’Etat de l’Environnement du Maroc, Ministry of Land Use Planning, Environment, Urbanism and Habitat, 2001.
Santé en Chiffres, Ministry of Health, 2001.
Santé et Environnement ; Action 30 :, Ministry of Environment and Ministry of Health, 1997.
Sadoff C. The Price of Dirty Water: Pollution Costs in the Sebou Basin, World Bank, 1996.
Sbai L., Pêche Industrielle et Pêche au Maroc, 1999. Sbai L., Le Droit de l’Environnement Marin et Côtier
Marocain : Dichotomie entre l’Etat du Milieu et une Législation Obsolète, 2001.
Schulman, Ronca and Bucuvalas, Inc., Confronting COPD in North America and Europe: A Survey of Patients and Doctors in Eight Countries, 2001.
Shyamsundar P., Hamilton K., Segnestam L., Sarraf M., Fankhauser S., Country Assistance Strategies and the Environment, Document from the Department of Environment no81, World Bank, 2001.
United Nations, Perspective de la population mondiale, révision Statistique de Population, se trouve sur la page web http://esa.un.org/unpp/.
World Bank, Middle East and North Africa Environment Strategy, 1995.
World Bank, Morocco Environment Strategy Note, 1999a.
World Bank, Implementation completion report, Kingdom of Morocco, Second forestry development project», Rapport N°19212, 1999b.
World Bank, World Development Indicators, 2001. World Bank, Arab Republic of Egypt: Cost
Assessment of Environmental Degradation, Sector note no. 25175, 2002.
World Tourism Organization, Yearbook and Compendium of Tourism Statistics, Madrid Spain, 2001.
Young, A., Land degradation in South Asia: its severity, causes and effects upon the people, 1994.
Young, A., Land resources: now and for the future, Cambridge University Press, Cambridge, U.K. 1998
.

Annexe IAbréviations
Population 28,787,000 Dh =Moroccan DirhamUrban population % 55% t = ton Rural population % 45% ql = quintal qx=quintalsNumber of persons per household 5.6 hhd = householdGDP $ (current) 33,345,000,000 n.a. = not availableGDP/ capita $ 1,160 ha = hectareGDP Dh (current) 354,316,000,000 inhab. = inhabitantGDP/ capita Dh 12,300 DALY = Disability-adjusted life yearParity Dh/ $US 10.63 WTP = Willingness to pay
WATER Method Unit Unit Explanation/Reference
Health/Quality of life Low High Low High Low High Low High
-Inadequate water supply, sanitation, hygiene
DALYs (child mortality due to diarrheal illnesses)
DALYs 6,150 12,300 Dh/DALY ########### ########### 0.34% 0.68%
Inadquate water quality and lack of supply in drinking water and sanitation lead to diarrheal illnesses. These could be fatal especially with very young children. In Morocco, it is estimated that approximately 20% of mortlaity in children below five years of age are caused by diarrhea. This corresponds to about 5500 deaths per year (Annex II). Each death corresponds to 35 DALYs lost, following the methodology developed by WHO and the World Bank and detailed in Murray et Lopez (1996). The value of each DALY is estimated at GDP/capita (higher bound) and 0.5*GDP/capita (lower bound).
-Inadequate water supply, sanitation, hygiene
DALYs (child morbidity due to diarrheal illnesses)
DALYs 6,150 12,300 Dh/DALY 338,000,000 677,000,000 0.10% 0.19%
According to the National Survey on the Health of Mother and Child (ENSME, 1997), about 9% of children below five have diarrhea every 24 hours. The total number of children below the age of five being 3 million, it is estimated that there are about 100 million days where children are affected by diarrhea (equivalent to 270,000 years). By using a level of severity of 0.2 DALY per year, the total number of DALYs lost each year reaches close to 55,000. The value of a DALY is estimated at GDP/capita (higher bound) and 0.5*GDP/capita (lower bound).
-Inadequate water supply, sanitation, hygiene
Cost of treatment (non-severe cases of diarrhea)
number of treated cases
Dh/case
According to ENSME (1997), 30% of children that have diarrhea are treated with Oral Rehydration Therapy (ORT). Based on the number of days where children suffered from diarrhea, and the average length of a diarrheal illness (5 days), the total number of diarrheal cases is estimated at 19 million. Thus, close to 6 million of these cases are treated by ORT at an average cost of 60 Dh per treatment (for more details see Annex II).
-Inadequate water supply, sanitation, hygiene
Cost of treatment (severe cases of diarrhea)
number of treated cases
Dh/case
Diarrheal diseases vary by degree of severity. Severe cases need medical attention. According to ENSME (1997), about 20% of children suffering from diarrhea visit a public hospital and 7% visit a private clinic. It is estimated that each case of severe diarrhea has an economic cost around 230 Dh. This includes the cost of a medical consultation, cost of medicine as well as the time spent by the care-giver looking after the sick child (for more details check Annex II).
-Quality of life - recreational value WTP
number of urban
households
Dh/hhd./year
Water flows have a recreational value (beauty of landscape and esthetics) to citizens. Their pollution result in diminishing the welfare of citizens. A contingent valuation survey on the recreational value of the wetland of Merja Zerga in Morocco revealed people's WTP to preserve the recreation qualities of the site (European Commission, 1998). The WTP was assessed at Dh187/hhd./yr. Half of the WTP was adopted in the frame of this study to takeinto account the recreational value of lakes and river to Moroccan citizens. WTP was adjusted to take into account the inflation between 1997-2000 (or 1.9% on average).
0.98% 1.41%Natural Capital -Impacts of used domestic and industrial waters on ecosystems n.a. n.a. The impact of used non-treated municipal and industrial waters on natural resources and
the equilibrium of ecosystems could not be estimated in the frame of the study.
Dh/kwh
Dh /m3
drinking and industrial
waterSub total 1.01% 1.45%
-Silting of dams Loss in retaining capacity m3/year
Silting of dams contributes in reducing their storage capacity because of sedimentation. In Morocco, around 50 million m3 of the storage capacity is estimated to be lost due to sedimentation. This loss is equivalent to the loss of 60 million kwh in electricity (close to Dh 0.7/kwh) and 40 million m3 of drinking and industrial water (at a price varying between 3 and 5 Dh/m3 according to ONEP).
0.03%
Number
0.7
Price
50,000,000
2
196,000
55,000
5,988,000
0.08%
Economic dataMorocco
2,839,000 99
World Bank
Damage costs
281,000,000
% GDPDh/ year
42,000,000
80,000,000
5,549,000
60 359,000,000 0.10%
230 1,276,000,000 0.36%
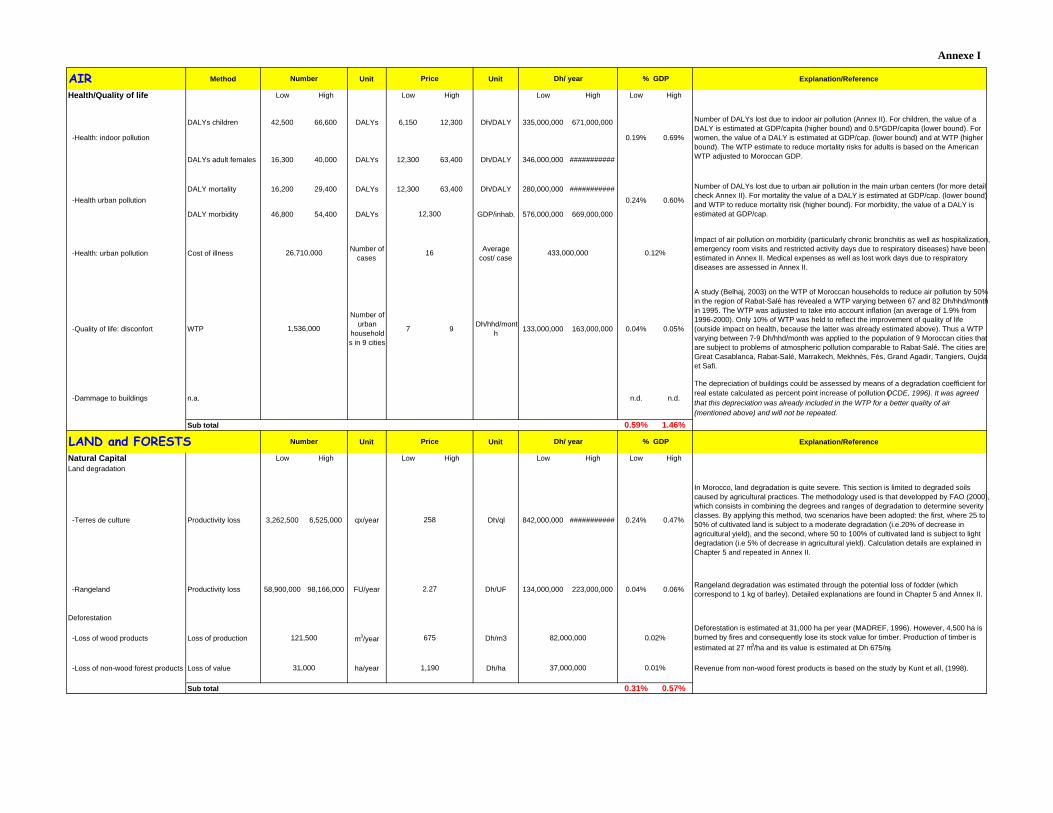
Annexe I
AIR Method Unit Unit Explanation/Reference
Health/Quality of life Low High Low High Low High Low High
DALYs children 42,500 66,600 DALYs 6,150 12,300 Dh/DALY 335,000,000 671,000,000
DALYs adult females 16,300 40,000 DALYs 12,300 63,400 Dh/DALY 346,000,000 ###########
DALY mortality 16,200 29,400 DALYs 12,300 63,400 Dh/DALY 280,000,000 ###########
DALY morbidity 46,800 54,400 DALYs GDP/inhab. 576,000,000 669,000,000
-Health: urban pollution Cost of illness Number of cases
Average cost/ case
Impact of air pollution on morbidity (particularly chronic bronchitis as well as hospitalization, emergency room visits and restricted activity days due to respiratory diseases) have been estimated in Annex II. Medical expenses as well as lost work days due to respiratory diseases are assessed in Annex II.
-Quality of life: disconfort WTP
Number of urban
households in 9 cities
7 9 Dh/hhd/month 133,000,000 163,000,000 0.04% 0.05%
A study (Belhaj, 2003) on the WTP of Moroccan households to reduce air pollution by 50% in the region of Rabat-Salé has revealed a WTP varying between 67 and 82 Dh/hhd/month in 1995. The WTP was adjusted to take into account inflation (an average of 1.9% from 1996-2000). Only 10% of WTP was held to reflect the improvement of quality of life (outside impact on health, because the latter was already estimated above). Thus a WTP varying between 7-9 Dh/hhd/month was applied to the population of 9 Moroccan cities that are subject to problems of atmospheric pollution comparable to Rabat-Salé. The cities are Great Casablanca, Rabat-Salé, Marrakech, Mekhnès, Fès, Grand Agadir, Tangiers, Oujda et Safi.
-Dammage to buildings n.a. n.d. n.d.
The depreciation of buildings could be assessed by means of a degradation coefficient for real estate calculated as percent point increase of pollution (OCDE, 1996). It was agreed that this depreciation was already included in the WTP for a better quality of air (mentioned above) and will not be repeated.
Sub total 0.59% 1.46%
LAND and FORESTS Unit Unit Explanation/Reference
Natural Capital Low High Low High Low High Low HighLand degradation
-Terres de culture Productivity loss 3,262,500 6,525,000 qx/year Dh/ql 842,000,000 ########### 0.24% 0.47%
In Morocco, land degradation is quite severe. This section is limited to degraded soils caused by agricultural practices. The methodology used is that developped by FAO (2000), which consists in combining the degrees and ranges of degradation to determine severity classes. By applying this method, two scenarios have been adopted: the first, where 25 to 50% of cultivated land is subject to a moderate degradation (i.e.20% of decrease in agricultural yield), and the second, where 50 to 100% of cultivated land is subject to light degradation (i.e 5% of decrease in agricultural yield). Calculation details are explained in Chapter 5 and repeated in Annex II.
-Rangeland Productivity loss 58,900,000 98,166,000 FU/year Dh/UF 134,000,000 223,000,000 0.04% 0.06% Rangeland degradation was estimated through the potential loss of fodder (which correspond to 1 kg of barley). Detailed explanations are found in Chapter 5 and Annex II.
Deforestation
-Loss of wood products Loss of production m3/year Dh/m3Deforestation is estimated at 31,000 ha per year (MADREF, 1996). However, 4,500 ha is burned by fires and consequently lose its stock value for timber. Production of timber is estimated at 27 m3/ha and its value is estimated at Dh 675/m3.
-Loss of non-wood forest products Loss of value ha/year Dh/ha Revenue from non-wood forest products is based on the study by Kunt et all, (1998).
Sub total 0.31% 0.57%
16 433,000,000 0.12%
12,300
0.19%
31,000
1,536,000
-Health: indoor pollution
-Health urban pollution
Number
26,710,000
Number of DALYs lost due to indoor air pollution (Annex II). For children, the value of a DALY is estimated at GDP/capita (higher bound) and 0.5*GDP/capita (lower bound). For women, the value of a DALY is estimated at GDP/cap. (lower bound) and at WTP (higher bound). The WTP estimate to reduce mortality risks for adults is based on the American WTP adjusted to Moroccan GDP.
Number of DALYs lost due to urban air pollution in the main urban centers (for more detailscheck Annex II). For mortality the value of a DALY is estimated at GDP/cap. (lower bound) and WTP to reduce mortality risk (higher bound). For morbidity, the value of a DALY is estimated at GDP/cap.
0.69%
0.24% 0.60%
Price
Number Price
675121,500
1,190
258
2.27
82,000,000
37,000,000
0.02%
0.01%
Dh/ year % GDP
% GDPDh/ year
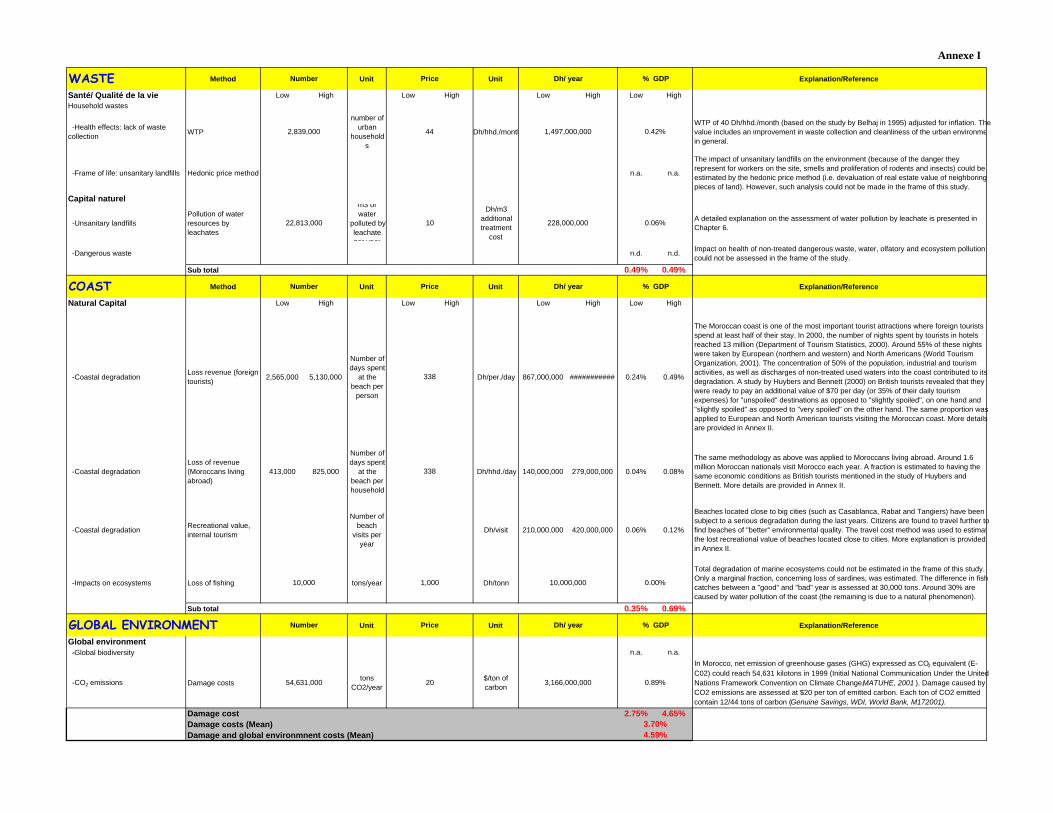
Annexe I
WASTE Method Unit Unit Explanation/Reference
Santé/ Qualité de la vie Low High Low High Low High Low HighHousehold wastes
-Health effects: lack of waste collection WTP
number of urban
households
Dh/hhd./monthWTP of 40 Dh/hhd./month (based on the study by Belhaj in 1995) adjusted for inflation. The value includes an improvement in waste collection and cleanliness of the urban environmein general.
-Frame of life: unsanitary landfills Hedonic price method n.a. n.a.
The impact of unsanitary landfills on the environment (because of the danger they represent for workers on the site, smells and proliferation of rodents and insects) could be estimated by the hedonic price method (i.e. devaluation of real estate value of neighboring pieces of land). However, such analysis could not be made in the frame of this study.
Capital naturel
-Unsanitary landfillsPollution of water resources by leachates
m3 of water
polluted by leachate per year
Dh/m3 additional treatment
cost
A detailed explanation on the assessment of water pollution by leachate is presented in Chapter 6.
-Dangerous waste n.d. n.d. Impact on health of non-treated dangerous waste, water, olfatory and ecosystem pollution could not be assessed in the frame of the study.
Sub total 0.49% 0.49%
COAST Method Unit Unit Explanation/Reference
Natural Capital Low High Low High Low High Low High
-Coastal degradation Loss revenue (foreign tourists) 2,565,000 5,130,000
Number of days spent
at the beach per
person
Dh/per./day 867,000,000 ########### 0.24% 0.49%
The Moroccan coast is one of the most important tourist attractions where foreign tourists spend at least half of their stay. In 2000, the number of nights spent by tourists in hotels reached 13 million (Department of Tourism Statistics, 2000). Around 55% of these nights were taken by European (northern and western) and North Americans (World Tourism Organization, 2001). The concentration of 50% of the population, industrial and tourism activities, as well as discharges of non-treated used waters into the coast contributed to its degradation. A study by Huybers and Bennett (2000) on British tourists revealed that they were ready to pay an additional value of $70 per day (or 35% of their daily tourism expenses) for "unspoiled" destinations as opposed to "slightly spoiled", on one hand and "slightly spoiled" as opposed to "very spoiled" on the other hand. The same proportion was applied to European and North American tourists visiting the Moroccan coast. More details are provided in Annex II.
-Coastal degradationLoss of revenue (Moroccans living abroad)
413,000 825,000
Number of days spent
at the beach per household
Dh/hhd./day 140,000,000 279,000,000 0.04% 0.08%
The same methodology as above was applied to Moroccans living abroad. Around 1.6 million Moroccan nationals visit Morocco each year. A fraction is estimated to having the same economic conditions as British tourists mentioned in the study of Huybers and Bennett. More details are provided in Annex II.
-Coastal degradation Recreational value, internal tourism
Number of beach
visits per year
Dh/visit 210,000,000 420,000,000 0.06% 0.12%
Beaches located close to big cities (such as Casablanca, Rabat and Tangiers) have been subject to a serious degradation during the last years. Citizens are found to travel further to find beaches of "better" environmental quality. The travel cost method was used to estimatthe lost recreational value of beaches located close to cities. More explanation is provided in Annex II.
-Impacts on ecosystems Loss of fishing tons/year Dh/tonn
Total degradation of marine ecosystems could not be estimated in the frame of this study. Only a marginal fraction, concerning loss of sardines, was estimated. The difference in fish catches between a "good" and "bad" year is assessed at 30,000 tons. Around 30% are caused by water pollution of the coast (the remaining is due to a natural phenomenon).
Sub total 0.35% 0.69%
GLOBAL ENVIRONMENT Unit Unit Explanation/Reference
Global environment -Global biodiversity n.a. n.a.
-CO2 emissions Damage costs tons CO2/year
$/ton of carbon
In Morocco, net emission of greenhouse gases (GHG) expressed as CO2 equivalent (E-C02) could reach 54,631 kilotons in 1999 (Initial National Communication Under the United Nations Framework Convention on Climate Change, MATUHE, 2001 ). Damage caused by CO2 emissions are assessed at $20 per ton of emitted carbon. Each ton of CO2 emitted contain 12/44 tons of carbon (Genuine Savings, WDI, World Bank, M172001).
Damage cost 2.75% 4.65%Damage costs (Mean)Damage and global environmnent costs (Mean)
Number Price
10,000
22,813,000
1,000
Number
2,839,000
338
338
Price
10
54,631,000 20 0.89%
Price
Dh/ year
10,000,000 0.00%
% GDP
Number
4.59%
3,166,000,000
% GDPDh/ year
3.70%
Dh/ year
228,000,000 0.06%
% GDP
44 1,497,000,000 0.42%

Annexe I
AbréviationsPopulation 28,787,000 Dh =Moroccan DirhamUrban population % 55% t = ton Rural population % 45% ql = quintal qx=quintalsNumber of persons per household 5.6 hhd = householdGDP $ (current) 33,345,000,000 n.a. = not availableGDP/ capita $ 1,160 ha = hectareGDP Dh (current) 354,316,000,000 inhab. = inhabitantGDP/ capita Dh 12,300 DALY = Disability-adjusted life yearParity Dh/ $US 10.63 WTP = Willingness to pay
WATER Method Number Unit Price Unit Dh/ year % GDP Explanation/Reference
Health/Quality of life -Conservation and sustainable management of water resources 1,120,000,000 Dh over 10
years 182,000,000 0.05% Structural Adjustment Programme for the Water Sector (PASE)
-Improve drinking water supply Investment cost 10,000,000,000 Dh over 10 years
1,627,000,000 0.46% Improvement of drinking water service in rural areas (PANE, 2002)
-Improve health in rural areas Strengthening capacity and raising awareness 6,000,000 Dh over 5 years 1,583,000 0.00% Establishment of awareness-raising programs; strengthening the Ministry of Health capacity;
implementation of a basic sanitation and food hygiene programme (PANE, 2001).Natural Capital
-Household and industrial wastewater Cost of treatment 9,810,000,000 Dh over 20 years 1,152,000,000 0.33% Necessary investment to improve treatment of wastewater (REEM, 2001)
Technical and legal assistance 4,500,000 Dh over 5 years 1,187,000 0.00% Establishing norms for discharge wastewater (PANE, 2002)
Technical studies 10,000,000 Dh over 10 years 1,627,000 0.00% Carrying out the ONEP programme concerning purification of small urban centers (PANE, 2002)
-Agriculture water Studies and programs 4,000,000 Dh over 10 years 651,000 0.00% Carrying out studies and establishment of programmes to control the impact of agricultural pollution
(pesticide and fertilizer) on water and soil resources, and control salinity of soils (PANE, 2002)
-Wetland conservation Technical assistance 60,000,000 Dh over 10 years 9,765,000 0.00%
Undertake technical, economic, land, legislative, statutory and institutional measures of raising awareness and research for a better conservation of the humid zones and coastal ecosystems in the Mediterannean (PANE, 2002)
AIR Method Number Unit Price Unit Dh/ year % GDP Explanation/Reference
Health/Quality of life
-Protection of the air 4,000,000,000 Dh over 20 years 470,000,000 0.13%
Development Strategy for Renewable Energies (DSRE). 20% of the programme cost that could contribute to reducing air pollution was adopted.
-Improvement of the urban and suburban environment 20,000,000,000 Dh over 20
years 2,349,000,000 0.66% SDNAL 20% of total programme cost
-Transport sector Technical assistance 20,000,000 Dh over 10 years 3,255,000 0.00%
Implementing a prevention and control programme against pollution of transport vehicles
- Energy sector Technical assistance 8,000,000 Dh over 5 years 2,110,000 0.00% Elaboration and establishment of programme of controlling pollution of the energy sector (PANE, 2002).
-Indoor air pollution Technical assistance 3,000,000 Dh over 5 years 791,000 0.00% Generalising butane use in rural areas (PANE, 2002)
-Renewable energies Technical assistance 40,000,000 Dh over 10 years 6,510,000 0.00% Raising awareness to the use of renewable energies (PANE, 2002)
MoroccoEconomic data
Remediation costs
-Household and industrial wastewater
World Bank

Annexe I
LAND, FORESTS Number Unit Price Unit Dh/ year % GDP Explanation/Reference
Natural Capital
-Control soil erosion Investment cost 150,000,000 Dh 150,000,000 0.04% Implementing measures already identified by the National Plan for Watershed Management to fight soil erosion (MAMVA, 1995). These measures need annual expenses of Dh 150 million for 20 years.
-Agricultural pollution Technical assistance 4,000,000 Dh over 5 years 1,055,000 0.00% Control of agricultural pollution impact on water, soil resources and soil salinity through studies, surveys and education (PANE, 2002)
-Management of obsolete phytosanitary products stocks Studies and programs 10,000,000 Dh over 10
years 1,627,000 0.00% Evaluate the current state of obsolete phytosanitary products in terms of quantities, qualities and stocking zones and establish elimination methods that are ecologically sound (PANE, 2002)
-Desertification Technical assistance 30,000,000 Dh over 10 years 4,882,000 0.00% Elaboration of a geographic information system on the vulnerability of soil and the desertification
phenomena and the establishment of an observatory for drought and desertification (PANE, 2002)
-Reforestation Investment cost 31,000 ha 12,262 380,122,000 0.11% Reforestation cost of the 31,000 ha of destroyed forests each year (World Bank, 1999b)
-Saving of ecosystems Technical assistance 15,000,000 Dh over 10 years 2,441,000 0.00% Mobilisation to conserve fragile ecosystems (PANE, 2002)
-Energy substitution Investment cost/ technical assistance 20,000,000 Dh over 10
years 3,255,000 0.00% Promote programmes for energy substitution (PANE, 2002)
WASTE Method Number Unit Price Unit Dh/ year % GDP Explanation/Reference
Health/Quality of life -Improvement of the urban and suburban environment Investment cost 12,000,000,000 Dh over 20
years 1,410,000,000 0.40% SDNAL 20% of total programme cost
-Waste management Technical assistance 15,500,000 Dh over 10 years 2,523,000 0.00%
Strengthening legal and institutional framework, producing an inventory of hazardous wastes, carrying out studies on socio-economic and environmental impact and implementing management plans of municipal and dangerous wastes (PANE, 2002).
-Promoting recycling Technical assistance 12,000,000 Dh over 10 years 1,953,000 0.00% Various actions to promote recycling of household wastes and introduction of ecological industries
(PANE, 2002).
-Chemical substances Technical assistance 20,000,000 Dh over 10 years 3,255,000 0.00% Elaboration and establishment of a plan for the management of chemical substances (PANE, 2002)
COAST Number Unit Price Unit Dh/ year % GDP Explanation/Reference
Natural Capital -Improvement of the urban and suburban environment Investment cost 12,000,000,000 Dh over 20 ans 1,410,000,000 0.40% SDNAL 20% of total programme cost
-Erosion of beaches Investment cost and technical assistance 150,000,000 Dh over 10 ans 24,412,000 0.01% Rehabilitation of the beach and bay of Agadir and Tangiers that are threatened by erosion (PANE ,
2002).
-Development of the coast Technical assistance 25,000,000 Dh over 10 ans 4,069,000 0.00% Establishing an Costal Observatory (PANE, 2002).
-Industrial pollution Technical assistance 341,000,000 Dh over 10 ans 55,496,000 0.02%Support programme against industrial pollution especially at the level of Casablance-Mohammedia and El Jadida and Safi (this programme also aims at reducing air pollution of industrial origin) (PANE2002).
-Marine environment Technical assistance 67,000,000 Dh over 10 ans 10,904,000 0.00% Control and monitoring the chemical and biological quality of marine environment and hygienic qualityof beaches (PANE, 2002).
-Marine biodiversity Technical assistance 17,500,000 Dh over 10 ans 2,848,000 0.00% Research and monitoring of threatened marine species (PANE, 2002) -Marine accidents Technical assistance 28,000,000 Dh over 10 ans 4,557,000 0.00% Prevention against marine accidents (PANE, 2002).
GLOBAL ENVIRONMENT Number Unit Price Unit Dh/ year % GDP Explanation/Reference
Global environment -Global biodiversity n.a.
-Programme for the reduction of CO2 Reduction cost n.a. Costs of CO2 reduction appear in programs of energy economy and the contribution to alternative energies for air pollution control.
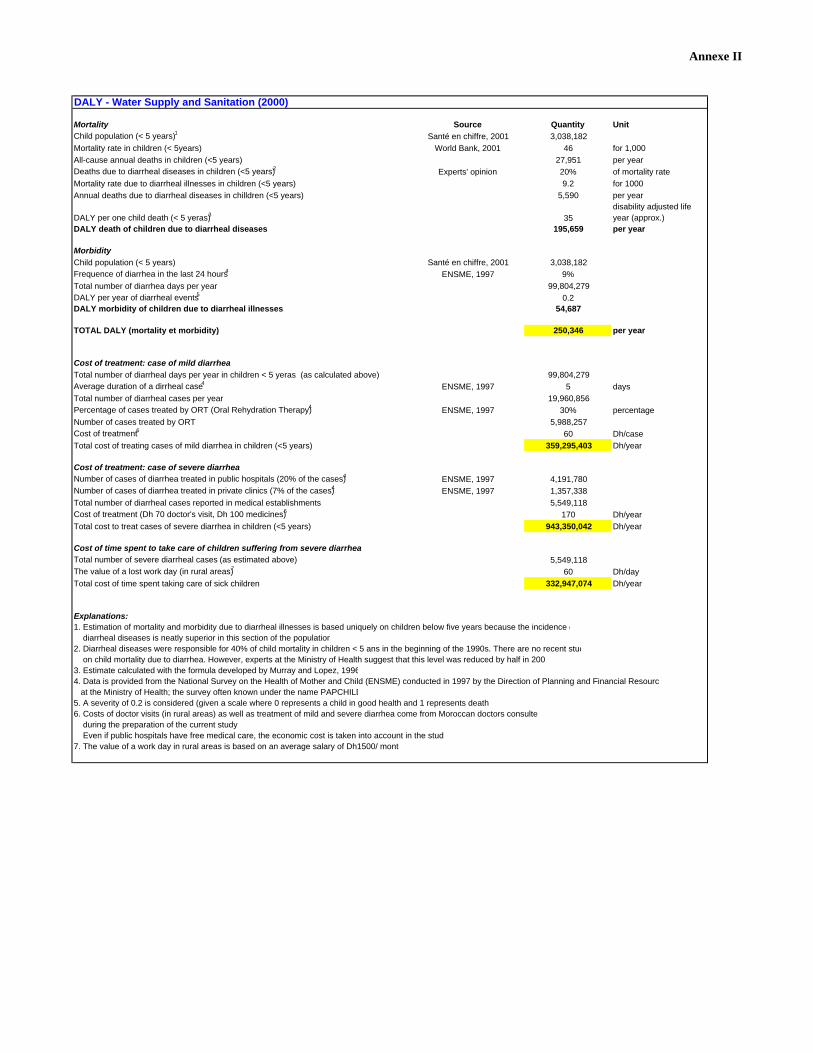
Annexe II
DALY - Water Supply and Sanitation (2000)
Mortality Source Quantity UnitChild population (< 5 years)1 Santé en chiffre, 2001 3,038,182Mortality rate in children (< 5years) World Bank, 2001 46 for 1,000All-cause annual deaths in children (<5 years) 27,951 per yearDeaths due to diarrheal diseases in children (<5 years)2 Experts' opinion 20% of mortality rateMortality rate due to diarrheal illnesses in children (<5 years) 9.2 for 1000Annual deaths due to diarrheal diseases in chilldren (<5 years) 5,590 per year
DALY per one child death (< 5 yeras)3 35disability adjusted life year (approx.)
DALY death of children due to diarrheal diseases 195,659 per year
MorbidityChild population (< 5 years) Santé en chiffre, 2001 3,038,182Frequence of diarrhea in the last 24 hours4 ENSME, 1997 9%Total number of diarrhea days per year 99,804,279DALY per year of diarrheal events5 0.2DALY morbidity of children due to diarrheal illnesses 54,687
TOTAL DALY (mortality et morbidity) 250,346 per year
Cost of treatment: case of mild diarrheaTotal number of diarrheal days per year in children < 5 yeras (as calculated above) 99,804,279Average duration of a dirrheal case4 ENSME, 1997 5 daysTotal number of diarrheal cases per year 19,960,856Percentage of cases treated by ORT (Oral Rehydration Therapy)4 ENSME, 1997 30% percentageNumber of cases treated by ORT 5,988,257Cost of treatment6 60 Dh/caseTotal cost of treating cases of mild diarrhea in children (<5 years) 359,295,403 Dh/year
Cost of treatment: case of severe diarrheaNumber of cases of diarrhea treated in public hospitals (20% of the cases)4 ENSME, 1997 4,191,780Number of cases of diarrhea treated in private clinics (7% of the cases)4 ENSME, 1997 1,357,338Total number of diarrheal cases reported in medical establishments 5,549,118Cost of treatment (Dh 70 doctor's visit, Dh 100 medicines)6 170 Dh/yearTotal cost to treat cases of severe diarrhea in children (<5 years) 943,350,042 Dh/year
Cost of time spent to take care of children suffering from severe diarrheaTotal number of severe diarrheal cases (as estimated above) 5,549,118The value of a lost work day (in rural areas)7 60 Dh/dayTotal cost of time spent taking care of sick children 332,947,074 Dh/year
Explanations:1. Estimation of mortality and morbidity due to diarrheal illnesses is based uniquely on children below five years because the incidence o diarrheal diseases is neatly superior in this section of the population2. Diarrheal diseases were responsible for 40% of child mortality in children < 5 ans in the beginning of the 1990s. There are no recent stud on child mortality due to diarrhea. However, experts at the Ministry of Health suggest that this level was reduced by half in 2003. Estimate calculated with the formula developed by Murray and Lopez, 19964. Data is provided from the National Survey on the Health of Mother and Child (ENSME) conducted in 1997 by the Direction of Planning and Financial Resource at the Ministry of Health; the survey often known under the name PAPCHILD5. A severity of 0.2 is considered (given a scale where 0 represents a child in good health and 1 represents death6. Costs of doctor visits (in rural areas) as well as treatment of mild and severe diarrhea come from Moroccan doctors consulte during the preparation of the current study Even if public hospitals have free medical care, the economic cost is taken into account in the study7. The value of a work day in rural areas is based on an average salary of Dh1500/ month
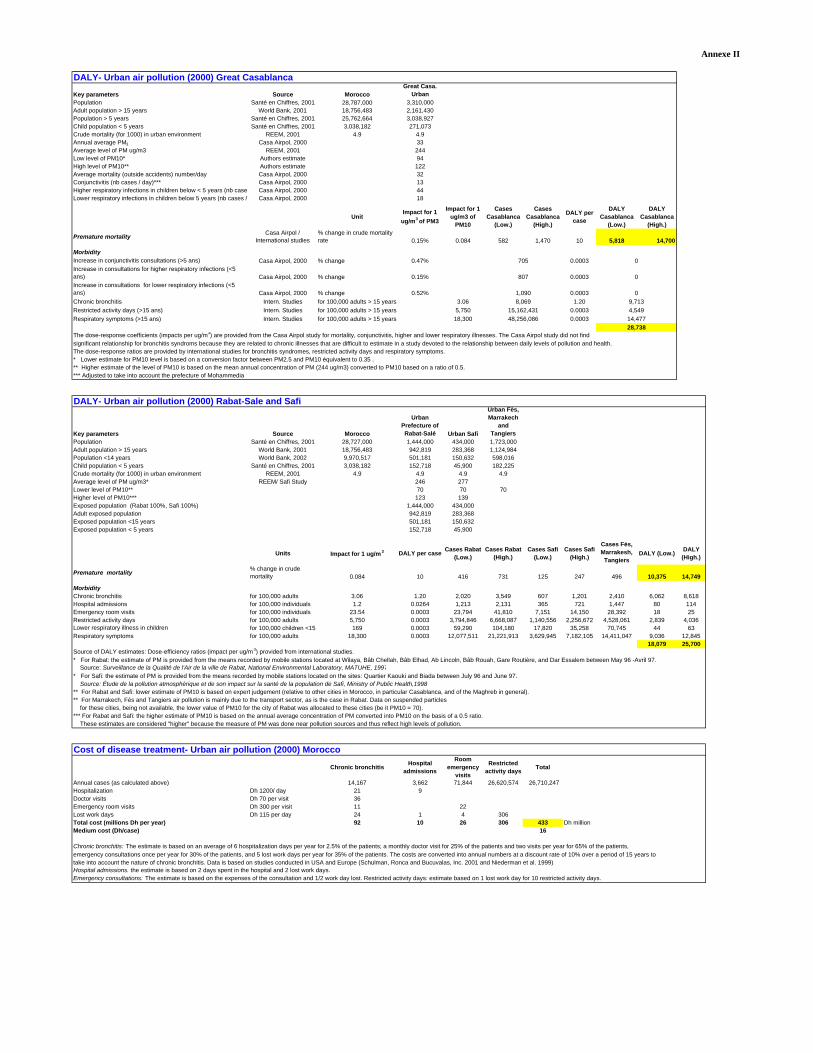
Annexe II
DALY- Urban air pollution (2000) Great Casablanca
Key parameters Source MoroccoGreat Casa.
UrbanPopulation Santé en Chiffres, 2001 28,787,000 3,310,000Adult population > 15 years World Bank, 2001 18,756,483 2,161,430Population > 5 years Santé en Chiffres, 2001 25,762,664 3,038,927Child population < 5 years Santé en Chiffres, 2001 3,038,182 271,073Crude mortality (for 1000) in urban environment REEM, 2001 4.9 4.9Annual average PM3 Casa Airpol, 2000 33Average level of PM ug/m3 REEM, 2001 244Low level of PM10* Authors estimate 94High level of PM10** Authors estimate 122Average mortality (outside accidents) number/day Casa Airpol, 2000 32Conjunctivitis (nb cases / day)*** Casa Airpol, 2000 13Higher respiratory infections in children below < 5 years (nb case Casa Airpol, 2000 44Lower respiratory infections in children below 5 years (nb cases / Casa Airpol, 2000 18
UnitImpact for 1
ug/m3 of PM3
Impact for 1 ug/m3 of
PM10
Cases Casablanca
(Low.)
Cases Casablanca
(High.)
DALY per case
DALY Casablanca
(Low.)
DALY Casablanca
(High.)
Premature mortality Casa Airpol / International studies
% change in crude mortality rate 0.15% 0.084 582 1,470 10 5,818 14,700
MorbidityIncrease in conjunctivitis consultations (>5 ans) Casa Airpol, 2000 % change 0.47% 0.0003Increase in consultations for higher respiratory infections (<5 ans) Casa Airpol, 2000 % change 0.15% 0.0003Increase in consultations for lower respiratory infections (<5 ans) Casa Airpol, 2000 % change 0.52% 0.0003Chronic bronchitis Intern. Studies for 100,000 adults > 15 years 3.06 1.20Restricted activity days (>15 ans) Intern. Studies for 100,000 adults > 15 years 5,750 0.0003Respiratory symptoms (>15 ans) Intern. Studies for 100,000 adults > 15 years 18,300 0.0003
The dose-response coefficients (impacts per ug/m3) are provided from the Casa Airpol study for mortality, conjunctivitis, higher and lower respiratory illnesses. The Casa Airpol study did not find significant relationship for bronchitis syndroms because they are related to chronic illnesses that are difficult to estimate in a study devoted to the relationship between daily levels of pollution and health.The dose-response ratios are provided by international studies for bronchitis syndromes, restricted activity days and respiratory symptoms.* Lower estimate for PM10 level is based on a conversion factor between PM2.5 and PM10 équivalent to 0.35 .** Higher estimate of the level of PM10 is based on the mean annual concentration of PM (244 ug/m3) converted to PM10 based on a ratio of 0.5.*** Adjusted to take into account the prefecture of Mohammedia
DALY- Urban air pollution (2000) Rabat-Sale and Safi
Key parameters Source Morocco
Urban Prefecture of Rabat-Salé Urban Safi
Urban Fès, Marrakech
and Tangiers
Population Santé en Chiffres, 2001 28,727,000 1,444,000 434,000 1,723,000Adult population > 15 years World Bank, 2001 18,756,483 942,819 283,368 1,124,984Population <14 years World Bank, 2002 9,970,517 501,181 150,632 598,016Child population < 5 years Santé en Chiffres, 2001 3,038,182 152,718 45,900 182,225Crude mortality (for 1000) in urban environment REEM, 2001 4.9 4.9 4.9 4.9Average level of PM ug/m3* REEM/ Safi Study 246 277Lower level of PM10** 70 70 70Higher level of PM10*** 123 139Exposed population (Rabat 100%, Safi 100%) 1,444,000 434,000Adult exposed population 942,819 283,368Exposed population <15 years 501,181 150,632Exposed population < 5 years 152,718 45,900
Units Impact for 1 ug/m3 DALY per case Cases Rabat (Low.)
Cases Rabat (High.)
Cases Safi (Low.)
Cases Safi (High.)
Cases Fès, Marrakesh,
Tangiers DALY (Low.) DALY
(High.)
Premature mortality % change in crude mortality 0.084 10 416 731 125 247 496 10,375 14,749
MorbidityChronic bronchitis for 100,000 adults 3.06 1.20 2,020 3,549 607 1,201 2,410 6,062 8,618Hospital admissions for 100,000 individuals 1.2 0.0264 1,213 2,131 365 721 1,447 80 114Emergency room visits for 100,000 individuals 23.54 0.0003 23,794 41,810 7,151 14,150 28,392 18 25Restricted activity days for 100,000 adults 5,750 0.0003 3,794,846 6,668,087 1,140,556 2,256,672 4,528,061 2,839 4,036Lower respiratory illness in children for 100,000 children <15 169 0.0003 59,290 104,180 17,820 35,258 70,745 44 63Respiratory symptoms for 100,000 adults 18,300 0.0003 12,077,511 21,221,913 3,629,945 7,182,105 14,411,047 9,036 12,845
18,079 25,700Source of DALY estimates: Dose-efficiency ratios (impact per ug/m 3) provided from international studies.* For Rabat: the estimate of PM is provided from the means recorded by mobile stations located at Wilaya, Bâb Chellah, Bâb Elhad, Ab Lincoln, Bâb Rouah, Gare Routière, and Dar Essalem between May 96 -Avril 97. Source: Surveillance de la Qualité de l'Air de la ville de Rabat, National Environmental Laboratory, MATUHE, 1997* For Safi: the estimate of PM is provided from the means recorded by mobile stations located on the sites: Quartier Kaouki and Biada between July 96 and June 97. Source: Étude de la pollution atmosphérique et de son impact sur la santé de la population de Safi, Ministry of Public Health,1998** For Rabat and Safi: lower estimate of PM10 is based on expert judgement (relative to other cities in Morocco, in particular Casablanca, and of the Maghreb in general).** For Marrakech, Fès and Tangiers air pollution is mainly due to the transport sector, as is the case in Rabat. Data on suspended particles for these cities, being not available, the lower value of PM10 for the city of Rabat was allocated to these cities (be it PM10 = 70).*** For Rabat and Safi: the higher estimate of PM10 is based on the annual average concentration of PM converted into PM10 on the basis of a 0.5 ratio. These estimates are considered "higher" because the measure of PM was done near pollution sources and thus reflect high levels of pollution.
Cost of disease treatment- Urban air pollution (2000) Morocco
Chronic bronchitis Hospital admissions
Room emergency
visits
Restricted activity days Total
Annual cases (as calculated above) 14,167 3,662 71,844 26,620,574 26,710,247 Hospitalization Dh 1200/ day 21 9Doctor visits Dh 70 per visit 36Emergency room visits Dh 300 per visit 11 22Lost work days Dh 115 per day 24 1 4 306Total cost (millions Dh per year) 92 10 26 306 433 Dh millionMedium cost (Dh/case) 16
Chronic bronchitis: The estimate is based on an average of 6 hospitalization days per year for 2.5% of the patients; a monthly doctor visit for 25% of the patients and two visits per year for 65% of the patients,emergency consultations once per year for 30% of the patients, and 5 lost work days per year for 35% of the patients. The costs are converted into annual numbers at a discount rate of 10% over a period of 15 years totake into account the nature of chronic bronchitis. Data is based on studies conducted in USA and Europe (Schulman, Ronca and Bucuvalas, Inc. 2001 and Niederman et al. 1999)Hospital admissions: the estimate is based on 2 days spent in the hospital and 2 lost work days.Emergency consultations: The estimate is based on the expenses of the consultation and 1/2 work day lost. Restricted activity days: estimate based on 1 lost work day for 10 restricted activity days.
705
1,090
807
8,06915,162,43148,256,086
4,54914,477
09,713
28,738
0
0

Annexe II
DALYs Indoor air pollution (2000)
Key parameters Morocco Source Population (million) 28,787,000Under five mortality rate (per 1,000 live births) 46Rural population (%) 45%Rural population 12,890,000Gross birth rate (per 1000 inhabitants) 22 Santé en chiffres, 2001Use of commercial energy (koe/inhab./year) 337 REEM, 2001 Biomass utilisation in rural areas (toe/year)* 3,700,000 Exposed population (% total population)** 38% Based: 85% of the rural population uses biomass
Estimate "Lower bound" NBD deaths Exposed population (PP)
Odds ratio (OR) PAR Death DALYs
Severe respiratory infections (child < 5 years) 4,400 38% 2 0.276 1213 42,455Chronic obstructive pulmonary diseases (adult females > 15 years) 2,050 38% 2 0.276 565 11,303Heart diseases (adult females >15years) 13,700 38% 1.1 0.037 502 5,023
58,781
Estimate "Higher bound" NBD deaths Exposed population (PP)
Odds ratio (OR) PAR Death DALYs
Severe respiratory infections (child < 5 years) 4,400 38% 3 0.432 1902 66,560Chronic obstructive pulmonary diseases (adult females > 15 years) 2,050 38% 4 0.533 1093 21,857Heart diseases (adult females >15years) 13,700 38% 1.4 0.132 1810 18,101
106,519
DATA:The National Burden of Disease (NBD) for Morocco is assessed by the extrapolation of data provided bythe WHO (Burden of Disease) and the World Bank for the countries having a longevity rate and level of mortality similar to Morocco. Biomass utilisation in percentage of the total energy consumption is provided by REEM, 2001.The Odds Ratios (OR) are provided by the study of Smith (2000) and reflect a review of major international studies.
Severe respiratory infections (child < 5 years): Diseases of the respiratory system are responsible for 15.7% of deaths in children.aged between 1-4 years (Santé en Chiffres, 2001). Chronic obstructive pulmonary diseases (female adults > 15 years): close to 3% of female adult deaths is due to chronic obstructive pulmonary diseasesaccording to the data form the World Bank and WHO.Heart illnesses (adult females >15 years): close to 20% of adult female deaths is due to ischemic cardiac diseasesaccording to data from the NBD, WHO and the World Bank.
METHODOLOGYPAR=PP*(OR-1)/(PP*(OR-1)+1)The methodology used is provided by Smith (2000). It is based on statistics of the National Burden of Disease (NBD)for illness and morbidity associated to indoor air pollution. The Odds ratios are based on international studiesreflecting increase in risk of disease associated with indoor use of biomass. DALYs are based on discounted years of life lost for each illness. Only mortality is included as Smith estimates that DALYs from morbidity are insignificant relatvie to morbidity.DALYs are only estimated for children less than 5 years of age and adult women because these groups are likely to disproportionately more time indoors than school children and adult men.
Explanation* Total commercial energy consumption in1999 (toe) 9,700,000 REEM, 2001 Total biomass consumption in 1999 (toe) 4,157,100 REEM: traditional energy = 30% dof global energy Global energy consumption in 1999 (toe) 13,857,000 Biomass consumption in rural areas in 1999 (toe) 3,699,819 Ministry of Energy, Consumption of biomass in rural areas=89%total consumption.
**Biomass utilisation in rural areas per inhabitant (koe/inhab./year) 287 Share of the rural population consuming biomass 85% Based on a consumption of 340 koe/inhab./year
Santé en chiffres, 2001World Bank, 2001

Annexe II
Degraded rangeland
Watershed basins Total area Rangeland areaFodder
productionUnit
productionDegraded rangeland Degraded area
ha ha 000 FU FU/ha/year (%) haDominant steppeM Dahbi;Y Ben Tachafine; Al Massira; 5,168,400 2,220,139 193,838 87 59% 1,309,882Md V; 4,992,000 3,269,912 238,377 73 38% 1,242,567Ibn Battouta;Nakhla 28,500 25,366 4,080 161 38% 9,639Total 10,188,900 5,515,417 436,295 79 46% 2,562,088
Dominant forestKansara 454,000 112,362 11,832 105 18% 20,225HassI, My Youssef; Bine el ouidane; L 1,121,800 440,204 52,194 119 3% 13,206O Makhazine; IdrissI; Al Khattabi; Oueh 1,243,300 432,468 76,333 177 36% 155,688SMBA 980,000 425,859 67,073 158 18% 76,655Total 3,799,100 1,410,893 207,432 558 19% 265,774
Degraded agricultural landLower bound Higher bound
Moderate erosionShare of degraded land 25% 50%Degraded agricultural land (ha) 2,175,000 4,350,000Level of decrease 20% 20%Cereal yield (qx/ha) 10 10Yield decrease (qx/ha) 2 2Production lost (qx) 4,350,000 8,700,000Selling price (wheat equivalent) (Dh/ql) 258 258Value lost (Dh) 1,122,300,000 2,244,600,000
Slight erosionShare of degraded land 50% 100%Degraded agricultural land (ha) 4,350,000 8,700,000Level of decrease 5% 5%Yield decrease (qx/ha) 0.5 0.5Production lost (qx) 2,175,000 4,350,000Selling price (wheat equivalent) (Dh/ql) 258 258Value lost (Dh) 561,150,000 1,122,300,000
Average 841,725,000 1,683,450,000Average 1,262,587,500

Annexe II
WTP of foreign tourists and Moroccan citizens living abroad to improve the coastBackground data 2000 SourceTotal tourists (Foreigners and Moroccans living abroad) 4,113,037 Department of Tourism, Statistics, 2000Tourists of foreign nationalities 2,462,894 Department of Tourism, Statistics, 2001 of which North Americans 155,388 Department of Tourism, Statistics, 2002 of which North and West Europeans (representing 55% of European tourists, WTO, 1999) 1,127,211 Total tourists North American and North/West Europeans 1,282,599Moroccan nationals 1,650,143 Department of Tourism, Statistics, 2002
Number nights in classed hotels (occupied by foreign tourists) 13,539,586Hypothesis: all foreign tourists residing in classed hotels
Average length of stay of foreign tourists (days) 5.5 dTotal tourism expenses (Dh) 21,644,000,000 Department of Tourism, Statistics, 2002Average tourism expenses (Dh/pers/day) 957
Expenses of British tourists in touristic destinations (average in $US) 2,775 Huybert & BenetteAverage of British tourists stays 14 Huybert & BenetteBritish tourism expenses ($US/day) 198WTP to improve environment 70 Huybert & BenetteWTP as % of total expenses 35%
WTP by American and European tourists to conserve the coast Lower bound Higher boundAverage stay by A&E tourists on the coast (1/3 and 2/3 total stays) 2 4WTP to improve the coast (35% of tourist expenses) Dh/person/dayWTP total to improve the coast (Dh) 867,000,000 1,735,000,000
WTP by Moroccan nationals living aborad to protect the coast Moroccan households having similar economic conditions as A&E tourists (20% of nationals)Average stay of Moroccan nationals on the coast (days) 7 14WTP per household/dayWTP total to improve coastal environment Dh 139,482,005 278,964,010
Loss in recreational value for Moroccan residents due to the degradation of the beachBeach visit by car Lower bound Higher boundUrban population Rabat-Tangiers-CasablancaNumber of urban households in Rabat- Tangiers-CasablancaPercentage of households with cars (20%)% of households with cars that visit more distant beaches for environmental reasons (assumption: 50%)Number of visits to the beach by car (visit/household/year) 10 20Number of visits to the beach by car (total/year) 937,000 1,874,000Additional travel cost by car* (Dh/visit)Total cost 157,416,000 314,832,000
Beach visit by bus and taxiNumber of persons of Rabat-Tangiers-Casa visiting beaches by bus or taxi (20%)Nb of persons visiting more distant beaches for environmental reasons (assumption:50%)Nombre de visites moyennes par personne par an 10 20Average additional cost to visit a more distant beach (Dh 10/pers/day)Total additional cost 52,480,000 104,960,000
* Additional travel cost is based upon cost of vehicle functioning (of $0.45/km or Dh 4.6/km according to a survey conducted by Sarraf M., Larsen B.and Owaygen M. "Cost Assessment of Environnmental Degradation in Lebanon" not published); an additional distance of 30 km (round trip); andan additional time of 2h estimated at Dh15/hr.
10
187,400
168
58,934
338
5,248,000937,143
93,700
338
1,049,600524,800
Related Documents