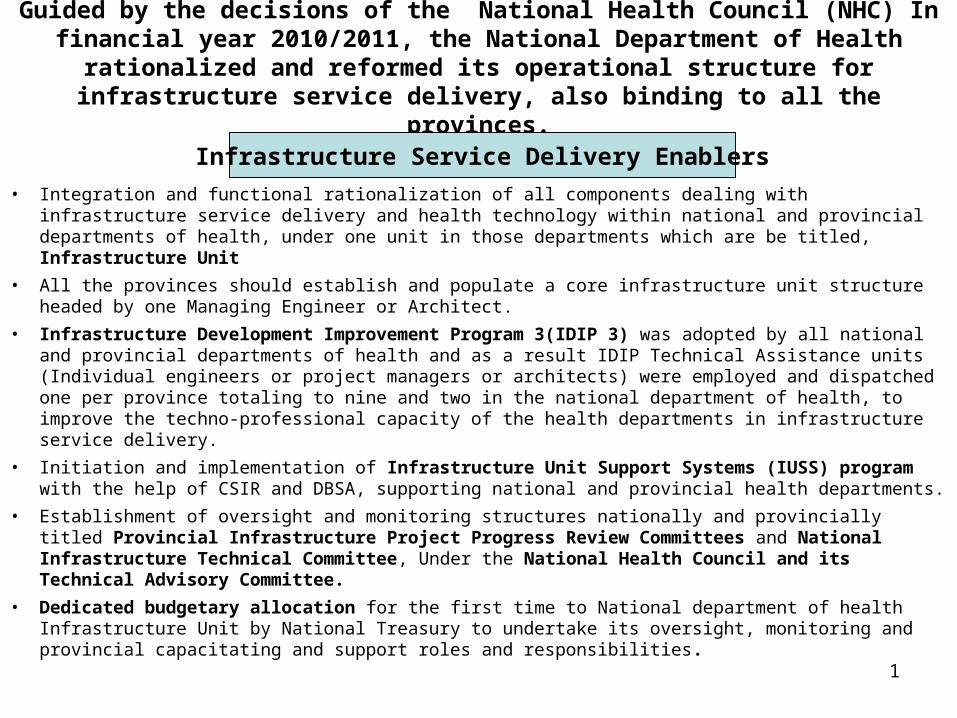
Guided by the decisions of the National Health Council (NHC) In financial year 2010/2011, the National Department of Health rationalized and reformed its operational structure for infrastructure service delivery, also binding to all the provinces. • Integration and functional rationalization of all components dealing with infrastructure service delivery and health technology within national and provincial departments of health, under one unit in those departments which are be titled, Infrastructure Unit • All the provinces should establish and populate a core infrastructure unit structure headed by one Managing Engineer or Architect. • Infrastructure Development Improvement Program 3(IDIP 3) was adopted by all national and provincial departments of health and as a result IDIP Technical Assistance units (Individual engineers or project managers or architects) were employed and dispatched one per province totaling to nine and two in the national department of health, to improve the techno-professional capacity of the health departments in infrastructure service delivery. • Initiation and implementation of Infrastructure Unit Support Systems (IUSS) program with the help of CSIR and DBSA, supporting national and provincial health departments. • Establishment of oversight and monitoring structures nationally and provincially titled Provincial Infrastructure Project Progress Review Committees and National Infrastructure Technical Committee, Under the National Health Council and its Technical Advisory Committee. • Dedicated budgetary allocation for the first time to National department of health Infrastructure Unit by National Treasury to undertake its oversight, monitoring and provincial capacitating and support roles and responsibilities. Infrastructure Service Delivery Enablers 1

Infrastructure Service Delivery Enablers
Jan 13, 2016
Guided by the decisions of the National Health Council (NHC) In financial year 2010/2011, the National Department of Health rationalized and reformed its operational structure for infrastructure service delivery, also binding to all the provinces. Infrastructure Service Delivery Enablers. - PowerPoint PPT Presentation
Welcome message from author
This document is posted to help you gain knowledge. Please leave a comment to let me know what you think about it! Share it to your friends and learn new things together.
Transcript
Guided by the decisions of the National Health Council (NHC) In financial year 2010/2011, the National Department of Health rationalized and reformed its
operational structure for infrastructure service delivery, also binding to all the provinces.
• Integration and functional rationalization of all components dealing with infrastructure service delivery and health technology within national and provincial departments of health, under one unit in those departments which are be titled, Infrastructure Unit
• All the provinces should establish and populate a core infrastructure unit structure headed by one Managing Engineer or Architect.
• Infrastructure Development Improvement Program 3(IDIP 3) was adopted by all national and provincial departments of health and as a result IDIP Technical Assistance units (Individual engineers or project managers or architects) were employed and dispatched one per province totaling to nine and two in the national department of health, to improve the techno-professional capacity of the health departments in infrastructure service delivery.
• Initiation and implementation of Infrastructure Unit Support Systems (IUSS) program with the help of CSIR and DBSA, supporting national and provincial health departments.
• Establishment of oversight and monitoring structures nationally and provincially titled Provincial Infrastructure Project Progress Review Committees and National Infrastructure Technical Committee, Under the National Health Council and its Technical Advisory Committee.
• Dedicated budgetary allocation for the first time to National department of health Infrastructure Unit by National Treasury to undertake its oversight, monitoring and provincial capacitating and support roles and responsibilities.
Infrastructure Service Delivery Enablers
1
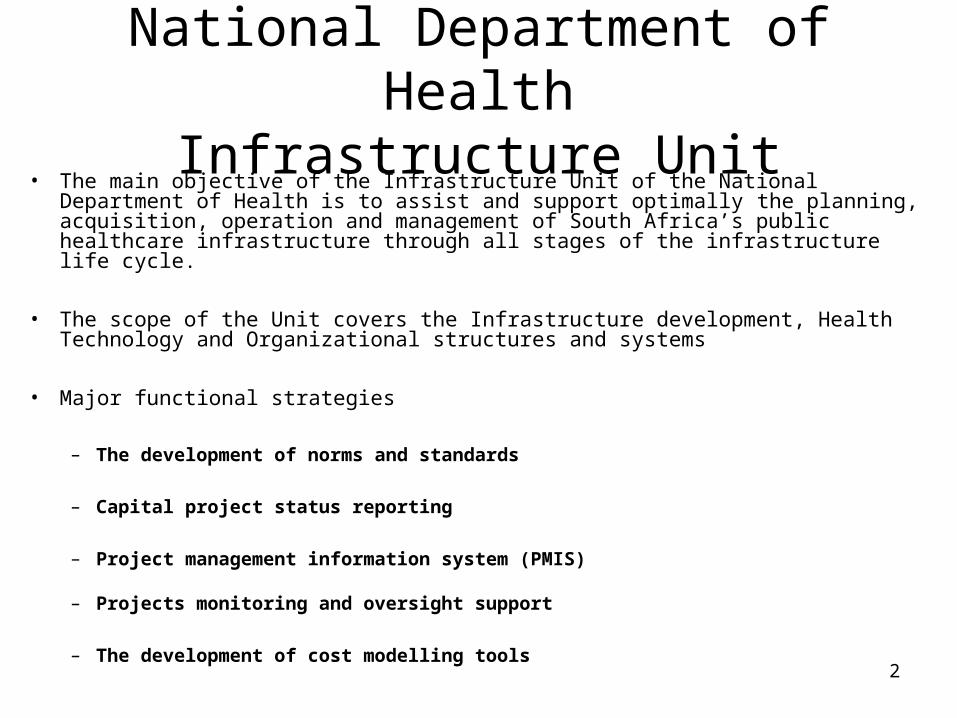
National Department of HealthInfrastructure Unit
• The main objective of the Infrastructure Unit of the National Department of Health is to assist and support optimally the planning, acquisition, operation and management of South Africa’s public healthcare infrastructure through all stages of the infrastructure life cycle.
• The scope of the Unit covers the Infrastructure development, Health Technology and Organizational structures and systems
• Major functional strategies
– The development of norms and standards
– Capital project status reporting
– Project management information system (PMIS)
– Projects monitoring and oversight support
– The development of cost modelling tools
2
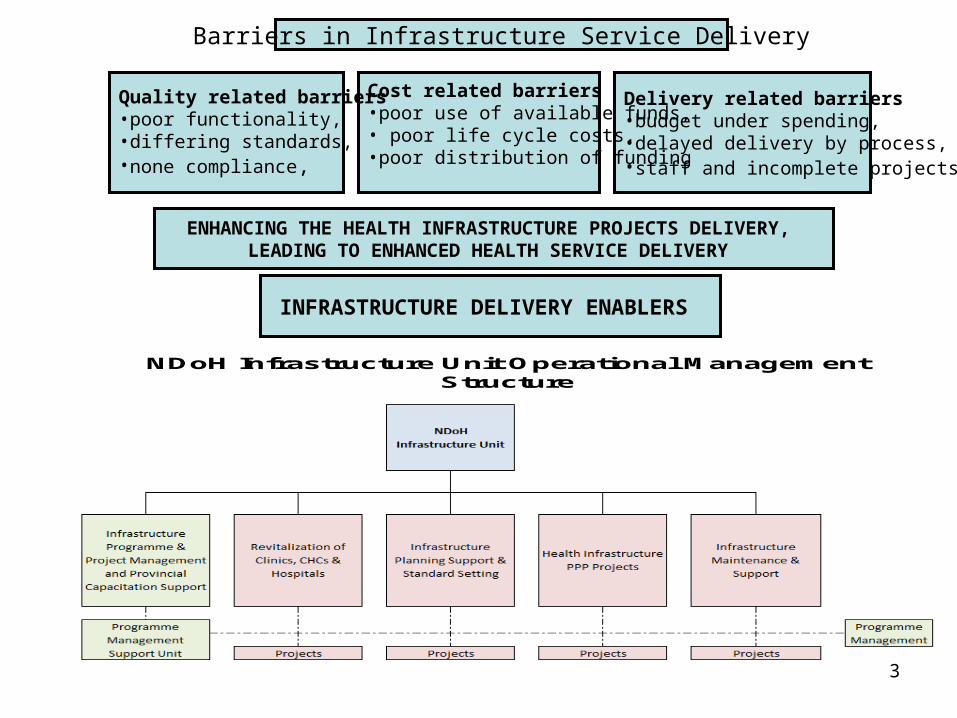
ENHANCING THE HEALTH INFRASTRUCTURE PROJECTS DELIVERY, LEADING TO ENHANCED HEALTH SERVICE DELIVERY
Delivery related barriers•budget under spending, •delayed delivery by process, •staff and incomplete projects.
Cost related barriers•poor use of available funds,• poor life cycle costs, •poor distribution of funding
Quality related barriers•poor functionality, •differing standards, •none compliance,
NDoH Infrastructure Unit Operational Management Structure
INFRASTRUCTURE DELIVERY ENABLERS
Barriers in Infrastructure Service Delivery
3
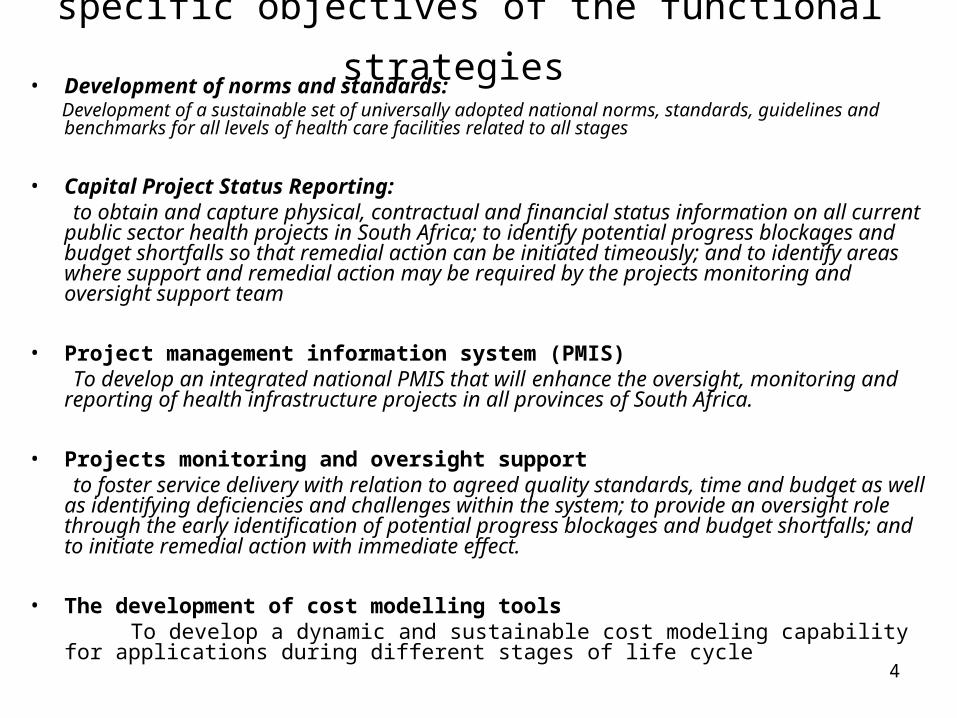
specific objectives of the functional strategies • Development of norms and standards: Development of a sustainable set of universally adopted national norms, standards, guidelines and
benchmarks for all levels of health care facilities related to all stages
• Capital Project Status Reporting: to obtain and capture physical, contractual and financial status information on all current
public sector health projects in South Africa; to identify potential progress blockages and budget shortfalls so that remedial action can be initiated timeously; and to identify areas where support and remedial action may be required by the projects monitoring and oversight support team
• Project management information system (PMIS) To develop an integrated national PMIS that will enhance the oversight, monitoring and
reporting of health infrastructure projects in all provinces of South Africa.
• Projects monitoring and oversight support to foster service delivery with relation to agreed quality standards, time and budget as well
as identifying deficiencies and challenges within the system; to provide an oversight role through the early identification of potential progress blockages and budget shortfalls; and to initiate remedial action with immediate effect.
• The development of cost modelling tools To develop a dynamic and sustainable cost modeling capability for applications during
different stages of life cycle
4
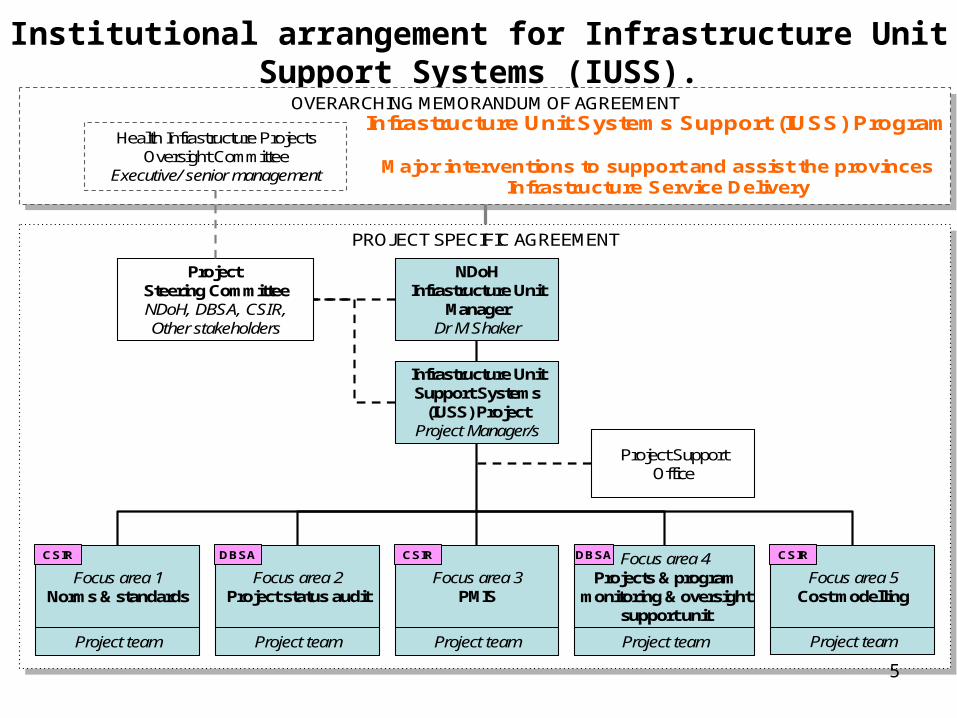
Institutional arrangement for Infrastructure Unit Support Systems (IUSS).
INFRASTRUCTURE UNIT
PROJECT SPECIFIC AGREEMENTPROJECT SPECIFIC AGREEMENT
OVERARCHING MEMORANDUM OF AGREEMENTOVERARCHING MEMORANDUM OF AGREEMENT
NDoHInfrastructure Unit
ManagerDr M Shaker
Infrastructure UnitSupport Systems
(IUSS) ProjectProject Manager/s
Project Steering CommitteeNDoH, DBSA, CSIR,Other stakeholders
Project SupportOffice
Focus area 1Norms & standards
Focus area 3PMIS
Focus area 4Projects & program
monitoring & oversightsupport unit
Focus area 5Cost modelling
Focus area 2Project status audit
Health Infrastructure ProjectsOversight Committee
Executive/ senior management
Project team Project team Project team Project team Project team
Infrastructure Unit Systems Support (IUSS) Program
Major interventions to support and assist the provincesInfrastructure Service Delivery
DBSA DBSACSIR CSIR CSIR
5
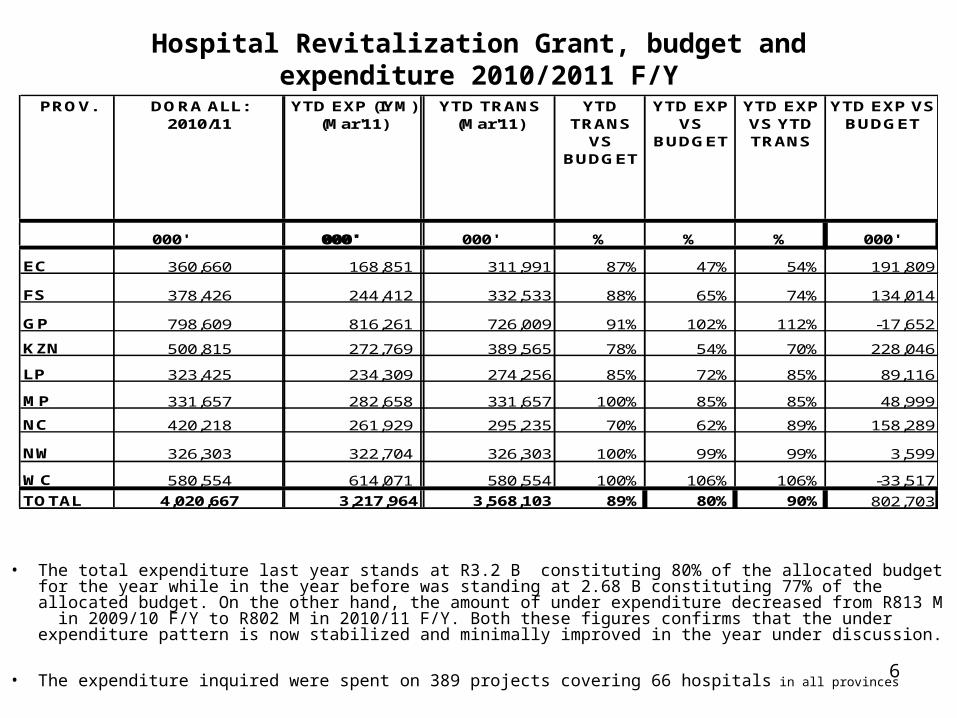
Hospital Revitalization Grant, budget and expenditure 2010/2011 F/Y
• The total expenditure last year stands at R3.2 B constituting 80% of the allocated budget for the year while in the year before was standing at 2.68 B constituting 77% of the allocated budget. On the other hand, the amount of under expenditure decreased from R813 M in 2009/10 F/Y to R802 M in 2010/11 F/Y. Both these figures confirms that the under expenditure pattern is now stabilized and minimally improved in the year under discussion.
• The expenditure inquired were spent on 389 projects covering 66 hospitals in all provinces
PROV. DORA ALL: 2010/11
YTD EXP (IYM) (Mar'11)
YTD FAC (M
YTD TRANS (Mar'11)
YTD TRANS
VS BUDGET
YTD EXP VS
BUDGET
YTD EXP VS YTD TRANS
YTD EXP VS BUDGET
000' 000' 000' 000' 000' % % % 000'
EC 360,660 168,851 311,991 87% 47% 54% 191,809
FS 378,426 244,412 332,533 88% 65% 74% 134,014
GP 798,609 816,261 726,009 91% 102% 112% -17,652
KZN 500,815 272,769 389,565 78% 54% 70% 228,046
LP 323,425 234,309 274,256 85% 72% 85% 89,116
MP 331,657 282,658 331,657 100% 85% 85% 48,999
NC 420,218 261,929 295,235 70% 62% 89% 158,289
NW 326,303 322,704 326,303 100% 99% 99% 3,599
WC 580,554 614,071 580,554 100% 106% 106% -33,517
TOTAL 4,020,667 3,217,964 3,568,103 89% 80% 90% 802,703
6
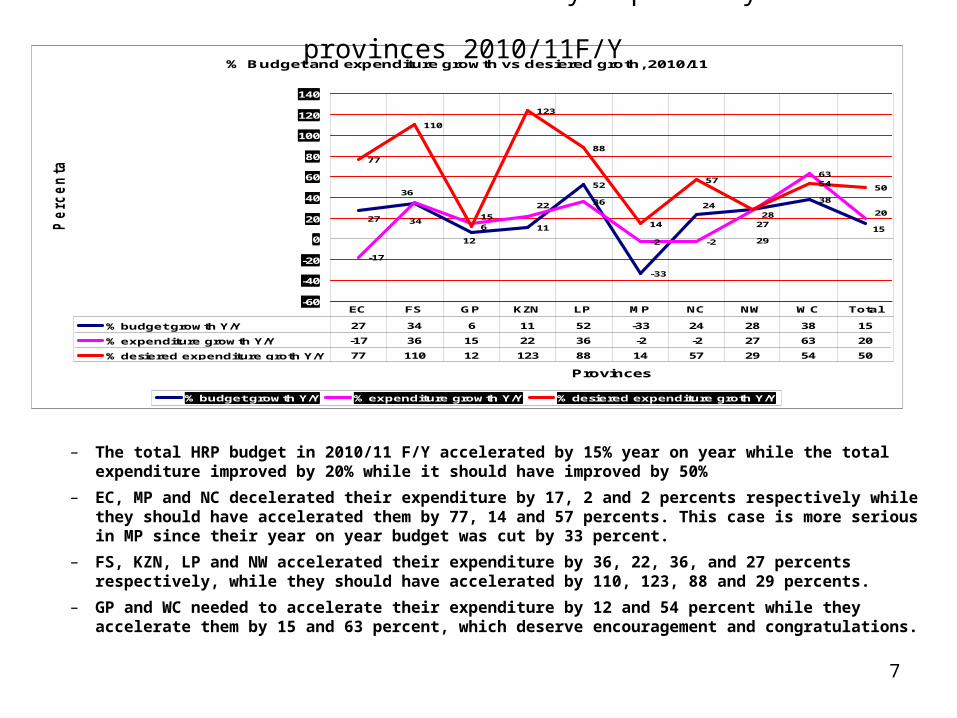
Infrastructure service delivery capability of the provinces 2010/11F/Y
– The total HRP budget in 2010/11 F/Y accelerated by 15% year on year while the total expenditure improved by 20% while it should have improved by 50%
– EC, MP and NC decelerated their expenditure by 17, 2 and 2 percents respectively while they should have accelerated them by 77, 14 and 57 percents. This case is more serious in MP since their year on year budget was cut by 33 percent.
– FS, KZN, LP and NW accelerated their expenditure by 36, 22, 36, and 27 percents respectively, while they should have accelerated by 110, 123, 88 and 29 percents.
– GP and WC needed to accelerate their expenditure by 12 and 54 percent while they accelerate them by 15 and 63 percent, which deserve encouragement and congratulations.
% Budget and expenditure growth vs desiered groth, 2010/11
11
52
-33
38
-17
36
-2 -2
63
77
110
123
88
14
57 54 50
2824
1527 34
6 27
20
36
15
22
2912
-60
-40
-20
0
20
40
60
80
100
120
140
Provinces
Pe
rc
en
tag
es
% budget growth Y/Y % expenditure growth Y/Y % desiered expenditure groth Y/Y
% budget growth Y/Y 27 34 6 11 52 -33 24 28 38 15
% expenditure growth Y/Y -17 36 15 22 36 -2 -2 27 63 20
% desiered expenditure groth Y/Y 77 110 12 123 88 14 57 29 54 50
EC FS GP KZN LP MP NC NW WC Total
7
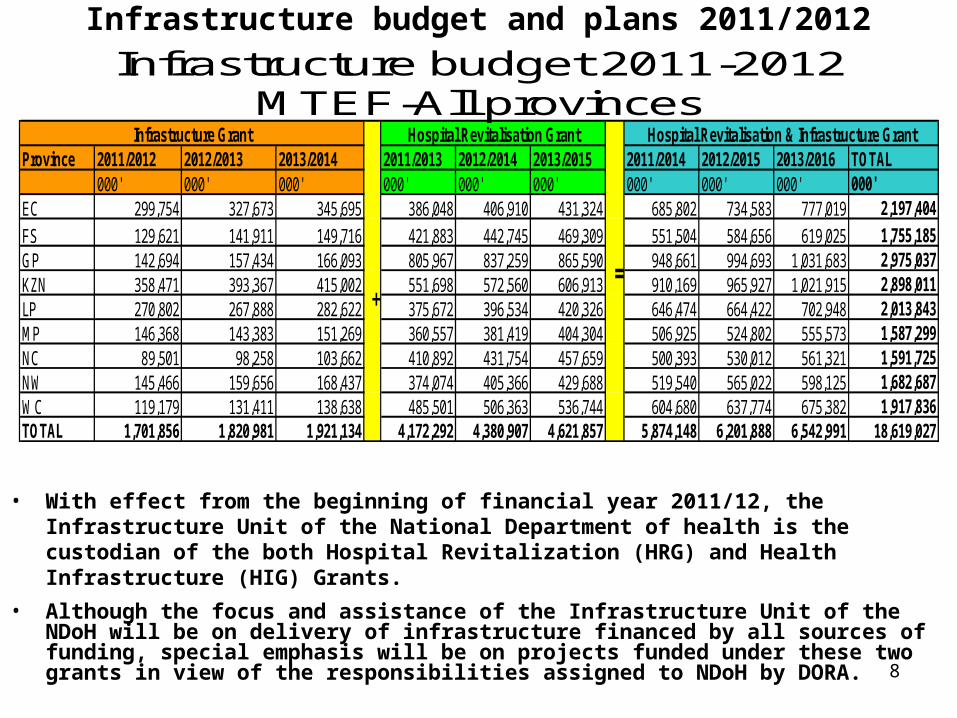
Infrastructure budget and plans 2011/2012
• With effect from the beginning of financial year 2011/12, the Infrastructure Unit of the National Department of health is the custodian of the both Hospital Revitalization (HRG) and Health Infrastructure (HIG) Grants.
• Although the focus and assistance of the Infrastructure Unit of the NDoH will be on delivery of infrastructure financed by all sources of funding, special emphasis will be on projects funded under these two grants in view of the responsibilities assigned to NDoH by DORA.
Province 2011/2012 2012/2013 2013/2014 2011/2013 2012/2014 2013/2015 2011/2014 2012/2015 2013/2016 TOTAL000' 000' 000' 000' 000' 000' 000' 000' 000' 000'
EC 299,754 327,673 345,695 386,048 406,910 431,324 685,802 734,583 777,019 2,197,404
FS 129,621 141,911 149,716 421,883 442,745 469,309 551,504 584,656 619,025 1,755,185GP 142,694 157,434 166,093 805,967 837,259 865,590 948,661 994,693 1,031,683 2,975,037KZN 358,471 393,367 415,002 551,698 572,560 606,913 910,169 965,927 1,021,915 2,898,011LP 270,802 267,888 282,622 375,672 396,534 420,326 646,474 664,422 702,948 2,013,843MP 146,368 143,383 151,269 360,557 381,419 404,304 506,925 524,802 555,573 1,587,299NC 89,501 98,258 103,662 410,892 431,754 457,659 500,393 530,012 561,321 1,591,725NW 145,466 159,656 168,437 374,074 405,366 429,688 519,540 565,022 598,125 1,682,687WC 119,179 131,411 138,638 485,501 506,363 536,744 604,680 637,774 675,382 1,917,836TOTAL 1,701,856 1,820,981 1,921,134 4,172,292 4,380,907 4,621,857 5,874,148 6,201,888 6,542,991 18,619,027
Infrastructure Grant
⁼₊
Hospital Revitalisation & Infrastructure GrantHospital Revitalisation Grant
Infrastructure budget 2011-2012 MTEF-All provinces
8
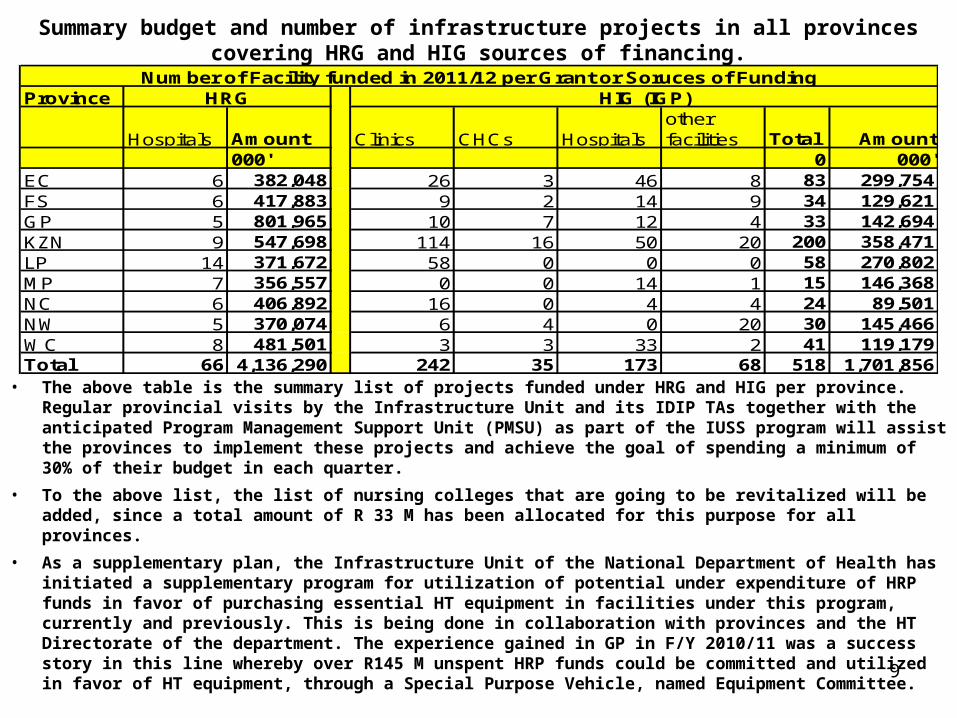
Summary budget and number of infrastructure projects in all provinces covering HRG and HIG sources of financing.
• The above table is the summary list of projects funded under HRG and HIG per province. Regular provincial visits by the Infrastructure Unit and its IDIP TAs together with the anticipated Program Management Support Unit (PMSU) as part of the IUSS program will assist the provinces to implement these projects and achieve the goal of spending a minimum of 30% of their budget in each quarter.
• To the above list, the list of nursing colleges that are going to be revitalized will be added, since a total amount of R 33 M has been allocated for this purpose for all provinces.
• As a supplementary plan, the Infrastructure Unit of the National Department of Health has initiated a supplementary program for utilization of potential under expenditure of HRP funds in favor of purchasing essential HT equipment in facilities under this program, currently and previously. This is being done in collaboration with provinces and the HT Directorate of the department. The experience gained in GP in F/Y 2010/11 was a success story in this line whereby over R145 M unspent HRP funds could be committed and utilized in favor of HT equipment, through a Special Purpose Vehicle, named Equipment Committee.
Province
Hospitals Amount Clinics CHCs Hospitalsother facilities Total Amount
000' 0 000'EC 6 382,048 26 3 46 8 83 299,754FS 6 417,883 9 2 14 9 34 129,621GP 5 801,965 10 7 12 4 33 142,694KZN 9 547,698 114 16 50 20 200 358,471LP 14 371,672 58 0 0 0 58 270,802MP 7 356,557 0 0 14 1 15 146,368NC 6 406,892 16 0 4 4 24 89,501NW 5 370,074 6 4 0 20 30 145,466WC 8 481,501 3 3 33 2 41 119,179Total 66 4,136,290 242 35 173 68 518 1,701,856
Number of Facility funded in 2011/12 per Grant or Soruces of FundingHRG HIG (IGP)
9
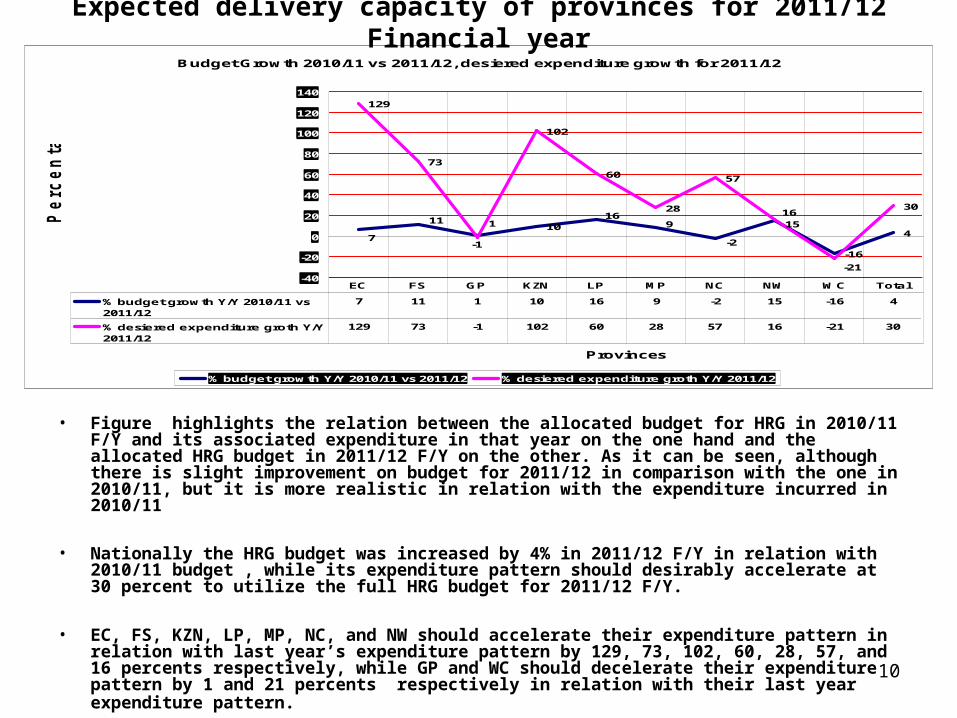
Expected delivery capacity of provinces for 2011/12 Financial year
• Figure highlights the relation between the allocated budget for HRG in 2010/11 F/Y and its associated expenditure in that year on the one hand and the allocated HRG budget in 2011/12 F/Y on the other. As it can be seen, although there is slight improvement on budget for 2011/12 in comparison with the one in 2010/11, but it is more realistic in relation with the expenditure incurred in 2010/11
• Nationally the HRG budget was increased by 4% in 2011/12 F/Y in relation with 2010/11 budget , while its expenditure pattern should desirably accelerate at 30 percent to utilize the full HRG budget for 2011/12 F/Y.
• EC, FS, KZN, LP, MP, NC, and NW should accelerate their expenditure pattern in relation with last year’s expenditure pattern by 129, 73, 102, 60, 28, 57, and 16 percents respectively, while GP and WC should decelerate their expenditure pattern by 1 and 21 percents respectively in relation with their last year expenditure pattern.
Budget Growth 2010/11 vs 2011/12, desiered expenditure growth for 2011/12
10
-16
4
129
73
102
60
28
57
30
7
15
-2
916
11116
-1
-21-40
-20
0
20
40
60
80
100
120
140
Provinces
Pe
rc
en
tag
es
% budget growth Y/Y 2010/11 vs 2011/12 % desiered expenditure groth Y/Y 2011/12
% budget growth Y/Y 2010/11 vs2011/12
7 11 1 10 16 9 -2 15 -16 4
% desiered expenditure groth Y/Y2011/12
129 73 -1 102 60 28 57 16 -21 30
EC FS GP KZN LP MP NC NW WC Total
10
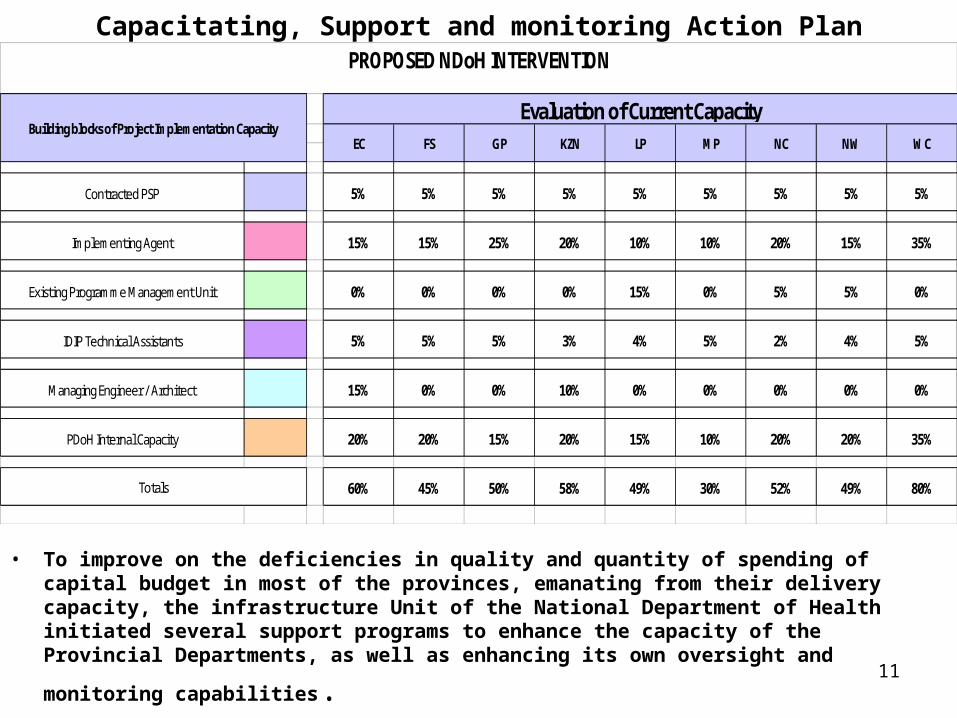
Contracted PSP 5% 5% 5% 5% 5% 5% 5% 5% 5%
Implementing Agent 15% 15% 25% 20% 10% 10% 20% 15% 35%
Existing Programme Management Unit 0% 0% 0% 0% 15% 0% 5% 5% 0%
IDIP Technical Assistants 5% 5% 5% 3% 4% 5% 2% 4% 5%
Managing Engineer / Architect 15% 0% 0% 10% 0% 0% 0% 0% 0%
PDoH Internal Capacity 20% 20% 15% 20% 15% 10% 20% 20% 35%
60% 45% 50% 58% 49% 30% 52% 49% 80%Totals
EC FS GP
PROPOSED NDoH INTERVENTION
Building blocks of Project Implementation CapacityEvaluation of Current Capacity
LP MP NC NW WCKZN
Capacitating, Support and monitoring Action Plan
• To improve on the deficiencies in quality and quantity of spending of capital budget in most of the provinces, emanating from their delivery capacity, the infrastructure Unit of the National Department of Health initiated several support programs to enhance the capacity of the Provincial Departments, as well as enhancing its own oversight and
monitoring capabilities. 11
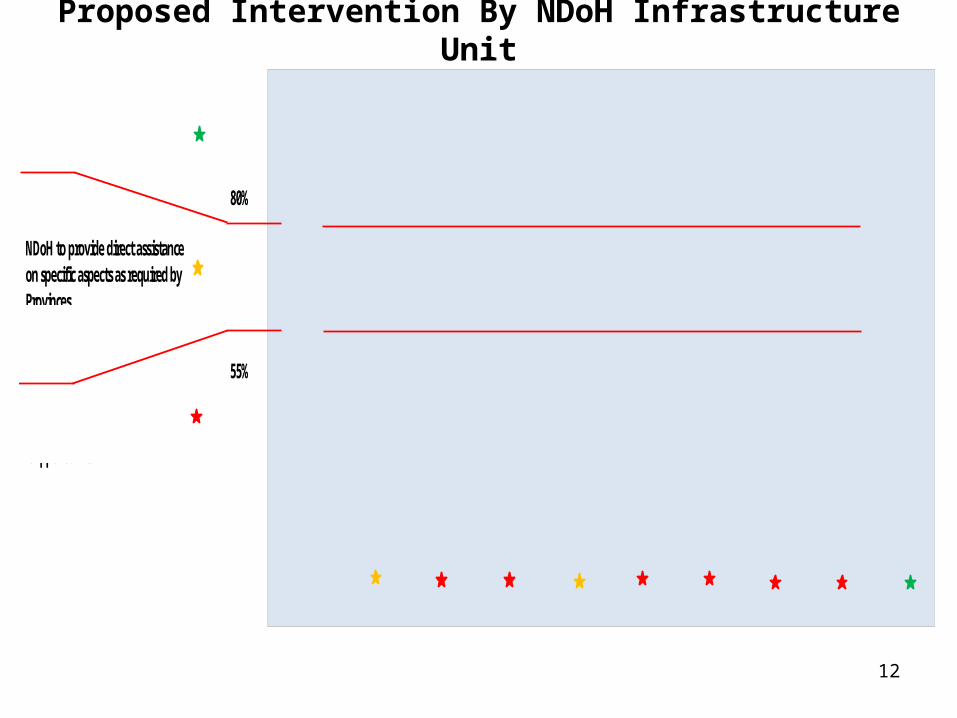
80%
55%
Thresholds for NDoH support to Provinces
0%
10%
20%
30%
40%
50%
60%
70%
80%
90%
100%
EC FS GP KZN LP MP NC NW WC
Province
Cumula
tive Ca
pacity
NDoH to provide direct assistance on specific aspects as required by Provinces
NDoH to intervene through "Programme Management Support Units"
NDoH to provide general guidance and monitoring
Proposed Intervention By NDoH Infrastructure Unit
12
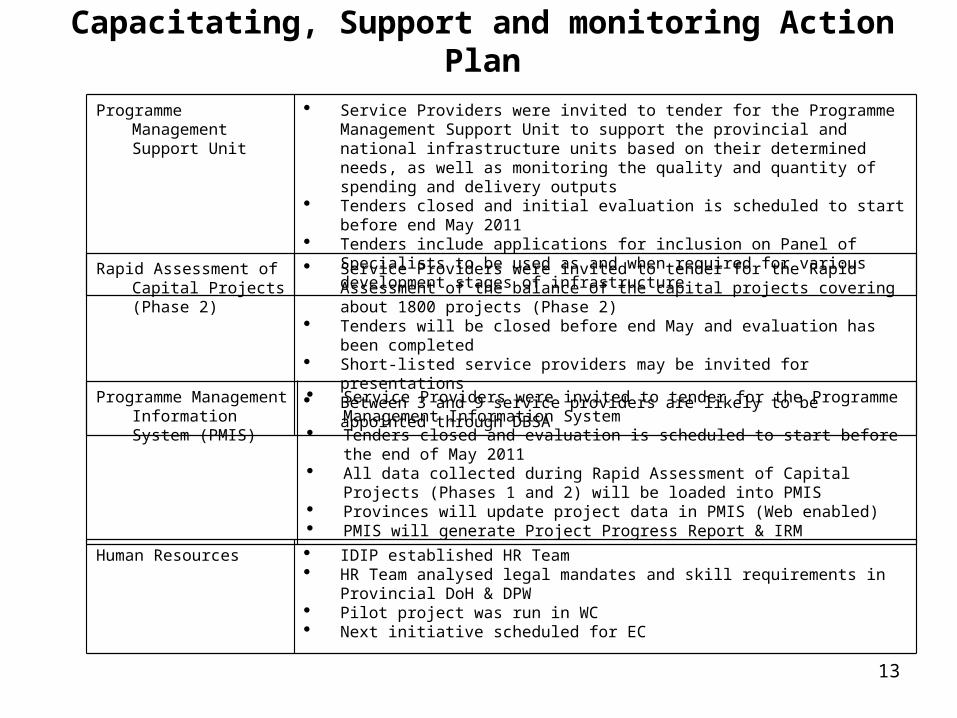
Programme Management Information System (PMIS)
Service Providers were invited to tender for the Programme Management Information System
Tenders closed and evaluation is scheduled to start before the end of May 2011
All data collected during Rapid Assessment of Capital Projects (Phases 1 and 2) will be loaded into PMIS
Provinces will update project data in PMIS (Web enabled) PMIS will generate Project Progress Report & IRM
Programme Management Support Unit
Service Providers were invited to tender for the Programme Management Support Unit to support the provincial and national infrastructure units based on their determined needs, as well as monitoring the quality and quantity of spending and delivery outputs
Tenders closed and initial evaluation is scheduled to start before end May 2011 Tenders include applications for inclusion on Panel of Specialists to be used as
and when required for various development stages of infrastructure
Rapid Assessment of Capital Projects (Phase 2)
Service Providers were invited to tender for the Rapid Assessment of the balance of the capital projects covering about 1800 projects (Phase 2)
Tenders will be closed before end May and evaluation has been completed Short-listed service providers may be invited for presentations Between 3 and 9 service providers are likely to be appointed through DBSA
Human Resources IDIP established HR Team HR Team analysed legal mandates and skill requirements in Provincial DoH &
DPW Pilot project was run in WC Next initiative scheduled for EC
Capacitating, Support and monitoring Action Plan
13
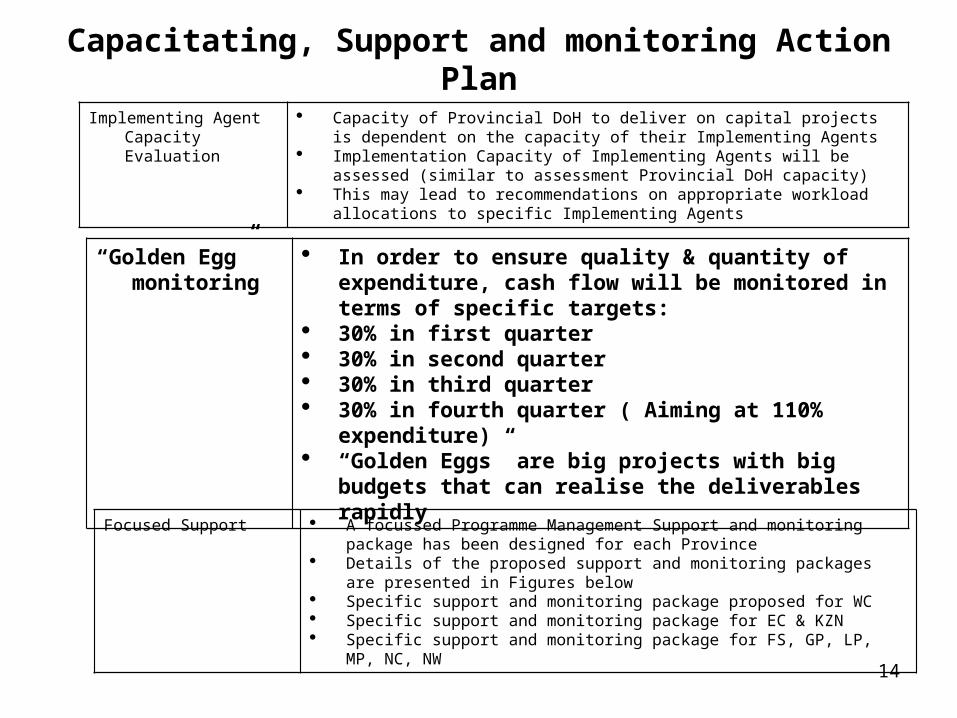
“Golden Egg” monitoring
In order to ensure quality & quantity of expenditure, cash flow will be monitored in terms of specific targets:
30% in first quarter 30% in second quarter 30% in third quarter 30% in fourth quarter ( Aiming at 110% expenditure) “Golden Eggs” are big projects with big budgets that
can realise the deliverables rapidly
Focused Support A focussed Programme Management Support and monitoring package has been designed for each Province
Details of the proposed support and monitoring packages are presented in Figures below
Specific support and monitoring package proposed for WC Specific support and monitoring package for EC & KZN Specific support and monitoring package for FS, GP, LP, MP, NC, NW
Implementing Agent Capacity Evaluation
Capacity of Provincial DoH to deliver on capital projects is dependent on the capacity of their Implementing Agents
Implementation Capacity of Implementing Agents will be assessed (similar to assessment Provincial DoH capacity)
This may lead to recommendations on appropriate workload allocations to specific Implementing Agents
Capacitating, Support and monitoring Action Plan
14
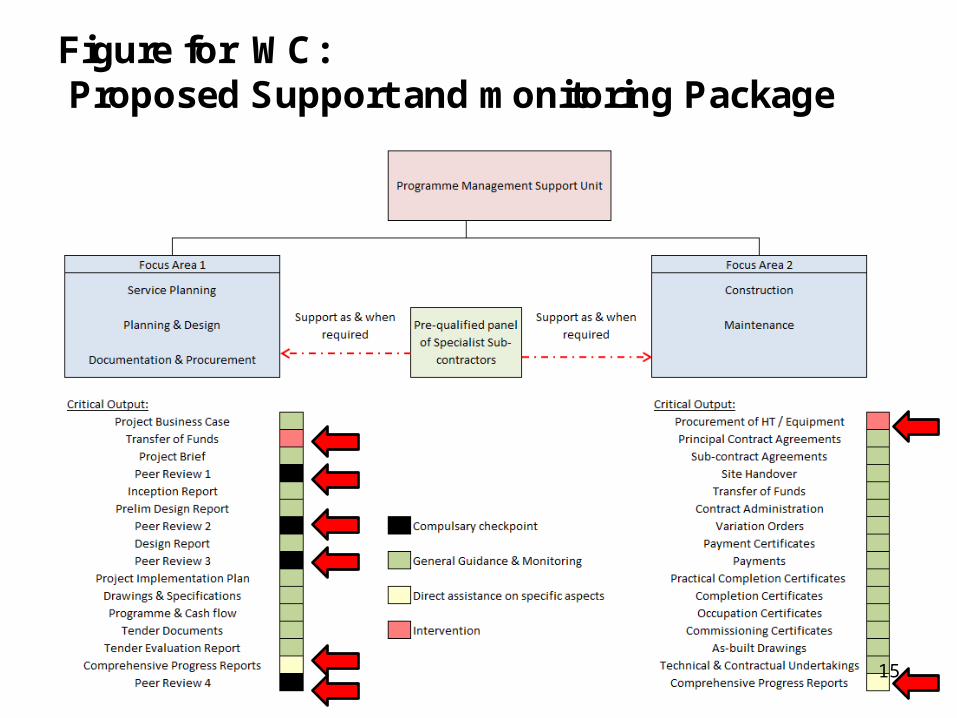
Figure for WC:Proposed Support and monitoring Package
15
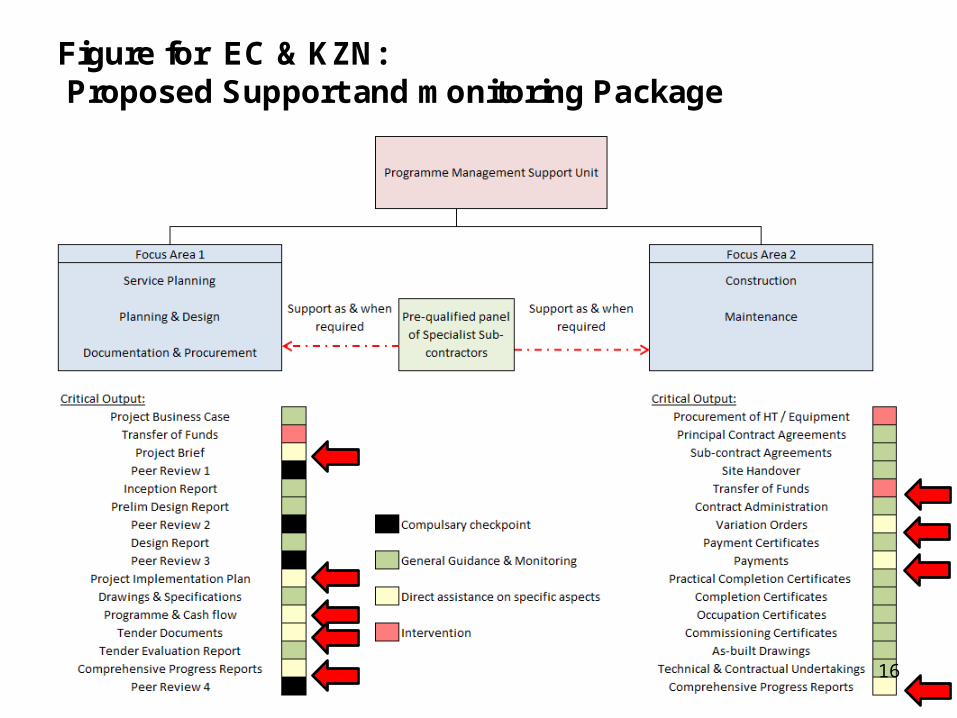
Figure for EC & KZN:Proposed Support and monitoring Package
16
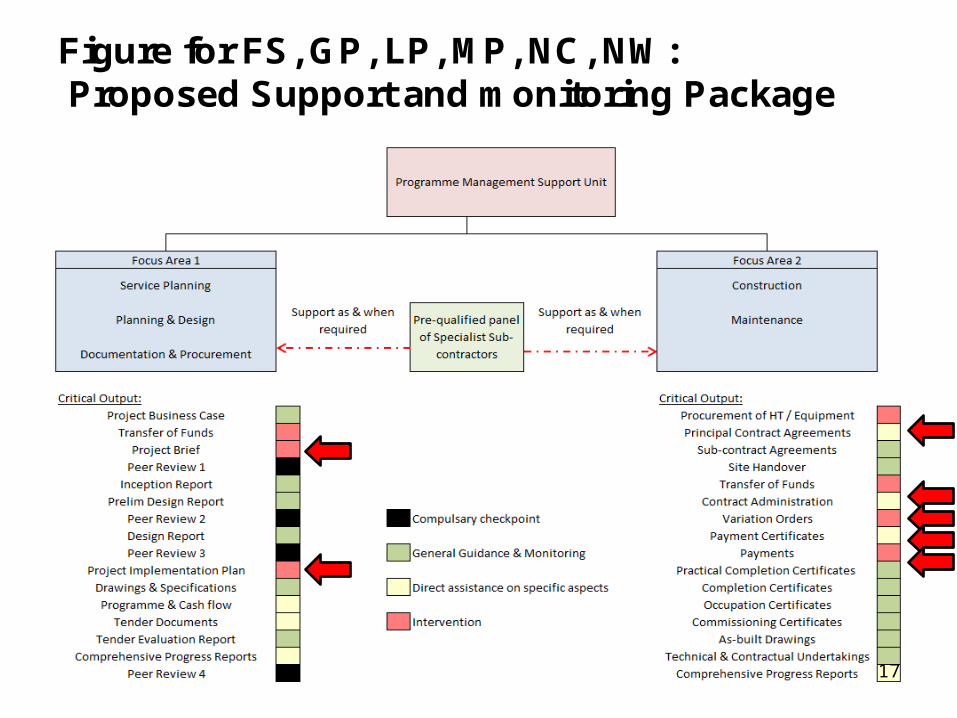
Figure for FS, GP, LP, MP, NC, NW:Proposed Support and monitoring Package
17
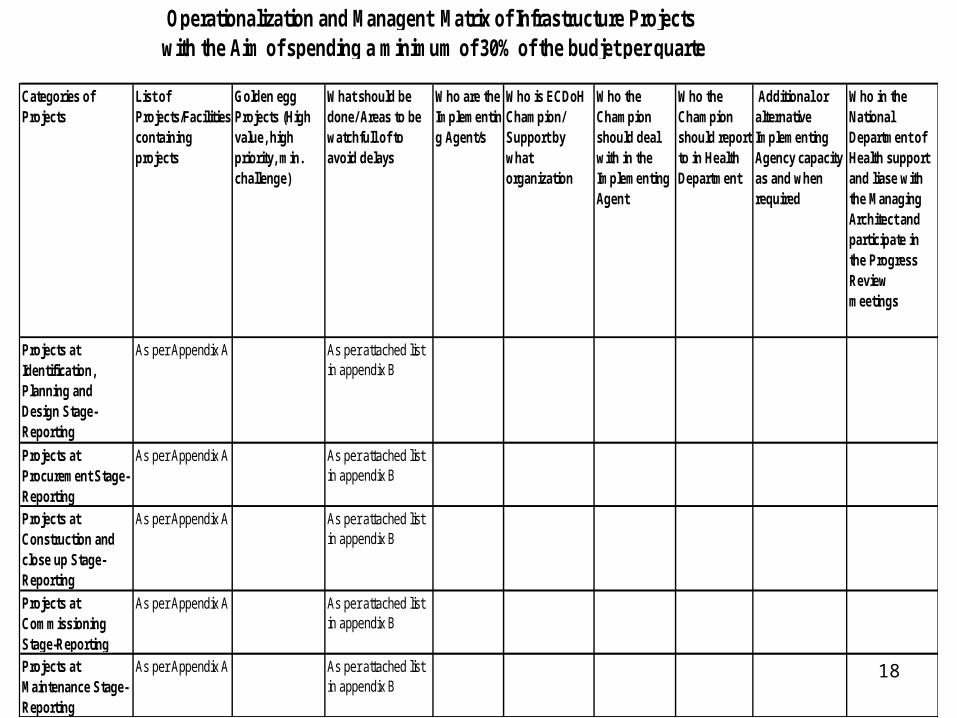
Categories of Projects
List of Projects/Facilities containing projects
Golden egg Projects (High value, high priority, min. challenge)
What should be done/ Areas to be watchfull of to avoid delays
Who are the Implementing Agent/s
Who is ECDoH Champion/ Support by what organization
Who the Champion should deal with in the Implementing Agent
Who the Champion should report to in Health Department
Additional or alternative Implementing Agency capacity as and when required
Who in the National Department of Health support and liase with the Managing Architect and participate in the Progress Review meetings
Projects at Identification, Planning and Design Stage-Reporting
As per Appendix A As per attached list in appendix B
Projects at Procurement Stage-Reporting
As per Appendix A As per attached list in appendix B
Projects at Construction and close up Stage-Reporting
As per Appendix A As per attached list in appendix B
Projects at Commissioning Stage-Reporting
As per Appendix A As per attached list in appendix B
Projects at Maintenance Stage-Reporting
As per Appendix A As per attached list in appendix B
Operationalization and Managent Matrix of Infrastructure Projects with the Aim of spending a minimum of 30% of the budjet per quarte
18
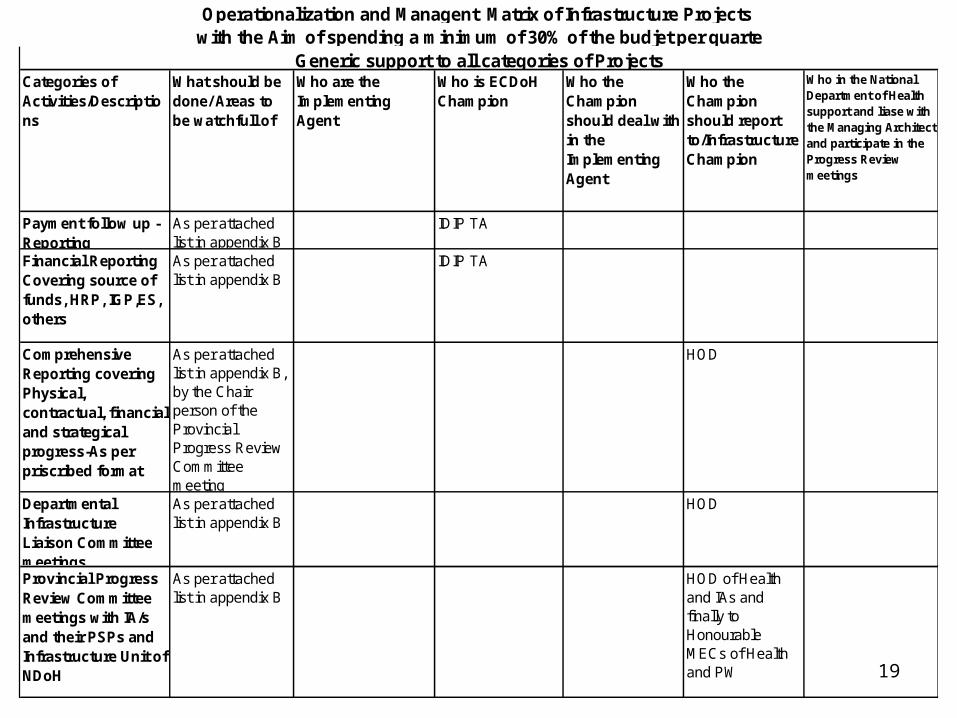
Categories of Activities/Descriptions
What should be done/ Areas to be watchfull of
Who are the Implementing Agent
Who is ECDoH Champion
Who the Champion should deal with in the Implementing Agent
Who the Champion should report to/Infrastructure Champion
Who in the National Department of Health support and liase with the Managing Architect and participate in the Progress Review meetings
Payment follow up -Reporting
As per attached list in appendix B
IDIP TA
Financial Reporting Covering source of funds, HRP, IGP,ES, others
As per attached list in appendix B
IDIP TA
Comprehensive Reporting covering Physical, contractual, financial and strategical progress-As per priscribed format
As per attached list in appendix B, by the Chair person of the Provincial Progress Review Committee meeting
HOD
Departmental Infrastructure Liaison Committee meetings
As per attached list in appendix B
HOD
Provincial Progress Review Committee meetings with IA/s and their PSPs and Infrastructure Unit of NDoH
As per attached list in appendix B
HOD of Health and IAs and finally to Honourable MECs of Health and PW
Operationalization and Managent Matrix of Infrastructure Projects with the Aim of spending a minimum of 30% of the budjet per quarte
Generic support to all categories of Projects
19

Thanks for the attention
20
Related Documents