1 Infrastructure Legibility – a comparative analysis of open311 based citizen feedback systems Dietmar Offenhuber, Northeastern University This is a preprint of the article published by Oxford Journals in the Journal of Regions, Economy and Society, available at http://cjres.oxfordjournals.org/content/early/2014/03/14/cjres.rsu001 Abstract The recent history of citizen feedback systems is a tale of growing ambition. In the past decade, most large US cities have implemented nonemergency incident reporting systems via telephone helplines, websites, and more recently, mobile applications. Using data from systems operating in the larger Boston area, spatial and grounded theory analysis of submitted reports, this paper investigates the role of design in shaping the interaction between the citizens and the city. It investigates the following questions: Which assumptions about the users are embedded in design of existing feedback systems? What motivates users to participate, and how does the systems’ design choices correspond with these motivations? By what mechanisms do these systems facilitate and constrain the interaction between citizen and city? Introduction The recent history of citizen feedback systems is a tale of growing ambition. In the past decade, most large US cities have implemented nonemergency incident reporting systems via telephone helplines, websites, and recently mobile applications. During that time, 311 systems, named after the threedigit US telephone shortcode reserved for that purpose, have evolved from service hotlines to public accountability instruments, data source for urban maintenance and tools for civic engagement. The trajectory of these recent developments raises the question: to what extent can and should citizens be involved in the processes urban maintenance? Numerous tensions exist: between the voluntary nature of involvement and the reliability and

Welcome message from author
This document is posted to help you gain knowledge. Please leave a comment to let me know what you think about it! Share it to your friends and learn new things together.
Transcript

1
Infrastructure Legibility – a comparative analysis of open311-‐
based citizen feedback systems
Dietmar Offenhuber, Northeastern University
This is a preprint of the article published by Oxford Journals in the Journal of Regions, Economy
and Society, available at http://cjres.oxfordjournals.org/content/early/2014/03/14/cjres.rsu001
Abstract
The recent history of citizen feedback systems is a tale of growing ambition. In the past decade,
most large US cities have implemented non-‐emergency incident reporting systems via telephone
helplines, websites, and more recently, mobile applications. Using data from systems operating
in the larger Boston area, spatial and grounded theory analysis of submitted reports, this paper
investigates the role of design in shaping the interaction between the citizens and the city. It
investigates the following questions: Which assumptions about the users are embedded in
design of existing feedback systems? What motivates users to participate, and how does the
systems’ design choices correspond with these motivations? By what mechanisms do these
systems facilitate and constrain the interaction between citizen and city?
Introduction
The recent history of citizen feedback systems is a tale of growing ambition. In the past decade,
most large US cities have implemented non-‐emergency incident reporting systems via telephone
helplines, websites, and recently mobile applications. During that time, 311 systems, named
after the three-‐digit US telephone short-‐code reserved for that purpose, have evolved from
service hotlines to public accountability instruments, data source for urban maintenance and
tools for civic engagement. The trajectory of these recent developments raises the question: to
what extent can and should citizens be involved in the processes urban maintenance?
Numerous tensions exist: between the voluntary nature of involvement and the reliability and

2
homogeneity expected from urban services; between the private motivations of participants
and their perception of a public good; between engagement and accountability.
By analyzing how the design factors of existing systems correspond with the practices and
stated motivations of the users, the paper investigates design principles for participatory
infrastructure systems, with special focus on questions of accountability and the capacity of the
interface to negotiate the interests of citizens and the service provider.
Problem and Research Questions
Despite a shared concern for a well-‐functioning infrastructure, the interests of citizens and city
are not identical. A feedback system designed according to the expectations of the citizens will
therefore be different from a system reflecting the needs of the city. These goals and interests
are ultimately negotiated through the interface, which regulates the possible forms of
interaction and determines the representation of the system.
The goal of this paper twofold: first, to identify and articulate the role of design in
facilitating or constraining the interaction between the citizens and the city; second, how these
design choices correspond with the motivations of the users of these systems.
We hypothesize that the degree to which individuals engage in infrastructure governance
depends on the legibility of the infrastructural system -‐ the extent to which the interface
represents the system’s structure, processes, and social dimensions. Infrastructure legibility
depends on design choices, since the designers of citizen feedback systems have to make basic
assumptions about their users, their motivations and expectations, and whether users are
driven by a personal grievance, or by the concern for the public good. The three main research
questions are consequently:
RQ1 – design: Which assumptions about the users are embedded in the decisions guiding
the design of online 311 platforms? How are these assumptions translated into design
features?
RQ2 – motivations: What motivates users to participate, and how do the system’s design
features correspond with these motivations? For example, to what extent are contributors
motivated by self-‐interest, to what extent by concern for the public good?

3
RQ3 – transformative effects: By what mechanisms and design principles do existing
systems facilitate and constrain the interaction between citizen and city?
A short history of 311 systems
In February of 1997, the US Federal Communications Commission designated a new nationwide
abbreviated number, 311, for quick access to non-‐emergency police and government services.
The reason for this decision was a steep increase in emergency calls, which was attributed to the
wide-‐spread adoption of cell-‐phones and created a burden for 911 call centers (Hester 1997;
Flynn 2001; FCC 1997). Following this decision, the City of Chicago began in the same year
planning for a new community response system, replacing an outdated mainframe system that
was not Y2K compliant. The new 311 System assumed operation in January 1999 (City of Chicago
2013); small-‐scale pilot programs were previously launched in the cities of San Jose and San
Diego (Department of General Services 2000).
In 2002, following these early examples, New York City’s Major Bloomberg announced
plans for installing a new citywide 311-‐phone system for handling non-‐emergency calls, as his
first major policy initiative. Until then, 12 different call centers were operating in the various
departments of city, often with a significant overlap in their competences, resulting in requests
frequently being sent back and forth between different departments. At this point, it became
increasingly clear that merging the different call centers into one new system would likely not
reduce the number of 911 calls, as previous studies on 311 pilot projects in San Diego and San
Jose had shown (Department of General Services 2000). Instead, the focus shifted to the
potential benefit of improving and simplifying access to communal services for the city’s diverse
population (Cardwell 2002). New Yorks new 311 call-‐center, operating under the 2001
established Office of Operations, was staffed by 300 phone operators who receive calls, parse
requests into the service categories provided by a Service Management System, which then
generates tasks for the appropriate department. A team of 12 analysts and engineers
continuously revised the protocols and database structures designed for parsing and routing the
incoming requests. Tracking how quickly things were handled in the city and evaluating urban
performance was an initial goal for using the 311 records. The data aggregated from citizen
requests in many cases turned out to be more reliable than official data generated by the
department’s service inspectors (Van Ryzin, Immerwahr, and Altman 2008). However, the full

4
value of the data for urban maintenance operations was not anticipated. Many issues surfaced
in the call data that would otherwise have gone unreported by conventional mechanisms;
including reports about dead animals and other public health issues. Besides using the call data
as a basis for monthly service performance reports, the City of Chicago has used the volume of
311 calls also for tracking Bedbug infestations (Gabler 2010). The data set was also instrumental
in tracing environmental emissions their source facilities based on reports from people reporting
unfamiliar odors (Johnson 2010).
Early online systems
While the possibility of using the web and email for service requests were absent in the first
deployment of New York City’s 311 System, these ideas started to materialize in 2005 through a
bottom-‐up initiative. Public advocate Andrew Rasiej launched a website – a simple Google maps
mash-‐up with photographs from Flickr – for mapping the city’s potholes, creating public
pressure on the city for having them fixed (Shulman 2005). Driven by the broad adaptation of
smart-‐phones and location-‐based technologies, many comparable services followed. Some of
them originated from bottom-‐up initiatives focusing on local government transparency, such as
the US based platform “SeeClickFix”, developed by a start-‐up in 2008, following the earlier
example of the “FixMyStreet” website. New York’s “311Online”, active since 2009 was initiated
and promoted by the city itself; Boston’s “Citizen Connect”, initiative, operational since 2010
and initiated by Boston’s “New Urban Mechanics” group inside city hall, and implemented by
the company “Connected Bits.”
Connecting efforts -‐ the open311 standard
The rapidly increasing number of cities and communities developing their own version of a
incident reporting systems from scratch made it necessary to think about improving
interoperability. In 2009, a new standard for unifying incident reporting systems under the name
“Open311,” developed in the course of the first “Apps for Democracy Contest”.1 The Open311
protocol is now supported by most 311 systems across the US. The nature of open standards
such as open311 makes it possible to use a wide range of different clients, platforms and
interfaces, while having the advantage of a standardized, machine-‐readable data stream that
allows citizens and companies to build own applications on top of the existing data
1 http://www.appsfordemocracy.org

5
infrastructure (Desouza and Bhagwatwar 2012). Online 311 systems fall within the domain of
Volunteered Geographic Information (VGI) systems, including community-‐driven mapping
projects such as OpenStreetMap2 or disaster relief and accountability focused initiatives such as
Ushahidi (Goodchild 2007).3
The accountability dimension of citizen feedback systems
Citizen feedback systems are also accountability instruments. They build on the concept of
Social Accountability, describing to mechanisms that rely on civic engagement for keeping
power-‐holders accountable (Malena, Forster, and Singh 2004).
New York’s Mayor Bloomberg, the driving force behind the implementation of the 311-‐
system, saw it as a way to improve the interaction between different city departments. An
interview partner, who worked as an analyst during the early days of the system recalled in an
interview how the mayor was known for frequently and anonymously calling in from different
parts of the city, reporting issues to probe the responsiveness and quality of the service.
From a social accountability perspective, 311 systems imply a two-‐way contract between
the government and the citizens. The city commits to responding to citizen requests in a timely
manner and offers a mechanism for the citizens to track requests. In return, the citizens
contribute data that again is made publicly accessible – as mandated by the Freedom of
Information Act (FOIA).
Since this kind of public visibility is not without drawbacks for the city especially when it
comes to issues of infrastructure management, why would a city choose a pro-‐active role in
promoting social accountability? One answer is that citizens that feel a lack of accountability
would eventually create such a system anyway. Such “rude” forms of accountability (Hossain
2010), operating by ‘naming and shaming’ might in the long run be more harmful to a local
government compared to a proactive solution that emphasizes the common goals both citizens
and the government share.
It should not be forgotten that income inequalities are closely connected to a community’s
inclination to request accountability. In their analysis of citizen grievance systems in India,
Martinez, Verplanke et al. have shown that residents living in the most deprived areas are often
not the ones who complain the most; instead, complaints are concentrated in the better-‐
2 http://www.openstreetmap.org 3 http://www.ushahidi.com

6
serviced middle-‐class areas. The authors observe that grievance systems often capture the
‘wants’, rather than the ‘needs’ (Martínez, Pfeffer, and van Dijk 2009; Verplanke et al. 2010,
194).
Infrastructure legibility
Participatory civic technologies are frequently categorized into dichotomy such as top-‐down
versus bottom up – whether these technologies originated from government initiatives or were
built by citizens. Such a categorization may seem appropriate, as both sides represent different
interests. However, in the case of citizen feedback systems, we see that different origins do not
necessarily result in fundamentally different systems -‐ they share many similarities in terms of
design, organization, and operation.
This paper uses a different approach and focuses on the processes and interactions that
take place at the system boundaries between user and provider, citizen and city. This interface-‐
centric perspective draws from actor-‐oriented research approaches, including Susan Leigh Star’s
anthropology of infrastructure, which conceptualizes infrastructure as a relationship between
technical systems and human practices (Star 1999), and, to a limited extent, Actor-‐Network
Theory, whose concept of non-‐human agency is particularly relevant for software and technical
artifacts (Callon and Latour 1981; Latour 2005).
To address the central question of how the design of citizen feedback systems mediates
between citizen and infrastructure providers, we introduce the construct of ‘infrastructure
legibility’ as a quality afforded by citizen feedback systems. Infrastructure legibility means the
degree to which the features of an infrastructural system can be recognized by its users or
governors with regard to (1) the system’s structure and its processes, (2) the system’s
governance, and (3) the presence of users in the system.
The concept of legibility is adapted from the classic work by the urbanist Kevin Lynch, who
hypothesized that the perceived quality of an urban environment is related to the degree to
which its inhabitants are able to ‘read’ its structure (Lynch 1960, 2). The Lynchean concept has
since been applied in Human-‐Computer Interaction (HCI) to address wayfinding issues in
informational space (Morville 2005). Equally relevant for this study is James D. Scott’s
conceptualization of legibility as a central issue of governance that allows the modern state to
exert its power (Scott 1999).

7
With regard to citizen feedback systems, one aspect of legibility concerns the
representation of the mediating technology itself. Citizen feedback apps are deeply entangled
with their physical surroundings, the practices of their users, and the urban infrastructures they
address. Under the terms Seamless and Seamful Design, the ubiquitous computing literature
offers two different design approaches for how this integration can take shape. Seamless design
follows the idea of the invisible interface and hides all technical complexities from the user
(Weiser 1994). Seamful design represents the opposite approach, uncovering the
discontinuities, boundaries, and internal processes of a system (Chalmers and Galani 2004;
MacColl et al. 2002). While seamless design emphasizes unobtrusiveness, a seamful system
emphasizes legibility, inviting customization and scrutiny.
A second aspect encompassed by infrastructure legibility is the way other participants,
citizens or city employees, are represented. The concept of Social Presence describes the degree
to which a communication medium is capable of conveying the salience of a communication
partner including all verbal, non-‐verbal, and contextual cues. Users of a specific communication
medium are aware of the degree of Social Presence it allows, and consequently adapt the way
how they use the medium (Short, Williams, and Christie 1976). For the sole purpose of
submitting incident reports, an anonymous system would be sufficient, especially as privacy
remains a concern. However, strict anonymity may not always be desirable. The system
governor might seek protection against vandalism and block repeated offenders. More
importantly, also the submitter might prefer to be more present in the system and be
acknowledged as a contributor. To negotiate the need for privacy and the desire for social
presence, the I.B.M. researchers Wendy Kellogg and Thomas Ericsson introduced the concept of
Social Translucence, using the metaphor of a frosted glass door that protects the identity of
people behind it, but conveys an idea about the activity in the room (Erickson and Kellogg 2000).
The specific forms of representation chosen for participatory systems are an effective
method for what Steven Woolgar terms the configuration of the user (1991). The design of the
interface, the inclusion of certain elements and the omission of others shape the likely future
actions of the user into a direction preferred by the designer. How this configuration happens in
the case of citizen reporting applications is the subject of a study by Matthew Wilson. In his
analysis of a controlled geocoding experiment, Wilson describes how design decisions such as
the choice of incident categories, help directing and configuring the cartographic gaze of the
user (Wilson 2011).
8
Participant motivations
From the perspective of the user, we can distinguish whether the feedback was driven by a
personal grievance, of by a socially oriented desire to improve the city. When it comes to the
question how broad participation can be encouraged, the issue becomes more complicated.
Traditional volunteer organizations such as the Appalachian Trail Conservancy, which maintains
2000 miles of hike trails exclusively through the work of volunteers, rely on the creation of Social
Capital as an incentive for potential volunteers (Appalachian Trail Conservancy 2012; Putnam
2001). In online communities, social relationships tend to be more context-‐oriented, and
Intellectual Capital, the generation of knowledge and sharing of information, becomes an
important motivational factor (Rafaeli and Ariel 2008).
Citizen feedback apps operate in both spaces, using online coordination to address issues
that affect the participants in physical space. However, they lack many incentives for
participation mobilized by volunteer organizations and online communities: they provide few
opportunities for social interaction, for learning, personal growth, or gaining prestige.
Coleman et al. investigated the motivations of users who volunteer geographic information
to dedicated platforms (D. J. Coleman, Georgiadou, and Labonte 2009)
The authors propose a framework that characterizes the user motivations in a two
dimensional matrix, linking the level of user expertise (neophytes, interested, expert amateurs,
professionals, or expert authorities) with the nature of information platforms (commercial
products, social communities or governmental platforms). In a following study, Coleman linked
user motivations to certain design characteristics of the used technologies (D. Coleman, Sabone,
and Nkhwanana 2010).
Methods & Data sources
The empirical analysis focuses on platforms used in the metropolitan region of Boston, which
offers a wide variety of active citizen feedback systems operated by the different municipalities
in the region. This includes the city of Cambridge, using their own iReport system; the city of
Boston, which also operates its own system under the name Citizens Connect and, since
recently, also officially supports the location-‐independent platform SeeClickFix. The City of
Brookline uses a system under the name BrookONline, which is identical to Citizens Connect in
terms of its functionality. This co-‐existence of various different systems in a continuous
9
metropolitan area makes the Boston region an ideal place for this study. The city of Boston itself
officially supports two systems of a very different design. As the response of the city can be
assumed being equal for both systems, the effects of design can be expected to be more salient.
The three research questions will be answered as follows:
• The first question concerning design factors of existing systems will be addressed using
comparative analysis of existing systems (Table 1). The design differences will be
contextualized with data sets acquired using the specific systems.
• The second question concerning the motivations of volunteers will be measured using
textual analysis of the language submitted in incident reports based on the Grounded
Theory approach (Glaser and Strauss 1967).
• The third question concerning transformative effects will combine results from the
textual analysis with the comparative analysis of design factors with respect to specific
aspects of the interaction.
Content analysis of submitted reports
From the 30278 reports submitted via CCN, a random sample of 1172 reports was drawn, while
the whole SCF data set concerning the city of Boston was used, consisting of 695 issues and
1780 reactions.
All fields of the incident report were considered in the analysis, including a photo of the
incident, the geographic location, a free-‐form textual description of the incident, and, in the
case of CCN, the incident category, and in the case of SCF, the short, user-‐defined title of the
incident.
The information entered into the description field is optional, yet used by most reporters.
The length of a description typically rages from a single line to a few sentences, through which
the reporter describes the nature of the incident, and often explains why the incident is
considered important and how the city should respond to it. The description is often contextual,
and requires the photo, the location, or the specified category for understanding the nature of
the request. The descriptions offer a wealth of explicit and implicit information, however, in an
unstructured format. To extract this information for the purposes of our analysis, a Grounded
Theory approach was used to capture the implicit information into more structured categories
derived from the data.

10
At first glance, the descriptions show certain characteristics. They differ in tone – some use
highly critical or accusatory language, while others are neutral. They may express a certain
concern – the safety of others potentially affected by the incident, the aesthetic appearance of
the city, or the behavior of other people. They also differ in terms of the reaction they expect
from the city. Often the intent of the reporter remains ambiguous, or multiple issues are
addressed simultaneously. The analysis of the reports started from the most salient features, for
example, by identifying reports that report other people, or reports that explicitly express safety
concerns. In the following iterations, the list of identified features was refined and expanded. In
a last step, this broad list of features was combined into a smaller set of categories, using a
shared definition for each category. For example, a report with a very critical tone was defined
to contain explicit expressions of anger, dissatisfaction, or accusations, while a report was
considered critical, if it emphasizes the urgency of the reported issue (Table 7). Some of the
salient characteristics were defined as properties rather than categories to allow for
combinations of more than one characteristic where necessary.
Since about half of the CCN reports were submitted in the unspecific “Other” category and
the SCF reports required no categories at all, the first necessary step was to identify the nature
of the reported incident. For this purpose, the initial categories from CCN were used, and then
gradually expanded. An important distinction emerged for example between reports that were
addressing infrastructure repairs, such as replacing a broken lamp, and infrastructure
improvements, such as requests for an additional park bench or trash bin. The entire sample
was coded by the author, the operational definitions of the individual categories and properties
can be found in Table 7 in the appendix.
Table 1 Compared incident report systems
# System In operation since Initiated by Geographic Area 1 Standard Open311 Specification Jun 2009 Consortium / public sector Location independent 2 SeeClickFix Sep 2008 Start-‐up Location independent 3 FixMyStreet Feb 2007 Non-‐profit UK 4 Cambridge iReport Dec 2011 Public sector Cambridge, MA 5 SpotReporters -‐ Citizens Connect
/ BrookONline
Sep 2009 / Sep 2010
Public sector Boston, MA / Brookline, MA
6 NYC 311 online Mar 2003 Public sector New York City 7 City Sourced Sep 2009 Start-‐up Location independent 8 Ushahidi Jan 2008 Start-‐up / non-‐profit Location independent

11
Compared Systems and data sources
In the comparative analysis of the design factors, the Boston platforms are contextualized within
a range of comparable web and smartphone-‐based systems, both location-‐dependent and
independent (Table 1). Most of these systems allow submitting an incident report either via a
web site or a mobile application. An incident report typically includes a photo of the incident, a
geographic location, a free-‐form textual description of the incident, and an incident category
selection. Some of the systems are specifically developed for a single city, such as New York City
or Cambridge. Other systems, such as SeeClickFix and CitySourced, are location independent,
but usually not supported in every city to the same extent. Also included in the comparison is
the standard specification for incident reports, Open311, which has become the basis for many
municipal systems as well as generic tools.
Spatial Characteristics of the Boston dataset
In most cities, reports submitted via Open311-‐type mobile applications still constitute the
minority of service requests. During the years 2011 and 2012, the city of Boston has received a
total number of 242354 service requests via different channels such as telephone calls, face-‐to-‐
face meetings, or email. Among these requests, only 30278 (or 8%) were sent from Boston’s
Citizens Connect app.
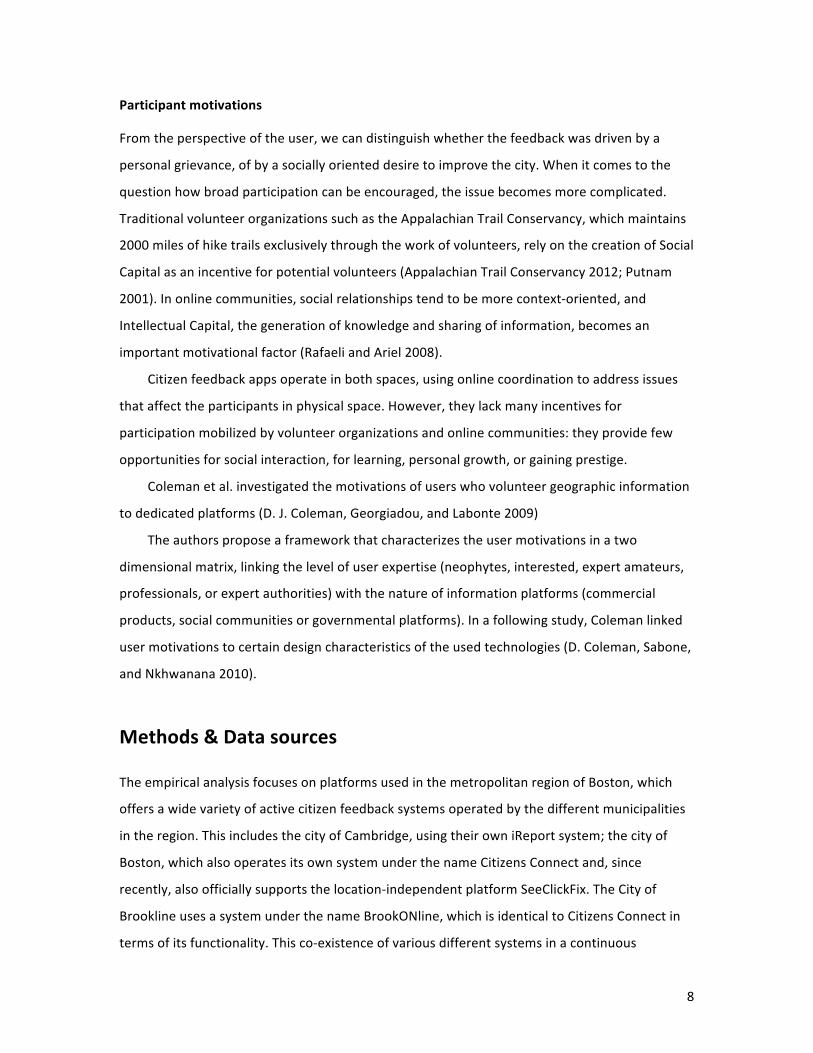
Digital and analog requests are not evenly distributed in space. Figure 1 presents a block-‐
aggregated map of reported incident locations showing the ratio between the number of
reports submitted via analog (phone) and digital channels (website, email, mobile app). Red
areas indicate that the large majority of reports were submitted via analog means. Blue areas
indicate more digital requests, and concentrate in public spaces with high pedestrian activity,
parks, and beaches. The map shows a pronounced ‘digital divide’ in citizen requests: the
southern, least affluent neighborhoods of Boston -‐ Roxbury, Mattapan, South Dorchester –
show the lowest likelihood to use digital feedback channels.
A second perspective is provided by the origin of the reporters. About 37% of the requests
via phone-‐hotline included a zip code of the reporter’s home; unfortunately, this was only the
case for 3% of the smart-‐phone application requests. Among those request with a known
reporter zip code, the reported issue was in the large majority of cases located in the same zip
code where the reporter lived (Table 2). Acknowledging the limitation of the low spatial

12
resolution, this supports the assumption that people tend to report issues in their own
neighborhood.
Table 2 Boston service requests: reported location versus home location of the reporter, by
communication channel (courtesy Curt Savoie, City of Boston).
Channel Reporter zip code known
Incident not in reporter zip
Incident in reporter zip
Citizens Connect App 1034 3.1% 176 25.7% 510 74.3% Constituent Call 55795 37.3% 6436 15.1% 36245 84.9% E-‐mail In 126 77.8% 88 87.1% 13 12.9% Mail In 6 66.7% 3 50.0% 3 50.0% Self Service via website 9880 26.0% 1360 15.7% 7294 84.3% Other via website 150 11.5% 25 20.2% 99 79.8%
Figure 1 Analog versus Digital service requests to the city of Boston. Blue areas have more digital
reports (mobile apps, web, email), red areas more analog (Phone calls). Data source: Boston CRM data,
all 242354 service requests from 2011 (courtesy Curt Savoie, City of Boston).

13
RQ1: Design factors and assumptions
Infrastructure legibility in the compared 311 systems
Table provides an overview over the basic design features of the compared systems. While
most systems involve both a web component as well as a mobile app, some platforms place
more emphasis on the website (nr 2,3,6,7,8), while others place more weight on the mobile
component (nr 4,5).
As of this writing, most of the compared systems publicize the submitted reports along with
response of the service provider (In Table , all except 4 and 8). This includes a status indicating
whether the issue has been resolved, often accompanied by an explanation of what the provider
has done to resolve the issue. With the exception of Cambridges iReport, each of these systems
also provides some form of a contextual display showing nearby reports, either as a map or as a
list.
The public display of reports is limited in different ways. Mobile apps are constrained in
terms of information and complexity that can be displayed, but offer the advantage of using the
user location for filtering relevant data. Web sites allow for more complexity. In the case of
Boston, the website offers three levels of representation – aggregated in monthly performance
indicators, mapped in a web-‐GIS application, and listed as a real-‐time feed of incoming
reports.4,5 However, the actual incident descriptions are only accessible via the citizens connect
twitter feed, effectively limiting the visibility of offensive reports. In the case of New York, they
are entirely absent.6 This decision may help prevent vandalism through submission of unrelated
and offensive text and images, but it also limits the visibility of notorious complainers, who
reinforce each other in their attitude against the city. The ephemeral nature of a real-‐time
twitter feed paradoxically renders the system more opaque by making it harder to find an
individual report in the stream of constantly updated information.
SeeClickFix has chosen a different strategy for displaying reports. Unlike Boston and New
York’s proprietary systems, SeeClickFix places its main emphasis on the display and discussion of
the submitted reports in a highly visible public forum. Its interface does not stop at a passive
4 http://www.cityofboston.gov/mayor/24/requests.asp 5 http://www.nyc.gov/apps/311/ 6 https://mayors24.cityofboston.gov:4443
14
display: users can proactively sign up public officials through their public email addresses to
receive the complete feed of issues and comments concerning a specified area. The platform,
however, does not include functions for analysis and visualization of historic data.
Many cities offer aggregated data sets of the submitted reports and key performance
indicators of various urban services. However, none of the compared feedback systems show
the real-‐time activity of the public works department beyond the response to the submitted
reports, for example by showing the locations where the city’s workforce is currently active.
Such a feature would allows seeing an otherwise isolated incident in context, which could
increase the acceptance and engagement on the side of the citizen.
The legibility of the reporting system itself is captured in the concepts of seamful versus
seamless design (Table 3). In the context of citizen feedback systems, a seamful system is a
system that offers open access to internal protocols and raw data on a programmatic level,
while a seamless system limits access to the functions of the end user interface. Cambridge
iReport is an example of a seamless system: it does not allow any customization nor provide
feedback that offers clues to what happens when a report is sent; user requests are limited to a
fixed set of service categories. The Open311 standard, on the other hand, is inherently seamful.
By including internal service codes and information about referrals to other agencies, Open311
systems represent the organizational structures, boundaries, and seams between the different
departments of the city government. Via its exposure of technical processes, Open311 systems
establish also a legibility of infrastructure governance.
The representation of the human side of infrastructural systems is investigated through the
concept of Social Presence (Table 3). The open311 standard in its current form (V.2) represents
the interaction of users and governors only to a limited degree. Both user requests and the
response from the provider are treated as anonymous, since the standard does not provide for
any kind of personalization. As a consequence, open311-‐based client apps allow for little social
presence. However, there are workarounds: many open311 based systems, including Citizens
Connect and BrookONline forward their reports via the Twitter platform, which allows for a
more personalized interaction. The representation of users is more prominent in the web-‐
oriented systems (2,3, and 7 in Table 1). Following established web 2.0 design patterns, the
users of SeeClickFix and CitySourced can create personal profile pages. Cities and city officials
are represented in a similar way. Interestingly, SeeClickFix does not make a principal distinction
between citizens and public officials, who often register and contribute as regular users.

15
A minimalist, one-‐to-‐one approach vs. a social many-‐to-‐many approach
Concluding from the previous observations, the design choices of the compared applications
follows two different philosophies, which could be called the minimalist and the social approach.
The first approach focuses entirely on one-‐to-‐one interaction between the individual and the
city. Its interface is minimalistic, aimed at streamlining the communication of the citizen
reporter with the public works department. The range of possible interactions is therefore
deliberately constrained; the choice of service categories fixed. This approach has been chosen
by the developers of NYC 311online, the iReport system recently launched in Cambridge, and to
some extent also for the Spotreporter systems Citizens Connect and BrookONline.
The second approach focuses on a more social, many-‐to-‐many interaction among citizens
and service providers, aims at establishing a community of practice around the activity of
incident reporting. Consequently, platform such as SeeClickFix feature many elements familiar
from other social media platforms. Citizens and public officials alike are represented via user
profiles; users have the possibility to rate and comment on existing issues, their activity feeds
into a simple reputation system.
While a minimalist design succeeds in simplifying the direct interaction between citizen and
city, is not difficult to imagine a case where a many-‐to-‐many conversation would be beneficial.
For example, many requests concern disputes among neighbors that could be resolved without
the city intervening. A more socially oriented feedback system could therefore help facilitating
self-‐help.
Reasons for choosing the minimalist approach
Often, the design of feedback systems is constrained by the historical factors. Existing systems
involve complex database structures that are generally difficult and expensive to change.
However, a minimalist design also offers advantages. A well-‐defined set of possible interactions
can be more efficiently managed by a public works department: a single report about a broken
streetlight can be immediately added to the respective task queue; a broad discussion around
the pros and cons of adding a crosswalk is less actionable for the service provider. A minimalistic
interface might also be more accessible for a broad population compared to the more complex
social media approach. A researcher from IBM Research challenges in an interview the
philosophy behind the latter approach as the result of "the web-‐way of thinking," which does
not translate well to urban space, especially keeping in mind barriers such as the tedious text-‐

16
entry on the keyboard of a smartphone. In his view, citizens do not appreciate such features;
they want their complaints to be heard and acted upon. From an accessibility standpoint, the
design patterns of social media might be attractive for a certain tech-‐savvy users, but at the
same time represent an obstacle for less technology-‐literate citizens.
Table 3 Design factors of the compared systems
System # 1 2 3 4 5 6 7 8
Open311 SeeClickFix FixMyStreet
Cambridge iReport
Spot Reporters
NYC 311 online
City Sourced
Ushahidi
Main platform NA Web / mobile Web Mobile Mobile Web Web Web
Paradigm NA Social Social minimalist minimalist minimalist Social Social
System legibility
Reports publicly visible? Via API Dedicated site
Dedicated site No Dedicated
site Yes Yes Dedicated site
Public response from provider? Yes Yes Yes No Yes No Yes Yes
Seamful vs. seamless
Raw Data Access Open311 Free API / Open311
Commercial API No Open311 Open311
(v1.0) Free API / Open311
Free API / Open311
Tools for data analytics No No No No Via data portal
Via data portal No Yes
Social presence
Anonymous use possible? NA Yes
(guest) Yes
(guest) Yes Yes Yes No Yes
Other users visible? No Yes (opt-‐
in) Yes (opt-‐
in) No No No Yes (opt-‐
in) No
Can users respond to other reports?
No Yes -‐ vote, comment
Yes -‐ comment
No No No Yes -‐ vote, comment
Yes -‐ verify, vote
Reward system No Top users, points No No No No
Yes / voting No
Implicit assumptions about the users and their motivations
Ultimately, the designers of feedback systems have to consider whether the citizens would
appreciate a complex social interface, when they want is their grievance being addressed by the
city. While infrastructure services are considered a public good, the individual citizen might treat
the service as a private good. Therefore, one could argue that the minimalist approach renders
the urban service as a private good, and involves an implicit assumption of a user pursuing his or
her self-‐interest. The social approach highlights the role of infrastructure as a public good, and
assumes users who are interested in civic issues.

17
RQ2: Stated Motivations of users
The following section will concentrate mainly on two systems operating in the Boston area,
Citizens Connect (CCN) and SeeClickFix (SCF), which were selected for several reasons. Both
systems provide access to the report descriptions, are technically comparable, and their reports
are answered by the same city department. More importantly, each respective system is an
almost pure embodiment of the minimalist and the social paradigm. Citizens Connect is a
government-‐driven system with an emphasis on service delivery; the interaction can be
characterized as one-‐to-‐one and anonymous, with an emphasis on mobile usage. SeeClickFix is a
privately driven effort with an emphasis on social accountability, the interaction can be
characterized as many-‐to-‐many and less anonymous. While SCF offers a mobile application, the
emphasis lies on the website.
From the 30278 reports submitted via CCN, a random sample of 1172 reports was drawn,
while the whole SCF data set concerning the city of Boston was used, consisting of 695 issues
and 1780 reactions.
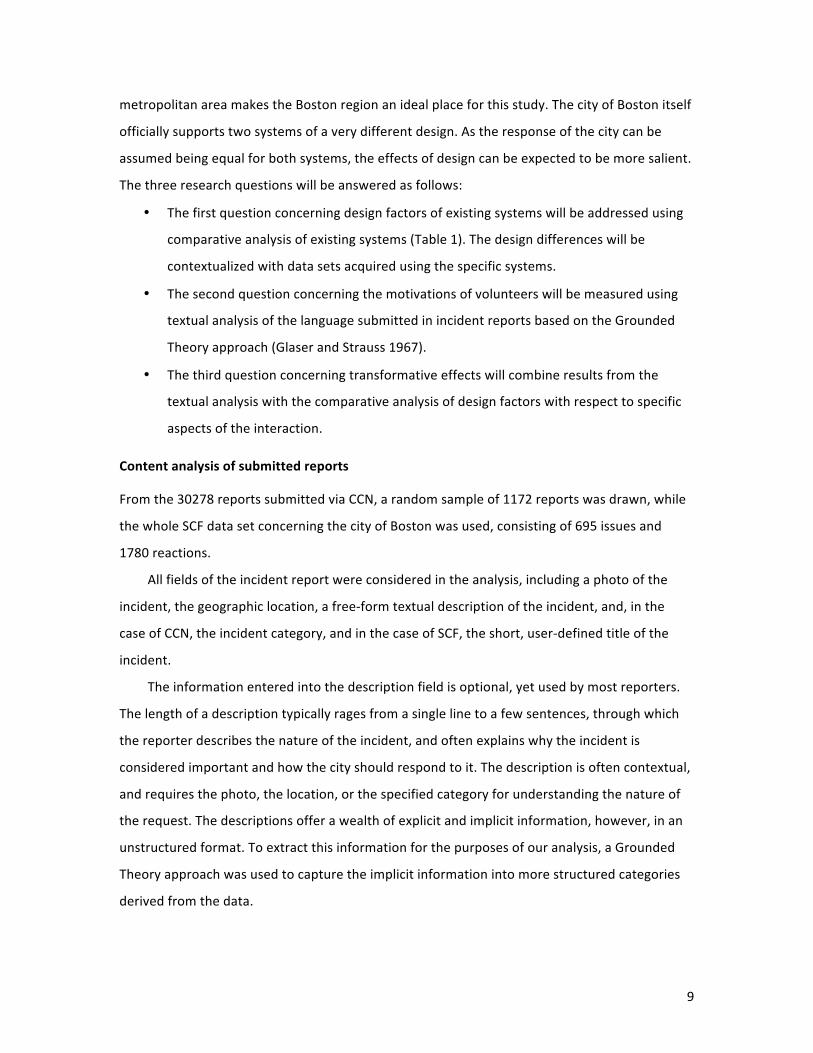
Figure 2 Screenshots of the Citizens Connect (CCN) and SeeClickFix (SCF) Smartphone app interfaces –
the latter affords additional social presence by allowing to explore “neighbors.”
Table 3 Citizens Connect: composition of the sample by submitted Service Categories
Service category N %
Other 573 49% Graffiti 201 17% Pothole 175 15% Streetlight 122 10% Sidewalk Patch 41 3% Damaged Sign 25 2% Unshoveled Sidewalk 26 2% Roadway 9 1%

18
Plowing/Sanding
Total 1172 100%
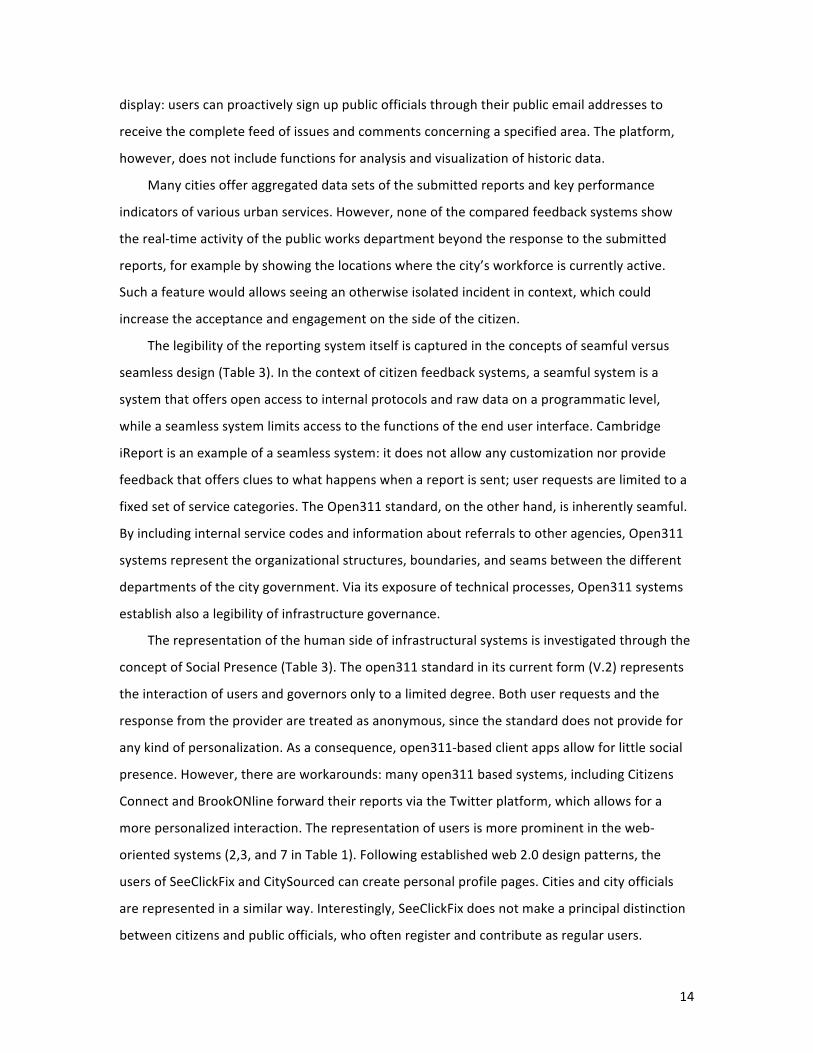
Submitted text: Second time opening this issue. On utility box. Was closed last week without being fixed. Category: Graffiti Submitted: 11/1/10 8:05 Status: Closed Updated: 11/4/10 11:17 Location: 42.32189175 -‐71.10108364 Service Reply: CAN'T REMOVE THIS IS A PRIVATE ELECTRICAL GENERATOR TRANSFER BOX...I BELIEVE I ALSO PUT THIS IN BEFORE. tone: critical, motivation: aesthetic concern, incident type: graffiti, properties: follow-‐up, accountability, custom reply
Figure 3 An example of a submitted Citizens Connect Report with associated Metadata, the reply of the
service provider, and the categorization in the content analysis.
Table 4a Comparison Citizens Connect (CCN) vs. SeeClickFix (SCF): Types of incidents submitted (left),
Motivations expressed (right)
Table 4b Comparison Citizens Connect (CCN) vs. SeeClickFix (SCF): Tone of report (left), selected non-‐
exclusive Properties (right)
Types of Incidents
CCN SCF CCN SCFIncident,type N % N % difference Motivations,expressed N % N % differenceAnimals 16 1% 7 1% Aesthetic0concerns 174 15% 33 5%Graffiti 210 18% 16 2% Bad0personal0experience 15 1% 32 5%Ice 37 3% 3 0% Concerns0with0disrepair 305 26% 249 36%Infrastructure0improvement 39 3% 92 13% Dissatisfied0with0the0city0service 38 3% 12 2%Infrastructure0repair 493 42% 466 67% Ideas0/0discussion0civic0issues 39 3% 76 11%Other0violation 40 3% 13 2% Other0people's0behavior 108 9% 47 7%Plants 42 4% 11 2% None0specified 345 29% 118 17%Social0issues 7 1% 10 1% Public0health0/0sanitation 37 3% 11 2%Test0/0unknown 13 1% 8 1% Safety0concerns 111 9% 116 17%Traffic 64 5% 39 6%Trash0/0litter 211 18% 29 4%Total 1172 100% 694 100% Total 1172 100% 694 100%
CCN SCF CCN SCF
Tone)of)report N % N % difference Properties)(non)exclusive) N % N % difference
Critical 205 17% 204 29% Demanding6Accoutability 60 5% 30 4%
Friendly 54 5% 30 4% Complaint6in6strong6language 37 3% 21 3%
Neutral 577 49% 317 46% Reporting6other6people 118 10% 26 4%
No6text 234 20% 104 15% Concern6for6safety 143 12% 140 20%
Plea 64 5% 20 3% Suggesting6Improvements 53 5% 81 12%
Very6critical 38 3% 19 3%
Total 1172 100% 694 100%

19
Error! Reference source not found. breaks down the Citizens Connect reports analyzed in the
random sample by the currently seven different service categories provided by the system. Since
about half of the CCN reports were submitted in the open “Other” category and the SCF reports
required no categories at all, further analysis was needed to identify the nature of the reported
incident (Table 4, top left). In both systems, but especially in SCF, the largest group of the
reports concern infrastructure repair in the broadest sense, including street and sidewalk
surfaces, lights, signals and urban furniture. Incident reports concerning trash / litter, as well as
graffiti comprise each about a fifth of the CCN reports. In comparison, these topics are less
prominent in the SCF dataset. Questions of infrastructure governance and possible
improvements to infrastructure, on the other hand, are more frequently discussed in SCF.
Denouncing others, such as neighbors or parking offenders is also less prevalent in SCF (Table 4,
bottom left).
It can be speculated, that these differences in the submitted reports result from the more
private, one-‐to-‐one type conversation between the reporting citizen and the city in comparison
to the more social and discursive nature of SCF. Many users might prefer to report small
incidents of Graffiti, litter, or traffic violations in the more anonymous setting of CCN, but might
hesitate to post them on SCF, where they might need to justify their posting in front of other
users. Examples of arguments among users exist on SCF, especially in the context of parking
disputes.
Tone of the Reports
Another question of interest was the mood and tone of language. The majority of reports
submitted to both systems were written in a neutral, factual language, very critical, or otherwise
emotionally colored reports are rare (Table 4, top right). The proportional composition is
remarkably consistent across the two compared platforms. Often, and more so in SCF, reports
are written in a somewhat critical tone to express the urgency of the issue. Again, the more
public nature of SCF might contribute to the higher proportion of critical language to mobilize
other citizens. In both systems, reporters can submit a geo-‐referenced image of a graffiti tag or a
pothole without any description, if the issue is sufficiently represented by the image. This is the
case for 15% of SCF reports, and 20% for the mostly mobile-‐submitted CCN reports.

20
Table 5 Tone by incident type, Citizens Connect (CCN) and SeeClickFix (SCF)
Critical and very critical reports in CCN were triggered especially by trash and litter related
issues; in SCF this is mainly the case for infrastructure repair issues such as potholes (Table 5).
Neutral reports and reports without text overwhelmingly concern infrastructure repair, and in
the case of CCN, graffiti. In both platforms, reports written in a more positive tone frequently
offered suggestions for improvements.
Reasons for Submitting, Motivations Expressed
The reporters’ motivation for submitting is estimated given the nature of the incident, the tone
of the report and the explanation provided. The most common motivations were categorized as
in the bottom left part of Table 4. While the behavior of other people is also a frequent reason
of complaint on SCF, users of CNN report such issues more often. Users of SCF bring up general
civic issues and explicitly raise safety concerns more often; also suggestions for improvements
are more frequent. Because of the more frequent lack of text descriptions, CCN has a higher
proportion of reports where no estimation of the reporter’s motivation was possible.
This difference can be attributed to a number of reasons. Besides the already discussed
difference in visibility, CCN, representing the city, tends to receive reports that have the
character of service requests. SCF, on the other hand, is not directly identified with the city, and
therefore attracts more discursive reports, focusing on infrastructure as a public good. In CCN, a
pothole report often contains just a picture. In SCF, such reports are more often accompanied by
complaints or warnings of safety implications.
Examples
SCF$%$tone$by$incident$typeCCN SCF CCN SCF CCN SCF CCN SCF CCN SCF CCN SCF CCN SCF
animals 3% 0% 2% 0% 2% 2% 0% 0% 0% 0% 0% 3% 1% 1%graffiti 5% 0% 4% 0% 17% 4% 38% 1% 11% 0% 6% 0% 18% 2%ice 0% 0% 4% 1% 2% 0% 6% 0% 6% 0% 0% 0% 3% 0%infrastructure$improvement 0% 0% 5% 12% 3% 15% 0% 0% 5% 50% 9% 31% 3% 13%infrastructure$repair 28% 64% 43% 34% 44% 65% 50% 99% 44% 45% 39% 53% 42% 68%other$violation 13% 5% 9% 2% 2% 2% 0% 0% 0% 0% 9% 3% 3% 2%plants 0% 5% 4% 1% 4% 3% 0% 0% 14% 0% 7% 0% 4% 2%social$issues 5% 5% 2% 2% 0% 1% 0% 0% 0% 5% 0% 7% 1% 1%test$/$unknown 3% 0% 0% 0% 1% 0% 2% 0% 0% 0% 0% 0% 1% 0%traffic 3% 16% 10% 7% 6% 6% 0% 0% 0% 0% 11% 14% 5% 6%trash$/$litter 29% 16% 31% 9% 18% 2% 4% 0% 20% 0% 15% 7% 18% 4%Grand$Total 100% 100% 100% 100% 100% 100% 100% 100% 100% 100% 100% 100% 100% 100%
Totalcritical friendlyneutral no$text pleavery$critical

21
The following section discusses the classification and inference of motivations from the
reports more in detail. The tone of a report was categorized as critical, if it contains language
that expresses the urgency of the incident, or express mild dissatisfaction with how the city has
handled the issue in the past. Examples include texts such as “3rd report of crumbling stairway.
Getting very dangerous” or “Light goes out periodically then comes on slowly. Dangerous area
for drugs, assaults.. Please fix. Thanks”. “Very critical” are reports that use strong language to
express their dissatisfaction or an openly accusatory tone. Examples include complaints such as
“Case open 136 days. Come on, City of Boston, surely you can do better than that!” or “Paint the
white lines. It's horrible that the lines have been missing here for over 1 year. You are on notice,
if someone gets hurt the city is liable. Shame that there is a school 20 feet away.....” Reports
categorized as “Pleas” urged the city to take action rather than just reporting facts, while
“Friendly” reports used distinctively polite or humorous language such as “Turkey walking down
Fairfield street. Not winning the marathon...”
In many cases, the estimation of motivations was not possible due to the briefness and
factual nature of the report. Aesthetic concerns behind a report were only assumed if the
reporter expresses or implies such a motivation, as in “trash collects along this fence and is an
eyesore. please send someone to clean it up. thx.” Graffiti, an aesthetic issue, was not
automatically categorized as such a concern, as it might be reported for different motivations,
such as a safety concern. Often, the justification was a bad personal experience: “This pothole
was never fixed, but reported fixed by City. I lost a tire on this pothole.“ Frequently, public safety
is invoked: “This water cover has been unscrewed and turned over for a few days now and it's
really pretty easy to trip on because it moves and stick up out of the sidewalk.” or “This is a
terrible intersection. Constant beeping every 5 mins disturbs the neighborhood. I'm afraid there
will be an accident here all the time. I've almost been hit several times.”
There were also reporters that offered ideas and suggestions how to improve a specific
situation, for example: “Google maps says this area is a park. Doesn't look like a park to me. This
area has one of the best water views in Boston and looks awful. There should be a park bench or
something nice there. Also the guardrail is very old looking and beat up. Makes the
neighborhood look disgusting. The whole area is very un-‐looked after,” or “Fallon field
playground climber has come undone. Requires big-‐ass tamper-‐proof torx bits. I think that's all
that's needed.”

22
Accountability is frequently directly addressed especially if an issue persists: “Whoever got
paid to close this report ripped off the taxpayers TWICE“. A resident of East Boston addresses
issues of perceived inequality, writing “Does one have to live in a posh neighborhoods to get
something done? Isn't an abandoned U-‐Haul truck a security concern?”
Often, the reason of complaints was the behavior of other citizens. Reporters denounced
other citizens mostly in in disputes over parking or the handling of trash, but also over noise,
code violations or other disputes. Examples include “Mitt Romney's giant Shredder Truck
illegally parked outside his office on Commercial Street. This giant shredder truck often parked in
tow zone in front of Romney National HQ, yet never towed or ticketed. Maybe he's shredding the
parking tickets too?” or “At 6:58 am today I ordered coffee at City Feed at corner of Centre and
Seaverns St. The cashier coughed into her hand then proceeded to wait on me without washing
her hands. This is unsanitary as well as disgusting behavior. Something needs to be done about
this germ-‐spewing menace. Thank you.”
Also social issues beyond the scope of the public works department are raised, especially
homeless and panhandlers are the targets of blunt requests such as “PANHANDLER / BEGGAR
[…], holding door open (to tracks 1 and 3), implying he's asking for money. I shouldn't have to
put up with this while I'm paying $235 a month for my commute. Please have him removed and
reinforce he should seek assistance elsewhere.”
Often, multiple issues, including aesthetic, safety and social concerns were addressed in one
single report: “Graffiti on the red sign and overall deteriorated building... Can't we do something
to make the owners of this falling apart business take care of graffiti, trash, danger hazard of
falling awning?” For this reason, certain aspects were coded as non-‐exclusive properties in
addition to the exclusive categories (Table 4, bottom left).
Private interests vs. the public good
Are the submitted concerns more personal, or more socially oriented, motivated by a
personal grievance or by a concern for the public good? While both motivations might be
present at the same time and difficult to untangle, the question whether others play a role in
the submitters motivations does have implications for the design of the feedback system and
vice versa. For example, personal complaints might be more effectively addressed by a
minimalist system, while a concern for the public good may also be instigated through the
design of the system.

23
We have seen that most reports are submitted in the reporter’s own neighborhood (Table 2).
Reports citing bad personal experiences or denouncing other people behaviors could be seen as
personal complaints, while concerns for safety, public health and sanitation, or the discussion of
wider civic issues addressed could be seen as public concerns. In this respect, about a third of
the SCF reports and almost a fifth of the CCN reports are socially oriented; while only about 10%
on each platform are explicitly personal in their motivation. However, the boundaries between
personal and public are fluid – a private concern can quickly become a public concern if it
resonates with the experiences of others. A report on SCF about a “stolen” parking spot quickly
turned into a broad discussion about social norms that should be applicable in a comparable
situation.7
Concluding with regard to RQ2, the differences in stated user motivations between CCN
and SCF can be attributed to three different factors. First, the expectations of the user from the
service: while both systems forward their reports to the city in the same way, SCF might be seen
more “independent” from the city, and therefore receive more critical reports, but also less
plain service requests. Second, the higher public visibility and lower privacy of reports on SCF
might contribute to a different style of reports. SCF reports put more emphasis on the public
good, and the implications of infrastructural issues on the wider public. Third, the different
affordances of the medium, the many-‐to-‐many conversation in the web environment leads to a
more open-‐ended discussion in SCF compared to CCN. This third aspect will be closer examined
in the following section.
RQ3: transformative effects
The effectiveness and the design of feedback systems are constrained by the capacity of city
departments to respond to this feedback. The feeling that the city’s capacity to respond to
requests does not match the sophistication of the interface will create frustration and
disaffection. Such a sentiment can be observed in several requests in sample: “72 days ago I
posted this under case id 101000405068 city forward info and details to DCR and forgot about it
72 days later nobody even care about this. What is the purpose of this citizens connect if we
voters are not taken in consideration by just simply being ignored […]”
7 The discussion can be accessed at http://seeclickfix.com/issues/76867

24
As briefly discussed earlier, the design and configuration of the system allows the city to manage
expectations and constrain the nature of citizen requests. We can expect, that the capacity of
the city to address citizen reports is reflected in their response time to specific types of request.
The duration from the submission of the request until its completion is a function of both the
actionability of the request (how well the request translates to a specific remediation action)
and its priority for the city given their constraints. In the following section, we will look at this
responsiveness to different types of requests.
Responsiveness of the city
Table 6 Citizens Connect: average response time by the city in days for closed issues, grouped by
different categories (N=849)
Days open Days open Service category Mean Median Incident type Mean Median Graffiti 17.3 7.3 Plants 37.9 2.0 Other 16.8 1.5 Social issues 35.0 1.8 Streetlight 13.0 3.8 Infrastructure improvement 19.8 8.2 Damaged Sign 12.4 8.7 Graffiti 17.7 7.3 Pothole 3.1 1.3 Infrastructure repair 15.7 2.1 Sidewalk Patch 2.9 0.9 Other violation 11.1 1.2 Unshoveled Sidewalk 2.6 2.8 Trash / litter 2.5 1.0 Roadway Plowing/Sanding 1.5 1 Ice 2.4 2.3 Traffic 2.4 0.9 Test / unknown 0.7 0.7 Animals 0.6 0.6 Total 13.0 2.0 Total 13.0 2.0
Days open Days open Motivations expressed Mean Median Tone of report Mean Median Ideas / discussion civic issues 31.2 6.6 Friendly 20.8 3.2 Safety concerns 22.2 3.1 Plea 16.2 1.5 Concerns with disrepair 18.7 2.0 Neutral 14.3 1.9 Bad personal experience 13.7 1.1 Critical 13.6 2.0 None specified 11.4 3.7 Very critical 10.1 0.8 Aesthetic concerns 5.1 0.9 No text 7.4 2.8 Issue with other people's behavior 3.7 1.2 Dissatisfied with the city service 3.4 0.8 Public health / sanitary concerns 1.9 1.3 Total 13.0 2.0 Total 13.0 2.0
Table 6 shows the responsiveness of the city for reports submitted via CCN, measured as the
average number of days until an issue is marked as resolved. A similar analysis was not possible
in SCF, since issues are acknowledged by the city, but rarely marked as closed.
Graffiti and other requests take average of 17 days (med=7.3) to resolve, while potholes,
sidewalk patches and snow and ice removal are closed after three days or less.

25
Closer investigation of the nature of the incident reveals that issues that cannot be directly
translated into an immediate course of action take longest to resolve, including suggestions for
infrastructure improvement or social issues. In contrast, issues such as traffic and parking
violations, are resolved swiftly (Table 6, top right). The tone of the report appears to make a
difference. Reports in a very critical language are resolved most quickly, while friendly requests
take longest (Table 6, bottom right). A similar pattern emerges from the motivations expressed:
ideas offered and discussions of general civic issues tend to remain open longer (Table 6, bottom
left).
Responsiveness should not be read as the only measure for service quality; it should not be
surprising that civic issues require a broader discussion and cannot be resolved within a day. The
time until resolution does however indicate the priorities of the city: city employees confirmed
in a conversation that sidewalk patches have a high priority. It does also indicate how actionable
a specific issue is: in terms of the nature of the incident, but also in terms of the alignment of
the categories offered by the platform with the organizational structures inside the city
government.
Integration with the internal structures
From the service provider perspective, the level of integration with the organizational structures
of the departments is the single most important parameter for the success of a citizen feedback
system. A free-‐form request might be convenient for the citizen, but is difficult to parse and act
upon on the provider side. On the other hand, using internal service categories for requests
might be most actionable for the city, but opaque for the citizen. A successful system negotiates
between the two extremes, often leading to different results for each city. At this point open311
does not provide a standard taxonomy, instead offers functions to query the service types
available in a specific location.
The compared systems choose different approaches in this regard. The DC 311 mobile
application uses no less than 87 service categories. Citizens Connect offers seven frequently
used categories plus a category labeled “other”, covering everything else. Cambridge limits
reports to six fixed categories. SeeClickFix adopts the categories of partnering cities, otherwise
provides no standard categories at all.
The importance of integration also becomes apparent in the case of SCF: the system is
effective where a partnership with a city exists, and the offered service categories is integrated

26
in the structures of the local provider, as in the case of Boston since Sept. 2011. With no such
partnership in place and no obligation for the city to respond in a timely manner, the system has
to rely entirely on mechanisms of social accountability. Judging from the few reports submitted
in Cambridge via SCF and the even fewer responses from the city, this seems to be often less
effective and is detrimental to the trust into the system.
The categorization of reports also has tangible consequences for the organizational
structures of public works departments. In the case of NYC 311, the requests prompted internal
questions such as: how deep does a pothole have to be to fall into the responsibility of the
department of sanitation as opposed to the department of transportation? Through the
interaction with citizen requests, the departments re-‐negotiated their boundaries and
relationships by repeatedly “drawing lines in the sand” and therefore re-‐shaping the system.8
To what extent can a system facilitate self-‐help?
The capacity of online 311 systems to galvanize coordination and self-‐help among citizens is
frequently emphasized. In fact, many of the reports submitted via CCN, fall outside the city’s
responsibility, or would not require its involvement: “Our neighbor always brings her daughter
and dogs to poop in front of our house and they live in 433 in the 1st and 2nd apartment. I called
the Animal Control for 2 years and nothing changed.” It also is clear that a suggestion by a citizen
to remove a handicapped parking spot cannot be negotiated over a system such as Citizens
Connect. While many cases illustrate the need for a better coordination among citizens, systems
such as Citizens Connect in its current form are not designed to support such a many-‐to-‐many
communication involving both citizens and the city. In order to allow citizens to act upon
existing reports, these need to be visible and discoverable for other residents. SeeClickFix
provides a simple mechanism for this purpose. Citizens can sign-‐up themselves or others for a
“Watch Area”, an automatic data feed of current issues related to a specific topic and
neighborhood. Since SCF treats citizens and government as users on the same level, it is not
predetermined that a request has to be addressed by a public official, it can also be answered by
a citizen. During a large snowstorm in Boston Feb. 2009, this mechanism has become the basis
for a citizen-‐initiated platform to organize the snow removal within the community.
8 From an interview with a former NYC 311 analyst
27
Conclusions -‐ recommendations, future role of infrastructure
As demonstrated in this paper, the design choices of citizen feedback systems – such as which
aspects of the system are represented and how, which forms of interaction are allowed -‐ play a
subtle, but central role in mediating the interaction among citizens and between citizens and the
city. This happens through various mechanisms. First, by determining the degree of the public
visibility of a citizen report, as well as the degree of privacy of the reporter. Second, by
determining the way the other is represented in a conversation – city and citizens. Third, by
regulating the interaction, for example by determining who is allowed to respond to a report.
Forth, by providing the vocabulary of the exchange, for example by through the selection of
categories that can be used for reporting.
It is clear that 311 systems, in their current stage, are not the final answer to the question
how to engage the broad public in urban infrastructure governance. However, they offer
valuable lessons on how this issue can be approached. Public participation is not only concerned
with large questions and consequential decisions, but with issues that happen on a very small
scale.
The previous discussion identified a number of different examples of how design shapes
such low-‐threshold interactions at the interface between the individual and an infrastructural
system. The way citizens can engage with the city and its infrastructure is moderated through
subtle design decisions that control visibility, access and the social dynamic among volunteers.
Contrasting the design aspects of currently operational citizen feedback systems with different
characteristics of the actual reports submitted by the citizens, it reflects on the role and
significance of infrastructure legibility. How important is seeing the system? How important is
seeing other people? How important is it to see the consequences, such as the responses from
the city? In cases when citizens need to address an infrastructural issue they are suffering from,
a simple and effective reporting mechanism, with the obligation of receiving a timely reply is
highly appreciated. However, there are also many cases where the minimalistic approach is not
sufficient.
While the value civic participation is barely critically questioned, it is also important to
consider its possible downsides. A feedback system might to reduce the perceived role of the
city to answering citizen requests. Over-‐emphasizing the service character therefore can
possibly paralyze the city, and ultimately diminish the quality of public infrastructure, especially

28
with short-‐term fixes superseding more strategic, long-‐term planning. The same issue can be
lead to frustration on the side of the citizen, if city is not responsive, follows a different agenda,
or does not take responsibility for its actions.
Cited Sources
Appalachian Trail Conservancy. 2012. “Volunteer Management.” http://www.appalachiantrail.org/what-‐we-‐do/trail-‐management-‐support/volunteer_toolkit/volunteer-‐management.
Callon, M., and B. Latour. 1981. “Unscrewing the Big Leviathan: How Actors Macro-‐structure Reality and How Sociologists Help Them to Do So.” Advances in Social Theory and Methodology: Toward an Integration of Micro-‐and Macro-‐sociologies: 277–303.
Cardwell, Diane. 2002. “Bloomberg Plans Quick Start of Citywide 311 Phone System.” New York Times, February 1. http://www.nytimes.com/2002/02/01/nyregion/bloomberg-‐plans-‐quick-‐start-‐of-‐citywide-‐311-‐phone-‐system.html?pagewanted=all&src=pm.
Chalmers, Matthew, and Areti Galani. 2004. “Seamful Interweaving: Heterogeneity in the Theory and Design of Interactive Systems.” In Proceedings of the 5th Conference on Designing Interactive Systems: Processes, Practices, Methods, and Techniques, 243–252.
City of Chicago. 2013. “Chicago 311 History.” http://www.cityofchicago.org/city/en/depts/311/supp_info/311hist.html.
Coleman, D. J, Y. Georgiadou, and J. Labonte. 2009. “Volunteered Geographic Information: The Nature and Motivation of Produsers.” International Journal of Spatial Data Infrastructures Research 4 (2009): 332–358.
Coleman, D., B. Sabone, and J. Nkhwanana. 2010. “Volunteering Geographic Information to Authoritative Databases: Linking Contributor Motivations to Program Characteristics.” Geomatica 64: 27–40.
Department of General Services. 2000. “Non-‐emergency Number Pilot Programs”. Sacramento, CA: Department of General Services. http://www.911dispatch.com/reference/cal311report.pdf.
Desouza, Kevin C., and Akshay Bhagwatwar. 2012. “Citizen Apps to Solve Complex Urban Problems.” Journal of Urban Technology 0 (0) (August): 1–30. doi:10.1080/10630732.2012.673056.
Erickson, Thomas, and Wendy A. Kellogg. 2000. “Social Translucence: An Approach to Designing Systems That Support Social Processes.” ACM Transactions on Computer-‐Human Interaction 7 (1): 59–83.
FCC. 1997. “FCC CREATES NEW 311 CODE FOR NON-‐EMERGENCY POLICE CALLS AND 711 CODE FOR ACCESS TO TELECOMMUNICATIONS RELAY SERVICES”. NEWSReport CC 97-‐7. http://transition.fcc.gov/Bureaus/Common_Carrier/News_Releases/1997/nrcc7014.txt.
Flynn, Kevin. 2001. “20% Increase in 911 Calls Is Seen As a Result of Cellular Phone Use.” New York Times, May 1. http://www.nytimes.com/2001/05/01/nyregion/20-‐increase-‐in-‐911-‐calls-‐is-‐seen-‐as-‐a-‐result-‐of-‐cellular-‐phone-‐use.html?src=pm.
Gabler, Ellen. 2010. “Those Pesky Bedbugs Won’t Rest.” Chicago Tribune. October 28. http://articles.chicagotribune.com/2010-‐10-‐28/a-‐z/ct-‐met-‐bedbugs-‐20101028_1_bedbugs-‐pest-‐control-‐apartment-‐building-‐tenants.

29
Glaser, Barney G., and Anselm L. Strauss. 1967. The Discovery of Grounded Theory: Strategies for Qualitative Research. Transaction Publishers.
Goodchild, M. F. 2007. “Citizens as Sensors: Web 2.0 and the Volunteering of Geographic Information.” GeoFocus (Editorial) 7: 8–10.
Hester, Jere. 1997. “Here’s The 411 On New 311 Calls.” New York Daily News, February 20. http://articles.nydailynews.com/1997-‐02-‐20/news/18038050_1_nonemergency-‐kitten-‐new-‐phone-‐number.
Hossain, Naomi. 2010. “Rude Accountability: Informal Pressures on Frontline Bureaucrats in Bangladesh.” Development and Change 41 (5): 907–928. doi:10.1111/j.1467-‐7660.2010.01663.x.
Johnson, Steven. 2010. “What a Hundred Million Calls to 311 Reveal About New York”, November 1. http://www.wired.com/magazine/2010/11/ff_311_new_york/all/1.
Latour, Bruno. 2005. Reassembling the Social: An Introduction to Actor-‐network-‐theory. Oxford University Press.
Lynch, Kevin. 1960. The Image of the City. Cambridge Mass.: MIT Press. MacColl, I., M. Chalmers, Y. Rogers, and H. Smith. 2002. “Seamful Ubiquity: Beyond Seamless
Integration.” In Workshop at UbiComp. Vol. 2. Malena, Carmen, Reiner Forster, and Janmejay Singh. 2004. “Social Accountability -‐ An
Introduction to the Concept and Emerging Practice”. 76. Social Development Papers. Washington DC: The World Bank.
Martínez, J. A., K. H. Pfeffer, and Tara van Dijk. 2009. “The Capacity of E-‐government Tools: Claimed Potentials, Unnamed Limitations.” In Proceeding of the 10th N-‐AERUS Conference: Challenges to Open Cities in Africa, Asia, Latin America and the Middle East: Shared Spaces Within and Beyond, IHS Rotterdam.
Morville, Peter. 2005. Ambient Findability. O’Reilly Media, Inc. Putnam, Robert D. 2001. Bowling Alone: The Collapse and Revival of American Community.
Simon and Schuster. Rafaeli, Sheizaf, and Yaron Ariel. 2008. “Online Motivational Factors: Incentives for Participation
and Contribution in Wikipedia.” In Psychological Aspects of Cyberspace: Theory, Research, Applications, edited by A. Barak, 243–267. Cambridge, Mass.: Cambridge University Press. http://citeseerx.ist.psu.edu/viewdoc/download?doi=10.1.1.158.1212&rep=rep1&type=pdf.
Scott, James C. 1999. Seeing Like a State: How Certain Schemes to Improve the Human Condition Have Failed. Yale University Press.
Short, John, Ederyn Williams, and Bruce Christie. 1976. The Social Psychology of Telecommunications. Wiley.
Shulman, Robin. 2005. “A Man With a Vision for Getting New York Wired.” The New York Times, September 2, sec. New York Region / Metro Campaigns. http://www.nytimes.com/2005/09/02/nyregion/metrocampaigns/02lives.html.
Star, Susan Leigh. 1999. “The Ethnography of Infrastructure.” American Behavioral Scientist 43 (3) (November 1): 377 –391. doi:10.1177/00027649921955326.
Van Ryzin, G. G, S. Immerwahr, and S. Altman. 2008. “Measuring Street Cleanliness: A Comparison of New York City’s Scorecard and Results from a Citizen Survey.” Public Administration Review 68 (2): 295–303.
Verplanke, Jeroen, Javier Martinez, Gianluca Miscione, Yola Georgiadou, David Coleman, and Abdishakur Hassan. 2010. “Citizen Surveillance of the State: A Mirror for eGovernment?” What Kind of Information Society? Governance, Virtuality, Surveillance, Sustainability, Resilience: 185–201.
Weiser, Mark. 1994. “Building Invisible Interfaces. Keynote Talk.” In Proc. ACM UIST.

30
Wilson, Matthew W. 2011. “‘Training the Eye’: Formation of the Geocoding Subject.” Social & Cultural Geography 12 (04): 357–376.
Woolgar, Steven. 1991. “Configuring the User: The Case of Usability Trials.” In A Sociology of Monsters : Essays on Power, Technology and Domination, edited by John Law, 57–99. Routledge, London.
Acknowledgements
Appendix
Table 7 Coding Rubric for content Analysis
Operational definition
Tone of the Report Very critical The report contains explicit expressions of anger, dissatisfaction or accusations Critical The report emphasizes the urgency of the reported issue
Neutral The report is limited to factual information, for example an explanation of what needs to be fixed or a location description
No Text The description field contains no text Plea The report contains language that urges the city to respond to the issue Friendly The report contains very positive language, such as a praise for the city's service Incident Type If multiple issues present, identify the most salient animals Incident involves animals – rodents, dead animals on the street and similar. graffiti Incident concerns graffiti ice Incident concerns snow and ice on the road or on the sidewalk infrastructure improvement Incident concerns possible changes to public infrastructure -‐ new regulations,
signs, elements infrastructure repair Incident concerns a state of disrepair, i.e. a pothole, a broken streetlight plants Incident involves plants -‐ fallen trees, overgrown weeds and foliage social issues Incident involves a conflict with other social groups test / unknown Incident has no apparent purpose, or is sent to test the system traffic Incident concerns traffic issues, including parking violations trash / litter Incident concerns litter, trash and general cleanliness other violation All other types of incidents Motivations expressed If multiple motivations are stated, identify the most salient aesthetic concerns Report contains a concern for the aesthetic appearance of the city (graffiti is not
necessarily always an aesthetic concern) bad personal experience Report mentions a bad personal experience in connection with the incident concerns with disrepair Report states that a physical object is broken dissatisfied with the city service Report contains explicit expressions of dissatisfaction with the city service ideas / discussion civic issues Report proposes a specific idea, or raises a more general civic question in relation
to the reported incident

31
issue with other people's behavior Report explicitly denounces another person's behavior none specified No reason can be inferred public health / sanitary concerns Report explicitly states a concern for sanitary or public health conditions safety concerns Report explicitly states that the issue poses a safety threat for the public Non-‐exclusive Properties
Demanding Accoutability Report emphasizes accountability, for example by mentioning that the city has the obligation to the public to fix a specific issue
Reporting other people Report explicitly denounces another person or party Concern for safety Report mentions a concern for safety Suggesting Improvements Report offers concrete suggestions for improvement
Related Documents