1 Infrared spectroscopy of radioactive hydrogen chloride H 36 Cl Santeri Larnimaa a, *, Markku Vainio a,b , Ville Ulvila c a Department of Chemistry, University of Helsinki, Helsinki, Finland b Photonics Laboratory, Physics Unit, Tampere University, Tampere, Finland c VTT Technical Research Centre of Finland Limited, Espoo, Finland * Corresponding author Postal address: Department of Chemistry, University of Helsinki, P.O. Box 55, FI-00014 Helsinki, Finland E-mail address: [email protected] Keywords Radioactive hydrogen chloride H 36 Cl, Fourier-transform infrared spectroscopy FTIR, rotational-vibrational spectroscopy, line center wavenumber, molecular constant Abstract We present the first report of optical absorption spectroscopy of H 36 Cl, a radioactive isotopologue of hydrogen chloride. We used Fourier-transform infrared spectroscopy to determine the line center wavenumbers of the fundamental rovibrational band lines P(10)–R(10) and the first overtone band lines P(1)– R(7) with total uncertainty of less than 0.0018 cm -1 (60 MHz) and 0.007 cm -1 (0.2 GHz), respectively, at 68 % confidence level. We also performed a rotational analysis on the bands to determine the related molecular constants. We further compared the linewidths and relative intensities of the lines to those of the stable isotopologues H 35 Cl and H 37 Cl. The new spectroscopic information assists in developing optical instrumentation for the detection of H 36 Cl. 1. Introduction Hydrogen chloride is an important molecule that plays a role in atmospheric chemistry [1,2], astrochemistry [3-5], the semiconductor industry [6], and in the research of volcanic activity [7-10] and planetary atmospheres [11-13]. While the rovibrational bands of HCl were studied in detail already in the 1960s [14- 16], early works on HCl date to the beginning of the 20 th century to the development of early spectrometers and the acceptance of quantum mechanics [17-19]. In recent years, there have been many publications that report increasingly accurate line parameters [20-24]. The naturally occurring stable isotopologues H 35 Cl, H 37 Cl, and their deuterated forms are usually studied. However, to the best of our knowledge, there are no prior reports on optical spectroscopy of H 36 Cl.

Welcome message from author
This document is posted to help you gain knowledge. Please leave a comment to let me know what you think about it! Share it to your friends and learn new things together.
Transcript
1
Infrared spectroscopy of radioactive hydrogen chloride H36Cl
Santeri Larnimaaa,*, Markku Vainioa,b, Ville Ulvilac
a Department of Chemistry, University of Helsinki, Helsinki, Finland
b Photonics Laboratory, Physics Unit, Tampere University, Tampere, Finland
c VTT Technical Research Centre of Finland Limited, Espoo, Finland
* Corresponding author
Postal address: Department of Chemistry, University of Helsinki, P.O. Box 55, FI-00014 Helsinki,
Finland
E-mail address: [email protected]
Keywords
Radioactive hydrogen chloride H36Cl, Fourier-transform infrared spectroscopy FTIR, rotational-vibrational
spectroscopy, line center wavenumber, molecular constant
Abstract
We present the first report of optical absorption spectroscopy of H36Cl, a radioactive isotopologue of
hydrogen chloride. We used Fourier-transform infrared spectroscopy to determine the line center
wavenumbers of the fundamental rovibrational band lines P(10)–R(10) and the first overtone band lines P(1)–
R(7) with total uncertainty of less than 0.0018 cm-1 (60 MHz) and 0.007 cm-1 (0.2 GHz), respectively, at 68 %
confidence level. We also performed a rotational analysis on the bands to determine the related molecular
constants. We further compared the linewidths and relative intensities of the lines to those of the stable
isotopologues H35Cl and H37Cl. The new spectroscopic information assists in developing optical
instrumentation for the detection of H36Cl.
1. Introduction
Hydrogen chloride is an important molecule that plays a role in atmospheric chemistry [1,2], astrochemistry
[3-5], the semiconductor industry [6], and in the research of volcanic activity [7-10] and planetary
atmospheres [11-13]. While the rovibrational bands of HCl were studied in detail already in the 1960s [14-
16], early works on HCl date to the beginning of the 20th century to the development of early spectrometers
and the acceptance of quantum mechanics [17-19]. In recent years, there have been many publications that
report increasingly accurate line parameters [20-24]. The naturally occurring stable isotopologues H35Cl,
H37Cl, and their deuterated forms are usually studied. However, to the best of our knowledge, there are no
prior reports on optical spectroscopy of H36Cl.
2
Chlorine-36 is a radioactive isotope of chlorine that is formed naturally in the atmosphere [25] and can be
used, for example, for groundwater dating [26-29]. The species is also formed in nuclear facilities by neutron
activation of 35Cl impurities found in reactor materials [30-33]. This is a major concern due to the long (ca.
301 000 years) half-life of 36Cl. Some of 36Cl may be released to the environment in the form of H36Cl.
Owing to their high sensitivity and selectivity, optical spectroscopy methods are well suited for the detection
of radioactive compounds in the gas phase [34]. These methods can also offer a more affordable and portable
alternative to the current state-of-the-art method, Accelerator Mass Spectrometry [35]. In addition,
spectroscopic methods do not depend on the specific activity of the species of interest, which might lead to
less laborious sample preparation than in Liquid Scintillation Counting [36], as the need for a complex
radiochemical separation is circumvented.
Prior research on optical spectroscopy of radioactive compounds has focused especially on laser
spectroscopy of radiocarbon dioxide 14CO2 [34,37-45]. One goal has been to develop highly sensitive and
portable field instruments for emission monitoring of this species in nuclear facilities and their decommission
sites. In general, the development of laser spectroscopy instrumentation for the detection of radioactive
molecules is hindered by the lack of spectroscopic information. For example, we only recently reported the
first absorption measurements and rotational analysis of radiocarbon methane 14CH4 [46,47], another
important species of concern in nuclear facility emission monitoring [48].
Here we report the results of our Fourier-transform infrared spectroscopy (FTIR) measurements of the
fundamental and first overtone rovibrational bands of H36Cl. These results aid the development of optical
instrumentation for monitoring this species. In the following sections, we first describe the sample
preparation, measurement and line-fitting procedures, after which we summarize the main results. Finally,
we present the rotational analysis and discuss the results for the overtone band. Supplementary information
contains information about the experimentally observed linewidths and relative intensities of the H36Cl
fundamental band lines, including a comparison to those of H35Cl.
2. Sample preparation and measurement conditions
The gaseous H36Cl sample was prepared by pipetting 50 µl of 36Cl-enriched NaCl solution (3.7 MBq/ml activity
concentration; American Radiolabeled Chemicals, Inc.) into a 10-cm long IR Quartz cell (Suprasil 300;
FireflySci Type 34). The aqueous sample was subsequently dried to solid NaCl using a flow of compressed air,
after which a few drops of concentrated sulfuric acid were added and the cell was closed with PTFE stoppers.
Finally, the reaction of the solid NaCl with sulfuric acid to produce HCl was initiated by tilting the sample cell
to combine the reagents. This simple gas cell system was not equipped with a pressure gauge or a
temperature meter to minimize the sample cell volume and sample losses.
Given the specific activity of 36Cl (1220 Bq/µg), the total amount of 36Cl in the sample was expected to be 4.2
µmol. Based on the FTIR measurements, we obtained 1.6 mbar of gaseous H36Cl. This estimate assumes the
HITRAN H35Cl line intensities for H36Cl (see Supplementary Note 4). This means that the yield into gas phase
was 43 %, assuming 296 K temperature and 28 ml volume of the sample cell. The sample also contained
approximately 0.4 mbar and 0.8 mbar of the stable isotopologues, H35Cl and H37Cl, respectively. The total
partial pressure of HCl was 2.7 mbar. Since the pressure increase in the sample cell due to the produced HCl
is small and the partial pressure of water in concentrated sulfuric acid is negligible [49], it is reasonable to
assume 1 atm (1013.25 mbar) pressure in the cell during the measurements. The lab pressure was within a
few mbar of this pressure upon filling the sample cell.
3
3. Measurement of the fundamental band
The H36Cl measurements in the mid-infrared (MIR) were executed using a commercial FTIR instrument
(Bruker IFS 120HR). We used a Globar light source, Ge-on-KBr beam splitter, and liquid-nitrogen-cooled InSb
detector. The raw spectrum is a result of processing 10 co-added double-sided interferograms using the
Mertz method [50]. We used the manufacturer-specified resolution setting of 0.02 cm-1 (600 MHz). The
manufacturer defines the resolution as the full width at half maximum (FWHM) of the assumed instrument
line shape (ILS) function if triangular apodization was used; we used Norton-Beer medium apodization [51],
which corresponds to 0.0095 cm-1 (285 MHz) half width at half maximum (HWHM) of the resulting ILS
function. Table 1 lists other relevant FTIR instrument settings used.
Table 1. Relevant FTIR instrument settings used for the MIR measurements.
Light source Globar
Beam splitter Ge-on-KBr
Detector InSb
Aperture diameter 1 mm
Apodization function Norton-Beer medium
Assumed HWHM of ILS function 0.0095 cm-1 (285 MHz)
Number of co-added interferograms 10
Type of interferograms Double-sided
Interferogram processing method Mertz
Zero-filling factor 2
Optical band-pass filtering 2614–3378 cm-1
Digital band-pass filtering 10–20 kHz (1975–3950 cm-1)
HeNe reference laser down-converted frequency 80 kHz
The 100 % transmission baseline was determined manually from the HCl spectrum by first low-pass filtering
the spectrum, excluding the HCl peaks from the data, and finally by using Savitzky-Golay filtering [52] and
defining the result as the baseline. The spectrum was then divided by this baseline to obtain the HCl
transmission spectrum. The result was further converted into absorption spectrum using the Naperian Beer-
Lambert law [53]
𝛼(𝜈) = −1
𝐿ln (
𝐼(𝜈)
𝐼0(𝜈)) ,
where 𝛼(𝜈) is the absorption coefficient, 𝐿 is the absorption path length (10 cm), 𝐼(𝜈) is the raw spectrum,
and 𝐼0(�̃�) is the 100 % transmission baseline. The resulting absorption spectrum is shown in Fig. 1.
4
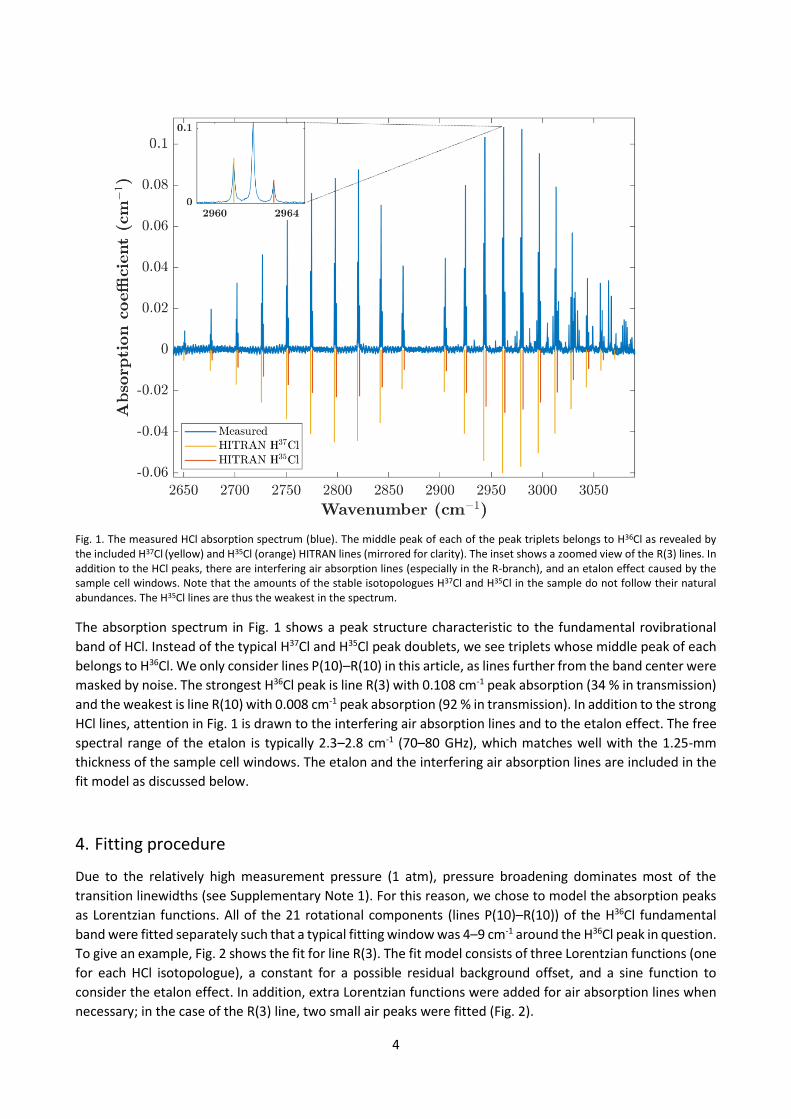
Fig. 1. The measured HCl absorption spectrum (blue). The middle peak of each of the peak triplets belongs to H36Cl as revealed by the included H37Cl (yellow) and H35Cl (orange) HITRAN lines (mirrored for clarity). The inset shows a zoomed view of the R(3) lines. In addition to the HCl peaks, there are interfering air absorption lines (especially in the R-branch), and an etalon effect caused by the sample cell windows. Note that the amounts of the stable isotopologues H37Cl and H35Cl in the sample do not follow their natural abundances. The H35Cl lines are thus the weakest in the spectrum.
The absorption spectrum in Fig. 1 shows a peak structure characteristic to the fundamental rovibrational
band of HCl. Instead of the typical H37Cl and H35Cl peak doublets, we see triplets whose middle peak of each
belongs to H36Cl. We only consider lines P(10)–R(10) in this article, as lines further from the band center were
masked by noise. The strongest H36Cl peak is line R(3) with 0.108 cm-1 peak absorption (34 % in transmission)
and the weakest is line R(10) with 0.008 cm-1 peak absorption (92 % in transmission). In addition to the strong
HCl lines, attention in Fig. 1 is drawn to the interfering air absorption lines and to the etalon effect. The free
spectral range of the etalon is typically 2.3–2.8 cm-1 (70–80 GHz), which matches well with the 1.25-mm
thickness of the sample cell windows. The etalon and the interfering air absorption lines are included in the
fit model as discussed below.
4. Fitting procedure
Due to the relatively high measurement pressure (1 atm), pressure broadening dominates most of the
transition linewidths (see Supplementary Note 1). For this reason, we chose to model the absorption peaks
as Lorentzian functions. All of the 21 rotational components (lines P(10)–R(10)) of the H36Cl fundamental
band were fitted separately such that a typical fitting window was 4–9 cm-1 around the H36Cl peak in question.
To give an example, Fig. 2 shows the fit for line R(3). The fit model consists of three Lorentzian functions (one
for each HCl isotopologue), a constant for a possible residual background offset, and a sine function to
consider the etalon effect. In addition, extra Lorentzian functions were added for air absorption lines when
necessary; in the case of the R(3) line, two small air peaks were fitted (Fig. 2).
5
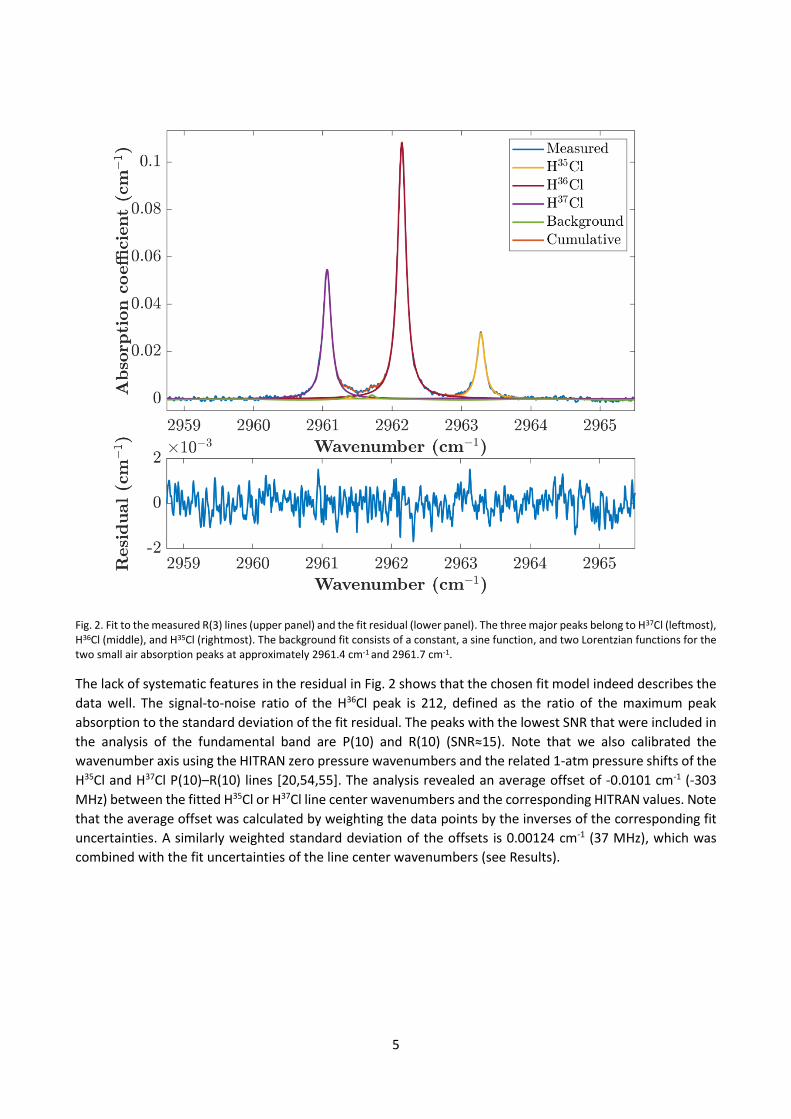
Fig. 2. Fit to the measured R(3) lines (upper panel) and the fit residual (lower panel). The three major peaks belong to H37Cl (leftmost), H36Cl (middle), and H35Cl (rightmost). The background fit consists of a constant, a sine function, and two Lorentzian functions for the two small air absorption peaks at approximately 2961.4 cm-1 and 2961.7 cm-1.
The lack of systematic features in the residual in Fig. 2 shows that the chosen fit model indeed describes the
data well. The signal-to-noise ratio of the H36Cl peak is 212, defined as the ratio of the maximum peak
absorption to the standard deviation of the fit residual. The peaks with the lowest SNR that were included in
the analysis of the fundamental band are P(10) and R(10) (SNR≈15). Note that we also calibrated the
wavenumber axis using the HITRAN zero pressure wavenumbers and the related 1-atm pressure shifts of the
H35Cl and H37Cl P(10)–R(10) lines [20,54,55]. The analysis revealed an average offset of -0.0101 cm-1 (-303
MHz) between the fitted H35Cl or H37Cl line center wavenumbers and the corresponding HITRAN values. Note
that the average offset was calculated by weighting the data points by the inverses of the corresponding fit
uncertainties. A similarly weighted standard deviation of the offsets is 0.00124 cm-1 (37 MHz), which was
combined with the fit uncertainties of the line center wavenumbers (see Results).
6
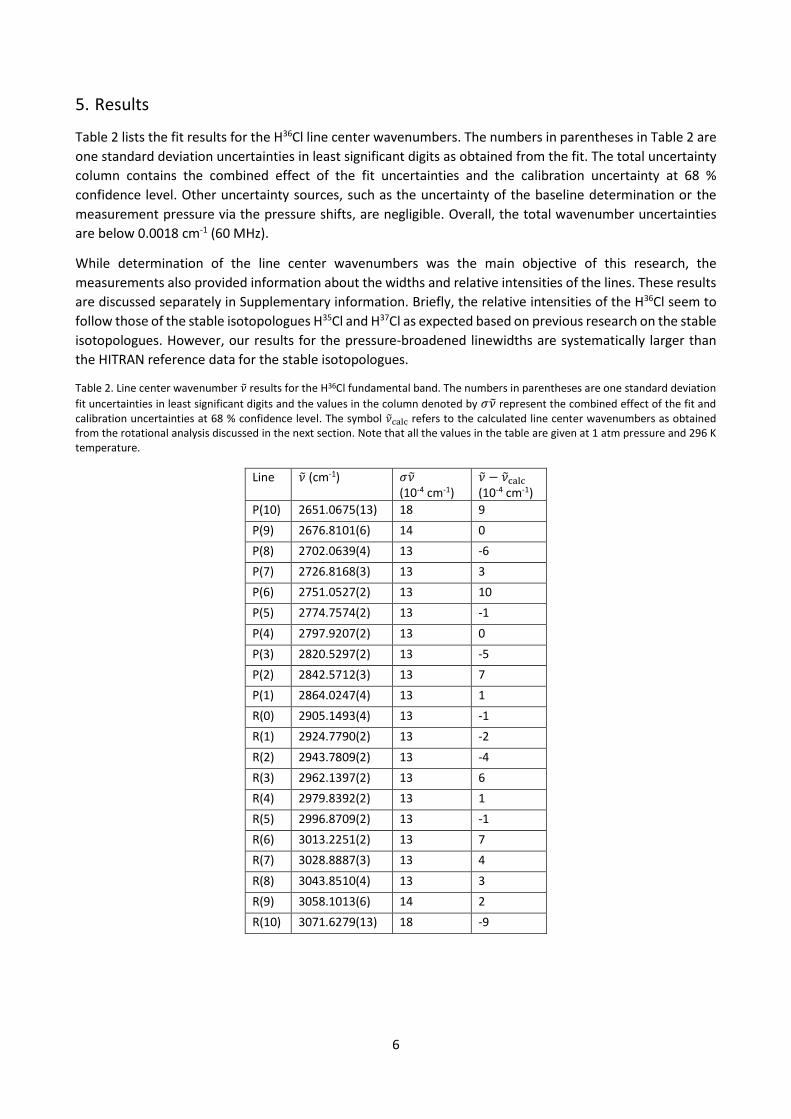
5. Results
Table 2 lists the fit results for the H36Cl line center wavenumbers. The numbers in parentheses in Table 2 are
one standard deviation uncertainties in least significant digits as obtained from the fit. The total uncertainty
column contains the combined effect of the fit uncertainties and the calibration uncertainty at 68 %
confidence level. Other uncertainty sources, such as the uncertainty of the baseline determination or the
measurement pressure via the pressure shifts, are negligible. Overall, the total wavenumber uncertainties
are below 0.0018 cm-1 (60 MHz).
While determination of the line center wavenumbers was the main objective of this research, the
measurements also provided information about the widths and relative intensities of the lines. These results
are discussed separately in Supplementary information. Briefly, the relative intensities of the H36Cl seem to
follow those of the stable isotopologues H35Cl and H37Cl as expected based on previous research on the stable
isotopologues. However, our results for the pressure-broadened linewidths are systematically larger than
the HITRAN reference data for the stable isotopologues.
Table 2. Line center wavenumber 𝜈 results for the H36Cl fundamental band. The numbers in parentheses are one standard deviation
fit uncertainties in least significant digits and the values in the column denoted by 𝜎𝜈 represent the combined effect of the fit and calibration uncertainties at 68 % confidence level. The symbol 𝜈calc refers to the calculated line center wavenumbers as obtained from the rotational analysis discussed in the next section. Note that all the values in the table are given at 1 atm pressure and 296 K temperature.
Line 𝜈 (cm-1) 𝜎𝜈 (10-4 cm-1)
𝜈 − 𝜈calc (10-4 cm-1)
P(10) 2651.0675(13) 18 9
P(9) 2676.8101(6) 14 0
P(8) 2702.0639(4) 13 -6
P(7) 2726.8168(3) 13 3
P(6) 2751.0527(2) 13 10
P(5) 2774.7574(2) 13 -1
P(4) 2797.9207(2) 13 0
P(3) 2820.5297(2) 13 -5
P(2) 2842.5712(3) 13 7
P(1) 2864.0247(4) 13 1
R(0) 2905.1493(4) 13 -1
R(1) 2924.7790(2) 13 -2
R(2) 2943.7809(2) 13 -4
R(3) 2962.1397(2) 13 6
R(4) 2979.8392(2) 13 1
R(5) 2996.8709(2) 13 -1
R(6) 3013.2251(2) 13 7
R(7) 3028.8887(3) 13 4
R(8) 3043.8510(4) 13 3
R(9) 3058.1013(6) 14 2
R(10) 3071.6279(13) 18 -9

7
6. Rotational analysis
We retrieved the molecular constants for the H36Cl fundamental rovibrational band. The 𝑣 − 0 band line
center wavenumbers of a diatomic molecule can be approximately expressed as [56]
𝜈 = 𝜈𝑣−0 + (�̃�𝑣 + �̃�0)𝑚 + (�̃�𝑣 − �̃�0 − �̃�𝑣 + �̃�0)𝑚2 + (�̃�𝑣 + �̃�0 − 2�̃�𝑣 − 2�̃�0)𝑚3
+(3�̃�𝑣 − 3�̃�0 − �̃�𝑣 + �̃�0)𝑚4 + (3�̃�𝑣 + 3�̃�0)𝑚5 + (�̃�𝑣 − �̃�0)𝑚6 , (1)
where 𝜈𝑣−0 is the band center, �̃� is the rotational constant, and �̃� and �̃� are the different order centrifugal
distortion constants. The integer 𝑚 = −𝐽 for the P-branch and 𝑚 = 𝐽 + 1 for the R-branch. The rotational
quantum number 𝐽 refers to the lower state.
We could not determine the centrifugal distortion constants �̃� in a statistically significant manner; we thus
assumed �̃� = �̃�𝑣 = �̃�0 and constrained its value to 1.66742 × 10⁻⁸ cm−1. This value is the predicted �̃�0 of
H36Cl, which we calculated using �̃�0, �̃�1, and �̃�2 of H35Cl given in the supplementary material of Ref. [20], the
approximate Dunham expression [57,58]
�̃�𝑣,𝑗 = �̃�0𝑗 + �̃�1𝑗 (𝑣 +1
2) + �̃�2𝑗 (𝑣 +
1
2)
2
(2)
and the approximate isotope relation [15,67]
�̃�𝑖𝑗∗
�̃�𝑖𝑗
= 𝜌𝑖+2𝑗, 𝜌 = √𝜇
𝜇∗ , (3)
where the asterisk denotes a different isotope, �̃�𝑖𝑗 are Dunham coefficients [57], 𝜇 is the reduced mass, and
�̃�𝑣,0 − �̃�0,0 = 𝜈𝑣−0, �̃�𝑣,1 = �̃�𝑣, �̃�𝑣,2 = �̃�𝑣, and �̃�𝑣,3 = �̃�𝑣.
Eqs. (2) and (3) and the molecular constants of H35Cl given in the supplementary material of Ref. [20] were
further used to predict in a similar manner the remaining molecular constants for H36Cl. The results are listed
in Table 4 together with the experimental molecular constants that we determined from the measured line
center wavenumbers of lines P(10)–R(10) in least-squares fits using the combination relations [15,56]
𝑅(𝐽 − 1) − 𝑃(𝐽 + 1) = (4�̃�0 − 6�̃�0 +27
4�̃�) (𝐽 +
1
2) − (8�̃�0 + 34�̃�) (𝐽 +
1
2)
3
+ 12�̃� (𝐽 +1
2)
5
(4)
𝑅(𝐽 − 1) + 𝑃(𝐽) = 2�̃�1−0 + 2(�̃�1 − �̃�0 − (�̃�1 − �̃�0))𝐽2 − 2(�̃�1 − �̃�0)𝐽4 , (5)
where 𝐽 = 1, … ,9 for Eq. (4) and 𝐽 = 1, … ,10 for Eq. (5).
First, the lower-state parameters �̃�0 and �̃�0 were determined in a least-squares fit using Eq. (4) and the
assumption �̃� = 1.66742 × 10⁻⁸ cm−1. However, prior to fitting, we shifted the measured H36Cl line center
wavenumbers to those corresponding to zero pressure assuming the HITRAN H35Cl pressure shifts [54,55].
After this, we determined the band center 𝜈1–0 and upper-state parameters �̃�1 and �̃�1 using Eq. (5). The
lower-state parameters were fixed during the least-squares fit to those obtained from the fit of Eq. (4). In
addition, to consider the fit uncertainties of the lower-state parameters in the determination of the upper-
state parameters, we repeated the fit a hundred times, each time drawing new �̃�0 and �̃�0 values from normal
distributions whose expectation values and standard deviations were chosen to be the original �̃�0 and �̃�0
values and their respective fit uncertainties obtained from the fit of Eq. (4). Finally, we calculated the
standard deviations of the hundred new �̃�0 and �̃�0 values and combined them with the fit uncertainties
obtained from the original fit of Eq. (5) to estimate the total uncertainties of the upper-state parameters.
8
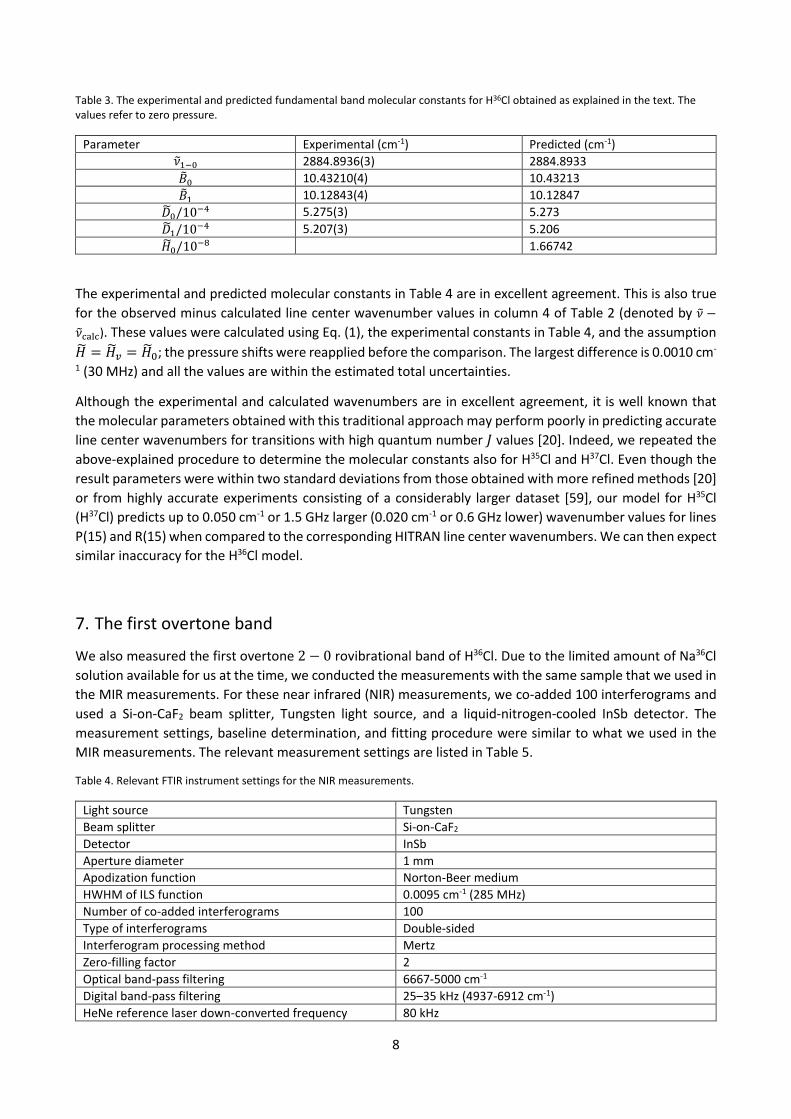
Table 3. The experimental and predicted fundamental band molecular constants for H36Cl obtained as explained in the text. The values refer to zero pressure.
Parameter Experimental (cm-1) Predicted (cm-1)
𝜈1−0 2884.8936(3) 2884.8933
�̃�0 10.43210(4) 10.43213
�̃�1 10.12843(4) 10.12847
�̃�0/10−4 5.275(3) 5.273
�̃�1/10−4 5.207(3) 5.206
�̃�0/10−8 1.66742
The experimental and predicted molecular constants in Table 4 are in excellent agreement. This is also true
for the observed minus calculated line center wavenumber values in column 4 of Table 2 (denoted by 𝜈 −
𝜈calc). These values were calculated using Eq. (1), the experimental constants in Table 4, and the assumption
�̃� = �̃�𝑣 = �̃�0; the pressure shifts were reapplied before the comparison. The largest difference is 0.0010 cm-
1 (30 MHz) and all the values are within the estimated total uncertainties.
Although the experimental and calculated wavenumbers are in excellent agreement, it is well known that
the molecular parameters obtained with this traditional approach may perform poorly in predicting accurate
line center wavenumbers for transitions with high quantum number 𝐽 values [20]. Indeed, we repeated the
above-explained procedure to determine the molecular constants also for H35Cl and H37Cl. Even though the
result parameters were within two standard deviations from those obtained with more refined methods [20]
or from highly accurate experiments consisting of a considerably larger dataset [59], our model for H35Cl
(H37Cl) predicts up to 0.050 cm-1 or 1.5 GHz larger (0.020 cm-1 or 0.6 GHz lower) wavenumber values for lines
P(15) and R(15) when compared to the corresponding HITRAN line center wavenumbers. We can then expect
similar inaccuracy for the H36Cl model.
7. The first overtone band
We also measured the first overtone 2 − 0 rovibrational band of H36Cl. Due to the limited amount of Na36Cl
solution available for us at the time, we conducted the measurements with the same sample that we used in
the MIR measurements. For these near infrared (NIR) measurements, we co-added 100 interferograms and
used a Si-on-CaF2 beam splitter, Tungsten light source, and a liquid-nitrogen-cooled InSb detector. The
measurement settings, baseline determination, and fitting procedure were similar to what we used in the
MIR measurements. The relevant measurement settings are listed in Table 5.
Table 4. Relevant FTIR instrument settings for the NIR measurements.
Light source Tungsten
Beam splitter Si-on-CaF2
Detector InSb
Aperture diameter 1 mm
Apodization function Norton-Beer medium
HWHM of ILS function 0.0095 cm-1 (285 MHz)
Number of co-added interferograms 100
Type of interferograms Double-sided
Interferogram processing method Mertz
Zero-filling factor 2
Optical band-pass filtering 6667-5000 cm-1
Digital band-pass filtering 25–35 kHz (4937-6912 cm-1)
HeNe reference laser down-converted frequency 80 kHz
9
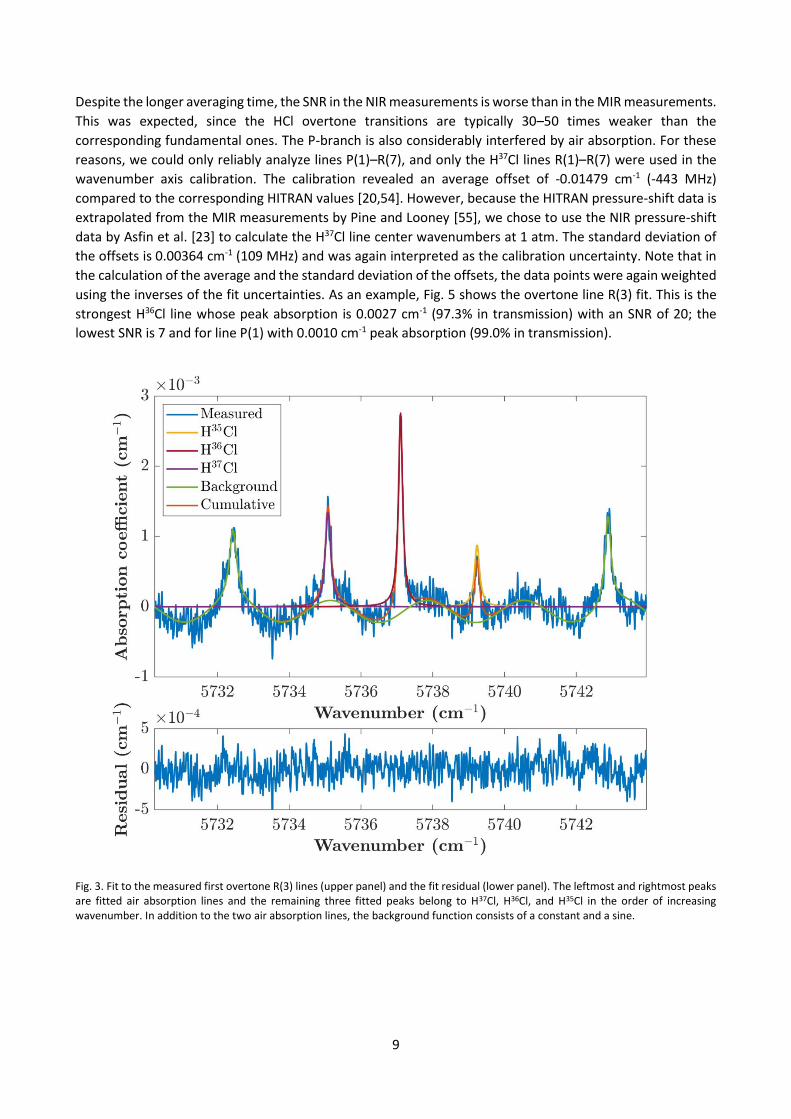
Despite the longer averaging time, the SNR in the NIR measurements is worse than in the MIR measurements.
This was expected, since the HCl overtone transitions are typically 30–50 times weaker than the
corresponding fundamental ones. The P-branch is also considerably interfered by air absorption. For these
reasons, we could only reliably analyze lines P(1)–R(7), and only the H37Cl lines R(1)–R(7) were used in the
wavenumber axis calibration. The calibration revealed an average offset of -0.01479 cm-1 (-443 MHz)
compared to the corresponding HITRAN values [20,54]. However, because the HITRAN pressure-shift data is
extrapolated from the MIR measurements by Pine and Looney [55], we chose to use the NIR pressure-shift
data by Asfin et al. [23] to calculate the H37Cl line center wavenumbers at 1 atm. The standard deviation of
the offsets is 0.00364 cm-1 (109 MHz) and was again interpreted as the calibration uncertainty. Note that in
the calculation of the average and the standard deviation of the offsets, the data points were again weighted
using the inverses of the fit uncertainties. As an example, Fig. 5 shows the overtone line R(3) fit. This is the
strongest H36Cl line whose peak absorption is 0.0027 cm-1 (97.3% in transmission) with an SNR of 20; the
lowest SNR is 7 and for line P(1) with 0.0010 cm-1 peak absorption (99.0% in transmission).
Fig. 3. Fit to the measured first overtone R(3) lines (upper panel) and the fit residual (lower panel). The leftmost and rightmost peaks are fitted air absorption lines and the remaining three fitted peaks belong to H37Cl, H36Cl, and H35Cl in the order of increasing wavenumber. In addition to the two air absorption lines, the background function consists of a constant and a sine.
10
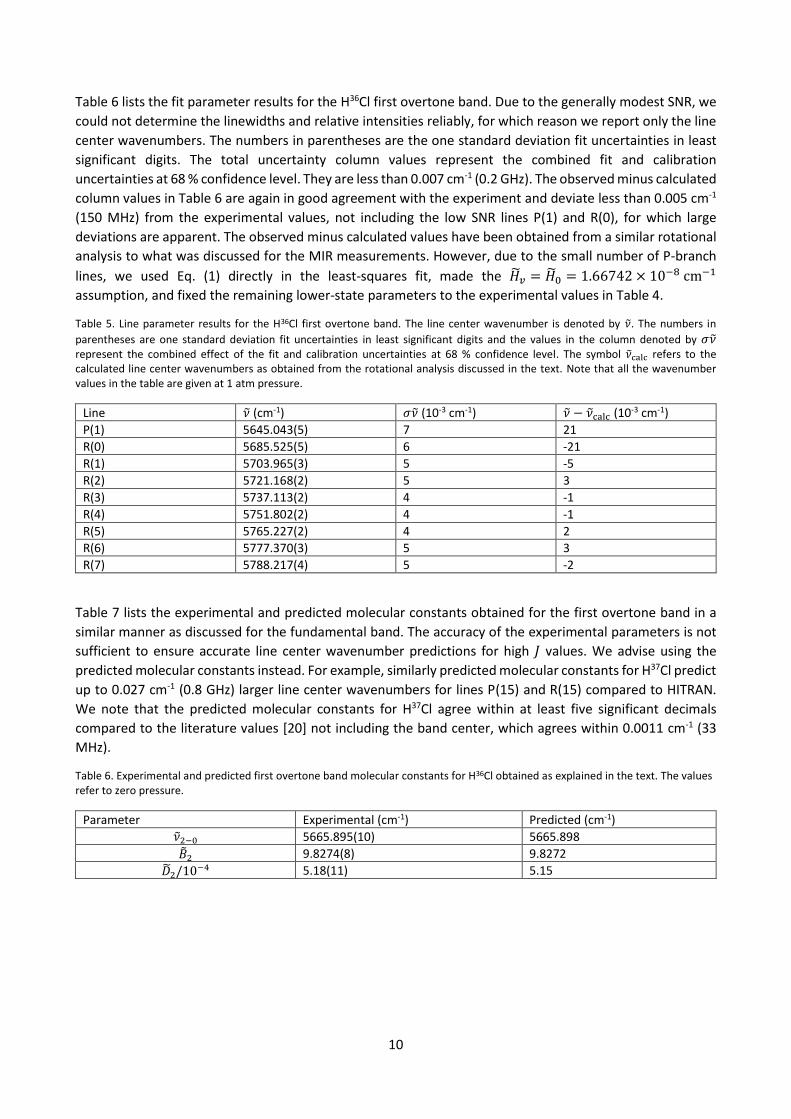
Table 6 lists the fit parameter results for the H36Cl first overtone band. Due to the generally modest SNR, we
could not determine the linewidths and relative intensities reliably, for which reason we report only the line
center wavenumbers. The numbers in parentheses are the one standard deviation fit uncertainties in least
significant digits. The total uncertainty column values represent the combined fit and calibration
uncertainties at 68 % confidence level. They are less than 0.007 cm-1 (0.2 GHz). The observed minus calculated
column values in Table 6 are again in good agreement with the experiment and deviate less than 0.005 cm-1
(150 MHz) from the experimental values, not including the low SNR lines P(1) and R(0), for which large
deviations are apparent. The observed minus calculated values have been obtained from a similar rotational
analysis to what was discussed for the MIR measurements. However, due to the small number of P-branch
lines, we used Eq. (1) directly in the least-squares fit, made the �̃�𝑣 = �̃�0 = 1.66742 × 10⁻⁸ cm−1
assumption, and fixed the remaining lower-state parameters to the experimental values in Table 4.
Table 5. Line parameter results for the H36Cl first overtone band. The line center wavenumber is denoted by 𝜈. The numbers in
parentheses are one standard deviation fit uncertainties in least significant digits and the values in the column denoted by 𝜎𝜈 represent the combined effect of the fit and calibration uncertainties at 68 % confidence level. The symbol 𝜈calc refers to the calculated line center wavenumbers as obtained from the rotational analysis discussed in the text. Note that all the wavenumber values in the table are given at 1 atm pressure.
Line 𝜈 (cm-1) 𝜎𝜈 (10-3 cm-1) 𝜈 − 𝜈calc (10-3 cm-1)
P(1) 5645.043(5) 7 21
R(0) 5685.525(5) 6 -21
R(1) 5703.965(3) 5 -5
R(2) 5721.168(2) 5 3
R(3) 5737.113(2) 4 -1
R(4) 5751.802(2) 4 -1
R(5) 5765.227(2) 4 2
R(6) 5777.370(3) 5 3
R(7) 5788.217(4) 5 -2
Table 7 lists the experimental and predicted molecular constants obtained for the first overtone band in a
similar manner as discussed for the fundamental band. The accuracy of the experimental parameters is not
sufficient to ensure accurate line center wavenumber predictions for high 𝐽 values. We advise using the
predicted molecular constants instead. For example, similarly predicted molecular constants for H37Cl predict
up to 0.027 cm-1 (0.8 GHz) larger line center wavenumbers for lines P(15) and R(15) compared to HITRAN.
We note that the predicted molecular constants for H37Cl agree within at least five significant decimals
compared to the literature values [20] not including the band center, which agrees within 0.0011 cm-1 (33
MHz).
Table 6. Experimental and predicted first overtone band molecular constants for H36Cl obtained as explained in the text. The values refer to zero pressure.
Parameter Experimental (cm-1) Predicted (cm-1)
𝜈2−0 5665.895(10) 5665.898
�̃�2 9.8274(8) 9.8272
�̃�2/10−4 5.18(11) 5.15
11
8. Conclusions and outlook
In this article, we reported the first absorption spectrum of H36Cl. The measurements of the fundamental and
the first overtone rovibrational bands were performed using a commercial FTIR instrument with a thermal
light source and using a sample prepared from the reaction between sulfuric acid and 36Cl-enriched NaCl salt.
The simple gas cell system helped to maximize the number density of the species of interest inside the cell,
which provided us with strong absorption lines in the MIR and allowed us to determine the fundamental
band P(10)–R(10) line center wavenumbers (referenced to the HITRAN values of the stable isotopologues
H35Cl and H37C), with total uncertainties of less than 0.0018 cm-1 (60 MHz) at 68 % confidence level. Due to
the order of magnitude weaker molecular transitions and consequently modest SNR in the NIR, we could
determine the first overtone band line center wavenumbers of only lines P(1)–R(7) and with total
uncertainties of less than 0.007 cm-1 (0.2 GHz) at 68 % confidence level.
The simple gas cell system came with the downside of not knowing the exact pressure and temperature
inside the sample cell. However, the initiation of the reaction at atmospheric pressure and room temperature
made it possible to estimate the measurement conditions with reasonable accuracy. In the Supplementary
information, we investigated the linewidths and relative intensities of the H36Cl lines and compared them to
the corresponding literature values of the stable isotopologues H35Cl and H37Cl. The relative intensities
showed similar behavior as the reference HITRAN data, implying that the line intensities of the different
isotopologues are similar as expected based on previous research on the stable isotopologues. However, as
discussed in the Supplementary information, the linewidths for all three isotopologues were systematically
larger than the HITRAN reference data for H35Cl and H37Cl.
An advantage of having atmospheric pressure inside the sample cell during measurements was to minimize
the distorting effect of the ILS function and to allow us to use a simple Lorentzian fit model. However, precise
control of the measurement pressure and measurements in lower pressures to reduce the linewidths would
enable much more accurate line center wavenumber determinations. To increase measurement sensitivity,
an external coherent light source in the FTIR instrument instead of the thermal source could be useful,
especially if combined with photoacoustic detection [47]. For accurate linewidth determinations, eliminating
the ILS function altogether would be helpful. This could be done by using optical frequency combs [60] or by
avoiding FTIR altogether (i.e., by using tunable laser absorption spectroscopy instead) [55,61,62]. In
particular, the sensitivity improvement by laser absorption spectroscopy would allow more accurate
characterization of the first overtone band. In addition, determination of the absolute line intensities would
require a more elaborate sample preparation and gas-control system to ensure accurate external knowledge
of the sample concentration [22]. Finally, as future applications in monitoring H36Cl will expectedly require
very high sensitivities to detect trace amounts of this species, it would be valuable to demonstrate low-
concentration measurements using some highly sensitive laser spectroscopy method, such as cavity ring-
down spectroscopy [34,39] or photoacoustic spectroscopy [37,46,63]. These pursuits are assisted by our
results, as we now have reasonably accurate knowledge on the line center wavenumbers of H36Cl, and the
simple models from the rotational analyses can be used to predict line positions of yet unobserved
transitions.
12
Acknowledgements
We wish to thank Dr. Markus Metsälä and Prof. Lauri Halonen for their support and constructive feedback
on the project, and Dr. Guillaume Genoud for fruitful discussions on the topic and for the work to secure
funding for the project.
Funding
This work obtained funding from the Euratom research and training programme 2014-2018 [grant agreement
number 755371, the CHANCE project]; the Academy of Finland [project number 326444]; and the Flagship of
Photonics Research and Innovation of the Academy of Finland (PREIN). S. Larnimaa acknowledges financial
support from the CHEMS doctoral program of the University of Helsinki.
Author contributions
Santeri Larnimaa: Investigation, Formal analysis, Writing – Original Draft, Writing – Review & Editing,
Visualization. Markku Vainio: Conceptualization, Writing – Review & Editing, Supervision, Project
Administration. Ville Ulvila: Conceptualization, Investigation, Writing – Review & Editing, Supervision, Project
Administration.
References
1. W. R. Simpson, S. S. Brown, A. Saiz-Lopez, J. A. Thornton and R. von Glasow, "Tropospheric Halogen
Chemistry: Sources, Cycling, and Impacts", Chem. Rev., 2015, 115, 10, pp. 4035-4062,
https://doi.org/10.1021/cr5006638.
2. M. A. Zondlo, P. K. Hudson, A. J. Prenni and M. A. Tolbert, "Chemistry and Microphysics of Polar
Stratospheric Clouds and Cirrus Clouds", Annu. Rev. Phys. Chem., 2000, 51, 1, pp. 473-499,
https://doi.org/10.1146/annurev.physchem.51.1.473.
3. F. Lique and A. Faure, "Collisional excitation and dissociation of HCl by H", Mon. Not. R. Astron. Soc., 2017,
472, 1, pp. 738-743, https://doi.org/10.1093/mnras/stx2025.
4. M. Lanza, Y. Kalugina, L. Wiesenfeld, A. Faure and F. Lique, "New insights on the HCl abundance in the
interstellar medium", Mon. Not. R. Astron. Soc., 2014, 443, 4, pp. 3351-3358,
https://doi.org/10.1093/mnras/stu1371.
5. R. Peng, H. Yoshida, R. A. Chamberlin, T. G. Phillips, D. C. Lis and M. Gerin, "A COMPREHENSIVE SURVEY OF
HYDROGEN CHLORIDE IN THE GALAXY", Astrophys. J., 2010, 723, 1, pp. 218-228,
https://doi.org/10.1088/0004-637x/723/1/218.
6. H. Panu, R. Timo, F. Thomas, J. Makkonen, S. Alyshev, A. Kharakhordin and S. Firstov, "Real-time HCl gas
detection at parts-per-billion level concentrations utilising a diode laser and a bismuth-doped fibre
amplifier", Meas. Sci. Technol., 2021, 32, 055206, https://doi.org/10.1088/1361-6501/abd651.
7. V. V. Zuev, N. E. Zueva, E. S. Savelieva and V. V. Gerasimov, "The Antarctic ozone depletion caused by
Erebus volcano gas emissions", Atmos. Environ., 2015, 122, pp. 393-399,
https://doi.org/10.1016/j.atmosenv.2015.10.005.
8. G. Tamburello, A. Caselli, F. Tassi, O. Vaselli, S. Calabrese, D. Rouwet, B. Capaccioni, R. Di Napoli, C.
Cardellini, G. Chiodini, M. Bitetto, L. Brusca, S. Bellomo and A. Aiuppa, "Intense magmatic degassing through
the lake of Copahue volcano, 2013–2014", J. Geophys. Res. Solid Earth, 2015, 120, 9, pp. 6071-6084,
https://doi.org/10.1002/2015JB012160.

13
9. C. Voigt, P. Jessberger, T. Jurkat, S. Kaufmann, R. Baumann, H. Schlager, N. Bobrowski, G. Giuffrida and G.
Salerno, "Evolution of CO2, SO2, HCl, and HNO3 in the volcanic plumes from Etna", Geophys. Res. Lett., 2014,
41, 6, pp. 2196-2203, https://doi.org/10.1002/2013GL058974.
10. D. M. Pyle and T. A. Mather, "Halogens in igneous processes and their fluxes to the atmosphere and
oceans from volcanic activity: A review", Chem. Geol., 2009, 263, 1, pp. 110-121,
https://doi.org/10.1016/j.chemgeo.2008.11.013.
11. O. Korablev, K. S. Olsen, A. Trokhimovskiy, F. Lefèvre, F. Montmessin, A. A. Fedorova, M. J. Toplis, J. Alday,
D. A. Belyaev, A. Patrakeev, N. I. Ignatiev, A. V. Shakun, A. V. Grigoriev, L. Baggio, I. Abdenour, G. Lacombe,
Y. S. Ivanov, S. Aoki, I. R. Thomas, F. Daerden, B. Ristic, J. T. Erwin, M. Patel, G. Bellucci, J. Lopez-Moreno and
A. C. Vandaele, "Transient HCl in the atmosphere of Mars", Sci. Adv., 2021, 7, 7, eabe4386,
https://doi.org/10.1126/sciadv.abe4386.
12. V. A. Krasnopolsky, D. A. Belyaev, I. E. Gordon, G. Li and L. S. Rothman, "Observations of D/H ratios in
H2O, HCl, and HF on Venus and new DCl and DF line strengths", Icarus, 2013, 224, 1, pp. 57-65,
https://doi.org/10.1016/j.icarus.2013.02.010.
13. B. J. Sandor and R. T. Clancy, "Observations of HCl altitude dependence and temporal variation in the 70–
100 km mesosphere of Venus", Icarus, 2012, 220, 2, pp. 618-626,
https://doi.org/10.1016/j.icarus.2012.05.016.
14. D. H. Rank, B. S. Rao and T. A. Wiggins, "Molecular constants of HCl35", J. Mol. Spectrosc., 1965, 17, 1, pp.
122-130, https://doi.org/10.1016/0022-2852(65)90114-1.
15. D. H. Rank, D. P. Eastman, B. S. Rao and T. A. Wiggins, "Rotational and Vibrational Constants of the HCl35
and DCl35 Molecules*", J. Opt. Soc. Am., 1962, 52, 1, pp. 1-7, https://doi.org/10.1364/JOSA.52.000001.
16. D. H. Rank, W. B. Birtley, D. P. Eastman, B. S. Rao and T. A. Wiggins, "Precise Measurements of Some
Infrared Bands of Hydrogen Chloride*", J. Opt. Soc. Am., 1960, 50, 12, pp. 1275-1279,
https://doi.org/10.1364/JOSA.50.001275.
17. E. D. Palik, "History of far-infrared research. I. The Rubens era", J. Opt. Soc. Am., 1977, 67, 7, pp. 857-865,
https://doi.org/10.1364/JOSA.67.000857.
18. N. Ginsburg, "History of far-infrared research. II. The grating era, 1925–1960", J. Opt. Soc. Am., 1977, 67,
7, pp. 865-871, https://doi.org/10.1364/JOSA.67.000865.
19. E. S. Imes, "Measurements on the Near Infra-Red Absorption of Some Diatomic Gases", Astrophys. J.,
1919, 50, pp. 251-276, https://doi.org/10.1086/142504.
20. J. A. Coxon and P. G. Hajigeorgiou, "Improved direct potential fit analyses for the ground electronic states
of the hydrogen halides: HF/DF/TF, HCl/DCl/TCl, HBr/DBr/TBr and HI/DI/TI", J. Quant. Spectrosc. Radiat.
Transfer, 2015, 151, pp. 133-154, https://doi.org/10.1016/j.jqsrt.2014.08.028.
21. G. Li, I. E. Gordon, P. F. Bernath and L. S. Rothman, "Direct fit of experimental ro-vibrational intensities to
the dipole moment function: Application to HCl", J. Quant. Spectrosc. Radiat. Transfer, 2011, 112, 10, pp.
1543-1550, https://doi.org/10.1016/j.jqsrt.2011.03.014.
22. G. Li, A. Serdyukov, M. Gisi, O. Werhahn and V. Ebert, "FTIR-based measurements of self-broadening and
self-shift coefficients as well as line strength in the first overtone band of HCl at 1.76 µM", J. Quant. Spectrosc.
Radiat. Transfer, 2015, 165, pp. 76-87, https://doi.org/10.1016/j.jqsrt.2015.06.021.
14
23. R. E. Asfin, A. V. Domanskaya and C. Maul, "Broadening and shifting coefficients of rotation–vibrational
lines in the fundamental and first overtone bands of HCl and HBr induced by oxygen and air", J. Quant.
Spectrosc. Radiat. Transfer, 2013, 130, pp. 296-303, https://doi.org/10.1016/j.jqsrt.2013.07.014.
24. K. Iwakuni, H. Sera, M. Abe and H. Sasada, "Hyperfine-resolved transition frequency list of fundamental
vibration bands of H35Cl and H37Cl", J. Mol. Spectrosc., 2014, 306, pp. 19-25,
https://doi.org/10.1016/j.jms.2014.09.013.
25. D. Huggle, A. Blinov, C. Stan-Sion, G. Korschinek, C. Scheffel, S. Massonet, L. Zerle, J. Beer, Y. Parrat, H.
Gaeggeler, W. Hajdas and E. Nolte, "Production of cosmogenic 36Cl on atmospheric argon", Planet. Space Sci.,
1996, 44, 2, pp. 147-151, https://doi.org/10.1016/0032-0633(95)00085-2.
26. Y. Tosaki, N. Morikawa, K. Kazahaya, H. Tsukamoto, Y. S. Togo, T. Sato, H. A. Takahashi, M. Takahashi and
A. Inamura, "Deep incursion of seawater into the Hiroshima Granites during the Holocene transgression:
Evidence from 36Cl age of saline groundwater in the Hiroshima area, Japan", Geochem. J., 2017, 51, 3, pp.
263-275, https://doi.org/10.2343/geochemj.2.0467.
27. V. Lavastre, C. Le Gal La Salle, J. Michelot, S. Giannesini, L. Benedetti, J. Lancelot, B. Lavielle, M. Massault,
B. Thomas, E. Gilabert, D. Bourlès, N. Clauer and P. Agrinier, "Establishing constraints on groundwater ages
with 36Cl, 14C, 3H, and noble gases: A case study in the eastern Paris basin, France", Appl. Geochem., 2010, 25,
1, pp. 123-142, https://doi.org/10.1016/j.apgeochem.2009.10.006.
28. Y. Tosaki, N. Tase, G. Massmann, Y. Nagashima, R. Seki, T. Takahashi, K. Sasa, K. Sueki, T. Matsuhiro, T.
Miura, K. Bessho, H. Matsumura and M. He, "Application of 36Cl as a dating tool for modern groundwater",
Nucl. Instrum. Methods Phys. Res., Sect. B, 2007, 259, 1, pp. 479-485,
https://doi.org/10.1016/j.nimb.2007.02.096.
29. A. J. Love, A. L. Herczeg, L. Sampson, R. G. Cresswell and L. K. Fifield, "Sources of chloride and implications
for 36Cl dating of old groundwater, Southwestern Great Artesian Basin, Australia", Water Resour. Res., 2000,
36, 6, pp. 1561-1574, https://doi.org/10.1029/2000WR900019.
30. S. Le Dizès and M. A. Gonze, "Behavior of 36Cl in agricultural soil-plant systems: A review of transfer
processes and modelling approaches", J. Environ. Radioact., 2019, 196, pp. 82-90,
https://doi.org/10.1016/j.jenvrad.2018.10.011.
31. T. L. White, D. DiPrete, C. DiPrete and G. Dobos, "Analysis of 36Cl in Savannah River Site radioactive waste",
J. Radioanal. Nucl., 2013, 296, 2, pp. 835-839, https://doi.org/10.1007/s10967-012-2071-9.
32. S. C. Sheppard, L. H. Johnson, B. W. Goodwin, J. C. Tait, D. M. Wuschke and C. C. Davison, "Chlorine-36 in
nuclear waste disposal—1. Assessment results for used fuel with comparison to 129I and 14C", Waste Manage.,
1996, 16, 7, pp. 607-614, https://doi.org/10.1016/S0956-053X(97)00001-9.
33. T. M. Beasley, D. EImore, P. W. Kubik and P. Sharma, "Chlorine-36 Releases from the Savanniah River Site
Nuclear Fuel Reprocessing Facilities", Groundwater, 1992, 30, 4, pp. 539-548,
https://doi.org/10.1111/j.1745-6584.1992.tb01530.x.
34. I. Galli, S. Bartalini, R. Ballerini, M. Barucci, P. Cancio, M. De Pas, G. Giusfredi, D. Mazzotti, N. Akikusa and
P. De Natale, "Spectroscopic detection of radiocarbon dioxide at parts-per-quadrillion sensitivity", Optica,
2016, 3, 4, pp. 385-388, https://doi.org/10.1364/OPTICA.3.000385.
35. W. Kutschera, "Applications of accelerator mass spectrometry", Int. J. Mass Spectrom., 2013, 349-350,
pp. 203-218, https://doi.org/10.1016/j.ijms.2013.05.023.
15
36. X. Hou, "Liquid scintillation counting for determination of radionuclides in environmental and nuclear
application", J. Radioanal. Nucl., 2018, 318, 3, pp. 1597-1628, https://doi.org/10.1007/s10967-018-6258-6.
37. M. Fatima, T. Hausmaninger, T. Tomberg, J. Karhu, M. Vainio, T. Hieta and G. Genoud, "Radiocarbon
dioxide detection using cantilever-enhanced photoacoustic spectroscopy", Opt. Lett., 2021, 46, 9, pp. 2083-
2086, https://doi.org/10.1364/OL.420199.
38. R. Terabayashi, K. Saito, V. Sonnenschein, Y. Okuyama, T. Iguchi, M. Yamanaka, N. Nishizawa, K. Yoshida,
S. Ninomiya and H. Tomita, "Mid-infrared cavity ring-down spectroscopy using DFB quantum cascade laser
with optical feedback for radiocarbon detection", Jpn. J. Appl. Phys., 2020, 59, 9, 092007,
https://doi.org/10.35848/1347-4065/abb20e.
39. G. Genoud, J. Lehmuskoski, S. Bell, V. Palonen, M. Oinonen, M. Koskinen-Soivi and M. Reinikainen, "Laser
Spectroscopy for Monitoring of Radiocarbon in Atmospheric Samples", Anal. Chem., 2019, 91, 19, pp. 12315-
12320, https://doi.org/10.1021/acs.analchem.9b02496.
40. V. Sonnenschein, R. Terabayashi, H. Tomita, S. Kato, N. Hayashi, S. Takeda, L. Jin, M. Yamanaka, N.
Nishizawa, A. Sato, K. Yoshida and T. Iguchi, "A cavity ring-down spectrometer for study of biomedical
radiocarbon-labeled samples", J. Appl. Phys., 2018, 124, 3, 033101, https://doi.org/10.1063/1.5041015.
41. A. J. Fleisher, D. A. Long, Q. Liu, L. Gameson and J. T. Hodges, "Optical Measurement of Radiocarbon
below Unity Fraction Modern by Linear Absorption Spectroscopy", J. Phys. Chem. Lett., 2017, 8, 18, pp. 4550-
4556, https://doi.org/10.1021/acs.jpclett.7b02105.
42. A. D. McCartt, T. J. Ognibene, G. Bench and K. W. Turteltaub, "Quantifying Carbon-14 for Biology Using
Cavity Ring-Down Spectroscopy", Anal. Chem., 2016, 88, 17, pp. 8714-8719,
https://doi.org/10.1021/acs.analchem.6b02054.
43. G. Genoud, M. Vainio, H. Phillips, J. Dean and M. Merimaa, "Radiocarbon dioxide detection based on
cavity ring-down spectroscopy and a quantum cascade laser", Opt. Lett., 2015, 40, 7, pp. 1342-1345,
https://doi.org/10.1364/OL.40.001342.
44. I. Galli, S. Bartalini, S. Borri, P. Cancio, D. Mazzotti, P. De Natale and G. Giusfredi, "Molecular Gas Sensing
Below Parts Per Trillion: Radiocarbon-Dioxide Optical Detection", Phys. Rev. Lett., 2011, 107, 27, 270802,
https://doi.org/10.1103/PhysRevLett.107.270802.
45. I. Galli, P. C. Pastor, G. Di Lonardo, L. Fusina, G. Giusfredi, D. Mazzotti, F. Tamassia and P. De Natale, "The
v3 band of 14C16O2 molecule measured by optical-frequency-comb-assisted cavity ring-down spectroscopy",
Mol. Phys., 2011, 109, 17-18, pp. 2267-2272, https://doi.org/10.1080/00268976.2011.614284.
46. S. Larnimaa, L. Halonen, J. Karhu, T. Tomberg, M. Metsälä, G. Genoud, T. Hieta, S. Bell and M. Vainio,
"High-resolution analysis of the ν3 band of radiocarbon methane 14CH4", Chem. Phys. Lett., 2020, 750, 137488,
https://doi.org/10.1016/j.cplett.2020.137488.
47. J. Karhu, T. Tomberg, F. Senna Vieira, G. Genoud, V. Hänninen, M. Vainio, M. Metsälä, T. Hieta, S. Bell and
L. Halonen, "Broadband photoacoustic spectroscopy of 14CH4 with a high-power mid-infrared optical
frequency comb", Opt. Lett., 2019, 44, 5, pp. 1142-1145, https://doi.org/10.1364/OL.44.001142.
48. M. Yim and F. Caron, "Life cycle and management of carbon-14 from nuclear power generation", Prog.
Nucl. Energy, 2006, 48, 1, pp. 2-36, https://doi.org/10.1016/j.pnucene.2005.04.002.
49. J. I. Gmitro and T. Vermeulen, "Vapor-liquid equilibria for aqueous sulfuric acid", AIChE J., 1964, 10, 5, pp.
740-746, https://doi.org/10.1002/aic.690100531.
16
50. P. R. Griffiths and J. A. de Haseth, Fourier Transform Infrared Spectrometry, Chemical Analysis: A Series of
Monographs on Analytical Chemistry and Its Applications, Vol. 83, eds. P. J. Elving, J. D. Winefordner and I.
M. Kolthoff, John Wiley & Sons, 1986.
51. R. H. Norton and R. Beer, "New apodizing functions for Fourier spectrometry", J. Opt. Soc. Am., 1976, 66,
3, pp. 259-264, https://doi.org/10.1364/JOSA.66.000259.
52. A. Savitzky and M. J. E. Golay, "Smoothing and Differentiation of Data by Simplified Least Squares
Procedures", Anal. Chem., 1964, 36, 8, pp. 1627-1639, https://doi.org/10.1021/ac60214a047.
53. P. F. Bernath, Spectra of Atoms and Molecules, Oxford University Press, New York, 1995.
54. I. E. Gordon, L. S. Rothman, C. Hill, R. V. Kochanov, Y. Tan, P. F. Bernath, M. Birk, V. Boudon, A. Campargue,
K. V. Chance, B. J. Drouin, J.-M. Flaud, R. R. Gamache, J. T. Hodges, D. Jacquemart, V. I. Perevalov, A. Perrin,
K. P. Shine, M.-A. H. Smith, J. Tennyson, G. C. Toon, H. Tran, V. G. Tyuterev, A. Barbe, A. G. Császár, V. M.
Devi, T. Furtenbacher, J. J. Harrison, J.-M. Hartmann, A. Jolly, T. J. Johnson, T. Karman, I. Kleiner, A. A.
Kyuberis, J. Loos, O. M. Lyulin, S. T. Massie, S. N. Mikhailenko, N. Moazzen-Ahmadi, H. S. P. Müller, O. V.
Naumenko, A. V. Nikitin, O. L. Polyansky, M. Rey, M. Rotger, S. W. Sharpe, K. Sung, E. Starikova, S. A. Tashkun,
J. V. Auwera, G. Wagner, J. Wilzewski, P. Wcisło, S. Yu and E. J. Zak, "The HITRAN2016 molecular spectroscopic
database", J. Quant. Spectrosc. Radiat. Transfer, 2017, 203, pp. 3-69,
https://doi.org/10.1016/j.jqsrt.2017.06.038.
55. A. S. Pine and J. P. Looney, "N2 and air broadening in the fundamental bands of HF and HCl", J. Mol.
Spectrosc., 1987, 122, 1, pp. 41-55, https://doi.org/10.1016/0022-2852(87)90217-7.
56. G. Herzberg, Molecular Spectra and Molecular Structure I. Spectra of Diatomic Molecules, 2nd ed., D. Van
Nostrand Company, Inc., Princeton, 1950.
57. J. L. Dunham, "The Energy Levels of a Rotating Vibrator", Phys. Rev., 1932, 41, 6, pp. 721-731,
https://doi.org/10.1103/PhysRev.41.721.
58. N. Inostroza, J. R. Letelier and M. L. Senent, "On the numerical determination of Dunham’s coefficients:
An application to X1Σ+HCl isotopomers", J. Mol. Struct.: THEOCHEM, 2010, 947, 1, pp. 40-44,
https://doi.org/10.1016/j.theochem.2010.01.037.
59. C. P. Rinsland, M. A. H. Smith, A. Goldman, V. M. Devi and D. C. Benner, "The Fundamental Bands of H35Cl
and H37Cl: Line Positions from High-Resolution Laboratory Data", J. Mol. Spectrosc., 1993, 159, 1, pp. 274-
278, https://doi.org/10.1006/jmsp.1993.1124.
60. P. Maslowski, K. F. Lee, A. C. Johansson, A. Khodabakhsh, G. Kowzan, L. Rutkowski, A. A. Mills, C. Mohr, J.
Jiang, M. E. Fermann and A. Foltynowicz, "Surpassing the path-limited resolution of Fourier-transform
spectrometry with frequency combs", Phys. Rev. A, 2016, 93, 2, 021802,
https://doi.org/10.1103/PhysRevA.93.021802.
61. A. S. Pine, A. Fried and J. W. Elkins, "Spectral intensities in the fundamental bands of HF and HCl", J. Mol.
Spectrosc., 1985, 109, 1, pp. 30-45, https://doi.org/10.1016/0022-2852(85)90049-9.
62. M. De Rosa, C. Nardini, C. Piccolo, C. Corsi and F. D’Amato, "Pressure broadening and shift of transitions
of the first overtone of HCl", Appl. Phys. B: Lasers Opt., 2001, 72, 2, pp. 245-248,
https://doi.org/10.1007/s003400000449.
63. T. Tomberg, M. Vainio, T. Hieta and L. Halonen, "Sub-parts-per-trillion level sensitivity in trace gas
detection by cantilever-enhanced photo-acoustic spectroscopy", Sci. Rep., 2018, 8, 1, pp. 1848,
https://doi.org/10.1038/s41598-018-20087-9.
17
Supplementary information
Infrared spectroscopy of radioactive hydrogen chloride H36Cl
Santeri Larnimaaa,*, Markku Vainioa,b, Ville Ulvilac
a Department of Chemistry, University of Helsinki, Helsinki, Finland
b Photonics Laboratory, Physics Unit, Tampere University, Tampere, Finland
c VTT Technical Research Centre of Finland Limited, Espoo, Finland
* Corresponding author
Postal address: Department of Chemistry, University of Helsinki, P.O. Box 55, FI-00014 Helsinki,
Finland
E-mail address: [email protected]
This document is organized as follows:
Supplementary Note 1: The use of Lorentzian functions to model the absorption peaks is justified.
Supplementary Note 2: The linewidths and integrated absorption coefficients (that reveal the relative
intensities) of the H36Cl fundamental rovibrational band, including an uncertainty analysis, are reported.
Supplementary Note 3: The H36Cl linewidths and relative intensities to those of the stable isotopologues H35Cl
and H37Cl are compared.
Supplementary Note 4: Our estimate of the gaseous H36Cl content in the sample is explained.
18
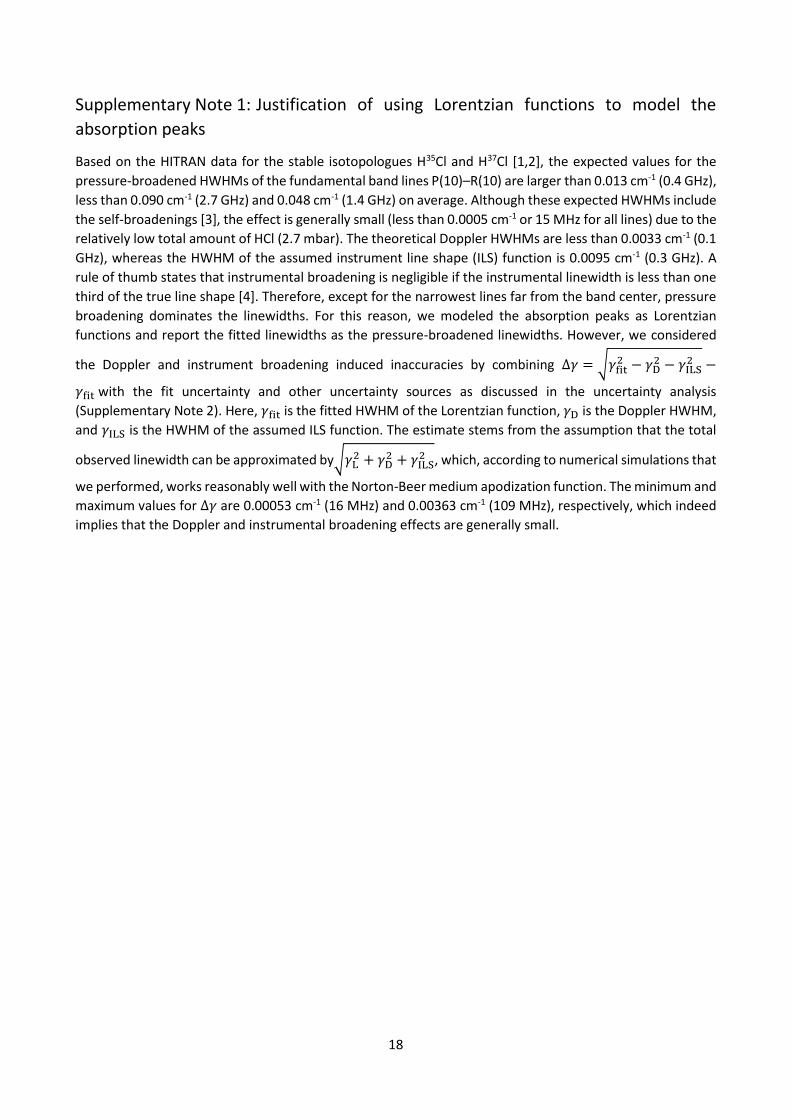
Supplementary Note 1: Justification of using Lorentzian functions to model the
absorption peaks
Based on the HITRAN data for the stable isotopologues H35Cl and H37Cl [1,2], the expected values for the
pressure-broadened HWHMs of the fundamental band lines P(10)–R(10) are larger than 0.013 cm-1 (0.4 GHz),
less than 0.090 cm-1 (2.7 GHz) and 0.048 cm-1 (1.4 GHz) on average. Although these expected HWHMs include
the self-broadenings [3], the effect is generally small (less than 0.0005 cm-1 or 15 MHz for all lines) due to the
relatively low total amount of HCl (2.7 mbar). The theoretical Doppler HWHMs are less than 0.0033 cm-1 (0.1
GHz), whereas the HWHM of the assumed instrument line shape (ILS) function is 0.0095 cm-1 (0.3 GHz). A
rule of thumb states that instrumental broadening is negligible if the instrumental linewidth is less than one
third of the true line shape [4]. Therefore, except for the narrowest lines far from the band center, pressure
broadening dominates the linewidths. For this reason, we modeled the absorption peaks as Lorentzian
functions and report the fitted linewidths as the pressure-broadened linewidths. However, we considered
the Doppler and instrument broadening induced inaccuracies by combining Δ𝛾 = √𝛾fit2 − 𝛾D
2 − 𝛾ILS2 −
𝛾fit with the fit uncertainty and other uncertainty sources as discussed in the uncertainty analysis
(Supplementary Note 2). Here, 𝛾fit is the fitted HWHM of the Lorentzian function, 𝛾D is the Doppler HWHM,
and 𝛾ILS is the HWHM of the assumed ILS function. The estimate stems from the assumption that the total
observed linewidth can be approximated by√𝛾L2 + 𝛾D
2 + 𝛾ILS2 , which, according to numerical simulations that
we performed, works reasonably well with the Norton-Beer medium apodization function. The minimum and
maximum values for Δ𝛾 are 0.00053 cm-1 (16 MHz) and 0.00363 cm-1 (109 MHz), respectively, which indeed
implies that the Doppler and instrumental broadening effects are generally small.
19
Supplementary Note 2: Linewidths, integrated absorption coefficients, and
uncertainty analysis
Supplementary Table 1 lists the H36Cl fit results for the linewidths (HWHM pressure broadenings) and the
integrated absorption coefficients (line areas). The numbers in parentheses are one standard deviation
uncertainties in least significant digits as obtained from the fit. The total uncertainty columns contain the
combined effect of the fit uncertainties and other uncertainty sources for the respective line parameters at
68 % confidence level. Supplementary Table 2 contains a breakdown of the typical magnitudes of the
different uncertainty contributions.
For the HWHMs, the total uncertainty estimates stated in Supplementary Tables 1 and 2 consist of the fit
uncertainty, effect of the baseline determination uncertainty, uncertainty in the measurement pressure, and
the effect of the ILS function. The effect of self-broadenings and temperature are negligible. The uncertainty
of the 100 % transmission baseline has been obtained via numerical simulations where we systematically
applied variation to the baseline and observed how the fit results changed. The effect of pressure has been
estimated assuming 1 % (ca. 10 mbar) pressure uncertainty and the fact that pressure broadening is
proportional to pressure. For the strongest lines, all the uncertainty sources are important. For the weakest
lines, the instrumental broadening dominates. The total uncertainties are 2–5 % for lines P(7)–R(6). Note that
for these lines the rule of thumb 𝛾ILS < 1/3 𝛾tot holds.
For the integrated absorption coefficients, the total uncertainty estimates stated in Supplementary Tables 1
and 2 consist of the fit uncertainty, the effect of the ILS function, the effect of the baseline uncertainty,
uncertainty in the measurement temperature, and uncertainty in the absorption path length. The effect of
the ILS function has been estimated based on tests where we simulated instrument broadened absorption
peaks and observed how well a Lorentz fit recovered the original line parameters. The temperature effect
has been estimated by calculating how a 2-K temperature change affects the assumed HITRAN H35Cl line
intensities according to the line intensity temperature dependence equation found in HITRAN
documentation [5]. The absorption path length uncertainty stems from a possible tilt of the sample cell with
respect to the light propagation direction. It is this path length uncertainty that has the largest contribution
to the total uncertainty of the strongest lines. For the weakest lines, all uncertainty contributions are
important. The total uncertainties are 2–5 % for lines P(8)–R(8).
20
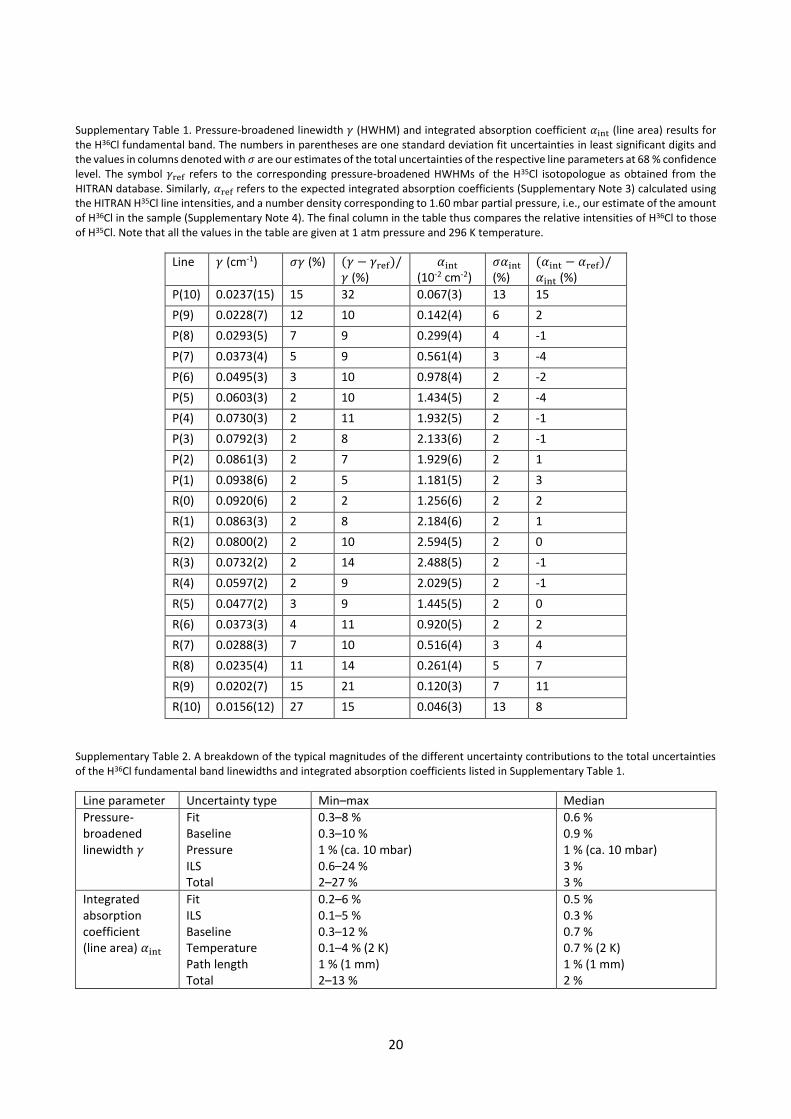
Supplementary Table 1. Pressure-broadened linewidth 𝛾 (HWHM) and integrated absorption coefficient 𝛼int (line area) results for the H36Cl fundamental band. The numbers in parentheses are one standard deviation fit uncertainties in least significant digits and the values in columns denoted with 𝜎 are our estimates of the total uncertainties of the respective line parameters at 68 % confidence level. The symbol 𝛾ref refers to the corresponding pressure-broadened HWHMs of the H35Cl isotopologue as obtained from the HITRAN database. Similarly, 𝛼ref refers to the expected integrated absorption coefficients (Supplementary Note 3) calculated using the HITRAN H35Cl line intensities, and a number density corresponding to 1.60 mbar partial pressure, i.e., our estimate of the amount of H36Cl in the sample (Supplementary Note 4). The final column in the table thus compares the relative intensities of H36Cl to those of H35Cl. Note that all the values in the table are given at 1 atm pressure and 296 K temperature.
Line 𝛾 (cm-1) 𝜎𝛾 (%) (𝛾 − 𝛾ref)/𝛾 (%)
𝛼int (10-2 cm-2)
𝜎𝛼int (%)
(𝛼int − 𝛼ref)/𝛼int (%)
P(10) 0.0237(15) 15 32 0.067(3) 13 15
P(9) 0.0228(7) 12 10 0.142(4) 6 2
P(8) 0.0293(5) 7 9 0.299(4) 4 -1
P(7) 0.0373(4) 5 9 0.561(4) 3 -4
P(6) 0.0495(3) 3 10 0.978(4) 2 -2
P(5) 0.0603(3) 2 10 1.434(5) 2 -4
P(4) 0.0730(3) 2 11 1.932(5) 2 -1
P(3) 0.0792(3) 2 8 2.133(6) 2 -1
P(2) 0.0861(3) 2 7 1.929(6) 2 1
P(1) 0.0938(6) 2 5 1.181(5) 2 3
R(0) 0.0920(6) 2 2 1.256(6) 2 2
R(1) 0.0863(3) 2 8 2.184(6) 2 1
R(2) 0.0800(2) 2 10 2.594(5) 2 0
R(3) 0.0732(2) 2 14 2.488(5) 2 -1
R(4) 0.0597(2) 2 9 2.029(5) 2 -1
R(5) 0.0477(2) 3 9 1.445(5) 2 0
R(6) 0.0373(3) 4 11 0.920(5) 2 2
R(7) 0.0288(3) 7 10 0.516(4) 3 4
R(8) 0.0235(4) 11 14 0.261(4) 5 7
R(9) 0.0202(7) 15 21 0.120(3) 7 11
R(10) 0.0156(12) 27 15 0.046(3) 13 8
Supplementary Table 2. A breakdown of the typical magnitudes of the different uncertainty contributions to the total uncertainties of the H36Cl fundamental band linewidths and integrated absorption coefficients listed in Supplementary Table 1.
Line parameter Uncertainty type Min–max Median
Pressure-broadened linewidth 𝛾
Fit Baseline Pressure ILS Total
0.3–8 % 0.3–10 % 1 % (ca. 10 mbar) 0.6–24 % 2–27 %
0.6 % 0.9 % 1 % (ca. 10 mbar) 3 % 3 %
Integrated absorption coefficient (line area) 𝛼int
Fit ILS Baseline Temperature Path length Total
0.2–6 % 0.1–5 % 0.3–12 % 0.1–4 % (2 K) 1 % (1 mm) 2–13 %
0.5 % 0.3 % 0.7 % 0.7 % (2 K) 1 % (1 mm) 2 %
21
Supplementary Note 3: Comparison of the H36Cl linewidths and relative intensities to
those of the stable isotopologues H35Cl and H37Cl
In the fourth column of Supplementary Table 1 (denoted by (𝛾 − 𝛾ref
)/𝛾), we compare the measured HWHMs
to the corresponding HITRAN values of H35Cl. This comparison is interesting because there are multiple
reports on H35Cl and H37Cl linewidths where the differences between the different isotopologues are small,
typically within the stated measurement uncertainties that are of the order of a few percent [3,6-12].
However, the HWHMs of H36Cl in this study are systematically larger than the HITRAN values for H35Cl. The
median of the differences is 10 %, whereas the median of the estimated total uncertainties is 3 %. We also
determined the HWHMs for the stable isotopologues H35Cl and H37Cl from our experimental data and these
also seemed to follow this trend; the median of the differences between the experimental HWHMs for H35Cl
(H37Cl) and the corresponding HITRAN values is 8 % (7 %). The HITRAN data for the linewidths are based on
laser spectroscopy measurements by Pine and Looney [2], who estimated 2–4 % total uncertainty for their
results. On the other hand, Asfin et al. [7] reported in a recent study widths that were approximately 5 %
smaller than the results of Pine and Looney. The reasons for the deviations of our results from the previously
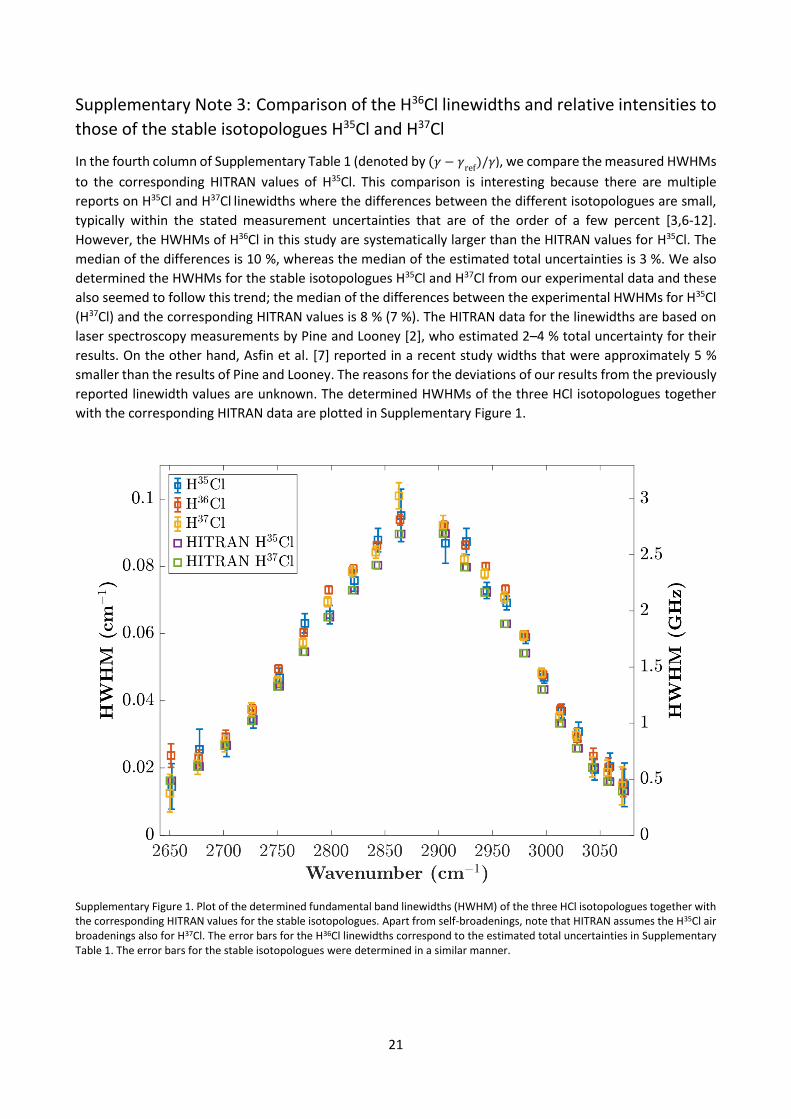
reported linewidth values are unknown. The determined HWHMs of the three HCl isotopologues together
with the corresponding HITRAN data are plotted in Supplementary Figure 1.
Supplementary Figure 1. Plot of the determined fundamental band linewidths (HWHM) of the three HCl isotopologues together with the corresponding HITRAN values for the stable isotopologues. Apart from self-broadenings, note that HITRAN assumes the H35Cl air broadenings also for H37Cl. The error bars for the H36Cl linewidths correspond to the estimated total uncertainties in Supplementary Table 1. The error bars for the stable isotopologues were determined in a similar manner.
22
For the final column of Supplementary Table 1, we multiplied the H35Cl HITRAN line intensities with a number
density corresponding to 1.6 mbar of H36Cl (see Supplementary Note 4) to obtain the expected integrated
absorption coefficients 𝛼ref. The column thus compares the relative intensities of H36Cl to those of H35Cl. The
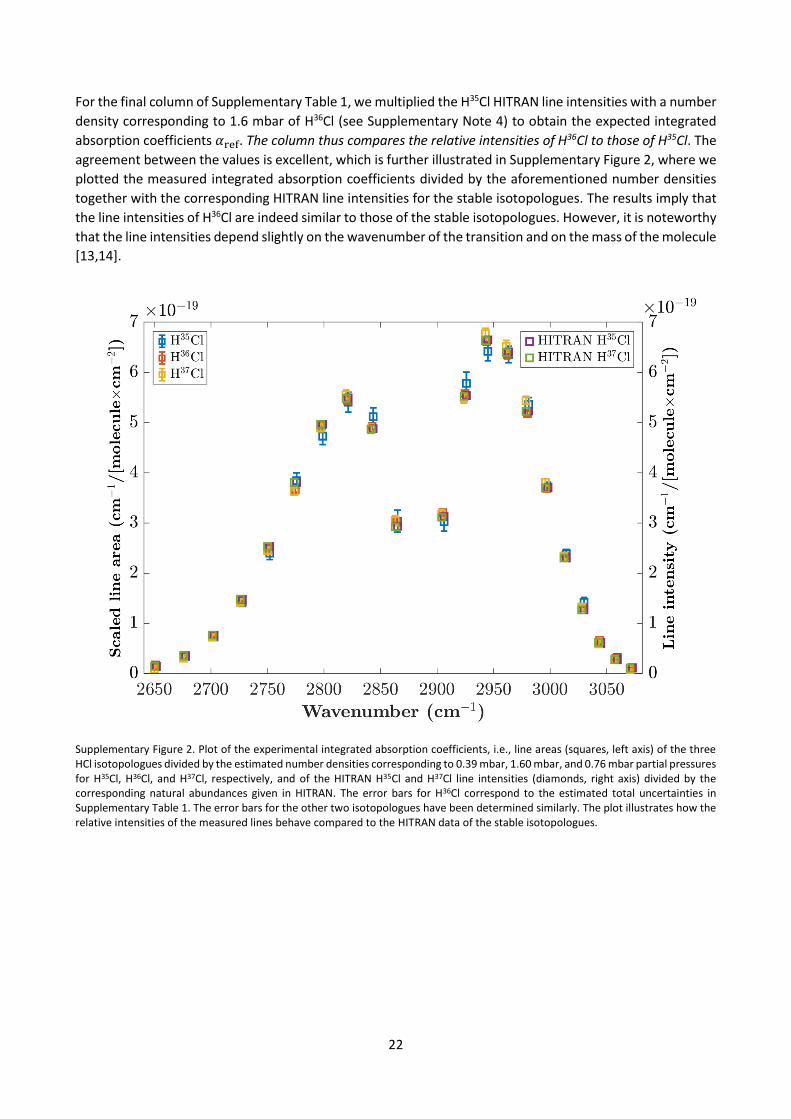
agreement between the values is excellent, which is further illustrated in Supplementary Figure 2, where we
plotted the measured integrated absorption coefficients divided by the aforementioned number densities
together with the corresponding HITRAN line intensities for the stable isotopologues. The results imply that
the line intensities of H36Cl are indeed similar to those of the stable isotopologues. However, it is noteworthy
that the line intensities depend slightly on the wavenumber of the transition and on the mass of the molecule
[13,14].
Supplementary Figure 2. Plot of the experimental integrated absorption coefficients, i.e., line areas (squares, left axis) of the three HCl isotopologues divided by the estimated number densities corresponding to 0.39 mbar, 1.60 mbar, and 0.76 mbar partial pressures for H35Cl, H36Cl, and H37Cl, respectively, and of the HITRAN H35Cl and H37Cl line intensities (diamonds, right axis) divided by the corresponding natural abundances given in HITRAN. The error bars for H36Cl correspond to the estimated total uncertainties in Supplementary Table 1. The error bars for the other two isotopologues have been determined similarly. The plot illustrates how the relative intensities of the measured lines behave compared to the HITRAN data of the stable isotopologues.
23
Supplementary Note 4: Explanation for our estimate of the gaseous H36Cl content in
the sample
The integrated absorption coefficients 𝛼int in the fifth column of Supplementary Table 1 are proportional to
the H36Cl line intensities and number density. Since we do not have accurate external knowledge of the H36Cl
number density, we cannot determine the absolute line intensities from our integrated absorption coefficient
data. The integrated absorption coefficients thus reveal only the relative intensities of the lines. However,
similar to the linewidths, there are several prior reports on H35Cl and H37Cl where the differences between
the intensities of the different isotopologues are small and typically within the stated measurement
uncertainties [6,11,12,14]. Therefore, we can estimate the number density of H36Cl in the sample if we
assume the HITRAN H35Cl line intensities. We performed this by calculating the weighted average of the ratio
of the H36Cl integrated absorption coefficients to the HITRAN H35Cl line intensities [1,15]. The weights given
to the data points are the inverses of the respective fit uncertainties. The obtained result is a number density
corresponding to 1.60 mbar partial pressure, which is our estimate of the amount of H36Cl in the sample. A
similarly weighted standard deviation is 0.04 mbar. The same calculation yields 0.39(2) mbar and 0.76(4)
mbar for H35Cl and H37Cl, respectively. Note that the HITRAN line intensities include the natural abundances
of the different isotopologues, which we considered in the calculations.
Supplementary References
1. I. E. Gordon, L. S. Rothman, C. Hill, R. V. Kochanov, Y. Tan, P. F. Bernath, M. Birk, V. Boudon, A. Campargue, K. V. Chance, B. J. Drouin, J.-M. Flaud, R. R. Gamache, J. T. Hodges, D. Jacquemart, V. I. Perevalov, A. Perrin, K. P. Shine, M.-A. H. Smith, J. Tennyson, G. C. Toon, H. Tran, V. G. Tyuterev, A. Barbe, A. G. Császár, V. M. Devi, T. Furtenbacher, J. J. Harrison, J.-M. Hartmann, A. Jolly, T. J. Johnson, T. Karman, I. Kleiner, A. A. Kyuberis, J. Loos, O. M. Lyulin, S. T. Massie, S. N. Mikhailenko, N. Moazzen-Ahmadi, H. S. P. Müller, O. V. Naumenko, A. V. Nikitin, O. L. Polyansky, M. Rey, M. Rotger, S. W. Sharpe, K. Sung, E. Starikova, S. A. Tashkun, J. V. Auwera, G. Wagner, J. Wilzewski, P. Wcisło, S. Yu and E. J. Zak, "The HITRAN2016 molecular spectroscopic database", J. Quant. Spectrosc. Radiat. Transfer, 2017, 203, pp. 3-69, https://doi.org/10.1016/j.jqsrt.2017.06.038.
2. A. S. Pine and J. P. Looney, "N2 and air broadening in the fundamental bands of HF and HCl", J. Mol. Spectrosc., 1987, 122, 1, pp. 41-55, https://doi.org/10.1016/0022-2852(87)90217-7.
3. A. S. Pine and A. Fried, "Self-broadening in the fundamental bands of HF and HCl", J. Mol. Spectrosc., 1985, 114, 1, pp. 148-162, https://doi.org/10.1016/0022-2852(85)90344-3.
4. A. Sieghard, K. A. Keppler and M. Quack, High-resolution Fourier Transform Infrared Spectroscopy, Handbook of High-resolution Spectroscopy, Vol. 2, eds. M. Quack and F. Merkt, John Wiley & Sons, 2011.
5. M. Šimečková, D. Jacquemart, L. S. Rothman, R. R. Gamache and A. Goldman, "Einstein A-coefficients and statistical weights for molecular absorption transitions in the HITRAN database", J. Quant. Spectrosc. Radiat. Transfer, 2006, 98, 1, pp. 130-155, https://doi.org/10.1016/j.jqsrt.2005.07.003.
6. G. Li, A. Serdyukov, M. Gisi, O. Werhahn and V. Ebert, "FTIR-based measurements of self-broadening and self-shift coefficients as well as line strength in the first overtone band of HCl at 1.76µM", J. Quant. Spectrosc. Radiat. Transfer, 2015, 165, pp. 76-87, https://doi.org/10.1016/j.jqsrt.2015.06.021.
24
7. R. E. Asfin, A. V. Domanskaya and C. Maul, "Broadening and shifting coefficients of rotation–vibrational lines in the fundamental and first overtone bands of HCl and HBr induced by oxygen and air", J. Quant. Spectrosc. Radiat. Transfer, 2013, 130, pp. 296-303, https://doi.org/10.1016/j.jqsrt.2013.07.014.
8. R. E. Asfin, A. V. Domanskaya, C. Maul and M. O. Bulanin, "Nitrogen-induced broadening and shift coefficients of rotation–vibrational lines in the fundamental and first overtone bands of HCl and HBr", J. Mol. Spectrosc., 2012, 282, pp. 9-13, https://doi.org/10.1016/j.jms.2012.10.009.
9. M. Tudorie, T. Földes, A. C. Vandaele and J. Vander Auwera, "CO2 pressure broadening and shift coefficients for the 1–0 band of HCl and DCl", J. Quant. Spectrosc. Radiat. Transfer, 2012, 113, 11, pp. 1092-1101, https://doi.org/10.1016/j.jqsrt.2012.01.025.
10. M. De Rosa, C. Nardini, C. Piccolo, C. Corsi and F. D’Amato, "Pressure broadening and shift of transitions of the first overtone of HCl", Appl. Phys. B: Lasers Opt., 2001, 72, 2, pp. 245-248, https://doi.org/10.1007/s003400000449.
11. C. L. Lin, E. Niple, J. H. Shaw, W. M. Uselman and J. G. Calvert, "Line parameters of HCl obtained by simultaneous analysis of spectra", J. Quant. Spectrosc. Radiat. Transfer, 1978, 20, 6, pp. 581-591, https://doi.org/10.1016/0022-4073(78)90029-8.
12. R. A. Toth, R. H. Hunt and E. K. Plyler, "Line strengths, line widths, and dipole moment function for HCl", J. Mol. Spectrosc., 1970, 35, 1, pp. 110-126, https://doi.org/10.1016/0022-2852(70)90169-4.
13. R. Herman and R. F. Wallis, "Influence of Vibration‐Rotation Interaction on Line Intensities in Vibration‐Rotation Bands of Diatomic Molecules", J. Chem. Phys., 1955, 23, 4, pp. 637-646, https://doi.org/10.1063/1.1742069.
14. A. S. Pine, A. Fried and J. W. Elkins, "Spectral intensities in the fundamental bands of HF and HCl", J. Mol. Spectrosc., 1985, 109, 1, pp. 30-45, https://doi.org/10.1016/0022-2852(85)90049-9.
15. G. Li, I. E. Gordon, P. F. Bernath and L. S. Rothman, "Direct fit of experimental ro-vibrational intensities to the dipole moment function: Application to HCl", J. Quant. Spectrosc. Radiat. Transfer, 2011, 112, 10, pp. 1543-1550, https://doi.org/10.1016/j.jqsrt.2011.03.014.
Related Documents


