arXiv:cond-mat/0104354v1 [cond-mat.supr-con] 19 Apr 2001 Infrared absorption in superconducting MgB 2 C.S.Sundar, A. Bharathi, M. Premila, T.N. Sairam, S. Kalavathi, G.L.N. Reddy, V.S. Sastry, Y.Hariharan and T.S. Radhakrishnan Materials Science Division, Indira Gandhi Centre for Atomic Research Kalpakkam, India 603 102 Abstract Infrared absorption measurements in the range of 125 to 700 cm -1 have been carried out as a function of temperature upto 5 K in MgB 2 . The ab- sorption spectrum is characterised by a broad band centred at 485 cm -1 , with shoulders at 333 and 387 cm -1 . Studies on the temperature dependence of absorption, indicate that these modes initially harden with the lowering of temperature, and this trend is arrested at ∼ 100 K, below which they soften. Further, in the case of the mode at 333 cm -1 , there is a distinct softening associated with the superconducting transition at 39 K. The implications of these experimental results in the context of superconductivity in MgB 2 are discussed. PACS numbers: 74.70.Ad, 74.25.Kc, 78.30.-j I. INTRODUCTION The recent discovery of superconductivity 1 at 39 K in the binary intermetallic MgB 2 , having a simple hexagonal structure consisting of alternating honeycomb layers of B and closed packed layers of Mg, has evoked a widespread interest. Initial experiments suggest 1

Welcome message from author
This document is posted to help you gain knowledge. Please leave a comment to let me know what you think about it! Share it to your friends and learn new things together.
Transcript
arX
iv:c
ond-
mat
/010
4354
v1 [
cond
-mat
.sup
r-co
n] 1
9 A
pr 2
001
Infrared absorption in superconducting MgB2
C.S.Sundar, A. Bharathi, M. Premila, T.N. Sairam, S. Kalavathi, G.L.N. Reddy, V.S.
Sastry, Y.Hariharan and T.S. Radhakrishnan
Materials Science Division, Indira Gandhi Centre for Atomic Research
Kalpakkam, India 603 102
Abstract
Infrared absorption measurements in the range of 125 to 700 cm−1 have
been carried out as a function of temperature upto 5 K in MgB2. The ab-
sorption spectrum is characterised by a broad band centred at 485 cm−1, with
shoulders at 333 and 387 cm−1. Studies on the temperature dependence of
absorption, indicate that these modes initially harden with the lowering of
temperature, and this trend is arrested at ∼ 100 K, below which they soften.
Further, in the case of the mode at 333 cm −1, there is a distinct softening
associated with the superconducting transition at 39 K. The implications of
these experimental results in the context of superconductivity in MgB2 are
discussed.
PACS numbers: 74.70.Ad, 74.25.Kc, 78.30.-j
I. INTRODUCTION
The recent discovery of superconductivity1 at 39 K in the binary intermetallic MgB2,
having a simple hexagonal structure consisting of alternating honeycomb layers of B and
closed packed layers of Mg, has evoked a widespread interest. Initial experiments suggest
1
that the superconductivity in this system arises due to phonon-mediated interaction, as
supported by experiments on isotope effect2; measurements on the superconducting gap
by tunnelling3 and optical spectroscopy4, as also the decrease of Tc with the application of
pressure5. There have been several theoretical calculations6–9 that emphasise the importance
of electron-phonon coupling, though alternative mechanisms10,11 for superconductivity have
also been proposed. Electronic structure calculations in MgB2 indicate that Mg is completely
ionised and the bands at the Fermi level are derived from σ orbitals of boron. There are four
distinct zone centre vibrational modes: a silent mode B1g, the doubly degenerate Raman
mode, E2g, and two infrared active modes of A2u and E1u symmetry. While there is a
general agreement with regard to electronic structure and vibrations, the details differ, both
with respect to the calculated frequencies and the relative importance of these modes with
respect to superconductivity in the system. For example, in the calculations of An and
Pickett7, using the deformation potential approach, it is the E2g mode that is shown to
have a dominant coupling with the electrons, whereas in the calculations of Kong et al8,
the electron phonon interaction is spread over all the modes. Inelastic neutron scattering
experiments measuring the vibrational density of states12–14 indicate acoustic modes at
less than 40 meV and peaks in the phonon density of states at 54, 78, 89 and 97 meV
corresponding to the optic modes. Raman scattering measurements15–17 indicate a mode at
∼ 600 cm−1, which is characterised by very large width ∼ 200 cm−1, indicative of strong
electron phonon interaction.
In this paper, results of infrared absorption measurements on superconducting MgB2,
covering a spectral range of 125 - 700 cm−1, in which the optic modes are predicted to
exist, are reported. In addition supportive experiments have also been carried out in the
mid infrared range, upto 2000 cm−1. Based on these experiments and comparison with
theoretical calculations6–9, the optic modes of MgB2 are identified. From studies on the
temperature dependence of infrared absorption, it is seen that the optic modes show an
interesting temperature variation in that the hardening behaviour at low temperatures is
arrested below 100 K, below which they soften. In addition, the IR mode at 333 cm−1 shows
2
a distinct softening below Tc.
II. EXPERIMENTAL DETAILS
The MgB2 sample used in the present experiments was prepared from Mg (99.99 %)
powder of 50 mesh and B (99.98 %) powder of 325 mesh. The starting materials were thor-
oughly mixed and put in Ta tube that was sealed in Ar atmosphere. This was subsequently
sealed in a quartz tube that was heat treated at 1223 K for 2 hours. After cooling down
to room temperature, the polycrystalline lumps were crushed using agate mortar and pestle
and subsequently used for experimentation. X - ray diffraction measurements were carried
out using Cu-Kα radiation in the Bragg-Brentano geometry. AC susceptibilty measurements
were carried out with a mutual inductance bridge and lock-in amplifier, using a dipstick cryo-
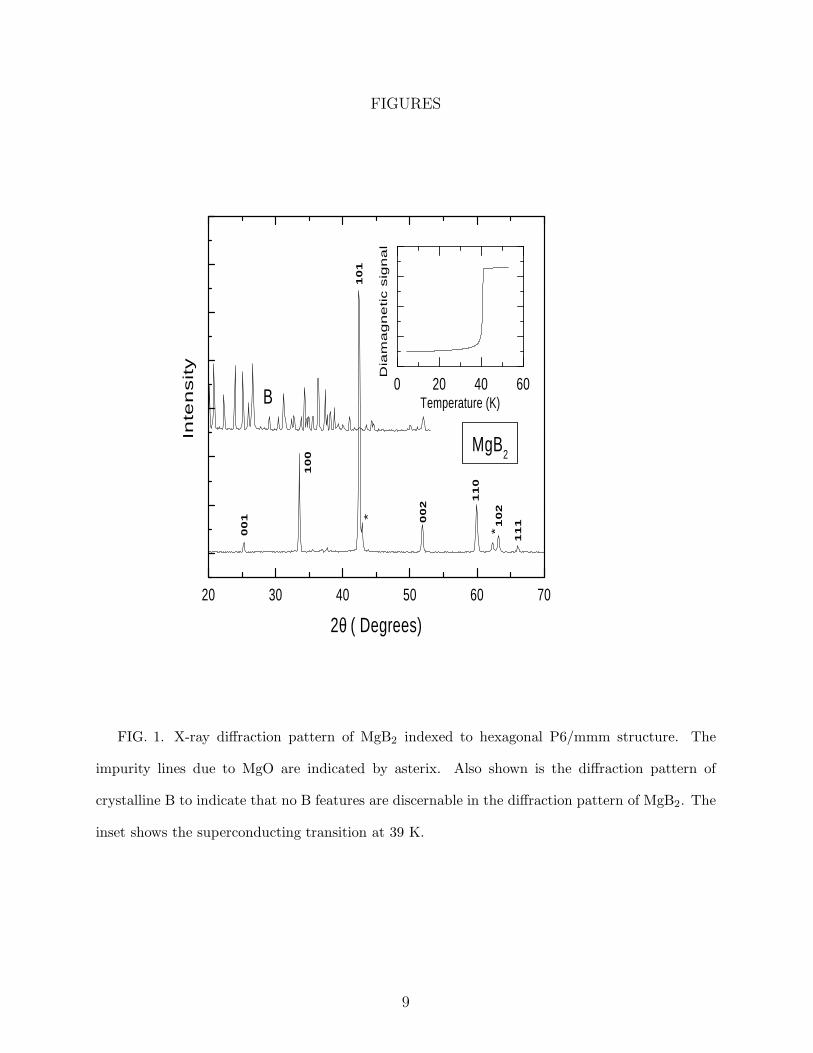
stat operating in the 4 to 300 K range. The diamagnetic signal corresponding to the sharp
superconducting transition at 39 K, and the results of the x-ray diffraction measurements
are shown in Fig.1. The diffraction pattern of MgB2 can be indexed to hexagnal structure
(P6/mmm) with lattice parameters: a= 3.0864 A and c=3.5253 A, in agreement with earlier
studies18. The diffraction pattern of crystalline β rhombohedral boron is also shown, and it
is seen that boron peaks are not discernable in the diffraction pattern of MgB2. However,
there are a few peaks that could be associated with MgO, whose concentration is estimated
to be ∼ 1%. From the powder ac-susceptibilty measurements, using Pb powder as standard,
the superconducting volume fraction was estimated to be 75%.
Infrared absorption measurements were carried out on finely ground MgB2 sample pel-
letized along with KBr, using a BOMEM -DA8 spectrometer operating with a resolution
of 2 cm−1. Measurements in the range of 125 - 700 cm −1 were carried out using a mylar
beam splitter and a DTGS detector. Experiments in the mid infrared range of 400 to 2000
cm−1 have been carried out using the combination of KBr beam splitter and MCT detector.
To study the temperature variation of IR modes, the sample was mounted inside a JANIS
continuous flow cryostat in which temperature variation of 300 to 5 K could be achieved.
3
III. RESULTS AND DISCUSSION
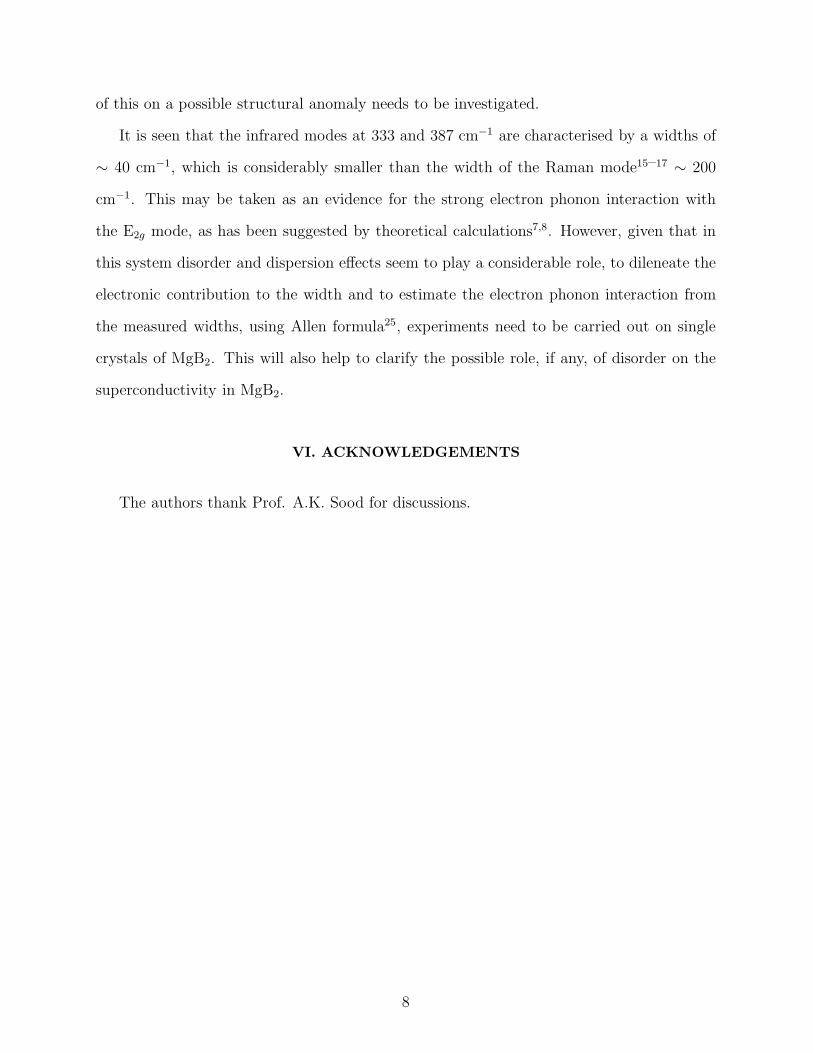
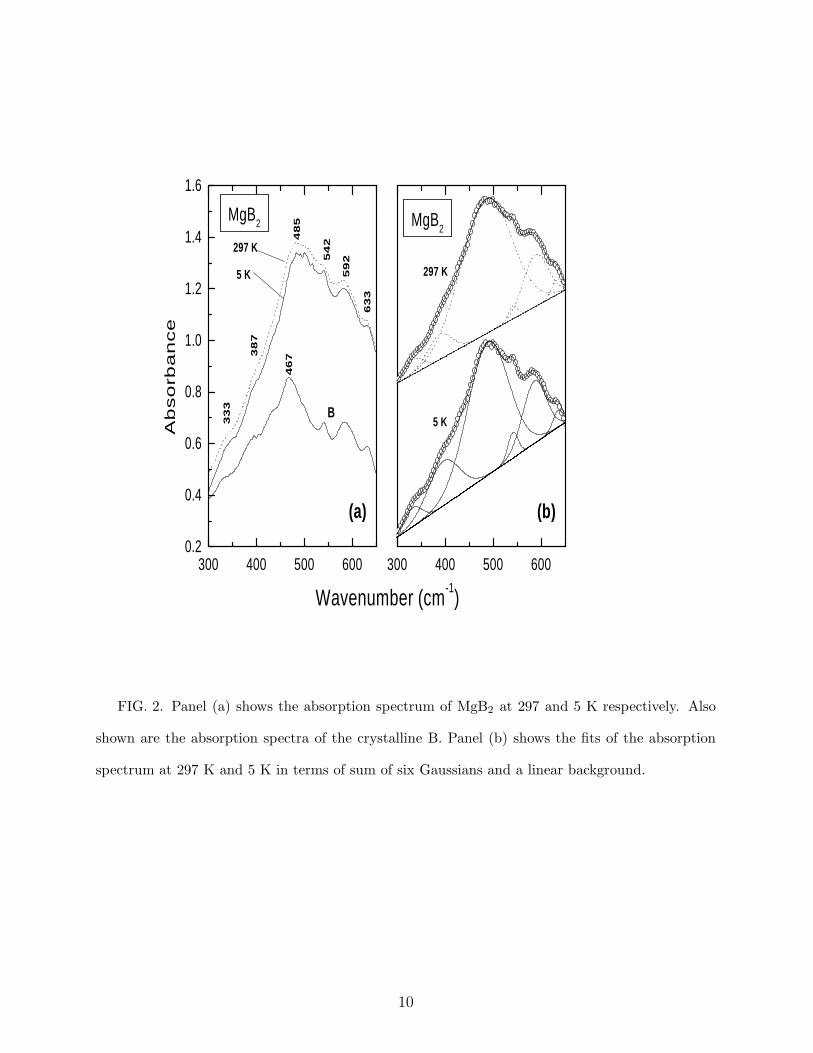
Fig.2 shows the IR absorbance of MgB2 in the range of 300 to 650 cm−1 . The region
below 300 cm−1 is supressed, as it is dominated by KBr absorption. The absorption spectrum
in MgB2 is characterised by a broad band centred at 485 cm−1 with shoulders at 333, 387
cm−1. Further sharp features are also noted at 542, 592 and 633 cm−1. The latter modes
match with those of β rhombohedral boron19, whose absorption spectrum is also shown.
The occurrence of these modes, while the x-ray diffraction pattern does not indicate the
presence of any B (cf. Fig. 1), p points to the activation of B-like modes in MgB2 due to
disorder (see below). Information on the frequencies, widths and intensity of the various
phonon modes have been obtained by fitting the absorption curves to a sum of Gaussians
and a linear background. The resulting fits along with the components is shown in the right
panel of Fig.2, for the two representative temperatures of 297 K and 5 K.
Factor group analysis predicts for MgB2 ( space group P6/mmm, z=1) B1g + E2g +
E1u+ A2u zone centre optic modes, of which E1u and A2u are IR active and E2g is Raman
active. There have been several calculations of these mode frequencies6–9,14 with a general
agreement. Kortus et al6 have calculated the two IR active modes of E1u and A2u symmetry
to be at 320 and 390 cm−1 respectively and a Raman mode of E2g symmetry at 470 cm−1.
In the calculations of Kong et al8, carried out using LMTO method, the infrared modes are
at 335 and 401 cm−1 and the Raman mode is at 585 cm−1. Yildrim et al14 have calculated
the infrared modes to be ω(E1u) = 40.7 meV, ω(A2u) = 49.8 meV and the Raman mode
ω(E2g) = 74.5 meV. Comparing these theoretical calculations6,8,9,14 with our experimental
results, we identify the absorption features at 333 and 387 cm−1 with E1u and A2u infrared
modes.
As for the absorption band centred at 485 cm−1, we first note that it is different from the
Raman mode identified to be at 560 cm−1 in the experiments by Bohnen et al15 and at 620
cm−1 in the experiments of Chen et al16, and Goncharov et al17. In all these experiments,
the Raman mode is observed to be very broad ∼ 200 cm−1. Chen et al16 have suggested
4
that this broad feature arises due to disorder which relaxes the momentum selection rule
resulting in phonons in the entire Brillouin zone being sampled in the Raman experiment.
Taking cue from this, we note that the broad feature at 485 cm−1, observed in the present
infrared absorption experiments (cf. Fig.2) can be associated with the peak in the phonon
density of states at ∼ 54 meV, that is seen in the theoretical calculations and neutron
scattering experiments12,14. In effect the broad absorption band centred at 485 cm−1 arises
due to sampling of the phonons in this energy range over the entire Brillouin zone. The exact
nature of disorder that is being invoked to account for the absorption spectrum is not clear at
present, but could be off-stoichiometry or disorder in the arrangement of layered structure.
We reiterate that the present infrared absorption measurements have been carried out on a
sample characterised by sharp x-ray diffraction pattern and superconducting transition (cf.
Fig.1).
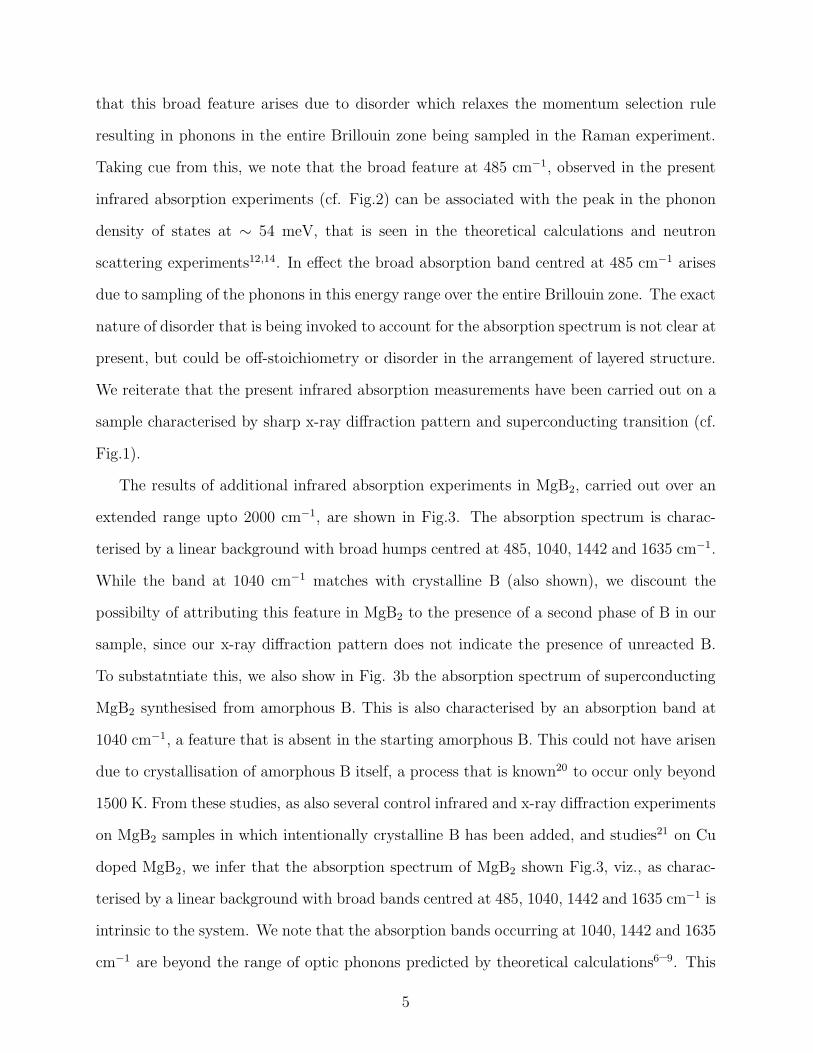
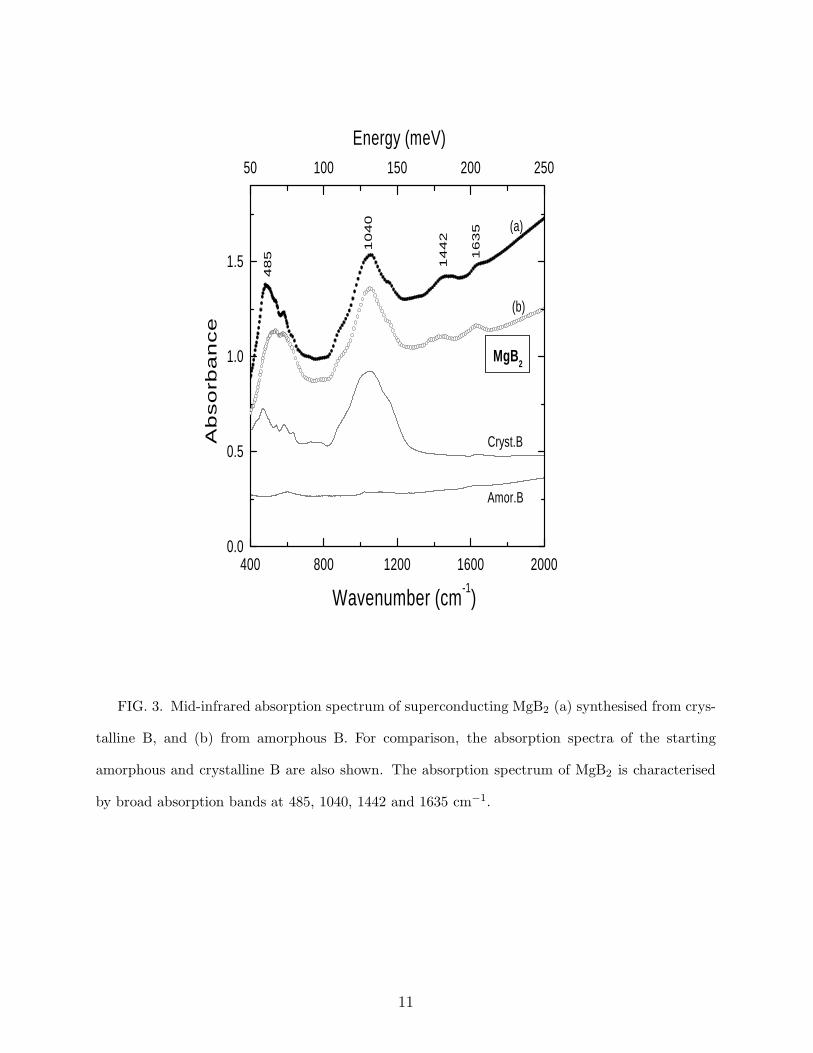
The results of additional infrared absorption experiments in MgB2, carried out over an
extended range upto 2000 cm−1, are shown in Fig.3. The absorption spectrum is charac-
terised by a linear background with broad humps centred at 485, 1040, 1442 and 1635 cm−1.
While the band at 1040 cm−1 matches with crystalline B (also shown), we discount the
possibilty of attributing this feature in MgB2 to the presence of a second phase of B in our
sample, since our x-ray diffraction pattern does not indicate the presence of unreacted B.
To substatntiate this, we also show in Fig. 3b the absorption spectrum of superconducting
MgB2 synthesised from amorphous B. This is also characterised by an absorption band at
1040 cm−1, a feature that is absent in the starting amorphous B. This could not have arisen
due to crystallisation of amorphous B itself, a process that is known20 to occur only beyond
1500 K. From these studies, as also several control infrared and x-ray diffraction experiments
on MgB2 samples in which intentionally crystalline B has been added, and studies21 on Cu
doped MgB2, we infer that the absorption spectrum of MgB2 shown Fig.3, viz., as charac-
terised by a linear background with broad bands centred at 485, 1040, 1442 and 1635 cm−1 is
intrinsic to the system. We note that the absorption bands occurring at 1040, 1442 and 1635
cm−1 are beyond the range of optic phonons predicted by theoretical calculations6–9. This
5
once again points to the important role of disorder in this system which may be activating
the the high frequency B-like modes19 in MgB2. We also note that these high frequency
features appear like replication of the absorption band at 485 cm−1 and hence may be due
to combination modes. The relatively large intensity of these combination modes could be
due to the large anharmonicity, which has been shown to exist14 in this system.
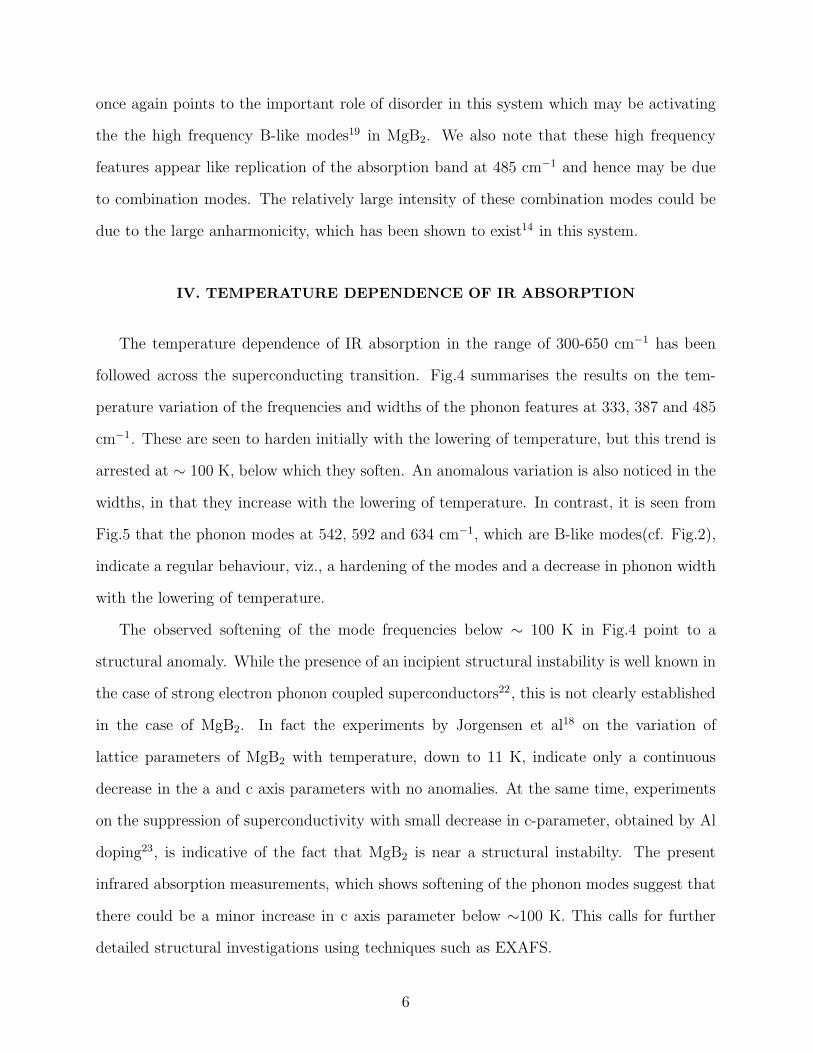
IV. TEMPERATURE DEPENDENCE OF IR ABSORPTION
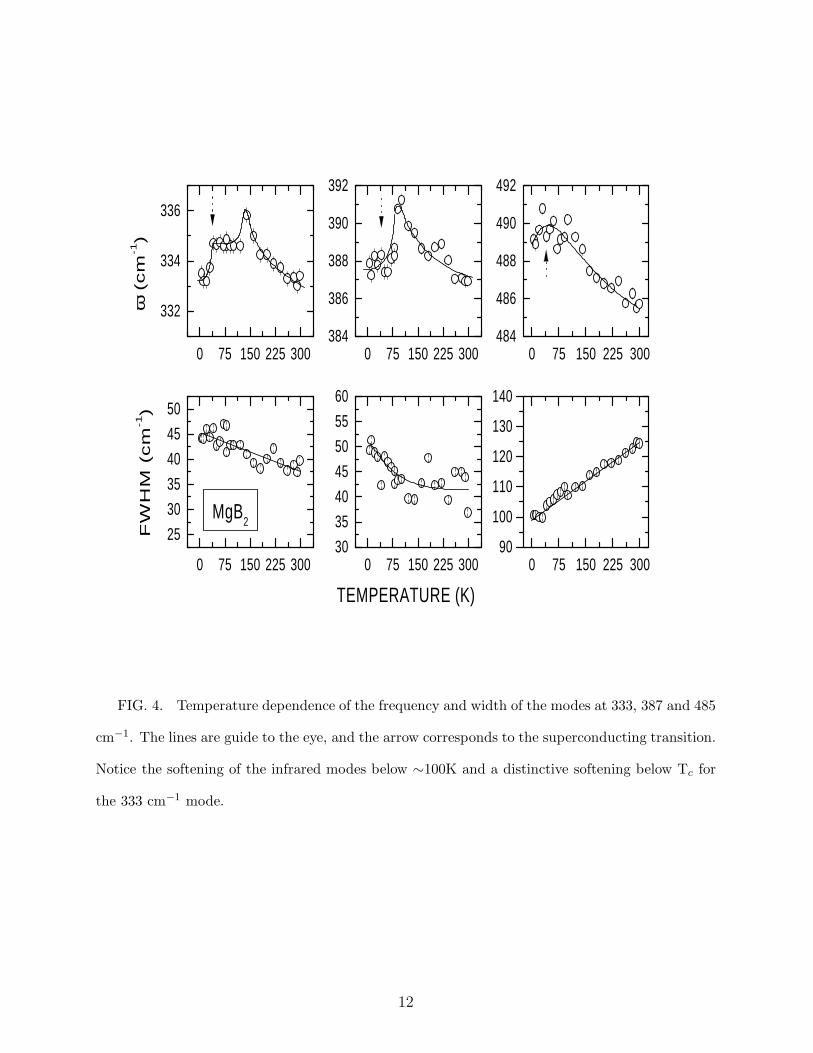
The temperature dependence of IR absorption in the range of 300-650 cm−1 has been
followed across the superconducting transition. Fig.4 summarises the results on the tem-
perature variation of the frequencies and widths of the phonon features at 333, 387 and 485
cm−1. These are seen to harden initially with the lowering of temperature, but this trend is
arrested at ∼ 100 K, below which they soften. An anomalous variation is also noticed in the
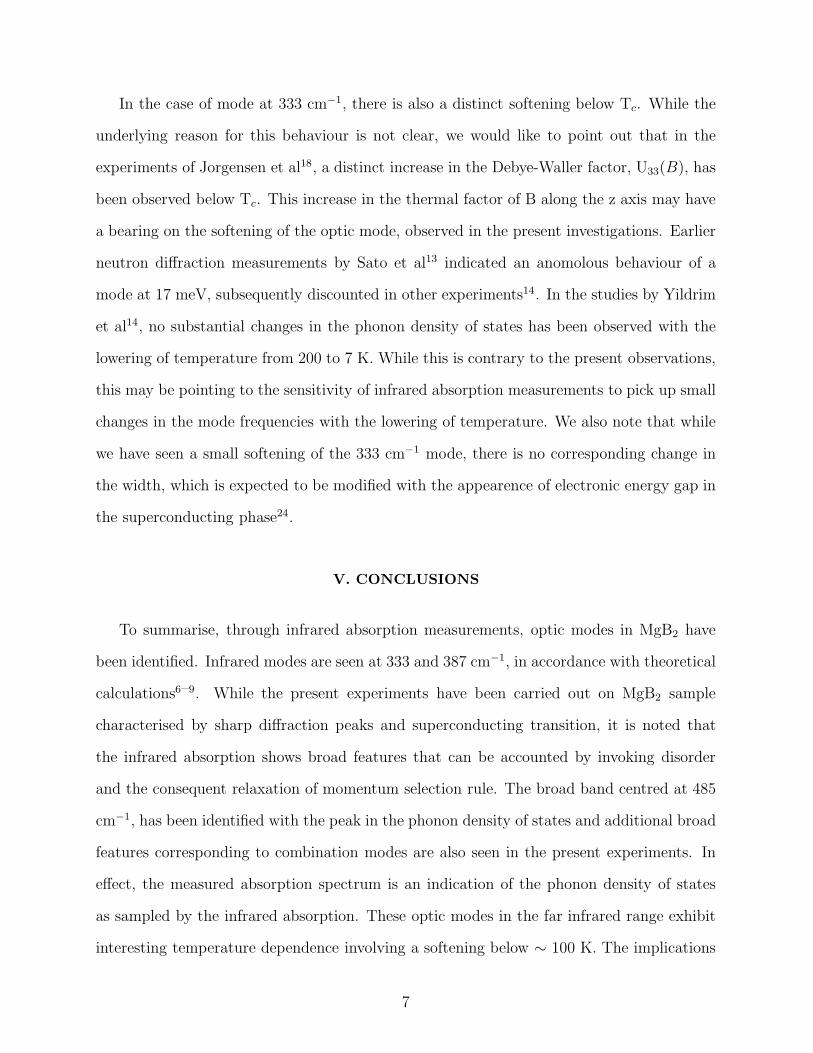
widths, in that they increase with the lowering of temperature. In contrast, it is seen from
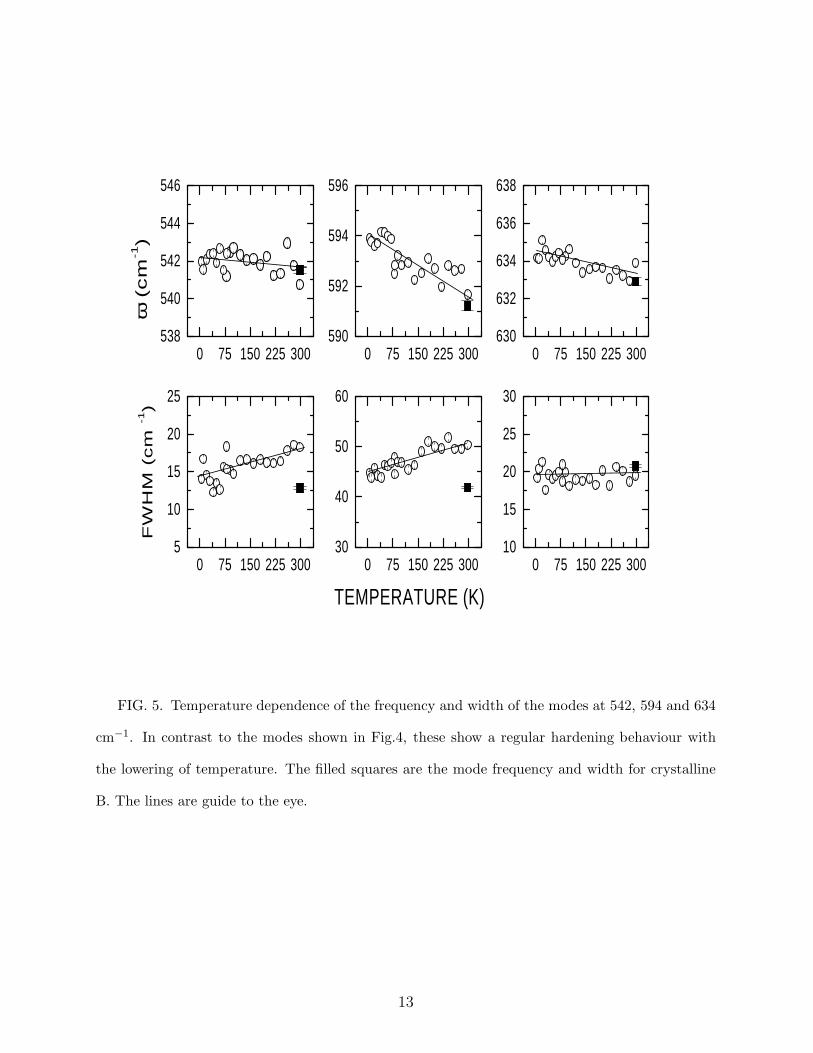
Fig.5 that the phonon modes at 542, 592 and 634 cm−1, which are B-like modes(cf. Fig.2),
indicate a regular behaviour, viz., a hardening of the modes and a decrease in phonon width
with the lowering of temperature.
The observed softening of the mode frequencies below ∼ 100 K in Fig.4 point to a
structural anomaly. While the presence of an incipient structural instability is well known in
the case of strong electron phonon coupled superconductors22, this is not clearly established
in the case of MgB2. In fact the experiments by Jorgensen et al18 on the variation of
lattice parameters of MgB2 with temperature, down to 11 K, indicate only a continuous
decrease in the a and c axis parameters with no anomalies. At the same time, experiments
on the suppression of superconductivity with small decrease in c-parameter, obtained by Al
doping23, is indicative of the fact that MgB2 is near a structural instabilty. The present
infrared absorption measurements, which shows softening of the phonon modes suggest that
there could be a minor increase in c axis parameter below ∼100 K. This calls for further
detailed structural investigations using techniques such as EXAFS.
6
In the case of mode at 333 cm−1, there is also a distinct softening below Tc. While the
underlying reason for this behaviour is not clear, we would like to point out that in the
experiments of Jorgensen et al18, a distinct increase in the Debye-Waller factor, U33(B), has
been observed below Tc. This increase in the thermal factor of B along the z axis may have
a bearing on the softening of the optic mode, observed in the present investigations. Earlier
neutron diffraction measurements by Sato et al13 indicated an anomolous behaviour of a
mode at 17 meV, subsequently discounted in other experiments14. In the studies by Yildrim
et al14, no substantial changes in the phonon density of states has been observed with the
lowering of temperature from 200 to 7 K. While this is contrary to the present observations,
this may be pointing to the sensitivity of infrared absorption measurements to pick up small
changes in the mode frequencies with the lowering of temperature. We also note that while
we have seen a small softening of the 333 cm−1 mode, there is no corresponding change in
the width, which is expected to be modified with the appearence of electronic energy gap in
the superconducting phase24.
V. CONCLUSIONS
To summarise, through infrared absorption measurements, optic modes in MgB2 have
been identified. Infrared modes are seen at 333 and 387 cm−1, in accordance with theoretical
calculations6–9. While the present experiments have been carried out on MgB2 sample
characterised by sharp diffraction peaks and superconducting transition, it is noted that
the infrared absorption shows broad features that can be accounted by invoking disorder
and the consequent relaxation of momentum selection rule. The broad band centred at 485
cm−1, has been identified with the peak in the phonon density of states and additional broad
features corresponding to combination modes are also seen in the present experiments. In
effect, the measured absorption spectrum is an indication of the phonon density of states
as sampled by the infrared absorption. These optic modes in the far infrared range exhibit
interesting temperature dependence involving a softening below ∼ 100 K. The implications
7
of this on a possible structural anomaly needs to be investigated.
It is seen that the infrared modes at 333 and 387 cm−1 are characterised by a widths of
∼ 40 cm−1, which is considerably smaller than the width of the Raman mode15–17∼ 200
cm−1. This may be taken as an evidence for the strong electron phonon interaction with
the E2g mode, as has been suggested by theoretical calculations7,8. However, given that in
this system disorder and dispersion effects seem to play a considerable role, to dileneate the
electronic contribution to the width and to estimate the electron phonon interaction from
the measured widths, using Allen formula25, experiments need to be carried out on single
crystals of MgB2. This will also help to clarify the possible role, if any, of disorder on the
superconductivity in MgB2.
VI. ACKNOWLEDGEMENTS
The authors thank Prof. A.K. Sood for discussions.
8
FIGURES
0 20 40 60
Dia
ma
gn
etic s
ign
al
Temperature (K)
20 30 40 50 60 70
*
*
11
110
2
11
0
00
2
10
1
10
0
00
1
MgB2
In
ten
sity
2θ ( Degrees)
B
FIG. 1. X-ray diffraction pattern of MgB2 indexed to hexagonal P6/mmm structure. The
impurity lines due to MgO are indicated by asterix. Also shown is the diffraction pattern of
crystalline B to indicate that no B features are discernable in the diffraction pattern of MgB2. The
inset shows the superconducting transition at 39 K.
9
300 400 500 600
54
2
63
3
59
2
48
5
38
7
33
3
Wavenumber (cm-1)
(b)
MgB2
5 K
297 K
300 400 500 600
0.2
0.4
0.6
0.8
1.0
1.2
1.4
1.6
(a)
5 K
297 K
46
7
B
MgB2
Ab
so
rba
nce
FIG. 2. Panel (a) shows the absorption spectrum of MgB2 at 297 and 5 K respectively. Also
shown are the absorption spectra of the crystalline B. Panel (b) shows the fits of the absorption
spectrum at 297 K and 5 K in terms of sum of six Gaussians and a linear background.
10
400 800 1200 1600 20000.0
0.5
1.0
1.5 16
35
14
42
10
40
48
5
(a)
MgB2
(b)
Amor.B
Cryst.B
Wavenumber (cm-1)
Ab
so
rba
nce
50 100 150 200 250
Energy (meV)
FIG. 3. Mid-infrared absorption spectrum of superconducting MgB2 (a) synthesised from crys-
talline B, and (b) from amorphous B. For comparison, the absorption spectra of the starting
amorphous and crystalline B are also shown. The absorption spectrum of MgB2 is characterised
by broad absorption bands at 485, 1040, 1442 and 1635 cm−1.
11
0 75 150 225 300
332
334
336
MgB2
ω (
cm
-1)
0 75 150 225 300
25
30
35
40
45
50
FW
HM
(cm
-1)
0 75 150 225 300384
386
388
390
392
0 75 150 225 30030
35
40
45
50
55
60
TEMPERATURE (K)
0 75 150 225 300484
486
488
490
492
0 75 150 225 30090
100
110
120
130
140
FIG. 4. Temperature dependence of the frequency and width of the modes at 333, 387 and 485
cm−1. The lines are guide to the eye, and the arrow corresponds to the superconducting transition.
Notice the softening of the infrared modes below ∼100K and a distinctive softening below Tc for
the 333 cm−1 mode.
12
0 75 150 225 300538
540
542
544
546
TEMPERATURE (K)
ω (
cm
-1)
0 75 150 225 3005
10
15
20
25
FW
HM
(cm
-1)
0 75 150 225 300630
632
634
636
638
0 75 150 225 30010
15
20
25
30
0 75 150 225 300590
592
594
596
0 75 150 225 30030
40
50
60
FIG. 5. Temperature dependence of the frequency and width of the modes at 542, 594 and 634
cm−1. In contrast to the modes shown in Fig.4, these show a regular hardening behaviour with
the lowering of temperature. The filled squares are the mode frequency and width for crystalline
B. The lines are guide to the eye.
13
REFERENCES
1 J. Nagamutsu, N. Nagakawa, T. Muranaka, Y. Zenitani, and J. Akimitsu, Nature 410, 63
(2001).
2 S.L. Bud’ko, G. Lapertot, C. Petrovic, C.E.Cunningham, N. Anderson and P.C. Canfield,
Phys. Rev. Lett. 86, 1877 (2001).
3 H. Schmidt, J.F. Zasadzinski, K.E. Gray and D.G. Hinks, cond-mat / 0102389; G. Kara-
petrov, M. Iavarone, W.K. Kwok, G.W. Crabtree and D.G. Hinks, cond-mat /0102312
4 B. Gorshunov, C.A. Kuntscher, P. Haas, M. Dressel, F.P. Mena, A.B. Kuz’menko, T.
Muranaka and J. Akimitsu, cond-mat / 0103164
5 B. Lorenz, R.L. Meng and C.W. Chu, cond-mat / 0102264
6 J. Kortus, I.I. Mazin, K.D. Balaschenko, V.P. Antropov, and L.L. Boyer, cond-mat /
0101446
7 J.M. An and W.E. Pickett, cond-mat / 0102391
8 Y. Kong, O.V. Dolgov, O. Jepsen and O.K. Andersen, cond-mat / 0102499
9 G. Satta, G. Profeta, F. Bernardini, A. Continenza, and S. Massida, cond-mat / 0102358
10 J.E. Hirch, Cond-mat /0102115
11 G. Baskaran, Cond-mat /0103308
12 R. Osborne, E.A. Goremychkin, A.I. Kolesnikov, and D.G. Hinks, Cond-mat /0103064
13 T.J. Sato, K. Shibata, and Y. Takano, cond-mat / 0102468
14 T. Yildrim, O. Gulseren, J.W. Lynn, C.M. Brown, T.J. Udovic, H.Z. Qing, N. Rogado,
K.A. Regan, M.A. Hayward, J.S. Slusky, T. He, M.K. Haas, P. Khalifah, K. Inumaru and
R,J, Cava, Cond-mat /0103469
15 K.P. Bohnen, R. Heid and B. Renker, cond-mat / 0103319
14
16 X.K. Chen, M.J. Konstantinovic, J.C. Irwin, D.D. Lawriem and J.P. Franck, cond-mat /
0104005
17 A.F. Goncharov, V.V. Struzhkin, J. Hu, R.J. Hemley, H.K. Mao, G. Lapertot, S.L. Budko,
and P.C. Canfield, cond-mat / 0104042
18 J.D. Jorgensen D.G. Hinks and S. Short, cond-mat / 0103069
19 N. Nogi, S. Tanaka, T. Noda, and T. Hirata, Solid State Commun. 111, 447 (1999)
20 C.P. Talley, L.E. Line, Jr and Q.D. Overman, Jr, in Boron, Synthesis, Structure and
Properties, Ed. J.A. Kohn, W.F. Nye, and G.K. Gaule, (Plenum, New York, 1960), p. 94.
21 A. Bharathi et al (to be published)
22 S.K. Sinha and B.N. Harmon, in ” Superconductivity in d and f band metals”, Ed. D.H,
Douglass (Plenum, Newyork, 1976), p. 269
23 J.S. Slusky, N. Rogado, K.W. Reagan, M.A. Hayward, P. Khalifah, T. He, K. Inumark,
S. Loureiro, M.K. Haas, H.W. Zandbergen and R.J. Cava, Nature, 410, 343 (2001)
24 J.D. Axe and G. Shirane, Phys. Rev. B 8, 1965 (1973)
25 P.B. Allen, Solid State Commun. 14, 937 (1974).
15
Related Documents


