April 14, 2022 1 Rating: ACCUMULATE | CMP: Rs1,749 | TP: Rs1,899 Margin pressure overpowering revenue growth Quick Pointers: Positive surprise in revenue guidance (13-15% YoY CC) and strong headcount addition (~22K, 7.5% QoQ, 21%YoY) indicate strength in demand EBIT margin guidance reduced to 21-23% for FY23 (vs 22-24% for FY22) We cut Infy’s rating to Accumulate from Buy and DCF based target price to Rs. 1899 (earlier: Rs.2204) as we cut EPS estimates by 10.6%/8.2% for FY23/24E led by ~100-130bps cut in EBIT margins, lower than expected exit revenue growth rate, and increase in risk free rate to 7.2% (earlier: 6.8%). EBIT margin guidance of 21-23% for FY23 vs cons expectations of 22-24% came as negative surprise as it is below pre-covid levels (23%+ over FY17-19). Strong revenue guidance of 13-15% YoY CC for FY23 (vs cons expectations of 12-14%) despite low TTM TCV of $9.5 bn (vs $14.1 bn last year) led by largest ever large deal pipeline, strong client metrics and net new wins (40% in FY22) indicate Infy’s ability to capitalize strong demand environment. We have already baked in 13.8% YoY USD growth for FY23, however negative surprise in margins can be a drag on FY23 EPS. Infy has already reported weak exit EBIT margins of 21.6% in Q4 (-200bps QoQ). Lower than expected EBIT margin guidance of 21-23% for FY23 factors in headwinds from supply side cost pressures, return of travel and facility costs, investments in building deeper digital capabilities and potential drop in utilization levels. We assign DCF based TP of INR 1899 (earlier: 2204) with implied target multiple of 28x on FY24 EPS (earlier: 30x). Infy is currently trading at 30x/26x on earnings of INR 57.8/68.4 for FY23/24E respectively with revenue CAGR of 12.6% and EPS CAGR of 14.1% over FY22-24E. Big miss in Q4 revenue: Infy reported revenue of $4,280 mn, 1.2% QoQ CC (Ple: 3%, Cons: 3%), 0.2% QoQ USD (Ple: 2.6%, Cons: 2.6%). Weakness in growth was due to lower calendar working days, Covid leaves in Jan, contractual provision taken for one client (likely to reverse in future) and sharp sequential decline in Life Sciences vertical (-11.4% QoQ USD) due to several one-time deals in this vertical in Q3FY22. Full year FY22 revenue growth of 19.7% YoY CC was within guidance range of 19.5-20% YoY CC Healthy deal momentum and strong pipeline led to strong revenue guidance: Infy reported healthy deal TCV of $2.3 Bn, 7% YoY, -11% QoQ. Management gave strong revenue guidance of 13-15% YoY CC for FY23 (vs cons expectations of 12-14%) despite lower TTM TCV of $9.5 bn compared to $14.1 bn last year led by – 1) strong net new TCV of 48% in FY22, 2) largest pipeline in terms of large deals, 3) potential client mining opportunities (6 clients added in $100 mn bucket and 5 in $50 mn range in FY22) and 4) robust deal conversion and market share gains. Infosys (INFO IN) April 14, 2022 Q4FY22 Result Update ☑ Change in Estimates | ☑ Target | ☑ Reco Change in Estimates Current Previous FY23E FY24E FY23E FY24E Rating ACCU MUL ATE BUY Target Price 1,899 2,204 Sales (Rs. m) 14,10, 446 15,92, 987 14,30, 767 16,14,398 % Chng. (1.4 ) (1.3 ) EBITDA (Rs. m) 3,47,1 73 3,96,3 40 3,63,0 34 4,09,535 % Chng. (4.4 ) (3.2 ) EPS (Rs.) 57.8 68.4 64.7 74.5 % Chng. (10. 6) (8.2 ) Key Financials - Consolidated Y/e Mar FY21 FY22 FY23E FY24E Sales (Rs. bn) 1,005 1,216 1,410 1,593 EBITDA (Rs. bn) 279 315 347 396 Margin (%) 27.8 25.9 24.6 24.9 PAT (Rs. bn) 195 221 243 287 EPS (Rs.) 45.9 52.5 57.8 68.4 Gr. (%) 17.3 14.6 10.1 18.3 DPS (Rs.) 32.4 37.1 24.0 24.0 Yield (%) 1.9 2.1 1.4 1.4 RoE (%) 27.3 29.0 31.4 30.6 RoCE (%) 34.5 36.7 40.2 38.4 EV/Sales (x) 7.1 5.9 5.0 4.3 EV/EBITDA (x) 25.6 22.6 20.4 17.1 PE (x) 38.1 33.3 30.2 25.6 P/BV (x) 9.7 9.7 9.3 6.8 Key Data INFY.BO | INFO IN 52-W High / Low Rs.1,954 / Rs.1,311 Sensex / Nifty 58,339 / 17,476 Market Cap Rs.7,356bn/ $ 96,552m Shares Outstanding 4,207m 3M Av g. Daily Value Rs.13240.41m Shareholding Pattern (%) Promoter’s 13.46 Foreign 34.17 Domestic Institution 15.31 Public & Others 37.06 Promoter Pledge (Rs bn) - Stock Performance (%) 1M 6M 12M Absolute (4.0) 2.3 25.2 Relativ e (8.6) 6.5 4.1 Aditi Patil [email protected] | 91-22-66322381

Welcome message from author
This document is posted to help you gain knowledge. Please leave a comment to let me know what you think about it! Share it to your friends and learn new things together.
Transcript
April 14, 2022 1
Rating: ACCUMULATE | CMP: Rs1,749 | TP: Rs1,899
Margin pressure overpowering revenue growth
Quick Pointers:
Positive surprise in revenue guidance (13-15% YoY CC) and strong headcount
addition (~22K, 7.5% QoQ, 21%YoY) indicate strength in demand
EBIT margin guidance reduced to 21-23% for FY23 (vs 22-24% for FY22)
We cut Infy’s rating to Accumulate from Buy and DCF based target price to
Rs. 1899 (earlier: Rs.2204) as we cut EPS estimates by 10.6%/8.2% for
FY23/24E led by ~100-130bps cut in EBIT margins, lower than expected exit
revenue growth rate, and increase in risk free rate to 7.2% (earlier: 6.8%). EBIT
margin guidance of 21-23% for FY23 vs cons expectations of 22-24% came as
negative surprise as it is below pre-covid levels (23%+ over FY17-19).
Strong revenue guidance of 13-15% YoY CC for FY23 (vs cons expectations
of 12-14%) despite low TTM TCV of $9.5 bn (vs $14.1 bn last year) led by
largest ever large deal pipeline, strong client metrics and net new wins (40%
in FY22) indicate Infy’s ability to capitalize strong demand environment. We
have already baked in 13.8% YoY USD growth for FY23, however negative
surprise in margins can be a drag on FY23 EPS. Infy has already reported
weak exit EBIT margins of 21.6% in Q4 (-200bps QoQ). Lower than expected
EBIT margin guidance of 21-23% for FY23 factors in headwinds from supply
side cost pressures, return of travel and facility costs, investments in building
deeper digital capabilities and potential drop in utilization levels.
We assign DCF based TP of INR 1899 (earlier: 2204) with implied target
multiple of 28x on FY24 EPS (earlier: 30x). Infy is currently trading at 30x/26x
on earnings of INR 57.8/68.4 for FY23/24E respectively with revenue CAGR of
12.6% and EPS CAGR of 14.1% over FY22-24E.
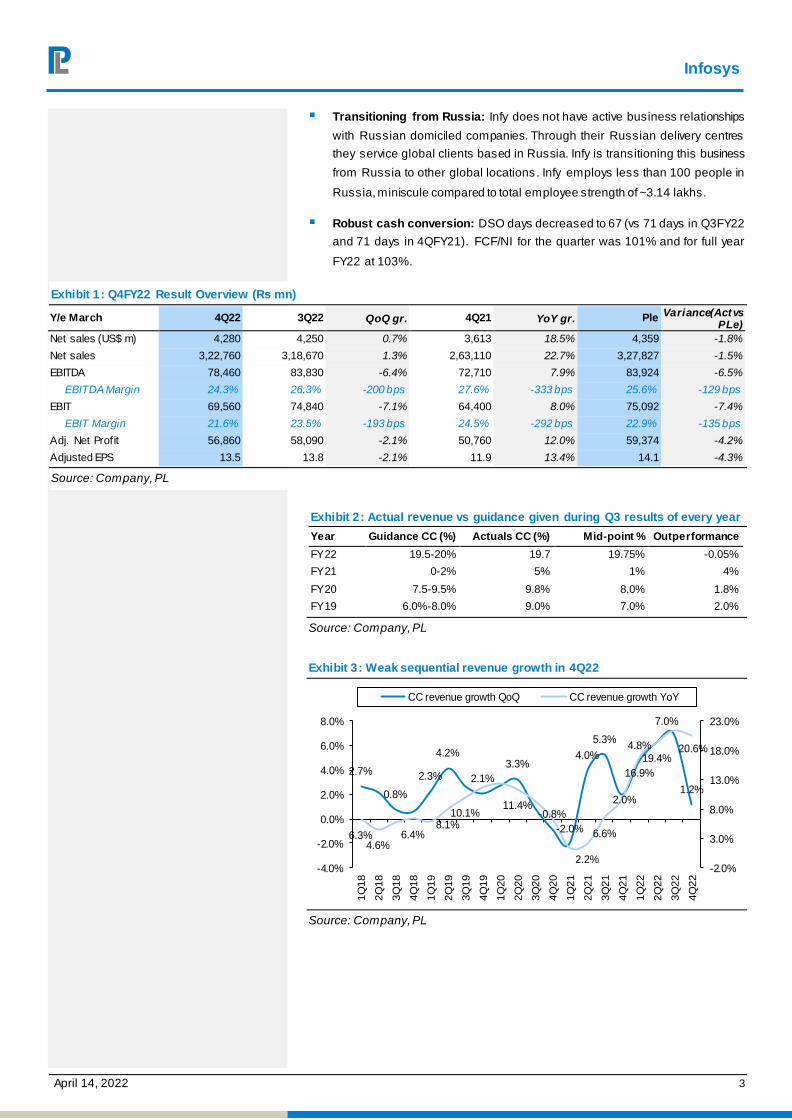
Big miss in Q4 revenue: Infy reported revenue of $4,280 mn, 1.2% QoQ CC
(Ple: 3%, Cons: 3%), 0.2% QoQ USD (Ple: 2.6%, Cons: 2.6%). Weakness in
growth was due to lower calendar working days, Covid leaves in Jan,
contractual provision taken for one client (likely to reverse in future) and sharp
sequential decline in Life Sciences vertical (-11.4% QoQ USD) due to several
one-time deals in this vertical in Q3FY22. Full year FY22 revenue growth of
19.7% YoY CC was within guidance range of 19.5-20% YoY CC
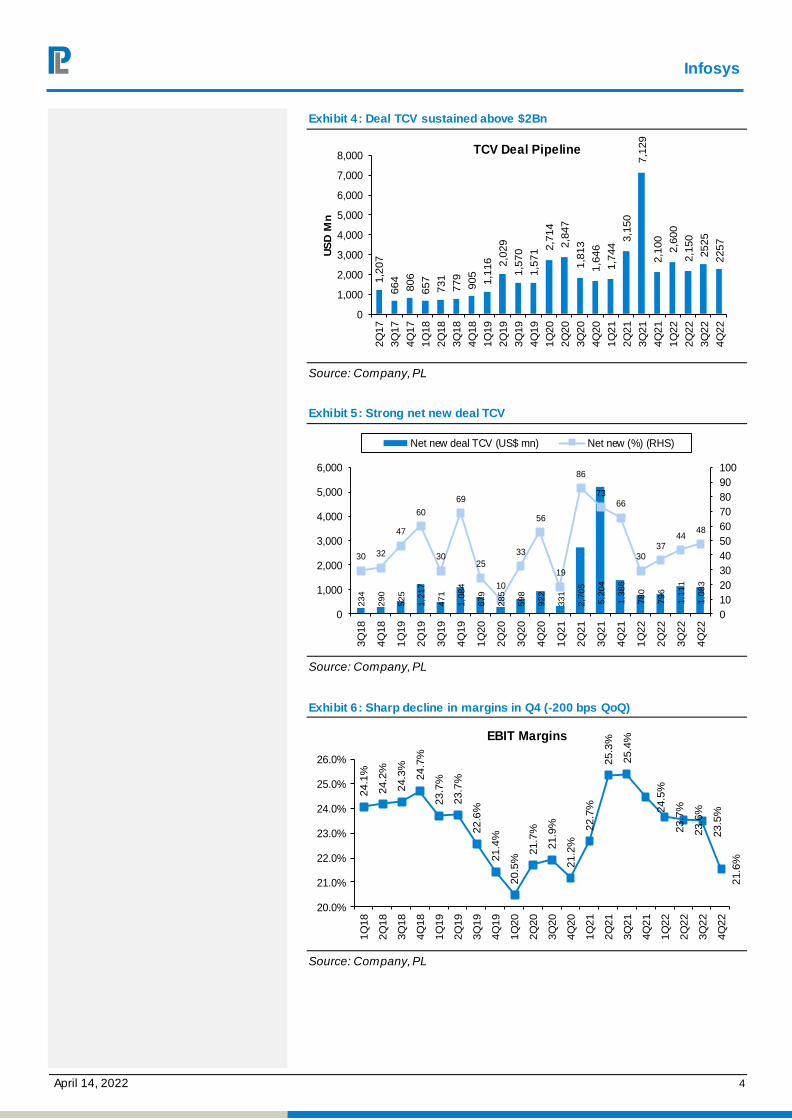
Healthy deal momentum and strong pipeline led to strong revenue
guidance: Infy reported healthy deal TCV of $2.3 Bn, 7% YoY, -11% QoQ.
Management gave strong revenue guidance of 13-15% YoY CC for FY23 (vs
cons expectations of 12-14%) despite lower TTM TCV of $9.5 bn compared to
$14.1 bn last year led by – 1) strong net new TCV of 48% in FY22, 2) largest
pipeline in terms of large deals, 3) potential client mining opportunities (6 clients
added in $100 mn bucket and 5 in $50 mn range in FY22) and 4) robust deal
conversion and market share gains.
Infosys (INFO IN)
April 14, 2022
Q4FY22 Result Update
☑ Change in Estimates | ☑ Target | ☑ Reco
Change in Estimates
Current Previous
FY23E FY24E FY23E FY24E
Rating ACCU MUL ATE BUY
Target Price 1,899 2,204
Sales (Rs. m) 14,10,446 15,92,987 14,30,767 16,14,398
% Chng. (1.4 ) (1.3 )
EBITDA (Rs. m) 3,47,173 3,96,340 3,63,034 4,09,535
% Chng. (4.4 ) (3.2 )
EPS (Rs.) 57.8 68.4 64.7 74.5
% Chng. (10.6) (8.2 )
Key Financials - Consolidated
Y/e Mar FY21 FY22 FY23E FY24E
Sales (Rs. bn) 1,005 1,216 1,410 1,593
EBITDA (Rs. bn) 279 315 347 396
Margin (%) 27.8 25.9 24.6 24.9
PAT (Rs. bn) 195 221 243 287
EPS (Rs.) 45.9 52.5 57.8 68.4
Gr. (%) 17.3 14.6 10.1 18.3
DPS (Rs.) 32.4 37.1 24.0 24.0
Yield (%) 1.9 2.1 1.4 1.4
RoE (%) 27.3 29.0 31.4 30.6
RoCE (%) 34.5 36.7 40.2 38.4
EV/Sales (x) 7.1 5.9 5.0 4.3
EV/EBITDA (x) 25.6 22.6 20.4 17.1
PE (x) 38.1 33.3 30.2 25.6
P/BV (x) 9.7 9.7 9.3 6.8
Key Data INFY.BO | INFO IN
52-W High / Low Rs.1,954 / Rs.1,311
Sensex / Nifty 58,339 / 17,476
Market Cap Rs.7,356bn/ $ 96,552m
Shares Outstanding 4,207m
3M Av g. Daily Value Rs.13240.41m
Shareholding Pattern (%)
Promoter’s 13.46
Foreign 34.17
Domestic Institution 15.31
Public & Others 37.06
Promoter Pledge (Rs bn) -
Stock Performance (%)
1M 6M 12M
Absolute (4.0) 2.3 25.2
Relativ e (8.6) 6.5 4.1
Aditi Patil
[email protected] | 91-22-66322381
Infosys
April 14, 2022 2
Big miss in Q4 margins: EBIT margin of 21.6%, declined by 200bps QoQ
(PLe: 22.9%, Cons: 23.2%) led by headwinds of - 1) 1.6% impact of lower
calendar working days and contractual provision, 2) 0.7% due to drop in
utilization (87%, -150bps QoQ), 3) 1% due to visa costs, third party costs and
absence of one-off benefits present in Q3 partially offset by salary related
benefit (1.1%) because of lower working days, leave costs etc. FY23 margins
stood at 23% (vs guidance range of 22-24%)
Negative surprise in margin guidance: Margin guidance downgraded 21-
23% for FY23 vs cons expectations of 22-24% factoring in headwinds from -1)
supply side pressures due to elevated attrition levels, 2) return of travel and
facility costs, 3) investments in building deeper digital capabilities, highly skilled
tech talent and sales and marketing to continue gaining market share, 4) further
drop in utilization levels (comfortable levels of 85% vs current 87%). These
headwinds will be partially offset by pyramid optimization, value led pricing
gains and operating efficiencies.
Quarterly attrition dropped by 500bps QoQ: LTM IT services attrition
increased to 27.7%, +220bps QoQ, +1680 bps YoY. However, quarterly
attrition is down 500bps QoQ. Quarterly attrition may not inch further down in
near term due to wage hike cycle in Q1FY23. We expect supply side cost
pressures to start easing in H2FY23.
Highest ever headcount addition: Infy continued its aggressive hiring with
highest ever net headcount addition of 21,948, 7.5% QoQ, 21%YoY. (vs avg
net addition 10,816 in last 3 quarters). Infy added 85K freshers (27% of FY22
total headcount) in FY22 and have initial target to add 50K in FY23 which can
be ramped up depending on demand momentum.
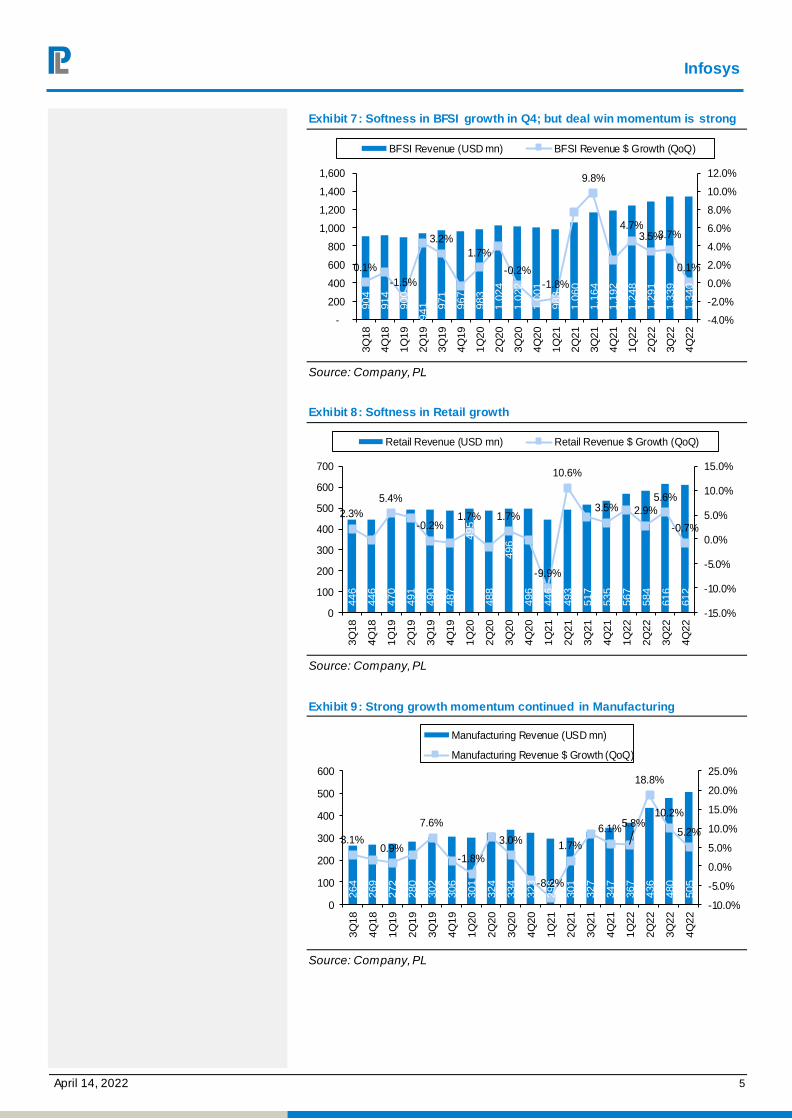
Strong demand across all verticals:
BFSI was flat QoQ, but Infy won 8 large deals in this segment in Q4 and
27 in FY22. Large deal pipeline is healthy in BFSI across all markets.
In Retail (-0.7% QoQ) demand is coming from integrated outsourcing
deals, e-commerce, supply chain, revenue growth initiatives. Infy won 16
large deals in Retail in FY22.
In E&U there is strong demand for digital transformation, CX, operational
efficiency improvement initiatives with 4 large deals in Q4 and 18 in FY22.
Infy won 6 large deals in Q4 and 13 in FY22 in Manufacturing with strong
demand from engineering, IoT, ERP, cloud, digital transformation.
In Communication demand is strong in areas of CX, network
simplification, time to market, integrated data etc. In HiTech clients are
spending on edge computing, commerce, cybersecurity etc.
In Life Sciences there is strong traction in digital transformation, clinical
trials reducing time, digital drug engagement etc.
Digital revenues grew by 2% QoQ
and 36.2% YoY (in USD terms) and
now account to 59.2% of total
revenue (vs 58.5% in Q3FY22)
Return to office will bring back travel and facility expenses. Infy has a three
phased plan to start working from
office in a phased manner. Currently
95% people working from home
Infosys
April 14, 2022 3
Transitioning from Russia: Infy does not have active business relationships
with Russian domiciled companies. Through their Russian delivery centres
they service global clients based in Russia. Infy is transitioning this business
from Russia to other global locations . Infy employs less than 100 people in
Russia, miniscule compared to total employee strength of ~3.14 lakhs.
Robust cash conversion: DSO days decreased to 67 (vs 71 days in Q3FY22
and 71 days in 4QFY21). FCF/NI for the quarter was 101% and for full year
FY22 at 103%.
Exhibit 1: Q4FY22 Result Overview (Rs mn)
Y/e March 4Q22 3Q22 QoQ gr. 4Q21 YoY gr. Ple Variance(Act vs PLe)
Net sales (US$ m) 4,280 4,250 0.7% 3,613 18.5% 4,359 -1.8%
Net sales 3,22,760 3,18,670 1.3% 2,63,110 22.7% 3,27,827 -1.5%
EBITDA 78,460 83,830 -6.4% 72,710 7.9% 83,924 -6.5%
EBITDA Margin 24.3% 26.3% -200 bps 27.6% -333 bps 25.6% -129 bps
EBIT 69,560 74,840 -7.1% 64,400 8.0% 75,092 -7.4%
EBIT Margin 21.6% 23.5% -193 bps 24.5% -292 bps 22.9% -135 bps
Adj. Net Profit 56,860 58,090 -2.1% 50,760 12.0% 59,374 -4.2%
Adjusted EPS 13.5 13.8 -2.1% 11.9 13.4% 14.1 -4.3%
Source: Company, PL
Exhibit 2: Actual revenue vs guidance given during Q3 results of every year
Year Guidance CC (%) Actuals CC (%) Mid-point % Outperformance
FY22 19.5-20% 19.7 19.75% -0.05%
FY21 0-2% 5% 1% 4%
FY20 7.5-9.5% 9.8% 8.0% 1.8%
FY19 6.0%-8.0% 9.0% 7.0% 2.0%
Source: Company, PL
Exhibit 3: Weak sequential revenue growth in 4Q22
2.7%
0.8%
2.3%
4.2%
2.1%
3.3%
-0.8%
-2.0%
4.0%
5.3%
2.0%
4.8%
7.0%
1.2%
6.3%4.6%
6.4%8.1%
10.1%11.4%
2.2%
6.6%
16.9%
19.4%20.6%
-2.0%
3.0%
8.0%
13.0%
18.0%
23.0%
-4.0%
-2.0%
0.0%
2.0%
4.0%
6.0%
8.0%
1Q
18
2Q
18
3Q
18
4Q
18
1Q
19
2Q
19
3Q
19
4Q
19
1Q
20
2Q
20
3Q
20
4Q
20
1Q
21
2Q
21
3Q
21
4Q
21
1Q
22
2Q
22
3Q
22
4Q
22
CC revenue growth QoQ CC revenue growth YoY
Source: Company, PL
Infosys
April 14, 2022 4
Exhibit 4: Deal TCV sustained above $2Bn
1,2
07
664
806
657
731
779
905
1,1
16 2,0
29
1,5
70
1,5
71 2
,714
2,8
47
1,8
13
1,6
46
1,7
44 3
,150
7,1
29
2,1
00
2,6
00
2,1
50
2525
2257
0
1,000
2,000
3,000
4,000
5,000
6,000
7,000
8,000
2Q
17
3Q
17
4Q
17
1Q
18
2Q
18
3Q
18
4Q
18
1Q
19
2Q
19
3Q
19
4Q
19
1Q
20
2Q
20
3Q
20
4Q
20
1Q
21
2Q
21
3Q
21
4Q
21
1Q
22
2Q
22
3Q
22
4Q
22
US
D M
n
TCV Deal Pipeline
Source: Company, PL
Exhibit 5: Strong net new deal TCV
23
4
29
0
52
5
1,2
17
47
1
1,0
84
67
9
28
5
59
8
92
2
33
1
2,7
05
5,2
04
1,3
86
78
0
79
6
1,1
11
1,0
83
30 32
47
60
30
69
25
10
33
56
19
86
7366
3037
4448
0
10
20
30
40
50
60
70
80
90
100
0
1,000
2,000
3,000
4,000
5,000
6,000
3Q
18
4Q
18
1Q
19
2Q
19
3Q
19
4Q
19
1Q
20
2Q
20
3Q
20
4Q
20
1Q
21
2Q
21
3Q
21
4Q
21
1Q
22
2Q
22
3Q
22
4Q
22
Net new deal TCV (US$ mn) Net new (%) (RHS)
Source: Company, PL
Exhibit 6: Sharp decline in margins in Q4 (-200 bps QoQ)
24.1
%
24.2
%
24.3
%
24.7
%
23.7
%
23.7
%
22.6
%
21.4
%
20.5
%
21.7
%
21.9
%
21.2
%
22.7
%
25.3
%
25.4
%
24.5
%
23.7
%
23.6
%
23.5
%
21.6
%
20.0%
21.0%
22.0%
23.0%
24.0%
25.0%
26.0%
1Q
18
2Q
18
3Q
18
4Q
18
1Q
19
2Q
19
3Q
19
4Q
19
1Q
20
2Q
20
3Q
20
4Q
20
1Q
21
2Q
21
3Q
21
4Q
21
1Q
22
2Q
22
3Q
22
4Q
22
EBIT Margins
Source: Company, PL
Infosys
April 14, 2022 5
Exhibit 7: Softness in BFSI growth in Q4; but deal win momentum is strong
904
914
900
941
971
967
983
1,0
24
1,0
22
1,0
01
983
1,0
60
1,1
64
1,1
92
1,2
48
1,2
91
1,3
39
1,3
40
0.1%
-1.5%
3.2%
1.7%
-0.2%
-1.8%
9.8%
4.7%3.5%3.7%
0.1%
-4.0%
-2.0%
0.0%
2.0%
4.0%
6.0%
8.0%
10.0%
12.0%
-
200
400
600
800
1,000
1,200
1,400
1,600
3Q
18
4Q
18
1Q
19
2Q
19
3Q
19
4Q
19
1Q
20
2Q
20
3Q
20
4Q
20
1Q
21
2Q
21
3Q
21
4Q
21
1Q
22
2Q
22
3Q
22
4Q
22
BFSI Revenue (USD mn) BFSI Revenue $ Growth (QoQ)
Source: Company, PL
Exhibit 8: Softness in Retail growth
446
446
470
491
490
487
495
488
496
496
446
493
517
535
567
584
616
612
2.3%
5.4%
-0.2%1.7% 1.7%
-9.9%
10.6%
3.5% 2.9%
5.6%
-0.7%
-15.0%
-10.0%
-5.0%
0.0%
5.0%
10.0%
15.0%
0
100
200
300
400
500
600
700
3Q
18
4Q
18
1Q
19
2Q
19
3Q
19
4Q
19
1Q
20
2Q
20
3Q
20
4Q
20
1Q
21
2Q
21
3Q
21
4Q
21
1Q
22
2Q
22
3Q
22
4Q
22
Retail Revenue (USD mn) Retail Revenue $ Growth (QoQ)
Source: Company, PL
Exhibit 9: Strong growth momentum continued in Manufacturing
264
269
272
280
302
306
301
324
334
323
296
301
327
347
367
436
480
505
3.1%0.9%
7.6%
-1.8%
3.0%
-8.2%
1.7%
6.1%5.8%
18.8%
10.2%
5.2%
-10.0%
-5.0%
0.0%
5.0%
10.0%
15.0%
20.0%
25.0%
0
100
200
300
400
500
600
3Q
18
4Q
18
1Q
19
2Q
19
3Q
19
4Q
19
1Q
20
2Q
20
3Q
20
4Q
20
1Q
21
2Q
21
3Q
21
4Q
21
1Q
22
2Q
22
3Q
22
4Q
22
Manufacturing Revenue (USD mn)
Manufacturing Revenue $ Growth (QoQ)
Source: Company, PL

Infosys
April 14, 2022 6
Exhibit 10: Subcontracting expenses remain at elevated levels
10,6
10
10,9
00
10,4
10
11,0
70
12,9
10
15,2
30
16,1
90
16,0
10
16,4
00
16,5
10
17,2
10
17,0
40
16,2
60
16,3
40
18,3
90
19,8
50
24,5
40
30,5
40
35,1
10
35,8
80
6.2% 5.9%6.7%
7.6% 7.5% 7.5%6.9% 6.7%
7.5%7.7%
8.8%
10.3%11.1%
0.0%
2.0%
4.0%
6.0%
8.0%
10.0%
12.0%
0
4,000
8,000
12,000
16,000
20,000
24,000
28,000
32,000
36,000
40,000
1Q
18
2Q
18
3Q
18
4Q
18
1Q
19
2Q
19
3Q
19
4Q
19
1Q
20
2Q
20
3Q
20
4Q
20
1Q
21
2Q
21
3Q
21
4Q
21
1Q
22
2Q
22
3Q
22
4Q
22
Subcontracting Expenses As a % of sales
Source: Company, PL
Exhibit 11: Changes in Estimates
FY23E FY24E
USD revenues (US$ m)
- New 18,558 20,688
- Old 18,826 20,966
Change (%) -1.4% -1.3%
EBIT Margin
- New 22.0% 22.6%
- Old 23.4% 23.5%
Change (%) -134 bps -94 bps
Recurring EPS - Fully diluted (Rs)
- New 57.8 68.4
- Old 64.6 74.5
Change (%) -10.6% -8.2%
Source: PL
Exhibit 12: Infosys One year forward PE
30.4
33.5
31.2
10.0
15.0
20.0
25.0
30.0
35.0
Apr-
10
Oct-10
Apr-
11
Oct-11
Apr-
12
Oct-12
Apr-
13
Oct-13
Apr-
14
Oct-14
Apr-
15
Oct-15
Apr-
16
Oct-16
Apr-
17
Oct-17
Apr-
18
Oct-18
Apr-
19
Oct-19
Apr-
20
Oct-20
Apr-
21
Oct-21
Apr-
22
P/E Mean Mean + Std Dev Mean - Std Dev
Source: Company, PL

Infosys
April 14, 2022 7
Exhibit 13: TCS One Year Forward P/E chart
12.3
16.2
23.7 26.8
19.3
28.5
33.4
30.4
10.0
15.0
20.0
25.0
30.0
35.0
40.0
Apr-
10
Oct-10
Apr-
11
Oct-11
Apr-
12
Oct-12
Apr-
13
Oct-13
Apr-
14
Oct-14
Apr-
15
Oct-15
Apr-
16
Oct-16
Apr-
17
Oct-17
Apr-
18
Oct-18
Apr-
19
Oct-19
Apr-
20
Oct-20
Apr-
21
Oct-21
Apr-
22
P/E Mean Mean + Std Dev
Mean - Std Dev Mean + 2SD
Source: Company, PL
Exhibit 14: Geography-wise revenues
(US$ m) 4Q22 3Q22 QoQ gr. 4Q21 YoY gr.
North America 2,628 2,627 0.1% 2,226 18.1%
Europe 1,079 1,058 1.9% 882 22.3%
India 137 128 7.4% 108 26.4%
Rest of World 437 438 -0.3% 397 9.8%
Total 4,280 4,250 0.7% 3,613 18.5%
as % of Total
North America 61.4% 61.8% -40 bps 61.6% -20 bps
Europe 25.2% 24.9% 30 bps 24.4% 80 bps
India 3.2% 3.0% 20 bps 3.0% 20 bps
Rest of World 10.2% 10.3% -10 bps 11.0% -80 bps
Source: Company, PL
Exhibit 15: Vertical-wise revenues
4Q22 3Q22 QoQ gr. 4Q21 YoY gr.
Financial Services 1,340 1,339 0.1% 1,192 12.4%
Manufacturing 505 480 5.2% 347 45.6%
Communication Services 548 531 3.1% 434 26.4%
Retail CPG 612 616 -0.7% 535 14.5%
Life Sc & Healthcare 282 319 -11.4% 246 15.0%
Others 993 965 2.9% 860 15.5%
Total 4,280 4,250 0.7% 3,613 18.5%
as % of Total
Financial Services 31.3% 31.5% -20 bps 33.0% -170 bps
Manufacturing 11.8% 11.3% 50 bps 9.6% 220 bps
Communication Services 12.8% 12.5% 30 bps 12.0% 80 bps
Retail CPG 14.3% 14.5% -20 bps 14.8% -50 bps
Life Sc & Healthcare 6.6% 7.5% -90 bps 6.8% -20 bps
Others 23.2% 22.7% 50 bps 23.8% -60 bps
Source: Company, PL

Infosys
April 14, 2022 8
Exhibit 16: Client Metrics
4Q22 3Q22 QoQ gr. 4Q21 YoY gr.
Number of Clients
Active 1741 1,738 0.2% 1626 7.1%
Added during the period 110 111 -0.9% 130 -15.4%
Revenue concentration (US$ m)
Top 10 clients 830 859 -3.3% 661 25.6%
Top 25 clients 1,515 1,526 -0.7% 1,236 22.6%
Top 11-25 clients 685 667 2.6% 574 19.2%
Non Top 25 2,765 2,724 1.5% 2,377 16.3%
Total 4,280 4,250 0.7% 3,613 18.5%
Revenue concentration (%)
Top 10 clients 19.4% 20.2% -80 bps 18.3% 110 bps
Top 25 clients 35.4% 35.9% -50 bps 34.2% 120 bps
Account Receivables (days) 67 71 (4) 71 (4)
Source: Company, PL
Exhibit 17: Utilization inching downwards
4Q22 3Q22 QoQ gr. 4Q21 YoY gr.
Utilization (%)
Include Trainees 80.0% 82.7% -270 bps 82.2% -220 bps
Exclude Trainees 87.0% 88.5% -150 bps 87.7% -70 bps
Source: Company, PL
Exhibit 18: Consistent growth in digital revenues (59.2% revenue share)
Revenues by offering 4Q22 3Q22 QoQ gr. 4Q21 YoY gr.
Digital 59.2% 58.5% 70 bps 51.5% 770 bps
Core 40.8% 41.5% -70 bps 48.5% -770 bps
Revenue by offering ( $mn)
Digital 2,534 2,239 13.2% 1762 43.8%
Core 1,746 1,759 -0.7% 1754 -0.5%
Source: Company, PL
Infosys
April 14, 2022 9
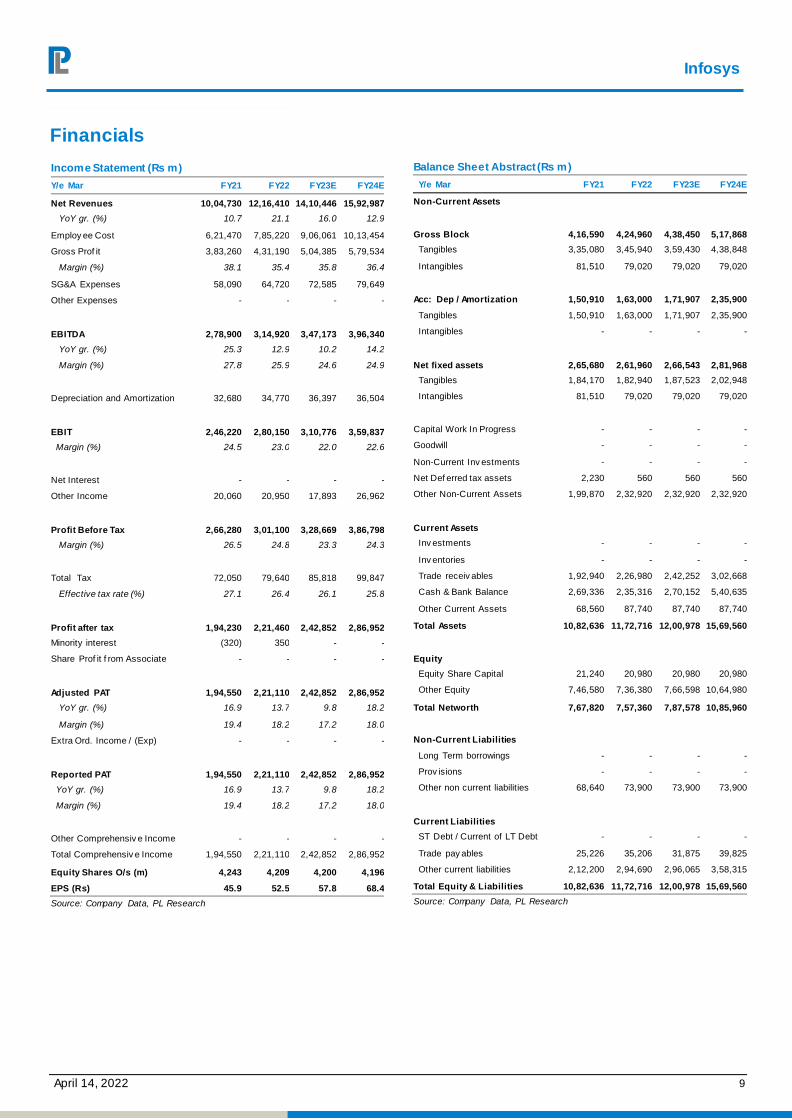
Financials Income Statement (Rs m)
Y/e Mar FY21 FY22 FY23E FY24E
Net Revenues 10,04,730 12,16,410 14,10,446 15,92,987
YoY gr. (%) 10.7 21.1 16.0 12.9
Employ ee Cost 6,21,470 7,85,220 9,06,061 10,13,454
Gross Prof it 3,83,260 4,31,190 5,04,385 5,79,534
Margin (%) 38.1 35.4 35.8 36.4
SG&A Expenses 58,090 64,720 72,585 79,649
Other Expenses - - - -
EBITDA 2,78,900 3,14,920 3,47,173 3,96,340
YoY gr. (%) 25.3 12.9 10.2 14.2
Margin (%) 27.8 25.9 24.6 24.9
Depreciation and Amortization 32,680 34,770 36,397 36,504
EBIT 2,46,220 2,80,150 3,10,776 3,59,837
Margin (%) 24.5 23.0 22.0 22.6
Net Interest - - - -
Other Income 20,060 20,950 17,893 26,962
Profit Before Tax 2,66,280 3,01,100 3,28,669 3,86,798
Margin (%) 26.5 24.8 23.3 24.3
Total Tax 72,050 79,640 85,818 99,847
Effective tax rate (%) 27.1 26.4 26.1 25.8
Profit after tax 1,94,230 2,21,460 2,42,852 2,86,952
Minority interest (320) 350 - -
Share Prof it f rom Associate - - - -
Adjusted PAT 1,94,550 2,21,110 2,42,852 2,86,952
YoY gr. (%) 16.9 13.7 9.8 18.2
Margin (%) 19.4 18.2 17.2 18.0
Extra Ord. Income / (Exp) - - - -
Reported PAT 1,94,550 2,21,110 2,42,852 2,86,952
YoY gr. (%) 16.9 13.7 9.8 18.2
Margin (%) 19.4 18.2 17.2 18.0
Other Comprehensiv e Income - - - -
Total Comprehensiv e Income 1,94,550 2,21,110 2,42,852 2,86,952
Equity Shares O/s (m) 4,243 4,209 4,200 4,196
EPS (Rs) 45.9 52.5 57.8 68.4
Source: Company Data, PL Research
Balance Sheet Abstract (Rs m)
Y/e Mar FY21 FY22 FY23E FY24E
Non-Current Assets
Gross Block 4,16,590 4,24,960 4,38,450 5,17,868
Tangibles 3,35,080 3,45,940 3,59,430 4,38,848
Intangibles 81,510 79,020 79,020 79,020
Acc: Dep / Amortization 1,50,910 1,63,000 1,71,907 2,35,900
Tangibles 1,50,910 1,63,000 1,71,907 2,35,900
Intangibles - - - -
Net fixed assets 2,65,680 2,61,960 2,66,543 2,81,968
Tangibles 1,84,170 1,82,940 1,87,523 2,02,948
Intangibles 81,510 79,020 79,020 79,020
Capital Work In Progress - - - -
Goodwill - - - -
Non-Current Inv estments - - - -
Net Def erred tax assets 2,230 560 560 560
Other Non-Current Assets 1,99,870 2,32,920 2,32,920 2,32,920
Current Assets
Inv estments - - - -
Inv entories - - - -
Trade receiv ables 1,92,940 2,26,980 2,42,252 3,02,668
Cash & Bank Balance 2,69,336 2,35,316 2,70,152 5,40,635
Other Current Assets 68,560 87,740 87,740 87,740
Total Assets 10,82,636 11,72,716 12,00,978 15,69,560
Equity
Equity Share Capital 21,240 20,980 20,980 20,980
Other Equity 7,46,580 7,36,380 7,66,598 10,64,980
Total Networth 7,67,820 7,57,360 7,87,578 10,85,960
Non-Current Liabilities
Long Term borrowings - - - -
Prov isions - - - -
Other non current liabilities 68,640 73,900 73,900 73,900
Current Liabilities
ST Debt / Current of LT Debt - - - -
Trade pay ables 25,226 35,206 31,875 39,825
Other current liabilities 2,12,200 2,94,690 2,96,065 3,58,315
Total Equity & Liabilities 10,82,636 11,72,716 12,00,978 15,69,560
Source: Company Data, PL Research

Infosys
April 14, 2022 10
Cash Flow (Rs m)
Y/e Mar FY21 FY22 FY23E FY24E Year
PBT 2,66,280 3,01,100 3,28,669 3,86,798
Add. Depreciation 32,680 34,770 36,397 36,504
Add. Interest - - - -
Less Financial Other Income 20,060 20,950 17,893 26,962
Add. Other - - - -
Op. prof it bef ore WC changes 2,98,960 3,35,870 3,65,066 4,23,302
Net Changes-WC (63,464) (28,950) 9,201 (12,474)
Direct tax (72,050) (79,640) (85,818) (99,847)
Net cash from Op. activities 1,63,446 2,27,280 2,88,449 3,10,982
Capital expenditures (30,940) (37,250) (93,350) (51,929)
Interest / Div idend Income - - - -
Others - - - -
Net Cash from Invt. activities (30,940) (37,250) (93,350) (51,929)
Issue of share cap. / premium 3,950 (1,920) - -
Debt changes - - - -
Div idend paid (1,37,487) (1,56,241) (1,00,602) (1,00,602)
Interest paid - - - -
Others 47,757 (70,949) (1,12,031) 1,12,031
Net cash from Fin. activities (85,780) (2,29,110) (2,12,633) 11,430
Net change in cash 46,726 (39,080) (17,534) 2,70,483
Free Cash Flow 1,32,506 1,90,030 1,95,100 2,59,053
Source: Company Data, PL Research
Quarterly Financials (Rs m)
Y/e Mar Q1FY22 Q2FY22 Q3FY22 Q4FY22
Net Revenue 2,78,960 2,96,020 3,18,670 3,22,760
YoY gr. (%) 17.9 20.5 22.9 22.7
Raw Material Expenses 1,76,770 1,89,470 2,05,160 2,13,820
Gross Prof it 1,02,190 1,06,550 1,13,510 1,08,940
Margin (%) 36.6 36.0 35.6 33.8
EBITDA 74,320 78,310 83,830 78,460
YoY gr. (%) 21.4 10.6 13.1 7.9
Margin (%) 26.6 26.5 26.3 24.3
Depreciation / Depletion 8,290 8,590 8,990 8,900
EBIT 66,030 69,720 74,840 69,560
Margin (%) 23.7 23.6 23.5 21.6
Net Interest - - - -
Other Income 5,730 4,760 4,590 5,870
Profit before Tax 71,760 74,480 79,430 75,430
Margin (%) 25.7 25.2 24.9 23.4
Total Tax 19,750 20,200 21,210 18,480
Effective tax rate (%) 27.5 27.1 26.7 24.5
Profit after Tax 52,010 54,280 58,220 56,950
Minority interest 60 70 130 90
Share Prof it f rom Associates - - - -
Adjusted PAT 52,070 54,350 58,350 57,040
YoY gr. (%) 23.0 12.2 11.5 12.3
Margin (%) 18.7 18.4 18.3 17.7
Extra Ord. Income / (Exp) - - - -
Reported PAT 52,070 54,350 58,350 57,040
YoY gr. (%) 23.0 12.2 11.5 12.3
Margin (%) 18.7 18.4 18.3 17.7
Other Comprehensiv e Income - - - -
Total Comprehensive Income 52,070 54,350 58,350 57,040
Av g. Shares O/s (m) 4,255 4,219 4,199 4,200
EPS (Rs) 12.2 12.9 13.9 13.6
Source: Company Data, PL Research
Key Financial Metrics
Y/e Mar FY21 FY22 FY23E FY24E
Per Share(Rs)
EPS 45.9 52.5 57.8 68.4
CEPS 53.6 60.8 66.5 77.1
BVPS 181.0 179.9 187.5 258.8
FCF 31.2 45.1 46.5 61.7
DPS 32.4 37.1 24.0 24.0
Return Ratio(%)
RoCE 34.5 36.7 40.2 38.4
ROIC 37.1 42.9 45.2 38.2
RoE 27.3 29.0 31.4 30.6
Balance Sheet
Net Debt : Equity (x) (0.4) (0.3) (0.3) (0.5)
Debtor (Day s) 70 68 63 69
Valuation(x)
PER 38.1 33.3 30.2 25.6
P/B 9.7 9.7 9.3 6.8
P/CEPS 32.6 28.8 26.3 22.7
EV/EBITDA 25.6 22.6 20.4 17.1
EV/Sales 7.1 5.9 5.0 4.3
Div idend Yield (%) 1.9 2.1 1.4 1.4
Source: Company Data, PL Research
Infosys
April 14, 2022 11
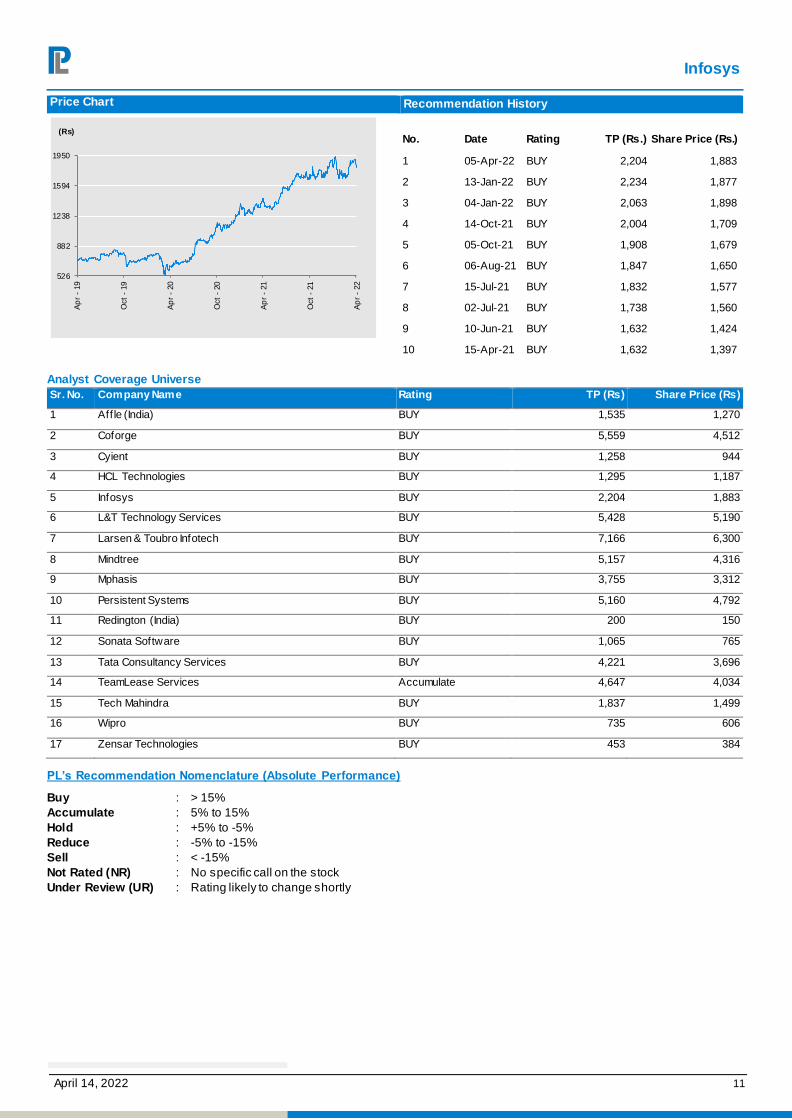
Price Chart Recommendation History
No. Date Rating TP (Rs.) Share Price (Rs.)
1 05-Apr-22 BUY 2,204 1,883
2 13-Jan-22 BUY 2,234 1,877
3 04-Jan-22 BUY 2,063 1,898
4 14-Oct-21 BUY 2,004 1,709
5 05-Oct-21 BUY 1,908 1,679
6 06-Aug-21 BUY 1,847 1,650
7 15-Jul-21 BUY 1,832 1,577
8 02-Jul-21 BUY 1,738 1,560
9 10-Jun-21 BUY 1,632 1,424
10 15-Apr-21 BUY 1,632 1,397
Analyst Coverage Universe
Sr. No. Company Name Rating TP (Rs) Share Price (Rs)
1 Aff le (India) BUY 1,535 1,270
2 Coforge BUY 5,559 4,512
3 Cyient BUY 1,258 944
4 HCL Technologies BUY 1,295 1,187
5 Infosys BUY 2,204 1,883
6 L&T Technology Services BUY 5,428 5,190
7 Larsen & Toubro Infotech BUY 7,166 6,300
8 Mindtree BUY 5,157 4,316
9 Mphasis BUY 3,755 3,312
10 Persistent Systems BUY 5,160 4,792
11 Redington (India) BUY 200 150
12 Sonata Software BUY 1,065 765
13 Tata Consultancy Services BUY 4,221 3,696
14 TeamLease Services Accumulate 4,647 4,034
15 Tech Mahindra BUY 1,837 1,499
16 Wipro BUY 735 606
17 Zensar Technologies BUY 453 384
PL’s Recommendation Nomenclature (Absolute Performance)
Buy : > 15%
Accumulate : 5% to 15%
Hold : +5% to -5%
Reduce : -5% to -15%
Sell : < -15%
Not Rated (NR) : No specific call on the stock
Under Review (UR) : Rating likely to change shortly
526
882
1238
1594
1950
Ap
r -
19
Oct
- 19
Ap
r -
20
Oct
- 20
Ap
r -
21
Oct
- 21
Ap
r -
22
(Rs)
Infosys
April 14, 2022 12
ANALYST CERTIFICATION
(Indian Clients)
We/I, Ms. Aditi Patil- MBA Finance Research Analysts, authors and the names subscribed to this report, hereby certify that all of the views expressed in this research report accurately ref lect our views about the subject issuer(s) or securities. We also certify that no part of our compensation was, is, or wil l be directly or indirectly related to the specific recommendation(s)
or v iew(s) in this report.
(US Clients)
The research analy sts, with respect to each issuer and its securities covered by them in this research report, certify that: All of the views expressed in this research report accurately ref lect his or her or their personal views about all of the issuers and their securities; and No part of his or her or their compensation was, is or will be directly related to the specific
recommendation or views expressed in this research report.
DISCLAIMER
Indian Clients
Prabhudas Lilladher Pvt. Ltd, Mumbai, India (hereinafter referred to as “PL”) is engaged in the business of Stock Broking, Portfolio Manager, Depository Participant and distribution for third party financial products. PL is a subsidiary of Prabhudas Lilladher Advisory Services Pvt Ltd. which has its various subsidiaries engaged in business of commodity broking,
inv estment banking, financial services (margin funding) and distribution of third party financial/other products, details in respect of which are available at www.plindia.com.
This document has been prepared by the Research Division of PL and is meant for use by the recipient only as information and is not for circulation. This document is not to be reported
or copied or made available to others without prior permission of PL. It should not be considered or taken as an offer to sell or a solicitation to buy or sell any security.
The inf ormation contained in this report has been obtained from sources that are considered to be reliable. However, PL has not independently verified the accuracy or completeness of the same. Neither PL nor any of its affiliates, its directors or its employees accepts any responsibility of whatsoever nature for the information, statements and opinion given, made av ailable or expressed herein or for any omission therein.
Recipients of this report should be aware that past performance is not necessarily a guide to future performance and value of investments can go down as well. The suitability or
otherwise of any investments will depend upon the recipient's particular circumstances and, in case of doubt, advice should be sought from an independent expert/advisor.
Either PL or its affiliates or its directors or its employees or its representatives or its clients or their relatives may have position(s), make market, act as principal or engage in transactions
of securities of companies referred to in this report and they may have used the research material prior to publication.
PL may from time to time solicit or perform investment banking or other services for any company mentioned in this document.
PL is a registered with SEBI under the SEBI (Research Analysts) Regulation, 2014 and having registration number INH000000271.
PL submits that no material disciplinary action has been taken on us by any Regulatory Authority impacting Equity Research Analysis activities.
PL or its research analysts or its associates or his relatives do not have any financial interest in the subject company.
PL or its research analysts or its associates or his relatives do not have actual/beneficial ownership of one per cent or more securities of the s ubject company at the end of the month immediately preceding the date of publication of the research report.
PL or its research analysts or its associates or his relatives do not have any material conflict of interest at the time of publication of the research report.
PL or its associates might have received compensation from the subject company in the past twelve months.
PL or its associates might have managed or co-managed public offering of securities for the subject company in the past twelve months or mandated by the subject company for any
other assignment in the past twelve months.
PL or its associates might have received any compensation for investment banking or merchant banking or brokerage services from the subject company in the past twelve m onths.
PL or its associates might have received any compensation for products or services other than investment banking or merchant banking or brokerage services from the subject
company in the past twelve months
PL or its associates might have received any compensation or other benefits from the subject company or third party in connection with the research report.
PL encourages independence in research report preparation and strives to minimize conflict in preparation of research report. PL or its analyst s did not receive any compensation or other benef its from the subject Company or third party in connection with the preparation of the research report. PL or its Research Analysts do not have any material conflict of interest
at the time of publication of this report.
It is conf irmed that Ms. Aditi Patil- MBA Finance Research Analysts of this report have not received any compensation from the companies mentioned in the report in the preceding
twelv e months
Compensation of our Research Analysts is not based on any specific merchant banking, investment banking or brokerage service transactions.
The Research analysts for this report certifies that all of the views expressed in this report accurately reflect his or her personal views about the subject company or companies and its
or their securities, and no part of his or her compensation was, is or will be, directly or indirectly related to specific recommendations or views expressed in this report.
The research analysts for this report has not served as an officer, director or employee of the subject company PL or its research analysts have not engaged in market making activity
f or the subject company
Our sales people, traders, and other professionals or affiliates may provide oral or written market commentary or trading strategies to our clients that reflect opinions that are contrary to the opinions expressed herein, and our proprietary trading and investing businesses may make investment decisions that are inconsistent with the recommendations expressed
herein. In rev iewing these materials, you should be aware that any or all of the foregoing, among other things, may give rise to real or potential conflicts of interest.
PL and its associates, their directors and employees may (a) from time to time, have a long or short position in, and buy or sell the securities of the subject company or (b) be engaged in any other transaction involving such securities and earn brokerage or other compensation or act as a market maker in the financial instruments of the subject company or act as an
adv isor or lender/borrower to the subject company or may have any other potential conflict of interests with respect to any recommendation and other related information and opinions.
US Clients
This research report is a product of Prabhudas Lilladher Pvt. Ltd., which is the employer of the research analyst(s) who has prepared the research report. The research analyst(s) preparing the research report is/are resident outside the United States (U.S.) and are not associated persons of any U.S. regulated broker-dealer and therefore the analyst(s) is/are not subject to supervision by a U.S. broker-dealer, and is/are not required to satisfy the regulatory licensing requirements of FINRA or required to otherwise comply with U.S. rules or
regulations regarding, among other things, communications with a subject company, public appearances and trading securities held by a research analyst account.
This report is intended for distribution by Prabhudas Lilladher Pvt. Ltd. only to "Major Institutional Investors" as defined by Rule 15a-6(b)(4) of the U.S. Securities and Exchange Act, 1934 (the Exchange Act) and interpretations thereof by U.S. Securities and Exchange Commission (SEC) in reliance on Rule 15a 6(a)(2). If the recipient of this report is not a Major Institutional Investor as specified above, then it should not act upon this report and return the same to the sender. Further, this report may not be copied, duplicated and/or transmitted
onward to any U.S. person, which is not the Major Institutional Investor.
In reliance on the exemption from registration provided by Rule 15a-6 of the Exchange Act and interpretations thereof by the SEC in order to conduct certain business with Major
Institutional Investors, Prabhudas Lilladher Pvt. Ltd. has entered into an agreement with a U.S. registered broker-dealer, Marco Polo Securities Inc. ("Marco Polo").
Transactions in securities discussed in this research report should be effected through Marco Polo or another U.S. registered broker dealer.
Prabhudas Lilladher Pvt. Ltd. 3rd Floor, Sadhana House, 570, P. B. Marg, Worli, Mumbai-400 018, India | Tel: (91 22) 6632 2222 Fax: (91 22) 6632 2209
www.plindia.com
Related Documents