Information Visualization Design for Multidimensional Data: Integrating the Rank-by-Feature Framework with Hierarchical Clustering Dissertation Defense Human-Computer Interaction Lab & Dept. of Computer Science Jinwook Seo

Welcome message from author
This document is posted to help you gain knowledge. Please leave a comment to let me know what you think about it! Share it to your friends and learn new things together.
Transcript
Information Visualization Design for Multidimensional Data:
Integrating the Rank-by-Feature Framework with Hierarchical Clustering
Dissertation Defense
Human-Computer Interaction Lab &Dept. of Computer Science
Jinwook Seo

Outline
• Research Problems• Clustering Result Visualization in HCE
• GRID Principles• Rank-by-Feature Framework• Evaluation
– Case studies– User survey via emails
• Contributions and Future work
Exploration of Multidimensional Data
• To understand the story that the data tells• To find features in the data set• To generate hypotheses
• Lost in multidimensional space• Tools and techniques are available in
many areas• Strategy and interface to organize them to
guide discovery
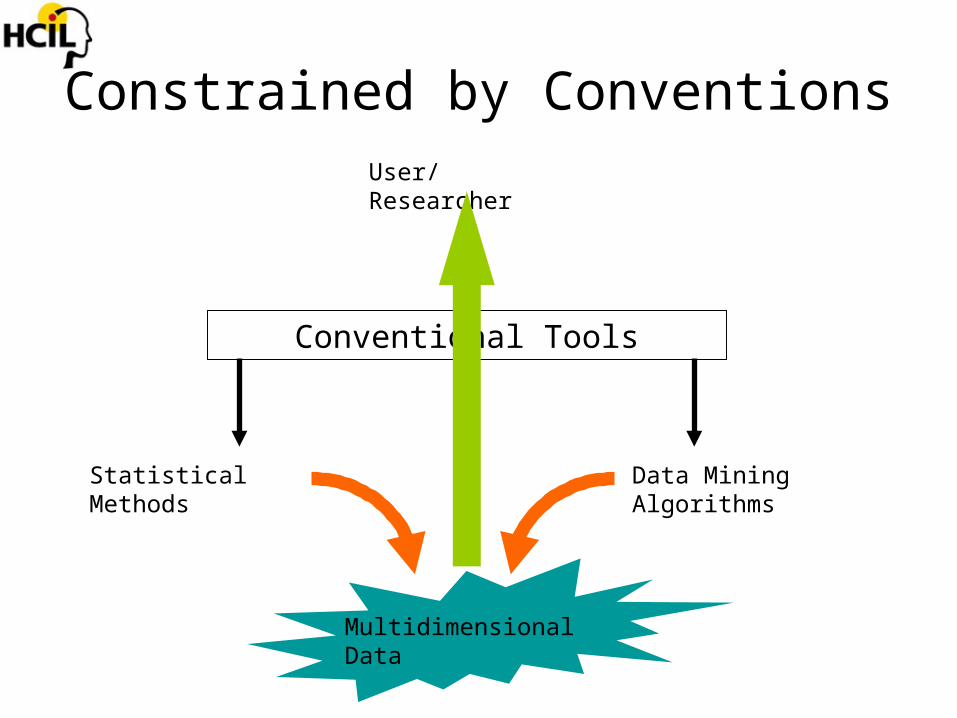
Constrained by Conventions
Multidimensional Data
Statistical Methods Data Mining Algorithms
User/Researcher
Conventional Tools
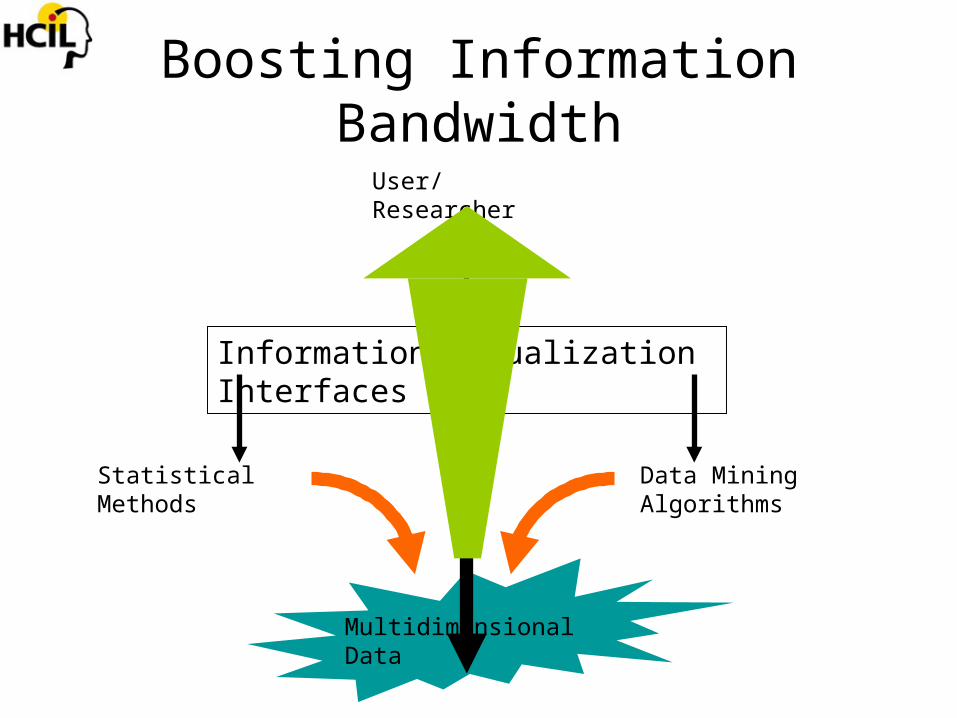
Boosting Information Bandwidth
Multidimensional Data
Statistical Methods Data Mining Algorithms
Information Visualization Interfaces
User/Researcher

Contributions
• Graphics, Ranking, and Interaction for Discovery (GRID) principles
• Rank-by-Feature Framework
• The design and implementation of the Hierarchical Clustering Explorer (HCE)
• Validation through case studies and user surveys
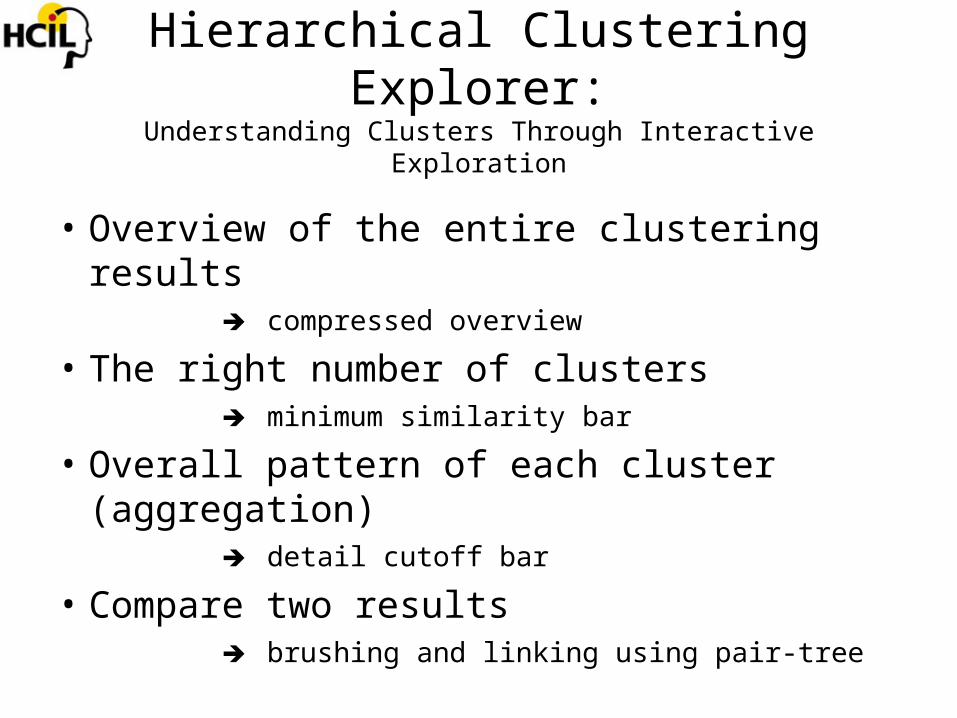
Hierarchical Clustering Explorer:Understanding Clusters Through Interactive Exploration
• Overview of the entire clustering results compressed overview
• The right number of clusters minimum similarity bar
• Overall pattern of each cluster (aggregation) detail cutoff bar
• Compare two results brushing and linking using pair-tree
HCE History
• Document-View Architecture
• 72,274 lines of C++ codes, 76 C++ classes
• About 2,500 downloads since April 2002
• Commercial license to a biotech company (www.vialactia.com)
• Freely downloadable at www.cs.umd.edu/hcil/hce

Goal: Find Interesting Features in Multidimensional Data
• Finding clusters, outliers, correlations, gaps, … is difficult in multidimensional data– Cognitive difficulties in >3D
• Therefore utilize low-dimensional projections– Perceptual efficiency in 1D and 2D– Orderly process to guide discovery
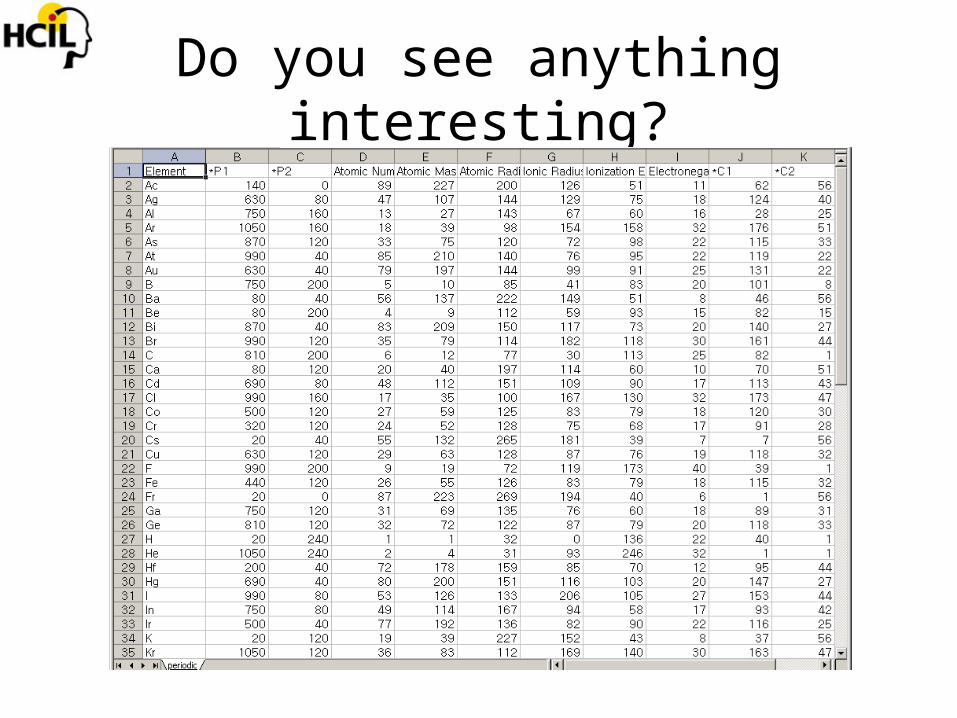
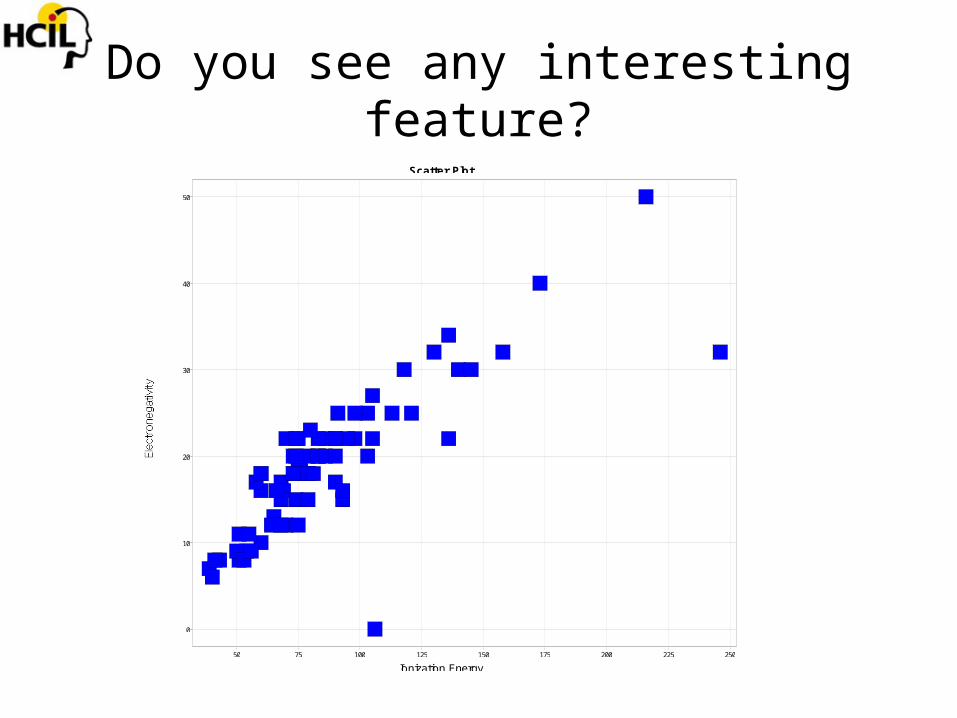
Do you see any interesting feature?Scatter Plot
Ionization Energy50 75 100 125 150 175 200 225 250
0
10
20
30
40
50
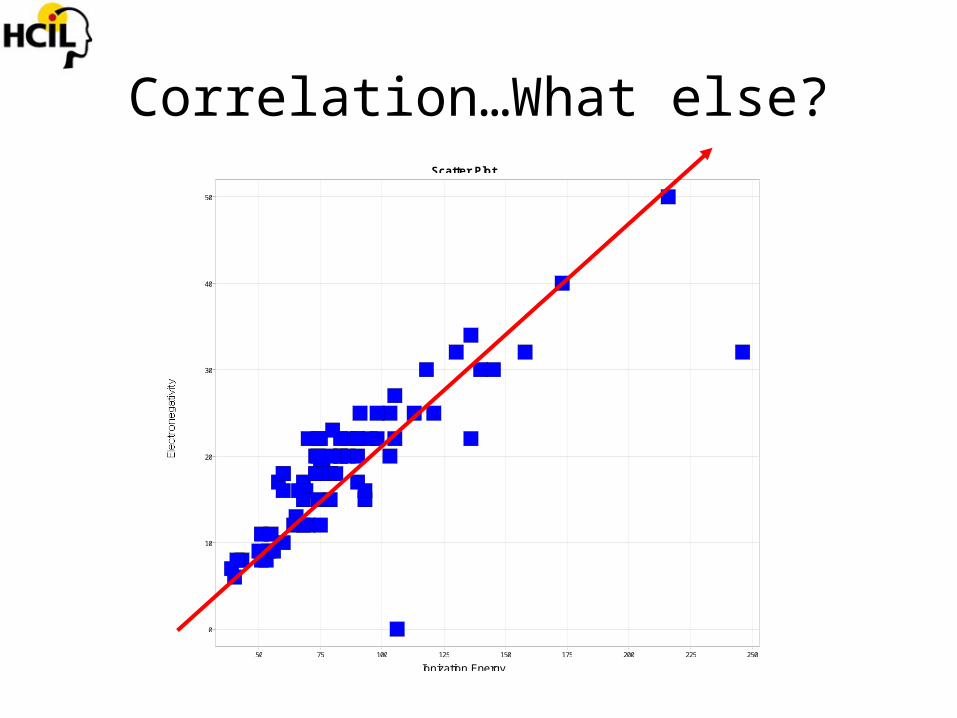
Correlation…What else?Scatter Plot
Ionization Energy50 75 100 125 150 175 200 225 250
0
10
20
30
40
50

OutliersScatter Plot
Ionization Energy50 75 100 125 150 175 200 225 250
0
10
20
30
40
50
He
Rn
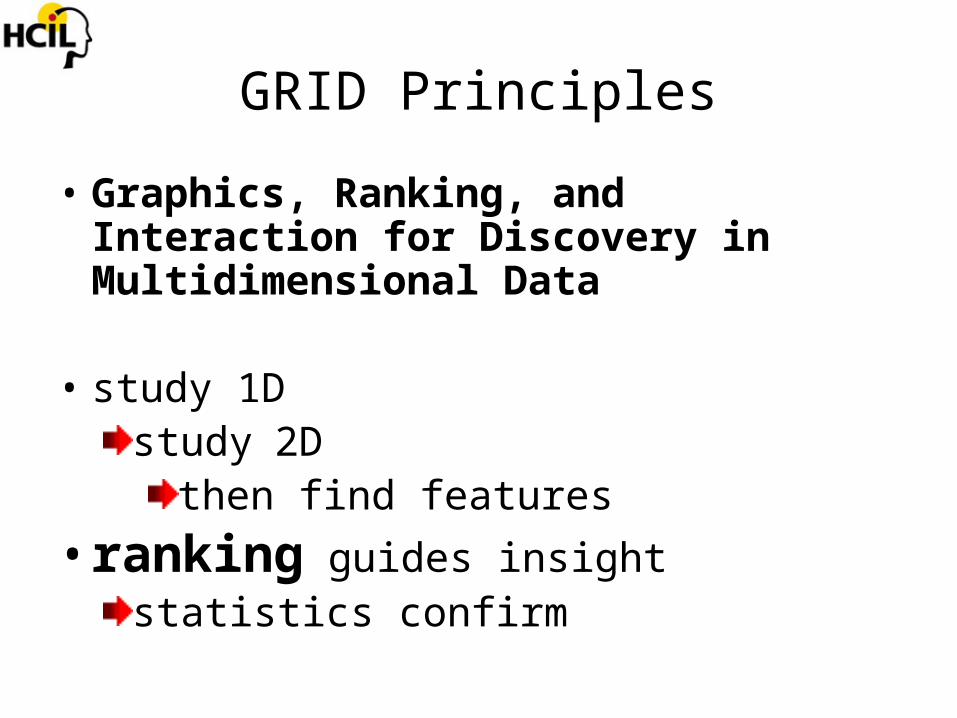
GRID Principles
• Graphics, Ranking, and Interaction for Discovery in Multidimensional Data
• study 1D
study 2Dthen find features
• ranking guides insightstatistics confirm

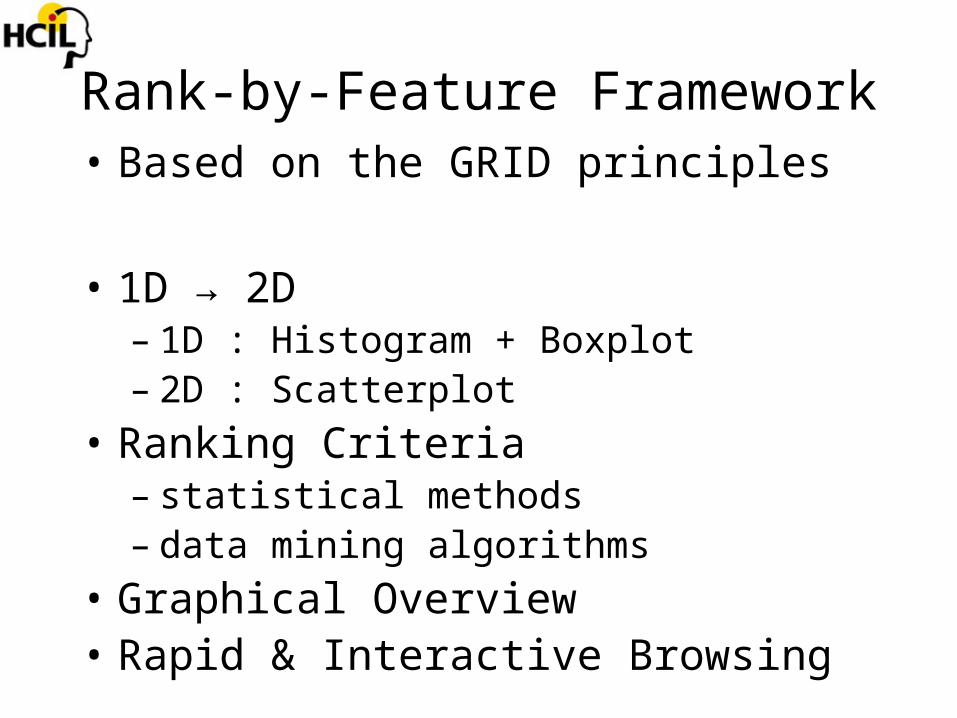
Rank-by-Feature Framework• Based on the GRID principles
• 1D → 2D– 1D : Histogram + Boxplot– 2D : Scatterplot
• Ranking Criteria– statistical methods– data mining algorithms
• Graphical Overview• Rapid & Interactive Browsing
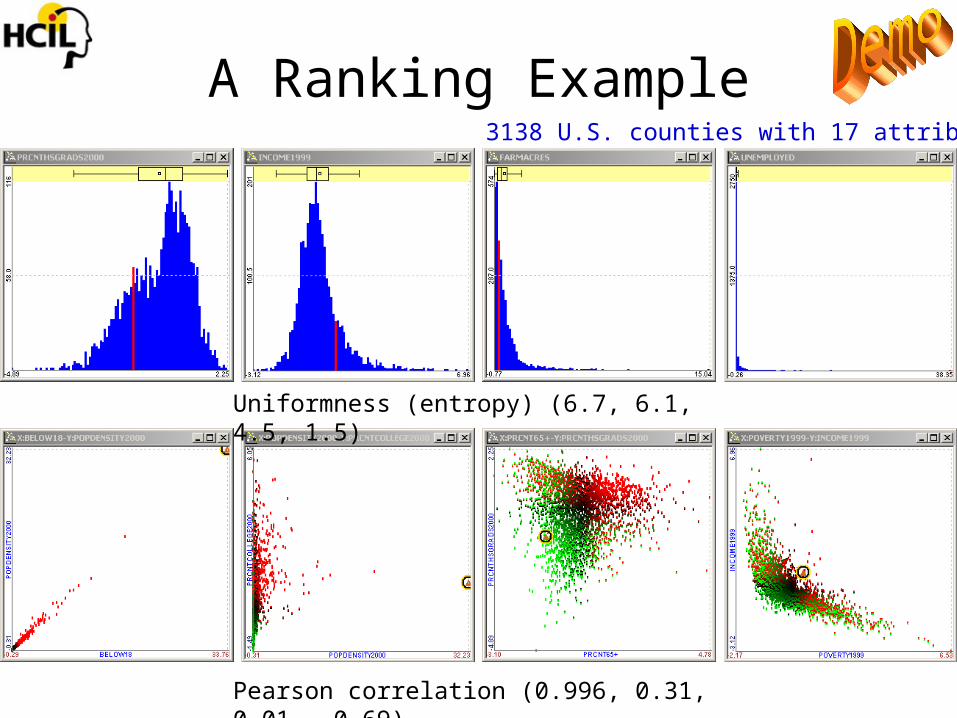
Pearson correlation (0.996, 0.31, 0.01, -0.69)
Uniformness (entropy) (6.7, 6.1, 4.5, 1.5)
A Ranking Example3138 U.S. counties with 17 attributes

Categorical Variables in RFF
• New ranking criteria– Chi-square, ANOVA
• Significance and Strength– How strong is a relationship?– How significant is a relationship?
• Partitioning and Comparison– partition by a column (categorical variable)– partition by a row (class info for columns)– compare clustering results for partitions

color : Contingency coefficient C size : Chi-square p-value
color : Quadracity size : Least-square error

Categorical Variables in RFF
• New ranking criteria– Chi-square, ANOVA
• Significance and Strength– How strong is a relationship?– How significant is a relationship?
• Partitioning and Comparison– partition by a column (categorical variable)– partition by a row (class info for columns)– compare clustering results for partitions

Partitioning and Comparison
s1 s2 s3 s4 s5 s6 s7
FieldType integer integer real integer integer integer categorical
i1 M
i2 M
i3 M
… …
in-1 F
in F
Compare two column-clustering results

Partitioning and Comparison
s1 s2 s3 s4 s5 s6
CID 1 1 1 2 2 2
FieldType integer integer real integer integer integer
i1i2i3…
in-1
in
Compare two row-clustering results
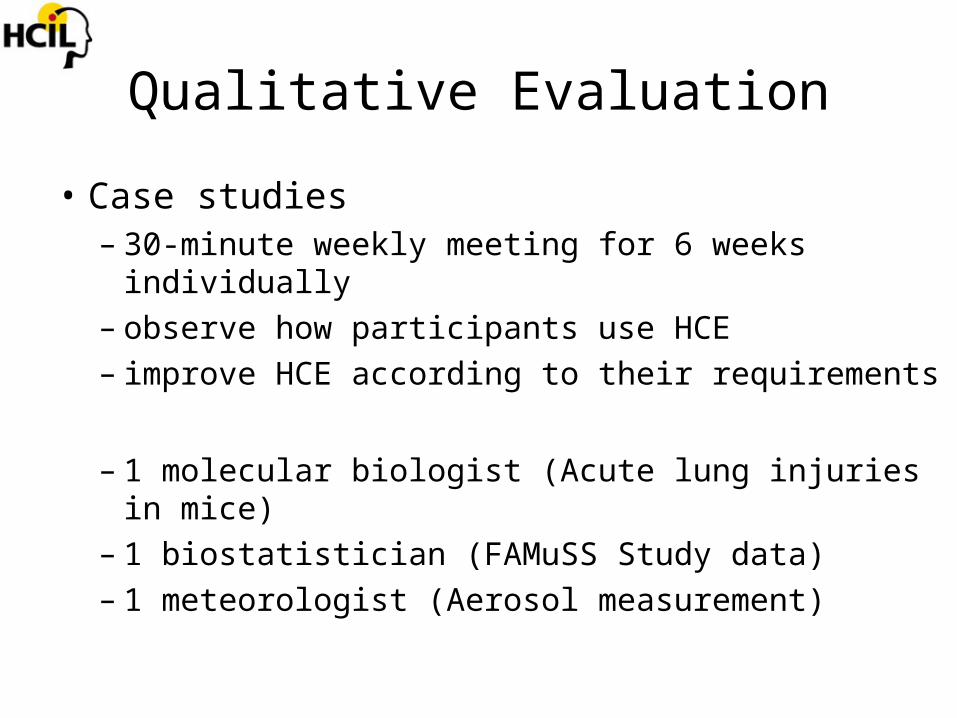
Qualitative Evaluation
• Case studies – 30-minute weekly meeting for 6 weeks
individually– observe how participants use HCE– improve HCE according to their requirements
– 1 molecular biologist (Acute lung injuries in mice)– 1 biostatistician (FAMuSS Study data)– 1 meteorologist (Aerosol measurement)
Lessons Learned
• Rank-by-Feature Framework – Enables systematic/orderly exploration– Prevents from missing important features– Helps confirm known features– Helps identify unknown features– Reveals outliers as signal/noise
• More work needed– Transformation of variables– More ranking criteria– More interactions
User Survey via Emails
• 1500 user survey emails• 13 questions on HCE and RFF• 60% successfully sent out • 85 users replied • 60 users answered a majority of questions • 25 just curious users

49
25 24 2522
7
0
10
20
30
40
50
60
dendrogram histogramordering
scatterplotordering
tabular view profile search gene ontology
Which features have you used?
13
20
12
2
0
5
10
15
20
25
signif icantly somew hat signif icantly a little bit not at all
Do you think HCE improved the way you analyze your data set?

Future Work
• Integrating RFF with Other Tools– More ranking criteria– GRID principles available in other tools
• Scaling-up– Selection/Filtering to handle large number
of dimensions
• Interaction in RFF
• Further Evaluation

Future Work
• Integrating RFF with Other Tools– More ranking criteria– GRID principles available in other tools
• Scaling-up– Selection/Filtering to handle large number
of dimensions
• Interaction in RFF
• Further Evaluation

Contributions
• Graphics, Ranking, and Interaction for Discovery (GRID) principles
• Rank-by-Feature Framework
• The design and implementation of the Hierarchical Clustering Explorer (HCE)
• Validation through case studies and user surveys

Related Documents