Physica A 388 (2009) 5057–5069 Contents lists available at ScienceDirect Physica A journal homepage: www.elsevier.com/locate/physa Information theoretical methods to deconvolute genetic regulatory networks applied to thyroid neoplasms Enrique Hernández-Lemus a,* , David Velázquez-Fernández b,c , Jesús K. Estrada-Gil a , Irma Silva-Zolezzi b , Miguel F. Herrera-Hernández c , Gerardo Jiménez-Sánchez b a Computational Genomics Department, National Institute of Genomic Medicine, Mexico b Basic Research Department, National Institute of Genomic Medicine, Mexico c Endocrine Surgery Department, National Institute of Medical Sciences and Nutrition Salvador Zubirán, Mexico article info Article history: Received 10 October 2008 Received in revised form 3 June 2009 Available online 18 August 2009 PACS: 87.10.Vg 87.16.Yc 87.18.Cf 89.75.Hc 89.70.Cf Keywords: Gene regulatory networks Information theory Maximum entropy Thyroid cancer abstract Most common pathologies in humans are not caused by the mutation of a single gene, rather they are complex diseases that arise due to the dynamic interaction of many genes and environmental factors. This plethora of interacting genes generates a complexity landscape that masks the real effects associated with the disease. To construct dynamic maps of gene interactions (also called genetic regulatory networks) we need to understand the interplay between thousands of genes. Several issues arise in the analysis of experimental data related to gene function: on the one hand, the nature of measurement processes generates highly noisy signals; on the other hand, there are far more variables involved (number of genes and interactions among them) than experimental samples. Another source of complexity is the highly nonlinear character of the underlying biochemical dynamics. To overcome some of these limitations, we generated an optimized method based on the implementation of a Maximum Entropy Formalism (MaxEnt) to deconvolute a genetic regulatory network based on the most probable meta-distribution of gene–gene interactions. We tested the methodology using experimental data for Papillary Thyroid Cancer (PTC) and Thyroid Goiter tissue samples. The optimal MaxEnt regulatory network was obtained from a pool of 25,593,993 different probability distributions. The group of observed interactions was validated by several (mostly in silico) means and sources. For the associated Papillary Thyroid Cancer Gene Regulatory Network (PTC-GRN) the majority of the nodes (genes) have very few links (interactions) whereas a small number of nodes are highly connected. PTC-GRN is also characterized by high clustering coefficients and network heterogeneity. These properties have been recognized as characteristic of topological robustness, and they have been largely described in relation to biological networks. A number of biological validity outcomes are discussed with regard to both the inferred model and the PTC. © 2009 Elsevier B.V. All rights reserved. 1. Introduction Cellular phenotypes are known to be determined by the interplay of many genes and their products. Thus, the identification of rules and/or structural characteristics of the underlying network is essential to elucidate both the normal cell function and the pathological phenotypic conditions at the whole-system level. A usual tool to track down this phenotypic diversity is gene expression analysis. Since the process of gene expression by itself is often regulated by different genes and * Corresponding author. Tel.: +52 55 53501970; fax: +52 55 53501999. E-mail address: [email protected] (E. Hernández-Lemus). 0378-4371/$ – see front matter © 2009 Elsevier B.V. All rights reserved. doi:10.1016/j.physa.2009.08.013

Welcome message from author
This document is posted to help you gain knowledge. Please leave a comment to let me know what you think about it! Share it to your friends and learn new things together.
Transcript
Physica A 388 (2009) 5057–5069
Contents lists available at ScienceDirect
Physica A
journal homepage: www.elsevier.com/locate/physa
Information theoretical methods to deconvolute genetic regulatorynetworks applied to thyroid neoplasmsEnrique Hernández-Lemus a,∗, David Velázquez-Fernández b,c, Jesús K. Estrada-Gil a,Irma Silva-Zolezzi b, Miguel F. Herrera-Hernández c, Gerardo Jiménez-Sánchez ba Computational Genomics Department, National Institute of Genomic Medicine, Mexicob Basic Research Department, National Institute of Genomic Medicine, Mexicoc Endocrine Surgery Department, National Institute of Medical Sciences and Nutrition Salvador Zubirán, Mexico
a r t i c l e i n f o
Article history:Received 10 October 2008Received in revised form 3 June 2009Available online 18 August 2009
PACS:87.10.Vg87.16.Yc87.18.Cf89.75.Hc89.70.Cf
Keywords:Gene regulatory networksInformation theoryMaximum entropyThyroid cancer
a b s t r a c t
Most common pathologies in humans are not caused by the mutation of a single gene,rather they are complex diseases that arise due to the dynamic interaction ofmany genes andenvironmental factors. This plethora of interacting genes generates a complexity landscapethat masks the real effects associated with the disease. To construct dynamic maps ofgene interactions (also called genetic regulatory networks) we need to understand theinterplay between thousands of genes. Several issues arise in the analysis of experimentaldata related to gene function: on the one hand, the nature of measurement processesgenerates highly noisy signals; on the other hand, there are far more variables involved(number of genes and interactions among them) than experimental samples. Anothersource of complexity is the highly nonlinear character of the underlying biochemicaldynamics. To overcome some of these limitations, we generated an optimized methodbased on the implementation of a Maximum Entropy Formalism (MaxEnt) to deconvolutea genetic regulatory network based on the most probable meta-distribution of gene–geneinteractions. We tested the methodology using experimental data for Papillary ThyroidCancer (PTC) and Thyroid Goiter tissue samples. The optimal MaxEnt regulatory networkwas obtained from a pool of 25,593,993 different probability distributions. The groupof observed interactions was validated by several (mostly in silico) means and sources.For the associated Papillary Thyroid Cancer Gene Regulatory Network (PTC-GRN) themajority of the nodes (genes) have very few links (interactions) whereas a small number ofnodes are highly connected. PTC-GRN is also characterized by high clustering coefficientsand network heterogeneity. These properties have been recognized as characteristic oftopological robustness, and they have been largely described in relation to biologicalnetworks. A number of biological validity outcomes are discussed with regard to both theinferred model and the PTC.
© 2009 Elsevier B.V. All rights reserved.
1. Introduction
Cellular phenotypes are known to be determined by the interplay of many genes and their products. Thus, theidentification of rules and/or structural characteristics of theunderlyingnetwork is essential to elucidate both thenormal cellfunction and the pathological phenotypic conditions at the whole-system level. A usual tool to track down this phenotypicdiversity is gene expression analysis. Since the process of gene expression by itself is often regulated by different genes and
∗ Corresponding author. Tel.: +52 55 53501970; fax: +52 55 53501999.E-mail address: [email protected] (E. Hernández-Lemus).
0378-4371/$ – see front matter© 2009 Elsevier B.V. All rights reserved.doi:10.1016/j.physa.2009.08.013
5058 E. Hernández-Lemus et al. / Physica A 388 (2009) 5057–5069
their products, statistical associations aboundbetween genetic transcripts abundance (e.g.mRNAs). These associations couldbe behind the mechanisms of cell function. Gene Regulatory Networks (GRNs) are powerful graph theoretical constructsthat describe the integrated status of a cell under a specific condition at a given time [1]. The complex description givenby GRNs consists, generally, in identifying gene interactions from experimental data through the use of theoretical modelsand computational analysis. The discovery of such an interaction connectivity network involves the solution of an inverseproblem (a deconvolution) that basically tries to uncover the interactions from the properties and dynamics of observablebehavior in the form of, for example, RNA transcription levels in a characteristic gene expression profile.A growing number of deconvolution methods (also called reverse engineering methods) have been proposed [2,3]. Most
of these methods aim at reaching a well defined representation of the cellular network topology from the transcriptionalinteractions as revealed by, for example, gene expression measurements. Under this scenario, gene expression values aremeasured under different conditions, either on a simultaneous [steady-state] or serial [dynamics] fashion, the measure-ments are then treated as samples from a joint probability distribution.The goal of deconvolution methods is inferring GRNs based on statistical dependencies within this joint distribution [4].
One major problem for doing so is that, surprisingly, there is still no conceptual agreement as to what the dependenciesare within these multivariate settings and about the role of noise and stochastic dynamics in the problem. The special caseof conditional statistical dependence has gained, however, a certain place as a somehow useful criterion in most biologicalapplications. With this in mind, one hopes to find a way to decompose the Statistical Dependency Matrix (SDM) – that is,the deviation of a joint probability distribution from the product of its marginals – into a series of well defined contributionscoming from interactions of several orders of complexity. Typical means to reach this goal consist in the quantification ofthe new information content that arise when we look at the full joint probability distribution when is compared to a seriesof successive independence approximations.To deconvolute a GRN related to PTC we applied a methodology based on both, a local pattern-sharing measure and a
global mutual information index, as surrogates to actual gene–gene interactions. The input data was a set of 67 AffymetrixHGU133 Plus2Microarrays. The set consists of both, normal and neoplasic tissue samples, from several independent steady-state experiments. Samples were prioritized (ordered) according to their degree of tumor progression in order to constructseries of experiments, as an attempt to mimic cancer progression in time. As a proxy to the progression stage, we took theirrespective levels of Galectin-3 (LGALS3), a known marker of PTC malignancy [5,6] (See Section 4.1 Materials and Methods).The optimal network (within the given approximations) was found by a Maximum Entropy Method and was validated byseveral (mostly in silico and database-mining) methods.
2. Gene–gene interactions
The deconvolution of a GRN based on a maximum entropy optimization of the Joint Probability Distribution (JPD) ofgene–gene interactions as given by gene expression experimental data could be implemented as follows. The JPD for thestationary expression of all genes, P(gi), i = 1, . . . ,N may be written as follows [1]:
P(gi) =1ZexpHgen (1)
Hgen =
[−
N∑i
Φi(gi)−N∑i,j
Φi,j(gi, gj)−N∑i,j,k
Φi,j,k(gi, gj, gk)− · · ·
]. (2)
Here N is the number of genes, Z is a normalization factor (the partition function), the Φ ’s are interaction potentials. Atruncation procedure in Eq. (2) it is used to define an approximate hamiltonian Hp that aims to describe statistical propertiesof the system. A set of variables (genes) Ω , interacts with each other if and only if the potential ΦΩ between such set ofvariables is non-zero. The relative contribution of ΦΩ is taken as proportional to the strength of the interaction betweenthis set. Eq. (2) does not define the potentials uniquely, thus, additional constraints should be provided in order to avoidambiguity. A usual approach to do so is specify Φ ’s using maximum entropy (MaxEnt) approximations consistent withthe available information on the system in the form of marginals. Information theory provides a set of useful criteria forsetting up probability distribution functions (PDFs) on the basis of partial knowledge. The MaxEnt estimate of a PDF isthe least biased estimate possible, given the information, i.e. the PDF that is maximally non-committal with regard tomissing information [7]. It is not possible to constrain the system via the specification of all possible N-way potentialswhen N is large; hence one has to approximate the interaction structure. A closer look of Eq. (2) reminds us of the typicalproblem of the BBGKY hierarchy in statistical mechanics. Unfortunately, there is not such well defined criteria to truncatethe geometric series expansion inmultiple p-way interaction potentialsΦi1,i2,...,ip(gi1 , gi2 , . . . , gip) ; ∀i as in, for example thediluted regime in the BBGKY hierarchy (see, for example Ref. [8]). According to the current genomics literature, sample sizesof order 102 (the usual maximum size available in most present-day studies) are generally sufficient to estimate 2-waymarginals, whereas 3-way marginals (e.g. triplet interactions Φi,j,k(gi, gj, gk)) require about an order of magnitude moresamples, a sample size unattainable under present circumstances. Being this the case, one is usually confronted with a 2-way hamiltonian of the form:
Haprox = −N∑i
Φi(gi)−N∑i,j
Φi,j(gi, gj) (3)

E. Hernández-Lemus et al. / Physica A 388 (2009) 5057–5069 5059
Under that approximation, the reconstruction (or deconvolution) of the associated GRN consists in the inverse problemof determining the complete set of relevant 2-way interactions Φi,j(gi, gj) consistent with the JPD (Eqs. (1) and (2)) thatdefines all known constrictions, e.g. the values of the stationary expression of genes gi as given by the set of Φi(gi)’s andnon-committal with every other restriction in the form of a marginal. The modeling of a GRN depends on the description ofthe interactions in the form of several correlation functions. A great deal of work has been done within the framework ofthe Bayesian Network (BN) approach [9,10]. BNmodels both static and dynamic have provided with a better understandingof the problem in terms of solvability, noise reduction and algorithmic complexity. Since BN’s are a form of the DirectedAcyclic Graph (DAG) problem, there are several instances (e.g. feed-forward loops, feed-back cycles, etc.) in which the DAGformalism of BNs fails short. It has been noted [2] that BNs require a larger number of data points (samples) to infer theprobability density distributions whereas information theoretical approaches performwell for steady-state data and can beapplied even when few experiments (compared to the number of genes) are available. A recently developed approach is theuse of statistical and information theoretical models to describe the interactions [11].If we consider a 2-way interaction hamiltonian, all gene pairs i, j for which Φi,j = 0 are said to be non-interacting.
This is true for genes that are statistically independent, P(gi, gj) ≈ P(gi) P(gj), but it is also valid for genes that do nothave a direct interaction but are connected via other genes i.e. Φi,j = 0 but P(gi, gj) 6= P(gi) P(gj). Several metrics such asPearson Correlation, Square Correlation and Spearman Ranked coefficients over the sampling universe have been used, butthe performance of these methods is usually poor as suffers from a big number of false positive predictions. To overcomesome of the limitations of these methods, we inferred gene–gene regulatory interactions by means of both a local pattern-sharing approach [12] and a global mutual information approach (as implemented in ARACNe [1]).
3. Information theoretical approach
3.1. Information based similarity
A promising approach consists in considering that the interactivity of the system is based on communication channels(either real or abstract) for the bio-signals. Thus, Information Theory (IT) could play a useful role in identifying entropicmeasures between pairs gi, gj of genes within the sampling universe as potential interactionsΦi,j. IT can also provide withmeans to test for the MaxEnt distribution, by considering, for example the Kullback–Leibler (KL) divergence (also calledmultiinformation) or the Connected Information as criteria of iterative convergence to the MaxEnt PDF in the same sensethat the cumulant distribution leads to the specification of usual PDFs [13].One possible approach that we propose below is based on the quantification of the so called Information Based Similarity
Index (IBS) [12] initially developed to work out the complex structure generated by the human heart beat time series.Nevertheless, IBS has proved to be a very powerful tool in the comparison of the dynamics of highly nonlinear processes.Within the present context the symbolic sequence represent the expression values of a single gene (say gene k-th) all alongthe sampling universe (of sizeM), as given by a vector Γ = −→gk = (gk1 , gk2 , . . . , gkM ). Let us consider a series that could wellrepresent a gene expression vector. It is possible to classify each pair of successive points into one of the following binarystates Bn, if (Γn+1 − Γn) < 0 then Bn = 0; in the other case Bn = 1. This procedure maps theM step real-valued time seriesΓ (i) into an M − 1 step binary-valued series B(i). It is now possible to define a binary sequence of length m (called an m-bit word). Each of them-bit wordswk represents a unique pattern in a given time series. For every unitary time-shift λ, thealgorithmmakes a different collectionWλ ofm-bitwords over thewhole time series,Wλ = w1, w2, . . . , wnλ. It is expectedthat the frequency of occurrence of thesem-bit words will reflect the underlying dynamics of the original (real-valued) timeseries. We are then looking to write down a probability distribution function in the rank–frequency representation (RF-PDF).This RF-PDF represents the statistical hierarchy of symbolic words of the original series [12]. Two given symbolic sequencesare said to have similarity if they give rise to similar probability distribution functions.Following the very same order of ideas, Yang and collaborators [12] defined a measure of similarity (akin to statistical
equivalence) between two series by plotting the rank number of every m-bit word in the first series with the rank for thesame m-bit word in the second series. Of course since the series are supposed to be finite, the m-bit words are not equallylikely to appear. Themethod introduces the likelihood of each word by defining a weighted distance∆m between two givensymbolic sequences σ1 and σ2 as follows:
∆m(σ1, σ2) =1
2m − 1
2m∑k=1
|R1(wk)− R2(wk)|F(wk). (4)
F(wk) is the normalized likelihood of them-bit word k, weighted by its given Shannon entropy [14], i.e.:
F(wk) =1Z[−p1(wk) log p1(wk)− p2(wk) log p2(wk)] . (5)
pi(wk) and Ri(wk) represent the probability and rank of a given word wk in the i-th series. The normalization factor inEq. (5) is the total Shannon’s entropyof the ensemble and is calculated as Z =
∑k [−p1(wk) log p1(wk)− p2(wk) log p2(wk)].
∆m(σ1, σ2) is called the Information Based Similarity Index (IBS) between series σ1, and σ2 (e.g. expression vectors g1

5060 E. Hernández-Lemus et al. / Physica A 388 (2009) 5057–5069
and g2 for genes 1 and 2 respectively). One notices that ∆m(σ1, σ2) ∈ [0, 1]; ∀σ1, σ2; ∀m. In fact one is able to consider∆m(σ1, σ2) as a probability measure. If lim∆m(σ1, σ2) → 1 the series are absolutely dissimilar, whereas in the oppositecase (lim∆m(σ1, σ2)→ 0) the two series become equivalent (in the statistical sense). One can then approximate the valueof the interaction potentialsΦ(gi, gj) as follows. If one is to consider interaction as given by correlation or information flow,one can notice that high values of ∆m imply stronger dissimilarity, hence lower correlation and since ∆m is a probabilitymeasure, one can define the complementary measure∆∗m = 1−∆m and then one can approximateΦ(gi, gj) ≈ ∆
∗m(gi, gj).
3.2. Mutual information
An information theoretical measure that has been used successfully to infer 2-way interactions in GRNs is mutualinformation (MI) [1]. MI for a pair of random variables α, and β is defined as I(α, β) = S(α)+ S(β)− S(α, β). Here S is theinformation theoretical entropy (Shannon’s entropy), S(x) = −〈log p(xi)〉 = −
∑i p(xi) log p(xi). MI measures the degree
of statistical dependency between two random variables. From the definition one can see that I(α, β) = 0 if and only if αand β are statistically independent. Estimating MI between gene expression profiles under high throughput experimentalsetups typical of today’s research in the field is a computational and theoretical challenge of considerable magnitude. Onepossible approximation is the use of estimators. Under a Gaussian kernel approximation, the JPD of a 2-way measurement−→Xi = (xi, yi), i = 1, 2, . . . ,M is given as [1]:
f (−→X ) =
1M
∑i
G[(h−1|−→X −−→Xi |)]
h2. (6)
G is the bivariate standard normal density and h is the associated kernel width [1]. The mutual information could beevaluated as follows:
I(xi, yi) =1M
∑i
logf (xi, yi)f (xi) f (yi)
(7)
hence, two genes with expression profiles gi and gj for which I(gi, gj) 6= 0 are said to interact each other with a strengthI(gi, gj) ≈ Φ(gi, gj), whereas two genes for which I(gi, gj) is zero are declared non-directly interacting to within the givenapproximations. Since MI is reparametrization invariant, one usually calculates the normalized mutual information. In thiscase I(gi, gj) ∈ [0, 1], ∀i, j. MI calculations are currently implemented and customized to infer GRNs in ARACNe [1]. Thisalgorithm will be used as a secondary means of inference in what follows.
4. Implementation and results
4.1. Materials and methods
We analyzed genome wide expression data obtained with Affymetrix HGU133Plus2 human gene expression chip underprocedure GPL570 for 67 Microarrays (MAs) of Papillary Thyroid Cancer (PTC) and Goiter tissue samples, 21 from patientswithin amulticentric collaboration (9 PTCMAs, 12 goiterMAs plus technical repeats) and 46 additional samples from severalindependent experiments (14 MAs 7C/7G from NIH-NCBI/GEO accession key: GDS1732, 18 MAs 14C/4G NIH-NCBI/GEOaccession key: GSE6004 and 14 MAs 7C/7G from EMBL/ArrayExpress accession key: E-GEOD-3678). All 67 arrays wereprocessedwithin the same protocol and in all cases unnormalized fluorescence raw data files (.CEL files) were used. The pre-processing was done according to the RMA algorithm implemented in R/BioConductor and statistical tests for differentialexpression profiles were done in the FlexArray/Nanuq platform [15].In the case of human mRNA samples taken directly from organ tissue (by a biopsy) and not from cultured cell-lines, it
is extremely difficult to design time-course experiments. As a proxy to time-courses we propose the following alternative.After quality control pre-processing, background correction and normalization of themicroarrays, the sampleswere orderedaccording to their Galectin-3 (LGALS3, Affy probe ID 208949_s_at) expression level, in such a way that sample 1 has thesmallest value of gene expression for Galectin-3 and sample 67 the largest one. Galectin-3 is a well known marker ofprogression and malignancy in PTC [5,6] that correlates both with lab tests and clinical trials [5]. Given these facts, ouransatz is that a higher level of LGALS3 implies a later stage of cancer progression. By ordering the independent, steady-statesamples in this way, to constitute a proxy to a time series, we intend to mimic the dynamics of cancer progression.InformationBased Similarity networkswere inferred byusing the IBS package [12] implemented in the PhysioToolKit [16]
to calculate ∆m and Mutual Information networks were inferred by the use of ARACNe [1]. Graphical depiction and SetTheoretic intersection of Networks were processed with the aid of CYTOSCAPE [17], graphical layout and algorithmicvisualization was done by PAJEK [18]. Validation of the optimal network (the MaxEnt network) was done by performingPearson Correlation Calculations and Spearman Rank tests with R [19]. We also made comparisons with the BayesianNetwork inferred by GeneNetwork [20], with functional annotations in STRING [21] and with annotations within theGeneOntology Databases [22].

E. Hernández-Lemus et al. / Physica A 388 (2009) 5057–5069 5061
Fig. 1. PTC Gene–Gene minimal interaction network Ψnet . Metric distances were measured by IBS index ∆m and MI between relevant genes for in silicovalidated interactions. Green nodes are transcription factors, yellow nodes are proteins known to interact with transcription factors.
After pre-processing of the gene expressionmicroarray datawe identified 1227 differentially expressed gene probeswithexpression log fold change (LFC)< −2
⋂LFC > +2 and corrected p-value< 0.02. After we performed 1505,529 pair wise
IBS comparisons for every bin size m (see Eq. (4)) up to m = 19, thus generating the set of ∆∗m(gi, gj) for all differentiallyexpressed genes i and j. Those pairs (a, b) whose∆∗m(ga, gb)→ 1 were considered interacting partners (co-regulated genes)although since∆∗m(ga, gb) is symmetric, one is not able to tell whether a regulates b or otherwise. This leaves us with a setof 2223 off-diagonal interactions (we did not consider self-regulation) corresponding to 428 non-degenerated gene–geneco-regulation relations. We consider only well annotated genes to obtain a set of 170 validated interactions between 75genes that constitutes the basis for the construction of the GRN (Ψnet ). All interactions possess∆∗m(gi, gj) = 1. The validatedGRN (Ψnet ) is shown in Fig. 1.In short,we begin by constructing aN×Mmatrixwhose entries are the expression values of theN differentially expressed
gene probes for theM (ordered) samples (in this case, N = 1227 andM = 67). We could think of suchmatrix as constitutedby an array of 1227 gene expression vectors (GEVs). Each of these 67-dimensional GEVs was considered as a time series(see above), representing changes in the level of expression of a given gene. We then proceeded to perform IBS and MIanalysis betweenGEVs in order to look up for correlations. Highly correlatedGEVswere considered to be putative interactionpartners that were analyzed and validated to form the nodes and links in the regulatory network.
4.2. Thresholding analysis and topological characterization of the inferred networks
Before entering into amuchdetailed analysis of the biologically validated networkΨnet , let us recall an important problemin network inference that is closely related to the criteria we used to obtain Ψnet (Table 3). Most of the already mentionedtheoreticalmeans of network inference are based on the evaluation of one or several values for the interaction (usually givenin the form of probability or information theoretical measures). The problem is that there are no well defined criteria as towhat is the right value of the cut-off in, for example theMI value, the p-value or another quantitative indicator of interaction,for if one takes a too-stringent criteria one is possibly having left-out an important interaction and if your cut-off is too-looseyou will end up having a lot of false positive links. The usual approach to solve a problem like this is starting with a setof known interactions, generate a group of networks with an open range of cut-off values and then choose the value thatpreserves the real interactions giving rise to a minimal error set. Unfortunately, for most interesting cases there is no set ofalready known interactions and, if it indeed exists, it is generally very poor.Here we propose an alternative way to tackle the thresholding problem. The design was done specifically for genomic
expression data but it is probably adaptable to other kinds of networks. We developed a mixed approach based on thequantification of a globalMI criteria forwhich it is possible to generate permutation p-values, and also a local pattern-sharingIBS analysis characterized by two quantities, the IBS value itself and the size m of the m-bit-word window. We calculated

5062 E. Hernández-Lemus et al. / Physica A 388 (2009) 5057–5069
1000
800
600
400
200
1200
Nu
mb
er o
f No
des
Network-Node Complexity versus IBS Bin Size
IBS Bin Size
Nodes
03 5 7 9 11 13 15 17 19 21
Fig. 2. Node Distribution versus IBS Bin Size (m) for networks constructed up to bin sizem = 3 to 19.
8000
7000
6000
4000
5000
3000
2000
1000
Nu
mb
er o
f ed
ges
0
9000
5 7 9 11 13 15 17 19
IBS Bin Size
3 21
Edges
Network-Link Complexity versus IBS Bin Size
Fig. 3. Link Distribution versus IBS Bin Size (m) for networks constructed up to bin sizem = 3 to 19.
the IBS index for the GEVs of the genes and form values from 3 to 19 (the algorithmic complexity of the calculations growsexponentially som = 19was anupper bound for our calculations). For the sake of stringencyweonly retained as interactionsthose pairs of genes whose GEVs have∆∗m = 1 corresponding to the higher degree of correlation.In Section 3.1we defined a IBS (∆m), an informationmeasure (or conversely, the complementary probabilitymeasure∆∗m
to account for information theoretical entropy). Since by construction the ∆∗m’s are independent quantities, maximizationof every measure∆∗m considered part of the ensemble implies maximization of the global information theoretical entropy.By taking only extermal values∆∗m = 1we are thus appealing to aMaximum entropy criteria. As it can be seen in Figs. 2 and3 and in Tables 1 and 2, an asymptotic regime is attained for these networks for values ofm = 11 and up. We consider thusthat the networks inferred under the models ∆∗m = 1 and m ∈ (11, 19) to be the threshold networks. As we will describelater, we validated these networks by means of the combined MI + p-value criteria and also by means of several biological,experimental and data-availability conditions to finally obtain (Ψnet ) as is shown in Fig. 1.With regards to the network topological attributes some interesting features arise. The number of connected network
components (which in the case of biological networks are candidates to be identified as modules, and sometimes even asfunctional units) decreases as m increases in such a way that many of the apparent islands present for low values of mare absent in the final network (see Table 1). These islands are regarded as having under-threshold significance. A similarbehavior is obviously present in the case of the number of nodes (Fig. 2 and Table 1) and edges (Fig. 3 and Table 1) in thenetwork. It is interesting to note, however, that the number of edges has a non-monotonic decrease pattern as it could beseen on Fig. 3. With regards to the average clustering coefficient its value varies (in a slightly non-monotonic fashion) from0.850 to the asymptotic value 0.653. As it could be seen by comparison with the network density values (that in the case ofrandom networks is equal to both p and the average clustering coefficient) the values of the average clustering coefficientsare well above (more than one order of magnitude) those of an equivalent random network. This could be taken as evidencethat these inferred networks (including also the biologically validated network Ψnet ) possess the small-world property. By

E. Hernández-Lemus et al. / Physica A 388 (2009) 5057–5069 5063
Table 1Thresholding analysis I: Main topological attributes of the inferred networks as a function of IBS m-bin size. It is noticeable that these general topologicalfeatures reach an asymptotic value fromm = 11 on. Thus, for such quantities the inferred network becomes bin-size-independent.
m Connected components Clustering coefficient Nodes Edges Heterogeneity
3 174 0.850 1012 8434 1.1474 139 0.674 521 2896 1.4385 94 0.682 365 1865 1.3056 88 0.699 345 2201 1.3107 82 0.680 319 1370 1.1388 79 0.671 310 2163 1.2639 81 0.653 300 1205 1.16410 79 0.661 301 1422 1.21011 83 0.653 300 1112 1.19512 83 0.653 300 1112 1.19513 83 0.653 300 1112 1.19514 83 0.653 300 1112 1.19515 83 0.653 300 1112 1.19516 83 0.653 300 1112 1.19517 83 0.653 300 1112 1.19518 83 0.653 300 1112 1.19519 83 0.653 300 1112 1.195
Table 2Thresholding analysis II: Secondary topological attributes of the inferred networks as a function of IBS m-bin size. It is noticeable that, although thesequantities follow a somewhat more complex pattern in their topological feature values, nevertheless they also reach an asymptotic value fromm = 11 on.
m Centralization Average number of neighbors Density Scaling exponent (γ )
3 0.048 16.668 0.016 0.2214 0.071 11.117 0.021 0.2745 0.088 10.219 0.028 0.2826 0.085 12.759 0.037 0.1407 0.068 8.589 0.027 0.2978 0.095 13.955 0.045 0.0569 0.067 8.033 0.027 0.29710 0.086 9.449 0.031 0.21211 0.069 7.413 0.025 0.34012 0.069 7.413 0.025 0.34013 0.069 7.413 0.025 0.34014 0.069 7.413 0.025 0.34015 0.069 7.413 0.025 0.34016 0.069 7.413 0.025 0.34017 0.069 7.413 0.025 0.34018 0.069 7.413 0.025 0.34019 0.069 7.413 0.025 0.340
considering the values of the network heterogeneity (Table 1) and the average network connectivity distribution (that forall the inferred networks possessed a positive slope), we observe that highly connected nodes tend to clusterize.By looking at Table 2 one notices that the network centralization values were relatively small indicating that there is
more than one central hub in the network. The values for the network centralization were in the range of values knownfor biological networks [23]. The average number of sub-networks (islands) is relatively high yet one can notice that it isdiminished asm increases indicating that in some sense our thresholding procedure acts also as a decimation or percolationprocess. In all cases the network densitywas low and this indicates that the interaction between partnerswas in some sense,highly selective. The scaling exponent increased its value non-monotonically as we increasem. This indicates that the finalvalidated network is topologically robust. The main properties of the network are: a relatively high number of connectedcomponents (although by seeing Fig. 1 one sees that many of the islands are small 2- or 3-node clusters), a high clusteringcoefficient and average number of neighbors (pointing to a small-world effect), a relatively high percentage of shortest paths(also a small-world feature), a low network centralization (more than one leading hub), a small network density and a highnetwork heterogeneity (a signature of cumulative advantage or rich-gets-richer property).
4.3. Minimal size biologically validated network
Since, in this particular case, we are interested in the minimal size MaxEnt network, we decided to take only the moststringent IT criteria. In the present case, thismeans that we only consider as interaction partner genes that possessed a valueof∆∗m(gi, gj) = 1 ∀m. This means, expression profiles that were absolutely correlated (in the IT sense) on their binarym-bitword representations (i.e. up to the m ∈ (11, 19) asymptotic limit). To further examine the effect of different bin sizes inthe IBS inference process let us recall Figs. 2 and 3, that represent the Network Complexity (nodes and edges respectively)as a function of the IBS bin sizem. It is possible to look up at the effect of enlargingm. Form = 3 the inferred network (with
5064 E. Hernández-Lemus et al. / Physica A 388 (2009) 5057–5069
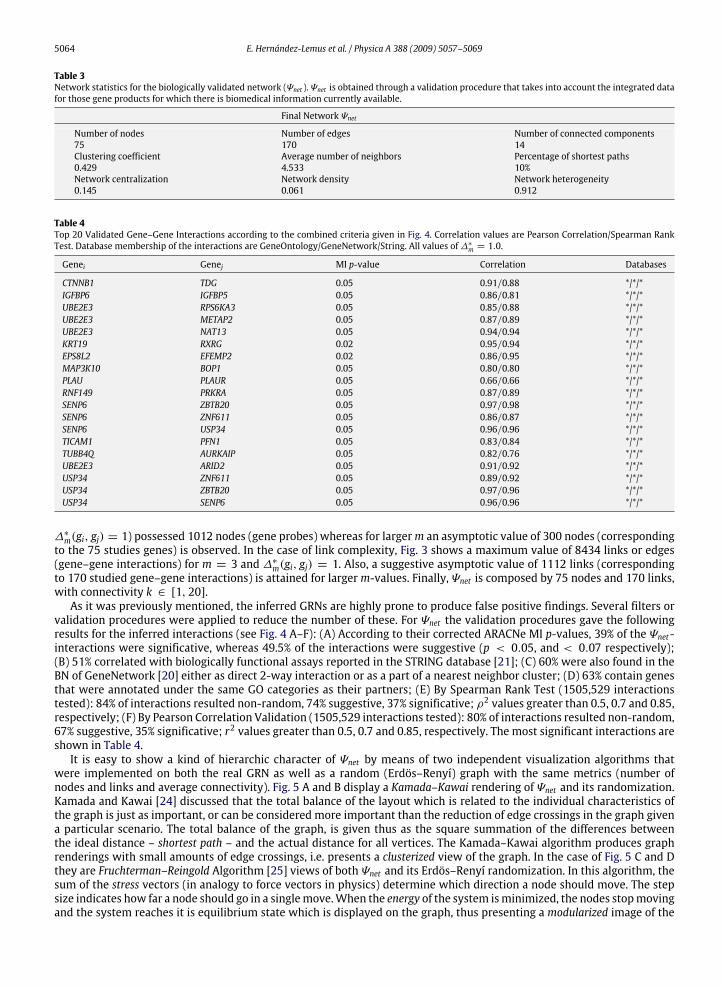
Table 3Network statistics for the biologically validated network (Ψnet ). Ψnet is obtained through a validation procedure that takes into account the integrated datafor those gene products for which there is biomedical information currently available.
Final Network Ψnet
Number of nodes Number of edges Number of connected components75 170 14Clustering coefficient Average number of neighbors Percentage of shortest paths0.429 4.533 10%Network centralization Network density Network heterogeneity0.145 0.061 0.912
Table 4Top 20 Validated Gene–Gene Interactions according to the combined criteria given in Fig. 4. Correlation values are Pearson Correlation/Spearman RankTest. Database membership of the interactions are GeneOntology/GeneNetwork/String. All values of∆∗m = 1.0.
Genei Genej MI p-value Correlation Databases
CTNNB1 TDG 0.05 0.91/0.88 */*/*IGFBP6 IGFBP5 0.05 0.86/0.81 */*/*UBE2E3 RPS6KA3 0.05 0.85/0.88 */*/*UBE2E3 METAP2 0.05 0.87/0.89 */*/*UBE2E3 NAT13 0.05 0.94/0.94 */*/*KRT19 RXRG 0.02 0.95/0.94 */*/*EPS8L2 EFEMP2 0.02 0.86/0.95 */*/*MAP3K10 BOP1 0.05 0.80/0.80 */*/*PLAU PLAUR 0.05 0.66/0.66 */*/*RNF149 PRKRA 0.05 0.87/0.89 */*/*SENP6 ZBTB20 0.05 0.97/0.98 */*/*SENP6 ZNF611 0.05 0.86/0.87 */*/*SENP6 USP34 0.05 0.96/0.96 */*/*TICAM1 PFN1 0.05 0.83/0.84 */*/*TUBB4Q AURKAIP 0.05 0.82/0.76 */*/*UBE2E3 ARID2 0.05 0.91/0.92 */*/*USP34 ZNF611 0.05 0.89/0.92 */*/*USP34 ZBTB20 0.05 0.97/0.96 */*/*USP34 SENP6 0.05 0.96/0.96 */*/*
∆∗m(gi, gj) = 1) possessed 1012 nodes (gene probes) whereas for largerm an asymptotic value of 300 nodes (correspondingto the 75 studies genes) is observed. In the case of link complexity, Fig. 3 shows a maximum value of 8434 links or edges(gene–gene interactions) for m = 3 and ∆∗m(gi, gj) = 1. Also, a suggestive asymptotic value of 1112 links (correspondingto 170 studied gene–gene interactions) is attained for largerm-values. Finally, Ψnet is composed by 75 nodes and 170 links,with connectivity k ∈ [1, 20].As it was previously mentioned, the inferred GRNs are highly prone to produce false positive findings. Several filters or
validation procedures were applied to reduce the number of these. For Ψnet the validation procedures gave the followingresults for the inferred interactions (see Fig. 4 A–F): (A) According to their corrected ARACNe MI p-values, 39% of the Ψnet-interactions were significative, whereas 49.5% of the interactions were suggestive (p < 0.05, and < 0.07 respectively);(B) 51% correlated with biologically functional assays reported in the STRING database [21]; (C) 60% were also found in theBN of GeneNetwork [20] either as direct 2-way interaction or as a part of a nearest neighbor cluster; (D) 63% contain genesthat were annotated under the same GO categories as their partners; (E) By Spearman Rank Test (1505,529 interactionstested): 84% of interactions resulted non-random, 74% suggestive, 37% significative; ρ2 values greater than 0.5, 0.7 and 0.85,respectively; (F) By Pearson Correlation Validation (1505,529 interactions tested): 80% of interactions resulted non-random,67% suggestive, 35% significative; r2 values greater than 0.5, 0.7 and 0.85, respectively. The most significant interactions areshown in Table 4.It is easy to show a kind of hierarchic character of Ψnet by means of two independent visualization algorithms that
were implemented on both the real GRN as well as a random (Erdös–Renyí) graph with the same metrics (number ofnodes and links and average connectivity). Fig. 5 A and B display a Kamada–Kawai rendering of Ψnet and its randomization.Kamada and Kawai [24] discussed that the total balance of the layout which is related to the individual characteristics ofthe graph is just as important, or can be considered more important than the reduction of edge crossings in the graph givena particular scenario. The total balance of the graph, is given thus as the square summation of the differences betweenthe ideal distance – shortest path – and the actual distance for all vertices. The Kamada–Kawai algorithm produces graphrenderings with small amounts of edge crossings, i.e. presents a clusterized view of the graph. In the case of Fig. 5 C and Dthey are Fruchterman–Reingold Algorithm [25] views of both Ψnet and its Erdös–Renyí randomization. In this algorithm, thesum of the stress vectors (in analogy to force vectors in physics) determine which direction a node should move. The stepsize indicates how far a node should go in a singlemove.When the energy of the system isminimized, the nodes stopmovingand the system reaches it is equilibrium state which is displayed on the graph, thus presenting a modularized image of the

E. Hernández-Lemus et al. / Physica A 388 (2009) 5057–5069 5065
Fig. 4. PTC-GRN validation. Columns and rows represent gene–gene interactions and color-coded validation (Only in the electronic version) processoutcomes, respectively: (A) ARACNe - MI permutation p-value, (B) bio-functional STRING validation, (C) GeneNetwork Validation, (D) GO-annotation, (E)Spearman Test, (F) Pearson Correlation. Green = validated, Yellow = suggestive, Red = improbable, else = no data available. (For interpretation of thereferences to colour in this figure legend, the reader is referred to the web version of this article.)
Fig. 5. Kamada–Kawai [24] and Fruchterman–Reingold [25] renderings of real Ψnet (A & C, respectively) as well as an Erdös–Renyí randomized versionwith the same metrics (B & D, respectively).
network. It is noticeable that neither the Kamada–Kawai nor the Fruchterman–Reingold visualization schemes greatly affectthe random Erdös–Renyí renderings but in both cases the hierarchic character of the validated Ψnet network is displayed inthe form of both a highly communicated graph (Fig. 5 A) and a modular structure (Fig. 5 C). Interestingly enough the verysame modular structure topology present in Fig. 5 C is given by Fig. 1, pointing out to the fact that the modular structure ofFig. 5 C is not an artifact of the visualization algorithm, but a real feature of Ψnet .

5066 E. Hernández-Lemus et al. / Physica A 388 (2009) 5057–5069
Fig. 6. PTC-GRN GeneOntology Clustering. Ψnet -GRN Clusters are linked to their enriched GO-biological Process Categories.
Table 5Network topological features for Ψnet .
Topological attribute Distribution Related Property
Average clustering coefficient * 〈C〉 = 6.1957 k−0.8694 Hierarchic structureTopological coefficient Tcoeff = 1.011 k−0.125 Hierarchic structureNeighborhood connectivity 〈NC〉 = 2.910 k0.378 Cumulative advantageShortest path length F = 524.67− 167L; L ∈ [1, 3] Small worldCloseness centrality Ccent = 0.678 k0.093 Information flow
To make more evident the intrinsic hierarchic character of Ψnet we calculated the degree distributions for the followingindicators: average clustering coefficient, topological coefficient, number of shared neighbors, neighborhood connectivity,shortest path length, betweenness centrality and closeness centrality. Results can be seen on Table 5. In the case of theaverage clustering coefficient distribution 〈C(k)〉 a cross-over cut-off is present in the distribution for k < 8, this is mostprobably due to the relatively small size of Ψnet and the presence of a big number of islands of very small connectivity.This limitation also applies to the number of shared networks and the betweenness centrality calculations that are stronglyinfluenced by the size of the network [26]. With this in mind, only values for C(k > 8) are considered for the averageconnectivity distribution calculation. The presence of a negative exponent power-law on C(k) (see Table 5) is however,an evidence of a hierarchic structure in the network [27]. A similar conclusion can be drawn for the topological coefficientdistribution [28] also indicating the presence of hierarchic structure.With regards to the average neighborhood connectivitydistribution, one notices that neighbor connectivity follows an increasing power-law on the degree, displaying a rich-gets-richer behavior. The shortest path length distribution is characterized by a big negative slope on the frequency versusdistance plot, also most nodes are linked through a relatively small number of steps (L ≤ 3 for connected components),a feature commonly called small-world property. The closeness centrality distribution, which is a measure of how fast theinformation flows is also given as an increasing power-law on the degree, in such a way that the higher the degree of a node,the faster the information spreads from it. This means that highly connected nodes (hubs) are shortcuts in the networkinformation flow.To further explore the biological insight that we could gain from the topology of Ψnet we performed an analysis of
enrichment of GeneOntology biological process levels between the gene clusters (or islands) formed by the interactionsin the Ψopt set. The clustering procedure reveals interesting structural features: It was possible to observe biologicallysound meta-clusters (see Fig. 6): i.e. interconnected clusters formed of inferred gene islands, that share a GO-biologicalprocess annotation, characterizing for example, apoptotic-related processes (such as death, apoptosis, cell death, regulationof apoptosis, negative regulation of cell proliferation, apoptosis progression and positive regulation of programmed celldeath), cell differentiation and proliferation processes (Systematic development, regulation of cell proliferation, cellularcommunication, signal transduction, cell development, regulation of cell growth, RAS protein signaling, intracellularsignaling cascades, cellular organization and biogenesis, regulation of biological processes, regulation of cellular processes,

E. Hernández-Lemus et al. / Physica A 388 (2009) 5057–5069 5067
negative regulation of cell proliferation, etc.), immune response and signaling processes (Cellular defense and response,negative regulation of biological processes, differential response, response to stress, Rho protein signal transduction,immune response, response to external stimuli, RAS protein signaling, cellular defense and response, response to chemicalstimuli, immune system response, response to other organisms, etc.) and cytoskeleton, migration and adhesion relatedprocesses (cell–cell adhesion, regulation of cell adhesion, cellularmotility, cell adhesion, negative regulation of cell adhesion,regulation of cell migration, anatomic and structural development, cytoskeleton organization and biogenesis, anatomicstructure andmorphology, etc.). All of these bio-functional features are all together a kind of signature of cancermalignanciesand are over-represented in the meta-cluster array given in Fig. 6.
5. Discussion
Gene regulation is a complex phenomenon. A great variety of reverse engineering techniques have been developed todiscover the relations and interactions between genes and/or sets of genes. In the particular case of information theory basedmethodologies, most of them consider global correlations between GEVs (measured either on a simultaneous or dynamicway) such as mutual information, Kullback–Leibler divergences and so on. This has been, of course a very fruitful approach.We have nevertheless considered that, apart from global measures of information theoretical correlation, there is a need fora local analysis of correlation.We then proposed a complementary study based in the local pattern-sharing analysis betweenGEVs. A measure (IBS) that quantifies pattern-sharing of two time series under an information theoretical framework hasbeen developed in the past [12]. We applied IBS as a measure of interaction between two genes. The rationale behind thisanalysis is that the higher the degree of pattern-sharing between two GEVs the larger its mutual correlation will be. If one isto consider (as is done in the conclusive part of this work) only the more relevant interactions, one should look for the largescale pattern-sharing (i.e. larger values of the bin sizem). If one is looking for more subtle interactions, then a closer look atpattern-sharing should be adequate (smaller values ofm).Herewe inferred gene–gene regulatory interactions bymeans of both the local approach of IBS [12] and the globalmutual
information approach as implemented in ARACNe [1], to highlight both the discretized pattern-sharing and the continuousvariable description in terms of MI, as different but complementary measures of interaction that could shed light in thebiological mechanisms of gene regulation. The validity of this approach was determined by means of a wide variety ofinstances (mostly in silico). The results, as sketched in Fig. 4 are promissory, specially by taking into account the degree ofintricacy associated with handling human samples (in terms of both genetic heterogeneity and transcriptional complexitylevels) as well as the relatively small sample size (67 total biological samples) that we reached.The ultimate and most authoritative validation of these transcription regulatory interactions will be the biological-
functional one. This validation is, at the present moment under experimental design, as is the project to raise the numberof in-house thyroid neoplasia samples. There exists, however, experimental evidence supporting some of our findings.Beta 1-catenin (CTNNB1) encodes a cadherin-associated protein that is critical for the establishment and maintenance ofepithelial layers. CTNNB1 has been associated with phenotypic transformations (such as epithelia disruption and tumor cellmetastasis) in the development of thyroid carcinomas. Transcriptional targets of over-expressed CTNNB1were observed inmost malignant neoplasms but were absent in the case of benign thyroid tissues. It has been reported [29] that CTNNB1 isrelated with the activation of the WNT-signaling pathway and cyclin modulation. Interestingly, transcriptional partnersAURKA and TDG have found to play also a regulatory role in the WNT pathway in relation to thyroid carcinomas [30];PLAU/PLAUR modified transcriptional patterns of ECM1 and TMPRSS4 have been associated with thyroid neoplasms, andhave been suggested as a molecular fingerprint of suchmalignancies [31]. The role of the retinoid X receptor gamma (RXRG)transcription enhancer with regards to papillary thyroid cancer is discussed in Ref. [32]. A classifier was proposed basedon the comparative expression of the target genes of RXRG. Up-regulation of cytokeratin-19 a co-transcription moleculeis used as a signal for the differential diagnosis of thyroid neoplasms [33]. With regards to the insulin-like growth factorbinding proteins 5 and 6 (IGFBP5, IGFBP6) they are stated to be co-factors in the regulatory dysfunction leading to thyroidcarcinomas [34]. MAP3K10 is related to the function of the RTK/RAS/RAF/MAPK pathway, a strongly associated molecularroute to papillary thyroid carcinomas [35]. The zinc finger ZNF611 has been reported to affect lymph node metastases insomatic mutations of the RET oncogene [36]. It is noticeable that all of these transcription factors and/or co-factors are wellvalidated nodes in the PTC-GRN network. In fact, all of them are in the experimental and clinical proposed validation setupthat could be seen on Table 4. In the case of specific network motifs, it is remarkable the cluster formed by SENP6, NBPF11,ZNF611, ITPR2, USP34 and ZBTB2D. This is so because, with the exception of ITPR2 these genes are not commonly associatedwith cancer but are important genes in thyroid malfunctions [34]. In particular USP34 has been found over-expressed bothin mRNA and proteomic analyses of adrenal thyroid neoplasms [32]. With regards to specific proliferation indicators in PTC,EPS8L1 and its partners DGAT1 and PRDM15 seems promising but more specific experimental studies have to be done beforereaching any conclusion. The biological outreach of the present findings is thus to be further investigated and validatedwithregards to the actual molecular mechanisms of thyroid carcinogenesis and its clinical consequences.As stated on Section 4.1. microarray gene expression experiments were performed to compare the patterns of expression
between papillary thyroid carcinoma and goiter tissue. From the set of statistically-significant differentially expressedgenes, we constructed PTC-GRN as a means to discover a set of functional relations pertinent to papillary thyroid cancerphysiopathology. The knowledge of such functional relations is essential to design and perform further investigationsleading to the discovery of therapeutic targets. In this sense network biology could be seen as a powerful hypotheses

5068 E. Hernández-Lemus et al. / Physica A 388 (2009) 5057–5069
generation methodology in the context of functional genomics. In conclusion, information theoretical methods result inpowerful tools to reconstruct GRNs. Problems like low signal to noise ratios, under-sampling, nonlinear interactions, delays,etc., could be coped with in a systematic manner under the MaxEnt Formalism. The PTC-GRN obtained was validated byseveral in silico analysis. A further validation in vivo is under experimental design, especially in the case of the top-20interactions. The PTC-GRN resulted in a robust topological structure, as it could be seen bymeans of several graph theoreticalanalyses. The degree distribution for the final GRN was scale-free showing a high robustness (i.e. the scaling exponentγ ' 1), the presence of the small-world property and maybe some evidence of a form of preferential attachment. PTC-GRNshowed also a high degree ofmodularity. However, themost outstanding result to datewas the discovery of some regulatoryinteractions among genes previously related to PTC and the biological implications of the correlated gene clusters.
Acknowledgements
The authors thank Professor Leopoldo Garcia-Colin Scherer (UAM/El Colegio Nacional) for his helpful discussion andcritical revision of the manuscript, as well as the two anonymous reviewers for valuable suggestions that significantlyimproved the manuscript.
References
[1] A.A. Margolin, I. Nemenman, K. Basso, C. Wiggins, G. Stolovitzky, R. Dalla Favera, A. Califano, ARACNe: An algorithm for the reconstruction of generegulatory networks in a mammalian cellular context, BMC Bioinformatics 7 (Suppl I) (2006) S7. doi:10.1186/1471-2105-7-S1-S7.
[2] M. Bansal, V. Belcastro, A. Ambesi-Impiombato, D. di Bernardo, How to infer gene networks from expression profiles, Mol. Syst. Biol. 3 (78) (2007).[3] E.P. van Someren, L.F.A. Wessels, E. Backer, M.T.J. Reinders, Genetic network modeling, Pharmacogenomics 3 (4) (2002) 507–525.[4] H. de Jong, Modeling and simulation of genetic regulatory systems: A literature review, J. Comput. Biol. 9 (1) (2002) 67–103.[5] H.K. Türköz, H. Oksüz, Z. Yurdakul, D. Ozcan, Galectin-3 expression in tumor progression andmetastasis of papillary thyroid carcinoma, Endocr Pathol.19 (2) (2008) 92–96.
[6] H. Inohara, T. Segawa, A.Miyauchi, T. Yoshii, S. Nakahara, A. Raz,M.Maeda, E.Miyoshi, N. Kinoshita, H. Yoshida,M. Furukawa, Y. Takenaka, Y. Takamura,Y. Ito, N. Taniguchi, Cytoplasmic and serum galectin-3 in diagnosis of thyroidmalignancies, Biochem. Biophys. Res. Commun. 376 (3) (2008) 605–610.
[7] E.T. Jaynes, Information Theory and Statistical Mechanics, Phys. Rev. 106 (4) (1957) 620–639.[8] C. Cercignani, R. Illner, M. Pulvirenti, The Mathematical Theory of Dilute Gases, in: Applied Mathematical Sciences, vol. 106, Springer-Verlag, 1994.[9] D. Pe’er, Bayesian network analysis of signaling networks: A primer, Science STKE 281 (2005) p14.[10] N. Friedman, M. Linial, I. Nachman, D. Pe’er, Using Bayesian networks to analyze expression data, J. Comput. Biol. 7 (601) (2000).[11] H. Li, M. Zhan, Analysis of gene coexpression by B-spline based CoD estimation, EURASIP J. Bioinform. Syst. Biol. (2007) doi:10.1155/2007/49478.[12] A.C. Yang, S.S. Hseu, H.W. Yien, A.L. Goldberger, C.K. Peng, Linguistic analysis of the human heartbeat using frequency and rank order statistics, Phys.
Rev. Lett. 90 (2003) 108103.[13] N. van Kampen, Stochastic Processes in Physics and Chemistry, North Holland, Elsevier, The Netherlands, 1997.[14] As is already mentioned in reference [12] (specifically in reference note [4] therein), it is possible and sometimes desirable to use different weighting
functions F(wk) in Eq. (5). We choose to use a weight based on Shannon’s information, for two related reasons: (1) It considers directly the amountof information that a given wk contributes to the ensemble, somehow ruling-out non-existent or non-informative wk ’s. (2) For this very reason, itlowers the computational burden (hence computing time) associated with many comparisons. The functional form of F(wk)we used here is alreadyimplemented in IBS on its standard form (see http://www.physionet.org/physiotools/ibs/doc/node2.html).
[15] http://genomequebec.mcgill.ca/FlexArray/.[16] www.physionet.org/physiotools/.[17] P. Shannon, A. Markiel1, O. Ozier, N.S. Baliga, J.T. Wang, D. Ramage, N. Amin, B. Schwikowski, T. Ideker, Cytoscape: A Software Environment for
Integrated Models of Biomolecular Interaction Networks, Genome Res. 13 (2003) 2498–2504. Also http://www.cytoscape.org.[18] W. de Nooy, A. Mrvar, V. Batagelj, Exploratory Social Network Analysis with Pajek, CUP, New York, 2005. Also http://vlado.fmf.uni-lj.si/pub/networks/
pajek/.[19] http://cran.r-project.org/.[20] http://humgen.med.uu.nl/lude/genenetwork/;
See also L. Franke, H. van Bakel, L. Fokkens, E.D. de Jong, M. Egmont-Petersen, C. Wijmenga, Reconstruction of a functional human gene network, withan application for prioritizing positional candidate genes, Am. J. Hum. Genet. 78 (6) (2006) 1011–1025.
[21] C. von Mering, L.J. Jensen, M. Kuhn, S. Chaffron, T. Doerks, B. Krüger, B. Snel, P. Bork, STRING 7-recent developments in the integration and predictionof protein interactions, Nucleic Acids Res. 35 (Database issue) (2007) D358-–62. also http://string.embl.de/.
[22] http://www.geneontology.org/, see also http://fatigo.bioinfo.cipf.es/.[23] J. Dong, S. Horvath, Understanding network concepts in modules, BMC Syst. Biol. 1 (24) (2007) (see especially Table 1).[24] T. Kamada, S. Kawai, An algorithm for drawing general undirected graphs, Inform. Process. Lett. 31 (1988) 7–15.[25] T.M.J. Fruchterman, E.M. Reingold, Graph drawing by force-directed placement, Soft. Pract. Exp. 21 (11) (1991).[26] M.E.J. Newman, A measure of betweenness centrality based on random walks. arXivcond-mat/0309045, (2003).[27] E. Ravasz, A.L. Somera, D.A. Mongru, Z.N. Oltvai, A.-L. Barabási, Hierarchical organization of modularity in metabolic networks, Science 297 (2002)
1551–1555.[28] U. Stelzl, U. Worm, M. Lalowski, C. Haenig, F.H. Brembeck, H. Goehler, M. Stroedicke, M. Zenker, A. Schoenherr, S. Koeppen, J. Timm, S. Mintzlaff,
C. Abraham, N. Bock, S. Kletzmann, A. Goedde, E. Toksöz, A. Droege, S. Korbitsch, B. Korn, W. Birchmeier, H. Lehrach, E.E. Wanker, A humanprotein–protein interaction network: a resource for annotating the proteome, Cell 122 (2005) 957–968.
[29] P.M.Weinberger, B.L. Adam, C.G. Gourin,W.H.Moretz III, R.J. Bollag, B.Y.Wang, Z. Liu, J.R. Lee, D.J. Terris, Association of nuclear, cytoplasmic expressionof galectin-3 with beta-catenin/Wnt-pathway activation in thyroid carcinoma, Arch. Otolaryngol. Head Neck Surg. 133 (5) (2007) 503–510.
[30] S. Ruiz-Llorente, C. Montero-Conde, R.L. Milne, C.M. Moya, A. Cebrian, R. Leton, A. Cascon, F. Mercadillo, I. Landa, S. Borrego, G. Perez de Nanclares,C. Alvarez-Escola, J.A. Diaz-Perez, A. Carracedo, M. Urioste, A. Gonzalez-Neira, J. Benitez, P. Satisteban, J. Dopazo, B.A. Ponder, M. Robledo, MedullaryThyroid Carcinoma Clinical Group, Association study of 69 Genes in the Ret Pathway identifies low-penetrance loci in Sporadic Medullary ThyroidCarcinoma, Cancer Res. 67 (19) (2007) 9561–9567.
[31] E. Kebebew, M. Peng, E. Reiff, Q-Y. Duh, O.H. Clark, A. McMillan, ECM1 and TMPRSS4 are diagnostic markers of malignant thyroid neoplasms andimprove the accuracy of fine needle aspiration biopsy, Ann. Surg. 242 (3) (2005) 353–363.
[32] B. Jarzab, M. Wiench, K. Fujarewicz, K. Simek, M. Jarzab, M. Oczo-Wojciechowska, J. Wloch, A. Czariecka, E. Chmielik, D. Lange, A. Pawlaczek, S. Szpak,E. Gubala, A. Swiernaiak, Gene expression profile of papillary thyroid cancer: Sources of variability and diagnostic implications, Cancer Res. 65 (4)(2005) 1587–1597.

E. Hernández-Lemus et al. / Physica A 388 (2009) 5057–5069 5069
[33] M.L. Prasad, N.S. Pellegata, Y. Huang, H.N. Nagaraja, A. de la Chappelle, R.T. Kloos, Galectrin-3, fibronectin-1, CITED-1, HBME1 and cytokeratin-19immunohistochemistry is useful for the differential diagnosis of thyroid tumors, Mod. Pathol. 18 (2005) 48–57.
[34] M.A. Aldred, Y. Huang, S. Liyanarachchi, N.S. Pellegata, O. Gimm, S. Jhiang, R.V. Davuluri, A. de la Chapelle, C. Eng, Papillary and follicular thyroidcarcinomas show distinctly different microarray expression profiles and can be distinguished by a minimum of five genes, J. Clin. Oncol. 22 (17)(2004) 3531–3539.
[35] G. Risco-Eizaguirre, P. Santisteban, New insights in throid follicular cell biology nad its impact in thyroid cancer therapy, Endoc. Relat. Cancer 14(2007) 957–977.
[36] R. Elisei, B. Cosci, C. Romei, V. Bottici, G. Renzini, E. Molinaro, L. Agate, A. Vivaldi, P. Faviana, F. Basolo, P. Miccoli, P. Berti, F. Pacini, A. Pinchera,Prognostic significance of somatic RET oncogene mutations in sporadic medullary thyroid cancer: A 10 years follow up study, J. Clin. Endocrinol.Metab., Pub-Ahead (2007) doi:10.1210/jc.2007-1714.
Related Documents