Information Technology Adoption Behavior Life Cycle: Toward a Technology Continuance Theory (TCT). By: Chechen Liao, Prashant Palvia and Jain-Liang Chen Liao, C, Palvia, P., and Chen, J-L. “Information Technology Adoption Behavior Life Cycle: Toward a Technology Continuance Theory (TCT).” International Journal of Information Management. 29(4), 2009, pp. 309-320. Made available courtesy of Elsevier: http://www.sciencedirect.com/science/article/pii/S0268401209000292 ***Reprinted with permission. No further reproduction is authorized without written permission from Elsevier. This version of the document is not the version of record. Figures and/or pictures may be missing from this format of the document. *** Abstract: For over a decade, researchers have devoted much effort to construct theoretical models, such as the Technology Acceptance Model (TAM) and the Expectation Confirmation Model (ECM) for explaining and predicting user behavior in IS acceptance and continuance. Another model, the Cognitive Model (COG), was proposed for continuance behavior; it combines some of the variables used in both TAM and ECM. This study applied the technique of structured equation modeling with multiple group analysis to compare the TAM, ECM, and COG models. Results indicate that TAM, ECM, and COG have quite different assumptions about the underlying constructs that dictate user behavior and thus have different explanatory powers. The six constructs in the three models were synthesized to propose a new Technology Continuance Theory (TCT). A major contribution of TCT is that it combines two central constructs: attitude and satisfaction into one continuance model, and has applicability for users at different stages of the adoption life cycle, i.e., initial, short-term and long-term users. The TCT represents a substantial improvement over the TAM, ECM and COG models in terms of both breadth of applicability and explanatory power. technology continuance theory | expectation confirmation model | expectation Keywords: disconfirmation model | technology acceptance model | cognitive model | adoption behavior | information management | moderator Article: 1. Introduction Over the years, information system (IS) usage has been a prominent topic in IS research. Prior efforts have sought to establish a theoretical base by explicating the determinants and mechanisms of users’ adoption decisions. It is widely believed that the adoption process

Welcome message from author
This document is posted to help you gain knowledge. Please leave a comment to let me know what you think about it! Share it to your friends and learn new things together.
Transcript
Information Technology Adoption Behavior Life Cycle: Toward a Technology Continuance Theory (TCT).
By: Chechen Liao, Prashant Palvia and Jain-Liang Chen
Liao, C, Palvia, P., and Chen, J-L. “Information Technology Adoption Behavior Life Cycle: Toward a Technology Continuance Theory (TCT).” International Journal of Information Management. 29(4), 2009, pp. 309-320.
Made available courtesy of Elsevier: http://www.sciencedirect.com/science/article/pii/S0268401209000292
***Reprinted with permission. No further reproduction is authorized without written permission from Elsevier. This version of the document is not the version of record. Figures and/or pictures may be missing from this format of the document. ***
Abstract:
For over a decade, researchers have devoted much effort to construct theoretical models, such as the Technology Acceptance Model (TAM) and the Expectation Confirmation Model (ECM) for explaining and predicting user behavior in IS acceptance and continuance. Another model, the Cognitive Model (COG), was proposed for continuance behavior; it combines some of the variables used in both TAM and ECM. This study applied the technique of structured equation modeling with multiple group analysis to compare the TAM, ECM, and COG models. Results indicate that TAM, ECM, and COG have quite different assumptions about the underlying constructs that dictate user behavior and thus have different explanatory powers. The six constructs in the three models were synthesized to propose a new Technology Continuance Theory (TCT). A major contribution of TCT is that it combines two central constructs: attitude and satisfaction into one continuance model, and has applicability for users at different stages of the adoption life cycle, i.e., initial, short-term and long-term users. The TCT represents a substantial improvement over the TAM, ECM and COG models in terms of both breadth of applicability and explanatory power.
technology continuance theory | expectation confirmation model | expectation Keywords:disconfirmation model | technology acceptance model | cognitive model | adoption behavior | information management | moderator
Article:
1. Introduction
Over the years, information system (IS) usage has been a prominent topic in IS research. Prior efforts have sought to establish a theoretical base by explicating the determinants and mechanisms of users’ adoption decisions. It is widely believed that the adoption process

influences successful use of information systems (Grover et al., 1998; Karahanna, Straub, & Chervany, 1999). Many scholars have investigated the factors that influence the diffusion of IS innovations in organizations (e.g., Gallivan, 2001, Rogers, 2003 and Swanson and Ramiller, 2004; Zhu, Kraemer, & Xu, 2006). Others have proposed psychological models for explaining and predicting users’ behavior toward IS adoption at the individual level (e.g., Bhattacherjee, 2001 and Bhattacherjee and Premkumar, 2004; Davis, Bagozzi, & Warshaw, 1989; Venkatesh and Davis, 2000 and Venkatesh et al., 2003). These two streams of research suggest that the determinants and mechanisms for an individual's adoption decision may vary from stage to stage during the lifecycle of IS usage, i.e., at initial adoption and then subsequent stages of continued usage. Thus using the same or misdirected managerial tactics to facilitate adoption behavior across various stages may result in negative consequences and reduced IS effectiveness. Though different behavioral models (Karahanna, Straub, & Chervany, 1999; Jasperson, Carter, & Zmud, 2005) have been recognized as relevant to user adoption behavior at different stages, what is lacking is a clear comparison of these models in terms of their theoretical underpinning and application practices. Without a clear understanding of the differences in users’ adoption behavior over time, both scholars and practitioners will not be able to effectively manage the issues related to system design, individual cognition, and organizational actions.
The Technology Acceptance Model (TAM) (Davis, 1986 and Davis et al., 1989) has dominated IS “use” research and has led to much exploration and widespread discussion over its application and extensions (e.g., Lai and Li, 2005 and Shih, 2004b). In more recent years, the expectation confirmation model (ECM) (Bhattacherjee, 2001) was proposed to describe user's behavior in “continue to use” an information system. ECM was adapted from the consumer satisfaction/dissatisfaction model (CS/D) (Churchill and Suprenant, 1982, Oliver, 1981, Oliver and Burke, 1999 and Tse and Wilton, 1988) that was originally designed in marketing research to model consumer's repurchase behavior. TAM with its focus on initial acceptance of an IS, theorizes that system use is directly determined by behavioral intention to use, and in turn motivated by the user's attitude toward system use. At the same time, ECM's objective is to evaluate an individual's continuance and loyalty for system use and argues that user satisfaction is the most important requirement determining a user's intention for continued use. While TAM has enjoyed widespread use and related literature has grown tremendously, there has been limited activity in ECM, post-adoption behavior and IS continuance research (Bhattacherjee, 2001 and Bhattacherjee and Premkumar, 2004). Many studies have been conducted to verify TAM with diverse empirical data and in various application contexts (Shih, 2004a, Vijayasarathy, 2003 and Yu et al., 2005), although the results have not always been consistent.
In comparing the theoretical underpinnings and application practices of TAM and ECM, three major differences can be found. First, while TAM has been applied to examine continuance and post-adoption behavior (Gefen, Karahanna, & Straub, 2003; Karahanna et al., 1999, Shih, 2004b and Taylor and Todd, 1995), its emphasis is on examining variables that lead to initial

acceptance. On the contrary, ECM focuses on factors that influence retention and loyalty, as the long-term viability of an IS and success depends on continued use rather than first-time use alone (Bhattacherjee, 2001). Second, TAM proposes that the behavior toward system use can be determined by the user's attitude. However, ECM hypothesizes that IS continuance is primarily affected by user satisfaction. Many theorists believe that conceptually satisfaction and attitude are two distinct constructs (Oliver, 1980, Oliver, 1981 and Tse and Wilton, 1988). Third, TAM considers two salient beliefs: perceived usefulness and perceived ease of use as underlying motivators affecting user's attitude and intention toward behavior. These behavioral beliefs are highly related to outcome expectations (Ajzen, 1991, Bandura, 1986 and Davis et al., 1989). Thus TAM only adopts user expectations, usually measured in a single time period, to explain and predict behavioral intention. On the other hand, ECM is based on CS/D which posits that user satisfaction has a strong relationship with disconfirmation, which is a function of the difference between user expectations and perceived performance. According to CS/D, a user's expectation must be measured before system use whereas perceived performance is measured after the experience. However, CS/D ignores potential changes in outcome expectations across the accumulation of user's experience and the impact on user's psychological state and cognitive process. ECM replaces pre-consumption expectations with post-consumption expectations and postulates that satisfaction is a function of expectations and confirmation.
Although many theoretical differences exist between TAM and ECM, no empirical study, to our knowledge, has examined the influences of these differences on explaining and predicting users’ psychological states and behavior. In comparing them, many interesting issues are worthy of exploring. For example, which model is more powerful or more suitable? How do the predictive power of the models change from initial acceptance of IS to continued use? Is it appropriate to apply TAM to predict and explain user behavior toward technology continuance? Note that while TAM uses attitude and ECM uses satisfaction, an earlier landmark paper by Oliver (1980) used both attitude and satisfaction as antecedents to intention. In fact, in the Cognitive Model (COG) proposed by Oliver, satisfaction is postulated as an antecedent to post-exposure attitude. Is it possible to develop a hybrid model which combines attitude and satisfaction and relevant parts of TAM and ECM, and has higher explanatory power for describing user behavior toward technology continuance?
We address the above questions in this study. The study investigates differences in model descriptions, model-fit, and explanatory power of the three intention models: TAM, ECM, and COG. Subsequently, we develop an enhanced theoretical model, called Technology Continuance Theory (TCT) which integrates the three existing models, for representing and explaining user behavior toward technology continuance. Specifically, the objectives of the study are:
1. Compare the three models: TAM, ECM, and COG. Test their hypotheses, and compare their path coefficients and explanatory powers.
2. Compare the three models across various stages of IS continuance. The three stages included are: initial adopters, short-term users, and long-term users.
3. Propose an enhanced Technology Continuance Theory (TCT) based on the characteristics of TAM, ECM and COG.
4. Evaluate the model fit and explanatory power of TCT, and compare it with TAM, ECM, and COG.
2. Literature review
2.1. Technology Acceptance Model
In the late 1980s, the TAM was developed for the IS discipline (Davis, 1986 and Davis et al., 1989). It was based on the theory of reasoned action (Fishbein & Ajzen, 1975), an intention theory that has been widely accepted for several decades. TAM received wide attention from IS researchers for at least three reasons. First, it has a strong foundation in psychological theory (Chau, 1996 and Taylor and Todd, 1995). Second, it is parsimonious and can be used as a guideline to develop a successful information system (Venkatesh & Davis, 2000). Third, past stream of research supports the robustness of the model across time, setting, populations, and technologies (Venkatesh & Davis, 2000).
TAM hypothesizes that actual system use is determined by users’ behavioral intention to use (BI), which in turn is influenced by users’ attitudes toward using (A). Attitude and behavioral intention are two internal psychological variables that have direct effects on user behavior. By definition, behavioral intention is a measure of the strength of one's willingness to try and exert while performing certain behavior (Ajzen, 1991). Attitude refers to “the degree of a person's positive or negative feelings about performing the target behavior (Davis et al., 1989, p. 984).” TAM postulates that the internal variables are motivated by two external factors regarding system design characteristics: perceived usefulness (PU) and perceived ease of use (PEOU). PEOU can directly affect both attitude and PU. PU is defined as “the prospective user's subjective probability that using a specific application system will increase job performance (Davis et al., 1989, p. 985).” PEOU refers to “the degree to which the prospective user expects the target system to be free of effort (Davis et al., 1989, p. 985).” An additional relationship from PU to BI is based on the assumption that intention to use can be based on an expected improvement in job performance regardless of attitude. TAM and its relationships are shown later in Fig. 3.

Several attempts have been made to enhance the explanatory and predictive power of TAM. Taylor and Todd (1995) integrated the Theory of Planned Behavior (TPB) (Ajzen, 1991) to TAM and proposed a decomposed version of TPB. Venkatesh and Davis (2000) proposed an extended model of TAM which incorporates social influence processes and cognitive instrumental processes. Several researchers have integrated variables from the Innovation Diffusion Theory (Rogers, 2003) to TAM or other intention models. Recently, TAM was combined with four core determinants of IT usage (Venkatesh et al., 2003). On an ad hoc basis, constructs such as trust, perceived enjoyment, training, privacy, security, compatibility, and self-efficacy have been added to the basic TAM (Mao and Palvia, 2006, Shih, 2004a, Vijayasarathy, 2003 and Yu et al., 2005). Despite reported improvement in the explanatory power of these new models, IS researchers have maintained their interest in TAM due to its parsimony and replicability (Lai & Li, 2005). TAM has even been applied to examine continuance and post-adoption behavior (Gefen et al., 2003, Karahanna et al., 1999 and Taylor and Todd, 1995).
2.2. Expectation Confirmation Model
What shifts the attention of users from initial acceptance to continued use is generally explained by the CS/D, an alias of the “expectation disconfirmation model” (Oliver, 1993 and Spreng and Chiou, 2002; Van Montfort, Masurel, & Van Rijn, 2000) and the “expectation disconfirmation paradigm” (McKinney, Yoon, & Zahedi, 2002; Patterson, Johnson, & Spreng, 1997). CS/D postulates that an individual's usage behavior is a series of acceptance, experience, verification, and continued use processes (Oliver, 1980). First, external variables such as system design characteristics that cause individual to believe in using an IS will bring certain outcomes. Second, an individual's outcome expectations lead to positive or negative feelings about system usage and in turn influence his or her actual acceptance. Third, after a certain period of usage experience, the perceived performance of the IS is compared with pre-adoption expectations. The evaluation results in confirmation or disconfirmation, which leads to adjustment in the individual's satisfaction level. Finally, the satisfaction level either enhances or inhibits the intention for IS continuance.
According to CS/D (Fig. 1), user satisfaction is the most immediate motivator that determines an individual's intention to continued use. User satisfaction is posited as a linear function proportional to disconfirmation. Disconfirmation is defined as the discrepancy between a user's pre-adoption expectations and perceived performance (Churchill and Suprenant, 1982 and Oliver, 1980). The polarity of disconfirmation is positive when the perceived performance is higher than pre-adoption expectations and the user is satisfied, or is negative when perceived performance falls short of expectations and the user is dissatisfied. Consequently, user's pre-

adoption expectations are hypothesized to have a negative relationship with disconfirmation owing that lower expectations are more likely to be exceeded by perceived performance and this results in positive disconfirmation. On the contrary, perceived performance is suggested to have positive effect on disconfirmation as higher perceived performance is more likely to surpass pre-adoption expectations.
Fig. 1. Consumer satisfaction/dissatisfaction model (CS/D).
Many theorists posit that pre-adoption expectations can have a direct effect on user satisfaction (Oliver, 1981) and perceived performance (Churchill and Suprenant, 1982 and Oliver and Burke, 1999; Spreng, MacKenzie, & Olshavsky, 1996). Assimilation theory refers to a process by which what is perceived in the outside world is integrated into existing schema without changing the structure of that schema, but potentially at the cost of squeezing the external perceptions to fit the pigeon-holing and stereotyping (Piaget, 1968). However, cognitive dissonance (Festinger, 1957) may occur if the evidence of the external perceptions is conspicuous. In this case, the internal world has to accommodate the existing schema to the evidence and then adapt to it (Piaget, 1968). Assimilation and accommodation are two complementary processes of adaptation and inseparable in a dialectical relationship. These forces account for the direct relationship between expectations and satisfaction. Other scholars find that perceived performance has a direct effect on user satisfaction (Churchill and Suprenant, 1982 and Tse and Wilton, 1988) and call the augmented model as the “expectance disconfirmation with performance” (Oliver, 1997).
The CS/D views disconfirmation and user satisfaction as internal variables concerning user's inner evaluative judgment and psychological state. The perceived performance and behavior are considered external variables that can directly influence the internal variables. CS/D is not dedicated to modeling IS continuance per se, but is a general model for describing a person's reiterative behavior in performing certain tasks (Oliver, 1980). Because CS/D does not specify expectations and perceived performance that are operative for a particular behavior, such as the continued use of IS, appropriate constructs and a model specific to IS need to be developed.

More recently, Bhattacherjee (2001) proposed the ECM for IS continuance based on CS/D. This adaptation required several theoretical extensions. First, ECM focuses only on post-acceptance variables. Second, while CS/D examines the effect of pre-consumption (ex ante) expectation, ECM amends CS/D and replaces pre-consumption with post-consumption (ex post) expectation. Third (ex post) expectation is represented in ECM by perceived usefulness—consistent with the definition of expectation and because perceived usefulness is a cognitive belief salient to IS use. The construct of perceived usefulness is borrowed from TAM. Since continuance is an extension of initial acceptance, many believe that both initial acceptance and continued use should recruit some of the same external variables to predict and explain a user's inner evaluation process and judgment (Bhattacherjee, 2001). Fourth, the construct of perceived performance has been removed from ECM. According to theoretical definitions within CS/D, disconfirmation is formulated as a direct function of the difference between pre-adoption expectations and perceived post-adoption performance. Therefore, the effect of perceived performance is already captured in the confirmation and satisfaction constructs. The ECM model is shown in Fig. 4.
Note that rational users may try to adjust their perceptions in order to reduce the psychological tension caused by disconfirmation between pre-adoption expectations and perceived performance. Disconfirmation during actual use could affect post-adoption expectations based on the cognitive dissonance theory (Festinger, 1957). According to the theory, individuals tend to seek consistency among their cognitions. When there is an inconsistency or dissonance between perception and inner schema, something must change to eliminate the dissonance (Festinger, 1957). In the case of a discrepancy between perceived performance and expectations, it is most likely that expectations will change to accommodate the perception.
2.3. Cognitive model of satisfaction decisions
The differences between attitude and satisfaction have been widely discussed. Though some scholars view attitude as synonymous with satisfaction (LaTour & Peat, 1979), most consider the two conceptually distinct. Attitude is defined as an individual's overall evaluation of a product or service offering, while satisfaction refers to as an individual's post-consumption evaluation of a specific transaction (Bolton and Drew, 1991 and Hunt, 1977). Generally speaking, attitude is an emotion concerning the degree of a pleasure or displeasure with a product or service, whereas satisfaction is an evaluation of that emotion based on the performance of the product or service (Hunt, 1977). According to assimilation theory, attitude can only change slowly across time, as the prior adaptation (expectation) level serves as an anchor for subsequent judgment of experiences (Oliver, 1981). Therefore, satisfaction is a transient and experience-specific affect, while attitude is relatively more enduring transcending all prior experiences. However, though
attitude and satisfaction are posited as two distinct constructs, it is possible to synthesize the effects of attitude and satisfaction on user behavior.
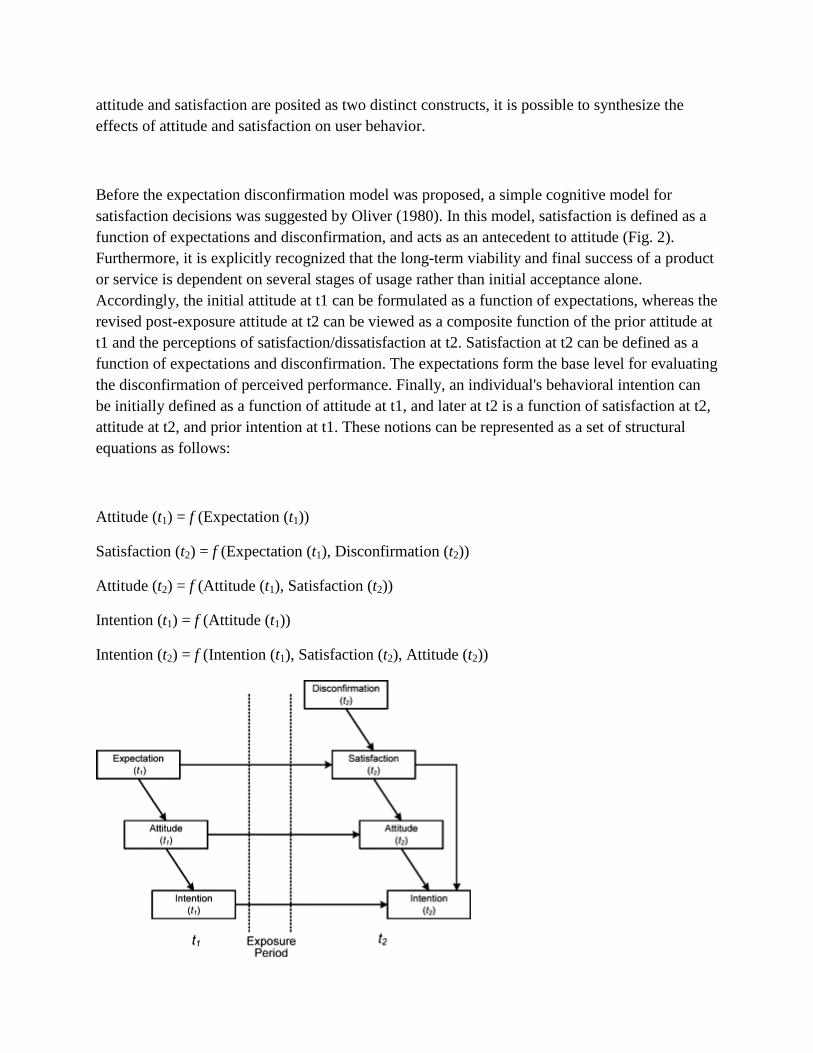
Before the expectation disconfirmation model was proposed, a simple cognitive model for satisfaction decisions was suggested by Oliver (1980). In this model, satisfaction is defined as a function of expectations and disconfirmation, and acts as an antecedent to attitude (Fig. 2). Furthermore, it is explicitly recognized that the long-term viability and final success of a product or service is dependent on several stages of usage rather than initial acceptance alone. Accordingly, the initial attitude at t1 can be formulated as a function of expectations, whereas the revised post-exposure attitude at t2 can be viewed as a composite function of the prior attitude at t1 and the perceptions of satisfaction/dissatisfaction at t2. Satisfaction at t2 can be defined as a function of expectations and disconfirmation. The expectations form the base level for evaluating the disconfirmation of perceived performance. Finally, an individual's behavioral intention can be initially defined as a function of attitude at t1, and later at t2 is a function of satisfaction at t2, attitude at t2, and prior intention at t1. These notions can be represented as a set of structural equations as follows:
Attitude (t1) = f (Expectation (t1))
Satisfaction (t2) = f (Expectation (t1), Disconfirmation (t2))
Attitude (t2) = f (Attitude (t1), Satisfaction (t2))
Intention (t1) = f (Attitude (t1))
Intention (t2) = f (Intention (t1), Satisfaction (t2), Attitude (t2))

Fig. 2. Oliver's cognitive model for satisfaction decision.
3. Research models
We plan to carefully evaluate the three theoretical models described above: Davis’ TAM (Davis, 1986), Bhattacherjee's ECM (Bhattacherjee, 2001), and Oliver's COG (Oliver, 1980). This evaluation would lead to a comparison of the three models as well as identify relationships across the various constructs. Although these models have been investigated individually in various empirical studies, their comparison has not been reported in the literature. Especially for Oliver's COG model, we could not find any empirical studies in the context of technology continuance.
Furthermore, we explicitly recognize that there are several stages of technology continuance. Past studies have examined users at only one stage of continuance, i.e., users have been examined at only one point in time. In order to enhance the robustness of our results, we classify users into three categories: initial adopters, short-term users, and long-term users, and examine the behavior of each.
One may argue the applicability of TAM in modeling user's continuance behavior, but as stated before, there is evidence that TAM has been used to examine continuance and post-adoption behavior (Gefen et al., 2003, Karahanna et al., 1999 and Taylor and Todd, 1995) and has been used in many longitudinal studies (Davis et al., 1989, Venkatesh, 2000, Venkatesh and Davis, 1996 and Venkatesh and Davis, 2000). While the original purpose of TAM was to explain initial technology acceptance, there has been some success in explaining continuance. Thus, the “Behavioral Intention” variable in the original TAM was relabeled as “IS Continuance Intention” to fit the context of IS continuance. In all of the models, the actual “use” variable is omitted, but previous studies have well established that “intention” is a good proxy variable for “use”. External variables are omitted, although they would make nice extensions to research once the core model has been fully developed. Finally, this is a cross-sectional study looking at variables only at time t2 in the COG model.
The three models are shown in Fig. 3, Fig. 4 and Fig. 5. The path hypotheses of the three models are listed as well. The justification for the ten hypotheses follows from the original models as well as the discussion earlier. Note that the length of experience is a moderator variable in this study. Thus the hypotheses apply to each of the three categories of users: initial adopters, short-term users, and long-term users. Thus, in effect, there are thirty hypotheses.

Hypothesis 1
. Attitude will positively affect behavioral intention.
Hypothesis 2
. Perceived usefulness will positively affect behavioral intention.
Hypothesis 3
. Perceived usefulness will positively affect attitude.
Hypothesis 4
. Perceived ease of use will positively affect attitude.
Hypothesis 5
. Perceived ease of use will positively affect perceived usefulness.
Hypothesis 6
. Satisfaction will positively affect behavioral intention.
Hypothesis 7
. Perceived usefulness will positively affect satisfaction.
Hypothesis 8
. Confirmation will positively affect satisfaction.

Hypothesis 9
. Satisfaction will positively affect attitude.
Hypothesis 10
. Confirmation will positively affect perceived usefulness.
Fig. 3. Technology Acceptance Model (TAM).
Fig. 4. Expectation Confirmation Model (ECM).

Fig. 5. Cognitive Model (COG).
Note that each of the three models: TAM, ECM and COG, excludes important constructs included in the other models. In order to develop an enhanced model of IS continuance, we integrate the six constructs included in the three models and propose the Technology Continuance Theory (TCT), as shown in Fig. 6. TCT is a three-level model with IS continuance intention as the final dependent variable. TCT includes two central constructs: satisfaction and attitude, and three first level antecedents: confirmation, perceived usefulness, and perceived ease of use. All of the hypotheses proposed in TAM, ECM, and COG are included in TCT.
Fig. 6. The Technology Continuance Theory (TCT).
4. Research design
In order to empirically test the three models and their hypotheses, a survey of three distinct user groups with varying levels of experience in using the Cyber University System (CUS) developed by a National University in southern Taiwan was conducted. The instrumentation, sampling methods, and scale validation process are described below.
4.1. Instrumentation
The survey instrument consisted of two parts: the first part asked demographic questions about the respondent while the second part included items to measure the theoretical constructs of TAM, ECM, and COG. Demographic information included: gender, age, educational level, occupation, experience in using CUS, total number of courses taken, and total hours of CUS usage per week.
Individual construct items were taken from previous studies and were adapted to fit to the context of this study. PU and PEOU were both measured using 4-item scales adapted from Venkatesh and Davis, 1996 and Venkatesh and Davis, 2000. CON, SAT, and INT items were adapted from Bhattacherjee (2001), using 3 items, 4 items, and 3 items respectively. Finally, ATT was measured using a 4-item scale adapted from Taylor and Todd (1995). Each item was measured using a 7-point Likert scale. The measurement items are included in Appendix A.
4.2. Sample organizations and respondents
The “Cyber University” e-learning system at a National University in southern Taiwan was chosen as the research context. CUS is a real-time and a well-established e-learning system providing not only asynchronous online teaching and learning services, but also synchronous group discussion, cyber meeting and office-hour services for registered students. In order to improve learning and teaching performance, CUS not only provides students online discussion boards, online exercises and real time chatting rooms for interactive learning, but also supports the faculty with many administrative tools for managing and monitoring students’ learning, such as the learning material management tool, homework, exams and grade management tool, and learning path tracking tool. There had been more than 2000 students registered in CUS, making it the most well-known and successful e-learning system in Taiwan.
Registered students of the Cyber University were chosen as subjects and were asked to complete the questionnaire described earlier. Almost all of the students (95%) are adult citizens scattered across many cities of Taiwan. Thus the sample frame has much diversity in respondent characteristics and is generally representative of adult e-learning adopters in Taiwan. In fact, more than 67% of the registrants are not even formal students of the University. These students voluntarily attend the online courses through the Internet. The Cyber University allows them to independently take courses during a semester and quit a course if it did not meet their needs. Even formal students are not mandated to take Cyber University courses. They can take traditional courses and use the e-learning system as an optional tool for facilitating their learning activities, e.g., course review, group discussion, cyber meeting, and reports delivering. Thus, for the most part, students are voluntary users of the Cyber University.
In order to collect data confidentially, Cyber University provides a survey service for faculty to collect data via e-mail. Initially, an invitation letter was sent to the administrator of Cyber University and then the letter was forwarded to registered students. The letter provided

information about the study and asked for their participation in providing perceptions about the use of CUS. It also provided a hyperlink which redirected them to an online questionnaire system. In order to increase the response rate, a follow-up letter was sent to the non-responding students after two weeks.
In total, 2800 letters were sent out and 626 valid questionnaires were returned. The response rate was 22.4%. Demographic data indicated that the respondents were 61.2% male, 44.2% were within the age group of 20–29, 33.1% were within the age group of 30–39, belonged to a wide range of professions (students only: 33.1%, professionals: 19.8%, academics: 15%, executives: 10.8%, self-employed: 4.2%, and retirees: 0.6%), and had varying levels of education (high school: 2%, technical school: 12.6%, college: 58.6%, master's degree: 24.8%, and doctoral degree: 2.1%). About seventy five percent of the respondents had at least taken one credit course. About thirty nine percent had CUS for more than 3 hours a week.
The length of experience in using CUS was treated as a moderating variable (Sun & Zhang, 2006) and classified into three categories: initial adopters if they had used the system less than 6 months, short-term users if they used it between 6 and 12 months, and long-term users if they used it for over 12 months. The breakdown was the following: 178 initial adopters (28.4%), 211 short-term users (33.7%), and 237 long-term users (37.9%).
To ensure that the online questionnaire had not caused a selection bias, profile of the sample frame provided by the Cyber University was compared with the profile of the respondents using χ2 tests. Results demonstrated that the characteristics of the respondents, such as gender, age, education, and occupation, had no significant differences from the sample frame. We also checked for systemic bias. The respondent sample was divided into two parts: early and late groups. These two groups were correlated on their demographic characteristics. The correlations of all characteristics were not significant, indicating that there was no such bias. Finally, the three groups of respondents: initial adopters, short-term users, and long-term users were compared and χ2 tests were employed to compare the profiles of the three groups. The results showed that the characteristics of the three groups had no significant differences in the frequency distributions of gender, age, education, and occupation.
4.3. Scale validation
Several tests were conducted to ensure scale validity. First, the measurement model was built by including all of the latent constructs and their indicators. Latent constructs were modeled as

reflective constructs, and the indicator items were allowed to freely correlate with each other. The six latent variables including PU, PEOU, CON, SAT, ATT, and INT were composed of 4, 4, 3, 4, 4, and 3 items respectively. The techniques of structural equation modeling (SEM) using the AMOS software for Windows were used to perform various analyses. Using the correlation matrix as the input, the measurement model shows strong fitness between the data and the model (χ2 = 430.041, df = 194, p = 0.00). The NFI was 0.97. Since χ2 and NFI may suffer from inconsistencies due to sampling characteristics ( Bollen, 1989 and Hair et al., 1998), we also examined several measures, such as χ2/df which should be less than 5 (Bentler, 1989); adjusted goodness-of-fit index (AGFI) which should be larger than 0.8 ( Henry and Stone, 1994 and Scott, 1994); goodness-of-fit index (GFI), normed fit index (NFI), relative fit index (RFI), and comparative fit index (CFI) which should all exceed 0.9; and root mean square error of approximation (RMSEA) which should be less than 0.10 (Hair et al., 1998). Results as displayed in Table 1 show excellent measurement fit.
Table 1. Measurement model-fit indexes.
Model-fit measure Measurement model result Recommended value
χ2 430.041 (p = 0.00) p ≤ 0.05
χ2/df 2.22 ≤5
AGFI 0.92 ≥0.80
GFI 0.94 ≥ 0.90
NFI 0.97 ≥ 0.90
RFI 0.97 ≥ 0.90
CFI 0.98 ≥ 0.90
RMSEA 0.044 ≤0.10
Second, convergent validity was evaluated with three criteria: (i) factor loading (λ) for an item should exceed 0.7 and be significant with the t test, (ii) construct reliability should be greater than 0.8, and (iii) average variance extracted (AVE) for a construct should be greater than 0.5 (Fornell & Larcker, 1981). Finally, discriminant validity was assessed by verifying that every construct's square root of AVE is larger than its correlations with other constructs (Fornell & Larcker, 1981). These results are shown in Table 2. The item loading and descriptive statistics are shown in Table 3.
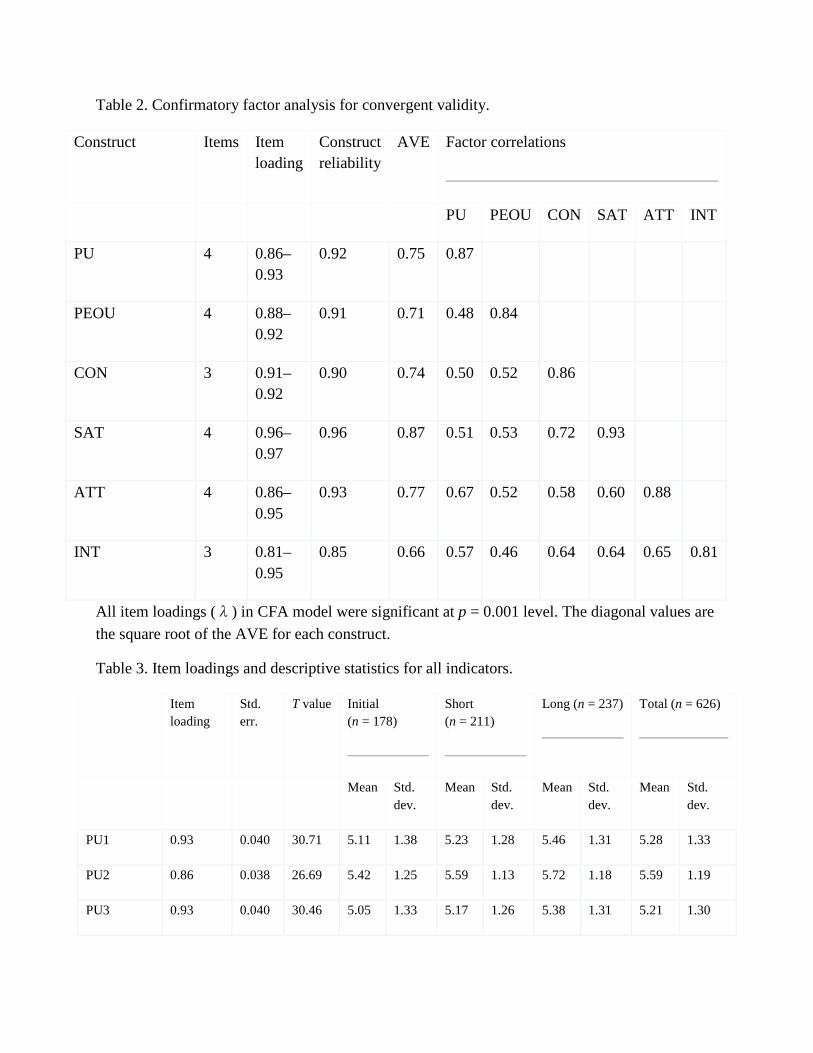
Table 2. Confirmatory factor analysis for convergent validity.
Construct Items Item loading
Construct reliability
AVE Factor correlations
PU PEOU CON SAT ATT INT
PU 4 0.86–0.93
0.92 0.75 0.87
PEOU 4 0.88–0.92
0.91 0.71 0.48 0.84
CON 3 0.91–0.92
0.90 0.74 0.50 0.52 0.86
SAT 4 0.96–0.97
0.96 0.87 0.51 0.53 0.72 0.93
ATT 4 0.86–0.95
0.93 0.77 0.67 0.52 0.58 0.60 0.88
INT 3 0.81–0.95
0.85 0.66 0.57 0.46 0.64 0.64 0.65 0.81
All item loadings (λ) in CFA model were significant at p = 0.001 level. The diagonal values are the square root of the AVE for each construct.
Table 3. Item loadings and descriptive statistics for all indicators.
Item loading
Std. err.
T value Initial (n = 178)
Short (n = 211)
Long (n = 237)
Total (n = 626)
Mean Std. dev.
Mean Std. dev.
Mean Std. dev.
Mean Std. dev.
PU1 0.93 0.040 30.71 5.11 1.38 5.23 1.28 5.46 1.31 5.28 1.33
PU2 0.86 0.038 26.69 5.42 1.25 5.59 1.13 5.72 1.18 5.59 1.19
PU3 0.93 0.040 30.46 5.05 1.33 5.17 1.26 5.38 1.31 5.21 1.30

Item loading
Std. err.
T value Initial (n = 178)
Short (n = 211)
Long (n = 237)
Total (n = 626)
Mean Std. dev.
Mean Std. dev.
Mean Std. dev.
Mean Std. dev.
PU4 0.91 0.040 29.25 5.17 1.38 5.32 1.23 5.51 1.25 5.35 1.29
EOU1 0.88 0.043 27.83 4.85 1.46 5.11 1.25 5.35 1.33 5.13 1.35
EOU2 0.91 0.043 29.54 4.77 1.53 5.15 1.31 5.26 1.34 5.08 1.40
EOU3 0.91 0.043 29.10 4.81 1.42 5.02 1.26 5.17 1.40 5.02 1.37
EOU4 0.92 0.040 29.80 4.92 1.40 5.24 1.23 5.35 1.28 5.19 1.31
CON1 0.91 0.041 28.88 4.61 1.35 4.98 1.18 5.08 1.34 4.91 1.31
CON2 0.91 0.041 29.33 4.61 1.31 4.95 1.19 4.94 1.42 4.85 1.32
CON3 0.92 0.041 29.78 4.50 1.37 4.98 1.18 4.98 1.40 4.85 1.34
SAT1 0.96 0.039 32.49 4.72 1.39 5.12 1.23 5.14 1.36 5.01 1.34
SAT2 0.97 0.039 32.90 4.80 1.38 5.12 1.24 5.18 1.37 5.05 1.34
SAT3 0.96 0.039 32.55 4.69 1.37 5.06 1.24 5.12 1.33 4.98 1.33
SAT4 0.96 0.039 32.74 4.79 1.40 5.11 1.23 5.16 1.34 5.04 1.33
ATT1 0.94 0.038 31.00 5.40 1.34 5.46 1.18 5.75 1.24 5.55 1.26
ATT2 0.95 0.039 31.62 5.26 1.34 5.33 1.23 5.54 1.33 5.39 1.30
ATT3 0.94 0.039 31.16 5.28 1.35 5.34 1.23 5.59 1.34 5.42 1.31
ATT4 0.86 0.043 26.73 5.04 1.36 5.20 1.22 5.33 1.38 5.20 1.33
CI1 0.90 0.040 28.63 5.04 1.34 5.26 1.18 5.46 1.28 5.27 1.27
CI2 0.81 0.049 24.25 4.40 1.44 4.57 1.48 4.57 1.49 4.52 1.47
CI3 0.95 0.041 31.10 4.97 1.30 5.10 1.29 5.24 1.40 5.12 1.34

All constructs show good convergent validity as all of the criteria were met. All factor loadings (λ) of the reflective indicators exceeded 0.7 and were significant at p = 0.001. Construct reliabilities ranged from 0.85 to 0.96, and AVE ranged from 0.66 to 0.87. Each construct's AVE is above its squared correlation with other constructs. Thus, the measurement model exhibits a high degree of reliability as well as convergent and discriminant validities.
5. Evaluation of research models and hypotheses testing
Structural equation modeling was used to evaluate the three structural models and various hypotheses. Visual tools provided by AMOS were used to depict the relationships among the constructs and their items. Since the respondents comprised three groups (initial adopters, short-term users, long-term users), the technique of multiple-group analysis with maximum likelihood estimation (MLE) was chosen to examine the moderating effect of usage experience and estimate the parameters of the model for each group. The evaluation process included the following steps. First, for each data record, a group variable was set to indicate the length of experience for the user. Second, the data was fed into AMOS and multiple-group analysis was executed. A different group variable value was assigned to each distinct round of analysis in order to compute all of the estimators. Thus each execution consisted of three distinct rounds of analysis. Third, the overall goodness of fit between the empirical data and the theoretical model across the three user groups was evaluated using the same fit indexes as in the measurement model. Fourth, the standardized path coefficient and path significance corresponding to each hypothesis were examined and compared across various user groups. Finally, the proportion of variance of each endogenous construct as explained by the model constructs was examined. The model-fit indexes are shown in Table 4. All fit indexes meet the suggested threshold and confirm that the empirical data have good fit with the three theoretical models. Results for each model are described below.
Table 4. Model-fit indexes.
Model-fit indexes TAM ECM Cognitive model
χ2/df 2.10 2.21 2.43
AGFI 0.85 0.86 0.84
GFI 0.90 0.90 0.89
NFI 0.94 0.95 0.95
RFI 0.93 0.94 0.94
CFI 0.97 0.97 0.97
RMSEA 0.042 0.044 0.048

For the TAM model (Fig. 7), continuance intention (INT) is determined jointly by PU (H2: β = 0.39, 0.23, 0.07) and ATT (H1: β = 0.49, 0.61, 0.78). It is clear that the effect of PU diminishes with experience, while the effect of ATT becomes more dominant for users with greater experience. In fact, the direct effect of PU on INT for long-term users is insignificant. In addition, the impact of ATT on INT is much greater than the direct effect of PU on all user groups. ATT and PU jointly explain 68%, 64%, and 71% of the variance in INT for initial adopters, short-term users, and long-term users respectively. PU and PEOU are antecedents to attitude (ATT). PEOU's beta coefficients (H4) are 0.36, 0.28, and 0.26 and PU's coefficients (H3) are 0.58, 0.58, and 0.68. Although significant, there appears to be lesser effect of PEOU on ATT with increasing experience, and greater effect of PU on ATT for the long-term users. Jointly, PU and PEOU determine 68%, 62%, and 77% of the variance in ATT. It appears that while TAM shows significance for all three experience levels, it has the best power for explaining intention and attitude for initial adopters and long-term users; in-between its explanatory power actually diminishes. PEOU's relationship to PU (H5) is represented by the beta coefficients: 0.53, 0.60, and 0.66, which are all significant. In essence, all TAM hypotheses (H1 through H5) are supported with the possible exception of the relationship between PU and INT for long-term users. In general, our results on R2, path coefficients, and path significance are similar in spirit to those reported in prior research ( Davis et al., 1989, Venkatesh, 2000 and Venkatesh and Davis, 2000)—suggesting further validity. We do, however, provide results for the three levels of experience.
Fig. 7. Hypotheses tests for TAM.
In the ECM model (Fig. 8), INT is determined by PU (H2: β = 0.42, 0.20, 0.39) and satisfaction (H6: β = 0.51, 0.75, 0.57) which jointly explain 72%, 79%, and 74% of the variance in INT. Comparatively, satisfaction (SAT) is a superior antecedent of INT than PU for all user groups. This result is compatible with conclusions of prior EDM-based studies ( Anderson and Sullivan, 1993, Bhattacherjee, 2001, Churchill and Suprenant, 1982, Oliver, 1981 and Oliver, 1993, Oliver and Burke, 1999, Spreng et al., 1996 and Tse and Wilton, 1988) which find SAT as the primary motivator of user's continuance intention. SAT is in turn determined by confirmation (H8: β =

0.82, 0.78, 0.89) and PU (H7: β = 0.13, 0.18, 0.03). While the influence of confirmation (CON) on satisfaction is consistently strong, the influence of PU is fairly weak—although it is significant in two of the three cases. PU and CON jointly explain 82% of the variance in SAT for all experience levels. The relationship between CON and PU (H9) is represented by beta coefficients of 0.68, 0.63, and 0.65. Again similar results are reported in prior research (Bhattacherjee, 2001)—thus corroborating the validity of our study as well as the applicability of the ECM model. The ECM model's hypotheses are all accepted with the possible exception of the relationship between perceived usefulness and satisfaction.
Fig. 8. Hypotheses tests for ECM.
The COG model (Fig. 9) incorporates the effects of both attitude and satisfaction on intention. The relationship between ATT and INT is significant (H1: β = 0.45, 0.26, 0.53) and so is the relationship between satisfaction (SAT) and INT (H6: β = 0.48, 0.68, 0.42). Moreover, the variance explained in INT is 74%, 80%, and 79% for initial adopters, short-term users, and long-term users respectively. Satisfaction is also an antecedent to attitude; a strong positive relationship is indicated (H10: β = 0.70, 0.78, 0.74) and the variance explained in ATT ranges between 49% and 60%. Again confirmation (CON) is verified to be strongly related to satisfaction (H8: β = 0.90, 0.90, 0.91). In summary, all of the hypotheses proposed in Oliver's cognitive model are confirmed and accepted.
Fig. 9. Hypotheses tests for the cognitive model.

The TCT model (Fig. 10) is tested using the same techniques of structure equation modeling. Most of the model-fit indexes (χ2/df = 1.95, AGFI = 0.81, GFI = 0.85, NFI = 0.93, RFI = 0.92, CFI = 0.97, RMSEA = 0.039) meet the suggested threshold except GFI is slightly lower than the recommended value. Overall, the model has a good fit.
Fig. 10. Hypotheses tests for TCT.
The TCT path coefficients and R2 values for the three levels of experience are shown in Fig. 10. Perceived usefulness’ direct impact on intention (β = 0.25, 0.11, 0.10) is only significant in the initial stage and becomes insignificant at the later two stages. At the same time, satisfaction (β = 0.41, 0.65, 0.42) and attitude (β = 0.32, 0.20, 0.45) have significant effects on intention for all levels of experience. Since confirmation is highly correlated with satisfaction (β = 0.84, 0.79, 0.89), it may very well be that PU's affect on intention is indirectly represented by satisfaction, and satisfaction is in fact a stronger predictor of intention. In fact, the entire path from confirmation to satisfaction to continuance intention is an important one in line with assimilation (Oliver, 1981) and cognitive dissonance (Festinger, 1957) theories. These results are somewhat in disagreement with previous ( Bhattacherjee, 2001 and Davis et al., 1989), which indicate that perceived usefulness has a significant impact on behavioral intention. However, our results provide a better understanding of intention antecedents based on user experience and help explain many of the inconsistencies in the literature. The R2 values of INT (R2 = 0.76, 0.81, 0.79) in TCT are quite high, even surpassing the values reported for the COG model. In general, all of the hypotheses proposed in TCT are fully or partially supported with the possible exceptions of the effects from perceived usefulness to attitude and satisfaction and the effect from perceived ease of use to attitude.
6. Discussion
In general, the three theoretical models TAM, ECM, and COG, and their hypotheses are all supported with relatively few exceptions. We make several important observations from the results.

The effect of attitude on intention in the TAM model is influenced by user experience, as the path coefficient increases across the three groups (initial adopter, short-term users, and long-term users). At the same time, the direct influence of perceived usefulness on intention is much less, and is further reduced in some experience categories. More specifically, initial adopter's behavioral intention is collectively determined by perceived usefulness and attitude. The initial adopters are concerned that the e-learning system is useful to learning in addition to their general preference for the system. After much use, the performance and usefulness of the e-learning system are approved by short-term and long-term users. At that time, usefulness is taken for granted and no longer remains an active determinant of usage. Continued usage is then determined by inner psychological judgment, such as attitude. Thus user attitude is a more stable, enduring, and vital determinant of behavioral intention. On the contrary, user's expectation of e-learning performance (i.e., usefulness) is a relatively temporary or transient factor in terms of long-term use.
Accordingly, attitude appears to be a more enduring and stable construct compared to many other constructs in the model; therefore, its effect on use and intention only magnifies with user experience. At the same time, while perceived usefulness may be enough to convince the users to work with the technology in initial stages, it may not be enough in the later stages of the innovation. Another example of this phenomenon is the relationship between satisfaction and intention. Satisfaction is widely regarded as a transient and experience-specific construct. While the relationship between satisfaction and intention is significant for the three groups in ECM and COG, there is no clearly identifiable pattern.
In the ECM model, while initial adopters are not familiar with the e-learning system and do not fully realize the actual performance of it, the intention of initial adopters is influenced by their expectations for the e-learning system, i.e., increased learning performance, and general satisfaction with the system. For short-term users, users’ satisfaction or dissatisfaction with the system turns to be a key determinant of intention to continuous use. In the meanwhile, the influence of user's expectations for e-learning performance is relatively less. However, the influence of satisfaction is not sustaining in the long term. According to assimilation (Oliver, 1981) and cognitive dissonance (Festinger, 1957) theories, confirmation will adjust the level of user's expectations for e-learning performance, which in turn restores the effect of satisfaction on intention in the long term to the level of the initial stage.

There can be two explanations for this result. First, given the transient nature of satisfaction, experience does not play a moderating role in the relationship. Second, as we will discuss later, the role of experience may not be linear and that short-tem users are clearly different from initial adopters and long-term users. According to this explanation, satisfaction plays a larger role in determining intention for the short-term users.
While the effect of perceived usefulness on satisfaction is significant for two of the three experience levels, it seems to be fairly weak (β = 0.13, 0.18, 0.03). However, the relationship between confirmation and satisfaction is strong. Thus confirmation, which takes into account pre-expectation behavior, is a much stronger predictor of satisfaction than post-expectation behavior is, in line with the CS/D model. The relationship between confirmation and post-adoption expectation (i.e., perceived usefulness) is strong at all three stages. This can be explained from the viewpoint of assimilation theory (Oliver, 1981) and cognitive dissonance theory (Festinger, 1957). Both theories suggest a strong adaptation of the internal schema (as partially accounted by confirmation) and the external schema (as represented by post-adoption expectation, i.e., perceived usefulness).
In the COG model, satisfaction is a more transient construct in affecting behavioral intention while attitude is more endurable. Satisfaction and attitude play different roles in affecting intention in various adoption stages. In the initial stage, because users are not well-acquainted with the actual performance of e-learning system, satisfaction and attitude are mainly determined by expectations. These two constructs have approximately equal effects on intention. However, satisfaction and attitude take on different dimensions with more user experience. In short-term stage, users begin to evaluate the difference between perceived performance and their expectations to decide whether to keep on using the system. At this stage, satisfaction becomes a relatively important factor. However, the effect of satisfaction gradually restores to the initial level in the long run by virtue of its transient nature. In contrast, attitude gradually increases its influence and finally surpasses the influence of satisfaction in the long term. In summary, the behavioral intention of initial adopters is mainly influenced by satisfaction, attitude and perceived usefulness, whereas that of short-term users and long-term users is influenced by satisfaction and attitude respectively.
We can also identify several differences between TAM, ECM, and COG. An obvious difference is that ECM and COG have higher power in explaining intention than TAM. More importantly, they are quite distinct models in describing users’ psychological motivation in IS continuance; TAM relies primarily on attitude, ECM on satisfaction, and COG on both. As Fig. 7 shows, the relationship among the constructs in TAM is moderated by experience, i.e., most of them show
either an increasing or decreasing pattern. This is not so for the constructs of ECM and COG which show non-linear patterns. More explicitly, in TAM, PU has the strongest direct impact (β = 0.39) on INT during the initial stage and rapidly wanes with experience. Nevertheless, it does have increasing indirect influence on INT (through attitude) with more experienced users. Similarly, the effect of PEOU (β = 0.36) on ATT is greater in the initial stages and reduced afterward. In just about all relationships in TAM, the pattern is linear with experience. We postulate that it is due to the enduring nature of the central construct “attitude” in TAM. On the contrary, the central construct in ECM is “satisfaction” and both “attitude” and “satisfaction” in COG. Satisfaction being a transient and unstable construct may explain the lack of patterns in ECM and COG. A quick explanation may be that experience is not a moderating factor in relationships with satisfaction. A more complex and plausible explanation may be that there is a non-linear or a “U-shaped” effect of experience on relationship with satisfaction. According to our results, satisfaction has the strongest influence on intention for short-term adopters and less for both initial adopters and long-term users. It is reasonable to make the argument that users tend to adopt a technology and use it for the long-term based primarily on attitude; satisfaction plays a role only in the short-term when they have had some interaction with the technology. Further research may be needed to validate this argument.
The three models have different antecedents yet they all achieve high explanatory powers. Not surprisingly though, they attain different values for explaining the dependent variable: IS continuance intention. The patterns of path coefficients are not similar across the three models, nor are the R2 values for INT. It means that the decision processes represented by the three models are not the same and the psychological constructs represent different assumptions. Overall, ECM's explanation power is better than TAM by 4%, 15%, and 3% for initial adopters, short-term users and long-term users respectively. COG is even more superior to TAM, exceeding it by 6%, 16%, and 8%, and slightly superior to ECM exceeding it by 2%, 1%, and 5% respectively. In summary, our results suggest that COG > ECM > TAM for modeling IS continuance behavior.
While prior literature may have suggested that ECM and COG are mainly designed for modeling user behavior toward continuance, we find them performing reasonably well even for initial adopters. At the same time, TAM was introduced as an initial technology acceptance model, although it has been used to explain long-term and post-adoption behavior on numerous occasions. In the current study, the R2 value of INT in the TAM model starts at 68% for initial adopters, dips to 64% for short-term users, and jumps to 71% for long-term users. In effect, TAM performs quite well for long-term users. Thus the central construct “attitude” in TAM appears to be a good variable to explain long-term user continuance behavior. At the same time, ECM postulates “satisfaction” as the central construct, which also serves well in explaining

continuance behavior. These results provide convincing evidence that both constructs: attitude and satisfaction should be used to model IS continuance behavior, which is exactly what the COG model does. The R2 values are the highest for the COG model at all levels of experience, providing further credence to using both attitude and satisfaction. It should be noted that the COG model, while having the highest explanation power, omits some of the key variables in the other two models. This leads us to the exploration of a more powerful theory, named Technology Continuance Theory (TCT), for IS continuance based on the synthesis of the three models.
According to TCT, the direct effect of PU on INT is significant only in the initial adoption stage. The following arguments may help explain this finding. By definition, PU refers to people's salient beliefs that using the technology will enhance their job performance. Thus, PU can directly affect behavioral intention (Davis et al., 1989) without regard to attitude. Furthermore, people might engage in a behavior in order to increase rewards without adjusting their attitude. More specifically, they may perform a certain behavior in the hope of obtaining rewards from the organization, even though the behavior could conceivably cause displeasure. This proposition could actually be stronger in the earlier stage of IS continuance, when the usefulness and rewards are mandatory for adoption and switching over from previous practices. Thus in the early stage, attitude alone might not completely mediate the effect of PU on intention (Mathieson, Peacock, & Chin, 2001). In the later stages, when the users have already experienced the technology, PU itself may not be a compelling factor for IS continuance. However, the residual effect of PU may have been accounted for by confirmation and in turn mediated by satisfaction. As discussed earlier, CON can account for the effect of post-consumption expectations as per the cognitive dissonance theory (Festinger, 1957) and assimilation theory (Piaget, 1968).
The antecedents of satisfaction in TCT are confirmation, CON (β = 0.84, 0.78, 0.89), and perceived usefulness, PU (β = 0.10, 0.17, 0.03). While the effect of CON on SAT is significant and very high for all levels of experience, the effect of PU is low in all cases and significant only for short-term users. This result is inconsistent with prior ECM research, where PU is regarded as an important and significant precursor of SAT. Once again, this deviation may be explained by the proposition that CON can account for much of the effects of PU. In any case, the two antecedents to satisfaction explain a high degree of variance (R2 = 0.84, 0.83, 0.83). These values of R2 are higher than those reported for both ECM and COG models.
Attitude is collectively determined by perceived ease of use, PEOU (β = 0.29, 0.11, 0.12), perceived usefulness, PU (β = 0.52, 0.40, 0.60), and satisfaction, SAT (β = 0.14, 0.44, 0.28). PU is the most significant precursor to attitude at all experience levels, followed in order by SAT and PEOU. The strengths of PEOU to ATT link are the weakest with significance for initial

adopters and long-term users, and no significance for the short-term users. This result may help explain the mixed findings reported on this link in the literature. About half of the prior studies fail to find a link between PEOU and ATT. Thus the level of user experience helps determine when the link is significant and when it is not. The path coefficient between satisfaction and attitude is insignificant in the initial adoption stage. However afterward, it becomes significant in the short-term and long-term usage stages. This result is very similar to the theoretical constructs of Oliver's (1980) model as shown in Fig. 2. According to Oliver's model, ATT at t1 has no connection with SAT whereas ATT at tn is affected by SAT at tn. In the current study, the initial adopter behavior is representative of initial acceptance. Thus, the insignificant path coefficient in the initial adoption stage is reasonable and confirms the constructs of the Oliver's model. Furthermore, the model explains a high degree of variance in attitude (R2 = 0.68, 0.70. 0.80). In fact, these values are considerably higher than both TAM and COG models.
In the final analysis, TCT represents a substantial improvement over the TAM, ECM and COG models both quantitatively and qualitatively. Quantitatively, TCT provides higher explanatory power for not only behavioral intention, but also attitude and satisfaction. Qualitatively, a major theoretical contribution of TCT is that it combines two central constructs: attitude and satisfaction into one continuance model. This synthesis, while suggested by Oliver (1980), has never been applied in the IT domain. Satisfaction is a transient and experience-specific affect, while attitude is more enduring transcending all prior experiences. In the IS continuance context, it is apparent that both can affect behavior and behavioral intention. While the Oliver's COG model had higher explanatory power than TAM and ECM, TCT provided further improvement. More importantly, TCT includes the well-established constructs of perceived usefulness and perceived ease of use as first-level antecedents. It also incorporates the various relationships between the constructs, as identified from the literature. Thus we propose TCT as an enduring theory for IS continuance for varying levels of user experience.
Are improvements to the proposed TCT possible? The answer is perhaps “yes” and we would like to encourage future investigators to evaluate TCT extensively and in different contexts and settings. While the six constructs in TCT are meaningful, one area of investigation is the various relationships between the constructs and whether some could be eliminated. For example, two of the relationships between perceived usefulness and satisfaction, and perceived usefulness and continuation intention were supported for only one of the three experience levels. We evaluated the structural model after removing these two; results are shown in Fig. 11. As can be seen, results are similar to the full TCT model. All relationships are supported for at least two levels of experience and R2 values are only slightly lower.

Fig. 11. Hypotheses tests for reduced TCT.
The above-reduced model is offered only as an illustration for what may be appropriate for future research. While it has the advantage of further parsimony, it does away with many important hypotheses extensively investigated in the literature. At this time, we are not advocating the reduced model; any further refinements should be based on the full TCT.
7. Conclusions and limitations
The goal of this study was the development of an enhanced model for IS continuance suitable for the entire life cycle of adoption. In that pursuit, we analyzed three models: the TAM, the ECM, and the COG. The three models have different assumptions about the underlying constructs that dictate user behavior. Results indicate that the three have different explanatory powers with relative strengths and weaknesses. In general, in explanatory power, the Cognitive Model was superior to the other two, and the Expectation Confirmation Model performed better than the Technology Acceptance Model. The six constructs in the three models were synthesized to propose the new Technology Continuance Theory (TCT). A major theoretical contribution of TCT is that it combines the two central constructs of attitude and satisfaction into one continuance model. It also retains the well-established constructs of perceived usefulness and perceived ease of use as first-level antecedents. The superiority of TCT over the other models was demonstrated by empirical means. When considering the various life cycle adoption stages, the TCT represents a substantial improvement over the TAM, ECM and COG models both quantitatively and qualitatively.
Through a comprehensive comparison of the three theoretical models, this study clarifies the variations in users’ adoption behavior across various stages of IS usage. It demonstrates that the

determinants and mechanisms of users’ adoption decision are moderated by usage experience. Outcome expectations are the major antecedents of initial adopters’ attitude and satisfaction which in turn have significant effects on intention to use. For short-term users, intention to continuance is determined by user satisfaction which was formulated as a direct function of the confirmation between expectations and perceived performance. Although satisfaction seems to have a somewhat transient effect on behavioral intention, it could still result in the rejection or willingness to continuously use the system in the short-term. However, the final and long-term success of the information system is determined by the adopter's attitude. In theory, attitude is derived from adopters’ post-expectations which are the consequences of cognitive dissonance and assimilation.
Executives and trainers need to take note of the finding that both attitude and satisfaction are important determinants of usage behavior. Satisfaction is regarded as a more transient factor since it is an evaluation of pre-consumption attitude and therefore experience-specific. Attitude is defined as an individual's overall evaluation of a product or service offering. Therefore it is more enduring transcending all prior experiences. The factors that affect satisfaction and attitude are different and both must be attended by management in order to ensure IS success. Accordingly, system design and training programs need to emphasize different components in order to enhance attitude and satisfaction. Furthermore, the relative importance of these two central constructs varies by user experience. Clearly, user experience is another factor in designing or redesigning IS products and training programs. More specifically, understanding users’ actual needs and designing a featured system that fits the users’ expectations are crucial success factors in the initial stage of IS implementation. In order to make sure that the users do not have unrealistic expectations, executives and trainers need to faithfully communicate the system's actual capacities and limitations. In the short-term, ensuring that the system services users with reasonable quality and responsiveness, which meets their pre-expectations, should be the primary concern. The long-term determinants of a successful IS implementation are post-adoption service quality and attitude, meaning that the executives and trainers need to take appropriate steps for both immediate and continuous improvement programs, in order to affect both satisfaction and post-expectations of users.
The limitations of the study include the ones commonly associated with surveys. Pinsonneault and Kraemer (1993) have identified several weaknesses in survey-based studies. These include unsystematic and inadequate sampling procedures, low response rates, weak linkages between units of analysis and respondents, and over-reliance on cross-sectional surveys where longitudinal surveys are really needed. While the representativeness of the sample can always be improved, special efforts were made to have high response rates and for the sample to be reflective of the target population. Our study relied on a cross-sectional survey of three distinct

user groups with varying levels of experience. In order to truly assess the impact of experience on usage behavior, one may argue for a longitudinal study tracking the behavior of a single user group. A cross-sectional survey differs from longitudinal research in the homogeneity of user groups and the accumulation of user experience. According to EDM referred to earlier, expectation-disconfirmation is calculated as the difference between user expectations and perceived performance in spite of the possibility that expectations can be moderated by experience. It is hard to determine whether the variation in disconfirmation is a result of the change in system performance or the accumulation of user experience, since user experience and system performance both would change with time in a longitudinal study. By contrast, when the characteristics of the user groups are similar, the cross-sectional survey is more suitable to evaluate the variation in disconfirmation among different user groups, since different user groups experience the same system performance and only user expectations would result in divergence.
While proposing the TCT for IS continuance, we realize it needs to undergo further testing and validation. We encourage future investigators to evaluate TCT extensively in similar as well as different contexts and settings. As suggested earlier, the six proposed constructs are key to TCT. However, some of the relationships between the constructs may be candidates for elimination and may lead to a more parsimonious model. Future research may explore this possibility. In addition, this stream of research will benefit from longitudinal studies of user behavior.
Appendix A.
Constructs and measurement items.
Usefulness
PU1 Using the CUS improves my performance in my learning.
PU2 Using the CUS improves my productivity in my learning.
PU3 Using the CUS enhances my effectiveness in my learning.
PU4 I find the CUS to be useful in my learning.
Easy of use
EOU1 My interaction with the CUS is clear and understandable.
EOU2 Interaction with the CUS does not require a lot of my mental effort.

EOU3 I find it easy to get the CUS to do what I want it to do.
EOU4 I find the CUS to be easy to use.
Disconfirmation
CON1 My experience with using CUS was better than what I expected.
CON2 The service level provide by CUS was better than what I expected.
CON3 Overall, most of my expectations from using CUS were confirmed.
Satisfaction
SAT1 My overall experience of CUS use was: very satisfied.
SAT2 My overall experience of CUS use was: very pleased.
SAT3 My overall experience of CUS use was: very contented.
SAT4 My overall experience of CUS use was: absolutely delighted.
Attitude
ATT1 Using CUS for learning would be a good idea.
ATT2 Using CUS for learning would be a wise idea.
ATT3 I like the idea of using CUS for learning.
ATT4 Using CUS would be a pleasant experience.
Continuance intention
INT1 I intend to continue using CUS rather than discontinue its use.
INT2 My intentions are to continue using CUS than use any alternative means.
INT3 If I could, I would like to continue using CUS as much as possible.
Note: CUS is an abbreviation for Cyber University System.

References
I. Ajzen. The theory of planned behavior. Organizational Behavior and Human Decision Process, 50 (1991), pp. 179–211
E.W. Anderson, M.W. Sullivan. The antecedents and consequences of customer satisfaction for firms. Marketing Science, 12 (2) (1993), pp. 125–143
A. Bandura. Social foundations of thought and action: A social cognitive theory. Prentice Hall, Englewood Cliffs, NJ (1986)
P.M. Bentler. EQS structural equations program manual. BMDP Statistical Software, Los Angeles (1989)
A. Bhattacherjee. Understanding information system continuance: An expectation-confirmation model. MIS Quarterly, 25 (3) (2001), pp. 351–370
A. Bhattacherjee, G. Premkumar. Understanding changes in belief and attitude toward information technology usage: A theoretical model and longitudinal test. MIS Quarterly, 28 (2) (2004), pp. 229–254
K.A. Bollen. Structural equations with latent variables. Wiley, New York (1989)
R.N. Bolton, J.H. Drew. A longitudinal analysis of the impact of service changes on customer attitudes. Journal of Marketing, 55 (1) (1991), pp. 1–9
P.Y.K. Chau. An empirical assessment of a modified technology acceptance model. Journal of Management Information Systems, 13 (2) (1996), pp. 185–204
G.A. Churchill, C. Suprenant. An investigation into the determinants of customer satisfaction. Journal of Marketing Research, 19 (4) (1982), pp. 491–504
Davis, F. D. (1986). A technology acceptance model for empirically testing new end-user information systems: theory and results. Unpublished Doctoral Dissertation. Sloan School of Management, Massachusetts Institute of Technology.
F.D. Davis, R.P. Bagozzi, P.R. Warshaw. User acceptance of computer technology: a comparison of two theoretical models. Management Science, 35 (8) (1989), pp. 982–1002
L.A. Festinger. A theory of cognitive dissonance. Row and Peterson, Evanston, IL (1957)
M. Fishbein, I. Ajzen. Belief, attitude, intention, and behavior: An introduction to theory and research. Addison-Wesley, MA (1975)
C. Fornell, D.F. Larcker. Evaluating structural equations with unobservable variables and measurement error. Journal of Marketing Research, 18 (1) (1981), pp. 39–50

M.J. Gallivan. Organizational adoption and assimilation of complex technological innovations: Development and application of a new framework. Data Base Advances, 32 (2001), pp. 51–86
D. Gefen, E. Karahanna, D.W. Straub. Inexperience and experience with online stores: the importance of TAM and trust. IEEE Transactions on Engineering Management, 50 (3) (2003), pp. 307–321
V. Grover, J. Teng, A.H. Segars, K. Fiedler. The influence of information technology diffusion and business process change on perceived productivity: The IS executive's perspective. Information & Management, 34 (3) (1998), pp. 141–159
J.F. Hair Jr., R.E. Anderson, R.L. Tatham, W.C. Black. Multivariate data analysis. (5th ed.)Prentice-Hall, New Jersey (1998)
J.W. Henry, R.W. Stone. A structural equation model of end-user satisfaction with a computer-based medical information systems. Information Resources Management Journal, 7 (3) (1994), pp. 21–33
H.K. Hunt. CS/D-overview and future research directions. H.K. Hunt (Ed.), Conceptualization and measurement of consumer satisfaction and dissatisfaction, Marketing Science Institute, Cambridge, MA (1977)
J.S. Jasperson, P.E. Carter, R.W. Zmud. A comprehensive conceptualization of post-adoption behaviors associated with information technology enabled work systems. MIS Quarterly, 29 (3) (2005), pp. 525–558
E. Karahanna, D.W. Straub, N.L. Chervany. Information technology adoption across time: A cross-sectional comparison of pre-adoption and post-adoption beliefs. MIS Quarterly, 23 (2) (1999), pp. 183–213
V.S. Lai, H. Li. Technology acceptance model for Internet banking. Information & Management, 42 (2) (2005), pp. 373–386
S.A. LaTour, N.C. Peat. Conceptual and methodological issues in consumer satisfaction research. W.L. Wilkie (Ed.), Advances in consumer research, vol. 8, Association for Consumer Research, Ann Arbor, MI (1979), pp. 431–437
E. Mao, P. Palvia. Testing an extended model of IT acceptance in the Chinese cultural context. Data Base, 37 (2 & 3) (2006), pp. 20–32
K. Mathieson, E. Peacock, W.W. Chin. Extending the technology acceptance model: The influence of perceived user resources. The Data Base for Advances in Information Systems, 32 (3) (2001), pp. 86–112
V. McKinney, K. Yoon, F.M. Zahedi. The measurement of web-customer satisfaction: an expectation and disconfirmation approach. Information System Research, 13 (3) (2002), pp. 296–315
R.L. Oliver. A cognitive model for the antecedents and consequences of satisfaction. Journal of Marketing Research, 17 (1980), pp. 460–469
R.L. Oliver. Measurement and evaluation of satisfaction processes in retail settings. Journal of Retailing, 57 (3) (1981), pp. 25–48
R.L. Oliver. Cognitive, affective, and attribute bases of the satisfaction response. Journal of Consumer Research, 20 (1993), pp. 418–430
R.L. Oliver. Satisfaction: a behavioral perspective on the consumer. Irwin/McGraw-Hill, New York (1997)
R.L. Oliver, R.R. Burke. Expectation process in satisfaction formation: a field study. Journal of Service Research, 1 (3) (1999), pp. 196–214
P.G. Patterson, L.W. Johnson, R.A. Spreng. Modeling the determinants of customer satisfaction for business-to-business professional services. Journal of the Academy of Marketing Science, 25 (1) (1997), pp. 4–17
J. Piaget. Six psychological studies, Anita Tenzer (Trans.). Vintage Books, New York (1968)
A. Pinsonneault, K.L. Kraemer. Survey research methodology in management information systems: an assessment. Journal of Management Information Systems, 10 (2) (1993), pp. 75–105
E.M. Rogers. Diffusion of innovation. (5th ed.)The Free Press, NY (2003)
J.E. Scott. The measurement of information systems effectiveness: Evaluating a measuring instrument. Proceedings of the fifteenth international conference on information systems, Vancouver, British Columbia (1994), pp. 111–128
H.P. Shih. Extended technology acceptance model of Internet utilization behavior. Information & Management, 41 (6) (2004), pp. 719–730
H.P. Shih. An empirical study on predicting user acceptance of e-shopping on the Web. Information & Management, 41 (3) (2004), pp. 351–368
R.A. Spreng, J.S. Chiou. A cross-cultural assessment of the satisfaction formation process. European Journal of Marketing, 36 (7/8) (2002), pp. 829–839
R.A. Spreng, S.B. MacKenzie, R.W. Olshavsky. A reexamination of the determinants of consumer satisfaction. Journal of Marketing, 60 (1) (1996), pp. 15–32

H. Sun, P. Zhang. The role of moderating factors in user technology acceptance. International Journal of Human-Computer Studies, 64 (2) (2006), pp. 53–78
E.B. Swanson, N.C. Ramiller. Innovating mindfully with information technology. MIS Quarterly, 28 (4) (2004), pp. 553–583
S. Taylor, P. Todd. Assessing IT usage: the role of prior experience. MIS Quarterly, 19 (4) (1995), pp. 561–570
D.K. Tse, P.C. Wilton. Models of consumer satisfaction: an extension. Journal of Marketing Research, 25 (1988), pp. 204–212
K. Van Montfort, E. Masurel, I. Van Rijn. Service satisfaction: An empirical analysis of consumer satisfaction in financial services. The Service Industries Journal, 20 (3) (2000), pp. 80–94
V. Venkatesh. Determinants of perceived easy of use: Integrating control, intrinsic motivation, and emotion into the technology acceptance model. Information Systems Research, 11 (4) (2000), pp. 342.s–365
V. Venkatesh, F.D. Davis. A model of the antecedents of perceived easy of use: Development and test. Decision Science, 27 (3) (1996), pp. 451–481
V. Venkatesh, F.D. Davis. A theoretical extension of the technology acceptance model: four longitudinal field studies. Management Science, 46 (2) (2000), pp. 186–204
V. Venkatesh, M.G. Morris, G. Davis, F.D. Davis. User acceptance of information technology: Toward a unified view. MIS Quarterly, 27 (3) (2003), pp. 425–477
L.R. Vijayasarathy. Predicting consumer intentions to use on-line shopping: The case for an augmented technology acceptance model. Information & Management, 41 (6) (2003), pp. 747–762
J. Yu, I. Ha, M. Choi, J. Rho. Extending the TAM for a t-commerce. Information & Management, 42 (7) (2005), pp. 965–976
K. Zhu, K.L. Kraemer, S. Xu. The process of innovation assimilation by firms in different countries: A technology diffusion perspective on e-business. Management Science, 52 (10) (2006), pp. 1557–1576
Related Documents