Volume 15, No. 6 November 2017 ISSN: 1545-679X Information Systems Education Journal In this issue: 4. Integrating Concept Mapping into Information Systems Education for Meaningful Learning and Assessment Wei Wei, University of Houston – Clear Lake Kwok-Bun Yue, University of Houston – Clear Lake 17. Investigating Student Resistance and Student Perceptions of Course Quality and Instructor Performance in a Flipped Information Systems Classroom Elizabeth White Baker, University of North Carolina Wilmington Stephen Hill, University of North Carolina Wilmington 27. Raising the Bar: Challenging Students in a Capstone Project Course With an Android and Mobile Web Parallel Development Team Project Wilson Wong, Worcester Polytechnic Institute James Pepe, Bentley University Irv Englander, Bentley University 43. Understanding Business Analytics Success and Impact: A Qualitative Study Rachida F. Parks, Quinnipiac University Ravi Thambusamy, University of Arkansas at Little Rock 56. RateMyInformationSystemsProfessor: Exploring the Factors that Influence Student Ratings Mark Sena, Xavier University Elaine Crable, Xavier University 62. Grounding IS Design Education in the First Principles of a Designerly Way of Knowing Leslie J. Waguespack, Bentley University Jeffry S. Babb, West Texas State A&M University 72. Identifying the Real Technology Skills Gap: A Qualitative Look Across Disciplines Evan Schirf, St. Vincent College Anthony Serapiglia, St. Vincent College

Welcome message from author
This document is posted to help you gain knowledge. Please leave a comment to let me know what you think about it! Share it to your friends and learn new things together.
Transcript
Volume 15, No. 6 November 2017
ISSN: 1545-679X
Information Systems
Education Journal
In this issue:
4. Integrating Concept Mapping into Information Systems Education for
Meaningful Learning and Assessment
Wei Wei, University of Houston – Clear Lake
Kwok-Bun Yue, University of Houston – Clear Lake
17. Investigating Student Resistance and Student Perceptions of Course Quality
and Instructor Performance in a Flipped Information Systems Classroom
Elizabeth White Baker, University of North Carolina Wilmington
Stephen Hill, University of North Carolina Wilmington
27. Raising the Bar: Challenging Students in a Capstone Project Course With an
Android and Mobile Web Parallel Development Team Project
Wilson Wong, Worcester Polytechnic Institute
James Pepe, Bentley University
Irv Englander, Bentley University
43. Understanding Business Analytics Success and Impact: A Qualitative Study
Rachida F. Parks, Quinnipiac University
Ravi Thambusamy, University of Arkansas at Little Rock
56. RateMyInformationSystemsProfessor: Exploring the Factors that Influence
Student Ratings
Mark Sena, Xavier University
Elaine Crable, Xavier University
62. Grounding IS Design Education in the First Principles of a Designerly Way of
Knowing
Leslie J. Waguespack, Bentley University
Jeffry S. Babb, West Texas State A&M University
72. Identifying the Real Technology Skills Gap: A Qualitative Look Across
Disciplines
Evan Schirf, St. Vincent College
Anthony Serapiglia, St. Vincent College
Information Systems Education Journal (ISEDJ) 15 (6) ISSN: 1545-679X November 2017 __________________________________________________________________________________________________________________________
_________________________________________________ ©2017 ISCAP (Information Systems & Computing Academic Professionals) Page 2 http://iscap.info; http://isedj.org
The Information Systems Education Journal (ISEDJ) is a double-blind peer-reviewed academic journal published by EDSIG, the Education Special Interest Group of AITP, the Association of Information Technology Professionals (Chicago, Illinois). Publishing frequency is six times per year. The first year of publication was 2003.
ISEDJ is published online (http://isedj.org). Our sister publication, the Proceedings of EDSIGCon (http://www.edsigcon.org) features all papers, panels, workshops, and presentations from the conference.
The journal acceptance review process involves a minimum of three double-blind peer reviews, where both the reviewer is not aware of the identities of the authors and the authors are not aware of the identities of the reviewers. The initial reviews happen before the conference. At that point papers are divided into award papers (top 15%), other journal papers (top 30%), unsettled papers, and non-journal papers. The unsettled papers are subjected to a second round of blind peer review to establish whether they will be accepted to the journal or not. Those papers that are deemed of sufficient quality are accepted for publication in the ISEDJ journal. Currently the target acceptance rate for the journal is under 40%.
Information Systems Education Journal is pleased to be listed in the 1st Edition of Cabell's Directory of Publishing Opportunities in Educational Technology and Library Science, in both the electronic and printed editions. Questions should be addressed to the editor at [email protected] or the publisher at [email protected]. Special thanks to members of AITP-EDSIG who perform the editorial and review processes for ISEDJ.
2017 AITP Education Special Interest Group (EDSIG) Board of Directors
Leslie J. Waguespack Jr
Bentley University
President
Jeffry Babb West Texas A&M
Vice President
Scott Hunsinger Appalachian State Univ
Past President (2014-2016)
Meg Fryling Siena College
Director
Lionel Mew University of Richmond
Director
Muhammed Miah Southern Univ New Orleans
Director
Rachida Parks
Quinnipiac University Director
Anthony Serapiglia
St. Vincent College Director
Li-Jen Shannon
Sam Houston State Univ Director
Jason Sharp
Tarleton State University Director
Peter Wu Robert Morris University
Director
Lee Freeman Univ. of Michigan - Dearborn
JISE Editor
Copyright © 2017 by the Education Special Interest Group (EDSIG) of the Association of Information Technology Professionals (AITP). Permission to make digital or hard copies of all or part of this journal for personal or classroom use is granted without fee provided that the copies are not made or distributed for profit or commercial use. All copies must bear this notice and full citation. Permission from the Editor is required to post to servers, redistribute to lists, or utilize in a for-profit or commercial use. Permission requests should be sent to Jeffry Babb, Editor, [email protected].

Information Systems Education Journal (ISEDJ) 15 (6) ISSN: 1545-679X November 2017 __________________________________________________________________________________________________________________________
_________________________________________________ ©2017 ISCAP (Information Systems & Computing Academic Professionals) Page 3 http://iscap.info; http://isedj.org
Information Systems
Education Journal
Editors
Jeffry Babb Senior Editor
West Texas A&M University
Thomas Janicki Publisher
U of North Carolina Wilmington
Donald Colton Emeritus Editor
Brigham Young Univ. Hawaii
Cameron Lawrence Teaching Cases Co-Editor The University of Montana
Guido Lang Associate Editor
Quinnipiac University
Anthony Serapiglia Teaching Cases Co-Editor
St. Vincent College
Muhammed Miah Associate Editor
Southern Univ at New Orleans
Samuel Abraham Associate Editor
Siena Heights University
Jason Sharp Associate Editor
Tarleton State University
2017 ISEDJ Editorial Board
Ronald Babin Ryerson University
Nita Brooks Middle Tennessee State Univ
Wendy Ceccucci Quinnipiac University
Ulku Clark U of North Carolina Wilmington
Jamie Cotler Siena College
Jeffrey Cummings U of North Carolina Wilmington
Christopher Davis U of South Florida St Petersburg
Gerald DeHondt II
Mark Frydenberg Bentley University
Meg Fryling Siena College
David Gomilion Northern Michigan University
Audrey Griffin Chowan University
Stephen Hill U of North Carolina Wilmington
Scott Hunsinger Appalachian State University
Musa Jafar Manhattan College
Rashmi Jain Montclair State University
Mark Jones Lock Haven University
James Lawler Pace University
Paul Leidig Grand Valley State University
Cynthia Martincic Saint Vincent College
Lionel Mew University of Richmond
Fortune Mhlanga Lipscomb University
Edward Moskal Saint Peter’s University
George Nezlek Univ of Wisconsin - Milwaukee
Rachida Parks Quinnipiac University
Alan Peslak Penn State University
James Pomykalski Susquehanna University
Franklyn Prescod Ryerson University
John Reynolds Grand Valley State University
Samuel Sambasivam Azusa Pacific University
Bruce Saulnier Quinnipiac University
Li-Jen Shannon Sam Houston State University
Michael Smith Georgia Institute of Technology
Karthikeyan Umapathy University of North Florida
Leslie Waguespack Bentley University
Bruce White Quinnipiac University
Peter Y. Wu Robert Morris University
Information Systems Education Journal (ISEDJ) 15 (6) ISSN: 1545-679X November 2017 __________________________________________________________________________________________________________________________
_________________________________________________ ©2017 ISCAP (Information Systems & Computing Academic Professionals) Page 4 http://iscap.info; http://isedj.org
Integrating Concept Mapping into Information
Systems Education for Meaningful Learning and Assessment
Wei Wei [email protected]
Kwok-Bun Yue
Computer Information Systems
University of Houston-Clear Lake Houston, TX 77058, U.S.A
Abstract Concept map (CM) is a theoretically sound yet easy to learn tool and can be effectively used to represent
knowledge. Even though many disciplines have adopted CM as a teaching and learning tool to improve learning effectiveness, its application in IS curriculum is sparse. Meaningful learning happens when one iteratively integrates new concepts and propositions into her existing cognitive structure. It is the
process of how one acquires deep and applicative knowledge in certain domains such as Information Systems (IS). As important as meaningful learning is in IS education, there is a scarcity of method to assess it effectively. This study reports a series of experiments of adopting CM as a tool to enhance and evaluate students’ learning, especially meaningful learning in IS education. Based on theoretical
foundation of CMs and prior related empirical work, we designed a series of assignments that require students to complete CMs in three participating courses. We also designed and implemented a tool to help analyzing the CMs with certain level of automation. The completed CMs are collected and analyzed to answer our research questions. We believe the results demonstrate the utility of CMs in IS education as an effective tool to understand and assess students’ meaningful learning. Our work also experimented with various methods to use CMs and the findings provide valuable insights as to how CM-based teaching
and learning tools can be integrated into IS curricula seamlessly. Keywords: Concept map, meaningful learning, assessment, information systems education, pedagogical tool.
1. INTRODUCTION
In the ACM & AIS Curriculum Guidelines (Topi et al., 2010) for Undergraduate Degree Programs in Information Systems (IS), critical thinking (CT) is listed as one of the five foundational knowledge and skills. CT skills must be acquired through meaningful learning (Mayer, 2002), during which
students acquire and build knowledge and
cognitive processes, which are needed for them
to become effective problem solvers in IS fields. Therefore, it is essential for IS educators to understand the nature and assess the quality of meaningful learning in order to design teaching artifacts that foster effective problem solving skills.
Information Systems Education Journal (ISEDJ) 15 (6) ISSN: 1545-679X November 2017 __________________________________________________________________________________________________________________________
_________________________________________________ ©2017 ISCAP (Information Systems & Computing Academic Professionals) Page 5 http://iscap.info; http://isedj.org
Meaningful learning was identified by Ausubel
(Ausubel, 1963) as the most important learning principle. It is signified by integrating new concepts and propositions with existing relevant
ideas in some substantive ways, within one’s cognitive structure. This is an iterative process in which learners must continue to refine, rectify, rearrange, and reorganize the content and structure of their knowledge so that their cognitive structure can be improved. Opposite to rote learning (Novak, 1993; Novak & Gowin,
1984), meaningful learning can be signified by: (1) Includes clarification of relations between concepts; (2) Involves self-assisted learning; and (3) Can be conducted in the form of scientific research and/or artistic production. It was also pointed out that though idiosyncrasy exists in
individual concept structures, sufficient commonality and isomorphism in individual meanings make it possible to have dialogue and sharing. Therefore, being able to communicate and share concept structures within one’s cognitive structure is the key to understand and evaluate meaningful learning.
To better understand and assess meaningful learning, we need an effective tool to visualize it and Concept Map (CM) is such a tool. CM was introduced by Novak (Novak & Gowin, 1984) as a graphical tool for representing knowledge structure in the form of a graph. The nodes of the
graph represent concepts. The edges that run between concepts represent relationships.
Concepts and relationships between them formulate propositions. The simplicity of constructing a CM makes it an easy tool for anyone to represent her knowledge structure for
others to see and understand (Cañas et al., 2005). Compared to other mapping techniques, CMs have solid underlying theories (Novak & Cañas, 2008). To construct high quality CMs, one needs to constantly integrate newly acquired concepts and
relationships into existing CMs, and the structures of the CMs need to be modified to accommodate the changes. The continuous iterative process of such integration signifies meaningful learning
rather than rote learning. This makes CMs an excellent tool to visualize meaningful learning. In turn, the quality of CMs may be used to assess
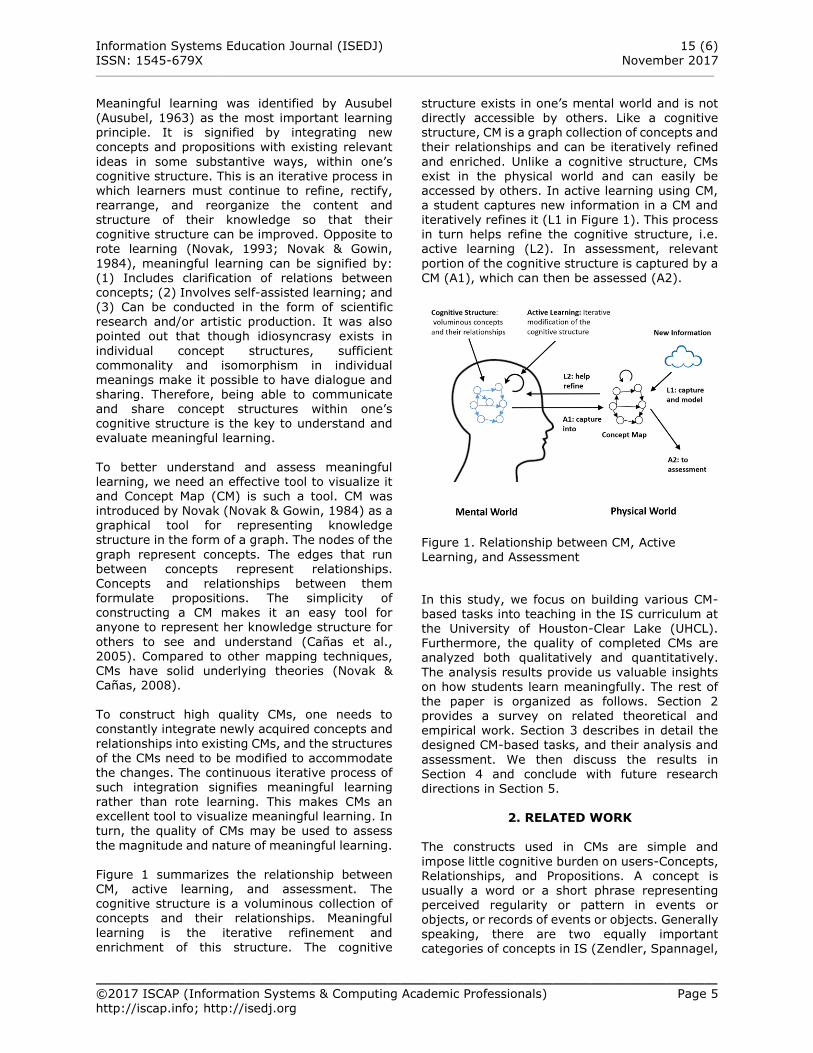
the magnitude and nature of meaningful learning. Figure 1 summarizes the relationship between CM, active learning, and assessment. The cognitive structure is a voluminous collection of concepts and their relationships. Meaningful
learning is the iterative refinement and enrichment of this structure. The cognitive
structure exists in one’s mental world and is not
directly accessible by others. Like a cognitive structure, CM is a graph collection of concepts and their relationships and can be iteratively refined
and enriched. Unlike a cognitive structure, CMs exist in the physical world and can easily be accessed by others. In active learning using CM, a student captures new information in a CM and iteratively refines it (L1 in Figure 1). This process in turn helps refine the cognitive structure, i.e. active learning (L2). In assessment, relevant
portion of the cognitive structure is captured by a CM (A1), which can then be assessed (A2).
Figure 1. Relationship between CM, Active Learning, and Assessment
In this study, we focus on building various CM-based tasks into teaching in the IS curriculum at the University of Houston-Clear Lake (UHCL). Furthermore, the quality of completed CMs are analyzed both qualitatively and quantitatively.
The analysis results provide us valuable insights on how students learn meaningfully. The rest of the paper is organized as follows. Section 2 provides a survey on related theoretical and empirical work. Section 3 describes in detail the designed CM-based tasks, and their analysis and
assessment. We then discuss the results in Section 4 and conclude with future research directions in Section 5.
2. RELATED WORK
The constructs used in CMs are simple and
impose little cognitive burden on users-Concepts, Relationships, and Propositions. A concept is usually a word or a short phrase representing perceived regularity or pattern in events or objects, or records of events or objects. Generally speaking, there are two equally important categories of concepts in IS (Zendler, Spannagel,
Information Systems Education Journal (ISEDJ) 15 (6) ISSN: 1545-679X November 2017 __________________________________________________________________________________________________________________________
_________________________________________________ ©2017 ISCAP (Information Systems & Computing Academic Professionals) Page 6 http://iscap.info; http://isedj.org
& Klaudt, 2011). The first are content concepts
such as algorithm, architecture, and data. The other are process concepts such as problem solving, problem posing, analyzing, and
generalizing. The practical components focus on content concepts and corresponds to the technical-oriented classes in IS curricula such as DBMS. The theoretical components focus on the process concepts and corresponds to the theoretical-oriented classes in IS curricula such as IS Theory. Related concepts can be linked
through relationships to formulate meaningful statements that represent the content and structure of one’s knowledge body. A set of inter-connected CM constructs often suggest certain knowledge domain/field. Cross-domain links may occur if one’s knowledge is comprehensive and
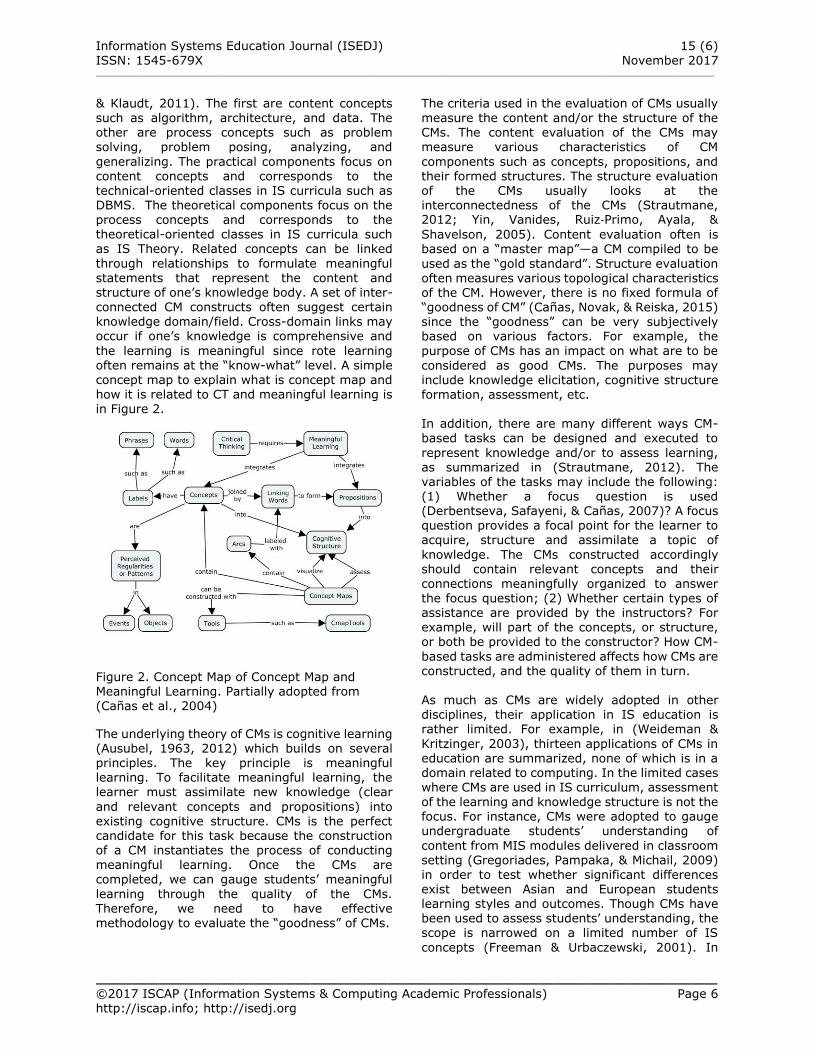
the learning is meaningful since rote learning often remains at the “know-what” level. A simple concept map to explain what is concept map and how it is related to CT and meaningful learning is in Figure 2.
Figure 2. Concept Map of Concept Map and Meaningful Learning. Partially adopted from (Cañas et al., 2004)
The underlying theory of CMs is cognitive learning (Ausubel, 1963, 2012) which builds on several principles. The key principle is meaningful learning. To facilitate meaningful learning, the learner must assimilate new knowledge (clear
and relevant concepts and propositions) into existing cognitive structure. CMs is the perfect candidate for this task because the construction of a CM instantiates the process of conducting meaningful learning. Once the CMs are completed, we can gauge students’ meaningful
learning through the quality of the CMs. Therefore, we need to have effective methodology to evaluate the “goodness” of CMs.
The criteria used in the evaluation of CMs usually
measure the content and/or the structure of the CMs. The content evaluation of the CMs may measure various characteristics of CM
components such as concepts, propositions, and their formed structures. The structure evaluation of the CMs usually looks at the interconnectedness of the CMs (Strautmane, 2012; Yin, Vanides, Ruiz‐Primo, Ayala, &
Shavelson, 2005). Content evaluation often is based on a “master map”—a CM compiled to be
used as the “gold standard”. Structure evaluation often measures various topological characteristics of the CM. However, there is no fixed formula of “goodness of CM” (Cañas, Novak, & Reiska, 2015) since the “goodness” can be very subjectively based on various factors. For example, the
purpose of CMs has an impact on what are to be
considered as good CMs. The purposes may include knowledge elicitation, cognitive structure formation, assessment, etc. In addition, there are many different ways CM-based tasks can be designed and executed to
represent knowledge and/or to assess learning, as summarized in (Strautmane, 2012). The variables of the tasks may include the following: (1) Whether a focus question is used (Derbentseva, Safayeni, & Cañas, 2007)? A focus question provides a focal point for the learner to acquire, structure and assimilate a topic of
knowledge. The CMs constructed accordingly should contain relevant concepts and their
connections meaningfully organized to answer the focus question; (2) Whether certain types of assistance are provided by the instructors? For example, will part of the concepts, or structure, or both be provided to the constructor? How CM-
based tasks are administered affects how CMs are constructed, and the quality of them in turn. As much as CMs are widely adopted in other disciplines, their application in IS education is rather limited. For example, in (Weideman &
Kritzinger, 2003), thirteen applications of CMs in education are summarized, none of which is in a domain related to computing. In the limited cases where CMs are used in IS curriculum, assessment
of the learning and knowledge structure is not the focus. For instance, CMs were adopted to gauge undergraduate students’ understanding of
content from MIS modules delivered in classroom setting (Gregoriades, Pampaka, & Michail, 2009) in order to test whether significant differences exist between Asian and European students learning styles and outcomes. Though CMs have been used to assess students’ understanding, the scope is narrowed on a limited number of IS
concepts (Freeman & Urbaczewski, 2001). In
Information Systems Education Journal (ISEDJ) 15 (6) ISSN: 1545-679X November 2017 __________________________________________________________________________________________________________________________
_________________________________________________ ©2017 ISCAP (Information Systems & Computing Academic Professionals) Page 7 http://iscap.info; http://isedj.org
other studies, CMs have also be used as a tool to
teach and evaluate critical thinking in IS curriculum (Wei & Yue, 2016).
The IS education community has a wide range of assessment tools, many of which have been proven effective in certain aspects, to some degree. Standard test questions such as multiple choice and T/F may be good at assessing “know-what”—usually results of rote learning. On the contrary, meaningful learning addresses “know-
why” and “know-how”. Writing assignments, hands-on projects, and case studies are often utilized for those. However, the deliverables of these assignments cannot effectively represent the cognitive processes and structures, which are important to understand the meaningful learning
involved. The graphical structure that CMs provide can fit in this void. In this study, we take a holistic approach to integrate CM-based tasks as pedagogical tools into IS curriculum at UHCL. Different types of CM-based tasks are designed and executed.
Mechanisms to evaluate the quality of the CMs are implemented. Tools are built to increase the automation level of the evaluation process. The evaluation results are interpreted based on theoretical and empirical work. This project is considered as the early phase of an effort to design and build a CM-Centered learning
environment tailored to IS education (Cañas & Novak, 2014).
3. EXPERIMENT DESIGN
In this study, we used five classes in three
Computer Information Systems (CIS) courses at both graduate (G) and undergraduate (U) levels for testbed. Two major categories of IS courses are used: one type is technical oriented database classes where the focus is “content concepts” including definition, algorithm, data structure and more. The other is more theoretical oriented IS
classes where the focus is “process concepts” including theories, frameworks, and problem solving procedures. The details of participating classes are summarized in Table 1.
Our research focus is to explore “How CMs can be effectively used to assess meaningful learning in
IS education?” More specifically, we would like to seek answers to the following questions: What impact does CM-assignment design
have on the outcomes? How do students perform on CM-assignments
and what are the insights?
Are there significant differences between CM-
assignments performance of students at different academic levels?
Are there significant differences between CM-
assignments performance of students from classes of different natures?
What features of CMs can be used to assess meaningful learning? More specifically, we would focus on the content and the structure of the CMs.
What modifications need to be made for
future CM-assignments?
Class #
Course Level Concept Type
1 Design of Databases (DOD)
U Content
2
3 Infor. Systems Theory & Practice (ISTP)
U Process
4
5 Strategic Information Systems (SIS)
G Process
Table 1. Summary of Participating Classes
CM-based Tasks For all participating classes, instructors prepared the students for the CM-assignments as follows:
(1) Conduct brief in-class introduction of CMs with examples (around 20 minutes); (2) Distribute more learning material on constructing CMs for further reading; (3) Distribute CmapTools tutorials to help students grasp the diagramming tool they are going to use to complete the
assignments; (4) Assign small in-class CM
exercises and provide instructor feedback. Pre-CM short surveys were also conducted and the results show that the majority of the students had not been exposed to CM before. Afterward, the CM-assignments are distributed as regular homework assignments and students were given one week to complete them.
For the purpose of constructing CMs, we adopted CmapTools (Cañas et al., 2004). This tool was chosen over other diagramming tools because: (1) It is developed by the Florida Institute for Human and Machine Cognition (IHMC) based on
their years’ research on knowledge representation; (2) It is free for download and use
for educational purposes; (3) It has an excellent user interface; (4) It provides network-based sharing and collaboration environment, which makes larger scale and longitudinal study on CMs possible; (5) It provides support to incorporating
multimedia elements into the CMs; (6) It allows the CMs to be exported in various formats such as XML files, which makes it possible to automate some analysis of the CMs.
Information Systems Education Journal (ISEDJ) 15 (6) ISSN: 1545-679X November 2017 __________________________________________________________________________________________________________________________
_________________________________________________ ©2017 ISCAP (Information Systems & Computing Academic Professionals) Page 8 http://iscap.info; http://isedj.org
CM-construction assignments can come in
different forms. For example, a focus question may be given to the students. Alternatively, an initial set of concepts may be provided to help the
students to start on the construction. The given concepts can either be provided in a list or in a pre-defined structure. In this study, the details of the CM-assignments design for each participating class is summarized in Table 2. The focus question given to the ISTP class is “How could businesses develop competitive strategies using
information systems?” For other classes, the CM-assignments are given based on specific teaching segments including “relational database model” (for one of the DOD classes), “Information Technology Architecture and Infrastructure (for SIS)”, and “Social and Ethical Issues of
information systems (for ISTP)”. For the last one, the initial set of concepts provided to students include: Ethics, Accountability, Information Systems, Information, Moral dimension, Quality of life, Data, Piracy, Ethical issues, Intellectual property, Privacy, Control, Social issues, Political issues, Data analytics, Ethical analysis, Law,
Security, Fair information practices, Ethical principles, Customer data, Computer crime. With this initial set, students are asked to construct a CM with at least 40 concepts.
Class #
Focus Question?
Initial Concepts?
Sample Size
1 N N 28
2 N Y 24
3 Y N 26
4 N Y 27
5 N Y 19
Table 2 CM-Assignments Details
Analysis and Evaluation of CMs The completed CMs are turned in electronically in
both .cmap and .cxl files. The .cmap file is the native file format for CMapTools and the .cxl file is basically exported XML file that can be parsed to extract details of the CMs. The .cxl files contain three major types of information: (1) General information of the CMs such as title, publisher,
and date; (2) Content of the CMs including concepts (nodes), relationships (edges), and the
labels of the nodes and edges; (3) Display information of the CMs such as the location of the nodes and edges, basically the graph layout information of the CMs. The first two types of information are useful in capturing and
understanding the knowledge represented by the CMs and will be the foci of our analysis. Completed CMs have a lot of information embedded in them and it is impractical to go
through them manually. Various studies have
tried to use different techniques to analyze CMs, most of which have the focus of gauging the quality of the CMs (Cañas, Bunch, Novak, &
Reiska, 2013; Jain, Gurupur, & Faulkenberry, 2013). Some other tools have the capabilities of comparing CMs to master CMs by seeking similarities (Lamas, Boeres, Cury, Menezes, & Carlesso, 2008; Marshall, Chen, & Madhusudan, 2006). For our study, we designed and implemented Concept Map Analysis Framework
(CMAF), a tool to analyze students’ CMs. The design goals include: (1) Provide automated analysis and feedback to students who turn in CMs as assignment deliverables; (2) Provide summary reports of submitted CMs of a class to the instructor; (3) For each CM, provide a quality
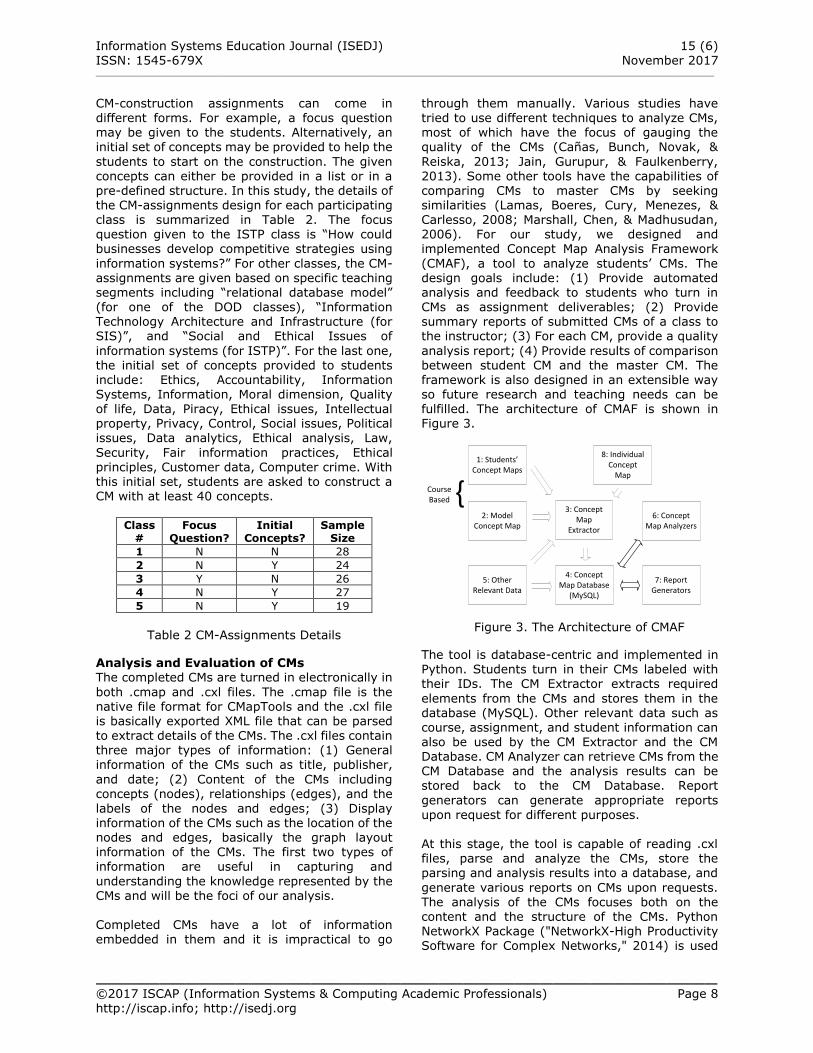
analysis report; (4) Provide results of comparison between student CM and the master CM. The framework is also designed in an extensible way so future research and teaching needs can be fulfilled. The architecture of CMAF is shown in Figure 3.
2: Model Concept Map
3: Concept Map
Extractor
4: Concept Map Database
(MySQL)
5: Other Relevant Data
6: Concept Map Analyzers
7: Report Generators
1: Students’ Concept Maps
{CourseBased
8: IndividualConcept
Map
The tool is database-centric and implemented in Python. Students turn in their CMs labeled with their IDs. The CM Extractor extracts required
elements from the CMs and stores them in the database (MySQL). Other relevant data such as course, assignment, and student information can also be used by the CM Extractor and the CM Database. CM Analyzer can retrieve CMs from the CM Database and the analysis results can be stored back to the CM Database. Report
generators can generate appropriate reports
upon request for different purposes. At this stage, the tool is capable of reading .cxl files, parse and analyze the CMs, store the parsing and analysis results into a database, and
generate various reports on CMs upon requests. The analysis of the CMs focuses both on the content and the structure of the CMs. Python NetworkX Package ("NetworkX-High Productivity Software for Complex Networks," 2014) is used
Figure 3. The Architecture of CMAF
Information Systems Education Journal (ISEDJ) 15 (6) ISSN: 1545-679X November 2017 __________________________________________________________________________________________________________________________
_________________________________________________ ©2017 ISCAP (Information Systems & Computing Academic Professionals) Page 9 http://iscap.info; http://isedj.org
to deliver topological measures of the CMs. In the
next phase, we plan to extend the tool’s functionality by including similarity analysis, i.e., comparison between students’ CMs and master
CMs provided by the instructor. With the help of the tool, we were able to batch process the CMs. In addition to extraction and storing all components of the CMs, we also process the information to obtain a set of significant measures of the CMs. A summary of
those measures is provided in Table 3 and Table 4. Note that many of the structure measures are borrowed from standard Social Network Analysis (SNA) (Wasserman & Faust, 1994).
Measure Definition
n_nodes Number of concepts in CM
n_edges Number of linkages between pair of concepts in CM
n_chars Number of characters in the labels
n_words Number of words in the label
Table 3 Captured Content Measures of CMs
Measure Definition
n_center Number of nodes that are centers
n_periphery Number of nodes that are periphery nodes
density Graph density
is_connected Boolean value to denote if the CM is connected or not
radius Minimum eccentricity
diameter Maximum eccentricity
degree Number of edges for a node
in_degree Number of incoming edges
out_degree Number of outgoing edges
deg_cent Degree centrality
close_cent Closeness centrality
between_cent Betweenness centrality
Table 4 Captured Structure Measures of CMs
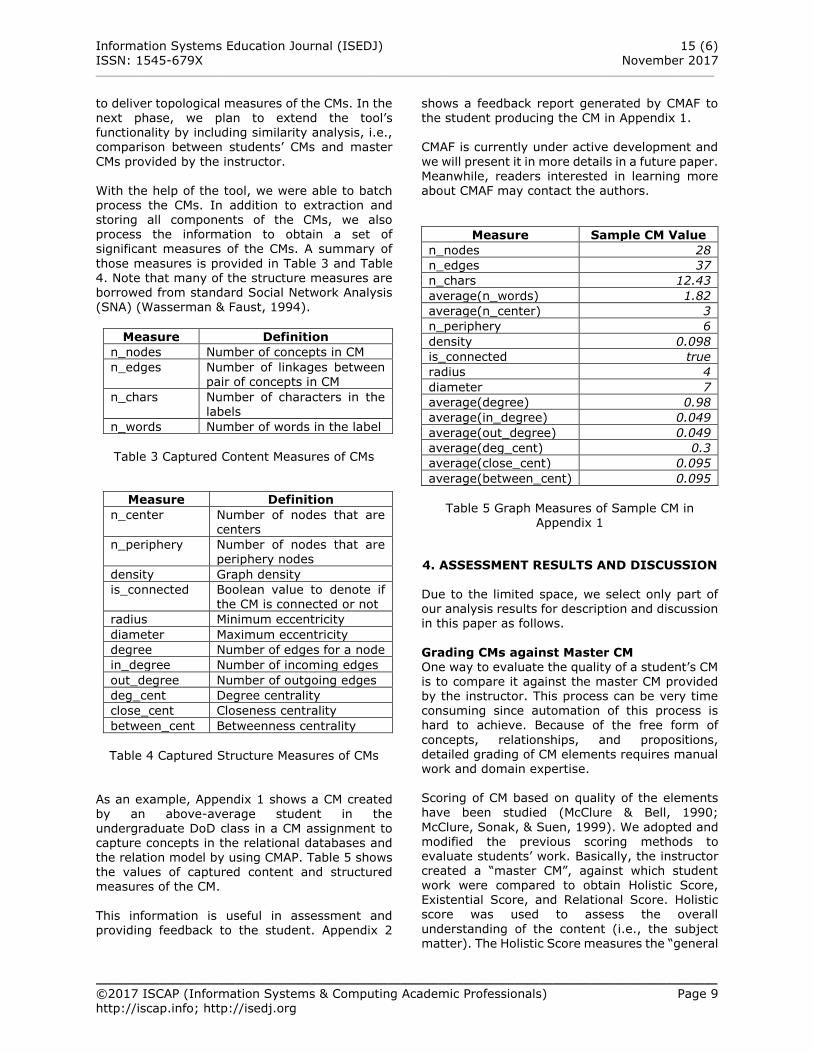
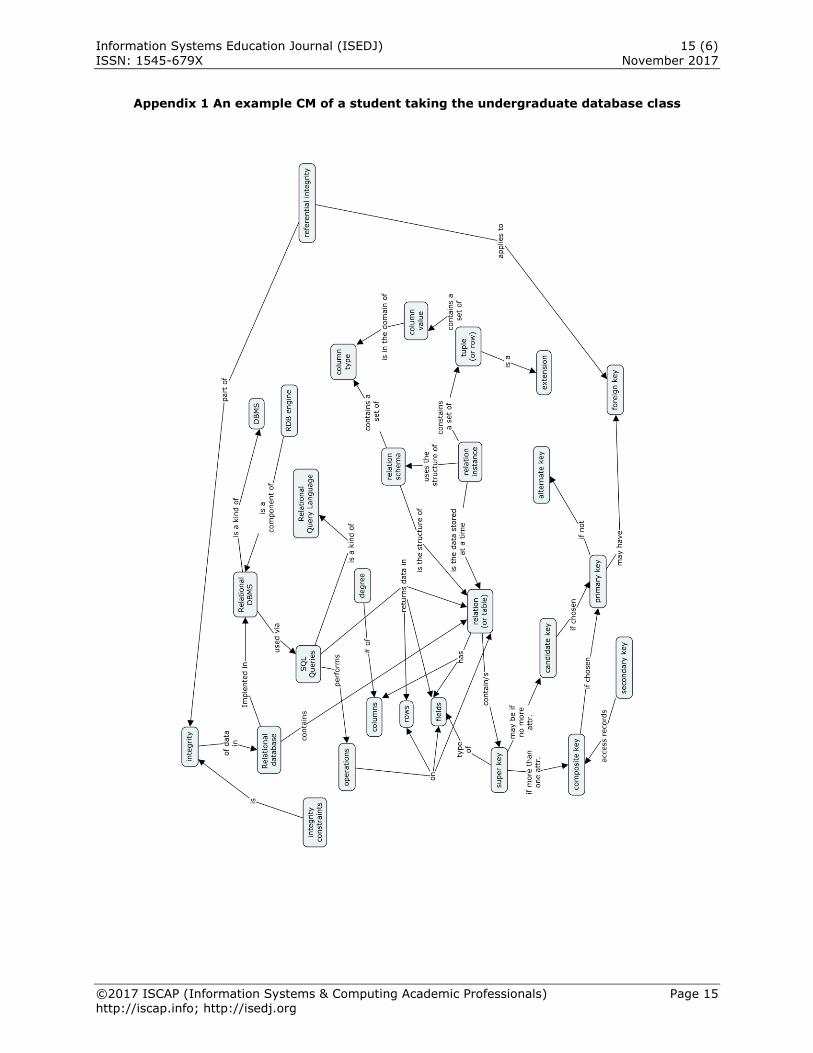
As an example, Appendix 1 shows a CM created
by an above-average student in the undergraduate DoD class in a CM assignment to capture concepts in the relational databases and the relation model by using CMAP. Table 5 shows the values of captured content and structured measures of the CM.
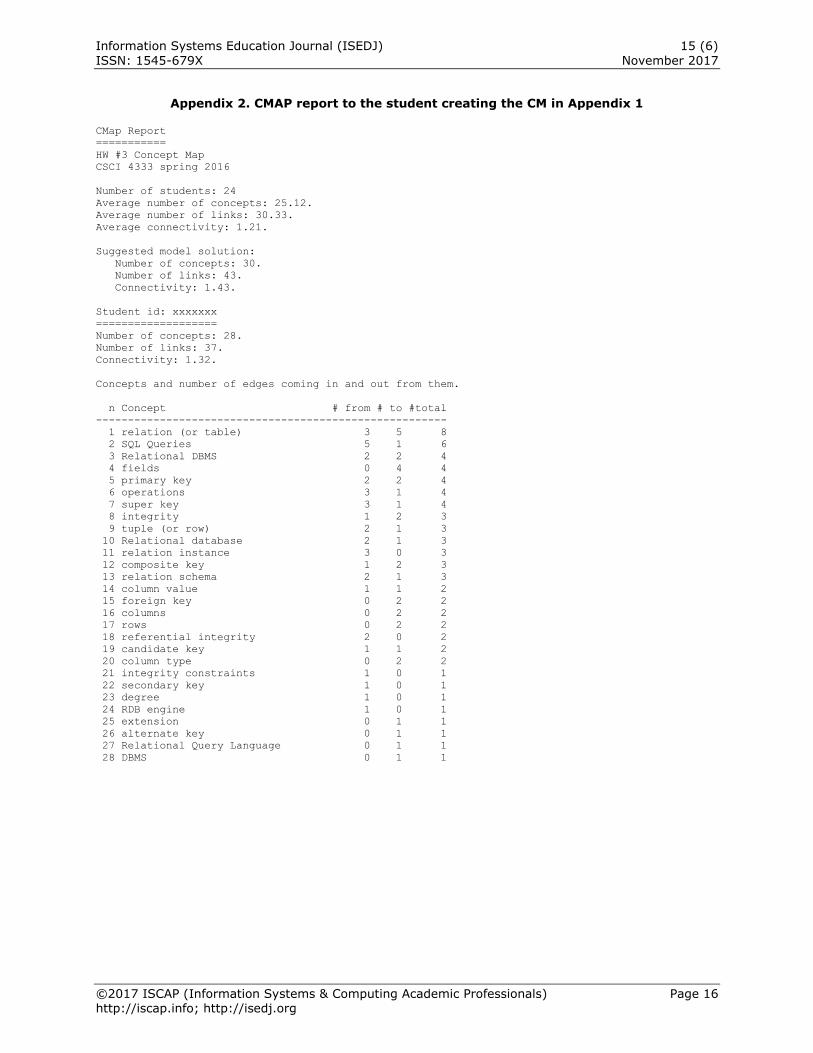
This information is useful in assessment and providing feedback to the student. Appendix 2
shows a feedback report generated by CMAF to
the student producing the CM in Appendix 1. CMAF is currently under active development and
we will present it in more details in a future paper. Meanwhile, readers interested in learning more about CMAF may contact the authors.
Measure Sample CM Value
n_nodes 28
n_edges 37
n_chars 12.43
average(n_words) 1.82
average(n_center) 3
n_periphery 6
density 0.098
is_connected true
radius 4
diameter 7
average(degree) 0.98
average(in_degree) 0.049
average(out_degree) 0.049
average(deg_cent) 0.3
average(close_cent) 0.095
average(between_cent) 0.095
Table 5 Graph Measures of Sample CM in
Appendix 1
4. ASSESSMENT RESULTS AND DISCUSSION
Due to the limited space, we select only part of our analysis results for description and discussion in this paper as follows.
Grading CMs against Master CM One way to evaluate the quality of a student’s CM is to compare it against the master CM provided by the instructor. This process can be very time consuming since automation of this process is hard to achieve. Because of the free form of
concepts, relationships, and propositions, detailed grading of CM elements requires manual work and domain expertise. Scoring of CM based on quality of the elements
have been studied (McClure & Bell, 1990;
McClure, Sonak, & Suen, 1999). We adopted and modified the previous scoring methods to evaluate students’ work. Basically, the instructor created a “master CM”, against which student work were compared to obtain Holistic Score, Existential Score, and Relational Score. Holistic score was used to assess the overall
understanding of the content (i.e., the subject matter). The Holistic Score measures the “general
Information Systems Education Journal (ISEDJ) 15 (6) ISSN: 1545-679X November 2017 __________________________________________________________________________________________________________________________
_________________________________________________ ©2017 ISCAP (Information Systems & Computing Academic Professionals) Page 10 http://iscap.info; http://isedj.org
goodness” of the CMs and is often assigned by the
graders who are familiar with the purpose of the assessment. Existential score captures the presence or lacking of required concepts,
weighted by their relative significance in the CM. CMs that contain more “significant” concepts in the master CM scores higher in this aspect. Relational score measures the existence and correctness of relationships between concepts, and relationships are also weighted. CMs that include more heavy-weighted relationships score
higher in this aspect. These three different scores were combined in a weighted-manner to compute the overall score. The overall score is calculated
on a 1-10 scale as 𝑂𝑣𝑒𝑟𝑎𝑙𝑙 = (10 ×𝐸
𝐸𝑚𝑎𝑥+ 10 ×
𝑅
𝑅𝑚𝑎𝑥+
𝐻)/3, where E and R are the Existential and
Relational scores respectively. Emax and Rmax are the highest achievable existential and relational scores and they can be calculated using the master CM. The graders, based on their understanding of the content, also assign the weights of the concepts and relationships. H is the
holistic score on a 1-10 scale and the assignment of a value for H relies on the grader’s criteria and domain knowledge. Using this method, completed CMs by students were graded and the general findings are as follows: (1) Students tend to achieve higher existential score than relational score; (2) Overall high score is rare compared to
the master CM; (3) High holistic score doesn’t necessarily correlate with high existential and/or relational scores; (4) Grading score, especially
the relational score, correlates positively with course grade. A possible implication of this is that students who are better in meaningful learning (required to achieve high relational scores)
generally perform better than others in the class, where knowing and memorizing facts is not sufficient. In addition, by observing the CMs by students, instructors can gain insights as to how to improve teaching to facilitate meaningful learning such as: (1) What concepts do many students fail to include in the CMs, especially
those concepts that are essential to learning objectives? The instructor may consider modify teaching to emphasize those important concepts. (2) What are the commonly missed/incorrectly labeled relationships that need more clarification?
(3) Is the teaching structured in the way to help
students see connection between topics? This can be done by observing the existence and/or absence cross-topic relationships. Currently, instructors do most of the grading against master map manually. We plan to include at least part of this process into our CMAF.
General Features of CMs
Some general features of CMs include: (1) The number of concepts (nodes) in a CM (#N); (2) The number of relationships (edges) in a CM
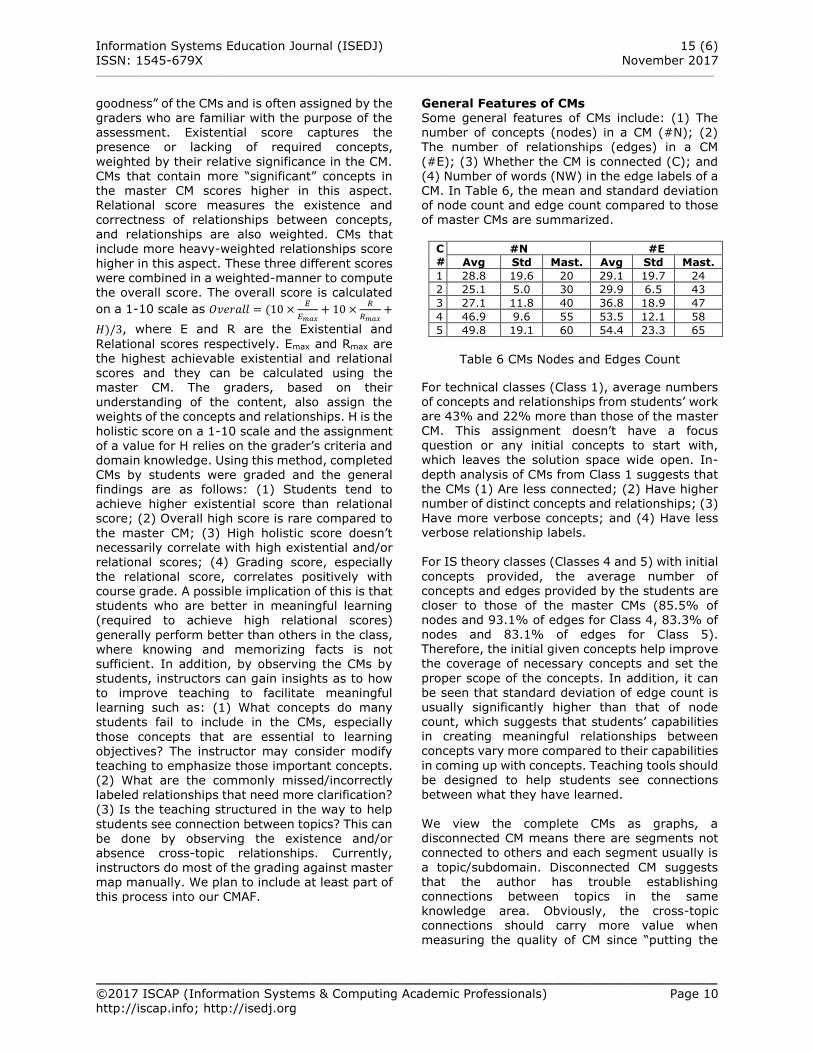
(#E); (3) Whether the CM is connected (C); and (4) Number of words (NW) in the edge labels of a CM. In Table 6, the mean and standard deviation of node count and edge count compared to those of master CMs are summarized.
C#
#N #E
Avg Std Mast. Avg Std Mast.
1 28.8 19.6 20 29.1 19.7 24
2 25.1 5.0 30 29.9 6.5 43
3 27.1 11.8 40 36.8 18.9 47
4 46.9 9.6 55 53.5 12.1 58
5 49.8 19.1 60 54.4 23.3 65
Table 6 CMs Nodes and Edges Count
For technical classes (Class 1), average numbers of concepts and relationships from students’ work are 43% and 22% more than those of the master CM. This assignment doesn’t have a focus question or any initial concepts to start with, which leaves the solution space wide open. In-
depth analysis of CMs from Class 1 suggests that the CMs (1) Are less connected; (2) Have higher number of distinct concepts and relationships; (3) Have more verbose concepts; and (4) Have less verbose relationship labels. For IS theory classes (Classes 4 and 5) with initial
concepts provided, the average number of concepts and edges provided by the students are closer to those of the master CMs (85.5% of nodes and 93.1% of edges for Class 4, 83.3% of nodes and 83.1% of edges for Class 5). Therefore, the initial given concepts help improve the coverage of necessary concepts and set the
proper scope of the concepts. In addition, it can be seen that standard deviation of edge count is usually significantly higher than that of node count, which suggests that students’ capabilities in creating meaningful relationships between concepts vary more compared to their capabilities
in coming up with concepts. Teaching tools should be designed to help students see connections between what they have learned.
We view the complete CMs as graphs, a disconnected CM means there are segments not connected to others and each segment usually is
a topic/subdomain. Disconnected CM suggests that the author has trouble establishing connections between topics in the same knowledge area. Obviously, the cross-topic connections should carry more value when measuring the quality of CM since “putting the
Information Systems Education Journal (ISEDJ) 15 (6) ISSN: 1545-679X November 2017 __________________________________________________________________________________________________________________________
_________________________________________________ ©2017 ISCAP (Information Systems & Computing Academic Professionals) Page 11 http://iscap.info; http://isedj.org
whole picture together” requires true learning in
depth. Our analysis results give some insights on this matter as follows: (1) The two classes with focus on “content concepts” (database
technologies) have much higher percentage of connected CMs, i.e., no broken pieces in the CMs (89.3% and 95.8% respectively). The three classes with focus on “process concepts” (IS theories) perform worse and the connected percentages are 56.0%, 44.4%, and 78.9%. For the knowledge area of DBMS, the content and
structure are more maturely established and stable, which makes it easier for the students to see the holistic view. For IS theory classes, the topics are more diverse and students tend to lose track of the connectedness. However, with advancement in the program, this aspect gets
improved as we can see graduate students (78.9%) perform much better than undergraduate students. Furthermore, we also found that in IS theory classes, CMs have higher number of words in the concept labels than DBMS classes. This often happens because concepts in IS theory classes are more abstract and students
have more trouble in coming up with precise and succinct concepts. In some extreme cases, a whole sentence is used as a concept. What the students fail to realize is that very long concept label is a good indication that more complicated structure such as propositions should be used instead, as seen in the example shown in Figure
4.
Figure 4. Example of a Very Long Concept
Structure Features of CMs In this section, we illustrate our findings by
analyzing CMs as graphs using network analysis techniques provided in NetworkX, with focus on selected features. For a node in a graph, its eccentricity measures the longest distance between it and any other nodes. The minimum eccentricity of a graph is its radius and the
maximum eccentricity is the diameter. The nodes
whose eccentricity equals to the radius are called center. The nodes with eccentricity equals to the diameter are called periphery. For a node, the
number of edges connected to it is called the degree. For directed graph, there are in-degree and out-degree. Centrality is used to measure the relative importance of a node in a graph, based on how connected is this node to others. Four different centrality measures are studied including degree, betweenness, closeness, and
load centrality (Wasserman & Faust, 1994).
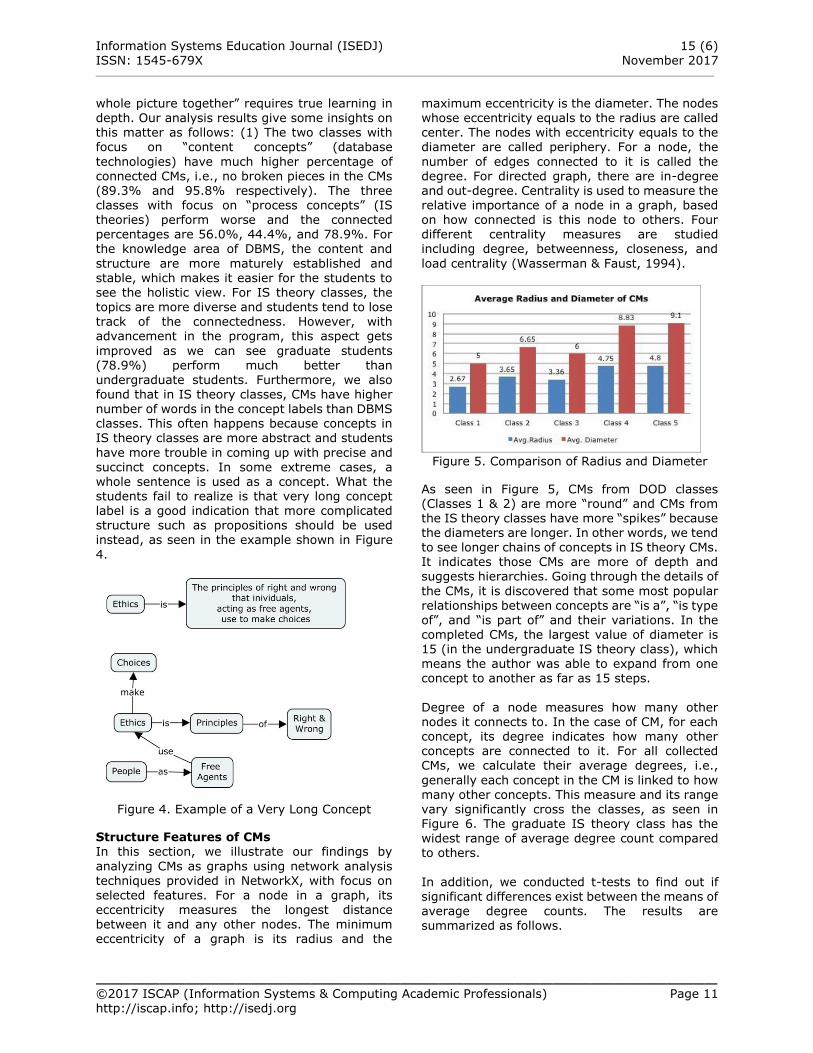
Figure 5. Comparison of Radius and Diameter
As seen in Figure 5, CMs from DOD classes (Classes 1 & 2) are more “round” and CMs from the IS theory classes have more “spikes” because the diameters are longer. In other words, we tend to see longer chains of concepts in IS theory CMs. It indicates those CMs are more of depth and
suggests hierarchies. Going through the details of
the CMs, it is discovered that some most popular relationships between concepts are “is a”, “is type of”, and “is part of” and their variations. In the completed CMs, the largest value of diameter is 15 (in the undergraduate IS theory class), which means the author was able to expand from one concept to another as far as 15 steps.
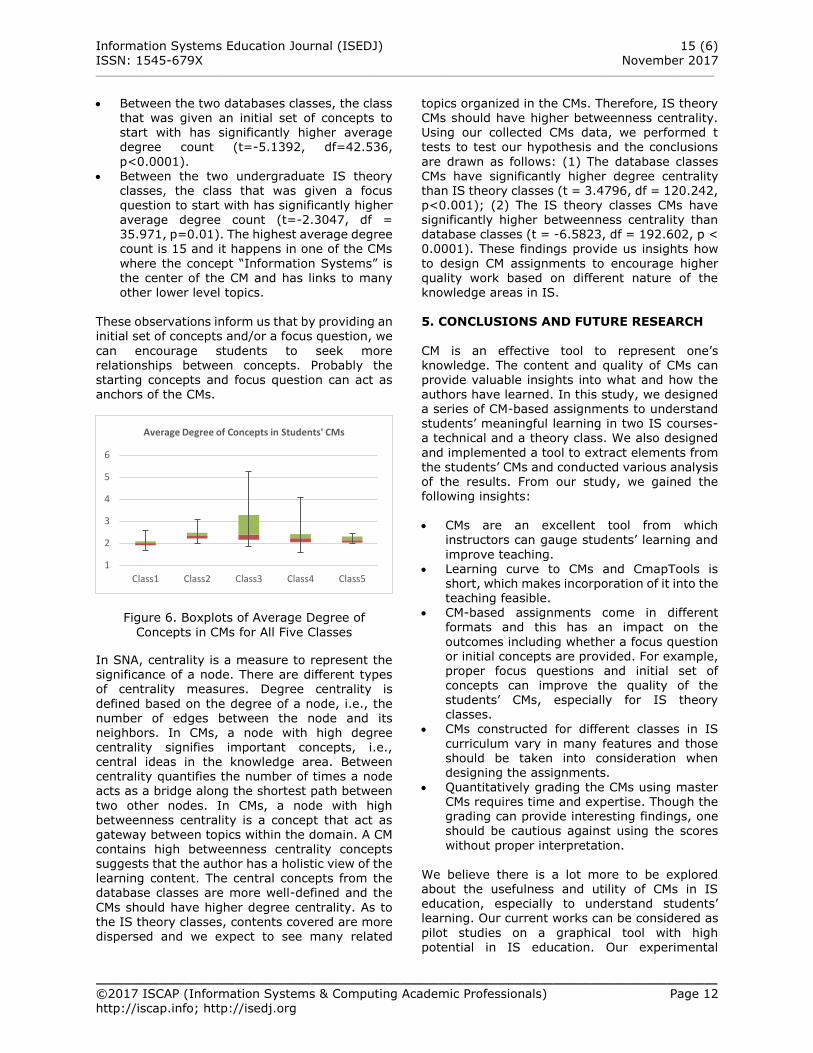
Degree of a node measures how many other nodes it connects to. In the case of CM, for each concept, its degree indicates how many other concepts are connected to it. For all collected CMs, we calculate their average degrees, i.e.,
generally each concept in the CM is linked to how many other concepts. This measure and its range
vary significantly cross the classes, as seen in Figure 6. The graduate IS theory class has the widest range of average degree count compared to others.
In addition, we conducted t-tests to find out if significant differences exist between the means of average degree counts. The results are summarized as follows.
Information Systems Education Journal (ISEDJ) 15 (6) ISSN: 1545-679X November 2017 __________________________________________________________________________________________________________________________
_________________________________________________ ©2017 ISCAP (Information Systems & Computing Academic Professionals) Page 12 http://iscap.info; http://isedj.org
Between the two databases classes, the class
that was given an initial set of concepts to start with has significantly higher average degree count (t=-5.1392, df=42.536,
p<0.0001). Between the two undergraduate IS theory
classes, the class that was given a focus question to start with has significantly higher average degree count (t=-2.3047, df = 35.971, p=0.01). The highest average degree count is 15 and it happens in one of the CMs
where the concept “Information Systems” is the center of the CM and has links to many other lower level topics.
These observations inform us that by providing an initial set of concepts and/or a focus question, we
can encourage students to seek more relationships between concepts. Probably the starting concepts and focus question can act as anchors of the CMs.
Figure 6. Boxplots of Average Degree of
Concepts in CMs for All Five Classes
In SNA, centrality is a measure to represent the significance of a node. There are different types of centrality measures. Degree centrality is
defined based on the degree of a node, i.e., the number of edges between the node and its neighbors. In CMs, a node with high degree centrality signifies important concepts, i.e., central ideas in the knowledge area. Between centrality quantifies the number of times a node acts as a bridge along the shortest path between
two other nodes. In CMs, a node with high betweenness centrality is a concept that act as gateway between topics within the domain. A CM contains high betweenness centrality concepts suggests that the author has a holistic view of the learning content. The central concepts from the database classes are more well-defined and the
CMs should have higher degree centrality. As to the IS theory classes, contents covered are more dispersed and we expect to see many related
topics organized in the CMs. Therefore, IS theory
CMs should have higher betweenness centrality. Using our collected CMs data, we performed t tests to test our hypothesis and the conclusions
are drawn as follows: (1) The database classes CMs have significantly higher degree centrality than IS theory classes (t = 3.4796, df = 120.242, p<0.001); (2) The IS theory classes CMs have significantly higher betweenness centrality than database classes (t = -6.5823, df = 192.602, p < 0.0001). These findings provide us insights how
to design CM assignments to encourage higher quality work based on different nature of the knowledge areas in IS.
5. CONCLUSIONS AND FUTURE RESEARCH
CM is an effective tool to represent one’s knowledge. The content and quality of CMs can provide valuable insights into what and how the authors have learned. In this study, we designed a series of CM-based assignments to understand students’ meaningful learning in two IS courses-a technical and a theory class. We also designed
and implemented a tool to extract elements from the students’ CMs and conducted various analysis of the results. From our study, we gained the following insights: CMs are an excellent tool from which
instructors can gauge students’ learning and
improve teaching. Learning curve to CMs and CmapTools is
short, which makes incorporation of it into the teaching feasible.
CM-based assignments come in different formats and this has an impact on the
outcomes including whether a focus question or initial concepts are provided. For example, proper focus questions and initial set of concepts can improve the quality of the students’ CMs, especially for IS theory classes.
CMs constructed for different classes in IS
curriculum vary in many features and those should be taken into consideration when designing the assignments.
Quantitatively grading the CMs using master
CMs requires time and expertise. Though the grading can provide interesting findings, one should be cautious against using the scores
without proper interpretation. We believe there is a lot more to be explored about the usefulness and utility of CMs in IS education, especially to understand students’ learning. Our current works can be considered as
pilot studies on a graphical tool with high potential in IS education. Our experimental
1
2
3
4
5
6
Class1 Class2 Class3 Class4 Class5
Average Degree of Concepts in Students' CMs
Information Systems Education Journal (ISEDJ) 15 (6) ISSN: 1545-679X November 2017 __________________________________________________________________________________________________________________________
_________________________________________________ ©2017 ISCAP (Information Systems & Computing Academic Professionals) Page 13 http://iscap.info; http://isedj.org
designs are limited by the small sample sizes, the
small number and variety of participating IS classes, the absences of control groups, and the lack of a strong theoretical model. Furthermore,
we have tested only a few variety of CM assignments. As a flexible graphical tool, the kind of CM assignments can be very rich and a taxonomy of these CM assignments in the context of IS education has not been studied systematically. Both the assessment methods and the CMAF tool are in their early stages and
much can be improved. Based on the lessons learnt in this series of preliminary studies, we will address these limitations and expand the scope and depth of our study and continue to improve our CMAF.
6. ACKNOWLEDGEMENT This project is partially supported by UHCL NSF Scholar Program (NSF Grant # 1060039). We thank our students and NSF scholars for their participation and assistance. We also thank the UHCL Quality Enhancement Plan Leadership
Team for its support in our investigations on critical thinking.
7. REFERENCES
Ausubel, D. P. (1963). The psychology of
meaningful verbal learning. Oxford, England:
Grune & Stratton.
Ausubel, D. P. (2012). The acquisition and retention of knowledge: A cognitive view: Springer Science & Business Media.
Cañas, A. J., Bunch, L., Novak, J. D., & Reiska, P. (2013). Cmapanalysis: an extensible concept
map analysis tool. Journal for Educators, Teachers and Trainers.
Cañas, A. J., Carff, R., Hill, G., Carvalho, M., Arguedas, M., Eskridge, T. C., . . . Carvajal, R. (2005). Concept maps: Integrating knowledge and information visualization Knowledge and information visualization (pp.
205-219): Springer.
Cañas, A. J., Hill, G., Carff, R., Suri, N., Lott, J., Eskridge, T., . . . Carvajal, R. (2004). CmapTools: A knowledge modeling and sharing environment. Paper presented at the Concept maps: Theory, methodology, technology. Proceedings of the first
international conference on concept mapping.
Cañas, A. J., & Novak, J. D. (2014). Facilitating
the Adoption of Concept Mapping Using CmapTools to Enhance Meaningful Learning. In A. Okada, S. J. Buckingham Shum, & T.
Sherborne (Eds.), Knowledge Cartography, Software Tools and Mapping Techniques (pp. 23-45): Springer.
Cañas, A. J., Novak, J. D., & Reiska, P. (2015). How good is my concept map? Am I a good Cmapper? Knowledge Management & E-Learning: An International Journal (KM&EL),
7(1), 6-19.
Derbentseva, N., Safayeni, F., & Cañas, A. (2007). Concept maps: Experiments on dynamic thinking. Journal of Research in
Science Teaching, 44(3), 448-465.
Freeman, L., & Urbaczewski, A. (2001). Using
Concept Maps to Assess Students' Understanding of Information Systems. Journal of Information Systems Education, 12(1), 3-9.
Gregoriades, A., Pampaka, M., & Michail, H. (2009). Assessing Students' Learning in MIS using Concept Mapping. Journal of
Information Systems Education, 20(4), 419.
Jain, G. P., Gurupur, V. P., & Faulkenberry, E. D. (2013). Artificial intelligence based student
learning evaluation tool. Paper presented at the Global Engineering Education Conference (EDUCON), 2013 IEEE.
Lamas, F., Boeres, M., Cury, D., Menezes, C. S.,
& Carlesso, G. (2008). An approach to comparison of concept maps represented by graphs. Paper presented at the Concept Mapping: Connecting Educators, Proceedings of the Third International Conference on Concept Mapping, Tallinn, Estonia & Helsinki,
Finland: University of Tallinn.
Marshall, B., Chen, H., & Madhusudan, T. (2006). Matching knowledge elements in concept maps using a similarity flooding algorithm.
Decision Support Systems, 42(3), 1290-1306.
Mayer, R. E. (2002). Rote versus Meaningful
Learning. Theory Into Practice, 41(4), 226-232. Retrieved from http://www.jstor.org/stable/1477407
McClure, J. R., & Bell, P. E. (1990). Effects of an Environmental Education-Related STS
Information Systems Education Journal (ISEDJ) 15 (6) ISSN: 1545-679X November 2017 __________________________________________________________________________________________________________________________
_________________________________________________ ©2017 ISCAP (Information Systems & Computing Academic Professionals) Page 14 http://iscap.info; http://isedj.org
Approach Instruction on Cognitive Structures
of Preservice Science Teachers. University Park, PA: Pennsylvania State University.
McClure, J. R., Sonak, B., & Suen, H. K. (1999).
Concept Map Assessment of Classroom Learning: Reliability, Validity, and Logistical Practicality. Journal of Research in Science Teaching, 36(4), 475-492.
NetworkX-High Productivity Software for Complex Networks. (2014). Retrieved from https://networkx.github.io/
Novak, J. D. (1993). Human constructivism: A unification of psychological and epistemological phenomena in meaning
making. International Journal of Personal Construct Psychology, 6(2), 167-193.
Novak, J. D., & Cañas, A. J. (2008). The theory
underlying concept maps and how to construct and use them.
Novak, J. D., & Gowin, D. B. (1984). Learning how to learn: Cambridge University Press.
Strautmane, M. (2012). Concept Map-Based Knowledge Assessment Tasks and Their Scoring Criteria: an Overview. Paper
presented at the Concept Maps: Theory, Methodology, Technology. The Fifth
International Conference on Concept Mapping, Valletta, Malta.
Topi, H., Valacich, J. S., Wright, R. T., Kaiser, K., Nunamaker Jr, J. F., Sipior, J. C., & de
Vreede, G.-J. (2010). IS 2010: Curriculum
guidelines for undergraduate degree programs in information systems. Communications of the Association for
Information Systems, 26(1), 18.
Wasserman, S., & Faust, K. (1994). Social Network Analysis-Methods and Applications: Cambridge University Press.
Wei, W., & Yue, K.-B. (2016). Using Concept Maps to Teach and Assess Critical Thinking in IS Education Paper presented at the 22nd
Americas Conference on Information Systems San Diego, US.
Weideman, M., & Kritzinger, W. (2003). Concept
Mapping-a proposed theoretical model for implementation as a knowledge repository. ICT in Higher Education.
Yin, Y., Vanides, J., Ruiz‐ Primo, M. A., Ayala, C. C., & Shavelson, R. J. (2005). Comparison of two concept‐ mapping techniques: Implications for scoring, interpretation, and use. Journal of Research in Science Teaching, 42(2), 166-184.
Zendler, A., Spannagel, C., & Klaudt, D. (2011).
Marrying content and process in computer science education. Education, IEEE Transactions on, 54(3), 387-397.
Information Systems Education Journal (ISEDJ) 15 (6)
ISSN: 1545-679X November 2017
©2017 ISCAP (Information Systems & Computing Academic Professionals) Page 15 http://iscap.info; http://isedj.org
Appendix 1 An example CM of a student taking the undergraduate database class
Information Systems Education Journal (ISEDJ) 15 (6)
ISSN: 1545-679X November 2017
©2017 ISCAP (Information Systems & Computing Academic Professionals) Page 16 http://iscap.info; http://isedj.org
Appendix 2. CMAP report to the student creating the CM in Appendix 1
CMap Report
===========
HW #3 Concept Map
CSCI 4333 spring 2016
Number of students: 24
Average number of concepts: 25.12.
Average number of links: 30.33.
Average connectivity: 1.21.
Suggested model solution:
Number of concepts: 30.
Number of links: 43.
Connectivity: 1.43.
Student id: xxxxxxx
===================
Number of concepts: 28.
Number of links: 37.
Connectivity: 1.32.
Concepts and number of edges coming in and out from them.
n Concept # from # to #total
-------------------------------------------------------
1 relation (or table) 3 5 8
2 SQL Queries 5 1 6
3 Relational DBMS 2 2 4
4 fields 0 4 4
5 primary key 2 2 4
6 operations 3 1 4
7 super key 3 1 4
8 integrity 1 2 3
9 tuple (or row) 2 1 3
10 Relational database 2 1 3
11 relation instance 3 0 3
12 composite key 1 2 3
13 relation schema 2 1 3
14 column value 1 1 2
15 foreign key 0 2 2
16 columns 0 2 2
17 rows 0 2 2
18 referential integrity 2 0 2
19 candidate key 1 1 2
20 column type 0 2 2
21 integrity constraints 1 0 1
22 secondary key 1 0 1
23 degree 1 0 1
24 RDB engine 1 0 1
25 extension 0 1 1
26 alternate key 0 1 1
27 Relational Query Language 0 1 1
28 DBMS 0 1 1
Information Systems Education Journal (ISEDJ) 15 (6)
ISSN: 1545-679X November 2017
©2017 ISCAP (Information Systems & Computing Academic Professionals) Page 17 http://iscap.info; http://isedj.org
Investigating Student Resistance and
Student Perceptions of Course Quality and Instructor Performance
in a Flipped Information Systems Classroom
Elizabeth White Baker
Stephen Hill [email protected]
Department of Information Systems and Operations Management
University of North Carolina – Wilmington Wilmington, NC, 28403, USA
Abstract
The study focuses on the instructor as a stakeholder in implementing the flipped classroom learning approach and ways to lessen professor resistance to flipped classroom adoption. The barrier to professor adoption that concerns potentially lower student evaluations as a result of incorporating the new
approach is of particular interest. The investigation shows how inverted classrooms (ICs), incorporating both traditional and e-learning pedagogical elements, impact student perceptions of course quality and instructor teaching effectiveness. Students in an Introduction to Information Systems course were given
surveys after a traditional course presentation, once the instructor changed to an IC, and after the instructor had taught the course in an IC environment several times. The results show that there are positive impacts to student perceptions of both course quality and instructor teaching effectiveness when students are taught in an IC. Further investigations into additional factors to encourage the adoption of this pedagogical approach are also provided.
Keywords: Information Systems Education; Student Resistance; Flipped Classroom; Inverted Classroom; Student Perceptions; Pedagogy
1. INTRODUCTION Developing new and novel pedagogical methods
that improve student engagement and student learning outcomes and more effectively teach course materials are a point of focus for educators. This is especially true for those educators in STEM fields where the course material can seem remote and intimidating to students. Historically, information systems (IS)
pedagogical research has focused on replacing the traditional classroom structure (synchronous time and place) with completely asynchronous
learning approaches (Alavi, Marakas, & Yoo, 2002; Arbaugh & Benbunan-Finch, 2006; Santhanam, Sasidharan, & Webster, 2008).
However, an approach that is gaining significant attention is a blended approach, where a course is structured to incorporate both traditional and e-learning elements, leveraging the strengths of each. One of the most significant impacts that using a blended approach can have is to allow the instructor to “flip” the classroom to enhance
student engagement. This work adopts the definition of a flipped classroom from Walvoord and Anderson (2011) where the learning
Information Systems Education Journal (ISEDJ) 15 (6)
ISSN: 1545-679X November 2017
©2017 ISCAP (Information Systems & Computing Academic Professionals) Page 18 http://iscap.info; http://isedj.org
environment is modeled for students to first gain
exposure learning (gaining knowledge and comprehension) prior to the synchronous class session and focus on higher level learning with
respect to Bloom’s taxonomy (Anderson et al., 2001) (e.g., synthesizing, analyzing, problem-solving, etc.) in class. Lage, Platt and Treglia (2000) described a similar approach as the “inverted classroom,” or IC. Research demonstrates that several different educational constituencies benefit when employing ICs. With
respect to IC effectiveness on student learning outcomes, many studies have been conducted that demonstrate the positive impact of flipped classrooms in delivering material across a wide variety of domain knowledge: undergraduate engineering (Mason, Shuman, & Cook, 2013);
undergraduate statistics (Wilson, 2013); graduate physiology (Tune, Sturek, & Basile, 2013); and information systems (Mok, 2014), among others. Yet, in spite of the demonstrated benefits of using an IC, many professors do not take advantage of this pedagogical approach. The move from teacher-centered to student-centered
learning will often encounter significant resistance (Keeney-Kennicutt, Gunersel, & Simpson, 2008; Pepper, 2010; Reimann, 2011). Students and professors alike exhibit this resistance to the change in the classroom approach.
One of the factors influencing faculty adoption of research-based instructional strategies, such as
ICs, is concern about student resistance (Smith, Cooper, & Lancaster, 2002; Vuorela & Nummenmaa, 2004). Student resistance to inverted classrooms has been well studied in the
literature (Cooper, MacGregor, Smith, & Robinson, 2000; Ellis, 2015; Felder & Brent, 1996). Kenney-Kennicutt and Simpson (2008) suggest that this resistance manifests as a result of the shift in thinking about who has responsibilities for what actions and processes in the classroom (Cheung & Huang, 2005; Cuban,
1993; Lee, Cheung, & Chen, 2005). The student anxiety and disorientation over the new expectations of them in the classroom impacts student performance (Akerlind & Trevitt, 1999).
Researchers have offered strategies to professors to acknowledge and overcome this resistance, including active listening and response to student
concerns (Keeney-Kennicutt et al., 2008), providing explicit guidance on how to meet expectations of the course (Akerlind & Trevitt, 1999) and Silverthorn’s (2006) six recommendations for conducting an inverted classroom.
With guidelines for the successful responses to
student resistance being provided to professors, it would seem that there would be greater adoption of ICs than currently exists. Yet,
considering the entire system of actors involved in teaching and learning, including interactions between administrators, faculty members and students, all points of resistance to the change within the system can contribute to non-adoption. In particular, faculty resistance to ICs remains a significant barrier to flipped classroom adoption
and implementation (Christensen Hughes & Mighty, 2010). One metric of student resistance that is a concern to faculty members is course evaluation performance (Gormally, Brickman, Hallar, & Armstrong, 2011; Kearney & Plax, 1992).
This current research builds on the success in ICs of raising student outcomes through addressing student resistance. The work broadens the scope of research to observe potential sources of faculty resistance to adoption of this pedagogical approach. Impact on student evaluation results is
a reason that faculty resist implementing the IC approach (Froyd, Borrego, Cutler, Henderson, & Prince, 2013). We set out to find how student evaluations were impacted when employing the IC approach with a professor new to delivering the approach by looking at the impact on student perceptions of course quality and instructor
teaching effectiveness, two factors central to the development of compelling classroom
experiences for students. Implementing an effective IC leads to potentially better student perceptions of course quality and instructor teaching effectiveness, leading to higher course
evaluation scores. The first research question is “Does flipping the IS/IT classroom improve student perceptions of course quality?” and second, “Does flipping the IS/IT classroom impact student evaluations of the teaching effectiveness of the instructor?” Over
the course of three semester-long course periods, student survey data on perceptions of course quality and teaching effectiveness are analyzed to look at the differences between semester T1,
where a traditional lecture delivery method was used to teach an Introduction to IS course; semester T2, the initial flipped classroom delivery
of the same material; and semester T3, the second flipped classroom delivery for the same course. This study uses quantitative methods to analyze student survey data from these three delivery timeframes.
Information Systems Education Journal (ISEDJ) 15 (6)
ISSN: 1545-679X November 2017
©2017 ISCAP (Information Systems & Computing Academic Professionals) Page 19 http://iscap.info; http://isedj.org
2. LITERATURE REVIEW
Following recommendations from Urbaczewski (2013) on future research on flipped classrooms
in information systems and Prince et al. (2013) on future research into professor’s perceptions of the flipped classroom, this study addresses a gap in the literature related to student perceptions of the flipped classroom environment, in particular, introductory IS course student perceptions of the course quality and instructor teaching
effectiveness. These perceptions have the potential to influence various stakeholders in higher education content delivery practices, in particular implementation of ICs by professors. Stakeholder analysis of resistance to
flipped classrooms in information systems The three stakeholders identified in this study are students taking IS courses, IS instructors delivering courses, and higher education administrators responsible for managing the enrollments and staffing of these courses. Each of these constituencies could have significant
motivation to employ flipped classroom techniques and to do so effectively. For example, if student perceptions of course quality and teaching effectiveness are positive and the value received in a flipped classroom is greater to students than in other learning formats, then why not teach all courses in this manner?
Several reasons might explain the reticence of
instructors to adopt flipped classroom pedagogy. Resistance may arise in the relationship between the instructor and the administration. Henderson and Dancy (2007) find that faculty decisions are
influenced by peer support, department climate, and institutional structures and policies. Although this administration contribution to IC adoption resistance is not in the scope of this paper, it is worth noting that a desire to increase the number of majors in IS and preparing those majors for future work environments (Granger, Dick,
Luftman, Van Slyke, & Watson, 2007; Koch, Van Slyke, Watson, Wells, & Wilson, 2010) makes administrative support of faculty to develop compelling classroom experiences an imperative
for IS administrators and instructors globally. One reason for instructor resistance to using ICs
comes from the lack of instructor familiarity with the particular pedagogies involved in active learning. For an IS instructor this familiarity with pedagogy can be a significant impediment to implementing this form of teaching, as it is not a classroom style that many have been a student in
or taught previously. Lecturing is more familiar and more refined for most IS educators, thus it is
the predominant pedagogy. Not all teaching
environments have course development resources available to assist instructors in creating the new course material delivery
experience an IC requires. Second, the types of course preparation that a professor performs for an IC is significantly different than what that instructor would perform if teaching courses in a more traditional, lecture-based manner. Preparing a lecture for students
requires a different skill set than preparing active-learning exercises around each learning objective in the course and developing the materials to ensure that students have familiarity with the vocabulary and basic skills before engaging in the active-learning activities in an IC. Instructors who
have already adopted the IC (in the field of pharmacy) have found that developing and administering a flipped course took over 125% more time than teaching it in a traditional lecture format (McLaughlin et al., 2014). In an introductory economics course, the time to plan and create the asynchronous content was twice
what the typical preparation time had been for the course with a traditional delivery (Lage et al., 2000). Such a significant time investment might be discouraging to those who fear that their teaching might end up being perceived as less effective as a result of adopting this approach (Herreid & Schiller, 2013).
Prior research has suggested that the flipped
classroom approach might not be the best structure for an introductory course (Strayer, 2012). Most students in the course may not have a deep interest in the subject, making more in-
depth engagement with the material something students see as an unnecessary effort, leading to a rise in student resistance. Students in a flipped introductory statistics course reported being less satisfied with the way they were prepared for the tasks they were given than students in a traditional lecture structure (Strayer, 2012).
Other potential reasons for the lack of active-learning pedagogy adoption revolve around role changes and perceptions of the instructor in the
classroom and the impact this has on student evaluation of instruction. In an IC environment instructors move from the traditional role of
lecturing as demonstrated knowledge toward learning facilitators in their presentation of the active learning activities (King, 1993; Rutherfoord & Rutherfoord, 2013). Although empowering to students to take the initiative for learning into their own hands, it may not be the
student’s expectation of what a typical instructor should be doing. Students might not perceive this
Information Systems Education Journal (ISEDJ) 15 (6)
ISSN: 1545-679X November 2017
©2017 ISCAP (Information Systems & Computing Academic Professionals) Page 20 http://iscap.info; http://isedj.org
facilitation as “teaching” as they have come to
know it through the many years of education that they have already experienced. Students can perceive the instructor as being less of an expert
because the student has to ‘learn the material on their own, without the professor’s help’ (Findlay-Thompson & Mombourquette, 2014). Instead of the student being more enthusiastic about being actively engaged in the classroom, the student begins to question the instructor’s expertise and work product by perceiving the instructor as
unwilling to help the student learn and pushing the work on to the students to have to ‘teach themselves,’ leading to a decrease in student satisfaction (Berrett, 2012; Missildine, Fountain, Summers, & Gosselin, 2013; Strayer, 2012). In many universities where student evaluations of
classroom teaching are the primary method of teaching capability assessment for instructors, the negative student perceptions of an IC and the subsequent decrease in evaluation scores could put the performance assessment of an instructor in serious jeopardy.
3. METHOD The course for this study was an undergraduate level Introduction to Information Systems course. This course was the core IS course for all business administration majors at a university in the southeastern United States. The same instructor
taught the course each semester, and the same course material (text and content) was used
across a three year period. The traditional model of the course delivered prior to the T1 survey administration (n=92) consisted of lecture only to deliver the course content. Daily accountability
included multiple-choice daily quizzes covering material from the prior lecture, randomly administered throughout the course, and attendance accounting for 10% of the overall grade. A hands-on project using Microsoft Excel and a final exam completed the graded content of the course. The IC model of the course delivered
in semesters T2 (n=53) and T3 (n=52) consisted of in-class mini-case discussions on the topics that were lectured on video. Prior to the class discussion, students were to watch the videos and
submit “daily questions” where they constructed practice exam questions based on the material that they learned. These daily questions were
graded on a 3 point scale, with those that scored in the highest category put into a question pool to be used during the midterm and final exams. Knowing that their questions could potentially be on the exam meant that the students offered thoughtful questions without making the
questions excessively difficult. Attendance was counted as 10% of the overall grade in the course
to ensure that students attended the in-class
sessions and did not simply submit their daily questions and skip the class discussions with no penalty. A hands-on project using Microsoft Excel
completed the graded content of the course. The students who took the course were between 20 and 23 years of age and of equal gender proportions in each survey period. Anonymous end of course surveys submitted by the students were used to collect the data. The
survey instrument used in T1, the traditional lecture presentation of the course, is presented in the Appendix. The items in this instrument are a subset of the SEEQ (Students’ Evaluations of Educational Quality), an instrument used to obtain student feedback on teaching quality and
effectiveness (H. W. Marsh, 1982). Statistical tests on the instrument repeated over 13 years have shown that SEEQ is both valid and reliable (H. Marsh & Hocevar, 1991; H. Marsh & Roche, 1997). The survey instrument questions used in T2 and T3, the flipped classroom semesters are presented in the Appendix and are adapted from
the University of California Berkeley student course evaluation instrument (Stark & Freishtat, 2014). This change was prompted by the instructor’s college administration group and the decision to change instrument items. The analytical challenge associated with the change in the format of the survey instrument between
semesters T1 and T2 is addressed in the next section of this article.
For each semester when data were collected, student responses from multiple sections taught by the same instructor were aggregated. In
semester T1, n = 92 students enrolled in four sections, and the primary course pedagogical method was in-class lecture. In T2, the semester directly following the pilot semester, n = 53 students enrolled in two sections, and the primary course pedagogical method was the flipped classroom. In semester T3, n = 52 students
enrolled in two sections, and the primary method remained the flipped classroom. The semester T3 surveys were administered three semesters after semester T2. Doing so allowed for further
qualitative observation when the pedagogy had been deployed by the instructor in this course setting several times.
4. RESULTS AND ANALYSIS
The semester T1 student evaluation survey instrument used five questions that were designed to measure teacher effectiveness and
three questions to measure course quality. The instrument changed between semesters T1 and T2
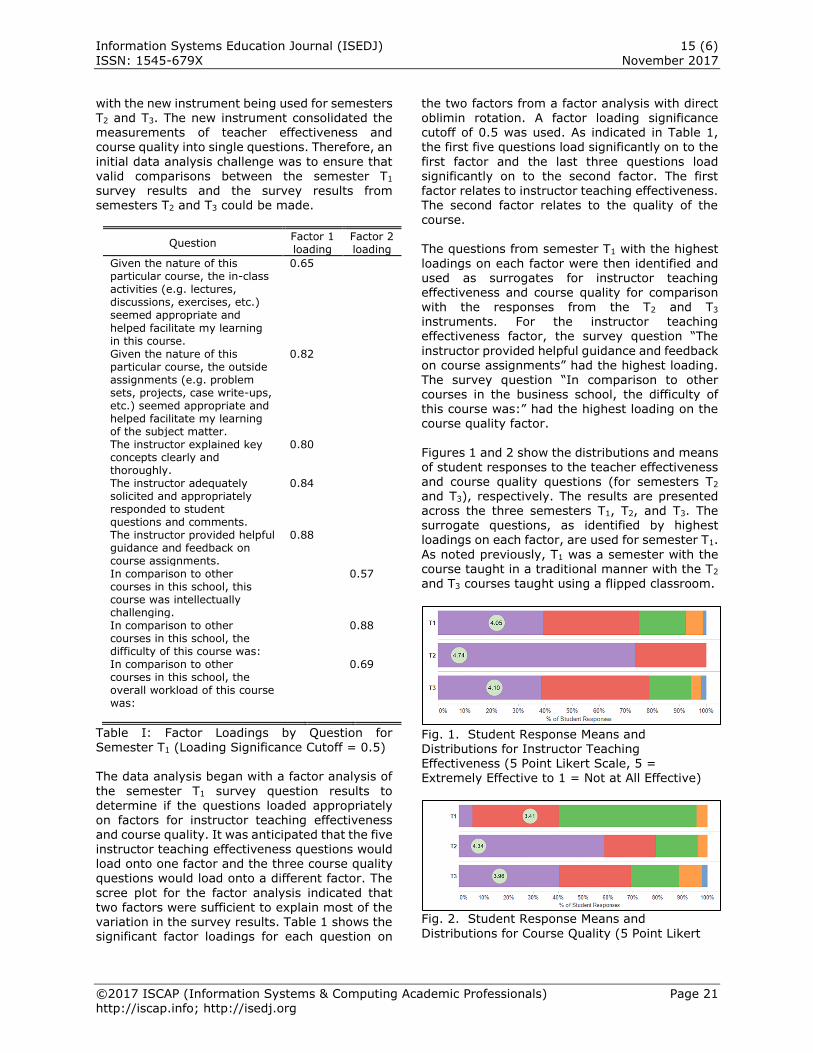
Information Systems Education Journal (ISEDJ) 15 (6)
ISSN: 1545-679X November 2017
©2017 ISCAP (Information Systems & Computing Academic Professionals) Page 21 http://iscap.info; http://isedj.org
with the new instrument being used for semesters
T2 and T3. The new instrument consolidated the measurements of teacher effectiveness and course quality into single questions. Therefore, an
initial data analysis challenge was to ensure that valid comparisons between the semester T1 survey results and the survey results from semesters T2 and T3 could be made.
Question Factor 1 loading
Factor 2 loading
Given the nature of this particular course, the in-class activities (e.g. lectures, discussions, exercises, etc.) seemed appropriate and
helped facilitate my learning in this course.
0.65
Given the nature of this particular course, the outside assignments (e.g. problem sets, projects, case write-ups, etc.) seemed appropriate and helped facilitate my learning of the subject matter.
0.82
The instructor explained key concepts clearly and thoroughly.
0.80
The instructor adequately solicited and appropriately responded to student questions and comments.
0.84
The instructor provided helpful guidance and feedback on course assignments.
0.88
In comparison to other courses in this school, this course was intellectually challenging.
0.57
In comparison to other courses in this school, the difficulty of this course was:
0.88
In comparison to other courses in this school, the overall workload of this course was:
0.69
Table I: Factor Loadings by Question for Semester T1 (Loading Significance Cutoff = 0.5) The data analysis began with a factor analysis of
the semester T1 survey question results to
determine if the questions loaded appropriately on factors for instructor teaching effectiveness and course quality. It was anticipated that the five instructor teaching effectiveness questions would load onto one factor and the three course quality questions would load onto a different factor. The
scree plot for the factor analysis indicated that two factors were sufficient to explain most of the variation in the survey results. Table 1 shows the significant factor loadings for each question on
the two factors from a factor analysis with direct
oblimin rotation. A factor loading significance cutoff of 0.5 was used. As indicated in Table 1, the first five questions load significantly on to the
first factor and the last three questions load significantly on to the second factor. The first factor relates to instructor teaching effectiveness. The second factor relates to the quality of the course. The questions from semester T1 with the highest
loadings on each factor were then identified and used as surrogates for instructor teaching effectiveness and course quality for comparison with the responses from the T2 and T3 instruments. For the instructor teaching effectiveness factor, the survey question “The
instructor provided helpful guidance and feedback on course assignments” had the highest loading. The survey question “In comparison to other courses in the business school, the difficulty of this course was:” had the highest loading on the course quality factor.
Figures 1 and 2 show the distributions and means of student responses to the teacher effectiveness and course quality questions (for semesters T2 and T3), respectively. The results are presented across the three semesters T1, T2, and T3. The surrogate questions, as identified by highest loadings on each factor, are used for semester T1.
As noted previously, T1 was a semester with the course taught in a traditional manner with the T2
and T3 courses taught using a flipped classroom.
Fig. 1. Student Response Means and Distributions for Instructor Teaching Effectiveness (5 Point Likert Scale, 5 = Extremely Effective to 1 = Not at All Effective)
Fig. 2. Student Response Means and
Distributions for Course Quality (5 Point Likert
Information Systems Education Journal (ISEDJ) 15 (6)
ISSN: 1545-679X November 2017
©2017 ISCAP (Information Systems & Computing Academic Professionals) Page 22 http://iscap.info; http://isedj.org
Scale, 5 = Extremely Worthwhile to 1 = Not at
All Worthwhile) The means and distributions of student survey
responses in Fig. 1 and 2 clearly change from T1 to T2 and from T2 to T3. For the instructor teaching effectiveness measure, nearly 80% of the responses in T1 were positive (Strongly Agree (5) or Agree (4)). Less than 10% of responses were negative (Disagree (2) or Strongly Disagree (1)). In T2, 100% of the responses were positive. The
proportion of positive responses returned to nearly 80% in T3 with negative responses accounting for less 10% of all responses. For the course quality measure, the number of positive responses increased from approximately 40% of responses to nearly 80% of responses from T1 to
T2. Negative responses for these two periods remained below 5%. There was a drop-off in positive responses from T2 to T3, to approximately 70%; however, the drop-off was not nearly as severe as that experienced for the teaching effectiveness measure. Negative responses increased to slightly more than 10%.
Question T1 vs. T2 T1 vs. T3 T2 vs. T3
Teacher Effectiveness
Yes (p<0.01)
No (p=0.47)
Yes (p<0.01)
Course Quality Yes (p<0.01)
Yes (p<0.01)
No (p=0.32)
TABLE II: Summary of Fisher’s Exact Tests (“Yes” indicates significant difference)
Fisher’s Exact Test (Agresti, 1992) was used to
compare the distributions of student responses for instructor teaching effectiveness and course quality questions across semesters T1, T2, and T3. The questions from T1 with the greatest factor loadings for each factor were used as described above. Table 2 shows the results of Fisher’s Exact Test. All tested pairings of semesters were found
to be significant with the exception of T1 and T3 for teacher effectiveness and T2 and T3 for course quality. To test robustness, Fisher’s Exact Test was re-run with each question from T1 that significantly loaded (loading above significance
cutoff of 0.5) on each factor substituted for the
questions with the best loading. This test of robustness produced results that aligned with those displayed in Table 2.
5. DISCUSSION
The survey results show that engaging students
in a flipped classroom initially improved the students’ perception of course quality. The course
experience was perhaps no longer merely a
matter of memorizing information and regurgitating it for a course grade; now the student became intentionally engaged in the
material as successful participation in the learning activities necessitated it. Students begin to interact with the material and might see it as more relevant to their personal learning. Thus, as long as the active learning exercises of interest to students are presented and the students participate, this level of student engagement with
the material will occur and lessen student resistance to the IC environment. As with the student perceptions of course quality, an initial improvement in perceptions of teaching effectiveness was followed by a drop-off from
semester T2 to semester T3. Whereas the nature of the personalized engagement in a flipped classroom lends itself to changing student perceptions of how worthwhile a course is, the preparation and approach with which the instructor facilitates the flipped classroom can have an effect on student perceptions in either a
positive or negative direction. In this research at T2, more attention was paid to the details of creating the flipped classroom/active learning environment, and student evaluations of the instructor went up over the lecture delivery method. At T3, when the student evaluation scores of the instructor were equivalent to T1 (and
lower than at T2), the instructor, having taught the material with the IC approach multiple times
at this point, did not dedicate sufficient attention to getting the course environment correct. The student perceptions of the teacher’s effectiveness reflect that the IC can be an improvement over
the traditional lecture delivery method. It might take several semesters of preparing an IC to have it become as second nature as the lecture method is for that instructor. Although this might lead to an instructor’s hesitance to adopt a flipped classroom, sufficient awareness of this effect would likely lessen its probability of occurring.
The results show that introducing a flipped classroom approach into an introductory, non-major course can be beneficial in terms of student
perceptions of the course and of the instructor.
6. FUTURE RESEARCH
Future research involves more investigation from the higher education administrator’s stakeholder viewpoint. Most of the current research from this stakeholder perspective has been conducted in the K-12 educational setting, leaving a gap in
research focused on higher education specifically. The administrator perspective and any movement
Information Systems Education Journal (ISEDJ) 15 (6)
ISSN: 1545-679X November 2017
©2017 ISCAP (Information Systems & Computing Academic Professionals) Page 23 http://iscap.info; http://isedj.org
that exists to support ICs becomes paramount to
any individual instructor’s success with the approach. There also needs to be support for the IC in the organizational culture for pedagogical
change to be effective. Otherwise, students will find the courses of the lone flipped classroom instructor jarring and potentially force the instructor to engage in the inevitable discussion about why he or she is the “only one” who “forces” students to learn this way. Answering questions about how implementation of this
pedagogical model will impact the number of majors in the discipline or enrollment impacts on student-teacher ratios and teaching efficiency will provide administrators with additional data with which they can decide the level of support for ICs and active learning that their learning
environment might support currently or in the future. Continuing work investigates the adoption of the flipped classroom approach as a matter of “technology adoption” among faculty, as the challenges and benefits to adopting the model
and its heavy dependence on technology are similar to those faced by users deciding whether or not to adopt a new technology for their work. Morris (2013) found in his study of flipped classroom adoption in higher education that administrators needed to address the following roadblocks: culture change; time needed to
implement the change; buy-in at the community and executive level; technology challenges;
professional development needs and student perceptions. These mirror the challenges faced by executives when trying to get their employees to adopt new technologies in the workplace. By
applying the UTAUT model (Venkatesh, Morris, Davis, & Davis, 2003) to investigate motivations behind adoption, researchers can look to get closer to understanding what factors can be used to encourage adoption of the flipped classroom model. The factors that influence behavioral intention to use the model and use behavior are
explained by four factors: performance expectancy; effort expectancy; social influence and facilitating conditions. Morris’ (2013) findings of reasons for adoption or planned adoption of
flipped classroom models can be mapped to one of the four factors in the UTAUT model, and subsequently analyze additional data to
determine if the model is supported in this context. This will provide further insight into the administrator’s stakeholder view and potential actions an administrator could take to encourage the adoption of active learning technologies in his or her institutions.
7. CONCLUSION
The results of this quantitative study demonstrate that implementing the flipped classroom
approach can positively impact student perceptions of course quality and teacher effectiveness. Ultimately, IC implementation can have a positive impact on course enrollments and increase interest in information systems among potential majors. Identifying the challenges and practices necessary to overcome those challenges
helps encourage all higher education stakeholders, including students, instructors and administrators, to adopt this pedagogical approach.
8. REFERENCES
Agresti, A. (1992). A survey of exact inference for
contingency tables. Statistical Science, 131–153.
Akerlind, G. S., & Trevitt, A. C. (1999). Enhancing Self-Directed Learning through Educational Technology: When Students Resist the
Change. Innovations in Education and Training International, 36(2), 96–105.
Alavi, M., Marakas, G. M., & Yoo, Y. (2002). A comparative study of distributed learning environments on learning outcomes. Information Systems Research, 13(4), 404–415.
Anderson, L. W., Krathwohl, D. R., Airasian, P. W., Cruikshank, K. A., Mayer, R. E., Pintrich, P. R., … Wittrock, M. C. (2001). A taxonomy for learning, teaching, and assessing: A revision of Bloom’s taxonomy of educational objectives, abridged edition. White Plains,
NY: Longman.
Arbaugh, J., & Benbunan-Finch, R. (2006). An investigation of epistemological and social dimensions of teaching in online learning environments. Academy of Management Learning & Education, 5(4), 435–447.
Berrett, D. (2012). How “flipping” the classroom
can improve the traditional lecture. The Chronicle of Higher Education, 12, 1–14.
Cheung, W., & Huang, W. (2005). Proposing a framework to assess Internet usage in university education: an empirical investigation from a student’s perspective. British Journal of Educational Technology,
36(2), 237–253.
Christensen Hughes, J., & Mighty, J. (2010). A Call to Action: Barriers to Pedagogical Innovation and How to Overcome Them. In J.
Information Systems Education Journal (ISEDJ) 15 (6)
ISSN: 1545-679X November 2017
©2017 ISCAP (Information Systems & Computing Academic Professionals) Page 24 http://iscap.info; http://isedj.org
Christensen Hughes & J. Mighty (Eds.),
Taking stock: Research on teaching and learning in higher education (pp. 261–277). Kingston, ON: The School of Policy Studies,
Queen’s University.
Cooper, J. L., MacGregor, J., Smith, K. A., & Robinson, P. (2000). Implementing Small‐Group Instruction: Insights from Successful Practitioners. New Directions for Teaching and Learning, 2000(81), 63–76.
Cuban, L. (1993). Computers meet classroom:
Classroom wins. Teachers College Record, 95(2), 185.
Ellis, D. E. (2015). What Discourages Students from Engaging with Innovative Instructional
Methods: Creating a Barrier Framework. Innovative Higher Education, 40(2), 111–125.
Felder, R. M., & Brent, R. (1996). Navigating the bumpy road to student-centered instruction. College Teaching, 44(2), 43–47.
Findlay-Thompson, S., & Mombourquette, P. (2014). Evaluation of a flipped classroom in an undergraduate business course. Business
Education & Accreditation, 6(1), 63–71.
Froyd, J. E., Borrego, M., Cutler, S., Henderson, C., & Prince, M. J. (2013). Estimates of use of research-based instructional strategies in core electrical or computer engineering
courses. IEEE Transactions on Education, 56(4), 393–399.
Gormally, C., Brickman, P., Hallar, B., & Armstrong, N. (2011). Lessons learned about implementing an inquiry-based curriculum in a college biology laboratory classroom. Journal of College Science Teaching, 40(3), 45–51.
Granger, M. J., Dick, G., Luftman, J., Van Slyke,
C., & Watson, R. T. (2007). Information systems enrollments: Can they be increased? Communications of the Association for Information Systems, 20(1), 41.
Henderson, C., & Dancy, M. H. (2007). Barriers to the use of research-based instructional
strategies: The influence of both individual and situational characteristics. Physical Review Special Topics-Physics Education Research, 3(2), 20102.
Herreid, C. F., & Schiller, N. A. (2013). Case studies and the flipped classroom. Journal of College Science Teaching, 42(5), 62–66.
Kearney, P., & Plax, T. G. (1992). Student resistance to control. In V. P. Richmond & J.
C. McCroskey (Eds.), Power in the Classroom:
Communication, Control, and Concern (pp. 85–100). Hillsdale, NJ: Lawrence Erlbaum Associates, Inc.
Keeney-Kennicutt, W., Gunersel, A. B., & Simpson, N. (2008). Overcoming Student Resistance to a Teaching Innovation. International Journal for the Scholarship of Teaching and Learning, 2(1), Article 5.
King, A. (1993). From sage on the stage to guide on the side. College Teaching, 41(1), 30–35.
Koch, H., Van Slyke, C., Watson, R., Wells, J., & Wilson, R. (2010). Best practices for increasing IS enrollment: a program perspective. Communications of the
Association for Information Systems, 26(1), 22.
Lage, M. J., Platt, G. J., & Treglia, M. (2000). Inverting the Classroom: A Gateway to Creating an Inclusive Learning Environment. The Journal of Economic Education, 31(1), 30–43.
Lee, M. K. O., Cheung, C. M. K., & Chen, Z. (2005). Acceptance of Internet-based
learning medium: the role of extrinsic and intrinsic motivation. Information & Management, 42(8), 1095–1104.
Marsh, H., & Hocevar, D. (1991). Students’ evaluations of teaching effectiveness: The
stability of mean ratings of the same teachers over a 13-year period. Teaching and Teacher
Education, 7, 303–314.
Marsh, H., & Roche, L. (1997). Making students’ evaluations of teaching effectiveness effective: The critical issues of validity, bias, and utility. American Psychologist, 52(11), 1187–1197.
Marsh, H. W. (1982). SEEQ: A Reliable, Valid and Useful Instrument for Collecting Students’ Evaluations of University Teaching. British Journal of Educational Psychology, 52(1), 77–95.
Mason, G. S., Shuman, T. R., & Cook, K. E. (2013). Comparing the Effectiveness of an
Inverted Classroom to a Traditional Classroom in an Upper-Division Engineering Course. IEEE Transactions on Education, 56(4), 430–435.
McLaughlin, J. E., Roth, M. T., Glatt, D. M., Gharkholonarehe, N., Davidson, C. A., Griffin, L. M., … Mumper, R. J. (2014). The Flipped
Classroom: A Course Redesign to Foster Learning and Engagement in a Health
Information Systems Education Journal (ISEDJ) 15 (6)
ISSN: 1545-679X November 2017
©2017 ISCAP (Information Systems & Computing Academic Professionals) Page 25 http://iscap.info; http://isedj.org
Professions School. Academic Medicine,
89(2), 236–243.
Missildine, K., Fountain, R., Summers, L., & Gosselin, K. (2013). Flipping the classroom to
improve student performance and satisfaction. Journal of Nursing Education, 52(10), 597–599.
Mok, H. N. (2014). Teaching Tip: The Flipped Classroom. Journal of Information Systems Education, 25(1), 7–11.
Morris, J. (2013). The Up Side of Upside Down:
Results From First National Survey on Faculty Perspectives on Flipped Classrooms. Washington, DC: Center for Digital Education.
Pepper, C. (2010). “There’s a lot of learning going
on but NOT much teaching!’: student perceptions of Problem‐Based Learning in
science. Higher Education Research &
Development, 29(6), 693–707.
Prince, M., Borrego, M., Henderson, C., Cutler, S., & Froyd, J. (2013). Use of research-based instructional strategies in core chemical engineering courses. Chemical Engineering Education, 47(1), 27–37.
Reimann, N. (2011). To risk or not to risk it: student (non‐)engagement with seen
examination questions. Assessment & Evaluation in Higher Education, 36(3), 263–279.
Rutherfoord, R. H., & Rutherfoord, J. K. (2013). Flipping the classroom: is it for you? (p. 19). ACM Press.
Santhanam, R., Sasidharan, S., & Webster, J. (2008). Using self-regulatory learning to enhance e-learning-based information technology training. Information Systems Research, 19(1), 26–47.
Silverthorn, D. U. (2006). Teaching and learning
in the interactive classroom. Advances in Physiology Education, 30(4), 135–140.
Smith, H., Cooper, A., & Lancaster, L. (2002).
Improving the quality of undergraduate peer assessment: A case for student and staff development. Innovations in Education and
Teaching International, 39(1), 71–81.
Stark, P., & Freishtat, R. (2014). An Evaluation of Course Evaluations: “F.” ScienceOpen Research.
Strayer, J. F. (2012). How Learning in an Inverted Classroom Influences Cooperation, Innovation and Task Orientation. Learning
Environments Research, 15(2), 171–193.
Tune, J. D., Sturek, M., & Basile, D. P. (2013). Flipped classroom model improves graduate student performance in cardiovascular,
respiratory, and renal physiology. AJP: Advances in Physiology Education, 37(4),
316–320.
Urbaczewski, A. (2013). Flipping the Classroom and Problem Solving Techniques - Observations and Lessons Learned. Presented at the Annual Conference of the AIS Special Interest Group in Education Research, Milan, Italy: Association for
Information Systems.
Venkatesh, V., Morris, M. G., Davis, G. B., & Davis, F. D. (2003). User Acceptance of Information Technology: Toward a Unified View. MIS Quarterly, 27(3), 425–478.
Vuorela, M., & Nummenmaa, L. (2004). How undergraduate students meet a new learning
environment? Computers in Human Behavior, 20(6), 763–777.
Walvoord, B. E., & Anderson, V. J. (2011). Effective grading: A tool for learning and assessment in college. John Wiley & Sons.
Wilson, S. G. (2013). The Flipped Class: A Method
to Address the Challenges of an Undergraduate Statistics Course. Teaching of Psychology, 40(3), 193–199.
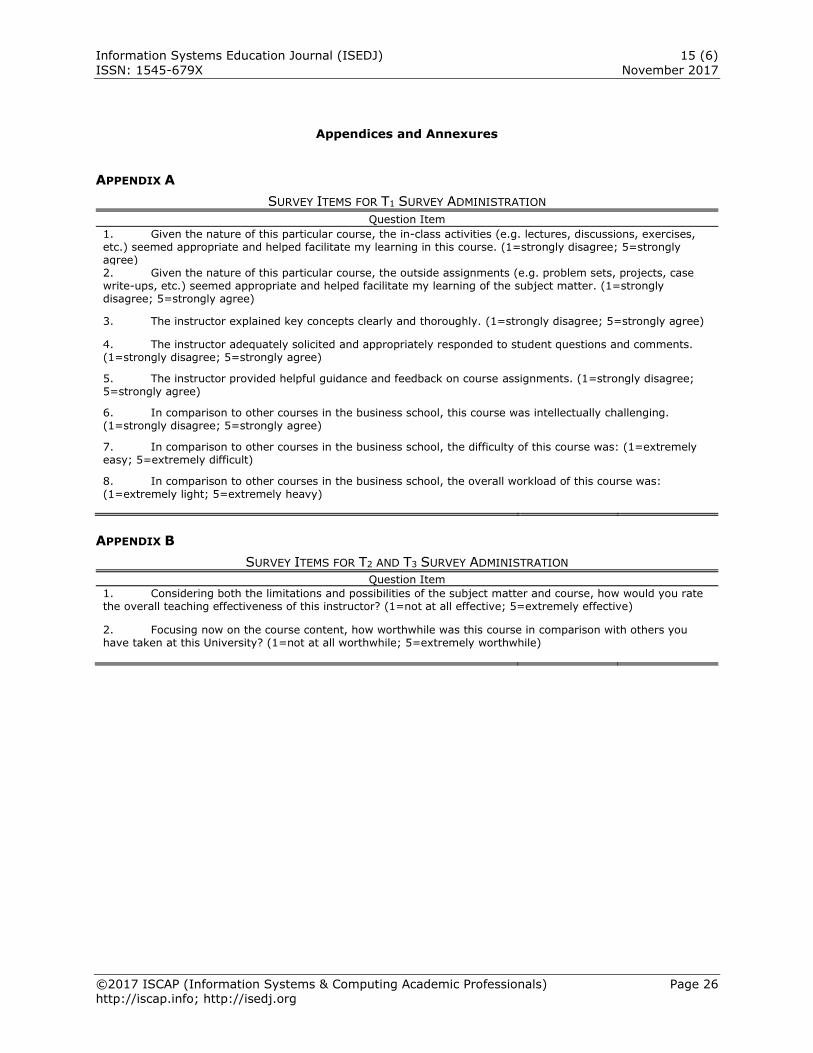
Information Systems Education Journal (ISEDJ) 15 (6)
ISSN: 1545-679X November 2017
©2017 ISCAP (Information Systems & Computing Academic Professionals) Page 26 http://iscap.info; http://isedj.org
Appendices and Annexures
APPENDIX A
SURVEY ITEMS FOR T1 SURVEY ADMINISTRATION
Question Item
1. Given the nature of this particular course, the in-class activities (e.g. lectures, discussions, exercises, etc.) seemed appropriate and helped facilitate my learning in this course. (1=strongly disagree; 5=strongly agree) 2. Given the nature of this particular course, the outside assignments (e.g. problem sets, projects, case write-ups, etc.) seemed appropriate and helped facilitate my learning of the subject matter. (1=strongly disagree; 5=strongly agree)
3. The instructor explained key concepts clearly and thoroughly. (1=strongly disagree; 5=strongly agree)
4. The instructor adequately solicited and appropriately responded to student questions and comments. (1=strongly disagree; 5=strongly agree)
5. The instructor provided helpful guidance and feedback on course assignments. (1=strongly disagree; 5=strongly agree)
6. In comparison to other courses in the business school, this course was intellectually challenging. (1=strongly disagree; 5=strongly agree)
7. In comparison to other courses in the business school, the difficulty of this course was: (1=extremely easy; 5=extremely difficult)
8. In comparison to other courses in the business school, the overall workload of this course was: (1=extremely light; 5=extremely heavy)
APPENDIX B
SURVEY ITEMS FOR T2 AND T3 SURVEY ADMINISTRATION
Question Item
1. Considering both the limitations and possibilities of the subject matter and course, how would you rate the overall teaching effectiveness of this instructor? (1=not at all effective; 5=extremely effective)
2. Focusing now on the course content, how worthwhile was this course in comparison with others you have taken at this University? (1=not at all worthwhile; 5=extremely worthwhile)
Information Systems Education Journal (ISEDJ) 15 (6)
ISSN: 1545-679X November 2017
©2017 ISCAP (Information Systems & Computing Academic Professionals) Page 27 http://iscap.info; http://isedj.org
Raising the Bar: Challenging Students in a
Capstone Project Course With an Android and Mobile Web Parallel Development Team Project
Wilson Wong [email protected]
Computer Science Department Worcester Polytechnic Institute
Worcester, MA 01609, USA
James Pepe
Irv Englander [email protected]
Computer Information Systems Department
Bentley University Waltham, MA 02452, USA
Abstract
Information systems capstone projects aim to prepare students for what they will encounter in the industry after graduation. Corporate application development is often a complex endeavor that requires coordination between related products. For example, software development in the mobile application sector may require a coordinated parallel development of native cellphone applications and mobile web applications. The dual approach taken by these companies enable end users to access the application over a wide variety of devices and operating systems. Instructors usually must choose between a mobile
web development environment and a native development environment such as Android or iPhone. In order to provide students with a learning experience that incorporates additional complexities of the real world, a challenging capstone course project is presented that requires a large team to implement the same application in both environments. This course was implemented in a single semester at Bentley University in the spring of 2015. Student teams created pub crawl applications based on stops within a local mass transit system that would run both on an Android phone and on a mobile website. Java,
Eclipse and Google’s Android SDK were used to create the Android component. JQuery, HTML5, PHP and
JavaScript constituted the development environment used to create the mobile web component. The project management and coordination of the two development environments within a single team resulted in unexpected challenges. Factors leading to varying degrees of successful completion of the team capstone projects are presented along with lessons learned. Keywords: capstone course, software project management, mobile application development, Android, mobile web, team structure
Information Systems Education Journal (ISEDJ) 15 (6)
ISSN: 1545-679X November 2017
©2017 ISCAP (Information Systems & Computing Academic Professionals) Page 28 http://iscap.info; http://isedj.org
1. INTRODUCTION The purpose of the software project management capstone course, CS460, at Bentley University is
to give seniors experience in team management and complex team application development. In many companies, application development is often an endeavor that not only requires the coordination of members within a team, but also the coordination among sub-teams where each sub-team is responsible for one or more
components of the application. Our capstone project was devised to better prepare graduating Computer Information Systems seniors to work in these complex team environments. Student
teams were required to create an application that would generate a pub-crawl, i.e. a walking tour of
bars and restaurants centered on a user-selected local mass transit stop in the Boston subway system. To mirror the application development environment of many software companies, each student team had to develop an Android version and a mobile web version in parallel throughout the semester. A further area of complexity
involved the creation of the back-end SQL database that both versions would access. This project satisfied the objective of a capstone course by challenging student teams to apply their knowledge gained from a wide range of prior computer courses – Java, Android, web, and databases – to the management and
development of a significant software application. Project management concepts are included as part of the course material and applied in the software development process. Our capstone model of Android and mobile web
parallel development arose from similar offerings in previous semesters that involved only a single mobile development environment. For the past five years, the fall version of the course had students developing mobile web applications and the spring version of the course had students developing Android applications. The reason for
the dichotomy was that during the fall, most students would not have yet taken the Android course. After teaching successful versions of both
types of capstone courses, a challenging, combined Android and mobile web course was delivered in the spring of 2015.
2. RELATED WORK Many IS/IT programs offer a project capstone course as a means of integrating the program material from previous courses into a coherent team project effort (Heshemi & Kellersberger,
2009; Leidig & Lange, 2012; Mew, 2014; Reinicke, 2011; Reinicke, Janicki, & Gebauer, 2012; Schwieger & Surendran, 2010; Shih, LeClair, & Varden, 2010; Tappert, Cotoranu, &
Monaco, 2015). Many of these capstone courses include substantial projects that involve the creation of web-based applications (Abrahams, 2010; Maloni, Dembla, & Swaim, 2012; Stillman & Peslak, 2009; Tappert, et al., 2015; Umapathy & Wallace, 2010) or mobile applications (Matos, Grasser, & Blake, 2008; Payne, Zlatkov, Jernigan,
& Scarbrough, 2009; Tappert, et al., 2015). Generally, these projects are purposefully limited in scope due to course time constraints, the technical background of the students, and the
number of students on a team. The current CS460 model is much broader in scope than the typical
project course described previously. The CS460 course project is intentionally ill-defined, requires significant requirements gathering, is organized into large teams, assumes significant student team and workload management, and requires the team presentation of a working model on both a mobile web and an Android platform at the end
of the semester. The stated goal is to more closely simulate the real-world operations that a student can expect to face in the workplace.
3. BACKGROUND At Bentley University, Computer Information
Systems majors must fulfill a combination of business requirements and departmental requirements. In addition to nine business core courses, CIS majors take two database courses, and one course each in Java, system analysis and design, as well as an introduction to operating
systems and networking. CIS majors may take, as electives, additional software programming courses such as web development, advanced Java programming, Android development, and network programming. CS460 Applied Software Project Management is the elective capstone course that students concentrating in software
development take where they synthesize knowledge learned in their previous CIS courses towards the creation of a software application.
CS460 was previously a required capstone course; however, it was subsequently made an elective to accommodate CIS students concentrating in areas other than software
development, such as software security or systems administration. The CS460 course topics include software development life cycle concepts, Agile methodologies, software project management, team dynamics, risk management, software size estimation, and quality assurance.
Information Systems Education Journal (ISEDJ) 15 (6)
ISSN: 1545-679X November 2017
©2017 ISCAP (Information Systems & Computing Academic Professionals) Page 29 http://iscap.info; http://isedj.org
In previous semesters, student teams have applied software development methodologies to create applications for real world clients such as hospitals and other non-profit organizations.
Examples have included applications to aid in coordinating online language lessons for Afghani citizens given by English speakers in other countries, assign hospital beds to patients, and provide destination paths for medical clinic visitors. Having teams produce software for the general public, as is described in this paper,
provides students with an increased challenge with respect to requirements gathering and incorporating user feedback throughout the development process. Applications for the general
public that student teams created in the past have included programs that guide end users
along a city walking tour, help end users avoid or reduce speeding ticket amounts, and direct students to their final room destinations in a university. We particularly note that each of these applications was designed by its team for use on a single, specific platform.
4. PARALLEL DEVELOPMENT MODEL To enrich the team management and development experience, the course project component was expanded to include a parallel development model, in which each team would be responsible for the development of a single
application that would operate on multiple platforms. This would simulate the sub-team experience of real-world project development. The instructor employed a skills matrix in forming the teams, based on a student CIS background
survey distributed in the first class. To facilitate the parallel development model, team sizes were increased to accommodate the significantly larger project scope that had to be delivered within a single semester. Teams were chosen to reflect a balance of experience in Android development, web development, and project management.
Most students had already taken two semesters of database courses and the remaining students were taking the second database course in
conjunction with CS460. As a result, the students with weaker software development backgrounds worked on a database development sub-team. Two balanced teams with the requisite web,
Android, and database experience were formed with eight students each. The eight person teams also offered students experience with the larger teams that are characteristic of many real world business projects, an experience that is rarely made available to students.
5. COURSE DELIVERY A major challenge is to incorporate both course material and team project development into a
single semester. For our course, this challenge was compounded by the additional requirements imposed by parallel multi-platform development. Course components consisted of lectures, software project management practicums, midterm and final exams, and a term project which required a midterm presentation, a final
presentation, student peer reviews, project management documentation, software design documentation, and a working application.
Software project management practicums were class sessions devoted to student teams applying
the concepts learned from earlier lectures to their software application development and team project management processes. Great care was taken to balance lectures with software project management practicums so students would have both the maximum amount of time to devote to developing the application and the necessary
knowledge in software project management to accomplish their goals efficiently and effectively. Two different approaches were initially considered: 1) present all of the lectures in the first half of the course and dedicate all of the remaining classes for teams to apply the concepts and create their applications and 2) alternate
lectures and the software project management practicums so students could apply a lecture’s material in the very next class. The first approach has the disadvantage of not giving teams enough time to design and create the application – only half a semester. The second approach introduces
a number of topics such as project scheduling or software sizing long after they are needed by the teams. As a result of these issues, a third approach was incorporated into the class. The first half of the course consists of approximately two-thirds of the lectures which includes the materials necessary for teams to get under way.
The teams present the results of their requirements gathering, software designs, and project management documents during midterm
presentations which are scheduled for the week after the midterm exam so students do not have conflicting goals. In the second half of the course, the remaining lectures such as quality assurance
and Agile methodologies are presented early enough so that the final exam can be given weeks before the final class session [see Appendix A] thereby freeing up students to concentrate on only application development towards the end of the semester. These final lectures are also timed
Information Systems Education Journal (ISEDJ) 15 (6)
ISSN: 1545-679X November 2017
©2017 ISCAP (Information Systems & Computing Academic Professionals) Page 30 http://iscap.info; http://isedj.org
to support the student teams who are just then starting their software development iterations. If quality assurance had been presented as one of the final lectures, then only a single iteration of
application development would have been possible. Consequently, this two-thirds/one-third approach successfully presents most of the material to the students prior to their needing it for their projects but maximizes the amount of development time that they have.
6. TEAM PROJECT DELIVERY A key component of Agile methodologies is that the team must be co-located so members work
together and engage in face-to-face communications (Beedle et al., 2001). Due to the
difficulties of coordinating the schedules of eight student team members, teams could not be expected to be primarily co-located, even online, nor could they be expected to hold daily meetings. Instead, a hybrid methodology, midway between Agile and traditional life cycle methodologies was adopted, an approach
suggested by Baird and Riggins (2012). This had the additional advantage of allowing students to focus on the value of various features within their applications, even given the time pressure exerted by the rapid Agile development cycle. Nonetheless, Agile methodology concepts are an important component of the course and many
aspects of Agile methodologies were mandated by the instructor. Teams would be self-organizing with respect to team member positions and would operate in regularly timed cycles with an exception for the architectural spike, i.e. the initial requirements gathering and creation of the
software designs. After the first six weeks that were allocated for the architectural spike, teams would develop iterations of the application in sprints of roughly two weeks each. The exam schedule, which overlapped the development cycles, prevented the sprints from being strictly time-boxed.
Once members were assigned to teams by the instructor, one of the initial tasks for teams was
to self-organize themselves, i.e. agreeing on which positions team members would hold, as recommended in Agile methodologies (Goodpasture, 2016). Teams were instructed to
use their own version of a skills matrix in making team position assignments. The positions that had to be filled were project manager, project lead analyst, and project analysts. Each team member other than the project manager would be assigned to the Android, web, or database
development sub-teams although assignment changes could be made as project needs would necessitate. Each software development area would appoint their own lead analyst to simplify
coordination and communications within the team. One of the project analysts would also be responsible for coordinating all quality assurance efforts, and another project analyst would be responsible for coordinating documentation. In effect, core application development is performed by the Android and mobile web sub-teams while
the other positions provide supporting roles. Project managers create weekly reports for the instructor who acts as the vice president of software development.
The mobile web development environment that
the student teams employed consisted of HTML5, JQuery and the WAMP stack. WAMP is an integrated PHP, MySQL, Apache web server environment running on Microsoft Windows. The selection of HTML5, the latest HTML standard, permitted teams to incorporate GPS location on mobile devices if their chosen software features
required the technology. The corresponding Android development environment consisted of the Java SDK, Android SDK, Eclipse, and the Android Plugin for Eclipse. A MySQL database was used as the back-end for both development platforms. Because students did not have experience with PHP, existing samples of the code
were provided. Students were able to successfully adapt the code to their projects because PHP’s syntax is similar to Java. In the first half of the semester, teams dedicated their time to determining software requirements
and then creating software designs for a minimal application that would be implemented in the first software development iteration. With projects that have a specified client, interviews and informal discussions are often conducted to generate a list of software requirements. Without given direction, student teams can flounder when
attempting to determine the software requirements of an application to be used by the general public. Project teams were instructed first
to gather software requirements through brainstorming sessions. In these sessions, team members were instructed to propose common features, as well as pie-in-the-sky features, free
from criticism. Once a substantial feature list was created, teams would prioritize features and remove those that would not be feasible within the timeframe of a semester project. In order to determine what features should be included in the application, teams would then distribute surveys
Information Systems Education Journal (ISEDJ) 15 (6)
ISSN: 1545-679X November 2017
©2017 ISCAP (Information Systems & Computing Academic Professionals) Page 31 http://iscap.info; http://isedj.org
of potential features to individuals matching the profile of possible end users. Armed with the survey results, teams would take their prioritized feature list and divide features into three
categories – features required for a minimal application, application features that most users would expect, and “delighters” - features that most users would not expect but would appreciate. If time permitted, teams would conduct interviews of representative end users together with observations of people actually
using their application, as each software version was completed. Because of students’ inexperience with software size estimations, it is critical that the instructor critique and adjust the
software requirements to be implemented in the software development cycles.
After the features for a minimal application were determined, the teams worked to create the software designs for their systems. These software designs – database entity relationship diagrams, context diagrams, UML diagrams and user interface mockups – were presented during
the midterm presentations and submitted with the final project deliverables. In the second half of the semester, after the midterm presentations were critiqued by the instructor, teams implemented the application over three sprints. In the first development
iteration, teams were to create a stripped down version of their application which would incorporate the first category of software requirements – those necessary for a minimal application. In the second iteration, teams would implement the next category of features – those
most expected in the application. The final application would contain at least one feature from the final category that would delight the audience / general public. It was a project requirement that application features would be implemented on both platforms, with the possible exception of the delighter feature.
This hybrid Agile approach with an architectural spike, an emphasis on good requirements
gathering, and three development iterations addresses a serious course concern – the possibility of teams failing to produce a viable application within a single semester. Rather than
designing the entire application before software implementation, teams initially create a much simpler design for a minimal application. This first software version can then be quickly implemented because most features are missing and the design is correspondingly cleaner. Once
the initial working version is created, teams are guaranteed a passing grade and the teams then implement remaining features in the subsequent iterations, applying lessons learned from the first
attempt. If teams are not successful in the first development iteration, they still have four weeks to meet, and hopefully exceed, the base requirement of a working application. So that students are not conflicted in their dedication to the software project at the end of the semester, the final exam is given after the first iteration is
completed. Students can then concentrate solely on the project during the second and final software development iterations.
7. COURSE OUTCOMES AND EVALUATIONS
There were significant differences between the two teams with respect to their team interactions and software development experiences. Team Beta began with a serious impediment to their effectiveness. They had chosen for their project lead analyst and Android lead analyst one of the weaker software developers. The more
experienced developers had been reluctant to take on the responsibility of coordinating the entire team. Although the instructor attempted to ameliorate the situation by stressing throughout the semester that it would benefit them to have a strong assistant lead analyst or a backup lead analyst, this advice was ignored. In comparison,
Team Alpha chose more appropriate leadership positions for their team members. Both teams progressed successfully through the architectural spike in the first half of the semester and created a list of software requirements,
software designs, and project management documents. In both teams, a single set of user interface diagrams were designed for the web and Android platforms. Correspondingly in the midterm peer evaluations, team members on both teams rated one another highly. The only notable issue seemed to be that both teams had
included far more features for the minimal application than necessary. The real challenge occurred in the second half of the semester when
the teams began to implement their application. Team Alpha – Implementation Iterations The leaders chosen for this team were
experienced and closely matched the expectations of the instructor. An additional position of user interface analyst was created by the team to coordinate the UI of both the web and Android applications.
Information Systems Education Journal (ISEDJ) 15 (6)
ISSN: 1545-679X November 2017
©2017 ISCAP (Information Systems & Computing Academic Professionals) Page 32 http://iscap.info; http://isedj.org
The first development iteration was successfully completed on time despite initially encountering problems with connecting to the MySQL database. During the second development iteration, the
project manager became unavailable as a result of unexpected personal issues. Fortunately, the project lead analyst was able to temporarily take over those responsibilities along with coordinating team development and serving as the Android lead analyst. The team was successful in completing the second development iteration on
time despite different programming problems in the two platform development sub-teams. The Android sub-team encountered problems with implementing a shortest path algorithm and the
web sub-team had difficulties with navigation. For their “delighter” feature, the Android team
implemented text-to-speech so potentially inebriated end users would not have to read their cellphones to follow directions to their destinations. The Android, web, and database sub-teams all performed well and met their goals. The user interface analyst was especially
successful in creating a unified look while permitting appropriate modifications for each development platform. The user interface analyst accomplished the unified look through constant communications with both the Android and web sub-teams. Although in the web application, the pub crawl screen displays both the map and the
list of bars, the Android application displays the same information in two tabs because of the limited viewing area. Team Beta – Implementation Iterations The project lead analyst was expected to
coordinate the web and Android development teams while leading the development in one of the two platforms. The selection of an inexperienced developer as the project and Android lead analyst position had a major negative effect on the productivity and coordination of the entire team.
The web development sub-team initially encountered database connection issues that
necessitated using the second development iteration to complete the minimal application. When the web sub-team began to encounter additional problems without the support of the
project lead analyst, the project manager was added to the web sub-team. Although serious doubts were expressed about their ability to implement the web crawl feature, they were eventually successful in the final release of the application. After the addition of the project
manager, the web sub-team worked effectively not only to create the pub crawl application but also to include administrative features to facilitate population of the pub-crawl and subway stop
databases. The Android development sub-team had the same initial difficulties with the database connection; this was resolved by the end of the first development iteration. This sub-team encountered a steady stream of serious
programming errors that delayed the successful implementation of the application until the last development iteration. The members of the Android sub-team felt that their lead analyst was
disruptive during meetings and did not contribute working code. Even though the more senior
developers had avoided taking on the responsibility of Android lead analyst, they eventually had to do so anyway or risk an implementation failure. This was an important learning lesson for the entire team. In contrast, the database sub-team, which was led by an experienced database developer, worked
efficiently throughout the three iterations. As each problem surfaced, they would quickly address it and solve it. The assignment of the project manager to support the web development sub-team negatively affected the coordination between the
web and Android sub-teams. Although a single set of user interface diagrams had been created, the two sub-teams had worked mostly independently, with little communication between the two sides. As a result, the two user interfaces diverged widely in their implementation. The
differences between the web application and Android application can be seen in Appendix C. Despite the disruptions caused by poor software development leadership, the team eventually addressed their imbalances and produced working versions of both the web and Android applications. For the “delighter” feature, the
Android version included a link to Uber in the event that the end user is too intoxicated to return home using public transportation.
Course and Student Evaluations Of the thirteen semesters that the authors have taught this course, this course delivery – the first
that implemented the parallel design methodology – received the highest student rating ever: 5.75 out of 6 points. Moreover, students indicated a high level of satisfaction and gave ratings of 5.7 or 5.8 out of 6 points in every category on the course evaluations. In
Information Systems Education Journal (ISEDJ) 15 (6)
ISSN: 1545-679X November 2017
©2017 ISCAP (Information Systems & Computing Academic Professionals) Page 33 http://iscap.info; http://isedj.org
comparison, the average rating for the course given in the previous twelve semesters was 5.32. Improvement in student comprehension of the course concepts was reflected in the increased
exam scores. In the previous semesters of this course, midterm exam grades averaged 81.4 and final exam grades averaged 81.1 out of 100 points. Students participating in the parallel development project in spring 2015 scored noticeably higher - an average of 89.0 for the midterm exam, and 86.9 for the final exam.
Furthermore, the project management and software design documentation that both teams submitted were of high quality and demonstrated a strong understanding of the course concepts.
Students stated that the course project gave them “insight about the real world” and “the
ability to apply all of our CS knowledge in order to create an application was super cool.”
8. CONCLUSIONS
In many basic respects, the capstone project, as newly defined, resembles its simpler earlier
project counterpart. Like the simpler projects executed in previous versions of the course, students had to navigate through the definition, requirements, design, and implementation of an ill-defined system. The addition of the parallel implementation
1. required the students to organize and manage their teams and sub-teams much more carefully through the use of skills matrices and sub-team leaders.
2. allowed us to introduce more formal software
project management methodologies.
3. forced the teams to consider complicating factors, such as user interfaces, the differences in implementation methods, the available services on different platforms, and the like more carefully.
Overall, this led conspicuously to a much deeper understanding of project management and
development processes by the students. At the same time, we share some valuable lessons that we gained from managing the team experience:
1. Selection of the proper team leaders, especially the project lead analyst and project manager, is critical to the efficiency and smooth workings of the team. There should be individuals assigned to be the backup project lead analyst and backup project
manager in the event the leaders become unavailable, cannot perform their responsibilities adequately, or are otherwise inappropriate for the position. Student teams
can be encouraged to make better position assignments by having them justify their decisions with the skills matrices they create. Instructors can then compare their own skill set listings and expected position assignments for the team with what is submitted by the students.
2. When developing for more than one platform,
the selection of a person to coordinate the user interfaces is critical. Team Alpha’s
applications appear unified and coherent because they assigned such a position. In
contrast, Team Beta did not have such a person and the user interfaces diverged significantly from one another [see Appendix C].
3. Each development iteration had the two platforms implement the same features.
However, development hurdles appeared at different times and in different features between the two platforms. This made it additionally challenging to execute the multiple development iterations on schedule if one or the other development platform was delayed. In the future, although the final
features in the web and Android applications should be almost the same, the order of feature implementation in the two platforms should be decoupled from one another. This approach can also permit one platform to take advantage of information learned in the other
platform. For example, in the pub crawl applications, determining the shortest path to the next bar could be solved by the Android sub-team in the first development iteration. Rather than duplicating the work, the web sub-team can employ parts of that solution in the second development iteration. Plus,
student teams could also present some of the lessons they learned at the end of each iteration so that other teams can benefit from
their experiences.
4. Teams did not truly understand what was meant by a minimal, streamlined application.
Students misinterpreted minimal to include additional features beyond selecting a location and getting a list of bars. A recommendation is to list explicitly the minimal application’s software requirements.
Information Systems Education Journal (ISEDJ) 15 (6)
ISSN: 1545-679X November 2017
©2017 ISCAP (Information Systems & Computing Academic Professionals) Page 34 http://iscap.info; http://isedj.org
5. The requirements gathering phase proved to be an important and useful aspect of the project, as it helped to organize the teams and the shape of the application.
Despite the additional challenges of software development for two different platforms and the larger teams, the parallel project model that we implemented met and exceeded the goals of a complex team project that we set for the course, as evidenced by student course evaluations, exam grades, final project documentation, and
the project applications themselves.
9. REFERENCES
Abrahams, A. (2010). Creating e-Commerce
Start-ups with Information Systems Students: Lessons Learned from New Venture
Successes and Failures. Information Systems Education Journal, 8(35), 3-24.
Baird, A., & Riggins, F. J. (2012). Planning and Sprinting: Use of a Hybrid Project Management Methodology within a CIS Capstone Course. Journal of Information Systems Education, 23(3), 15.
Beedle, M., Bennekum, A. v., Cockburn, A., Cunningham, W., Fowler, M., Highsmith, J., et al. (2001). Twelve Principles of Agile
Software. Retrieved June 23, 2016, from http://www.agilemanifesto.org/principles.html
Goodpasture, J. C. (2016). Project Management
the Agile Way: Making it Work in the Enterprise, Second Edition Retrieved from Books24x7 database Available from http://common.books24x7.com.ezproxy.wpi.edu/toc.aspx?bookid=104303
Heshemi, S., & Kellersberger, G. (2009). The
Pedagogy of Utilizing Lengthy and Multifaceted Projects in Capstone Experiences. Information Systems Education Journal, 7(17).
Leidig, P. M., & Lange, D. K. (2012). Lessons Learned From A Decade Of Using Community-Based Non-Profit Organizations In
Information Systems Capstone Projects. Paper presented at the 2012 Proceedings of the Information Systems Educators Conference, New Orleans, Louisiana.
Maloni, M., Dembla, P., & Swaim, J. A. (2012). A Cross-Functional Systems Project in an IS Capstone Course. Journal of Information Systems Education, 23(3), 283-296.
Matos, V., Grasser, R., & Blake, B. (2008). Pencils Down! Phones Up! An Interdisciplinary Capstone Project. Journal of Computing Sciences in Colleges, 24(1), 67-75.
Mew, L. (2014). Improving an Information Systems Capstone/Consulting Course for Non-Traditional Undergraduate Students.
Paper presented at the 2014 Proceedings of the Information Systems Educators
Conference, Baltimore, Maryland.
Payne, D. L., Zlatkov, D. T., Jernigan, J. M., & Scarbrough, J. M. (2009). A Location-Aware Mobile System for On-Site Mapping and
Geographic Data Management. Paper presented at the SIGITE '09: Proceedings of the 10th ACM conference on SIG-information technology education, Fairfax, VA.
Reinicke, B. (2011). Real World Projects, Real World Problems: Capstones for External Clients. Information Systems Education
Journal, 9(3), 23-27.
Reinicke, B., Janicki, T., & Gebauer, J. (2012).
Implementing an Integrated Curriculum with an Iterative Process to Support a Capstone Course in Information Systems. Paper presented at the 2012 Proceedings of the Information Systems Educators Conference,
New Orleans, Louisiana.
Schwieger, D., & Surendran, K. (2010). Enhancing the Value of the Capstone Experience Course. Information Systems Education Journal, 8(29), 3-14.
Shih, L.-F., LeClair, J. A., & Varden, S. A. (2010).
The Integrated Technology Assessment: A Portfolio-based Capstone Experience.
Information Systems Education Journal, 8(63).
Stillman, R. M., & Peslak, A. R. (2009). The Complexities of Effectively Teaching Client-Server System Development. Information
Systems Education Journal, 7(22).
Tappert, C. C., Cotoranu, A., & Monaco, J. V. (2015). A Real-World-Projects Capstone

Information Systems Education Journal (ISEDJ) 15 (6)
ISSN: 1545-679X November 2017
©2017 ISCAP (Information Systems & Computing Academic Professionals) Page 35 http://iscap.info; http://isedj.org
Course in Computing: A 15-year Experience. Paper presented at the 2015 Proceedings of the EDSIG Conference.
Umapathy, K., & Wallace, F. L. (2010). The Role of the Web Server in a Capstone Web Application Course. Information Systems Education Journal, 8(62).
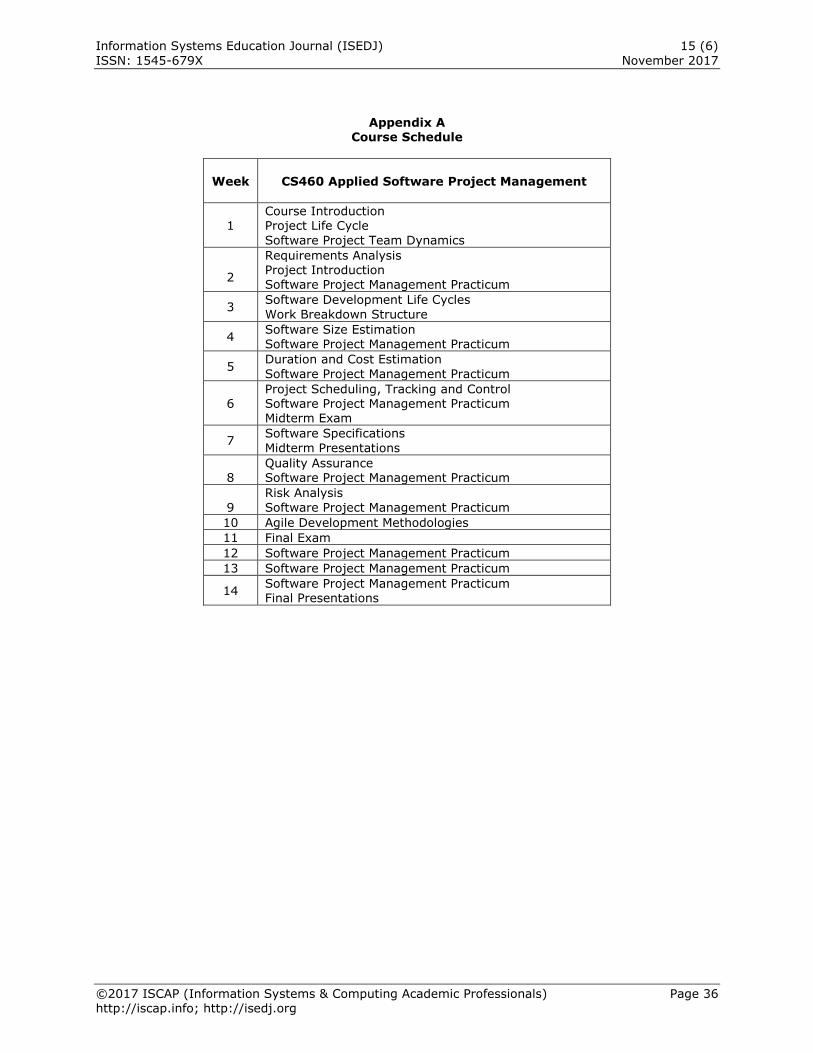
Information Systems Education Journal (ISEDJ) 15 (6)
ISSN: 1545-679X November 2017
©2017 ISCAP (Information Systems & Computing Academic Professionals) Page 36 http://iscap.info; http://isedj.org
Appendix A Course Schedule
Week
CS460 Applied Software Project Management
1 Course Introduction Project Life Cycle
Software Project Team Dynamics
2
Requirements Analysis Project Introduction Software Project Management Practicum
3 Software Development Life Cycles
Work Breakdown Structure
4 Software Size Estimation
Software Project Management Practicum
5 Duration and Cost Estimation
Software Project Management Practicum
6 Project Scheduling, Tracking and Control Software Project Management Practicum Midterm Exam
7 Software Specifications
Midterm Presentations
8
Quality Assurance Software Project Management Practicum
9
Risk Analysis
Software Project Management Practicum
10 Agile Development Methodologies
11 Final Exam
12 Software Project Management Practicum
13 Software Project Management Practicum
14 Software Project Management Practicum Final Presentations
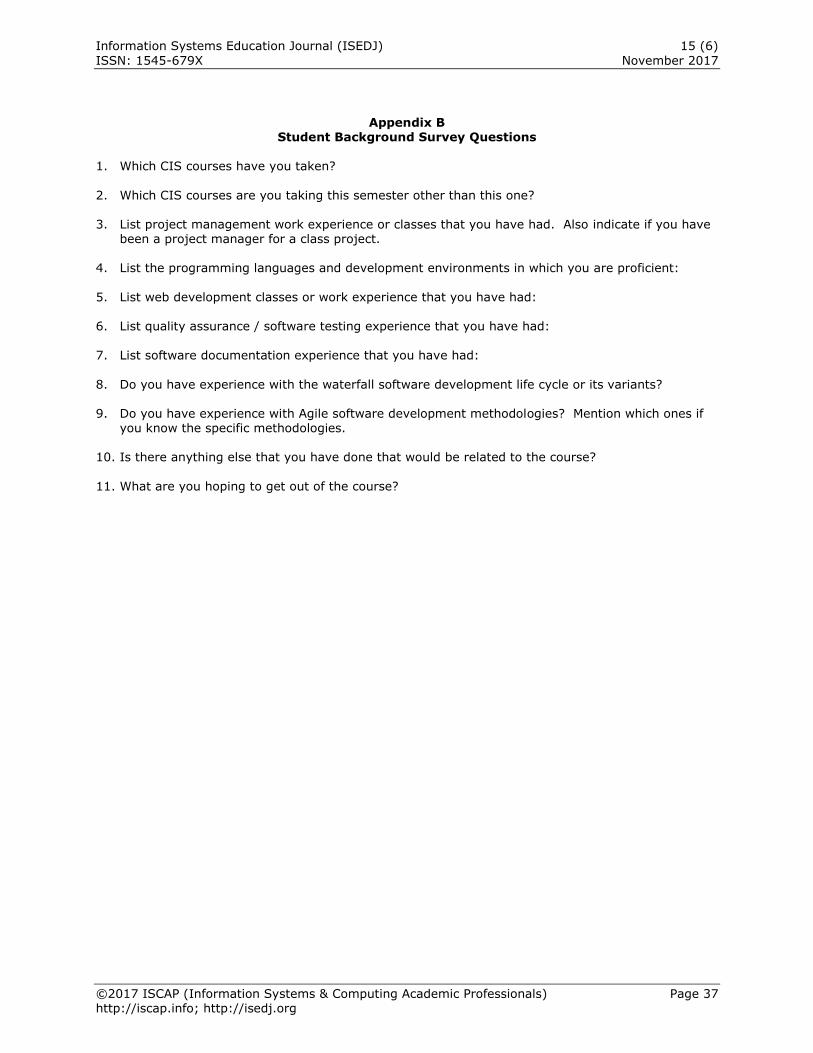
Information Systems Education Journal (ISEDJ) 15 (6)
ISSN: 1545-679X November 2017
©2017 ISCAP (Information Systems & Computing Academic Professionals) Page 37 http://iscap.info; http://isedj.org
Appendix B Student Background Survey Questions
1. Which CIS courses have you taken?
2. Which CIS courses are you taking this semester other than this one? 3. List project management work experience or classes that you have had. Also indicate if you have
been a project manager for a class project. 4. List the programming languages and development environments in which you are proficient:
5. List web development classes or work experience that you have had: 6. List quality assurance / software testing experience that you have had:
7. List software documentation experience that you have had:
8. Do you have experience with the waterfall software development life cycle or its variants? 9. Do you have experience with Agile software development methodologies? Mention which ones if
you know the specific methodologies. 10. Is there anything else that you have done that would be related to the course?
11. What are you hoping to get out of the course?
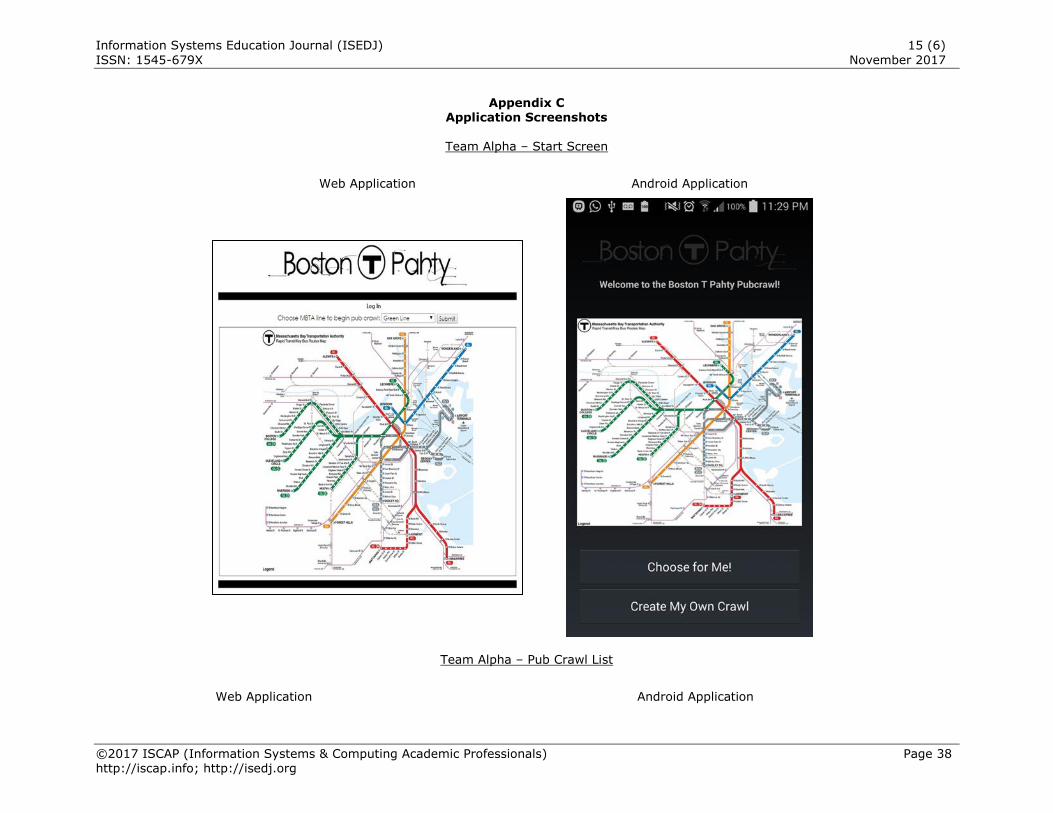
Information Systems Education Journal (ISEDJ) 15 (6)
ISSN: 1545-679X November 2017
©2017 ISCAP (Information Systems & Computing Academic Professionals) Page 38 http://iscap.info; http://isedj.org
Appendix C Application Screenshots
Team Alpha – Start Screen
Web Application Android Application
Team Alpha – Pub Crawl List
Web Application Android Application
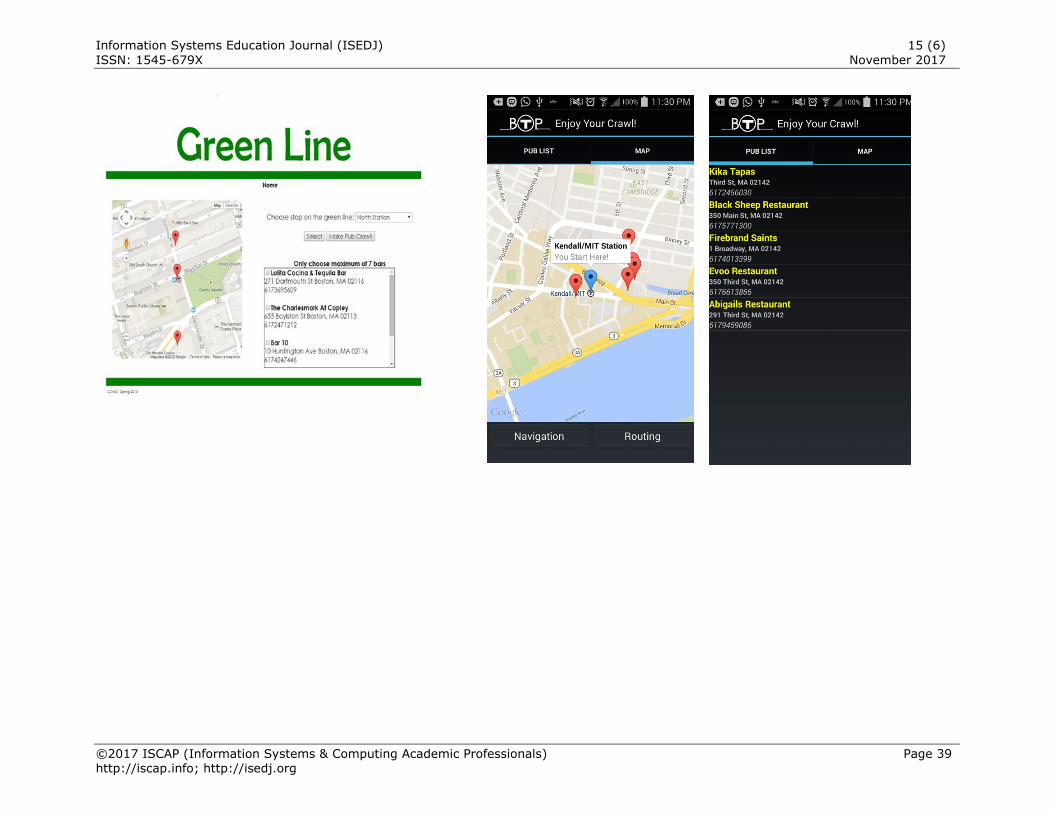
Information Systems Education Journal (ISEDJ) 15 (6)
ISSN: 1545-679X November 2017
©2017 ISCAP (Information Systems & Computing Academic Professionals) Page 39 http://iscap.info; http://isedj.org
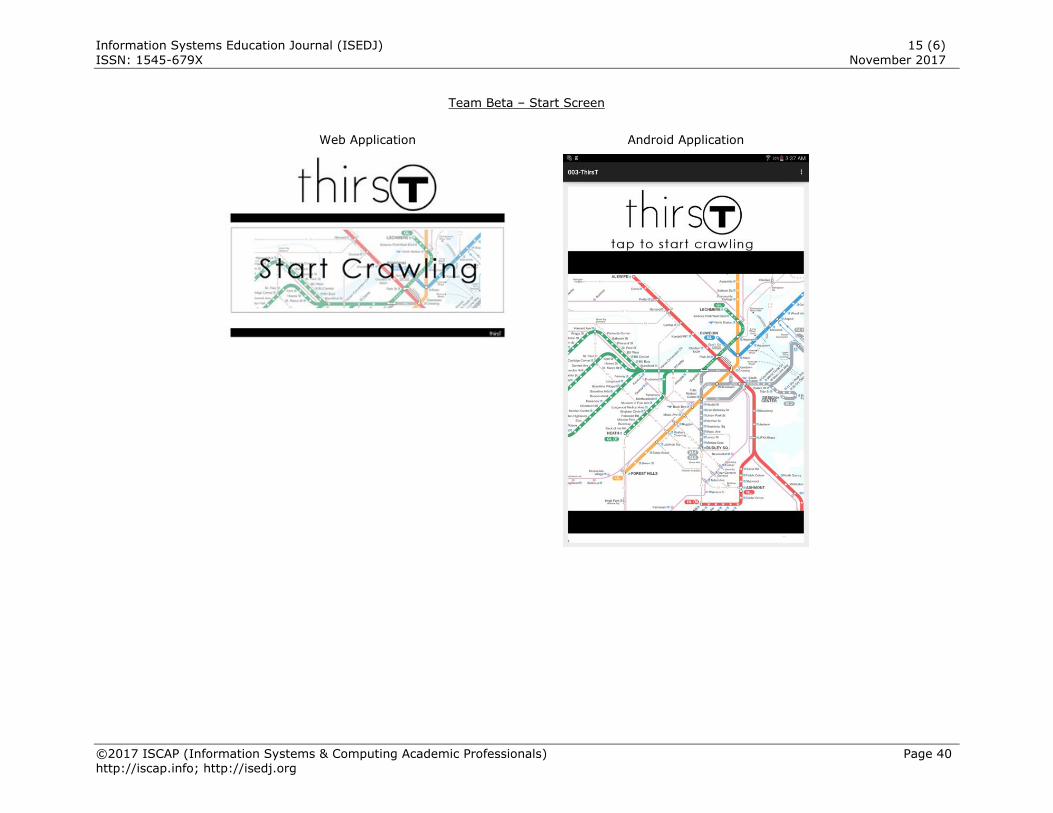
Information Systems Education Journal (ISEDJ) 15 (6)
ISSN: 1545-679X November 2017
©2017 ISCAP (Information Systems & Computing Academic Professionals) Page 40 http://iscap.info; http://isedj.org
Team Beta – Start Screen
Web Application Android Application
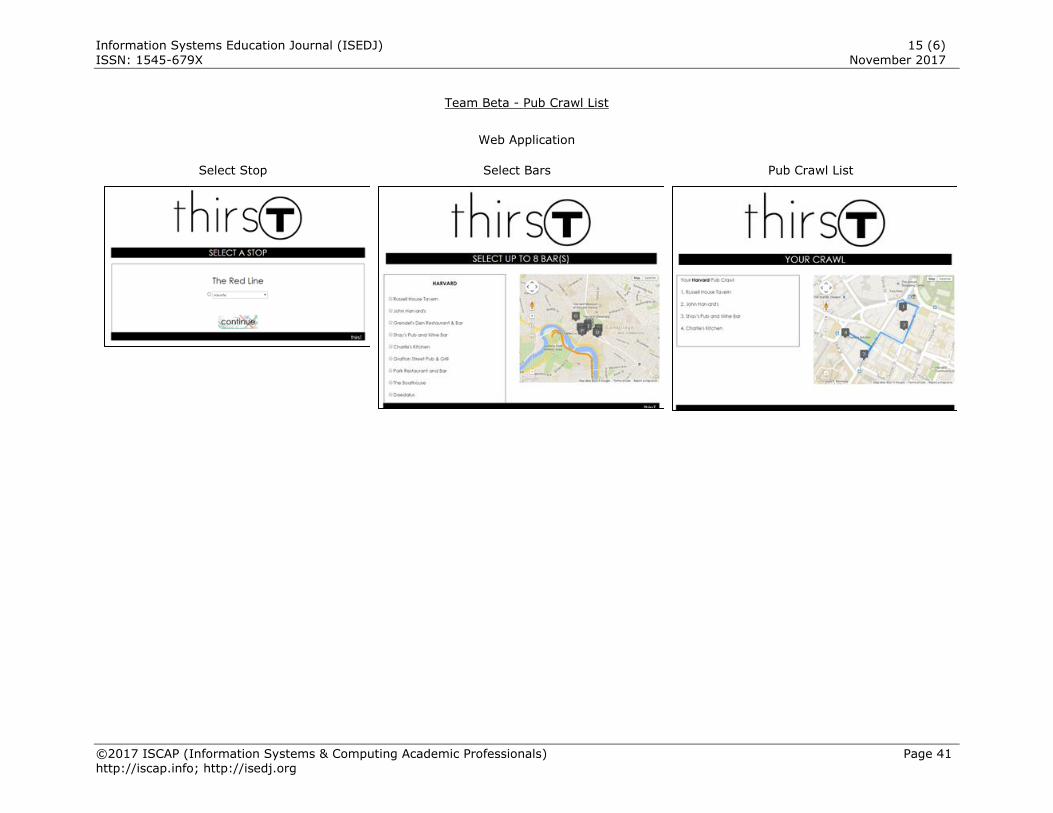
Information Systems Education Journal (ISEDJ) 15 (6)
ISSN: 1545-679X November 2017
©2017 ISCAP (Information Systems & Computing Academic Professionals) Page 41 http://iscap.info; http://isedj.org
Team Beta - Pub Crawl List
Web Application
Select Stop Select Bars Pub Crawl List
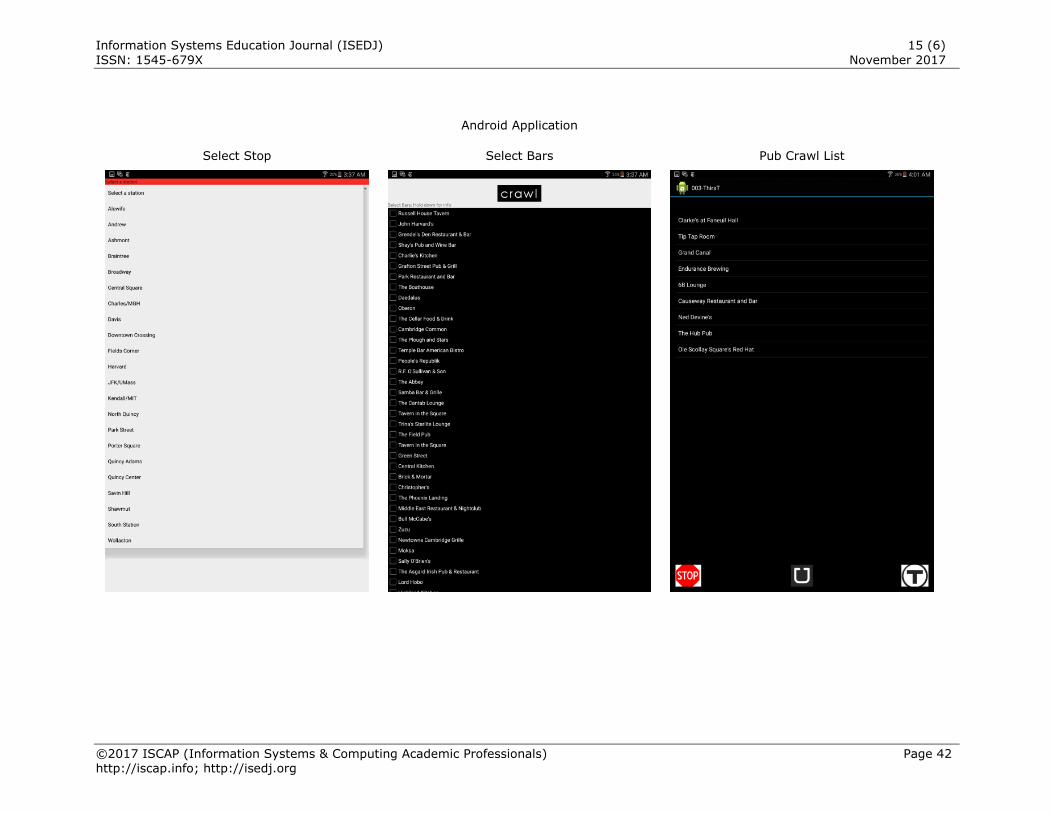
Information Systems Education Journal (ISEDJ) 15 (6)
ISSN: 1545-679X November 2017
©2017 ISCAP (Information Systems & Computing Academic Professionals) Page 42 http://iscap.info; http://isedj.org
Android Application
Select Stop Select Bars Pub Crawl List
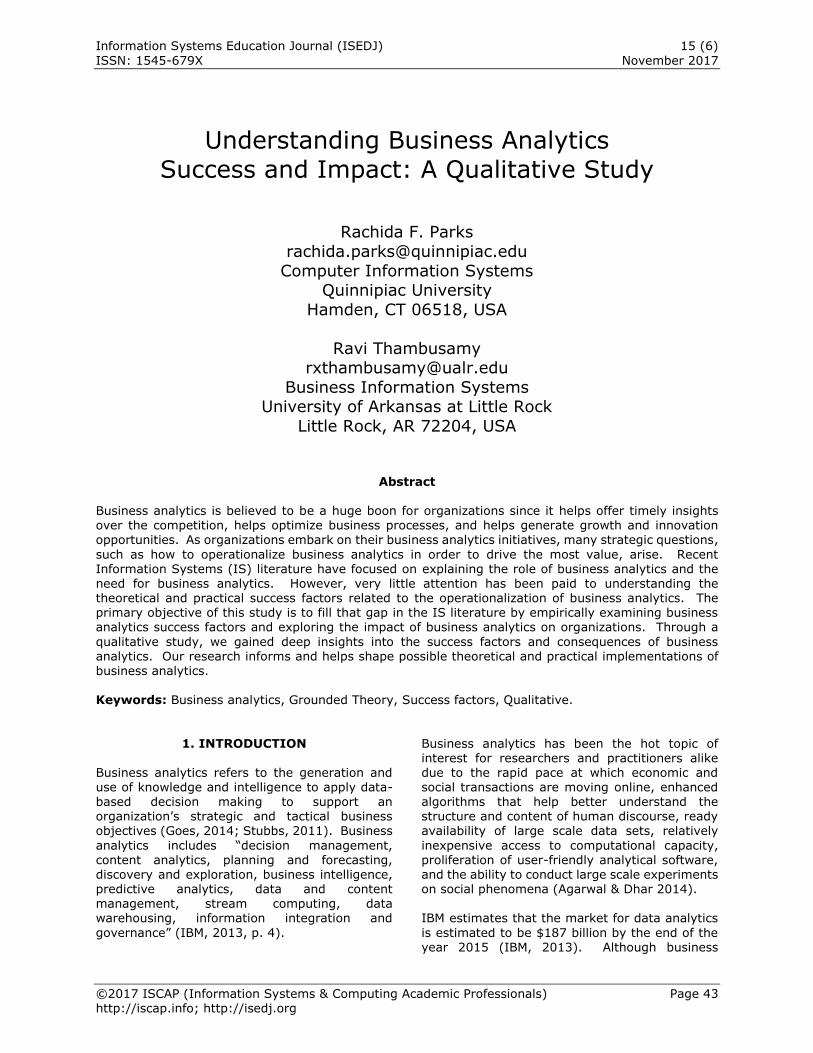
Information Systems Education Journal (ISEDJ) 15 (6)
ISSN: 1545-679X November 2017
©2017 ISCAP (Information Systems & Computing Academic Professionals) Page 43 http://iscap.info; http://isedj.org
Understanding Business Analytics
Success and Impact: A Qualitative Study
Rachida F. Parks
Computer Information Systems Quinnipiac University
Hamden, CT 06518, USA
Ravi Thambusamy [email protected]
Business Information Systems University of Arkansas at Little Rock
Little Rock, AR 72204, USA
Abstract
Business analytics is believed to be a huge boon for organizations since it helps offer timely insights over the competition, helps optimize business processes, and helps generate growth and innovation opportunities. As organizations embark on their business analytics initiatives, many strategic questions,
such as how to operationalize business analytics in order to drive the most value, arise. Recent Information Systems (IS) literature have focused on explaining the role of business analytics and the
need for business analytics. However, very little attention has been paid to understanding the theoretical and practical success factors related to the operationalization of business analytics. The primary objective of this study is to fill that gap in the IS literature by empirically examining business analytics success factors and exploring the impact of business analytics on organizations. Through a
qualitative study, we gained deep insights into the success factors and consequences of business analytics. Our research informs and helps shape possible theoretical and practical implementations of business analytics. Keywords: Business analytics, Grounded Theory, Success factors, Qualitative.
1. INTRODUCTION Business analytics refers to the generation and use of knowledge and intelligence to apply data-
based decision making to support an organization’s strategic and tactical business objectives (Goes, 2014; Stubbs, 2011). Business
analytics includes “decision management, content analytics, planning and forecasting, discovery and exploration, business intelligence, predictive analytics, data and content management, stream computing, data warehousing, information integration and
governance” (IBM, 2013, p. 4).
Business analytics has been the hot topic of interest for researchers and practitioners alike due to the rapid pace at which economic and social transactions are moving online, enhanced
algorithms that help better understand the structure and content of human discourse, ready availability of large scale data sets, relatively
inexpensive access to computational capacity, proliferation of user-friendly analytical software, and the ability to conduct large scale experiments on social phenomena (Agarwal & Dhar 2014). IBM estimates that the market for data analytics
is estimated to be $187 billion by the end of the year 2015 (IBM, 2013). Although business
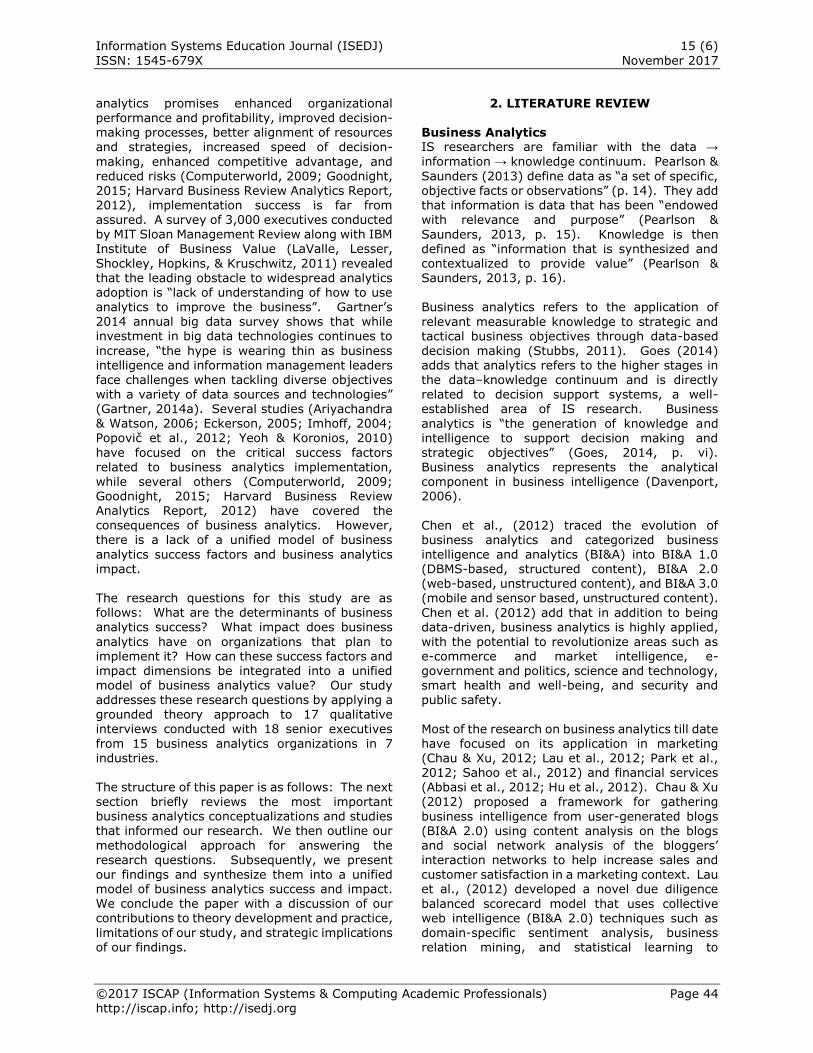
Information Systems Education Journal (ISEDJ) 15 (6)
ISSN: 1545-679X November 2017
©2017 ISCAP (Information Systems & Computing Academic Professionals) Page 44 http://iscap.info; http://isedj.org
analytics promises enhanced organizational
performance and profitability, improved decision-making processes, better alignment of resources and strategies, increased speed of decision-
making, enhanced competitive advantage, and reduced risks (Computerworld, 2009; Goodnight, 2015; Harvard Business Review Analytics Report, 2012), implementation success is far from assured. A survey of 3,000 executives conducted by MIT Sloan Management Review along with IBM Institute of Business Value (LaValle, Lesser,
Shockley, Hopkins, & Kruschwitz, 2011) revealed that the leading obstacle to widespread analytics adoption is “lack of understanding of how to use analytics to improve the business”. Gartner’s 2014 annual big data survey shows that while investment in big data technologies continues to
increase, “the hype is wearing thin as business intelligence and information management leaders face challenges when tackling diverse objectives with a variety of data sources and technologies” (Gartner, 2014a). Several studies (Ariyachandra & Watson, 2006; Eckerson, 2005; Imhoff, 2004; Popovič et al., 2012; Yeoh & Koronios, 2010)
have focused on the critical success factors related to business analytics implementation, while several others (Computerworld, 2009; Goodnight, 2015; Harvard Business Review Analytics Report, 2012) have covered the consequences of business analytics. However, there is a lack of a unified model of business
analytics success factors and business analytics impact.
The research questions for this study are as follows: What are the determinants of business analytics success? What impact does business
analytics have on organizations that plan to implement it? How can these success factors and impact dimensions be integrated into a unified model of business analytics value? Our study addresses these research questions by applying a grounded theory approach to 17 qualitative interviews conducted with 18 senior executives
from 15 business analytics organizations in 7 industries. The structure of this paper is as follows: The next
section briefly reviews the most important business analytics conceptualizations and studies that informed our research. We then outline our
methodological approach for answering the research questions. Subsequently, we present our findings and synthesize them into a unified model of business analytics success and impact. We conclude the paper with a discussion of our contributions to theory development and practice,
limitations of our study, and strategic implications of our findings.
2. LITERATURE REVIEW
Business Analytics IS researchers are familiar with the data →
information → knowledge continuum. Pearlson &
Saunders (2013) define data as “a set of specific, objective facts or observations” (p. 14). They add that information is data that has been “endowed with relevance and purpose” (Pearlson &
Saunders, 2013, p. 15). Knowledge is then defined as “information that is synthesized and contextualized to provide value” (Pearlson & Saunders, 2013, p. 16). Business analytics refers to the application of
relevant measurable knowledge to strategic and tactical business objectives through data-based
decision making (Stubbs, 2011). Goes (2014) adds that analytics refers to the higher stages in the data–knowledge continuum and is directly related to decision support systems, a well-established area of IS research. Business
analytics is “the generation of knowledge and intelligence to support decision making and strategic objectives” (Goes, 2014, p. vi). Business analytics represents the analytical component in business intelligence (Davenport, 2006).
Chen et al., (2012) traced the evolution of business analytics and categorized business intelligence and analytics (BI&A) into BI&A 1.0 (DBMS-based, structured content), BI&A 2.0
(web-based, unstructured content), and BI&A 3.0 (mobile and sensor based, unstructured content).
Chen et al. (2012) add that in addition to being data-driven, business analytics is highly applied, with the potential to revolutionize areas such as e-commerce and market intelligence, e-government and politics, science and technology, smart health and well-being, and security and public safety.
Most of the research on business analytics till date have focused on its application in marketing (Chau & Xu, 2012; Lau et al., 2012; Park et al., 2012; Sahoo et al., 2012) and financial services (Abbasi et al., 2012; Hu et al., 2012). Chau & Xu
(2012) proposed a framework for gathering
business intelligence from user-generated blogs (BI&A 2.0) using content analysis on the blogs and social network analysis of the bloggers’ interaction networks to help increase sales and customer satisfaction in a marketing context. Lau et al., (2012) developed a novel due diligence
balanced scorecard model that uses collective web intelligence (BI&A 2.0) techniques such as domain-specific sentiment analysis, business relation mining, and statistical learning to
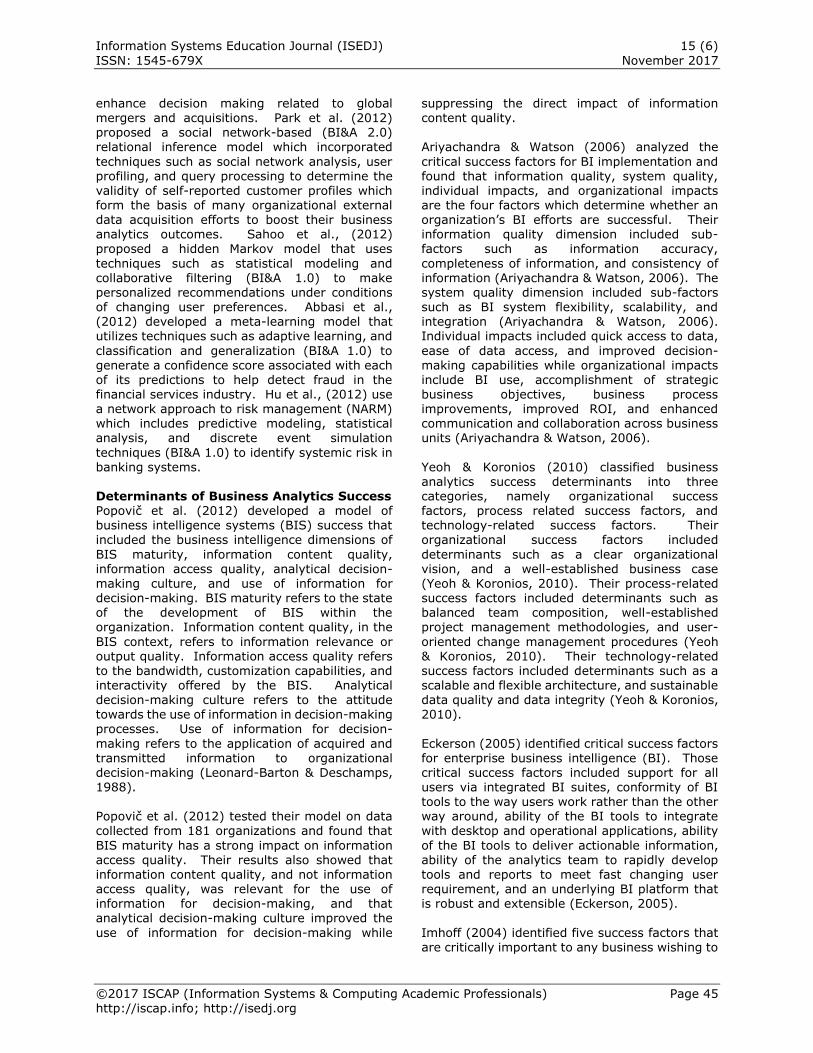
Information Systems Education Journal (ISEDJ) 15 (6)
ISSN: 1545-679X November 2017
©2017 ISCAP (Information Systems & Computing Academic Professionals) Page 45 http://iscap.info; http://isedj.org
enhance decision making related to global
mergers and acquisitions. Park et al. (2012) proposed a social network-based (BI&A 2.0) relational inference model which incorporated
techniques such as social network analysis, user profiling, and query processing to determine the validity of self-reported customer profiles which form the basis of many organizational external data acquisition efforts to boost their business analytics outcomes. Sahoo et al., (2012) proposed a hidden Markov model that uses
techniques such as statistical modeling and collaborative filtering (BI&A 1.0) to make personalized recommendations under conditions of changing user preferences. Abbasi et al., (2012) developed a meta-learning model that utilizes techniques such as adaptive learning, and
classification and generalization (BI&A 1.0) to generate a confidence score associated with each of its predictions to help detect fraud in the financial services industry. Hu et al., (2012) use a network approach to risk management (NARM) which includes predictive modeling, statistical analysis, and discrete event simulation
techniques (BI&A 1.0) to identify systemic risk in banking systems. Determinants of Business Analytics Success Popovič et al. (2012) developed a model of business intelligence systems (BIS) success that included the business intelligence dimensions of
BIS maturity, information content quality, information access quality, analytical decision-
making culture, and use of information for decision-making. BIS maturity refers to the state of the development of BIS within the organization. Information content quality, in the
BIS context, refers to information relevance or output quality. Information access quality refers to the bandwidth, customization capabilities, and interactivity offered by the BIS. Analytical decision-making culture refers to the attitude towards the use of information in decision-making processes. Use of information for decision-
making refers to the application of acquired and transmitted information to organizational decision-making (Leonard-Barton & Deschamps, 1988).
Popovič et al. (2012) tested their model on data collected from 181 organizations and found that
BIS maturity has a strong impact on information access quality. Their results also showed that information content quality, and not information access quality, was relevant for the use of information for decision-making, and that analytical decision-making culture improved the
use of information for decision-making while
suppressing the direct impact of information
content quality. Ariyachandra & Watson (2006) analyzed the
critical success factors for BI implementation and found that information quality, system quality, individual impacts, and organizational impacts are the four factors which determine whether an organization’s BI efforts are successful. Their information quality dimension included sub-factors such as information accuracy,
completeness of information, and consistency of information (Ariyachandra & Watson, 2006). The system quality dimension included sub-factors such as BI system flexibility, scalability, and integration (Ariyachandra & Watson, 2006). Individual impacts included quick access to data,
ease of data access, and improved decision-making capabilities while organizational impacts include BI use, accomplishment of strategic business objectives, business process improvements, improved ROI, and enhanced communication and collaboration across business units (Ariyachandra & Watson, 2006).
Yeoh & Koronios (2010) classified business analytics success determinants into three categories, namely organizational success factors, process related success factors, and technology-related success factors. Their organizational success factors included
determinants such as a clear organizational vision, and a well-established business case
(Yeoh & Koronios, 2010). Their process-related success factors included determinants such as balanced team composition, well-established project management methodologies, and user-
oriented change management procedures (Yeoh & Koronios, 2010). Their technology-related success factors included determinants such as a scalable and flexible architecture, and sustainable data quality and data integrity (Yeoh & Koronios, 2010).
Eckerson (2005) identified critical success factors for enterprise business intelligence (BI). Those critical success factors included support for all users via integrated BI suites, conformity of BI
tools to the way users work rather than the other way around, ability of the BI tools to integrate with desktop and operational applications, ability
of the BI tools to deliver actionable information, ability of the analytics team to rapidly develop tools and reports to meet fast changing user requirement, and an underlying BI platform that is robust and extensible (Eckerson, 2005).
Imhoff (2004) identified five success factors that are critically important to any business wishing to
Information Systems Education Journal (ISEDJ) 15 (6)
ISSN: 1545-679X November 2017
©2017 ISCAP (Information Systems & Computing Academic Professionals) Page 46 http://iscap.info; http://isedj.org
develop a BI environment. Those success factors
included a dependable architecture, strong partnership between the business community and IT, an agile/prototyping methodology, well-
defined business problems, and a willingness to accept change (Imhoff, 2004). Howson (2008) identified four critical success factors while exploring the characteristics of a killer BI app. Those BI success determinants included culture, people’s views of the value of
information, exploratory and predictive models, and fact-based management (Howson, 2008). Consequences of Business Analytics Success Jim Goodnight, CEO of SAS Institute Inc., states
that business analytics has a tremendous impact on organizational performance and profitability adding that the “ability to predict future business trends with reasonable accuracy will be one of the crucial competitive advantages of this new decade. And you won’t be able to do that without analytics.” (Goodnight, 2015, p.3).
A Computerworld survey (Computerworld, 2009) of 215 business analytics organizations showed that the key benefits derived from business analytics initiatives include improved decision-making processes (75%), increased speed of decision-making (60%), better alignment of
resources and strategies (56%), greater cost savings (55%), quicker response to users’
business analytics needs (54%), enhanced organizational competitiveness (50%), and improved ability to provide a single, unified view of enterprise information (50%).
According to a Harvard Business Review global survey of 646 executives, managers, and professionals, some of the key benefits from using business analytics include increased productivity, reduced risks, reduced costs, faster decision-making, improved programs, and
superior financial performance (Harvard Business Review Analytics Report, 2012).
3. RESEARCH METHOD
To achieve our research objectives, we followed a qualitative-empirical research design. We adopted a grounded theory methodology that
accounts for, and uncovers, organizational activities and behaviors with regards to business analytics (Glaser & Strauss, 1967). The grounded theory approach is becoming increasingly common in IS research literature because of its usefulness in helping develop rich context-based descriptions and explanations of the phenomenon
being studied (Orlikowski, 1993). This
methodology also enables researchers to “produce theoretical accounts which are understandable to those in the area studied and
which are useful in giving them a superior understanding of the nature of their own situation” (Turner 1983, p. 348). Data Collection We gathered data through semi-structured interviews with executives and experts in
business analytics such as: Chief Data Officer (CDO), Chief Information Officer (CIO), Chief Privacy Officer (CPO), Chief Medical Information Officer (CMIO), Chief Executive Officer (CEO), and Managers (see Appendix A). We conducted 17 interviews with 18 informants from 15
organizations in the U.S. We used a “snowball” technique (Lincoln & Guba, 1985) to identify more informants. Our selection can be considered a convenience sample that allowed us to achieve a large number of executives. However, with regards to theoretical replication (Benbasat et al., 1987; Yin, 2009), we tried to achieve sufficient
variation across the organizations with respect to industry (banking, healthcare, insurance, manufacturing, retail, technology services, etc.), organization size (10 to 115,000 employees), interviewees’ roles (CDO, CIO, CPO, CMIO, CEO, VP, etc.), and interviewees’ area(s) of expertise (BA, BI, Enterprise BI, IT, innovation, leadership,
privacy, etc.) in order to avoid any bias. Therefore, we interviewed informants with
different expertise across multiple industries (see Appendix A). The interviews addressed ten major question categories (see Appendix B) and lasted between 40 and 90 minutes. Interviews were
conducted between Fall 2014 and Spring 2015. All interviews were audio-recorded and transcribed. Grounded Theory Analysis Process For the purpose of clarity, we provide a brief overview of the tasks undertaken during the
grounded theory approach: (1) First, for data collection and transcription, all interviews were recorded and then transcribed into Microsoft Word documents. (2) Second, as a part of data
analysis, each transcribed interview was imported into Dedoose. Dedoose is a “cross-platform app for analyzing qualitative and mixed methods
research with text, photos, audio, videos, spreadsheet data and so much more” (Dedoose, 2015). Transcripts were then manually coded. This involved selecting pieces of raw data and creating codes to describe them using an inductive approach, meaning that we did not use
a predefined set of codes, but rather let the codes arise from the data. For the first order analysis,
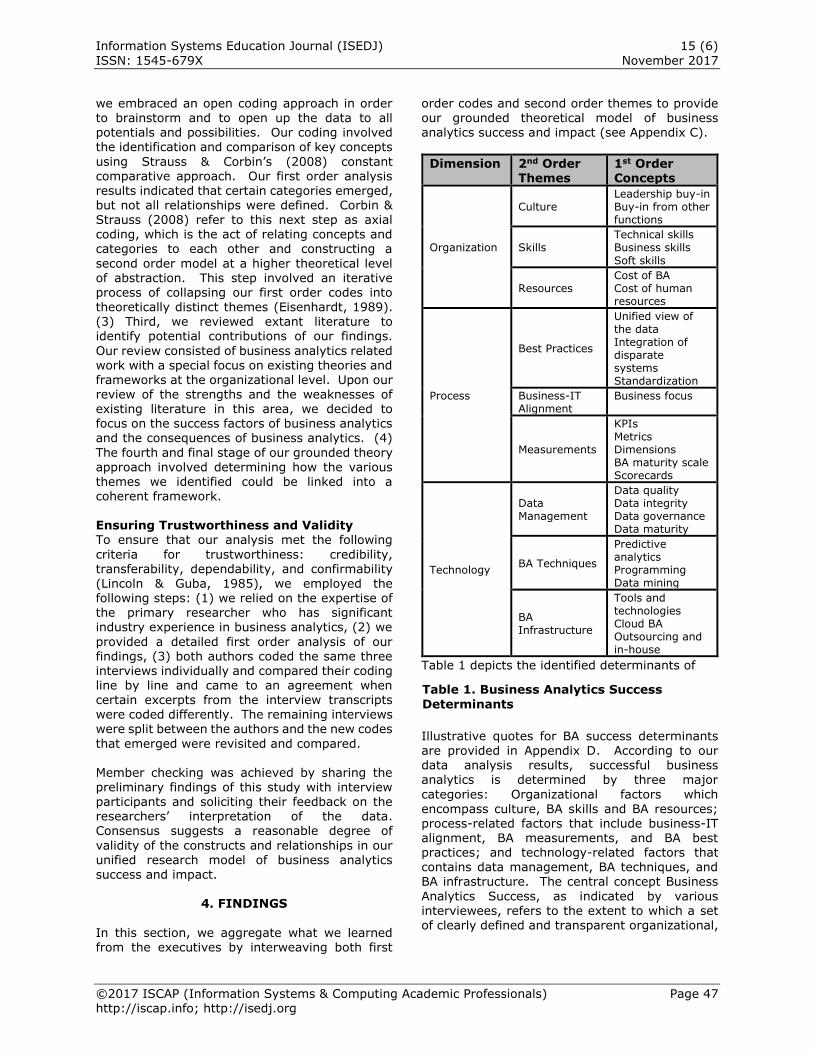
Information Systems Education Journal (ISEDJ) 15 (6)
ISSN: 1545-679X November 2017
©2017 ISCAP (Information Systems & Computing Academic Professionals) Page 47 http://iscap.info; http://isedj.org
we embraced an open coding approach in order
to brainstorm and to open up the data to all potentials and possibilities. Our coding involved the identification and comparison of key concepts
using Strauss & Corbin’s (2008) constant comparative approach. Our first order analysis results indicated that certain categories emerged, but not all relationships were defined. Corbin & Strauss (2008) refer to this next step as axial coding, which is the act of relating concepts and categories to each other and constructing a
second order model at a higher theoretical level of abstraction. This step involved an iterative process of collapsing our first order codes into theoretically distinct themes (Eisenhardt, 1989). (3) Third, we reviewed extant literature to identify potential contributions of our findings.
Our review consisted of business analytics related work with a special focus on existing theories and frameworks at the organizational level. Upon our review of the strengths and the weaknesses of existing literature in this area, we decided to focus on the success factors of business analytics and the consequences of business analytics. (4)
The fourth and final stage of our grounded theory approach involved determining how the various themes we identified could be linked into a coherent framework. Ensuring Trustworthiness and Validity To ensure that our analysis met the following
criteria for trustworthiness: credibility, transferability, dependability, and confirmability
(Lincoln & Guba, 1985), we employed the following steps: (1) we relied on the expertise of the primary researcher who has significant industry experience in business analytics, (2) we
provided a detailed first order analysis of our findings, (3) both authors coded the same three interviews individually and compared their coding line by line and came to an agreement when certain excerpts from the interview transcripts were coded differently. The remaining interviews were split between the authors and the new codes
that emerged were revisited and compared. Member checking was achieved by sharing the preliminary findings of this study with interview
participants and soliciting their feedback on the researchers’ interpretation of the data. Consensus suggests a reasonable degree of
validity of the constructs and relationships in our unified research model of business analytics success and impact.
4. FINDINGS
In this section, we aggregate what we learned from the executives by interweaving both first
order codes and second order themes to provide
our grounded theoretical model of business analytics success and impact (see Appendix C).
Dimension 2nd Order Themes
1st Order Concepts
Organization
Culture Leadership buy-in Buy-in from other functions
Skills Technical skills Business skills
Soft skills
Resources Cost of BA Cost of human resources
Process
Best Practices
Unified view of the data Integration of disparate systems Standardization
Business-IT Alignment
Business focus
Measurements
KPIs Metrics Dimensions BA maturity scale Scorecards
Technology
Data Management
Data quality Data integrity Data governance Data maturity
BA Techniques
Predictive analytics Programming Data mining
BA Infrastructure
Tools and technologies Cloud BA Outsourcing and in-house
Table 1 depicts the identified determinants of
Illustrative quotes for BA success determinants are provided in Appendix D. According to our data analysis results, successful business analytics is determined by three major
categories: Organizational factors which
encompass culture, BA skills and BA resources; process-related factors that include business-IT alignment, BA measurements, and BA best practices; and technology-related factors that contains data management, BA techniques, and BA infrastructure. The central concept Business
Analytics Success, as indicated by various interviewees, refers to the extent to which a set of clearly defined and transparent organizational,
Table 1. Business Analytics Success
Determinants
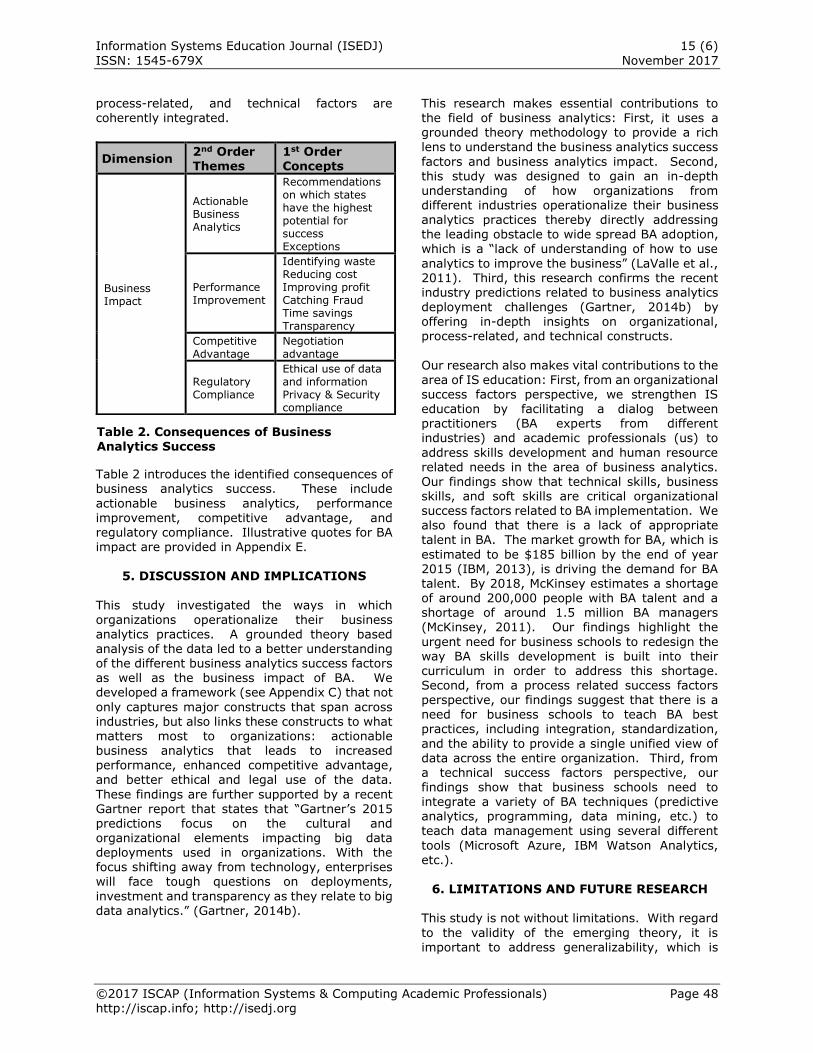
Information Systems Education Journal (ISEDJ) 15 (6)
ISSN: 1545-679X November 2017
©2017 ISCAP (Information Systems & Computing Academic Professionals) Page 48 http://iscap.info; http://isedj.org
process-related, and technical factors are
coherently integrated.
Table 2 introduces the identified consequences of business analytics success. These include
actionable business analytics, performance improvement, competitive advantage, and regulatory compliance. Illustrative quotes for BA impact are provided in Appendix E.
5. DISCUSSION AND IMPLICATIONS
This study investigated the ways in which organizations operationalize their business analytics practices. A grounded theory based analysis of the data led to a better understanding of the different business analytics success factors as well as the business impact of BA. We developed a framework (see Appendix C) that not
only captures major constructs that span across industries, but also links these constructs to what matters most to organizations: actionable business analytics that leads to increased performance, enhanced competitive advantage, and better ethical and legal use of the data.
These findings are further supported by a recent
Gartner report that states that “Gartner’s 2015 predictions focus on the cultural and organizational elements impacting big data deployments used in organizations. With the focus shifting away from technology, enterprises will face tough questions on deployments,
investment and transparency as they relate to big data analytics.” (Gartner, 2014b).
This research makes essential contributions to
the field of business analytics: First, it uses a grounded theory methodology to provide a rich lens to understand the business analytics success
factors and business analytics impact. Second, this study was designed to gain an in-depth understanding of how organizations from different industries operationalize their business analytics practices thereby directly addressing the leading obstacle to wide spread BA adoption, which is a “lack of understanding of how to use
analytics to improve the business” (LaValle et al., 2011). Third, this research confirms the recent industry predictions related to business analytics deployment challenges (Gartner, 2014b) by offering in-depth insights on organizational, process-related, and technical constructs.
Our research also makes vital contributions to the area of IS education: First, from an organizational success factors perspective, we strengthen IS education by facilitating a dialog between practitioners (BA experts from different industries) and academic professionals (us) to
address skills development and human resource related needs in the area of business analytics. Our findings show that technical skills, business skills, and soft skills are critical organizational success factors related to BA implementation. We also found that there is a lack of appropriate talent in BA. The market growth for BA, which is
estimated to be $185 billion by the end of year 2015 (IBM, 2013), is driving the demand for BA
talent. By 2018, McKinsey estimates a shortage of around 200,000 people with BA talent and a shortage of around 1.5 million BA managers (McKinsey, 2011). Our findings highlight the
urgent need for business schools to redesign the way BA skills development is built into their curriculum in order to address this shortage. Second, from a process related success factors perspective, our findings suggest that there is a need for business schools to teach BA best practices, including integration, standardization,
and the ability to provide a single unified view of data across the entire organization. Third, from a technical success factors perspective, our findings show that business schools need to
integrate a variety of BA techniques (predictive analytics, programming, data mining, etc.) to teach data management using several different
tools (Microsoft Azure, IBM Watson Analytics, etc.).
6. LIMITATIONS AND FUTURE RESEARCH This study is not without limitations. With regard
to the validity of the emerging theory, it is important to address generalizability, which is
Dimension 2nd Order Themes
1st Order Concepts
Business Impact
Actionable Business Analytics
Recommendations on which states have the highest potential for success Exceptions
Performance Improvement
Identifying waste Reducing cost Improving profit Catching Fraud Time savings Transparency
Competitive Advantage
Negotiation advantage
Regulatory Compliance
Ethical use of data and information Privacy & Security compliance
Table 2. Consequences of Business Analytics Success
Information Systems Education Journal (ISEDJ) 15 (6)
ISSN: 1545-679X November 2017
©2017 ISCAP (Information Systems & Computing Academic Professionals) Page 49 http://iscap.info; http://isedj.org
“the validity of a theory in a setting different from
the one where it was empirically tested and confirmed” (Lee & Baskerville, 2003, p. 221). Lee & Baskerville (2003) clarified that the appropriate
type of generalizability (not just statistical) should be applied to this particular type of study. The purpose of this study was not to achieve statistical validation, but rather to discover patterns for the purpose of theory building and gaining a better understanding of the main issues in its context. It is reasonable to assume that the
insights gained from our emerging framework will guide future researchers to develop a more formal theory in this area (Orlikowski, 1993). Large scale additional data collection will further sharpen the findings in this study. Therefore, we propose a large scale study that examines the
relationships among BA success factors and BA impact factors especially with regards to the changes needed to the IS curriculum. Our findings show that BA skills are extremely important and that there is a lack of appropriate talent. Therefore, a second research opportunity is to further examine the correlations among the
required talent by industries and deliverable skills by IS programs. Doing so could facilitate the hiring and training of appropriate talent to achieve better decision making. Finally, the findings are based on different industries. Therefore, a third research opportunity could be to conduct a research study with focus on a
particular industry for more-in-depth findings on its impact on the curriculum offered (e.g., more
statistic courses, technical emphasis etc.).
7. CONCLUSION
Motivated by the significant increase in investments in business analytics technologies and growing concerns over BA implementation success, the primary goal of our paper was to examine how organizations operationalized their business analytics practices. We report the results of our grounded theory study that was
carried out to understand how business analytics helps organizations handle the growing complexity of data, information, and business decisions. We thereby set out to identify the
factors that influence and result from successful business analytics. Our analysis resulted in the emergence of a theoretical framework of business
analytics success and impact. Our research provides the foundation for exploring further the operationalization of business analytics. Business analytics indeed is playing increasingly important role in decision making, and as BA deployments become more successful, organizations will see
more opportunity for exceptional business impact.
8. REFERENCES
Abbasi, A., Albrecht, C., Vance, A., & Hansen, J.
(2012). Metafraud: a meta-learning framework for detecting financial fraud. MIS Quarterly, 36(4), 1293-1327.
Agarwal, R., & Dhar, V. (2014). Editorial—Big Data, Data Science, and Analytics: The Opportunity and Challenge for IS Research. Information Systems Research, 25(3), 443-448.
Ariyachandra, T., & Watson, H. (2006). Which data warehouse architecture is most successful? Business Intelligence Journal, 11(1), 4.
Benbasat, I., Goldstein, D. & Mead, M. (1987).
The Case Research Strategy in Studies of Information Systems. MIS Quarterly, 11(3), 369-386.
Chau, M., & Xu, J. (2012). Business intelligence in blogs: Understanding consumer interactions and communities. MIS quarterly, 36(4), 1189-1216.
Chen, H., Chiang, R. H. L., & Storey, V. (2012). Business Intelligence and Analytics. MIS Quarterly, 36(4), 1165-1188.
Computerworld. (2009). Defining business
analytics and its impact on organizational decision-making. Retrieved June 22, 2016 from
http://www.umsl.edu/~sauterv/DSS4BI/links/sas_defining_business_analytics_wp.pdf.
Davenport, T. H. (2006). Competing on Analytics. Harvard Business Review, 84(1), 98-107.
Dedoose. (2015). Dedoose: Great Research Made Easy! Retrieved June 22, 2016 from
http://www.dedoose.com/.
Eckerson, W. W. (2005). The keys to enterprise Business Intelligence: critical success factors. The Data Warehousing Institute. Retrieved
June 22, 2016 from http://download.101com.com/pub/TDWI/Files/TDWIMonograph2-BO.pdf.
Eisenhardt, K.M. (1989). Building theories from case study research. Academy of
Management Review 14(4), 532-550.
Gartner. (2014a). Survey Analysis: Big Data Investment Grows but Deployments Remain Scarce in 2014. Retrieved June 22, 2016
from https://www.gartner.com/doc/2841519/survey-analysis-big-data-investment.
Gartner. (2014b). Predicts 2015: Big Data Challenges Move From Technology to the
Information Systems Education Journal (ISEDJ) 15 (6)
ISSN: 1545-679X November 2017
©2017 ISCAP (Information Systems & Computing Academic Professionals) Page 50 http://iscap.info; http://isedj.org
Organization. Retrieved June 22, 2016 from
https://www.gartner.com/doc/2928217/predicts--big-data-challenges.
Glaser, B. G., & Strauss, A. L. (1967). The Discovery of Grounded Theory: Strategies for Qualitative Research. New York: Aldine de Gruyter.
Goes, P. B. (2014). Big Data and IS Research. MIS Quarterly, 38(3), pp. iii-viii.
Goodnight, J. (2015). The impact of business analytics on performance and profitability.
Retrieved June 22, 2016 from http://resources.idgenterprise.com/original/AST-0033108_56067_insights_BA_Goodnight.pdf.
Harvard Business Review Analytics Report. (2012). The Evolution of Decision Making: How Leading Organizations Are Adopting a Data-Driven Culture. Retrieved June 22, 2016 from https://hbr.org/resources/pdfs/tools/17568_
HBR_SAS%20Report_webview.pdf.
Howson, C. (2008). Successful Business Intelligence: Secrets to Making BI a Killer App. McGraw-Hill Osborne Media.
Hu, D., Zhao, J. L., Hua, Z., & Wong, M. C. (2012). Network-based modeling and analysis of systemic risk in banking systems. MIS Quarterly, 36(4), 1269-1291.
IBM. (2013). What will we make of this moment? 2013 IBM Annual Report. Retrieved June 22, 2016 from https://www.ibm.com/annualreport/2013/bin/assets/2013_ibm_annual.pdf.
Imhoff, C. (2004). Business Intelligence – Five factors for success. Retrieved June 22, 2016 from http://www.b-eye-network.co.uk/view/252.
Lau, R. Y., Liao, S. S., Wong, K. F., & Chiu, D. K. (2012). Web 2.0 environmental scanning and adaptive decision support for business mergers and acquisitions. MIS Quarterly, 36(4), 1239-1268.
LaValle, S., Lesser, E., Shockley, R., Hopkins, M.
S. & Kruschwitz, N. (2011). Big Data, Analytics and the Path from Insights to Value. MIT Sloan Management Review, 52(2), 21-
31.
Lee, A. S., & Baskerville, R. L. (2003). Generalizing Generalizability in Information Systems Research. Information Systems Research, 14(3), pp 221-243.
Leonard-Barton, D. & Deschamps, I. (1988).
Managerial influence in the implementation of new technology. Management Science 34 (10), 1252-1265.
Lincoln, Y. S., & Guba, E. G. (1985). Naturalistic inquiry. Sage Publications, Inc.
McKinsey. (2011). Big data: The next frontier for innovation, competition, and productivity. Retrieved June 22, 2016 from http://www.mckinsey.com/insights/business_technology/big_data_the_next_frontier_for_innovation.
Orlikowski, W. J. (1993). CASE Tools as Organizational Change: Investigating Incremental and Radical Changes in Systems Development. MIS Quarterly, 17(3), 309-
340.
Park, S. H., Huh, S. Y., Oh, W., & Han, S. P. (2012). A social network-based inference model for validating customer profile data. MIS Quarterly, 36(4), 1217-1237.
Pearlson, K. E., & Saunders, C. S. (2013). Managing & Using Information Systems: A Strategic Approach. Wiley.
Popovič, A., Hackney, R., Coelho, P. S., & Jaklič, J. (2012). Towards business intelligence systems success: Effects of maturity and culture on analytical decision making. Decision Support Systems, 54(1), 729-739.
Sahoo, N., Singh, P. V., & Mukhopadhyay, T.
(2012) A Hidden Markov Model for Collaborative Filtering. MIS Quarterly, 36(4), 1329-1356.
Strauss, A. L., & Corbin, J. (2008). Basics of Qualitative Research: Grounded Theory Procedures and Techniques. 3rd Ed. Newbury Park, CA: Sage
Stubbs, E. (2011). The value of business analytics: Identifying the path to profitability. Cary, North Carolina: SAS Institute Inc.
Turner, B.A. (1983). The Use of Grounded Theory
for the Qualitative Analysis of Organizational Behaviour. Journal of Management Studies, 20(3), 333-348.
Yeoh, W., & Koronios, A. (2010). Critical success
factors for business intelligence systems. Journal of computer information systems, 50(3), 23-32.
Yin, R. K. (2009). Case Study Research - Design and Methods Sage Publications, Thousand
Oaks.
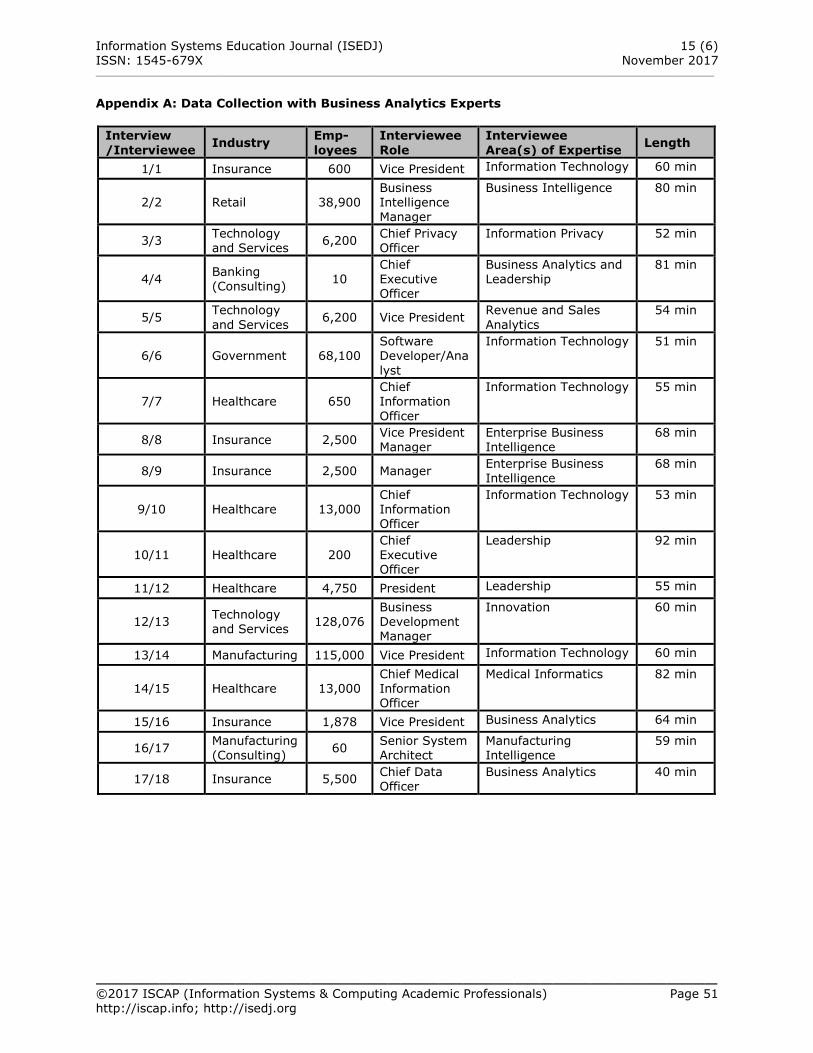
Information Systems Education Journal (ISEDJ) 15 (6) ISSN: 1545-679X November 2017 __________________________________________________________________________________________________________________________
_________________________________________________ ©2017 ISCAP (Information Systems & Computing Academic Professionals) Page 51 http://iscap.info; http://isedj.org
Appendix A: Data Collection with Business Analytics Experts
Interview
/Interviewee Industry
Emp-
loyees
Interviewee
Role
Interviewee
Area(s) of Expertise Length
1/1 Insurance 600 Vice President Information Technology 60 min
2/2 Retail 38,900 Business Intelligence Manager
Business Intelligence 80 min
3/3 Technology and Services
6,200 Chief Privacy Officer
Information Privacy 52 min
4/4 Banking (Consulting)
10 Chief Executive Officer
Business Analytics and Leadership
81 min
5/5 Technology
and Services 6,200 Vice President
Revenue and Sales
Analytics
54 min
6/6 Government 68,100 Software Developer/Ana
lyst
Information Technology 51 min
7/7 Healthcare 650 Chief Information
Officer
Information Technology 55 min
8/8 Insurance 2,500 Vice President Manager
Enterprise Business Intelligence
68 min
8/9 Insurance 2,500 Manager Enterprise Business Intelligence
68 min
9/10 Healthcare 13,000 Chief Information Officer
Information Technology 53 min
10/11 Healthcare 200 Chief Executive Officer
Leadership 92 min
11/12 Healthcare 4,750 President Leadership 55 min
12/13 Technology and Services
128,076 Business Development Manager
Innovation 60 min
13/14 Manufacturing 115,000 Vice President Information Technology 60 min
14/15 Healthcare 13,000 Chief Medical Information Officer
Medical Informatics 82 min
15/16 Insurance 1,878 Vice President Business Analytics 64 min
16/17 Manufacturing (Consulting)
60 Senior System Architect
Manufacturing Intelligence
59 min
17/18 Insurance 5,500 Chief Data Officer
Business Analytics 40 min
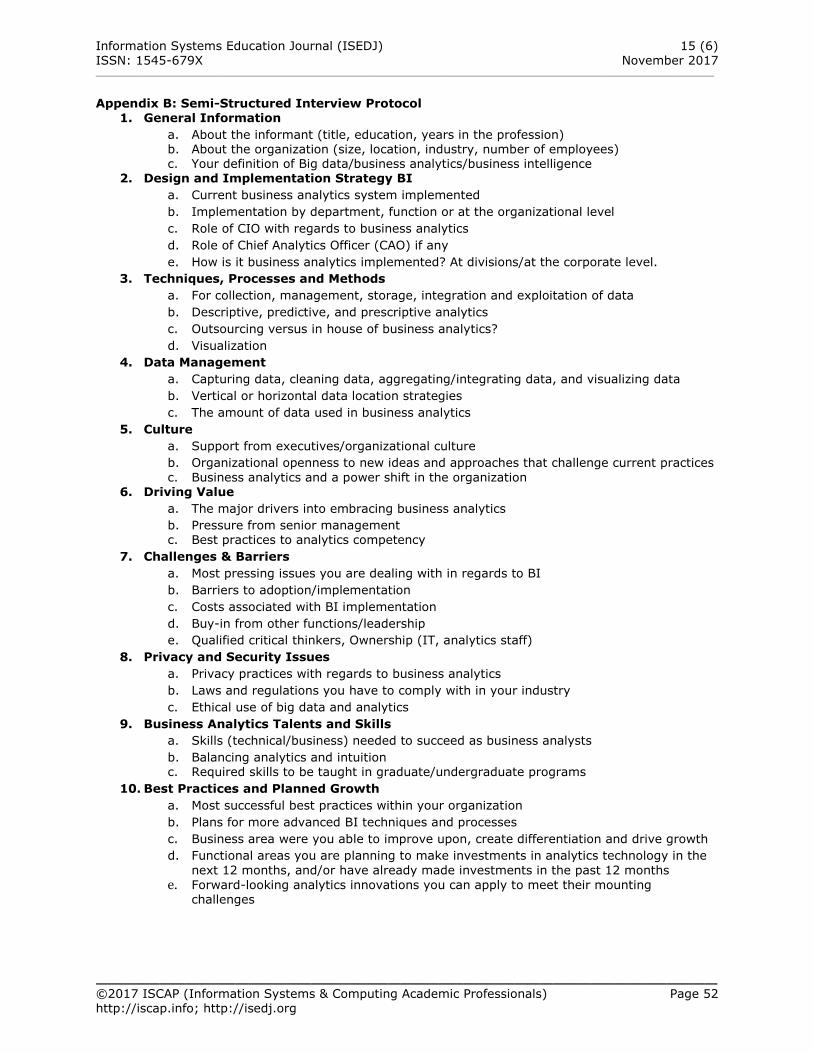
Information Systems Education Journal (ISEDJ) 15 (6) ISSN: 1545-679X November 2017 __________________________________________________________________________________________________________________________
_________________________________________________ ©2017 ISCAP (Information Systems & Computing Academic Professionals) Page 52 http://iscap.info; http://isedj.org
Appendix B: Semi-Structured Interview Protocol
1. General Information
a. About the informant (title, education, years in the profession) b. About the organization (size, location, industry, number of employees) c. Your definition of Big data/business analytics/business intelligence
2. Design and Implementation Strategy BI
a. Current business analytics system implemented
b. Implementation by department, function or at the organizational level
c. Role of CIO with regards to business analytics
d. Role of Chief Analytics Officer (CAO) if any
e. How is it business analytics implemented? At divisions/at the corporate level.
3. Techniques, Processes and Methods
a. For collection, management, storage, integration and exploitation of data
b. Descriptive, predictive, and prescriptive analytics
c. Outsourcing versus in house of business analytics?
d. Visualization
4. Data Management
a. Capturing data, cleaning data, aggregating/integrating data, and visualizing data
b. Vertical or horizontal data location strategies
c. The amount of data used in business analytics
5. Culture
a. Support from executives/organizational culture
b. Organizational openness to new ideas and approaches that challenge current practices
c. Business analytics and a power shift in the organization 6. Driving Value
a. The major drivers into embracing business analytics
b. Pressure from senior management c. Best practices to analytics competency
7. Challenges & Barriers
a. Most pressing issues you are dealing with in regards to BI
b. Barriers to adoption/implementation
c. Costs associated with BI implementation
d. Buy-in from other functions/leadership
e. Qualified critical thinkers, Ownership (IT, analytics staff)
8. Privacy and Security Issues
a. Privacy practices with regards to business analytics
b. Laws and regulations you have to comply with in your industry
c. Ethical use of big data and analytics
9. Business Analytics Talents and Skills
a. Skills (technical/business) needed to succeed as business analysts
b. Balancing analytics and intuition c. Required skills to be taught in graduate/undergraduate programs
10. Best Practices and Planned Growth
a. Most successful best practices within your organization
b. Plans for more advanced BI techniques and processes
c. Business area were you able to improve upon, create differentiation and drive growth
d. Functional areas you are planning to make investments in analytics technology in the
next 12 months, and/or have already made investments in the past 12 months
e. Forward-looking analytics innovations you can apply to meet their mounting challenges
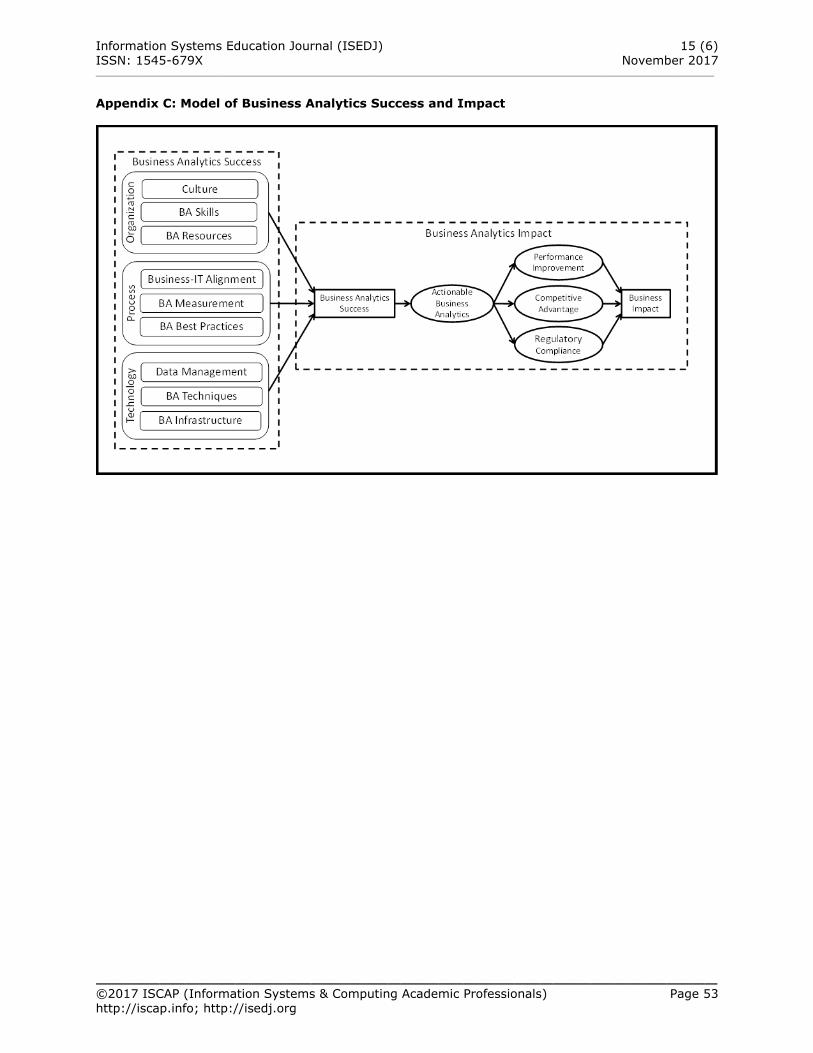
Information Systems Education Journal (ISEDJ) 15 (6) ISSN: 1545-679X November 2017 __________________________________________________________________________________________________________________________
_________________________________________________ ©2017 ISCAP (Information Systems & Computing Academic Professionals) Page 53 http://iscap.info; http://isedj.org
Appendix C: Model of Business Analytics Success and Impact
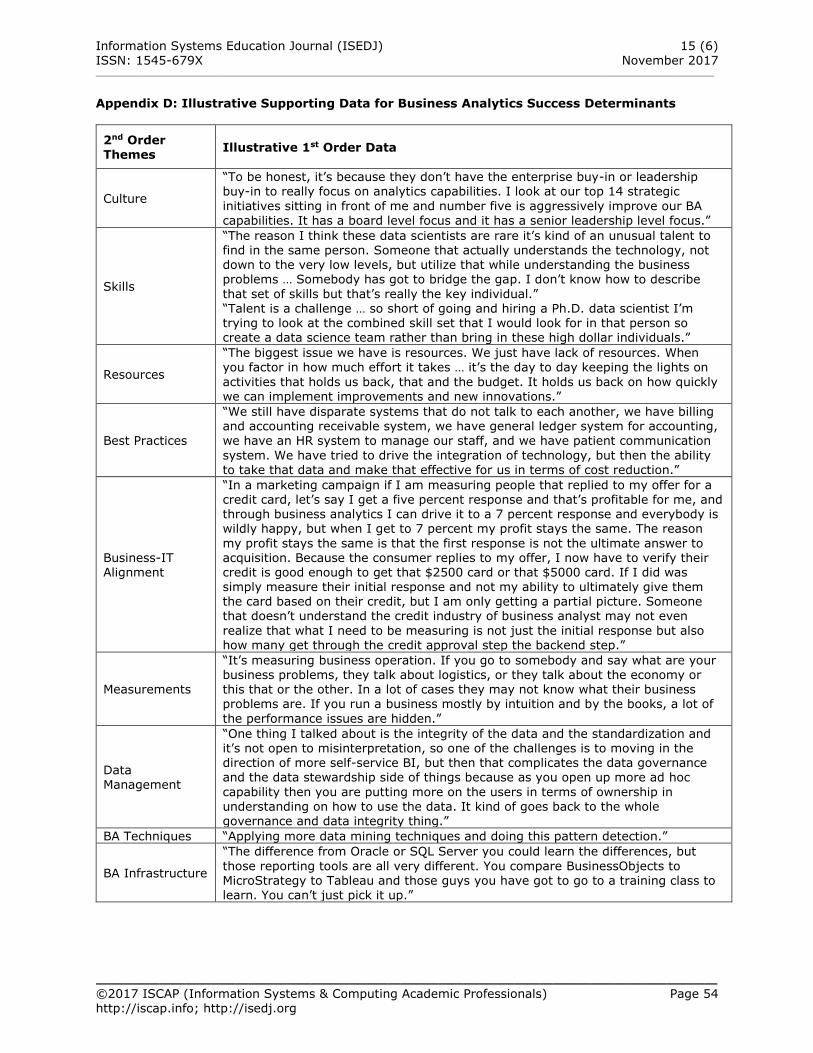
Information Systems Education Journal (ISEDJ) 15 (6) ISSN: 1545-679X November 2017 __________________________________________________________________________________________________________________________
_________________________________________________ ©2017 ISCAP (Information Systems & Computing Academic Professionals) Page 54 http://iscap.info; http://isedj.org
Appendix D: Illustrative Supporting Data for Business Analytics Success Determinants
2nd Order Themes
Illustrative 1st Order Data
Culture
“To be honest, it’s because they don’t have the enterprise buy-in or leadership buy-in to really focus on analytics capabilities. I look at our top 14 strategic
initiatives sitting in front of me and number five is aggressively improve our BA capabilities. It has a board level focus and it has a senior leadership level focus.”
Skills
“The reason I think these data scientists are rare it’s kind of an unusual talent to find in the same person. Someone that actually understands the technology, not down to the very low levels, but utilize that while understanding the business problems … Somebody has got to bridge the gap. I don’t know how to describe
that set of skills but that’s really the key individual.” “Talent is a challenge … so short of going and hiring a Ph.D. data scientist I’m trying to look at the combined skill set that I would look for in that person so create a data science team rather than bring in these high dollar individuals.”
Resources
“The biggest issue we have is resources. We just have lack of resources. When you factor in how much effort it takes … it’s the day to day keeping the lights on
activities that holds us back, that and the budget. It holds us back on how quickly we can implement improvements and new innovations.”
Best Practices
“We still have disparate systems that do not talk to each another, we have billing and accounting receivable system, we have general ledger system for accounting, we have an HR system to manage our staff, and we have patient communication
system. We have tried to drive the integration of technology, but then the ability to take that data and make that effective for us in terms of cost reduction.”
Business-IT
Alignment
“In a marketing campaign if I am measuring people that replied to my offer for a credit card, let’s say I get a five percent response and that’s profitable for me, and through business analytics I can drive it to a 7 percent response and everybody is wildly happy, but when I get to 7 percent my profit stays the same. The reason
my profit stays the same is that the first response is not the ultimate answer to acquisition. Because the consumer replies to my offer, I now have to verify their
credit is good enough to get that $2500 card or that $5000 card. If I did was simply measure their initial response and not my ability to ultimately give them the card based on their credit, but I am only getting a partial picture. Someone that doesn’t understand the credit industry of business analyst may not even
realize that what I need to be measuring is not just the initial response but also how many get through the credit approval step the backend step.”
Measurements
“It’s measuring business operation. If you go to somebody and say what are your business problems, they talk about logistics, or they talk about the economy or this that or the other. In a lot of cases they may not know what their business problems are. If you run a business mostly by intuition and by the books, a lot of
the performance issues are hidden.”
Data Management
“One thing I talked about is the integrity of the data and the standardization and it’s not open to misinterpretation, so one of the challenges is to moving in the direction of more self-service BI, but then that complicates the data governance and the data stewardship side of things because as you open up more ad hoc
capability then you are putting more on the users in terms of ownership in
understanding on how to use the data. It kind of goes back to the whole governance and data integrity thing.”
BA Techniques “Applying more data mining techniques and doing this pattern detection.”
BA Infrastructure
“The difference from Oracle or SQL Server you could learn the differences, but
those reporting tools are all very different. You compare BusinessObjects to MicroStrategy to Tableau and those guys you have got to go to a training class to learn. You can’t just pick it up.”
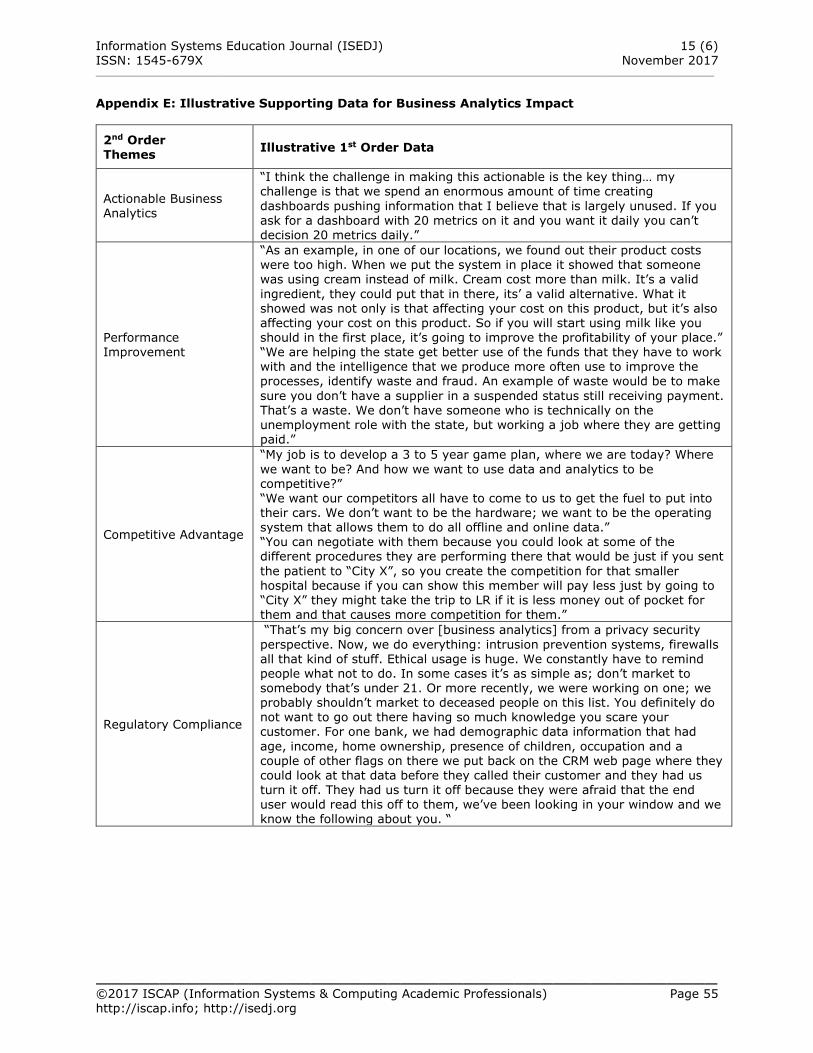
Information Systems Education Journal (ISEDJ) 15 (6) ISSN: 1545-679X November 2017 __________________________________________________________________________________________________________________________
_________________________________________________ ©2017 ISCAP (Information Systems & Computing Academic Professionals) Page 55 http://iscap.info; http://isedj.org
Appendix E: Illustrative Supporting Data for Business Analytics Impact
2nd Order Themes
Illustrative 1st Order Data
Actionable Business Analytics
“I think the challenge in making this actionable is the key thing… my challenge is that we spend an enormous amount of time creating
dashboards pushing information that I believe that is largely unused. If you ask for a dashboard with 20 metrics on it and you want it daily you can’t decision 20 metrics daily.”
Performance
Improvement
“As an example, in one of our locations, we found out their product costs were too high. When we put the system in place it showed that someone was using cream instead of milk. Cream cost more than milk. It’s a valid
ingredient, they could put that in there, its’ a valid alternative. What it showed was not only is that affecting your cost on this product, but it’s also affecting your cost on this product. So if you will start using milk like you should in the first place, it’s going to improve the profitability of your place.”
“We are helping the state get better use of the funds that they have to work with and the intelligence that we produce more often use to improve the processes, identify waste and fraud. An example of waste would be to make
sure you don’t have a supplier in a suspended status still receiving payment. That’s a waste. We don’t have someone who is technically on the unemployment role with the state, but working a job where they are getting paid.”
Competitive Advantage
“My job is to develop a 3 to 5 year game plan, where we are today? Where
we want to be? And how we want to use data and analytics to be competitive?” “We want our competitors all have to come to us to get the fuel to put into their cars. We don’t want to be the hardware; we want to be the operating system that allows them to do all offline and online data.” “You can negotiate with them because you could look at some of the different procedures they are performing there that would be just if you sent
the patient to “City X”, so you create the competition for that smaller hospital because if you can show this member will pay less just by going to “City X” they might take the trip to LR if it is less money out of pocket for them and that causes more competition for them.”
Regulatory Compliance
“That’s my big concern over [business analytics] from a privacy security
perspective. Now, we do everything: intrusion prevention systems, firewalls all that kind of stuff. Ethical usage is huge. We constantly have to remind people what not to do. In some cases it’s as simple as; don’t market to somebody that’s under 21. Or more recently, we were working on one; we probably shouldn’t market to deceased people on this list. You definitely do not want to go out there having so much knowledge you scare your customer. For one bank, we had demographic data information that had
age, income, home ownership, presence of children, occupation and a couple of other flags on there we put back on the CRM web page where they could look at that data before they called their customer and they had us turn it off. They had us turn it off because they were afraid that the end
user would read this off to them, we’ve been looking in your window and we know the following about you. “
Information Systems Education Journal (ISEDJ) 15 (6) ISSN: 1545-679X November 2017 __________________________________________________________________________________________________________________________
_________________________________________________ ©2017 ISCAP (Information Systems & Computing Academic Professionals) Page 56 http://iscap.info; http://isedj.org
RateMyInformationSystemsProfessor: Exploring
the factors that influence student ratings
Mark Sena
Elaine Crable
Department of Management Information Systems Williams College of Business
Xavier University Cincinnati, OH 45207-1215, USA
Abstract
Based on 820 entries on Ratemyprofessors.com, we explore whether information systems course ratings differ from those in marketing or management courses, whether lower level course ratings differ from those in senior or graduate level courses, whether course ratings differ between genders, and whether perceived course difficulty impacts course ratings. Our findings did not reveal significant differences between information systems and other subjects. However we did find a substantial relationship between perceived course difficulty and overall course ratings. Rating differences between genders and
across course levels was not found to be statistically significant for information systems courses given our sample size. Keywords: student evaluations, university teaching, ratemyprofessors.com, student opinion
1. INTRODUCTION
The evaluation of faculty teaching by students has been occurring for decades. It remains a major consideration as a measure of teaching effectiveness and quite often a major decision in promotion and tenure for faculty. These have
typically been evaluations based on written forms filled out anonymously by the students in a classroom with controlled processes (Cashin,
1995; Centra, 2003). This research on student evaluation of faculty was extended by a number of authors (Otto, Sandford, Jr. & Ross, 2008; Bleske-Rechek & Michels, 2010; Felton, Mitchell,
& Stinson, 2004) when a different source of evaluation came on the scene with the World Wide Web. Online faculty rating sites included in the early 2000s were RateMyProfessors.com, PassCollege.com, ProfessorPerformance.com, RatingsOnline.com and Reviewum.com (Foster,
2003). RateMyProfessors.com (RMP) has been
the most enduring and most used site while the others have lost their popularity over the past decade. RMP is a student review site, founded in May 1999 by John Swapceinski, a software engineer from
Menlo Park, California. RMP allows college and university students to assign ratings to professors in America, Canada, and United
Kingdom institutions. The RateMyProfessor (RMP) site was originally launched as TeacherRatings.com and converted to RateMyProfessors.com in 2001. According to RMP
it has been around for over a decade and as of July 2016 it contained 8,000+ schools and 1.4 million rated professors with over 15 million student ratings. RMP has altered the landscape of information available to students and claims to be the biggest online listing of faculty ratings. This
Information Systems Education Journal (ISEDJ) 15 (6) ISSN: 1545-679X November 2017 __________________________________________________________________________________________________________________________
_________________________________________________ ©2017 ISCAP (Information Systems & Computing Academic Professionals) Page 57 http://iscap.info; http://isedj.org
site allows students to assign numeric ratings to
instructors for Easiness, Clarity, and Helpfulness and the latter two scores become averaged to provide a rating of Overall Professor Quality.
Past research on RMP has primarily focused on the reliability and validity of the information posted at the site and the results have been mixed. Some research has indicated that students just focus on the exceptionally good or exceptionally poor faculty (Kindred & Mohammed,
2005) while other research has indicated students focus on issues unrelated to learning like course difficulty or workload (Davison & Price, 2009) plus faculty sexiness (Silva K, Silva F, Quin, Draper, Cover & Munoff, 2008). Even with all this one study found that RMP had reasonable correlations
with traditional in-class evaluations (Coladarci & Komfield, 2007). Regardless of the validity or reliability of RMP’s results, students still flock to the site to make course selection decisions. Kindred and Mohammed (2005) found that students used RMP
frequently to discover what other students had to say about a professor in order to use it for course selection purposes and also found there was a jump in frequency of use around registration times. The students reported that it was a good way to evaluate a potential instructor without having to talk to numerous other students and
advisors to find out similar useful information.
The Hayes and Prus (2014) study found that students look for reliable and useful information to help them make course selection decisions and their study suggested that students believed that
RMP was as useful and reliable as more traditional sources. While their data indicated that students do critically evaluate sources and the information these provide, that information may be biased by factors that students are not aware, such as halo effects and difficulty bias, and therefore, could be less valid. A confounding issue when using RMP
for course selection was discussed by Felton et al., (2004). They found that RMP ratings could be affected by perceived difficulty. The perceived easier instructors received higher scores on
Helpfulness, Clarity, and Overall Quality ratings. Since students perceive these ratings to be useful and reliable when making course selection,
difficulty may indirectly affect course selection decisions. In addition, students who read the negative reviews on RMP often will form less positive expectancies for a course, which could result in less effort on the part of the students in selected courses (Kowai-Bell et al., 2011).
2. FACTORS AFFECTING STUDENT
OPINIONS As briefly mentioned in this Introduction,
research has found that students are affected by a number of factors when selecting courses. Students wants courses that will fit their schedule but gender has always been a significant factor (Wilson, Stocking, & Goldstein, 1994) and students also have preferred instructors considered to be extroverted (Radmacher &
Martin, 2001) and sexy (Silva et al., 2008). Other researchers have found students consider factors like course difficulty and workload (Davison & Price, 2009) to be important. Babad & Tayeb (2003) found that students will choose more difficult courses if the evaluations indicated a high
level of perceived learning value even if the course was considered difficult. RMP gives students access to the type of information they seek within the qualitative student comment area as well as in the quantitative course evaluation area. Hayes and
Prus (2014) found in their study that students believe that RMP is as useful and reliable as more traditional sources such as other students and their advisors. They found that the students consider all the available information, weighing numeric averages equally with any anecdotal comments. Students use the evidence to make
course selections regardless of any bias being posted by others. Interestingly, one study found
that RMP correlated quite well with traditional in-class evaluations (Coladarci & Kornfeld, 2007) so the students might be using relatively valid in-class evaluations for their course selections.
3. RESEARCH QUESTIONS AND METHODOLOGY
Student evaluations have come under fire for their potential unreliability in measuring teaching effectiveness (Boring et al, 2016). In addition to the potential for gender bias, some faculty
perceive that student evaluations may vary according to subject matter or the degree of rigor imposed by the instructor. Information systems
courses are a requirement for business degrees in nearly every AACSB accredited undergraduate degree program. Faculty may believe that students who are required to take a particular
course may be less interested in the material. In addition, due to computer anxiety and the inherent challenges of teaching information systems to students with varying degrees of skill and aptitude, faculty may feel that strong student evaluations may be more difficult to achieve in
introductory or core classes.
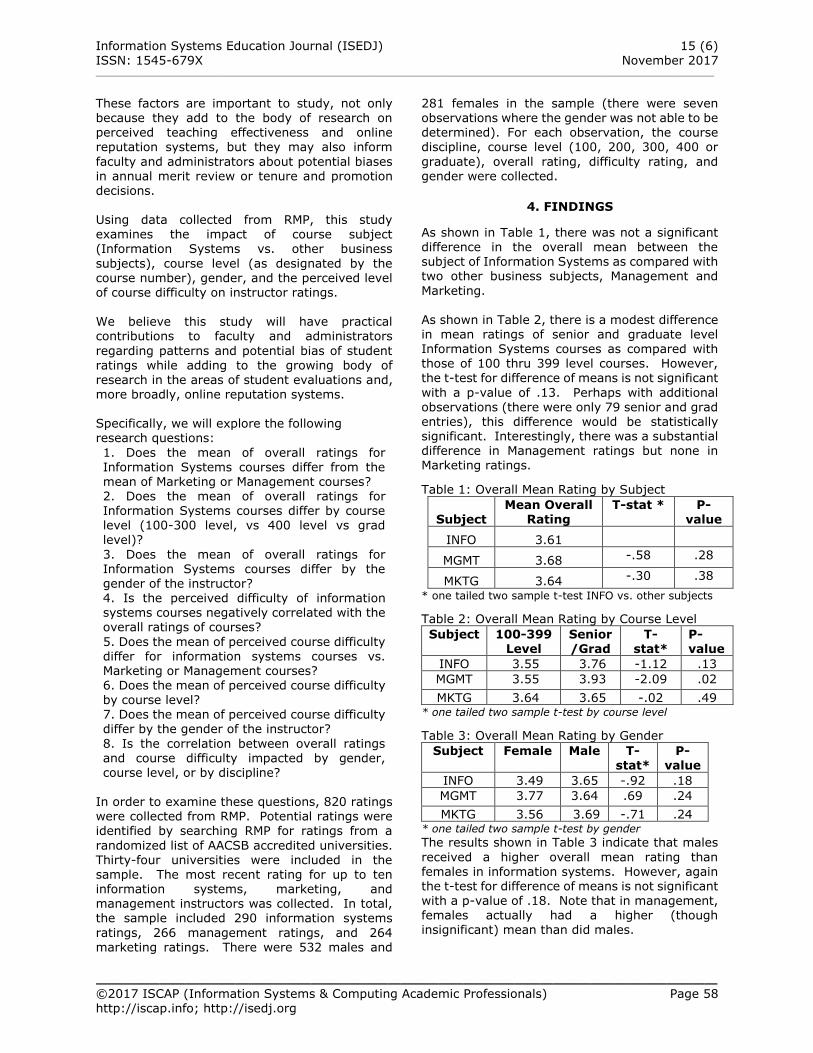
Information Systems Education Journal (ISEDJ) 15 (6) ISSN: 1545-679X November 2017 __________________________________________________________________________________________________________________________
_________________________________________________ ©2017 ISCAP (Information Systems & Computing Academic Professionals) Page 58 http://iscap.info; http://isedj.org
These factors are important to study, not only
because they add to the body of research on perceived teaching effectiveness and online reputation systems, but they may also inform
faculty and administrators about potential biases in annual merit review or tenure and promotion decisions. Using data collected from RMP, this study examines the impact of course subject (Information Systems vs. other business
subjects), course level (as designated by the course number), gender, and the perceived level of course difficulty on instructor ratings. We believe this study will have practical contributions to faculty and administrators
regarding patterns and potential bias of student ratings while adding to the growing body of research in the areas of student evaluations and, more broadly, online reputation systems. Specifically, we will explore the following research questions:
1. Does the mean of overall ratings for Information Systems courses differ from the mean of Marketing or Management courses? 2. Does the mean of overall ratings for Information Systems courses differ by course level (100-300 level, vs 400 level vs grad level)?
3. Does the mean of overall ratings for Information Systems courses differ by the
gender of the instructor? 4. Is the perceived difficulty of information systems courses negatively correlated with the overall ratings of courses?
5. Does the mean of perceived course difficulty differ for information systems courses vs. Marketing or Management courses? 6. Does the mean of perceived course difficulty by course level? 7. Does the mean of perceived course difficulty differ by the gender of the instructor?
8. Is the correlation between overall ratings and course difficulty impacted by gender, course level, or by discipline?
In order to examine these questions, 820 ratings were collected from RMP. Potential ratings were identified by searching RMP for ratings from a
randomized list of AACSB accredited universities. Thirty-four universities were included in the sample. The most recent rating for up to ten information systems, marketing, and management instructors was collected. In total, the sample included 290 information systems
ratings, 266 management ratings, and 264 marketing ratings. There were 532 males and
281 females in the sample (there were seven
observations where the gender was not able to be determined). For each observation, the course discipline, course level (100, 200, 300, 400 or
graduate), overall rating, difficulty rating, and gender were collected.
4. FINDINGS
As shown in Table 1, there was not a significant difference in the overall mean between the subject of Information Systems as compared with two other business subjects, Management and
Marketing. As shown in Table 2, there is a modest difference in mean ratings of senior and graduate level
Information Systems courses as compared with those of 100 thru 399 level courses. However, the t-test for difference of means is not significant
with a p-value of .13. Perhaps with additional observations (there were only 79 senior and grad entries), this difference would be statistically significant. Interestingly, there was a substantial difference in Management ratings but none in Marketing ratings.
Table 1: Overall Mean Rating by Subject
Subject Mean Overall
Rating T-stat * P-
value
INFO 3.61
MGMT 3.68 -.58 .28
MKTG 3.64 -.30 .38
* one tailed two sample t-test INFO vs. other subjects
Table 2: Overall Mean Rating by Course Level
Subject 100-399 Level
Senior/Grad
T-stat*
P-value
INFO 3.55 3.76 -1.12 .13
MGMT 3.55 3.93 -2.09 .02
MKTG 3.64 3.65 -.02 .49 * one tailed two sample t-test by course level
Table 3: Overall Mean Rating by Gender
Subject Female Male T-stat*
P-value
INFO 3.49 3.65 -.92 .18
MGMT 3.77 3.64 .69 .24
MKTG 3.56 3.69 -.71 .24 * one tailed two sample t-test by gender
The results shown in Table 3 indicate that males
received a higher overall mean rating than females in information systems. However, again the t-test for difference of means is not significant with a p-value of .18. Note that in management, females actually had a higher (though insignificant) mean than did males.
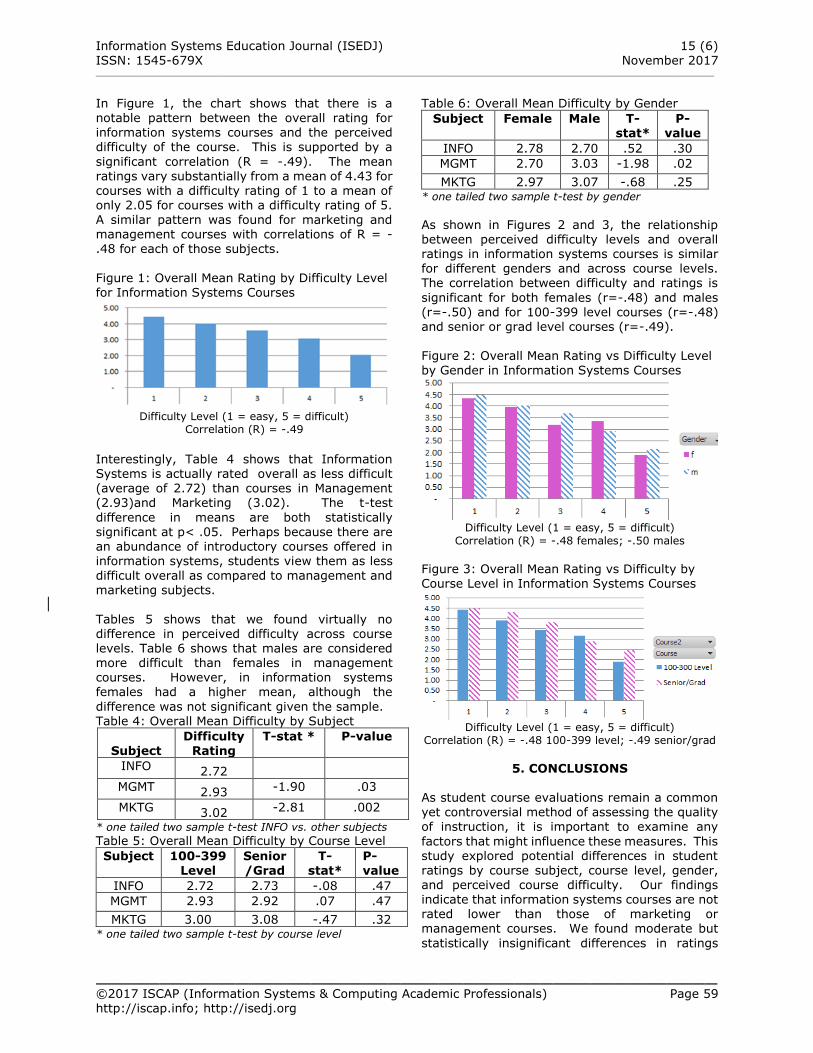
Information Systems Education Journal (ISEDJ) 15 (6) ISSN: 1545-679X November 2017 __________________________________________________________________________________________________________________________
_________________________________________________ ©2017 ISCAP (Information Systems & Computing Academic Professionals) Page 59 http://iscap.info; http://isedj.org
In Figure 1, the chart shows that there is a
notable pattern between the overall rating for information systems courses and the perceived difficulty of the course. This is supported by a
significant correlation (R = -.49). The mean ratings vary substantially from a mean of 4.43 for courses with a difficulty rating of 1 to a mean of only 2.05 for courses with a difficulty rating of 5. A similar pattern was found for marketing and management courses with correlations of R = -.48 for each of those subjects.
Figure 1: Overall Mean Rating by Difficulty Level for Information Systems Courses
Difficulty Level (1 = easy, 5 = difficult)
Correlation (R) = -.49
Interestingly, Table 4 shows that Information Systems is actually rated overall as less difficult (average of 2.72) than courses in Management (2.93)and Marketing (3.02). The t-test
difference in means are both statistically significant at p< .05. Perhaps because there are an abundance of introductory courses offered in information systems, students view them as less
difficult overall as compared to management and marketing subjects.
Tables 5 shows that we found virtually no difference in perceived difficulty across course levels. Table 6 shows that males are considered more difficult than females in management courses. However, in information systems females had a higher mean, although the
difference was not significant given the sample. Table 4: Overall Mean Difficulty by Subject
Subject Difficulty
Rating T-stat * P-value
INFO 2.72
MGMT 2.93 -1.90 .03
MKTG 3.02 -2.81 .002
* one tailed two sample t-test INFO vs. other subjects
Table 5: Overall Mean Difficulty by Course Level
Subject 100-399 Level
Senior/Grad
T-stat*
P-value
INFO 2.72 2.73 -.08 .47
MGMT 2.93 2.92 .07 .47
MKTG 3.00 3.08 -.47 .32 * one tailed two sample t-test by course level
Table 6: Overall Mean Difficulty by Gender
Subject Female Male T-stat*
P-value
INFO 2.78 2.70 .52 .30
MGMT 2.70 3.03 -1.98 .02
MKTG 2.97 3.07 -.68 .25 * one tailed two sample t-test by gender
As shown in Figures 2 and 3, the relationship between perceived difficulty levels and overall ratings in information systems courses is similar for different genders and across course levels. The correlation between difficulty and ratings is
significant for both females (r=-.48) and males (r=-.50) and for 100-399 level courses (r=-.48) and senior or grad level courses (r=-.49).
Figure 2: Overall Mean Rating vs Difficulty Level by Gender in Information Systems Courses
Difficulty Level (1 = easy, 5 = difficult)
Correlation (R) = -.48 females; -.50 males
Figure 3: Overall Mean Rating vs Difficulty by
Course Level in Information Systems Courses
Difficulty Level (1 = easy, 5 = difficult)
Correlation (R) = -.48 100-399 level; -.49 senior/grad
5. CONCLUSIONS
As student course evaluations remain a common
yet controversial method of assessing the quality of instruction, it is important to examine any
factors that might influence these measures. This study explored potential differences in student ratings by course subject, course level, gender, and perceived course difficulty. Our findings indicate that information systems courses are not rated lower than those of marketing or management courses. We found moderate but
statistically insignificant differences in ratings
Information Systems Education Journal (ISEDJ) 15 (6) ISSN: 1545-679X November 2017 __________________________________________________________________________________________________________________________
_________________________________________________ ©2017 ISCAP (Information Systems & Computing Academic Professionals) Page 60 http://iscap.info; http://isedj.org
across different course levels and gender. We did
find a substantial relationship between perceived course difficulty and student ratings. In terms of course difficulty, our findings indicated that
information systems courses were viewed as less difficult than those of marketing and management courses. There were little differences in perceived difficulty between course levels and gender. The significant negative correlation between perceived course difficulty and course ratings was consistent across course
levels and different genders. This study provides evidence to support or refute some anecdotal claims by instructors regarding student ratings. The claim that information systems courses are harder or rated lower as
compared to marketing or management courses was not supported. Conversely, our study would support any claim that a more difficult class results in lower student ratings. Any claim regarding course level and gender bias in student evaluations should require addition study as there were not statistically significant results in this
study given the sample sizes. This study has some inherent limitations given the use of RMP as a means of data collection. Clearly RMP data could suffer from non-response bias and lack of controls for the subject pool. While we collected a large overall sample size of
820 observations, when broken down by subject, class level, gender, and difficulty levels, some
measurements could have used additional observations to better examine the effects. This study could certainly be extended to other course subjects or to measure additional effects such as
course subjects within information systems, demographic differences (age, ethnicity, etc,) of instructors, research productivity of faculty, and many other potentially interesting factors that may influence student ratings.
6. REFERENCES
Babad, E. & Tayeb, A. (2003). Experimental
analysis of students’ course selection. British Journal of Educational Psychology, 73, 373-
393. doi: 10.1348/000709903322275894 . Bleske-Rechek, A. & Kelsey Michels (2010)
Ratemyprofessors.com: testing assumptions about student use and misuse. Practical Assessment, Research & Evaluation. 15, no. 5: 1-11.
Boring, A., Ottoboni, K., & Stark, Ph. B. (2016).
Student evaluations of teaching (mostly) do not measure teaching effectiveness.
ScienceOpen Research.
https://www.scienceopen.com/document/vid/818d8ec0-5908-47d8-86b4-5dc38f04b23e
Cashin, W. (1995) Student ratings of teaching: the research revisited. Idea Paper No. 32, Center for Faculty Evaluation and Development, Kansas State University.
Centra, J. A. (2003) Will teachers receive higher
student evaluation by giving higher grades
and less course work? Research in Higher Education, 44, no. 5: 495-518.
Coladarci, T., & Komfield, I. (2007).
RateMyProfessors.com versus formal in-class
student evaluations of teaching. Practical
Assessment, Research & Evaluations, 12(6)
www.pareonline.net/getvn.asp?v=12&n=6 Davison, E., & Price, J. (2009). How do we rate?
An evaluation of online student evaluations.
Assessment & Evaluation in Higher Education, 34, 51-65.
Felton, J., Mitchell, J., & Stinson, M. (2004). Web-based student evaluations of professors: The relations between perceived quality, easiness and sexiness. Assessment & Evaluation in Higher Education, 29, 91-108. doi:
10.1080/0260293032000158180
Foster, A. (2003). Picking apart pick-a-prof: does the popular online service help students find good professors, or jut easy A’s? Chronicle of Higher Education 49, no. 26: A33-34.
Hayes, M. W. & J. Prus (2014). Student use of quantitative and qualitative information on ratemyprofessors.com for course selection. College Student Journal; Winter 2014, 48, No 4, 675-688.
Kindred, J., & Mohammed, S. N. (2005). He will
crush you like an academic ninja!: Exploring teacher ratings on Ratemyprofessors.com. Journal of Computer-Mediated
Communication, 10 (3), article 9. Retrieved from: http://jcmc.indiana.edu/vol 10/issue3/ kindred.html
Kowai-Bell, N., Guadagno, R. E., Little, T., Preiss,
N., & Hensley, R. (2011). Rate my expectations: How online evaluations of professors impact students' perceived control. Computers in Human Behavior, 27, 1862-1867.

Information Systems Education Journal (ISEDJ) 15 (6) ISSN: 1545-679X November 2017 __________________________________________________________________________________________________________________________
_________________________________________________ ©2017 ISCAP (Information Systems & Computing Academic Professionals) Page 61 http://iscap.info; http://isedj.org
Otto, J., A.S. Sandford, Jr., and N. Ross (2008)
Does ratemyrofessor.com really rate my professor? Assessment & Evaluation in Higher Education, 33, no. 4: 355-368.
Silva, K. M., Silva, F. J., Quinn, M. A., Draper, J.
N., Cover, K. R., & Munofif, A. A. (2008). Rate
my professor: Online evaluations of
psychology instructors. Teaching of
Psychology, 35, 71-80

Information Systems Education Journal (ISEDJ) 15 (6) ISSN: 1545-679X November 2017 __________________________________________________________________________________________________________________________
_________________________________________________ ©2017 ISCAP (Information Systems & Computing Academic Professionals) Page 62 http://iscap.info; http://isedj.org
Grounding IS Design Education in the First
Principles of a Designerly Way of Knowing
Waguepack, Leslie J.
Computer Information Systems Bentley University
Waltham, MA 02452
Babb, Jeffry, S. [email protected]
Computer Information Systems West Texas State A&M University
Canyon, Texas 79016
Abstract
“The Golden Age of Design may finally be upon us!” or so reported the New York Times in September of 2014. On the one hand everyday personal information appliances emphasized beauty and function. Apple™ took a lead by marketing the “feeling” of the iPod’s design. The business world took notice and
the cachet of designers soared both in terms of demand and compensation. Regrettably, the “golden age of design” has not swept the Information Systems (IS) discipline along with it. News stories weekly
report huge project cost overruns, long delayed delivery dates, and complete project failures with irretrievable sunk costs. What explains the difference? Perhaps IS has not yet embraced the design mindset founded in professions prefixed by: architectural, fashion, industrial, graphic, product, urban, and interior. We examine the mindset of design professionals all but absent in IS education. This mindset
fuels the enthusiasm for agile development methodologies. Appropriating it may be a relatively inexpensive re-centering of current IS pedagogy that can pay huge dividends for society down the road as information systems grow more and more essential throughout the commercial and private sectors. We explore this design mindset following Nigel Cross’s retrospective on research in Designerly Ways of Knowing. With that as a frame we name five core elements of that mindset to frame IS pedagogy for design – First Principles of a Designerly Way of Knowing and propose guidelines for situating them in IS education.
Keywords: IS design education, design pedagogy, tacit knowing, design theory, first principles of design
1. INTRODUCTION The tenets upon which the information systems,
IS, discipline rests are the pillars upon which our curriculum and pedagogy rest, and the lens we apply to stakeholders and constituents. IS as Davis and Olson (1985) characterize it is fairly canonical: the nexus of computer science, management and organizational theory,
operations research, and accounting. Each of these disciplines has a “spanning” influence
raising a broad range of concerns that overarch computing in its social context.
Computing and information systems continue to be a dominant force in the daily life – a diffusing and diffuse innovation (Rogers & Shoemaker, 1971). The pervasive and ubiquitous aspect of computing and information systems is both a backdrop (Carr, 2003; Lyytinen and Yoo, 2002)
as well as an acute driver of societal change (Bernstein at al., 2010). Despite the near
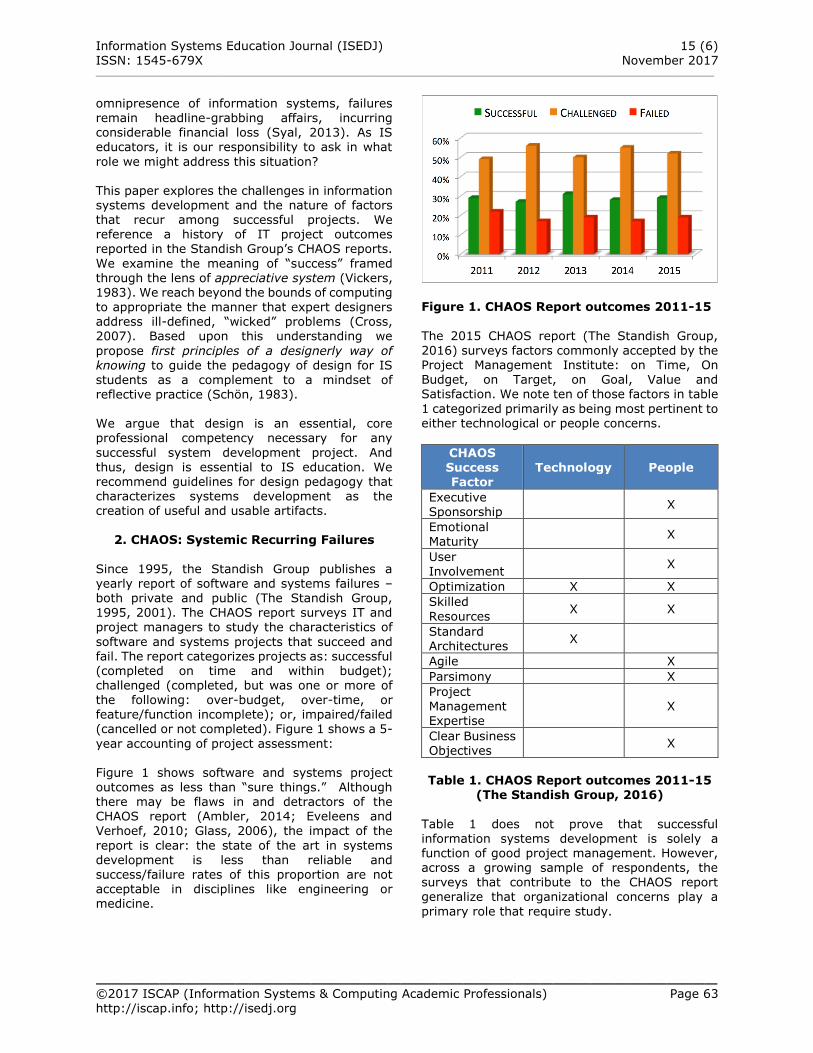
Information Systems Education Journal (ISEDJ) 15 (6) ISSN: 1545-679X November 2017 __________________________________________________________________________________________________________________________
_________________________________________________ ©2017 ISCAP (Information Systems & Computing Academic Professionals) Page 63 http://iscap.info; http://isedj.org
omnipresence of information systems, failures
remain headline-grabbing affairs, incurring considerable financial loss (Syal, 2013). As IS educators, it is our responsibility to ask in what
role we might address this situation? This paper explores the challenges in information systems development and the nature of factors that recur among successful projects. We reference a history of IT project outcomes reported in the Standish Group’s CHAOS reports.
We examine the meaning of “success” framed through the lens of appreciative system (Vickers, 1983). We reach beyond the bounds of computing to appropriate the manner that expert designers address ill-defined, “wicked” problems (Cross, 2007). Based upon this understanding we
propose first principles of a designerly way of knowing to guide the pedagogy of design for IS students as a complement to a mindset of reflective practice (Schön, 1983). We argue that design is an essential, core professional competency necessary for any
successful system development project. And thus, design is essential to IS education. We recommend guidelines for design pedagogy that characterizes systems development as the creation of useful and usable artifacts.
2. CHAOS: Systemic Recurring Failures
Since 1995, the Standish Group publishes a
yearly report of software and systems failures – both private and public (The Standish Group, 1995, 2001). The CHAOS report surveys IT and project managers to study the characteristics of
software and systems projects that succeed and fail. The report categorizes projects as: successful (completed on time and within budget); challenged (completed, but was one or more of the following: over-budget, over-time, or feature/function incomplete); or, impaired/failed (cancelled or not completed). Figure 1 shows a 5-
year accounting of project assessment: Figure 1 shows software and systems project outcomes as less than “sure things.” Although
there may be flaws in and detractors of the CHAOS report (Ambler, 2014; Eveleens and Verhoef, 2010; Glass, 2006), the impact of the
report is clear: the state of the art in systems development is less than reliable and success/failure rates of this proportion are not acceptable in disciplines like engineering or medicine.
Figure 1. CHAOS Report outcomes 2011-15
The 2015 CHAOS report (The Standish Group,
2016) surveys factors commonly accepted by the Project Management Institute: on Time, On Budget, on Target, on Goal, Value and Satisfaction. We note ten of those factors in table
1 categorized primarily as being most pertinent to either technological or people concerns.
CHAOS Success Factor
Technology People
Executive Sponsorship
X
Emotional Maturity
X
User
Involvement X
Optimization X X
Skilled
Resources X X
Standard Architectures
X
Agile X
Parsimony X
Project Management Expertise
X
Clear Business Objectives
X
Table 1. CHAOS Report outcomes 2011-15
(The Standish Group, 2016)
Table 1 does not prove that successful information systems development is solely a function of good project management. However, across a growing sample of respondents, the surveys that contribute to the CHAOS report generalize that organizational concerns play a
primary role that require study.
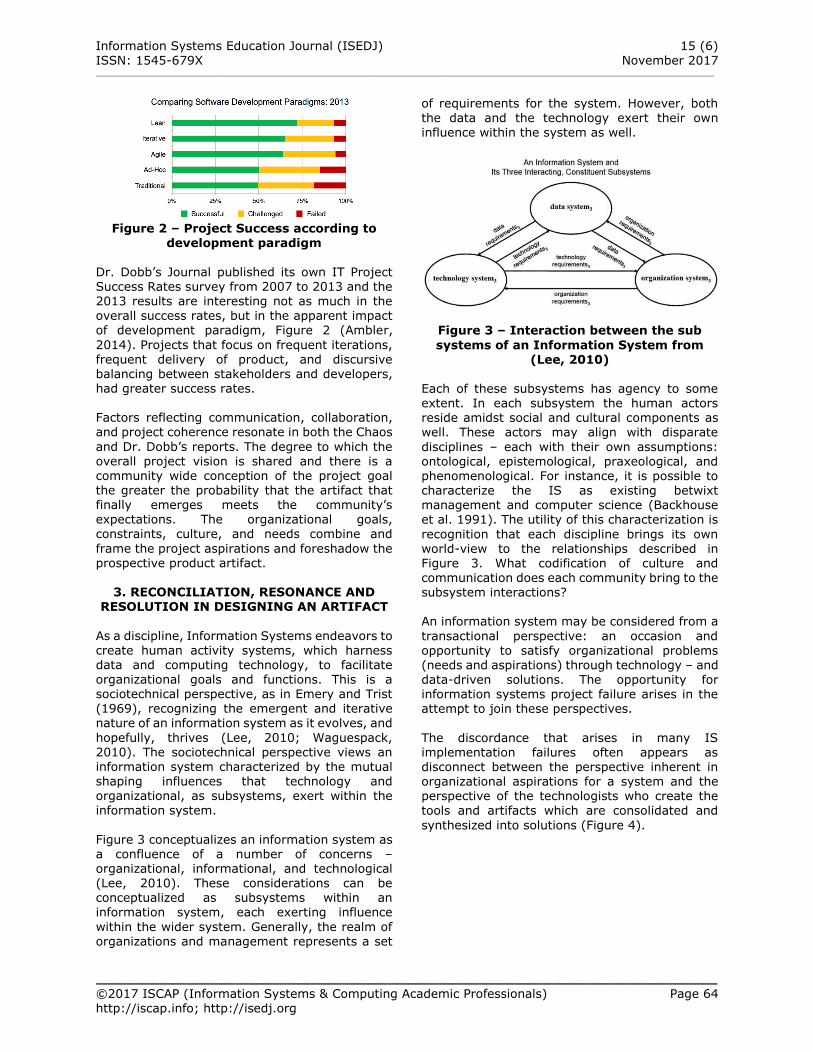
Information Systems Education Journal (ISEDJ) 15 (6) ISSN: 1545-679X November 2017 __________________________________________________________________________________________________________________________
_________________________________________________ ©2017 ISCAP (Information Systems & Computing Academic Professionals) Page 64 http://iscap.info; http://isedj.org
Figure 2 – Project Success according to
development paradigm
Dr. Dobb’s Journal published its own IT Project Success Rates survey from 2007 to 2013 and the 2013 results are interesting not as much in the overall success rates, but in the apparent impact of development paradigm, Figure 2 (Ambler,
2014). Projects that focus on frequent iterations, frequent delivery of product, and discursive balancing between stakeholders and developers, had greater success rates. Factors reflecting communication, collaboration, and project coherence resonate in both the Chaos
and Dr. Dobb’s reports. The degree to which the overall project vision is shared and there is a community wide conception of the project goal the greater the probability that the artifact that finally emerges meets the community’s expectations. The organizational goals, constraints, culture, and needs combine and
frame the project aspirations and foreshadow the prospective product artifact.
3. RECONCILIATION, RESONANCE AND
RESOLUTION IN DESIGNING AN ARTIFACT
As a discipline, Information Systems endeavors to create human activity systems, which harness data and computing technology, to facilitate organizational goals and functions. This is a sociotechnical perspective, as in Emery and Trist (1969), recognizing the emergent and iterative nature of an information system as it evolves, and
hopefully, thrives (Lee, 2010; Waguespack, 2010). The sociotechnical perspective views an information system characterized by the mutual shaping influences that technology and organizational, as subsystems, exert within the
information system.
Figure 3 conceptualizes an information system as a confluence of a number of concerns – organizational, informational, and technological (Lee, 2010). These considerations can be conceptualized as subsystems within an information system, each exerting influence
within the wider system. Generally, the realm of organizations and management represents a set
of requirements for the system. However, both
the data and the technology exert their own influence within the system as well.
Figure 3 – Interaction between the sub
systems of an Information System from (Lee, 2010)
Each of these subsystems has agency to some extent. In each subsystem the human actors reside amidst social and cultural components as well. These actors may align with disparate
disciplines – each with their own assumptions: ontological, epistemological, praxeological, and phenomenological. For instance, it is possible to characterize the IS as existing betwixt management and computer science (Backhouse et al. 1991). The utility of this characterization is
recognition that each discipline brings its own world-view to the relationships described in Figure 3. What codification of culture and
communication does each community bring to the subsystem interactions? An information system may be considered from a
transactional perspective: an occasion and opportunity to satisfy organizational problems (needs and aspirations) through technology – and data-driven solutions. The opportunity for information systems project failure arises in the attempt to join these perspectives.
The discordance that arises in many IS implementation failures often appears as disconnect between the perspective inherent in organizational aspirations for a system and the perspective of the technologists who create the
tools and artifacts which are consolidated and
synthesized into solutions (Figure 4).
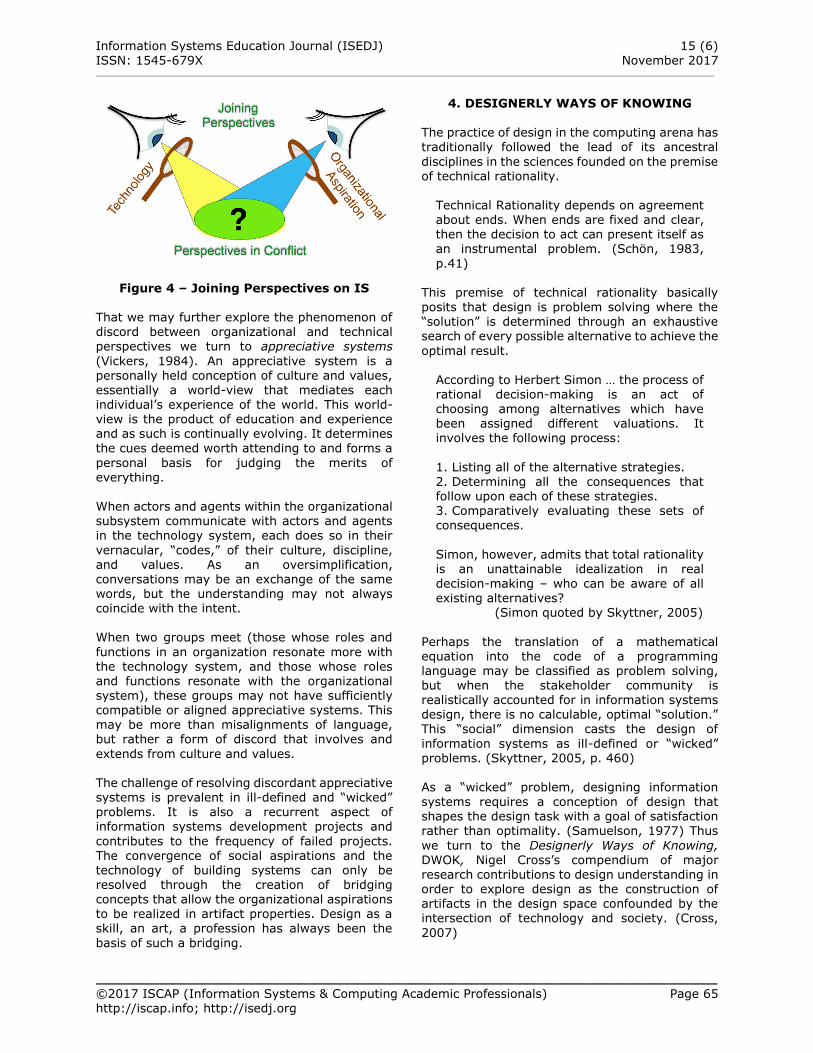
Information Systems Education Journal (ISEDJ) 15 (6) ISSN: 1545-679X November 2017 __________________________________________________________________________________________________________________________
_________________________________________________ ©2017 ISCAP (Information Systems & Computing Academic Professionals) Page 65 http://iscap.info; http://isedj.org
Figure 4 – Joining Perspectives on IS That we may further explore the phenomenon of discord between organizational and technical
perspectives we turn to appreciative systems
(Vickers, 1984). An appreciative system is a personally held conception of culture and values, essentially a world-view that mediates each individual’s experience of the world. This world-view is the product of education and experience and as such is continually evolving. It determines the cues deemed worth attending to and forms a
personal basis for judging the merits of everything. When actors and agents within the organizational subsystem communicate with actors and agents in the technology system, each does so in their
vernacular, “codes,” of their culture, discipline, and values. As an oversimplification,
conversations may be an exchange of the same words, but the understanding may not always coincide with the intent. When two groups meet (those whose roles and
functions in an organization resonate more with the technology system, and those whose roles and functions resonate with the organizational system), these groups may not have sufficiently compatible or aligned appreciative systems. This may be more than misalignments of language, but rather a form of discord that involves and
extends from culture and values. The challenge of resolving discordant appreciative systems is prevalent in ill-defined and “wicked”
problems. It is also a recurrent aspect of information systems development projects and
contributes to the frequency of failed projects. The convergence of social aspirations and the technology of building systems can only be resolved through the creation of bridging concepts that allow the organizational aspirations to be realized in artifact properties. Design as a skill, an art, a profession has always been the
basis of such a bridging.
4. DESIGNERLY WAYS OF KNOWING
The practice of design in the computing arena has traditionally followed the lead of its ancestral
disciplines in the sciences founded on the premise of technical rationality.
Technical Rationality depends on agreement about ends. When ends are fixed and clear, then the decision to act can present itself as an instrumental problem. (Schön, 1983,
p.41) This premise of technical rationality basically posits that design is problem solving where the “solution” is determined through an exhaustive search of every possible alternative to achieve the
optimal result.
According to Herbert Simon … the process of rational decision-making is an act of choosing among alternatives which have been assigned different valuations. It involves the following process:
1. Listing all of the alternative strategies. 2. Determining all the consequences that follow upon each of these strategies. 3. Comparatively evaluating these sets of consequences.
Simon, however, admits that total rationality is an unattainable idealization in real
decision-making – who can be aware of all existing alternatives?
(Simon quoted by Skyttner, 2005)
Perhaps the translation of a mathematical equation into the code of a programming language may be classified as problem solving, but when the stakeholder community is realistically accounted for in information systems design, there is no calculable, optimal “solution.” This “social” dimension casts the design of
information systems as ill-defined or “wicked” problems. (Skyttner, 2005, p. 460) As a “wicked” problem, designing information
systems requires a conception of design that shapes the design task with a goal of satisfaction rather than optimality. (Samuelson, 1977) Thus
we turn to the Designerly Ways of Knowing, DWOK, Nigel Cross’s compendium of major research contributions to design understanding in order to explore design as the construction of artifacts in the design space confounded by the intersection of technology and society. (Cross,
2007)
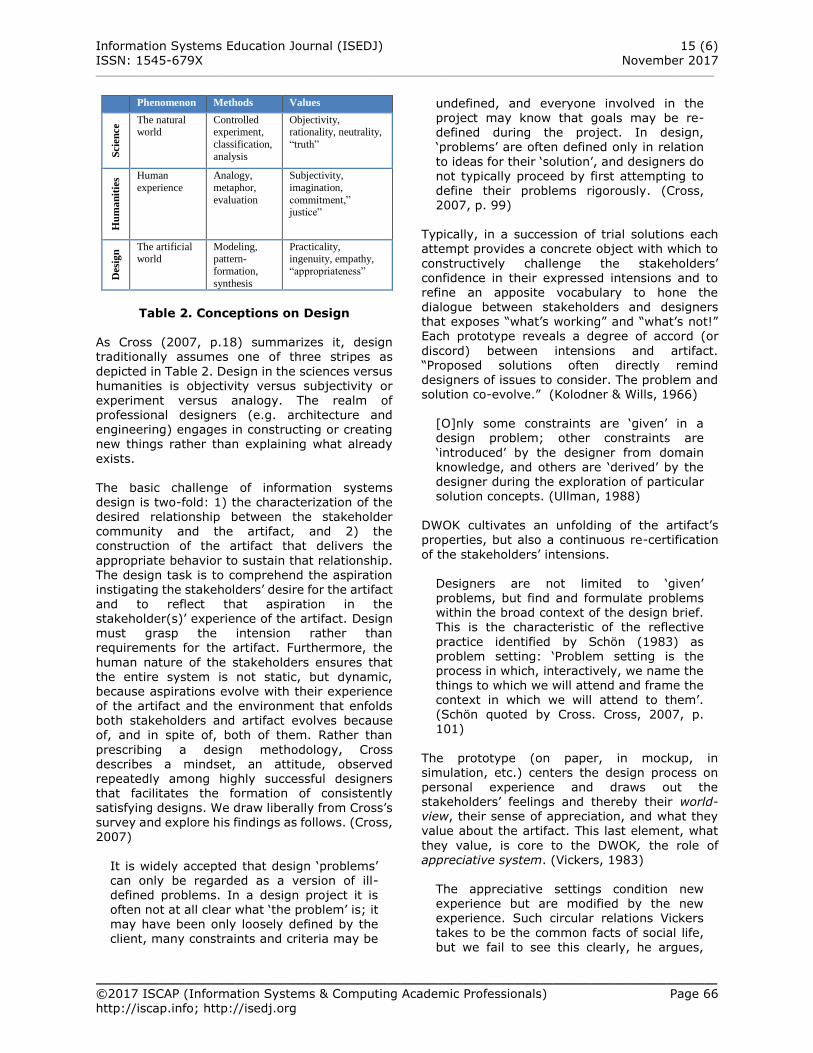
Information Systems Education Journal (ISEDJ) 15 (6) ISSN: 1545-679X November 2017 __________________________________________________________________________________________________________________________
_________________________________________________ ©2017 ISCAP (Information Systems & Computing Academic Professionals) Page 66 http://iscap.info; http://isedj.org
Phenomenon Methods Values
Scie
nce
The natural world
Controlled experiment,
classification,
analysis
Objectivity, rationality, neutrality,
“truth”
Hu
ma
nit
ies Human
experience
Analogy,
metaphor,
evaluation
Subjectivity,
imagination, commitment,” justice”
Desi
gn
The artificial world
Modeling, pattern-
formation,
synthesis
Practicality, ingenuity, empathy,
“appropriateness”
Table 2. Conceptions on Design
As Cross (2007, p.18) summarizes it, design traditionally assumes one of three stripes as
depicted in Table 2. Design in the sciences versus humanities is objectivity versus subjectivity or experiment versus analogy. The realm of professional designers (e.g. architecture and engineering) engages in constructing or creating new things rather than explaining what already
exists. The basic challenge of information systems design is two-fold: 1) the characterization of the desired relationship between the stakeholder community and the artifact, and 2) the construction of the artifact that delivers the
appropriate behavior to sustain that relationship.
The design task is to comprehend the aspiration instigating the stakeholders’ desire for the artifact and to reflect that aspiration in the stakeholder(s)’ experience of the artifact. Design must grasp the intension rather than requirements for the artifact. Furthermore, the
human nature of the stakeholders ensures that the entire system is not static, but dynamic, because aspirations evolve with their experience of the artifact and the environment that enfolds both stakeholders and artifact evolves because of, and in spite of, both of them. Rather than
prescribing a design methodology, Cross describes a mindset, an attitude, observed repeatedly among highly successful designers that facilitates the formation of consistently
satisfying designs. We draw liberally from Cross’s survey and explore his findings as follows. (Cross, 2007)
It is widely accepted that design ‘problems’ can only be regarded as a version of ill-defined problems. In a design project it is often not at all clear what ‘the problem’ is; it may have been only loosely defined by the client, many constraints and criteria may be
undefined, and everyone involved in the
project may know that goals may be re-defined during the project. In design, ‘problems’ are often defined only in relation
to ideas for their ‘solution’, and designers do not typically proceed by first attempting to define their problems rigorously. (Cross, 2007, p. 99)
Typically, in a succession of trial solutions each attempt provides a concrete object with which to
constructively challenge the stakeholders’ confidence in their expressed intensions and to refine an apposite vocabulary to hone the dialogue between stakeholders and designers that exposes “what’s working” and “what’s not!” Each prototype reveals a degree of accord (or
discord) between intensions and artifact. “Proposed solutions often directly remind designers of issues to consider. The problem and solution co-evolve.” (Kolodner & Wills, 1966)
[O]nly some constraints are ‘given’ in a design problem; other constraints are
‘introduced’ by the designer from domain knowledge, and others are ‘derived’ by the designer during the exploration of particular solution concepts. (Ullman, 1988)
DWOK cultivates an unfolding of the artifact’s properties, but also a continuous re-certification
of the stakeholders’ intensions.
Designers are not limited to ‘given’ problems, but find and formulate problems within the broad context of the design brief. This is the characteristic of the reflective
practice identified by Schön (1983) as problem setting: ‘Problem setting is the process in which, interactively, we name the things to which we will attend and frame the context in which we will attend to them’. (Schön quoted by Cross. Cross, 2007, p. 101)
The prototype (on paper, in mockup, in simulation, etc.) centers the design process on personal experience and draws out the
stakeholders’ feelings and thereby their world-view, their sense of appreciation, and what they value about the artifact. This last element, what
they value, is core to the DWOK, the role of appreciative system. (Vickers, 1983)
The appreciative settings condition new experience but are modified by the new experience. Such circular relations Vickers
takes to be the common facts of social life, but we fail to see this clearly, he argues,
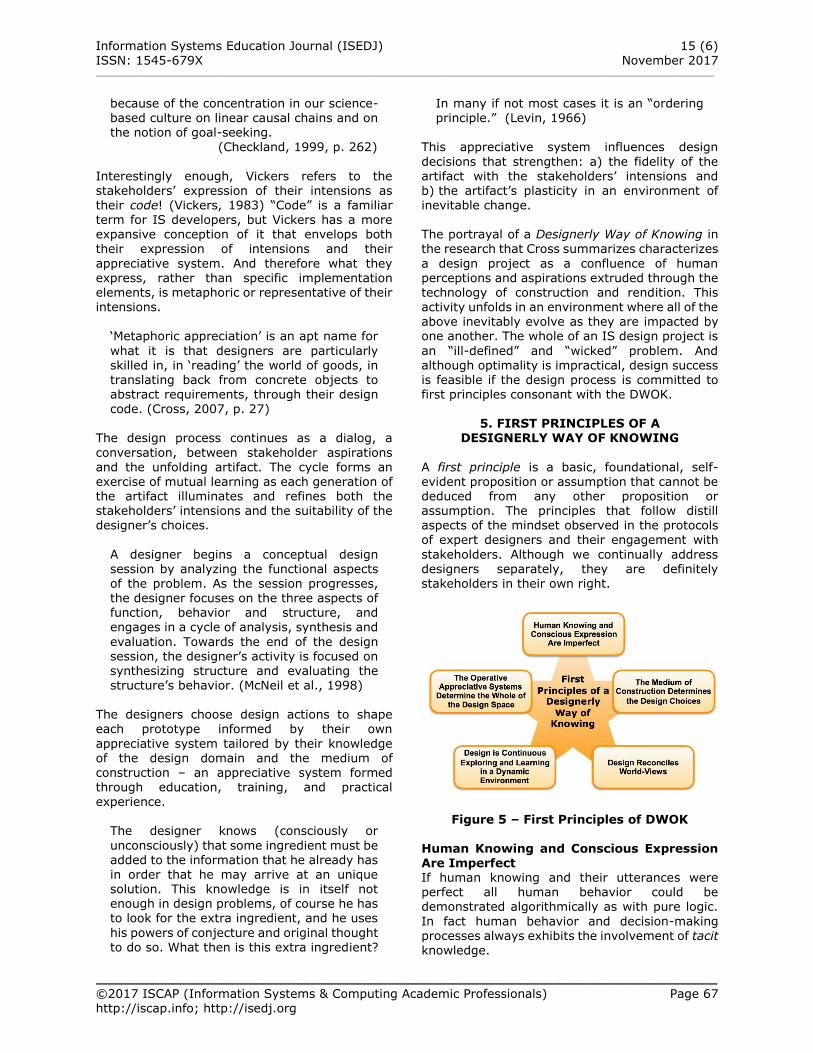
Information Systems Education Journal (ISEDJ) 15 (6) ISSN: 1545-679X November 2017 __________________________________________________________________________________________________________________________
_________________________________________________ ©2017 ISCAP (Information Systems & Computing Academic Professionals) Page 67 http://iscap.info; http://isedj.org
because of the concentration in our science-
based culture on linear causal chains and on the notion of goal-seeking.
(Checkland, 1999, p. 262)
Interestingly enough, Vickers refers to the stakeholders’ expression of their intensions as their code! (Vickers, 1983) “Code” is a familiar term for IS developers, but Vickers has a more expansive conception of it that envelops both their expression of intensions and their
appreciative system. And therefore what they express, rather than specific implementation elements, is metaphoric or representative of their intensions.
‘Metaphoric appreciation’ is an apt name for
what it is that designers are particularly skilled in, in ‘reading’ the world of goods, in translating back from concrete objects to abstract requirements, through their design code. (Cross, 2007, p. 27)
The design process continues as a dialog, a
conversation, between stakeholder aspirations and the unfolding artifact. The cycle forms an exercise of mutual learning as each generation of the artifact illuminates and refines both the stakeholders’ intensions and the suitability of the designer’s choices.
A designer begins a conceptual design session by analyzing the functional aspects
of the problem. As the session progresses, the designer focuses on the three aspects of function, behavior and structure, and engages in a cycle of analysis, synthesis and
evaluation. Towards the end of the design session, the designer’s activity is focused on synthesizing structure and evaluating the structure’s behavior. (McNeil et al., 1998)
The designers choose design actions to shape each prototype informed by their own
appreciative system tailored by their knowledge of the design domain and the medium of construction – an appreciative system formed through education, training, and practical
experience.
The designer knows (consciously or
unconsciously) that some ingredient must be added to the information that he already has in order that he may arrive at an unique solution. This knowledge is in itself not enough in design problems, of course he has to look for the extra ingredient, and he uses
his powers of conjecture and original thought to do so. What then is this extra ingredient?
In many if not most cases it is an “ordering
principle.” (Levin, 1966) This appreciative system influences design
decisions that strengthen: a) the fidelity of the artifact with the stakeholders’ intensions and b) the artifact’s plasticity in an environment of inevitable change. The portrayal of a Designerly Way of Knowing in the research that Cross summarizes characterizes
a design project as a confluence of human perceptions and aspirations extruded through the technology of construction and rendition. This activity unfolds in an environment where all of the above inevitably evolve as they are impacted by one another. The whole of an IS design project is
an “ill-defined” and “wicked” problem. And although optimality is impractical, design success is feasible if the design process is committed to first principles consonant with the DWOK.
5. FIRST PRINCIPLES OF A DESIGNERLY WAY OF KNOWING
A first principle is a basic, foundational, self-evident proposition or assumption that cannot be deduced from any other proposition or assumption. The principles that follow distill aspects of the mindset observed in the protocols of expert designers and their engagement with
stakeholders. Although we continually address designers separately, they are definitely
stakeholders in their own right.
Figure 5 – First Principles of DWOK Human Knowing and Conscious Expression Are Imperfect If human knowing and their utterances were perfect all human behavior could be demonstrated algorithmically as with pure logic.
In fact human behavior and decision-making processes always exhibits the involvement of tacit knowledge.
Information Systems Education Journal (ISEDJ) 15 (6) ISSN: 1545-679X November 2017 __________________________________________________________________________________________________________________________
_________________________________________________ ©2017 ISCAP (Information Systems & Computing Academic Professionals) Page 68 http://iscap.info; http://isedj.org
We marvel at the story of the firefighter who
has a sudden urge to escape a burning house just before it collapses, because the firefighter knows the danger intuitively,
‘without knowing how he knows:' However, we also do not know how we immediately know that a person we see as we enter a room is our friend Peter. The moral … is that the mystery of knowing without knowing is … the norm of mental life.
(Kahneman, 2011)
Kahneman’s interest in tacit knowing weaves throughout his study of human decision making in economics from choosing laundry products to assessing the reliability of financial institutions. The act of design continually engages tacit
knowing. Stakeholders [and designers] access their knowledge through explicit or tacit “knowing.” A stakeholder can specify/explain their explicit knowledge (i.e. knowledge acquired through formal education) and be aware of but, not be able to specify/explain
their tacit knowledge (i.e. knowledge acquired through their personal experience of “living”). This is the distinction between knowing “what” and knowing “how” (i.e. “We know more than we can tell”).
(Polanyi, 1966, Waguespack, 2016)
The fact of tacit knowing is the reason that design is as much art as science. The fact that all
possible alternatives cannot be known in advance is why technical rationality is a false model of human behavior. Description in metaphor is a constant channel for connecting with tacit
knowledge. And thus, a prime function of design is teasing out that knowledge. Although it may be tacit, it materially impacts the primary goal of design, satisfaction. The Operative Appreciative Systems Determine the Whole of the Design Space
Whether held explicitly or tacitly, stakeholders and designers apply a personally held appreciative system to their perception of the world. That appreciative system is in fact their
world-view. That view determines what cues they notice in their everyday activities and what properties of those experiences determine their
sense of approval or displeasure. To the extent that stakeholders share a background of culture, education, or life experience there may be significant accord across their appreciative systems. And where this shared background does not exist, design must build bridges to attain
“peaceful coexistence” or value resolution.
Design is Continuous Exploring and
Learning in a Dynamic Environment A central characteristic of both tacit knowing and appreciative systems is their continuous
evolution. Together they are a product of “living:” the life experience of the stakeholders, the designer(s), and “living” with the artifact. Change is continuous and ubiquitous. It occurs in the stakeholders’ environment through markets, government, politics, the changing community of stakeholders, etc. It occurs with the evolution of
technology: theory, communication, computation, etc. First and foremost, the stakeholders’ experience with the artifact of the design process itself changes everything. The design space is an ecosystem of mindsets, aspirations, and feedback.
One of the unique aspects of design behavior is the constant generation of new task goals and redefinition of task constraints. (Akin, 1979)
Accounts of the design activity repeatedly demonstrate that stakeholders’ aspirations
evolve, as does the nature of the artifact. “The problem and solution co-evolve.” (Kolodner & Wills, 1966) Indeed, this characteristic of organically evolving the artifact is a signature of agile development methodologies – “building lean:” only as much as is needed; when we know we need it.
The Medium of Construction Determines the
Design Choices Among the resources the designers bring to the design task is their skill with the medium of construction – the implements of fabrication,
prefabricated frameworks, vocabularies, and (most important of all) the seasoned practice of applying these tools in design projects. Here the designer is a “performer” in the vein of an accomplished musician, sports athlete, surgeon, painter, or sculptor. These performers achieve an internalization of their instrument, the bat or ball,
the scalpel, the brush, or the chisel. For the skilled performer it is as though the instrument becomes an extension of their own person – they know “what,” “why,” and “how” in the doing. They
are one with their craft.
When exercising a skill, we literally dwell in
the innumerable muscular acts which contribute to its purpose, a purpose which constitutes their joint meaning. Therefore, since all understanding is tacit knowing, all understanding is achieved by indwelling.
(Polanyi, 1969)
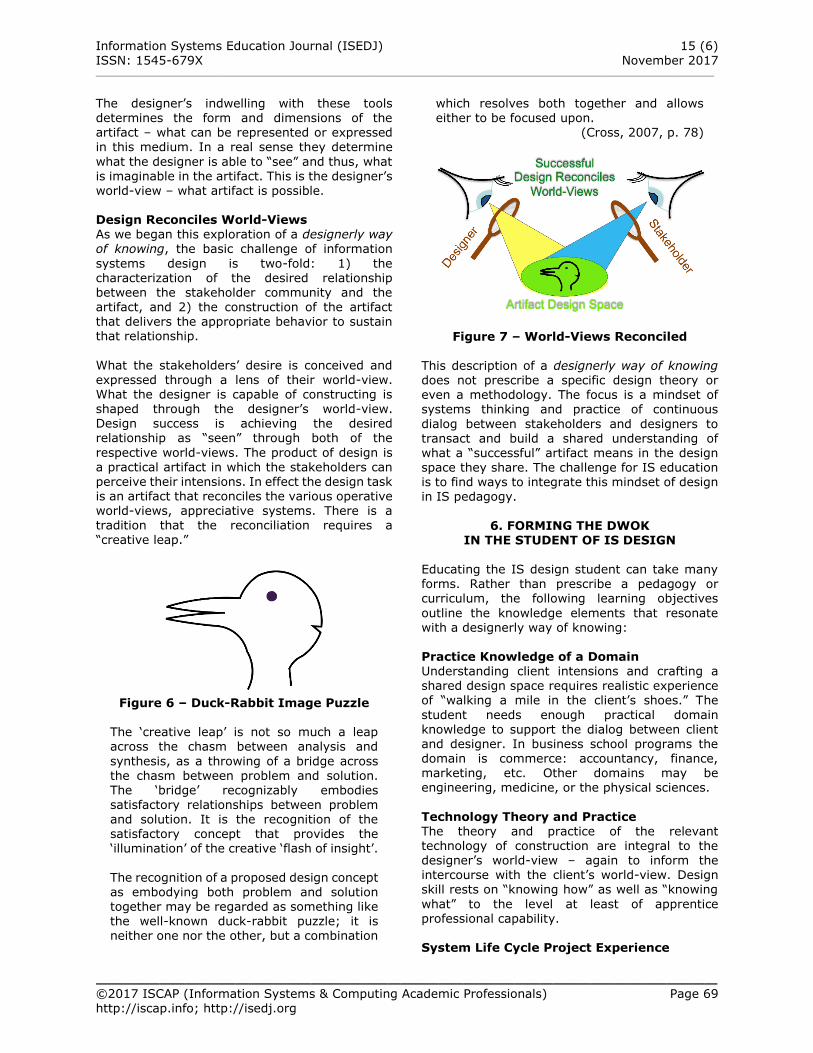
Information Systems Education Journal (ISEDJ) 15 (6) ISSN: 1545-679X November 2017 __________________________________________________________________________________________________________________________
_________________________________________________ ©2017 ISCAP (Information Systems & Computing Academic Professionals) Page 69 http://iscap.info; http://isedj.org
The designer’s indwelling with these tools
determines the form and dimensions of the artifact – what can be represented or expressed in this medium. In a real sense they determine
what the designer is able to “see” and thus, what is imaginable in the artifact. This is the designer’s world-view – what artifact is possible. Design Reconciles World-Views As we began this exploration of a designerly way of knowing, the basic challenge of information
systems design is two-fold: 1) the characterization of the desired relationship between the stakeholder community and the artifact, and 2) the construction of the artifact that delivers the appropriate behavior to sustain that relationship.
What the stakeholders’ desire is conceived and expressed through a lens of their world-view. What the designer is capable of constructing is shaped through the designer’s world-view. Design success is achieving the desired relationship as “seen” through both of the
respective world-views. The product of design is a practical artifact in which the stakeholders can perceive their intensions. In effect the design task is an artifact that reconciles the various operative world-views, appreciative systems. There is a tradition that the reconciliation requires a “creative leap.”
Figure 6 – Duck-Rabbit Image Puzzle
The ‘creative leap’ is not so much a leap across the chasm between analysis and
synthesis, as a throwing of a bridge across the chasm between problem and solution. The ‘bridge’ recognizably embodies
satisfactory relationships between problem and solution. It is the recognition of the satisfactory concept that provides the ‘illumination’ of the creative ‘flash of insight’.
The recognition of a proposed design concept as embodying both problem and solution together may be regarded as something like the well-known duck-rabbit puzzle; it is neither one nor the other, but a combination
which resolves both together and allows
either to be focused upon. (Cross, 2007, p. 78)
Figure 7 – World-Views Reconciled
This description of a designerly way of knowing does not prescribe a specific design theory or even a methodology. The focus is a mindset of systems thinking and practice of continuous
dialog between stakeholders and designers to transact and build a shared understanding of what a “successful” artifact means in the design space they share. The challenge for IS education is to find ways to integrate this mindset of design in IS pedagogy.
6. FORMING THE DWOK
IN THE STUDENT OF IS DESIGN Educating the IS design student can take many
forms. Rather than prescribe a pedagogy or curriculum, the following learning objectives
outline the knowledge elements that resonate with a designerly way of knowing: Practice Knowledge of a Domain Understanding client intensions and crafting a shared design space requires realistic experience of “walking a mile in the client’s shoes.” The
student needs enough practical domain knowledge to support the dialog between client and designer. In business school programs the domain is commerce: accountancy, finance, marketing, etc. Other domains may be engineering, medicine, or the physical sciences.
Technology Theory and Practice The theory and practice of the relevant technology of construction are integral to the designer’s world-view – again to inform the intercourse with the client’s world-view. Design skill rests on “knowing how” as well as “knowing
what” to the level at least of apprentice professional capability. System Life Cycle Project Experience
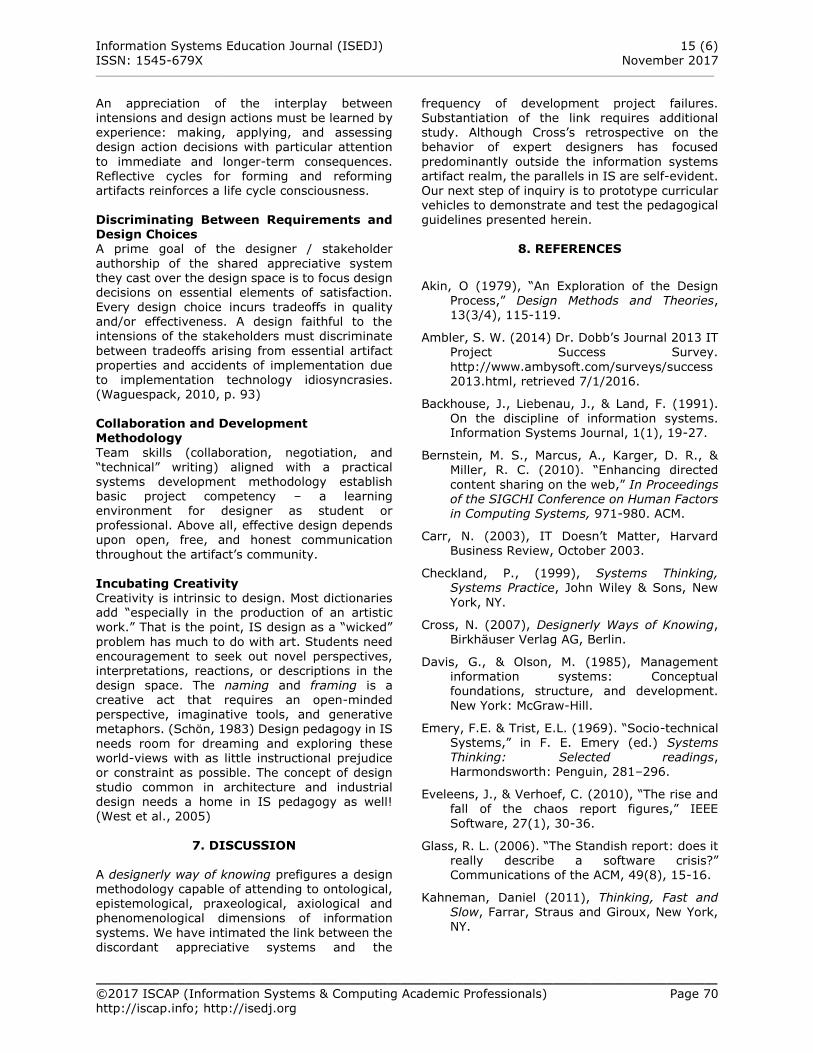
Information Systems Education Journal (ISEDJ) 15 (6) ISSN: 1545-679X November 2017 __________________________________________________________________________________________________________________________
_________________________________________________ ©2017 ISCAP (Information Systems & Computing Academic Professionals) Page 70 http://iscap.info; http://isedj.org
An appreciation of the interplay between
intensions and design actions must be learned by experience: making, applying, and assessing design action decisions with particular attention
to immediate and longer-term consequences. Reflective cycles for forming and reforming artifacts reinforces a life cycle consciousness. Discriminating Between Requirements and Design Choices A prime goal of the designer / stakeholder
authorship of the shared appreciative system they cast over the design space is to focus design decisions on essential elements of satisfaction. Every design choice incurs tradeoffs in quality and/or effectiveness. A design faithful to the intensions of the stakeholders must discriminate
between tradeoffs arising from essential artifact properties and accidents of implementation due to implementation technology idiosyncrasies. (Waguespack, 2010, p. 93) Collaboration and Development Methodology
Team skills (collaboration, negotiation, and “technical” writing) aligned with a practical systems development methodology establish basic project competency – a learning environment for designer as student or professional. Above all, effective design depends upon open, free, and honest communication
throughout the artifact’s community.
Incubating Creativity Creativity is intrinsic to design. Most dictionaries add “especially in the production of an artistic work.” That is the point, IS design as a “wicked”
problem has much to do with art. Students need encouragement to seek out novel perspectives, interpretations, reactions, or descriptions in the design space. The naming and framing is a creative act that requires an open-minded perspective, imaginative tools, and generative metaphors. (Schön, 1983) Design pedagogy in IS
needs room for dreaming and exploring these world-views with as little instructional prejudice or constraint as possible. The concept of design studio common in architecture and industrial
design needs a home in IS pedagogy as well! (West et al., 2005)
7. DISCUSSION A designerly way of knowing prefigures a design methodology capable of attending to ontological, epistemological, praxeological, axiological and phenomenological dimensions of information
systems. We have intimated the link between the discordant appreciative systems and the
frequency of development project failures.
Substantiation of the link requires additional study. Although Cross’s retrospective on the behavior of expert designers has focused
predominantly outside the information systems artifact realm, the parallels in IS are self-evident. Our next step of inquiry is to prototype curricular vehicles to demonstrate and test the pedagogical guidelines presented herein.
8. REFERENCES
Akin, O (1979), “An Exploration of the Design Process,” Design Methods and Theories, 13(3/4), 115-119.
Ambler, S. W. (2014) Dr. Dobb’s Journal 2013 IT
Project Success Survey.
http://www.ambysoft.com/surveys/success2013.html, retrieved 7/1/2016.
Backhouse, J., Liebenau, J., & Land, F. (1991). On the discipline of information systems. Information Systems Journal, 1(1), 19-27.
Bernstein, M. S., Marcus, A., Karger, D. R., & Miller, R. C. (2010). “Enhancing directed
content sharing on the web,” In Proceedings of the SIGCHI Conference on Human Factors in Computing Systems, 971-980. ACM.
Carr, N. (2003), IT Doesn’t Matter, Harvard Business Review, October 2003.
Checkland, P., (1999), Systems Thinking, Systems Practice, John Wiley & Sons, New
York, NY.
Cross, N. (2007), Designerly Ways of Knowing, Birkhäuser Verlag AG, Berlin.
Davis, G., & Olson, M. (1985), Management information systems: Conceptual foundations, structure, and development.
New York: McGraw-Hill.
Emery, F.E. & Trist, E.L. (1969). “Socio-technical Systems,” in F. E. Emery (ed.) Systems Thinking: Selected readings, Harmondsworth: Penguin, 281–296.
Eveleens, J., & Verhoef, C. (2010), “The rise and
fall of the chaos report figures,” IEEE
Software, 27(1), 30-36.
Glass, R. L. (2006). “The Standish report: does it really describe a software crisis?” Communications of the ACM, 49(8), 15-16.
Kahneman, Daniel (2011), Thinking, Fast and Slow, Farrar, Straus and Giroux, New York, NY.
Information Systems Education Journal (ISEDJ) 15 (6) ISSN: 1545-679X November 2017 __________________________________________________________________________________________________________________________
_________________________________________________ ©2017 ISCAP (Information Systems & Computing Academic Professionals) Page 71 http://iscap.info; http://isedj.org
Kaufman, S.B. & Gregoire, C. (2015), Wired to
Create: Unraveling the Mysteries of the Creative Mind, Perigee, New York, NY.
Lee, A. S. (2010). “Retrospect and prospect:
information systems research in the last and next 25 years.” Journal of Information Technology, 25(4), 336-348.
Levin, P H (1966), “Decision Making in Urban Design” Building Research Station Note ENS1/66, Building Research Station, Garston, Herts, UK.
Lyytinen, K., & Yoo, Y. (2002). Ubiquitous computing. Communications of the ACM, 45(12), 63-96.
Kisser, W (1990), “More or Less Following a Plan
During Design: opportunistic deviations in specification,” International Journal of Man-
Machine Studies, Vol. 33, 247-278.
Kolodner, J L & Wills, L M (1996), “Powers of Observation in Creative Design,” Design Studies, 17(4), 385-416.
McNeil, T, Gero, J et al (1998), “Understanding Conceptual Electronic Design Using Protocol Analysis,” Research in Engineering Design,
19(4), 431-453.
New York Times, (2014), “A Golden Age of Design,” The New York Times Style Magazine, http://www.nytimes.com/2014/09/22/t-
magazine/design-golden-age.html?_r=0, retrieved 6/27/2016.
Polanyi, Michael (1966), The Tacit Dimension, University of Chicago Press, Chicago, IL.
Polanyi, Michael (1969), Knowing and Being: Essays by Michael Polanyi, University of Chicago Press, Chicago, IL.
Rogers, E. M., & Shoemaker, F. F. (1971).
Communication of Innovations; A Cross-Cultural Approach.
Samuelson, K (1977), General Information Systems Theory in Design, Modelling and Development, Institutional Paper,
Informatics and Systems Science, Stockholm University.
Schön, Donald (1963), Displacement of Concepts,
Rutledge, Abington, UK.
Schön, Donald (1983), The Reflective Practitioner: How Professionals Think in
Action, Basic Books, New York, NY.
Simon, Herbert (1996), The Sciences of the Artificial, 3ed, M.I.T., Cambridge, MA, USA.
Skyttner, Lars (2005), General Systems Theory (2ed), World Scientific Publishing Co., Singapore.
The Standish Group, “The Chaos Report (1994),”
retrieved 8/4/2016 at www.projectsmart.co.uk/white-papers/chaos-report.pdf
The Standish Group, “Extreme Chaos,” retrieved 8/4/2016 at http://www.cin.ufpe.br/~gmp/docs/papers/
extreme_chaos2001.pdf
Syal, R. (2013). Abandoned NHS IT system has cost £10bn so far. Retrieved June 29, 2016, from https://www.theguardian.com/society/2013/sep/18/nhs-records-system-10bn
Ullman, D G, Dietterich, T G et al. (1988), “A
Model of the Mechanical Design Process Based on Empirical Data,” AI in Engineering Design and Manufacturing, 2(1), 33-52.
Vickers, G (1983), The Art of Judgement, Harper
Collins, New York, NY.
Waguespack, L.J. (2010), Thriving systems theory and metaphor-driven modeling,
Springer-Verlag, London.
Waguespack, L.J. (2016), “IS Design Pedagogy: A Special Ontology and Prospects for Curricula,” Information Systems Education Journal, to appear Summer 2016.
West, D., Rostal, P., & Gabriel, R. P. (2005),
“Apprenticeship agility in academia,” In Companion to the 20th annual ACM SIGPLAN conference on Object-oriented programming, systems, languages, and applications, October, 371-374.
Information Systems Education Journal (ISEDJ) 15 (6) ISSN: 1545-679X November 2017 __________________________________________________________________________________________________________________________
_________________________________________________ ©2017 ISCAP (Information Systems & Computing Academic Professionals) Page 72 http://iscap.info; http://isedj.org
Identifying the Real Technology Skills Gap: A
Qualitative Look Across Disciplines
Evan Schirf
Anthony Serapiglia
CIS Department St. Vincent College
Latrobe, PA 15650
Abstract
Every year several survey inventories are performed throughout the IT industry by trade magazines and
research groups that attempt to gauge the current state of the industry as it relates to trends. Many of these highlight a technology skills gap between job expectations and potential employees. While many job openings exist and educational programs are adjusting to produce more candidates for these jobs, many employers express dissatisfaction with the talent pool. Many of these surveys do not take into account wide differences in the spectrum of industries that employ technology workers. This study interviewed four “C” level executives from four different industries to discover more specifically which
skills they have identified as being most valuable for potential employees. The results show that the
“skills” gap is not just technical. The soft skills of communication, problem solving, and interpersonal skills as well as motivation and positive attitude may be more in demand than specific hard skills of programming languages or other CS/IT specific training. This may be even more pronounced in the multifaceted area of Cybersecurity. Keywords: Skills Gap, Communication Skills, Cybersecurity, IT Education, Information Systems
1. INTRODUCTION
Computer Science and Information Technology/Systems is a very dynamic discipline both in practice and in education. One result of
this dynamism is that often during cycles of change, disconnects can develop between those
two areas of industry and education. Education is often looking at a much longer term picture than industry; and while the student population turns over regularly, the faculty does not. Stories of graduates leaving university unable to land jobs
because of a deficit in their technological education are often reported (Allabarton, 2015; Weiner, 2014).
Cybersecurity is also a moving target in both industry and education. In practice it is a constantly evolving cycle of threat re-assessment and vulnerability identification. With the specifics of the tasks in a constant state of flux, the
challenge of preparing a workforce to succeed in accomplishing those tasks is also in perpetual
change. It is a dynamic that has always been a challenge in the CS/IS/IT education world, how to continually keep up with the hyperactive state of change that exists in both the consumer and industrial markets. Until recently, the path to a
Cybersecurity job in computing/information assurance/networking was through experience. It was common to see job postings that required 10 years of experience or more for anything that related to security. The positions of Chief Security
Information Systems Education Journal (ISEDJ) 15 (6) ISSN: 1545-679X November 2017 __________________________________________________________________________________________________________________________
_________________________________________________ ©2017 ISCAP (Information Systems & Computing Academic Professionals) Page 73 http://iscap.info; http://isedj.org
Officer (CSO) and Chief Information Security
Officer (CISO) simply did not exist. In 2015, by modest estimates, more than 209,000 cybersecurity jobs in the U.S. are unfilled, and
postings are up 74 percent over the past five years (Carapezza, 2015; Resa, 2014). There is a changing atmosphere of perception and understanding of how pervasive security must be within organizations. New Cybersecurity personnel are expected to have the level of
systemic understanding as the ten year veteran. However, most post-secondary degree and certification programs simply do not have the ability to react as quickly as the changing work environment. This inevitably results in both a real and perceived skills gap between education and
industry. A regular feature of many trade magazines is an annual survey of CIO/CSO/CISOs to assess current industry trends and to allow insight into where the skills gaps exist at that instant, as well as to help predict where they may be in the near
future. While these industry surveys serve a very valuable purpose, often the quantitative results are not as insightful as they could be. Distinctions between company size and industry specialization are not often teased out from the bulk statistics. This study set out to follow up on industry
standard quantitative security surveys with qualitative interviews with four “C” level security
personnel from four distinctly different industries. The purpose of these interviews and this study is to gain further insight into the differences in perspective between the four industry segments
related to the technology skills gap. From these insights, specific areas may be identified to help guide changes in security curriculum to help close the current divide.
2. LITERATURE REVIEW
Industry Outlook It is an Information Age when everyone and everything (IoT) is online, paper money is so yesterday (Bitcoin, Apple/Google Pay), and Big
Data Analytics on the zettabytes of social media content generated allows marketers (and others) to know everything about their targets. As more
and more data and services have moved online, so too has the recognition of the value of those things that live online electronically. With that recognition of the value of even the smallest points of data, the targeting of even the most innocuous of online material has increased. So
while once the largest need were employees with the skills to build the enabling networks and
technologies of an information age/economy, the
shift that has ensued now sees that the largest need are those workers skilled in knowing how maximize the potential of and to protect the
systems now in use. Conventional wisdom could assume that there would simply be an overabundance of talent to be able to work with this data and function in this world. The reality of the situation, however, is far from that. According to one 2015 study by Stanford
University, more than 209,000 cybersecurity jobs in the U.S. are unfilled, and postings are up 74 percent over the past five years. The demand for positions like information security professionals is expected to grow by 53 percent through 2018 (Setalvad, 2015).
An Ernst & Young survey highlights that companies will spend marginally more money on technology and staff to defend their IT systems and data in 2015, but they continue to have problems hiring knowledgeable security professionals. “About 52 percent of the more than
1,800 organizations surveyed expect security budgets to increase, compared to 43 percent whose budgets will remain unchanged. More than half of firms identified the lack of skilled professionals as a major reason for their inability to bolster system security, according to the survey.”(Ernst & Young, 2015).
In an interview with security magazine
SCMagazine.com, Sean Smith director of CyberSecurityJobsite.com reports that while over 50% of the companies listing job openings on the site, only a third of the applicants are meeting the
cyber security skills listed (Drinkwater, 2014). The International Information System Security Certification Consortium, Inc., (ISC)² is one of the global leaders in educating and certifying security professionals in a variety of disciplines. The (ISC)² 2013 Global Information Security
Workforce Study revealed there to be an “acute gap” between the supply and demand of qualified cyber-security professionals. It detailed there would be 3.2 million information security
professionals employed in 2013, and says that this demand is growing at a compound annual growth rate (CAGR) of 11.3 percent through
2017. Some 56 percent of IT decision makers in their survey responded that they had 'too few' information security workers (Suby, 2013) Model Curriculum The Association for Computing Machinery (ACM)
has provided model computer related curriculum guidelines since the 1960s. The 2013 model
Information Systems Education Journal (ISEDJ) 15 (6) ISSN: 1545-679X November 2017 __________________________________________________________________________________________________________________________
_________________________________________________ ©2017 ISCAP (Information Systems & Computing Academic Professionals) Page 74 http://iscap.info; http://isedj.org
curriculum is the latest update. In it Information
Assurance and Security is broken out into it’s own Knowledge Area (KA) for the first time. In defining the KA, industry standards of CIA
(Confidentiality, Integrity, and Availability) are used in conjunction with providing for authentication and non-repudiation. Broadening the scope, CS2013 acknowledges that both assurance and security concepts are needed to ensure a complete perspective, “Information assurance and security education, then, includes
all efforts to prepare a workforce with the needed knowledge, skills, and abilities to protect our information systems and attest to the assurance of the past and current state of processes and data (ACM, 2013).”
The model curriculum guidelines for Information Systems version 2010 lists security and risk management as one of a group of five high level IS capabilities. Under the heading of Understanding, Managing and Controlling IT Risks, this is more clearly defined as, “IS graduates should have strong capabilities in
understanding, managing, and controlling organizational risks that are associated with the use of IT-based solutions (e.g., security, disaster recovery, obsolescence, etc.). At the undergraduate level, the emphasis should be on in-depth understanding of a variety of risks. Because IT solutions are so closely integrated
with all aspects of a modern organization, it has become essential to manage the risks related to
their use in a highly systematic and comprehensive way (ACM, 2010). With the need to fill so many security related
positions, other organizations have stepped in to begin to define what professional certifications should encompass. The International Information Systems Security Certification Consortium, (ISC)2, was formed in 1989 as a group to determine a Common Body of Knowledge (CBK) that has become the basis for what has been the
leading security certification for years, the Certified Information Systems Security Professional (CISSP) certification (ISC2, 2015). The CISSP certification includes the added
requirement that not only do candidates have to pass an exam related to the CBK, but they must also show that they possess a minimum of five
years of direct full-time security work experience in two or more of the security domains. An alternative to the CISSP certification is offered by the EC-Council (The International Council of Electronic Commerce Consultants) with their
flagship certification being the Certified Ethical Hacker (CEH). The CEH certificate has been
offered since 2003 (Goldman, 2012) and is
heavily centered on practical skills education and specifically penetration testing techniques. The name itself has been controversial, becoming
both an asset and a possible hindrance to the organization and certificate holders (D’Ottavi, 2003; Olson, 2012). The other leading organization in developing curriculum and certification programs is the SANS Institute (the name is derived from SysAdmin,
Audit, Networking, and Security). Founded in 1989, the organization created their Global Information Assurance Certification (GIAC) in 1999. GIAC tests and validates the ability of practitioners in information security, forensics, and software security. SANS as an organization
has grown to provide training seminars on ground and online, with the SANS Technology Institute was granted regional accreditation by the Middle States Commission on Higher Education. (SANS, 2014). A common thread amongst these organizations in
their curriculum models and certification paths, is that although both the CISSP and CEH require proof of field experience, these organizations have had a focus on providing support materials for the classroom and promoting standards of what should be included and expected of the students/certificate candidates.
3. METHODOLOGY
This project was conducted as series of interviews with current CIO/CISO or equivalent executives in order to determine what IT departments are
facing in the current industry. The interviews were conducted utilizing a combination of questions culled from Harvey Nash’s CIO Survey for 2015, and the CSC CIO Survey for 2014-15 (Appendix A). The Harvey Nash CIO Survey 2015, in association
with KPMG, collected data between January 6th and April 19th, 2015, and represents the views of 3,691 technology leaders from more than 50 countries, with a combined IT spend of over $200
billion. Of the respondents, 33 percent identified themselves as CIOs, nine percent as CTOs, 32 percent as director/VP in technology and the
remaining 26 percent were spread between a broad range of roles including CEO, COO, CDO and senior executives (BusinessWire, 2015). The CSC Global CIO Survey: 2014-2015 is the 6th annual barometer of CIOs’ plans, priorities,
threats and opportunities across nearly every industry. Almost 600 CIOs and IT leaders
Information Systems Education Journal (ISEDJ) 15 (6) ISSN: 1545-679X November 2017 __________________________________________________________________________________________________________________________
_________________________________________________ ©2017 ISCAP (Information Systems & Computing Academic Professionals) Page 75 http://iscap.info; http://isedj.org
contributed to this report from around the world,
offering insights and data to better prepare IT leaders for the challenges and possibilities of the coming years (CSC, 2015).
Questions in the interview were divided into three sections: Information Technology and Innovation, Cybersecurity, and Management of Information Systems and Personnel. Four interviews were conducted. The interviews were conducted with: 1 – IT Director of a medium sized
alternative energy company, 2 – CIO of a medium sized private College, 3 – CISO of a medium sized regional retail business, 4 – Director of Security Architecture of a large national financial services banking institution.
4. RESULTS Management of Information Systems and Personnel The focus of this paper is on responses from the third section of the interviews relating to Management of Information Systems and
Personnel. This section featured questions pertaining to how employees are being used in their department or workspace, as well as what skills the department management sees as valuable. Questions inquired as to which skills were viewed by the interviewees as overpopulated or underpopulated. The featured
question of this section asked whether or not a disconnect is being seen by the interviewed CIOs
or IT executives between the knowledge and skillset of new hires looking to enter the industry and the knowledge and skillset these interviewees desire to see.
Question: What are the most common day-to-day operations your department undertakes? The responses to this question were varied and depended greatly upon the business type of the respondent.
Subject 1 simply stated that there were not day-to-day operations specifically related to IT. Where managerial office duties fell in with things like
budget approvals and planning, strategic planning, invoice approvals, and employee peer reviews, IT related work was constantly rotating
with ongoing projects and new projects “coming down the pipe” to the point that the respondent described his IT work as “triaging what comes across [his] desk.” In contrast, Subject 2 stated his department’s role in the business unit was supporting day to day operations constantly.
Service operations, serving the needs of the users, such as dealing with incidents (incident
management) such as troubleshooting a piece of
technology and addressing overarching technical problems (problem management) through ticket creation and handling were among the common
everyday activities, with long term projects with deadlines and objectives being undertaken in the background. Subject 3, whose position was solely security focused in a stable industry, reported log management, investigating and troubleshooting
alerts, dealing with malware, and reacting to things seen in logs as his department’s day to day operations. Subject 4’s statement of daily workload as much wider, encompassing consulting, security pattern design, vetting of current solutions, looking at capabilities matrix,
creating taxonomies, understanding capabilities and applying them across the enterprise, making sure people follow appropriate governance when inserting technology into the workplace, appropriate due diligence when introducing a new security solution, management and oversight of security architecture, standards development,
threat modeling, innovation activities research, and providing subject matter expertise. “So, a lot” was his summarized report. Question: Do you believe you're experiencing a rise or fall in skills demand? Which skills do you feel are needed most/least? Which skills are
overpopulated/underpopulated (in your department, in the industry)? Which skills do you
personally value? All respondents interviewed reported they were experiencing a rise in skills demand, either by
direct reference or by communitive statements. While most responses differed in some way in due to different industry demands, all subjects stated they were eager to see new hires with people skills and who are, as reported by Subject 4, “as comfortable on the command line as they are in the board room” with good communication skills
being the “most critical” for Subject 4 and good soft skills such as project management being needed by Subject 3. Meanwhile, most subjects offered that they were not looking for as many
programming skills as they were in the past. Subject 1 offered the observation that security
skills are in huge demand, but also offered the following statement in regards to communication skills:
“I believe there is an overpopulation of people that can code and things of that
nature, but it’s not a bad thing necessarily. But there’s also under –and this can just be
Information Systems Education Journal (ISEDJ) 15 (6) ISSN: 1545-679X November 2017 __________________________________________________________________________________________________________________________
_________________________________________________ ©2017 ISCAP (Information Systems & Computing Academic Professionals) Page 76 http://iscap.info; http://isedj.org
an experience thing- but there’s an under
population of individuals that can really take technical terms and translate that into business terms, right? I guess you could say
you and I [we] could probably have a conversation about something highly technical or…very high level conversation about DHCP/TCIP, TCIP and IP Addressing and all that stuff, because someone standing there, they could be the CEO of a company, now it’s going to sound like we’re
speaking a totally different language. But to take those concepts and ideas and translate them into something that makes sense from a business standpoint, I think that skill is very lacking... let’s take someone like a coder or programmer that’s going to sit
there and code and program for ten, twelve, fourteen hours in front of his or her screen go home and do the same thing for another five or six hours at night. They have zero human interaction, and they don’t know how to establish relationships with individuals, and I mean business
relationships and manage those.” The subject then followed this statement up with an observation that too many people were coming in with coding background in the wrong languages, in that the languages new hires had experience in were not the languages he was
looking for experience in.
Subject 3’s responses were very similar, expressing his need for highly seasoned people with at least eight years of IT experience with both soft skills and project management skills in
order to be looked at for acceptance into the subject’s security department. However, the subject offered that, at least in regards to security, lots of different backgrounds were able to be utilized within the industry. He highlighted the presence of developers and managers within his security department. On the topic of what new
hires had to offer, the subject had this to say:
“I can find a lot of one-off people. So if I wanted a pen tester, I could find someone
to do pen testing. If I wanted a UNIX admin, I could find someone to be a UNIX admin. I don’t find very many people that have
multiple skillsets or that can move between the security domains fluidly.”
In regards to security specifically, the subject reported that what he called the “security boom” had taken people and made them think they are
more valuable than they actually are in the
industry, causing a rise in salaries and a fall in
expectations. The subject reported his personally valued skills
were such skills as a good work ethic, as he stated security was not a nine-to-five job and involved many late nights, the ability to self-teach, with the added comment that he was willing to send people for training as long as they proved their worthiness for such training as well as the expansion of their own horizons on their own
time, and soft skills, such as project management and the ability to work with people outside of the direct chain of command within the workplace. Subject 4’s personally valued skills were similar to Subject 3’s, including a polishing technology
background, a willingness to get hands dirty and be courageous, good communication skills which he valued as “critically important.” The subject stated that technical skills were able to be taught through classes and certification courses, yet intangible skills such as communication and collaboration were not skills easily taught.
Furthermore, the respondent stressed the need for communication skills, as many technology skills like security are embedded into everything that a company does. The subject offered that the “best security people aren’t security people” but rather are the people who have an understanding of the technology or discipline in order to
effectively secure it, using as an example that in order to have effective web application firewalling
delivery controls, he would optimally look for someone who had been working on load balancers and application delivery controls.
The subject offered that skills that appeared “sexy” or that appeared to equate a quick pay day were overpopulated and that practical security skills were watered down in many candidates. Additionally, the subject reported that he saw skills like knowing fundamentally how technology works as underpopulated in the pool of new hires.
The subject stated that technology had become “abstractions upon abstractions upon abstractions that makes things easier” and that he valued people who can “decompose complex
problems into very primitive parts, and to be able to communicate that clearly and effectively.”
Subject 2 responded with the statement that as his department as well as the business unit’s industry was taking on more technology, there was to be a higher demand for skills to use that technology. The most of which the subject reported these to be business intelligence skills
such as report generation, help desk and ticket handling, fixing overall computer problems and
Information Systems Education Journal (ISEDJ) 15 (6) ISSN: 1545-679X November 2017 __________________________________________________________________________________________________________________________
_________________________________________________ ©2017 ISCAP (Information Systems & Computing Academic Professionals) Page 77 http://iscap.info; http://isedj.org
troubleshooting, as well as instructional
designers, who are in especially high demand, that would help the transition from old technology to newer technology.
The subject reported that programming skills were on the decline due to the package availability to business units. Where in the past business units would hire programmers for in-house work, now businesses are simply using their IT staff to select and implement
prepackaged software. However, the subject stated that companies will always hire network administrators, help desk people, PC technicians, business analysts, and systems analysts, yet the consistent hiring of programmers is on the decline with the exception of within the software
development industry where software would be built for multiple industries. The subject highlighted the demand for people who can be business analysts that can look at the requirements for the business, select the best software package, and then help with implementation and training on said package,
also suggesting that companies do not realize the value of business analysts who can look at big data and analytics like that inside an IT department, where such skills tend to fall under the category of training, which is the first place budget cuts look to for dollars.
Question: Do you see a disconnect between the knowledge and skills of new hires and the
knowledge and skills you want them to have? As the staple point of this project, this question was met with unique responses from all
interviewees, where three of the four respondents reported the disconnection was not found in the difference of technical skills of the new hires versus what each interviewee wanted to see, but rather in the personal soft skills of the new hires, including their initiative, communication and collaboration skills, and patience to first learn the
system before enacting change upon it. Subject 1’s response can be personified in the following statement, where he highlighted the
difference in initiative that he was seeing between new hires from technical schools and those from four-year-degree, collegiate environments:
“I’ve seen a difference in the skillset as well as the initiative and the willing to learn more from between the individuals in these technical two-year, associate-degree type schools and a four-year collegiate school.
And what I mean by that is it seems like the individuals in the 4-year college
programs are more eager to learn, more
well prepped for a business type of environment as well as are willing to take the initiative. Whereas someone from a
technical school, a two-year trade type of school who specializes in IT or something similar, does not tend to have all the skills necessary to function in a business environment whereby a good internship would potentially help with that along with experience. Something about a four-year
degree, though, it seems that doesn’t seem to be the need for.”
Subject 2 referenced an article in the Chronical for Higher Education, where employers reported that “recent [college] graduates often don’t know
how to communicate effectively, and struggle with adapting, problem-solving, and making decisions” and that graduates “dinged bachelor’s-degree holders for lacking basic workplace proficiencies, like adaptability, communication skills, and the ability to solve complex problems” (Fischer, 2013). The subject commented on this
article by stating that the issues addressed are not a matter the technical skills, but rather of knowing how to think in terms of written and oral communication, decision making, analytical and research skills, and the ability to solve complex problems. He offered the following statement regarding how colleges are treated in the here
and now:
“When I went to college, the professor said to me, ‘I’m not here to help you get a job, or to give you a skill that’s going to get you a job. I’m here to educate you, teach you
how to think, and expose you to a variety of things that you wouldn’t get in the working world.’ Now, colleges, a parent comes in admissions and says, “What’s your college going to do to get my kid a job?” “What are they doing to get my kid a job?” It has evolved and changed to that.”
The subject offered that the views expressed by the parents who are concerned with job acquisition are appropriate if their child is
attending a technical school, but “college is still college” where professors can teach almost anything, but they cannot teach students “how to
be nice” or rather how to make students truly care about what they are doing. The subject offered that students were understanding the technical skills, but the best students are those who feel bad for showing up late to class and later to their job. And while only so many classes can be taught
by colleges, the skills acquired are meant to go beyond just programming, but also include
Information Systems Education Journal (ISEDJ) 15 (6) ISSN: 1545-679X November 2017 __________________________________________________________________________________________________________________________
_________________________________________________ ©2017 ISCAP (Information Systems & Computing Academic Professionals) Page 78 http://iscap.info; http://isedj.org
project management and coordination, which are
seen often in the workplace. The subject’s final response was a cautionary statement to students:
“The worst thing you can hear from a kid, [is] when they have a major and they say ‘I don’t know [what I want to do].’”
Subject 4 offered that new hires simply must understand what they are working with before they can effect positive change, which requires
characterizing and understanding the environment, which in turn requires patience. The subject reported that new hires are lacking in the ability to characterize and be patient with the culture they are dealing with, so much to the point of “where new hires get tripped up is by
working so hard to become relevant so quickly, they quickly make themselves irrelevant”, where new hires burn bridges and shatter relationships because they do not understand the culture. The subject had the following statement to offer in clarification:
“The one thing I would tell new hires is ‘it’s a marathon, not a sprint.’ You have to understand the organisms that you’re working with and the systems that you’re working with before you can effect positive change, because you, A, have to speak the language, B, be collaborative, and C,
support the mission.”
The subject reported the average turnaround period for a new hire to begin effecting positive change on the work environment was between three and six months, with the average falling
closer to six months, where the subject does not expect a huge impact until after that “learning phase” has been gone through. Subject 3, on the other hand, stated that there was an obvious disconnect, where new hires did not understand what it takes to be in the security
industry, overvaluing their one to two years of experience displayed on their resumes. He noted the inadequacies in people’s work ethic, but focused heavier on the problem of hew hires
putting flimsy or unpracticed skills on resumes as well as the number of skills displayed simply not being adequate for the job.
5. CONCLUSIONS
There is no question a gap does exist between the number of positions available and the number of available candidates to fill them. A study funded
by Microsoft in 2013 reported that there are 120,000 new jobs created in the United States
each year that require the skills of workers with
degrees in Computer Science. However, in the US only 49,000 graduates leave university with Computer Science degrees annually creating a
gap of 71,000 available jobs (Allabarton, 2015). Many schools, colleges and universities, as well as vocational training and certification programs, have stepped up their CS/IS/IT programs to produce more and more potential employees to fill this gap.
However there are still complaints and dissatisfaction from employers as to the readiness of these potential employees. Much of the dissatisfaction has been attributed to changing skill sets and moving targets of evolving
technology. The results of this study show that this may not be the case. From the interviews of four “C” level CS/IS/IT professionals, it can be seen that businesses,
CIOs and IT executives are valuing soft skills such as communication and collaboration, in order to decompose problem solving into primitive and easily communicated parts. While it can be frustrating to have to re-train to a specific language or software package, that
process can be done rather quickly. The ability to think and act systemically, with a bigger picture
in mind across departments and industries is the skill that takes far longer to obtain. For generations, organizations emphasized in-
depth domain knowledge necessary for their employee’s job performance. However, a sea-change has come about in part because of the rapid transformation in workplace ambience and the far reaching effects of technology within all aspects of an organization. Among the cluster of skills that cater to this changing scenario,
personality and soft skills play a major role in a person’s career progress. Communication skills, both verbal and nonverbal, problem solving skills, interpersonal skills, motivation and positive
attitude are some of the most important soft skills that the organizations expect from their employees.
The soft skills surrounding the technical skills may become the deciding factors in employment decisions. Mitra (2011) says, “Attitude is a very critical personal attribute—a soft skill that exposes the real you.” He adds, “There isn’t any
other personal attribute that is more important today than one’s ethics, integrity, values and
Information Systems Education Journal (ISEDJ) 15 (6) ISSN: 1545-679X November 2017 __________________________________________________________________________________________________________________________
_________________________________________________ ©2017 ISCAP (Information Systems & Computing Academic Professionals) Page 79 http://iscap.info; http://isedj.org
trustworthiness. One may have desirable hard
skills but lack of ethics, integrity, values and trustworthiness is not taken lightly by the management of any company.”
Colleges and universities can better prepare their graduates the more they can integrate experiences that emphasize these skills into their coursework. This will also lead to more satisfied employers.
6. REFERENCES
Allabarton, Rosie (2015, March 18). The skills gap is widening – but here’s how you can close it. Retrieved May 14, 2016, from
http://thenextweb.com/insider/2015/03/18/
the-skills-gap-is-widening-but-heres-how-you-can-close-it/#gref
Bacey, C.; Warren, A. (2015, May 19). Pace of Digital Innovation Quickens; Large Companies Struggle to Keep Up, Finds Harvey Nash CIO Survey in Association With KPMG. Retrieved May 2, 2016, from
http://www.businesswire.com/news/home/20150519005677/en/Pace-Digital-Innovation-Quickens-Large-Companies-Struggle
Carapezza, Kirk (2014, April 29). Poll: Skills Gap May Be Lengthening Job Searches. Retrieved February 12, 2016, from http://news.wgbh.org/post/poll-skills-gap-
may-be-lengthening-job-searches
Computer Science Curricula 2013: Curriculum - ACM. (2013, December 20). Retrieved February 1, 2015, from http://ACM.ORG
CSC (2015). The CSC Global CIO Survey. Retrieved May 2, 2016, from
http://www.csc.com/cio_survey_2014_2015
D’Otavi, A. (2003, February 3). Interview: Marcus J. Ranum, the "father" of the firewall. Retrieved June 4, 2015, from http://www.infoservi.it/interview-marcus-j-ranum-the-father-of-the-firewall/1057
Drinkwater, Doug (2014, March 27) More jobs but
cyber security skills gap widens. Retrieved
February 29, 2016, from http://www.scmagazineuk.com/more-jobs-but-cyber-security-skills-gap-widens/article/340103/
Ernst & Young (2015). Creating trust in the digital world: Global Information Security Survey
2015. Retrieved April 1, 2016, from http://www.ey.com/GL/en/Services/Advisory
/ey-global-information-security-survey-
2015-1
Fischer, K. (2013, March 04). The Employment Mismatch. Retrieved April 28, 2016, from
http://chronicle.com/article/The-Employment-Mismatch/137625/
Goldman, J. (2012, May 2). How to Become a Certified Ethical Hacker. Retrieved April 5, 2015, from http://www.esecurityplanet.com/hackers/how-to-become-a-certified-ethical-hacker.html
Harvey Nash (2015) Harvey Nash CIO Survey 2015: Into an Age of Disruption. Retrieved May 2, 2016, from http://www.kpmg-institutes.com/content/dam/kpmg/advisory-
institute/pdf/2015/harvey-nash-cio-survey-2015-full.pdf
Information Systems Curricula 2010: Curriculum - ACM. (2010, May 20). Retrieved February 1, 2015, from http://ACM.ORG
International Information Systems Security Certification Consortium. (n.d.). Retrieved June 14, 2015, from https://www.isc2.org
Mitra, Barun K. (2011). Personality Development
and Soft Skills. New Delhi : OUP. Pp. 47-49
Olson, P. (2012, July 31). Exploding The Myth Of The 'Ethical Hacker' Retrieved June 3, 2015, from http://www.forbes.com/sites/parmyolson/20
12/07/31/exploding-the-myth-of-the-ethical-hacker/
Resa, Dan (2014, March 1). "The Growth of Cybersecurity Jobs." Growth of Cybersecurity Jobs. Accessed May 16, 2015. http://www.burning-glass.com/research/cybersecurity/.
Setalvad, Ariha (2015, March 31). Demand to fill
cybersecurity jobs booming. Retrieved April 1, 2016, from http://peninsulapress.com/2015/03/31/cybersecurity-jobs-growth/
Suby, Michael (2013) The 2013 (ISC)2 Global Information Security Workforce Study.
Retreived February 29, 2016, from
https://www.isc2cares.org/uploadedFiles/wwwisc2caresorg/Content/2013-ISC2-Global-Information-Security-Workforce-Study.pdf
Weiner, Joann (2014, September 16). The STEM paradoxes: Graduates’ lack of non-technical skills, and not enough women. Retrieved May 14, 2016, from
https://www.washingtonpost.com/blogs/she-the-people/wp/2014/09/26/the-stem-

Information Systems Education Journal (ISEDJ) 15 (6) ISSN: 1545-679X November 2017 __________________________________________________________________________________________________________________________
_________________________________________________ ©2017 ISCAP (Information Systems & Computing Academic Professionals) Page 80 http://iscap.info; http://isedj.org
paradox-lack-of-skills-by-stem-graduates-
and-not-enough-women/
Editor’s Note:
This paper was selected for inclusion in the journal as a EDSIGCon 2016 Distinguished Paper. The acceptance rate is typically 7% for this category of paper based on blind reviews from six or more peers including three or more former best papers authors who did not submit a paper in 2016.
Information Systems Education Journal (ISEDJ) 15 (6) ISSN: 1545-679X November 2017 __________________________________________________________________________________________________________________________
_________________________________________________ ©2017 ISCAP (Information Systems & Computing Academic Professionals) Page 81 http://iscap.info; http://isedj.org
Appendix A
The following is the survey instrument that was utilized as a base script to conduct the interviews with the four subjects that participated in this project.
A. Classification
a. Title
i. CIO - Chief Information Officer
ii. IT Director
iii. CDO - Chief Digital Officer
iv. CISO - Chief Information Systems Officer
v. CITO - Chief Information Technology Officer
vi. Other (please specify)
b. Business Type
i. Manufacturing
ii. Telecom
iii. Retail/Tech/Media
iv. Financial Services
v. Healthcare
vi. Government/Public Sector
vii. Education
viii. Other (please specify)
c. IT Department Size
i. Small Business: IT budget < $1M
ii. Medium Business: IT budget $1M-$250M
iii. Large Business: IT budget > $250M
B. Interview Questions
a. Information Technology and Innovation
i. What do you think is the perceived impact of IT in your organization?
ii. What role do you feel IT plays in innovation and strategy? Does IT support
or drive innovation in our organization?
iii. Are you familiar with the term digital disruption? If you are not familiar with
the term, I will provide a brief description (see page 2). How important is it
to your company?
1. 0 - Cannot say
2. 1 - Not important at all
3. 2 - Lowly important
4. 3 - Moderately important
5. 4- Highly important
6. 5 - Crucially/Critically important
iv. Has your industry been affected by digital disruption? If so, in what way?
v. How do you think your business compares to current/future competitors in
how it will survive or capitalize on digital disruption?
b. Cybersecurity
i. Do you believe your board recognizes the risks posed by cybersecurity, and
do you believe it is doing enough about it?
ii. Which department (Marketing, Financial, Legal, IT) relies the heaviest on
cybersecurity?
iii. What was the most common threat for your organization/industry in the
past year or two? What do you think will be the next most common threat
Information Systems Education Journal (ISEDJ) 15 (6) ISSN: 1545-679X November 2017 __________________________________________________________________________________________________________________________
_________________________________________________ ©2017 ISCAP (Information Systems & Computing Academic Professionals) Page 82 http://iscap.info; http://isedj.org
within the next two years? Did you feel adequately prepared to meet past
threats, and do you feel prepared to meet future threats?
iv. CIO Magazine claims the majority of security threats are internal. Do you
feel this is accurate? Are you countering this threat? If not, do you plan to
pursue countermeasures against this threat?
c. Management of Information Systems and Personnel
i. What are the most common day-to-day operations your department
undertakes?
ii. If the company wished to pursue a project that would encounter
major/unsolvable problems on the IT side, how likely is your input to stop
or alter the project?
iii. What proportion of your IT department is flexible/contingent labor? If you
are unfamiliar with the term, I will provide a brief description (see page 2).
iv. Do you believe you're experiencing a rise or fall in skills demand? Which
skills do you feel are needed most/least? Which skills are
overpopulated/underpopulated (in your department, in the industry)? Which
skills do you personally value?
1. Harvey Nash 2015 CIO Survey claims that there is a fall in demand
for skills related to business scope recognition ([1] Technical
architecture, [2] Enterprise architecture, and [3] Business analysis)
as well as a rise in demand for skills related to predicting change
and moving on change ([1] Big data / analytics, [2] Change
management, and [3] Development). Do you feel this is accurate in
your organization/industry?
2. Do you see a disconnect between the knowledge and skills of new
hires and the knowledge and skills you want them to have?
(Optional) What is the oddest (most out of place for an IT worker) job or task you have had to perform to date?
Related Documents