Information Sources And Signals

Welcome message from author
This document is posted to help you gain knowledge. Please leave a comment to let me know what you think about it! Share it to your friends and learn new things together.
Transcript

Information Sources And Signals

2
Review: Composite Signals and Frequency Domain Representations
Time Domain Representation Frequency Domain Representation
3
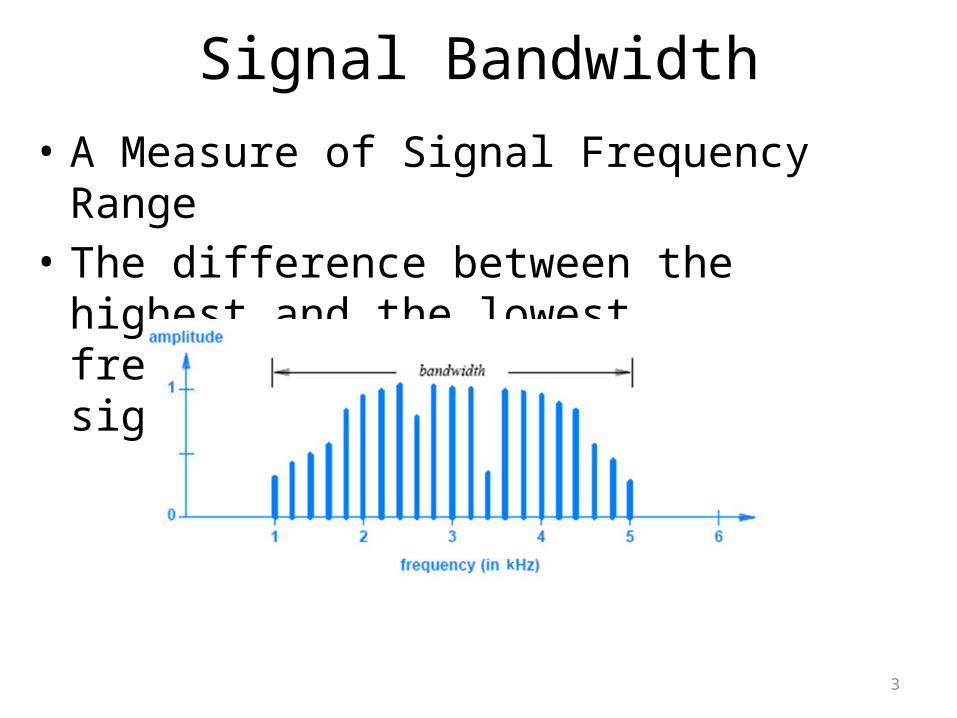
Signal Bandwidth• A Measure of Signal Frequency Range • The difference between the highest and the
lowest frequencies contained in a signal.

4
What Is the Bandwidth of This Signal?
2 - 1 = 1Hz

• If a signal is decomposed into three sine waves with frequencies of 300, 700, and 1200 Hz, what is its bandwidth?
5

Why Should We Care about Bandwidth?
• We need to know the bandwidth of a signal to make sure the communication channel is wide enough to transmit it.
6

An Analogy
7

In reality,
8
The bandwidth of a signal is much larger than what is
allowed by a communication channel.
We need to chop off some frequency components of a
signal so that it can be transmitted AND as much
information as possible can be preserved.

Digital Signals

10
Digital Signals• Use voltage to represent digital values
– A positive voltage a logical one (1)– Zero or a negative voltage a logical zero (0)
• +5 volts is usually what we use in computer hardware.– +5 or 0 -> 1 or 0– Two levels: 1 bit

11
Digital Signal Levels • Some physical mechanisms can support more than
two signal levels.– For example, consider a system that uses four levels of
voltage:– -5 volts, -2 volts, +2 volts, and +5 volts

Digital Signal Levels
• More signal levels a system has, more bits need to be sent out per unit time.

Bits and Signal Levels
• Often we use bits to describe signal levels
• How many bits can we represent using 4 levels?– -5, -2, 2, 5
• How many bits can we represent using 8 levels?
• How many levels do we need to represent n bits?
13

14
More Bits, Better?
• More bits a system can deliver at a given time period, more information it can transfer.
• Can we increase the signal levels as many as possible?– Mathematically, it is doable.– Practically, electronic systems cannot distinguish
between signal levels (voltage levels) that differ by small amounts.

What’s the bandwidth of digital signals?
Frequency Domain RepresentationTime Domain Representation
=
• Fourier Analysis:• http://www.mathcs.org/java/programs/FFT/index.html
16
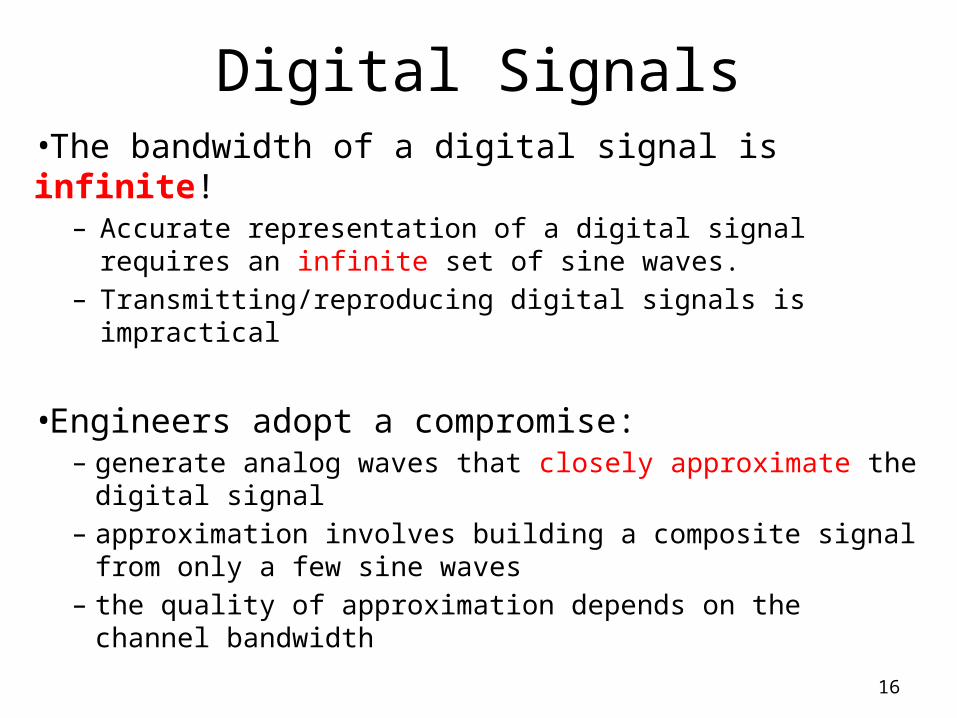
Digital Signals•The bandwidth of a digital signal is infinite!
– Accurate representation of a digital signal requires an infinite set of sine waves.
– Transmitting/reproducing digital signals is impractical
•Engineers adopt a compromise: – generate analog waves that closely approximate the digital
signal– approximation involves building a composite signal from
only a few sine waves– the quality of approximation depends on the channel
bandwidth

Bandwidth-Limited Signals
Having less bandwidth (harmonics) degrades the signal
CN5E by Tanenbaum & Wetherall, © Pearson Education-Prentice Hall and D. Wetherall, 2011
8 sine waves
4 sine waves
2 sine waves
Lost!
Bandwidth
Lost!
Lost!

18
Speed/Capacity of Data Transmittion• We use bit rate (bits per second) to measure the
speed/capacity of transmission. • Two factors to consider when measuring the bit
rate.1. The number of signal levels
• How many bits at each level?
2. How long does a system have to stay at a given level?• Should be long enough to guarantee the signal to be received. • We use Baud to measure how many times the signal can
change per second

19
Baud• Baud rate is confined by hardware.• Some numbers (theoretical)
– Dial-in (v.90): 56k– ISDN: 128k – DSL: 300k – 1,500k (1.5M)– Cable: 300k – 6,000k (6M) (could go higher)– T1: 1.5M– T3: 44M– 100Base-T: 100M
• Baud rates on real connections may be lower.

20
Bit Rate
• If a system with two signal levels operates at 1000 baud, how many bits he system can transfer per second?
• How about a system that operates at 2000 baud and has four signal levels

21
Synchronization and Agreement about Signals
• Diverse signals and systems means different signal levels and baud rates.– Different signal levels + Different baud rates
Troubles!• The systems at both ends must be able to
measure time precisely.– if one end transmits a signal with 10 elements per
second, the other end must expect exactly 10 elements per second

22
Example of Synchronization Error

23
Synchronization and Agreement about Signals
• Handshaking– http://www.freesound.org/samplesViewSingle.php?id=19036– http://www.windytan.com/2012/11/the-sound-of-dialup-pictured.html
• At slow speeds, easy• At high speeds, many challenges
– if one end transmits a signal with 109 elements per second, the other end must expect exactly 109 elements per second (not 109-1, not 109+1)
1 0 0 0 0 0 0 0 0 0 0 … 0
Um, how many zeros was that?

Manchester Encoding
• For computers, detecting a transition in signal level is much easier than measuring the signal level– A transition from 0V to +5V logical 1– A transition from +5V to 0V logical 0– Transitions occur in the middle of each time slot

25
Converting an Analog Signal to Digital
Pulse code modulation

26
Converting an Analog Signal to Digital
• The three steps used PCM1. Sampling an
analog signal.2. Quantizing the
sampled value.3. Encoding the
quantized value.4.5 5.7 3.2
01000101 01010111 00110010
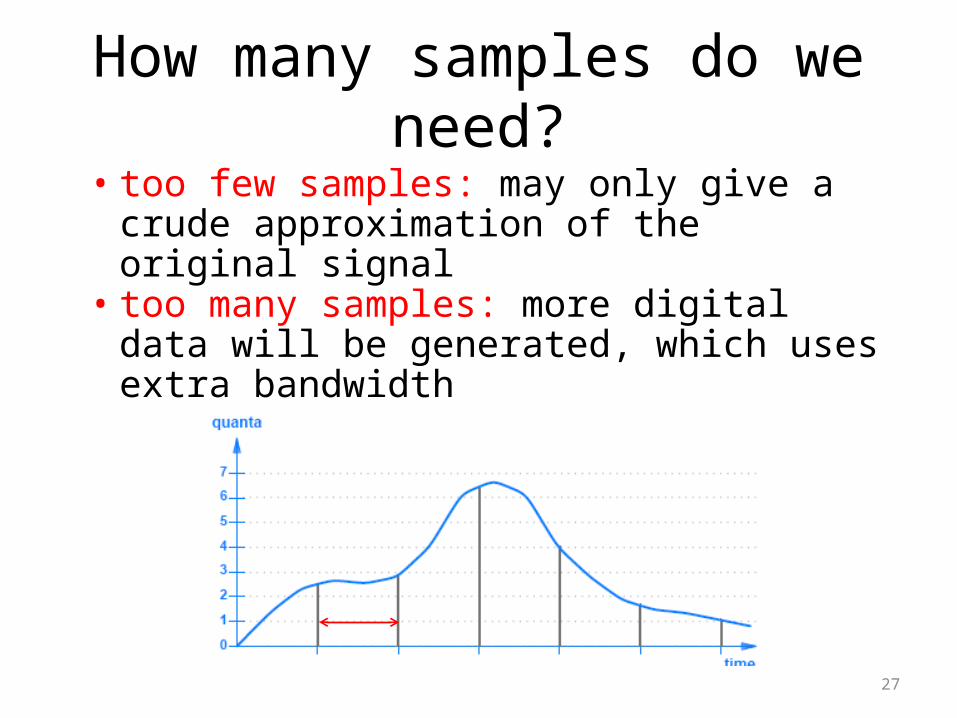
How many samples do we need?
27
• too few samples: may only give a crude approximation of the original signal
• too many samples: more digital data will be generated, which uses extra bandwidth

28
The Nyquist Theorem and Sampling Rate
• A mathematician named Nyquist discovered exactly how much sampling is required:
– fmax : the highest frequency in the composite signal.
• Sample a signal at least twice as fast as the highest frequency that must be preserved.

• Q: At what rate should we sample the following signal?
30
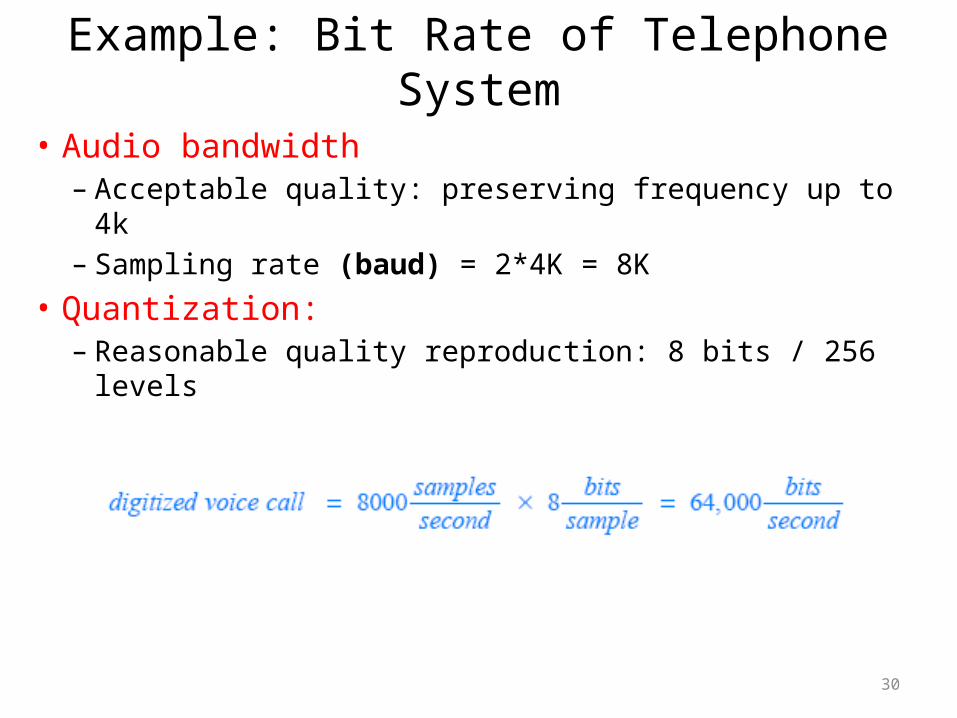
Example: Bit Rate of Telephone System
• Audio bandwidth– Acceptable quality: preserving frequency up to 4k– Sampling rate (baud) = 2*4K = 8K
• Quantization:– Reasonable quality reproduction: 8 bits / 256 levels

Digital Audio• Audio frequency
– 20 Hz – 20k– Varied from individual to individual
• Teenbuzz: http://download.npr.org/anon.npr-mp3/atc/atc_teenbuzz.mp3
• Sampling frequency– MP3: 44.1kHz– DVD-audio: 48 kHz

32
Encoding and Data Compression• Data compression refers to a technique that reduces the
number of bits required to represent data• Data compression is relevant to a communication system
– because reducing the number of bits used to represent data reduces the time required for transmission
– a communication system can be optimized by compressing data• Chapter 29 discusses compression in multimedia
applications• There are two types of compression:
– Lossy - some information is lost during compression– Lossless - all information is retained in the compressed version

33
Encoding and Data Compression• Lossy compression is generally used with data that a human
consumes, such as an image, video/audio
• The key idea is that the compression only needs to preserve details to the level of human perception– a change is acceptable if humans cannot detect the change– JPEG (used for images) compression or MPEG-3 (abbreviated MP3 and used
for audio recordings) employ lossy compression
• Lossless compression preserves the original data without missing anything– lossless compression can be used for documents or in any situation where
data must be preserved exactly– when used for communication, a sender compresses the data before
transmission and the receiver decompresses the result– arbitrary data can be compressed by a sender and decompressed by a
receiver to recover an exact copy of the original

Friday
• Group research assignment 1 due at 11:59pm• Use class time to work on it
Related Documents