Foundations and Trends R in Information Retrieval Vol. 7, No 1 (2013) 1–145 c 2013 Oard and Webber DOI: xxxxxx Information Retrieval for E-Discovery [[ DRAFT: $Revision: 461 $ $Date: 2013-05-16 10:37:00 -0400 (Thu, 16 May 2013) $]] Douglas W. Oard 1 and William Webber 2 1 University of Maryland, College Park, MD 20742, USA, [email protected] 2 University of Maryland, College Park, MD 20742, USA, [email protected] Abstract E-discovery refers generally to the process by which one party (e.g., the plaintiff) is entitled to “discover” evidence in the form of “electronically stored information” that is held by another party (e.g., the defendant) and that is relevant to some matter that is the subject of civil litigation (i.e., what is commonly called a “lawsuit”). This survey describes the emergence of the field, identifies the information retrieval issues that arise, reviews the work to date on this topic, and summarizes major open issues.

Welcome message from author
This document is posted to help you gain knowledge. Please leave a comment to let me know what you think about it! Share it to your friends and learn new things together.
Transcript

Foundations and Trends R© inInformation RetrievalVol. 7, No 1 (2013) 1–145c© 2013 Oard and Webber
DOI: xxxxxx
Information Retrieval for E-Discovery[[ DRAFT: $Revision: 461 $
$Date: 2013-05-16 10:37:00 -0400 (Thu, 16 May 2013) $]]
Douglas W. Oard1 and William Webber2
1 University of Maryland, College Park, MD 20742, USA, [email protected] University of Maryland, College Park, MD 20742, USA, [email protected]
Abstract
E-discovery refers generally to the process by which one party (e.g., the
plaintiff) is entitled to “discover” evidence in the form of “electronically
stored information” that is held by another party (e.g., the defendant)
and that is relevant to some matter that is the subject of civil litigation
(i.e., what is commonly called a “lawsuit”). This survey describes the
emergence of the field, identifies the information retrieval issues that
arise, reviews the work to date on this topic, and summarizes major
open issues.

Contents
1 Introduction 1
2 The E-Discovery Process 4
2.1 Civil Discovery 4
2.2 The Rise of E-Discovery 10
2.3 The EDRM Reference Model 13
2.4 An IR-Centric E-Discovery Process Model 17
2.5 For Further Reading 24
3 Information Retrieval for E-Discovery 26
3.1 Defining the Unit of Retrieval 28
3.2 Extraction of Embedded Content 30
3.3 Representation 31
3.4 Specification 36
3.5 Classification 39
3.6 Clustering 41
3.7 Other E-Discovery Tasks 45
i

ii Contents
3.8 For Further Reading 50
4 Evaluating E-Discovery 52
4.1 Evaluation Methods and Metrics 53
4.2 Sampling and Estimation 62
4.3 Measurement Error 75
4.4 For Further Reading 79
5 Experimental Evaluation 81
5.1 Test Collection Design 82
5.2 The TREC Legal Track 84
5.3 Other Evaluation Venues 93
5.4 Results of Research on Test Collection Design 95
5.5 Research on System and Process Design 102
5.6 For Further Reading 111
6 Looking to the Future 112
6.1 Some Important Things We Don’t Yet Know 112
6.2 Some Prognostications 116
6.3 For Further Reading 117
7 Conclusion 118
A Interpreting Legal Citations 121
A.1 Case Law 122
A.2 Statutes and Rules 123
A.3 Other Court Documents 124
Acknowledgements 126
Notations and Acronyms 127

1
Introduction
Regular viewers of the mid-twentieth century courtroom drama Perry
Mason might be surprised to learn that the Fifth Amendment right
against self-incrimination enshrined in the U.S. Constitution applies
only to criminal law. In civil law, it is the obligation of parties to a
lawsuit to provide documents to the other side that are responsive to
proper requests and that are not subject to a claim of privilege (e.g.,
attorney-client privilege) (Scheindlin et al., 2012). In the law, this pro-
cess is called “civil discovery,” and the resulting transfer of documents
is called “production.” Amendments to the Federal Rules of Civil Proce-
dure in 2006 made it clear that the scope of civil discovery encompasses
all “Electronically Stored Information” (ESI), and thus was born the
rapidly growing field that has come to be called “e-discovery” (the dis-
covery of ESI, or Electronic Discovery) (Borden et al., 2011).
A confluence of interest between those working on e-discovery and
those working on information retrieval was evident from the outset,
although it has taken some time for the key issues to come into sharp
focus. E-discovery applications of information retrieval technology are
marked by five key challenges. First, e-discovery emphasizes fixed result
sets rather than ranked retrieval. Second, e-discovery focuses on high
1

2 Introduction
recall, even in large collections, in contrast to the high-precision focus
of many end-user applications, such as Web search. Third, e-discovery
evaluation must measure not just relative, but also absolute effective-
ness. Fourth, e-discovery connects information retrieval with techniques
and concerns from other fields (for instance, computer forensics and
document management). And fifth, the adversarial nature of civil liti-
gation, and the information asymmetry between requesting party (who
makes the request) and responding party (who has the documents),
makes e-discovery a substantially arms-length transaction.
While these challenges are not unique to e-discovery, the demands
of the e-discovery marketplace has focused research upon them. The
market for vendors of e-discovery systems has been estimated at $US
1 billion in 2010 (Logan and Childs, 2012); several times that figure
are spent on the staffing and processing costs to use those systems
effectively (Pace and Zakaras, 2012). In view of these large costs, in-
formation retrieval research can help to achieve two important societal
goals: (1) improving the return on this investment by enhancing the
effectiveness of the process for some given level of human effort (which
has important implications for the fairness of the legal system), and
(2) reducing future costs (which has important implications for broad
access to the legal system by potential litigants). Furthermore, funda-
mental technologies developed for e-discovery may have applications in
other fields as well. For example, the preparation of systematic reviews
of recent research on specific topics in medicine might benefit from ad-
vances in high-recall search (Higgins and Green, 2008), and personal
information management might benefit from advances in search tech-
nology that focus specifically on email (which at present is of particular
interest in operational e-discovery settings).
With that background in mind, the remainder of this survey is or-
ganized as follows. Chapter 2 on The E-Discovery Process begins with
an introduction to the structure of the process of e-discovery, focus-
ing principally on U.S. federal law, but with a brief survey of discov-
ery practice in other jurisdictions. The part of the e-discovery pro-
cess known as “document review” has been the focus of the greatest
investment (Pace and Zakaras, 2012) and is therefore our central fo-
cus in this manuscript. The chapter also introduces the three canoni-

3
cal information seeking processes (linear review, keyword search, and
technology-assisted review) that shape current practice in document
review. Chapter 3 on Information Retrieval for E-Discovery examines
specific techniques that have been (or could be) applied in e-discovery
settings. Chapter 4 on Evaluating E-Discovery discusses evaluation is-
sues that arise in e-discovery, focusing in detail on set-based evaluation,
estimation of effectiveness metrics, computation of confidence intervals,
and challenges associated with developing absolute as well as relative
measures. Chapter 5 on Experimental Evaluation reviews the principal
venues in which e-discovery technology has been examined, both those
well known in academic research (such as the Legal Track of the Text
Retrieval Conference (TREC)), and those more familiar to industry
(e.g., the Data Set project of the Electronic Discovery Reference Model
(EDRM) organization). Chapter 6 on Looking to the Future draws on
our description of the present state of the art to identify important
and as yet unresolved issues that could benefit from future information
retrieval research. Finally, Chapter 7, the Conclusion, draws together
some broader implications of work on e-discovery.

2
The E-Discovery Process
This chapter places technical issues of e-discovery in the context of
the legal process under which it is conducted. We discuss the place of
discovery in civil law in Section 2.1, while Section 2.2 describes the
rising importance of e-discovery in recent years. We then describe the
e-discovery process itself, with the aid of two models: first, the popular
EDRM model, in Section 2.3; and then, in Section 2.4, an alternative
model that more clearly identifies the parts of the process where infor-
mation retrieval techniques can have the greatest impact.
2.1 Civil Discovery
Discovery is the process whereby one party (the producing party) in
a legal case makes available to the other (the requesting party) the
materials in their possession which are pertinent to that case. The
chief venue for discovery is in civil litigation, but analogous processes
occur in regulatory (including antitrust) investigation, in freedom of
information requests, in the conduct of commercial due diligence, and
4

2.1. Civil Discovery 5
in criminal law.1 We focus in this survey on e-discovery under the U.S.
Federal Rules of Civil Procedure (FRCP).2 The rules in most U.S.
states are modeled on the federal rules, but considerable variation in
practice occurs in other countries. We therefore begin with a description
of the discovery process in the USA, and then we briefly review similar
processes in other jurisdictions.
2.1.1 Discovery in the USA
Which materials are pertinent to a case depends on the matter under
dispute, as laid out in a complaint document that makes specific alle-
gations, and more particularly in the requests for production that the
requesting party lodges with the producing party. A party may make
several production requests in a case, each covering a different aspect
of the case. Requests can be made not just from the plaintiffs to de-
fendants, but also from defendants to plaintiffs, and by either party to
third parties (The Sedona Conference, 2008b). We refer simply to re-
questing and producing parties in the context of any specific production
request.
Having received a request, it is the producing party’s responsibil-
ity to conduct a reasonable inquiry to find and return all material in
their possession that is responsive to that request. The search for re-
sponsive documents thus aims at comprehensiveness—in the jargon of
information retrieval, at recall. The producing party is also respon-
sible for ensuring that the production is not overly broad, obscuring
responsive materials amongst a mass of non-responsive materials. The
producing party can be sanctioned by the court for failing to return
responsive documents (under-production), as well as for returning too
many non-responsive ones (over-production). The law does not require
perfection at this task, but rather that the actions taken in response to
the request are reasonable (Oot et al., 2010; Baron, 2008), and that the
effort and expense is proportionate to the amount in dispute (Carroll,
1 For e-discovery in criminal law, see the Criminal Discovery Subcommittee of the Seventh
Circuit’s Electronic Discovery Pilot Program, http://www.discoverypilot.com/content/
criminal-procedure-subcommittee.2 http://www.law.cornell.edu/rules/frcp/

6 The E-Discovery Process
2010; The Sedona Conference, 2010a).
It is in the first instance up to the two parties to agree upon what
constitutes a reasonable and proportionate effort (for instance, not
searching backup tapes, or only searching documents produced after
a certain date). If the parties are unable to agree upon a protocol,
then the court must get involved. Some judges may be unwilling to de-
cide upon the technical details of production protocols (Baron, 2011);3
others may be forced to do so by the fundamental disagreements be-
tween the parties;4 and yet others may be prepared to make proactive
determinations about production methods.5
The scope of discovery under the FRCP is broad; the producing
party must produce not just documents that are significant to the case,
but all documents that are relevant to the production request. In legal
terms, the criterion is responsiveness, not materiality. Specifically, Rule
26(b)(1) of the FRCP states:
Unless otherwise limited by court order, the scope of
discovery is as follows: Parties may obtain discovery
regarding any nonprivileged matter that is relevant to
any party’s claim or defense—including the existence,
description, nature, custody, condition, and location of
any documents or other tangible things and the identity
and location of persons who know of any discoverable
matter. For good cause, the court may order discovery
of any matter relevant to the subject matter involved in
the action. Relevant information need not be admissible
at the trial if the discovery appears reasonably calcu-
lated to lead to the discovery of admissible evidence.
Materials may be withheld from production under the claim of priv-
3 Judge Facciola in United States v. O’Keefe, 537 F. Supp. 2d 14, 24 (D.D.C. 2008) com-
mented that choosing blind between search terms is “clearly beyond the ken of a laymanand requires that any such conclusion be based on evidence.” (See Appendix A for anexplanation of the legal citation practice used here and throughout this survey.)
4 Da Silva Moore v. Publicis Groupe et al., 2012 WL 607412 (S.D.N.Y. Feb. 24, 2012),
approved and adopted in Da Silva Moore v. Publicis Group, 2012 WL 1446534, at *2(S.D.N.Y. Apr. 26, 2012)
5 EORHB, Inc. v. HOA Holdings, LLC, Civ. No. 7409-VCL (Del. Ch. Oct. 15, 2012).

2.1. Civil Discovery 7
ilege, the most common forms of which are as an attorney-client com-
munication or an attorney work product, as defined by Federal Rule of
Evidence 502.6 Determination of privilege requires legal (rather than
only subject-matter) expertise, and may be performed as a separate
review of those documents previously identified as responsive. A log of
privileged documents is normally provided to the requesting party.
The producing party generally regards privileged documents as
highly sensitive, since client-attorney communications could disclose
case strategy or otherwise prejudice the producing party’s interests.
The law does provide for “clawback” of such documents if released in-
advertently (Facciola and Redgrave, 2009).7 However, if the producing
party is found to have not made a reasonable effort to protect their
privileged materials, they can be judged by the court to have waived
their privilege, thus allowing those materials to be used at trial,8 though
the court can release the producing party even from this reasonable ef-
fort requirement by issuing what is known as a 502(d) order (Grimm
et al., 2011). Even if privileged documents are successfully clawed back,
the literature on hindsight bias suggests that the requesting party may
simply no longer be able to think in the same way they had before
seeing the privileged information (Heuer, 1999).
There is an inherent asymmetry in the nature of the discovery pro-
cess (Baron, 2009). The requesting party must develop the production
request without access to the ESI, while the producing party must ex-
ecute that request on the ESI on behalf of the requesting party. To
address this asymmetry, and reduce the scope for gamesmanship and
disputes, the FRCP requires the parties meet in a pre-trial conference
(known as a meet and confer) and present a case management plan to
the court.9 Cooperation between parties is being increasingly urged by
legal commentators and the judiciary (The Sedona Conference, 2008d;
Paul and Baron, 2007). Advanced tools can allow for a more itera-
tive collaboration between the parties, through joint review of training
documents (Zhao et al., 2009), and recent cases using such technology
6 http://www.law.cornell.edu/rules/fre/rule_5027 Fed. R. Civ. P. Rule 26(b)(5)(B); Fed. R. Evid. 502.8 Mt. Hawley Ins. Co. v. Felman Prod., Inc., 271 F.R.D. 125, 136 (S.D.W.Va. 2010).9 Fed. R. Civ. P. Rule 26(f).

8 The E-Discovery Process
suggest that iterative collaboration is growing.10
2.1.2 Similar Processes In Other Jurisdictions
Discovery practice varies in jurisdictions outside the United States.
To begin with, the concept of discovery is mainly confined to com-
mon law jurisdictions, meaning (besides the US) the countries of
the British Commonwealth, particularly Canada, Australia, Singapore,
Hong Kong, and New Zealand, plus the Republic of Ireland,11 though
not all jurisdictions in the Commonwealth are common law (for in-
stance, Scotland is a civil law jurisdiction, as is the province of Quebec
in Canada for private law, including commercial law). Outside com-
mon law countries, quite different legal processes apply. For instance,
“[a] party to a German lawsuit cannot demand categories of documents
from his opponent. All he can demand are documents that he is able
to identify specifically—individually, not by category.”12 Similarly, Chi-
nese law does not require the exchange of information in litigation.13
Nevertheless, companies based in countries without discovery may still
find themselves subject to discovery proceedings if they trade with
countries that do observe discovery, most notably the United States.
Moreover, there are also discovery-like processes outside civil litigation,
such as responding to regulatory requests from government bodies.
Within the non-US common law countries, discovery practice is also
variable. Perhaps the most notable divide is over the scope of produc-
tion. Some jurisdictions follow the broader US standard of relevance
under which a document is discoverable if it possesses “relevance to one
or more facts at issue.”14 Others follow a tighter materiality standard,
10 Da Silva Moore v. Publicis Groupe et al., 11 Civ. 1279 (ALC) (AJP) (S.D.N.Y. Feb. 22,2012) (Document 92 of http://archive.recapthelaw.org/nysd/375665/); In Re: Actos
(Pioglitazone) Products, 2012 WL 3899669 (W.D. La. July 27, 2012) (http://pdfserver.
amlaw.com/legaltechnology/11-md-2299.pdf).11 http://chrisdale.wordpress.com/2012/11/27/a-hong-kong-ediscovery-snapshot-
in-the-company-of-epiq-systems/12 Heraeus Kulzer, GmbH v. Biomet, Inc., 2011 U.S. App. LEXIS 1389 (7th Cir. Jan. 24,
2011).13 http://www.insidecounsel.com/2012/12/03/like-the-great-wall-e-discovery-
barriers-still-exi?ref=hp&utm_source=buffer&buffer_share=dbf7d14 NSW (Australia) Uniform Civil Procedure Rules 2005, Regulation 21.2 (http://www.
austlii.edu.au/au/legis/nsw/consol_reg/ucpr2005305/s21.2.html)

2.1. Civil Discovery 9
stating (in these or other words) that a party is required to discover
only:
“(a) documents on which the party relies;
(b) documents that adversely affect the party’s own
case;
(c) documents that adversely affect another party’s
case; and
(d) documents that support another party’s case.”15
England and Wales follow (under the name e-disclosure) the materiality
standard (Bennett and Millar, 2006), though there recent modifications
to Part 31 of the Civil Procedure Rules flowing from the Jackson Review
allow courts more lee-way in varying the scope of disclosure.16. Aus-
tralia also observes materiality at the Federal level,17 though practice
varies at the state level, with for instance Victoria following a materi-
ality standard, New South Wales a relevance standard.18 Similarly, in
Canada, some provinces (for instance, Ontario and British Columbia)
follow a relevance standard, others (such as Alberta) a materiality stan-
dard (The Sedona Conference, 2008a), though in all jurisdictions there
is increasing emphasis on cost containment (Force, 2010; The Sedona
Conference, 2011a).
The difference between a materiality standard and a relevance stan-
dard from the point of view of retrieval is that the latter emphasizes
recall, whereas the former arguably emphasizes precision. Moreover,
the materiality standard has traditionally been seen as less onerous
upon the responding party, and so, in the new age of electronic discov-
ery (Section 2.2), perhaps calling for less sophisticated technological
15 Victorian Supreme Court (Australia) (General Civil Procedure) Rules 2005 – Sect
29.01.1.3 (http://www.austlii.edu.au/au/legis/vic/consol_reg/sccpr2005433/s29.
01.1.html)16 http://www.justice.gov.uk/courts/procedure-rules/civil/rules/part31;
http://www.legislation.gov.uk/uksi/2013/262/contents/made; http://www.scl.
org/site.aspx?i=ed3046517 Federal Court Rules (Commonwealth) O 15 r 2(3) (http://www.alrc.gov.au/sites/
default/files/pdfs/publications/Whole\%20ALRC\%20115\%20\%2012\%20APRIL-
3.pdf)18 NSW UCPR and VSC GCPR, op. cit.

10 The E-Discovery Process
involvement. Rules and practice are changing rapidly at present, how-
ever, in non-US jurisdictions as in United States.
2.2 The Rise of E-Discovery
Traditionally, discovery focused on paper documents, and a paper
mindset persisted for some time even as documents shifted to elec-
tronic media. The shift from paper to digital content—what is termed
“electronically stored information” (ESI)—has posed fundamental new
challenges to the discovery process, which have had to be met with a
combination of legal and technical responses.
At first, it might seem that ESI should be easier to search and pro-
duce than paper documents stored in filing cabinets—and in the long
term that may turn out to be true. But the rise of highly computer-
ized and networked enterprises initially made discovery more difficult
and expensive. The ease of creating digital content led to an explosion
in the amount created. Moreover, while paper documents were con-
structed and centrally filed by professional secretarial staff, electronic
documents are now created autonomously by employees and stored in
a profusion of locations and devices. Additionally, whereas in the age of
paper records, most communications were ephemeral and unrecorded,
with the advent of digital communication, much more communication
is stored and therefore discoverable (Paul and Baron, 2007).
Initially, e-discovery practitioners attempted to apply paper meth-
ods to electronic information, amassing all data from relevant custo-
dians and displaying it page by page on screen, or even printed out
on paper. Review itself was performed by an army of junior attorneys
reading through the documents one at a time, and marking them with
physical or virtual tags according to their responsiveness to the pro-
duction request(s). Such a method of search came to be known as linear
review. Review speed depends on the collection, requests, and review-
ers, but a rate of a few minutes per document is typical.19 Evidently,
19 Baron et al. (2006) report review rates for different topics at the TREC 2006 Legal Trackranging from 12.3 to 67.5 documents per hour, and averaging 24.7. The average rate was20 documents per hour in 2007, and 21.5 per hour in 2008 (Oard et al., 2008). Roitblatet al. (2010) describe a large-scale review, for both responsiveness and privilege, requiring
225 attorneys to each work nearly 2, 000 hours to review 1.6 million documents, at a rate

2.2. The Rise of E-Discovery 11
the cost of such an approach scales linearly with the collection size,
and as collections have grown dramatically, linear review has become
increasingly insupportable (Paul and Baron, 2007).
The next step was keyword search (Baron, 2008); that is, search
based on the presence or absence of specific terms. All documents
matching the keyword query were then subjected to linear manual re-
view. Thus, keyword search is a filtering step, aimed at cutting the
collection down to a manageable size while still (it is hoped) catching
the great majority of relevant material. Keyword search is a somewhat
imprecise term, however, since (almost) all techniques that might be
used to automatically identify potentially relevant documents are based
at least in part on the presence or absence of specific terms. Initially,
keyword search was used to refer narrowly to finding all documents that
contained some very specific search term (e.g., the name of a project or
a person). Later, the term was used somewhat more expansively to refer
to any sharply defined hand-crafted term-based specification of a re-
sult set (e.g., a Boolean query). Some e-discovery vendors subsequently
elaborated keyword search into what has been referred to as concept
search (Laplanche et al., 2004; The Sedona Conference, 2007c).20 Con-
cept search covers a range of technologies, from query expansion to
clustering documents for more focused review; in general, any search
method that goes beyond simple keyword matching might be referred
to as concept search.21 As corporate collections continued to grow, how-
ever, even filtering by keywords or (some representation of) concepts
left huge document sets that had to be linearly reviewed. Moreover,
there are long-standing questions about how reliable keyword searches
are at capturing all relevant documents (Blair and Maron, 1985).
Solving the scalability question while maintaining comprehensive-
ness has ultimately required adopting a higher degree of automation for
of 14.8 documents per hour. Borden (2010) cites a review of “fairly technical” documents
running at the rate of 45 documents per hour, and states 50 to 60 documents per houras the “e-discovery industry average.”
20 Disability Rights Council v. Washington Metropolitan Transit Authority, 242 F.R.D. 139(D.D.C. 2007).
21 A typical definition from an e-discovery vendor is “Conceptual search is defined as theability to retrieve relevant information without requiring the occurrence of the search
terms in the retrieved documents” (Chaplin, 2008).

12 The E-Discovery Process
locating relevant documents, through the use of more advanced meth-
ods. Such methods are sometimes now referred to as technology-assisted
review. One influential approach has been to apply supervised machine
learning to the classification task, which is now often referred to in e-
discovery circles as predictive coding. Whether predictive coding is an
acceptable, or even a mandatory, approach to e-discovery has been the
subject of several recent and ongoing cases.22
An important practical issue in e-discovery is the format in which
ESI is to be produced. Rule 34 of the FRCP states that “If a request
does not specify a form for producing electronically stored information,
a party must produce it in a form or forms in which it is ordinarily main-
tained or in a reasonably usable form or forms.”23 A common practice
in the early days of e-discovery (remarkable though it might sound to
contemporary ears) was to print all documents out and produce them
in hard copy; the requesting party would then typically scan and OCR
the documents to return them to digital form.24 Even today, docu-
ments can be, and sometimes are, requested as rendered TIFF images
if the intended process for using them will be manual (because such an
approach avoids the complexity of rendering many different document
types) (Marcus, 2006). Another, as yet not completely resolved, issue
22 In Global Aerospace Inc., et al., v. Landow Aviation, L.P. d/b/a Dulles Jet Center, etal., 2012 WL 1431215 (Va. Cir. Ct. Apr. 23, 2012), the court ordered the use of predictivecoding technologies, over the objections of the plaintiff. In Kleen Products LLC et al. v.
Packaging Corporation of America et al., 10 C 05711 (N.D .Ill.) (Nolan, M.J) (http:
//archive.recapthelaw.org/ilnd/247275/), the plaintiffs objected to the defendants’using Boolean keyword search to construct their production, and sought to have the court
force defendants to use “content-based advanced analytics;” the court instead required thetwo sides to negotiate further, and after discussion, the plaintiffs withdrew their objectionto the use of Boolean keyword search. In Da Silva Moore v. Publicis Groupe et al., 11Civ. 1279 (ALC) (AJP) (S.D.N.Y.) (http://archive.recapthelaw.org/nysd/375665/),
plaintiffs initially objected to the defendants’ use of predictive coding; at the time of thiswriting, plaintiffs have removed their objection to predictive coding, and the parties arenegotiating the discovery protocol to be employed. More recently still, in EORHB, Inc.v. HOA Holdings, LLC, No. 7409-VCL (Del. Ch. Oct. 15, 2012), the court preemptively
ordered both parties to use predictive coding, without either party having requested suchan order.
23 http://www.law.cornell.edu/rules/frcp/rule_3424 As recently as June 2011, the emails of former Alaska Governor Sarah Palin
were released in response to an open government request as 24,199 hard-copy,printed pages (http://gizmodo.com/5810955/palins-emails-released-in-the-most-
appropriately-stupid-manner-possible).

2.3. The EDRM Reference Model 13
Fig. 2.1 The EDRM Reference Model.
is which (if any) of the metadata associated with a document must be
produced.25
2.3 The EDRM Reference Model
The process of e-discovery involves many, possibly iterated, stages, and
these stages might be scoped and bounded in different ways when seek-
ing to emphasize different aspects of the process. Figure 2.1 shows
one very widely cited process model, known as the EDRM Reference
Model.26 The model specifically focuses on information processing, so
procedural activities such as the conference of the parties provide con-
text for the model, but are not explicitly represented.
From left to right, the model begins with the ongoing information
management activities of the organization.27 Although entitled “Infor-
25 National Day Laborer Organizing Network et al. v. United States Immigration and Cus-toms Enforcement Agency et al., 10 Civ. 3488 (S.D.N.Y). The court initially ordered thatcertain key metadata fields were an organic part of a document and must be producedby the government in response to an FOIA request. The government appealed based on
the widespread ramifications of this ruling; the court subsequently agreed, and withdrewthe order.
26 EDRM is the name of an organization whose first product was the Electronic DiscoveryReference Model. EDRM now encompasses several projects, so we (somewhat redun-
dantly) make it clear when it is EDRM’s Reference Model that we mean to refer to.27 A detailed description of each stage in the EDRM Reference Model can be found at
http://www.edrm.net/resources/edrm-stages-explained

14 The E-Discovery Process
mation Management,” the intent is to encompass all of the regular
information processing activities of an organization prior to the start
of an e-discovery process. Thus, that leftmost stage in the model also
includes activities that may be outside the direct control of the infor-
mation management staff of an organization, and possibly outside the
control of the organization itself. Examples include records manage-
ment (e.g., to meet legal, regulatory or policy goals), archival storage
of records that are appraised as having permanent value, information
processed using personally owned devices such as smartphones or home
computers, and information managed by other providers (e.g., “cloud
services”).28
The second stage in the EDRM Reference Model, “Identification,”
involves finding the information in the diverse information process-
ing ecosystem that must be searched. This might be done by internal
staff (typically information management staff working together with
lawyers), or consultants with specialized expertise may be called in.
Either way, this is a team activity, calling for both legal and techni-
cal knowledge. Two broad classes of activities are subsumed in this
stage. First, information systems that may contain responsive informa-
tion need to be identified. This process is often referred to as “data
mapping,” and it produces a “data map” that depicts the informa-
tion stores and information flows, often using generic categories (e.g.,
“personal computers”) when a large number of similar devices are in-
volved (Fischer et al., 2011).29 Much of the work of data mapping can
(and, in best practice, should) be done prior to litigation, as part of
the organization’s information management procedures. Second, deci-
sions need to be made, and agreed between the parties, about which
systems information will be collected from, and what restrictions will
be placed on the collection process (e.g., limiting collection to specific
custodians, specific date ranges, and/or specific file types). Informa-
tion retrieval researchers will recognize this as an instance of federated
28 See The Sedona Conference (2007a) for best-practice recommendations on informationmanagement for e-discovery.
29 In E-Discovery, “data” and “information” are often used interchangeably; the use of“data” in this context does not imply a specific focus on databases, just as our use of
“information” throughout this survey is not intended to imply the exclusion of databases.

2.3. The EDRM Reference Model 15
search,30 but e-discovery practitioners do not typically think of it as a
search process. The reasons for that are both historical and practical.
Historically, pulling boxes from a file room was the direct analogue of
what is now the Identification stage in the EDRM Reference Model,
a process more akin to acquisition than to search. Practically, even in
the digital era, organizations typically have no index that can search
across the broad range of information systems involved, which could
potentially include offline backup tapes, memory sticks in the bottom
of desk drawers, and email stored on home computers. As a result,
decisions about Identification are typically made prior to search, and
with little in the way of formal evaluation of the amount of responsive
ESI that may be missed.
The third stage of the EDRM Reference Model involves two explic-
itly depicted functions, “Collection” and “Preservation.” Collection is,
quite simply, actually getting what you decided to get. This may in-
volve using ordinary access means (e.g., issuing queries to an operating
database), using specialized means for access that avoid altering the
stored information (e.g., file system reads using software or hardware
approaches to avoid altering the “last accessed time” metadata), or
using forensic techniques to recover otherwise inaccessible information
(e.g., creation of a disk image from a personal computer in order to sup-
port recovery of deleted files from “slack space” that has not yet been
reallocated). Preservation involves three basic functions: maintaining
the bit stream, maintaining the information necessary to interpret the
bit stream, and maintaining evidence of authenticity for the bit stream.
To maintain the bit stream, replication is normally used for “preserva-
tion copies,” and all analytical manipulations are performed on “service
copies” (Stewart and Banks, 2000). The information necessary to in-
terpret the bit stream (e.g., file type and time created) is normally
captured as metadata along with the file, and is preserved in the same
way. To maintain evidence of authenticity, a cryptographic hash is nor-
mally created and then escrowed in separate storage to which access is
restricted in a manner intended to prevent malicious alteration. Matters
30 In federated search, multiple collections are available. Two decisions must be made: which
collections to search; and how to merge the results obtained from the searched collections.

16 The E-Discovery Process
related to preservation attract considerable attention in the e-discovery
literature (The Sedona Conference, 2008c), though they are often not
directly relevant to information retrieval.
The fourth stage of the EDRM Reference Model has been the prin-
cipal focus of attention to date from the information retrieval research
community. This stage involves three explicitly depicted functions,
“Processing,” “Review” and “Analysis.” Processing, in this context,
refers to operations performed on service copies to prepare the col-
lection for review. In the era of linear review, this involved rendering
page images for each file type and formatting appropriate metadata for
display with each page image. In the era of technology-assisted review,
the Processing function would also involve feature generation and in-
dexing; essentially, processing is whatever needs to be done in advance
of Review. Review, in the era of manual linear review, involved some-
one looking at each document and making decisions on responsiveness,
privilege, and perhaps other issues (a process referred to in e-discovery
as “issue coding”). In the era of technology-assisted review, Review
will generally still involve some human examination of individual doc-
uments, but it can also involve aggregate specification of sets (e.g.,
using queries), classifier training, and automated classification. Analy-
sis is the term used by EDRM to indicate the control over the Review
process. Information retrieval researchers would recognize the Analysis
function as combining information seeking behavior (e.g., analysis of
what you want) and formative evaluation (e.g., analysis of how well
you are doing at finding it).
The fifth stage of the EDRM reference model, Production, involves
the delivery of responsive and non-privileged ESI to the requesting
party, often accompanied by a log identifying any responsive and privi-
leged ESI that has been withheld. The produced digital documents are
typically accompanied by what is referred to in e-discovery as a “load
file,” providing additional metadata not contained in the documents
themselves.
The final (rightmost) stage in the EDRM Reference Model is Pre-
sentation. This involves the use of produced ESI to elicit further infor-
mation (e.g., in a deposition), to support legal analysis, and to persuade
(e.g., during a trial).

2.4. An IR-Centric E-Discovery Process Model 17
Although the EDRM Reference Model is widely referred to, it pro-
vides just one way of looking at what is a complex and nuanced pro-
cess. The EDRM Reference Model predates the current focus on both
technology-assisted review and on “Early Case Assessment” (see Sec-
tion 2.4.5), so it is not surprising that the details of the model are
perhaps better suited to explaining linear review than to explaining
more recent developments. Nonetheless, the EDRM Reference Model
is useful to information retrieval researchers precisely because of such
limitations—by capturing the ways in which e-discovery practitioners
have traditionally thought about the process, the EDRM Reference
Model can serve as a useful guide for helping to interpret the legal
literature on this topic.
2.4 An IR-Centric E-Discovery Process Model
In the remainder of this section, and throughout this survey, we adopt a
view of the E-Discovery process that is both broader and more focused
than that of the EDRM Reference Model, one that is crafted to specif-
ically focus on the potential points of impact for information retrieval
research.31 Our perspective is broader than that of the EDRM Refer-
ence Model because we start with the formulation and interpretation of
the production request, one of the principal points of contact between
e-discovery and information seeking behavior research. Our perspec-
tive is narrower than that of the EDRM Reference Model in that we
focus sharply on information retrieval tasks that produce five key re-
sults: (1) the production request, (2) the collection to be searched, (3)
the responsive documents in that collection, (4) among the responsive
documents, those that are subject to a claim of privilege, and (5) the
insight that results from interpreting the contents of a production. The
tasks in our process model each fundamentally implicate IR research,
and each will have some place in any comprehensive E-Discovery pro-
cess model. Figure 2.2 depicts this model.
31 Conrad (2010) offers another alternative model.

18 The E-Discovery Process
����������
�� �������
��������
�������� ����������
�������� �� ����
� �������� ������
���������
�������������
� �������
�����
Fig. 2.2 An IR-Centric E-Discovery Process Model. Dashed lines indicate requesting partytasks and products, solid lines indicate producing party tasks and products.
2.4.1 Formulation: Creating Production Requests
The first stage of an e-discovery process begins with the production re-
quest. The request resembles what in IR evaluation is called the topic,
and what Taylor referred to as the “formalized information need” (Tay-
lor, 1962). Although in fully automatic IR evaluation it is common to
create a query automatically from the topic, that is not how production
requests are intended to be used in e-discovery. Rather, it is expected
that the producing party will manually interpret the production re-
quest and then engage in whatever query formulation and result review
process is appropriate to properly respond to the request (possibly in
consultation with the requesting party). In that sense, a production
request is more akin to the sort of topic statement that is presented to
a user in an interactive IR user study. The meet and confer between
the parties, described above in Section 2.1, occurs during this stage.

2.4. An IR-Centric E-Discovery Process Model 19
2.4.2 Acquisition: Assembling the Collection
Once the content and scope of the production have been agreed upon,
the producing party must assemble the collection to be searched. Be-
cause the domain from which the collection could be drawn is poten-
tially huge, a drastic winnowing of this material takes place in which
specific inclusion and exclusion criteria are used to bring the task down
to a manageable degree of complexity and (hopefully) to bring the
resulting collection down to a manageable size. These criteria (often
referred to by lawyers as ‘filters’) focus on information systems, custo-
dians, date ranges, and file types. Sometimes, the presence of specific
terms is also required.32
It is worth reflecting on the implications of this winnowing process
for the comprehensiveness of a production. Typically, when we eval-
uate comprehensiveness (or, as it is more formally known, recall), we
consider (and sample) only the collection at hand—that is, the set of
documents collected after the winnowing process. It may be, however,
that there are responsive documents amongst the chaff that has been
winnowed. For instance, a custodian that organizational analysis had
identified as not related to the case may unexpectedly hold relevant
information (e.g., because they were cc’d on some relevant email mes-
sage) (Wang et al., 2009); or there may be documents on backup tapes
that are no longer held on spinning disks; or what were thought to be
system files based on file-type identifiers (e.g., .bat or .exe) may actually
have been documents that some bad actor had sought to conceal.
The bar to including some of these missing sources may be the prac-
tical expense of obtaining specific types of ESI (e.g., deleted files on
personal hard drives). But insofar as readily accessible documents have
been filtered out simply to make the resulting collection smaller, we
32 An example agreement on the requirements for the search protocol is Oracle America,
Inc. v. Google Inc., 10 Civ. 03561 (N.D.Cal. Dec. 17, 2011) (“Response to re 56 CaseManagement Scheduling Order”) (Document 67 of http://dockets.justia.com/docket/
california/candce/3:2010cv03561/231846/), which specifies that the producing party
must include search terms specified by the requesting party in their search, as well asdiscussing handling of custodians and of privileged documents. More recently, a court hasapproved a process in which keyword filtering was used to construct a collection, whichwas only then entered into a predictive coding system; see in re: Biomet M2a Magnum
Hip Implant Prods. Liab. Litig., NO. 3:12-MD-2391 (N.D. Ind. Apr. 18, 2013.)

20 The E-Discovery Process
should realize that such decisions raise risks regarding recall and that
these risks may not be well characterized. Moreover, the costs of craft-
ing algorithms to avoid collecting specific types of content may actually
exceed the costs of storing and automatically searching that content,
since automated techniques allow large collections to be searched for a
relatively small marginal cost when compared with smaller collections.
It should be noted at this stage that, while good records manage-
ment practices can, in some cases, reduce the expense and increase the
reliability of discovery, it is rarely the case that a production request
can be satisfied simply by running searches in a records management
system.33 There are two reasons for this. First, the scope of e-discovery
simply exceeds the scope of records management in that records man-
agement is applied only to “records” of activity that have recognized
value at the time of their creation, use, or disposition, whereas e-
discovery applies to all ESI regardless of whether its value was pre-
viously anticipated. Second, in some organizational settings (notably,
in businesses) records management is informed not just by anticipated
value but also by risk management decisions.
Recognizing that retaining and managing information incurs costs
(both financial costs such as for storage, and other types of costs such as
the risk of unauthorized disclosure of sensitive information), the law al-
lows organizations to destroy information when it is no longer required
in the ordinary course of business. There are two exceptions to this
broad permission: (1) information that may be relevant to reasonably
anticipated litigation cannot be destroyed, and (2) some information is
required to be retained for defined periods by law or regulation. Busi-
nesses seeking to limit risk are wise to avail themselves of their right
to destroy information before the threat of litigation arises, a fact that
information retrieval researchers (who naturally tend to focus on the
value of finding things over the value of not being able to find things)
33 A records management system is a system for capturing, preserving, and disposing ofbusiness records produced by a company or organization. Frequently extended nowadays
to an “Electronic Document and Record Management System” (EDRMS), to incorpo-rate the management of (electronic) documents as they are being created and used,not only when they become business records. See “Implementing an EDRMS – KeyConsiderations”, National Archives of Australia, 2011, http://www.naa.gov.au/records-
management/agency/digital/EDRMS/index.aspx.

2.4. An IR-Centric E-Discovery Process Model 21
often initially have difficulty understanding. Destroying information in
a records management system may not, however, destroy all copies of
that information. So implementation of a process for authorized de-
struction of centrally stored records could, in at least some cases, sim-
ply increase the need to look beyond the records management system
for information that may still exist elsewhere that is responsive to a
production request (McGann, 2010).
2.4.3 Review for Responsiveness: Finding the Relevant ESI
Review for responsiveness is the stage that is most similar to a standard
information retrieval process, although there are important differences
in the nature of the query and the querier (detailed, expert, and time-
committed), the nature of the production (set-based, and possibly very
large), and the measures of success (emphasizing recall over precision).
The goal of review for responsiveness is to produce a set of relevant
documents. The definition of relevance has traditionally been a legal
judgment of an attorney for the producing party who must certify that
the production is complete and correct. Production protocols are, how-
ever, increasingly providing for validation processes that also involve
the requesting party.
Collections assembled from many sources will naturally contain du-
plicates: the one email sent to many recipients; the one contract held
in many folders; and so forth. For example, in the TREC Legal Track
Enron collection (see Chapter 5 on Evaluation Resources), 63% of the
email messages were classed by the organizers as duplicates of other
messages in the collection (Cormack et al., 2010). De-duplication is
therefore first applied to identify a canonical version of each item and
then to simply record every location where that item was found (Nel-
son and Simek, 2009; Kershaw and Howie, 2009). De-duplication serves
several purposes, including reducing collection size, preventing manual
reviewers from having to review one document multiple times, limiting
redundancy in training data for automated classification techniques,
and supporting social network analysis (by noting which custodians
held identical ESI). The focus at this stage is typically on “exact”,
bitwise-identical duplicates (perhaps after some transformations to nor-
22 The E-Discovery Process
malize formatting and to remove incidental content such as email mes-
sage path header fields that may cause inconsequential variations in
otherwise identical ESI). Referring to this as de-duplication (as is com-
mon in e-discovery) is perhaps somewhat misleading; what is really
meant is “duplicate detection.”
How the review process itself is carried out depends upon the
method employed, be it linear review, keyword search, or technology-
assisted review (Section 2.2). We focus in this survey on technology-
assisted review.
2.4.4 Review for Privilege
After the review for responsiveness, a subsequent review of the respon-
sive documents for privilege will often also be needed (Scheindlin et al.,
2012, Chapter IX). In a full manual review, review for privilege might be
conducted at the same time as review for responsiveness, or it might be
conducted as a separate step. Even in technology-assisted reviews, re-
view for privilege is frequently performed as a separate, manual review,
as attorneys may be skeptical of the reliability of automated privilege
review. Moreover, since assessments of privilege can require expert le-
gal knowledge, privilege review can be particularly expensive.34 Only
documents that are to be produced must be reviewed for privilege; but
production sets can be quite large.
As a result of these factors, review for privilege is one of the major
obstacles standing in the way of lowering production costs through the
use of automated technology. The judiciary has tried to address this
problem by adding the clawback provisions to rules of procedure and
evidence, as discussed in Section 2.1, but technical approaches have
been the focus of little work to date (though see Section 5.2.3 for the
inclusion of a privilege task in the TREC 2010 Legal Track).
34 “It’s the second-line review that kills us, the one for privilege; some firms try to chargeus $320 per hour for using third-year associates for this sort of work” (quoted in Pace
and Zakaras (2012, page 26)).

2.4. An IR-Centric E-Discovery Process Model 23
2.4.5 Sense-Making: Generating Insight
Once the producing party delivers its production, the requesting party’s
sense-making task begins (Attfield and Blandford, 2010; Wilson, 1999).
The ultimate goal of discovery is to find evidence of activity in the
real world, not merely to find responsive ESI; it is through the sense-
making process that ESI becomes evidence. The requesting party will
seek to understand the so-called “5 W’s:” Who, What, When, Where,
and Why. Who involves not merely which people are involved, but also
their roles and their interests. What involves both what happened and
what objects were involved. When involves both absolute (calendar)
time and the relative sequencing of events. Where involves either phys-
ical location or locations in an information system. And why might be
established either in an explicit statement from someone involved, or
by fitting together pieces of a puzzle around some hypothesis. This is
Sherlock Holmes’ territory, and ESI provides only one part of a rich col-
lection of sources; other potential sources include physical documents
from various sources, statements and depositions from people involved,
and information that is on the public record or that is otherwise avail-
able to the requesting party (e.g., from its own information systems).
As the dashed lines with arrows in Figure 2.2 (which represent re-
questing party information flows) indicate, this process yields two re-
sults. One possibility is that it may directly yield needed insight; the
other is that it may inform the formulation of additional production
requests (or it may lead to seeking additional information in some other
way). Repeated iterations of requests and production are uncommon
in civil litigation, though iterativity and interactivity between the par-
ties is increasingly encouraged (The Sedona Conference, 2008d). The
darker lines in Figure 2.2 therefore indicate the primary information
flows.
Figure 2.2 is a somewhat simplified depiction, omitting the parallel
sense-making process that occurs throughout the process by the pro-
ducing party. Unlike the requesting party, the producing party need
not complete the reviews for relevance and privilege before beginning
sense-making. Indeed they would be unwise to do so, because early
sense-making results could help to improve their collection process

24 The E-Discovery Process
and/or the accuracy of their review process. When a producing party’s
sense-making process is conducted early in the process, it is typically
referred to in e-discovery as “Early Case Assessment” (Solomon and
Baron, 2009). In such cases, the producing party’s goals will largely
mirror those of the requesting party, but with the additional goals of
learning which documents should be collected and how reviews for re-
sponsiveness and privilege should best be conducted.
A broad range of tools might be employed to support this sense-
making process. Some obvious examples include ranked retrieval, clus-
tering, summarization, information extraction, data mining, gap analy-
sis (e.g., to detect missing parts of email threads), and visual analytics.
Indeed, this is a natural application of the so-called “concept retrieval”
tools originally marketed for the more formal review process.
2.5 For Further Reading
• The Sedona Conference is an association of legal practitioners
that provides impartial commentary and recommendations
on issues in complex litigation. Working Group 1 of the Se-
dona Conference is devoted to e-discovery, and over the years
it has produced over two dozen widely-cited white papers on
matters in e-discovery practice, aimed at a legal audience.35
“The Sedona Principles: Best Practice Recommendations for
Addressing Electronic Document Production” (The Sedona
Conference, 2007b) is a good starting point.• Scheindlin et al. (2012) collect and provide extended com-
mentary on US rules and case law across a wide range of
topics in e-discovery, while Berman et al. (2011) contains
essays by leading e-discovery practitioners.• Clive Freeman maintains a web page, “Electronic Disclo-
sure”, providing links to a wide range of resources on
e-discovery and e-disclosure in jurisdictions outside the
United States,36 while the blog of Chris Dale covers the
same territory, with a focus on practice in England and
35 https://thesedonaconference.org/publications36 http://www.edisclosure.uk.com/wiki_new/index.php?title=Electronic_Disclosure

2.5. For Further Reading 25
Wales.37 Working Group 7 of the Sedona Conference (“Se-
dona Canada”) produces recommendations and commen-
taries upon e-discovery practice in Canada, while Working
Group 6 discusses disclosure issues for organizations working
across multiple international jurisdictions.• As described above, EDRM is an industry association of ven-
dors and customers of e-discovery systems.38 The EDRM
Reference Model was their earliest, and still their best known,
creation, but EDRM also has initiated projects on standard-
ization, education, and other topics.• The literature on sense-making for e-discovery is not yet as
well developed as the literature on review for responsive-
ness; the field has yet even to converge on a way of speaking
about such issues with any degree of clarity or comprehen-
siveness. One notable exception is Attfield and Blandford
(2010), which reports on workplace studies of sense-making
and refinement by lawyers in an e-discovery context.• A workshop series known as DESI (for Discovery of Electron-
ically Stored Information) has served as a point of contact
between e-discovery practitioners and technologists with a
broad range of interests. The proceedings of each workshop
are available online.39
37 http://chrisdale.wordpress.com/38 http://www.edrm.net/39 http://www.umiacs.umd.edu/˜oard/desi5/, which also has links to earlier workshops.

3
Information Retrieval for E-Discovery
David Lewis has observed that pretty much all of e-discovery is classi-
fication.1 When limited in scope to review for responsiveness and priv-
ilege, this is largely true. The problem of determining whether some
ESI is responsive to a request is a binary classification problem for the
simple reason that in the end, the document must either be determined
to be responsive (and thus to be considered for production) or not to be
responsive. The problem of determining whether some responsive ESI
is subject to a proper claim of privilege (and thus to have its existence
disclosed, but not to be produced, or to be produced only after some
redaction has been applied) is similarly a binary classification problem.
That is not to say that ranking techniques might not be useful as a tool
for supporting decisions regarding relevance or responsiveness, but ul-
timately those are indeed binary classification tasks, whether the final
decision is to be made by human or by machine.
This formulation begs one important question, however: what, in
this context, do we mean by “some ESI?” In particular, we need to
define the unit of retrieval. That, therefore, is where the story of In-
1 Said in a talk at the SIGIR 2011 Information Retrieval for E-Discovery (SIRE) Workshop.
26

27
Feature Set
Transformation
Feature
Construction
Classification
Specification
Employment
Process
Representation
Process
ESI
Result Set
Fig. 3.1 Four layers of the classification process. The bottom two layers result in a repre-sentation of the ESI on which classification can be performed; the top two layers producethe classification result.
formation Retrieval (IR) for e-discovery must begin (in Section 3.1).
That’s followed by a description of issues that arise with teasing apart
embedded ESI (in Section 3.2). The classification process then proceeds
in four stages, as illustrated in Figure 3.1. We focus first on represent-
ing ESI in Section 3.3, then on specifying to a system what ESI needs
to be found in Section 3.4, and finally on actually finding that ESI
(in Section 3.5). The chapter concludes with descriptions of some re-
lated tasks, including broadly useful capabilities for grouping ESI (in
Section 3.6) and specific tasks such as acquisition and production that
occur earlier and later in the e-discovery process (in Section 3.7).

28 Information Retrieval for E-Discovery
3.1 Defining the Unit of Retrieval
Justice Antonin Scalia of the U.S. Supreme Court has written “In our
favored version [of an apocryphal story], an Eastern guru affirms that
the earth is supported on the back of a tiger. When asked what supports
the tiger, he says it stands upon an elephant; and when asked what
supports the elephant he says it is a giant turtle. When asked, finally,
what supports the giant turtle, he is briefly taken aback, but quickly
replies ‘Ah, after that it is turtles all the way down.’ ”2 The situation
with units of review for e-discovery bears some resemblance to that
story.
The Sedona Conference Glossary defines a document family to be
“A collection of pages or files produced manually or by a software appli-
cation, constituting a logical single communication of information, but
consisting of more than a single stand-alone record” (The Sedona Con-
ference, 2010b). Common examples of document families include the
scanned pages of a book, a cover letter along with any attached docu-
ments, or an email message along with its attached files. In e-discovery,
the unit of Electronically Stored Information (ESI) that is subject to
production is generally understood to be the document family, not the
individual file (i.e., not the page of the scanned book, the cover letter
alone, or the email message without its attachments).
A document family is therefore the information object for which
decisions about responsiveness and privilege must be made. That is
not to say, however, that those decisions should be made in isolation.
Consider, for example, the case of an email message, the only content
of which is “sure – let’s do it!” It matters a great deal whether the
message being replied to had proposed murder, malfeasance, or lunch.
For this reason, it is common to group email messages into threads, and
to make initial decisions about the threads. Similarly, a decision that
some attachment is responsive might lead to a conclusion that other
copies of the same attachment might be responsive. For this reason, it is
common to identify duplicate documents and to make initial decisions
about each unique item.
2 Rapanos v. US, 547 US 715 (2006).

3.1. Defining the Unit of Retrieval 29
Similar examples of grouping documents for the purpose of review
abound in e-discovery. Even the common practice of selecting the cus-
todians3 from whom documents should be collected is a coarse-grained
way of grouping documents and deciding on entire sets at once. When
reviewing so-called loose files (i.e., documents in a file system, as op-
posed to documents attached to an email), entire directory trees might
be removed from consideration. A “.zip” archive containing many ex-
pense reports might be excluded after examining only a few of the
reports. The unit of review need not, and often does not, equate to the
unit of production. In other words, just because it is document families
that are produced does not mean that it should be document families
that are reviewed. Reviews can reasonably work with both finer-grained
sets (e.g., individual attachments) and coarser-grained sets (e.g., email
threads), at least initially.
From an information retrieval perspective, document granularity is
an important design decision. In a typical information retrieval research
setting, the boundaries of a document seem self-evident. In a library
catalog, we might seek to find books; in newspapers, articles; on the
Web, Web pages. But document granularity has always been with us
to some degree: the one book might be available in different editions,
some newspaper articles are part of a series of articles on the same
topic, and Web pages are often organized into Web sites. The question
of granularity is not new to information retrieval; what is new is the
attention it demands in e-discovery.
In e-discovery, much of the publicly reported experimentation has
worked with document-based measures. An exception was the TREC
Legal Track’s Interactive task in 2009 and 2010, which focused on doc-
ument families; specifically, on email messages together with their at-
tachments (Hedin et al., 2009; Cormack et al., 2010). Exploitation of
email threads has most often been discussed in the context of redun-
dancy suppression (since threads often contain redundant quoted text,
reviewing the later messages in a thread might obviate the need to
3 The term custodian is often used generically in e-discovery to refer to a person havingcontrol over specific ESI. The term does not necessarily imply physical control; the ownerof an email account for which the messages are stored on a central server is often referred
to as a custodian of the ESI in that account.

30 Information Retrieval for E-Discovery
review earlier messages) (Kershaw and Howie, 2010) or as a way of
grouping messages for display (Joshi et al., 2011). The direct use of
threads as unit of retrieval has been reported in other settings (Elsayed
et al., 2008), but we are not aware of its reported use in e-discovery.
Moving beyond the domain of primarily unstructured textual docu-
ments, retrieval from databases and other structured data sources poses
even more complex challenges in determining the unit of retrieval (The
Sedona Conference, 2011b). The work on evaluation of retrieval from
XML documents offers some insight on this question (Fuhr et al., 2002).
3.2 Extraction of Embedded Content
Documents can be embedded inside other objects, and identifying, ex-
tracting, and separately processing embedded content can be beneficial.
Attachments are easily separable from emails, and compressed (e.g.,
.zip) archives can be expanded. Documents can also be embedded in-
side other documents, as in Microsoft’s Object Linking and Embedding
(OLE) standard, where (say) a chart from a spreadsheet can be em-
bedded in a Word document.
An important special case in e-discovery is the embedding of one
email message within another, sometimes as an explicit attachment, but
more commonly as quoted text. The format for quoting responded-to
text differs between different email client systems, and it can vary de-
pending on whether a message is replied to or forwarded. Nevertheless,
a small number of format parsers can accommodate the formats of
the vast majority of messages in any one collection. Since responders
can generally edit the email they are responding to, issues of authen-
ticity and completeness arise; and the embedded email may be refor-
matted and lose its original attachments. Emails recovered from such
embedding are often called hidden emails because simply indexing each
stored message could miss some messages (or parts of messages) that
are “hidden in plain sight” within other messages, and which may not
be otherwise present in the collection.

3.3. Representation 31
3.3 Representation
Once the unit of retrieval has been decided, and embedded documents
have been extracted, the next question is how best to represent these
units to support the classification task. In information retrieval, this
process is often referred to as “indexing,” a term which places empha-
sis on the construction of data structures to support rapid responses
to queries. We prefer the term “representation” because it places the
emphasis on what aspects of the units of retrieval can be used as a basis
for classification. Information retrieval researchers have long experience
with content-based retrieval in which the representation is built from
counts of term occurrences in documents, but specialized systems also
use other features (e.g., metadata found in library catalogs, the link
structure of the Web, or patterns of purchase behavior). Borrowing a
term from machine learning, we might call the process of crafting useful
features “feature engineering” (Scott and Matwin, 1999). As Figure 3.1
illustrates, feature engineering involves two tasks: construction of po-
tentially useful features, and (often) transformation of the resulting
feature set to accommodate the capabilities and limitations of the clas-
sification technique that will be employed. Four broad types of features
have been found to be useful in IR generally over the years: content;
context; description; and behavior. Content is what is inside the docu-
ment itself; the remaining three are varieties of metadata.
3.3.1 Content Representation
What constitutes a document’s content varies depending upon docu-
ment type; text predominates, but other media forms occur, and even
text comes in multiple forms.
In representing text, common processing techniques such as the re-
moval of stopwords and stemming are as applicable in e-discovery as
in other applications, though care may need to be taken to account
for domain-specific terminology and acronyms. Term weights are calcu-
lated in the usual way, giving emphasis to terms frequent in a document
but rare in the collection (Salton and Waldstein, 1978). In e-discovery,
semi-structured text is common, particularly in an email’s wide range
of header fields and body segments (e.g., new text, quoted text, auto-

32 Information Retrieval for E-Discovery
matically inserted signature, boilerplate disclaimers); representations
that respect this structure can be useful.
Mixed-language content, either within or between documents, can
pose challenges, as available machine translation resources may not be
suited to the genre (e.g., email) or content (e.g., terminology unique
to an industry or organization). For the most part, however, standard
techniques from cross-language information retrieval can be used. These
include statistical alignment and dictionaries as sources of translation
mappings, mapping term frequency and document frequency statistics
to the query language language before computing term weights, pre-
and post-translation blind relevance feedback, and the use of cognate
matching for unknown words (Oard, 2009).
The representation of spoken content for e-discovery (e.g., from
voicemail) poses no unusual challenges to standard speech retrieval
techniques, such as speaker adaptation (e.g., training speech recogni-
tion to optimize accuracy for the owner of a voicemail account) and
the use of phonetic matching for out-of-vocabulary terms (Olsson and
Oard, 2009).
Scanned documents are becoming markedly less prevalent in dis-
covery generally, but they are still more common in e-discovery than
in many other retrieval tasks, in part because it is common to find
scanned documents as attachments to email messages. Layout analysis
can help to extract fields with particular semantic interpretations (for
instance, to identify the from address in emails that have been included
in the collection by printing and scanning, as was common practice in
the past) (Shin et al., 2001). Other techniques from document image re-
trieval are applicable, such as Optical Character Recognition (OCR),
statistical correction of OCR error effects, and character n-gram in-
dexing (to accommodate moderate character error rates) (Doermann,
1998). Specialized techniques such as signature matching or handwrit-
ing recognition can also be useful for identifying document authors and
annotators (Zhu et al., 2009). Handwritten content is easily detected,
but not as easily deciphered (Manmatha et al., 1996).
Representing image content in specialized ways can be useful when
processing still and moving images. For example, face matching tech-

3.3. Representation 33
niques (e.g., eigenface) can be used to identify photographs of a spe-
cific person (Zhang et al., 1997), and specialized activity detection al-
gorithms (e.g., automated detection of moving objects in surveillance
video) can be used to focus a reviewer’s attention on those portions of
a long video that are most likely to contain specific evidence that is
sought (Medioni et al., 2001).
Indeed, it is possible to imagine some e-discovery application for al-
most any information retrieval content representation technique. Music
fingerprinting (Wang, 2006), for example, might be useful for cases in
which copyright violations in the course of file sharing are alleged; tech-
niques for representing the topical expertise of individuals who have
authored scientific articles (Balog, 2008) might be useful in a patent
infringement case; and a standardized representation for mathematical
formulas could help to find spreadsheets that implement specific types
of financial models. Although e-discovery does place greater emphasis
on some content representation issues than has been the case to date
(e.g., by focusing attention on the consequences of gaps in the lexical
coverage of translation resources for high-recall search when represent-
ing mixed-language content), there is in general little about content
representation that is unique to e-discovery.
3.3.2 Contextual Metadata
Defined succinctly, contextual metadata is any representation that
serves to characterize the context within which some content was gen-
erated. Much contextual metadata is inferred, and even some appar-
ently explicit metadata requires interpretation (for instance, knowing
the time zone to which a timestamp belongs). The document family
to which a document belongs is a fundamental form of context; for in-
stance, the email to which a document is attached. Email header fields
offer rich sources for context, such as authorship, recipient, and date
of transmission (Kiritchenko et al., 2004). Other document types also
provide contextual metadata, or can have contextual metadata inferred
for them. File systems store file creation times; some file types (e.g.,
Microsoft Word) can store version history information, allowing earlier
versions of a document to be recreated; and near-duplicate detection

34 Information Retrieval for E-Discovery
systems may enable the recreation of version-of relationships between
files that are not physically connected in this way (Hoad and Zobel,
2003).
A particularly important type of contextual metadata for e-
discovery is authorship. Authorship is often indicated by explicit meta-
data, or it may be stated within the file itself. But authorship can in
some cases also be inferred using other evidence from content (e.g.,
based on patterns in syntactic or lexical choice and/or systematic vari-
ations in spelling or layout) (Juaola, 2006). No one source of evidence
is perfectly accurate, but when several sources are used together it may
be possible to infer authorship with a useful degree of reliability. In-
deed, even when authorship is indicated clearly (as in an email From
line), it can sometimes be useful to look for confirmatory evidence from
other sources, simply because many types of metadata are rather easily
forged. Also of importance in e-discovery is the custodianship, another
form of contextual metadata (Wang et al., 2009).
From this discussion, we can identify three broad classes of contex-
tual metadata: time-document associations (e.g., date written), person-
document associations (e.g., the person who stored an email message),
and content-content associations (e.g., reply-to relationships). Some of
these types of contextual metadata may be useful in the acquisition
stage (e.g., time and custodian are often used as a basis for culling
document sets prior to review). All of these metadata types are poten-
tially useful as a source of features for use by a classifier, since some
patterns in the values of these features could be associated with the
events in the world that are the ultimate focus of the e-discovery pro-
cess.
3.3.3 Descriptive Metadata
A broad definition of descriptive metadata is metadata that directly
describes, but is not part of (nor automatically generated from), the
content of an item. Any form of content-indicative annotation or tag
for a document constitutes descriptive metadata (e.g., written notes
from a meeting that was recorded as an audio file, or a descriptive file
name for an office document).

3.3. Representation 35
A common source of descriptive metadata in e-discovery is a com-
pany’s document retention schedule, which is created and used by
records management professionals to identify how long content must be
retained and how it is ultimately to be dispositioned. Retention sched-
ules are based on the business purpose of a document, or on legal,
regulatory, or policy requirements; for instance, some financial infor-
mation must be retained for seven years to comply with tax laws. The
assignment of an item to a retention schedule is indicative the type of
content of an item, and thus constitutes descriptive metadata.
Descriptive metadata is also created when users categorize or orga-
nize information at the time of its creation or handling. For instance,
U.S. federal government email systems are required to provide func-
tionality for grouping emails by business purpose.4 Less formally, some
email users store their email in folders, and office documents in di-
rectories, with names that describe the content of the messages (e.g.,
“project1,” or “contracts”) (Perer et al., 2006). More sophisticated tag-
ging systems may also be provided, for instance by corporate content
management systems. Experience suggests, though, that requiring users
to follow some predefined tagging scheme will often meet with limited
success (because the benefit accrues not to the user creating the meta-
data, but rather to some future searcher).
3.3.4 Behavioral Metadata
Behavioral metadata, loosely defined, is any metadata that provides
information about how people have interacted with an item after its
creation. Examples of behavioral metadata include the most recent time
at which a file was accessed (which is maintained by many file systems);
the most recent time a document was printed (which is maintained
within the document by Microsoft Office products); whether the user
had designated for deletion a file that was later recovered from a disk
image using forensic techniques; and whether and to whom an email or
attachment was forwarded (Martin et al., 2005).
Transaction logs of many kinds provide a rich sources for behavioral
metadata (Dumais et al., 2003). Well known examples in e-discovery
4 36 C.F.R §1234.24(b)(1).

36 Information Retrieval for E-Discovery
include telephone call logs, credit card transaction records, and access
control records (either for controlled physical access to a facility or for
controlled online access to an information system). Behavioral profiling
of Web usage is also possible, through browser history, proxy records,
or server logs (Jansen et al., 2009). Transaction logs may be subject
to e-discovery in their own right as ESI, but they can also provide
behavioral metadata for other documents (for instance, determining
whether an employee was in the office building on the night an email
was sent).
3.3.5 Feature Engineering
Bearing those four types of features in mind can help designers to iden-
tify potentially useful features, but building an actual working system,
also requires making many detailed choices about data cleaning, feature
construction, and feature representation. It can be useful to consider
the feature engineering process as having three fundamental parts: (1)
what kinds of features are needed?, (2) how will each be created?, and
(3) how should the resulting feature set be transformed before it is
used (Scott and Matwin, 1999)? Two types of feature transformations
are possible: feature selection (as when removing stopwords) and more
general feature transformation (as when performing latent semantic
indexing). Because some classifier designs are sensitive to redundancy,
feature selection and/or transformation can be key to getting good
results.
These distinctions are often elided in e-discovery marketing litera-
ture, where “concept search” might refer to some innovation in feature
generation (e.g., phrase indexing), feature transformation (e.g., topic
modeling), or feature use (e.g., clustering for diversity ranking). Bear-
ing these distinctions in mind may help make technical conversations
with vendors more productive.
3.4 Specification
A useful representation must allow users to specify their retrieval goal
in an effectively operationalizable way that ultimately can be made
to conform with the representation of the ESI that is to be searched.

3.4. Specification 37
There are two general forms this specification can take: (1) formu-
lating queries, and (2) providing annotated examples. The two can
work together: while example-based classifiers are popular, some way
of choosing the initial examples is required. The discussion of specifi-
cation starts, therefore, with query formulation.
3.4.1 Query Formulation
In the Cranfield evaluation methodology (described in Chapter 5 on Ex-
perimental Evaluation), a researcher is given some fixed query and their
goal is to build the best possible system. That’s precisely backward
from the problem faced by the practitioner, however, who is given some
system and for that system must build the best possible query. Two ba-
sic techniques are known for building good queries: “building blocks,”
and “pearl growing” (Harter, 1986; Marley and Cochrane, 1981).
The “building blocks” approach starts with facet analysis to iden-
tify the criteria a relevant document must satisfy. For example, the
production request for the TREC Legal Track’s Topic 103 asks for:
“All documents which describe, refer to, report on, or mention any ‘in-
store,’ ‘on-counter,’ ‘point of sale,’ or other retail marketing campaigns
for cigarettes,” from which the facets “retail marketing campaign” and
“cigarette” might be identified (Oard et al., 2008). Then the scope of
request must be determined—a particularly important step in the ad-
versarial advocacy structure of U.S. litigation. For instance, are “elec-
tronic cigarettes” included in the scope of “cigarettes?” Deciding scope
may require the judgment of the overseeing attorney, or negotiation
with the requesting party. Once scope is decided, alternative vocabu-
lary is identified, which can be done using thesauri, through automated
suggestion of statistically related terms in the collection, or with the
aid of linguists, business sociologists, and domain experts.
An alternative approach is known as “pearl growing,” the key idea
of which is iterative query refinement through the examination of docu-
ments. Initial queries are typically both overly narrow (missing relevant
material) and overly broad (including irrelevant material). For instance,
the querier may not have known that Juana De Los Apostoles Cov-
adonga Smith oversaw cigarette marketing campaigns at Philip Morris
38 Information Retrieval for E-Discovery
International (a tobacco company), making their query too narrow;
having learned this association from documents that were returned,
the name could be added to the query. Conversely, the querier may
have included PMI as a query term (intending Philip Morris Interna-
tional), not realizing that it is also an acronym for the Presidential
Management Intern program (Baron et al., 2008), making their query
too broad; after seeing many unrelated documents about interns in the
results, a negative qualifier could be added to exclude such documents.
Refinement can also be performed on context, description, or behavior
features.
Brassil et al. (2009) claim that both facet analysis and iterative
refinement are central to effective e-discovery. Pearl growing by itself is
not particularly good at finding previously unknown aspects of a topic;
achieving sufficient diversity therefore requires first applying something
like building blocks, and then refining the initial results using something
like pearl growing.
3.4.2 Learning from Examples
An alternative to retrieval specification using explicit queries is to au-
tomatically learn a model from annotated examples using supervised
machine learning. Typically, the user interacts with such classifiers by
annotating examples of relevant and nonrelevant documents; the clas-
sifier then learns which document features (Section 3.3) are predictive
of relevance. Both positive and negative examples can be useful for
training a classifier. When relevant documents are a relatively small
proportion of the collection, however, an insufficient number of posi-
tive examples might be obtained by a random sample (Lewis and Gale,
1994). Moreover, a fully automated classifier cannot learn the impor-
tance of a feature that it never sees in an example. The query formula-
tion strategies described above (Section 3.4.1) can be useful in locating
a sufficiently rich and diverse initial (or “seed”) set of examples. Some
e-discovery practitioners, however, prefer to select the seed set by pure
random sampling to avoid the (actual or perceived) potential for clas-
sifier output to be biased by the choice of query.

3.5. Classification 39
3.5 Classification
The basic structure of the production process in e-discovery is two-stage
cascaded binary classification. The first stage seeks to partition the col-
lection into responsive and non-responsive documents (Section 2.4.3);
the second stage seeks to partition the responsive documents into those
that are subject to a claim of privilege and those that are not (Sec-
tion 2.4.4). For each stage, the classifier requires a decision rule that
separates the two classes. The classification can be performed by human
reviewers, or automated using a hand-built set of rules, but the use of
machine learning for text classification is becoming increasingly preva-
lent (Sebastiani, 2002). The classifier may directly produce the binary
classification, or it may instead produce a ranking by decreasing prob-
ability (or degree) of relevance, and leave it to humans to determine
the cutoff point. The ranking approach may be well suited to proto-
cols in which most or all of the production will be checked by humans
before being produced. The use of classifiers to support review for re-
sponsiveness has received considerable attention, but far less has been
published on the use of automatic classification for privilege. Some ini-
tial exploration of automating privilege review is reported in Cormack
et al. (2010), but much more remains to be done.
Many classifiers aim to identify a single class of documents, whereas
multiple subclasses may actually exist. For instance, a multi-national
company may have documents in many languages. In such cases, it may
be more effective to build a separate classifier for each language. There
also may be several aspects to a request (e.g., designing a marketing
campaign, reporting on its success, or considering its legal ramifica-
tions), and separate classifiers might best be applied to each aspect.
The results of the separate classifiers can then be combined (perhaps
by a simple set union) to form the responsive set. Although not often
a principal focus of the research literature, classifier development in
the real world typically requires attention to data cleaning so that the
classifier is not misled by inconsequential phenomena, such as typo-
graphical errors or formatting conventions.5
5 See Google Refine (http://code.google.com/p/google-refine/) for an example of a data
cleaning tool.
40 Information Retrieval for E-Discovery
Many classifier designs learn statistical models that are not eas-
ily interpreted or directly tunable by people. For instance, a support
vector machine learns a separating hyperplane in a transformed multi-
dimensional feature space (Joachims, 1998), while (supervised) prob-
abilistic latent semantic analysis infers a generative model of words
and documents from topical classes (Barnett et al., 2009). There are,
however, classifier designs that yield decision rules that are at least
somewhat interpretable. Examples include rule induction (Stevens,
1993), association rule learning (Agrawal et al., 1996) and decision
trees (Quinlan, 1998). Unfortunately, the less explainable statistical
text classifiers also tend to be the most effective (Dumais et al., 1998).
When the model built by an automated classifier is not easily inter-
pretable, the use of example-based statistical classifiers places a heavy
emphasis on evaluation to guide classifier training and to assure clas-
sifier effectiveness. The oft-cited admonition of Lord Kelvin that “if
you can’t measure it, you can’t improve it” is a fundamental truth in
machine learning (though the obverse is not necessarily true!). Limita-
tions in our ability to measure relative improvements would therefore
tend to limit the effectiveness of learned classifiers, and limitations in
our ability to measure effectiveness in some absolute sense would limit
our ability to make well informed decisions about when to stop adding
training examples.
Classifiers are frequently trained iteratively, by adding more an-
notated examples until some level of measured reliability is achieved.
Examples to be added to the initial seed set can be selected by simple
random sampling, or else the classifier itself can suggest which exam-
ples should be annotated next, in a process known as active learn-
ing. In active learning, it is typically the examples that the classifier
is most unsure about that are selected for annotation. Active learn-
ing generally requires fewer training examples than random or passive
learning (Lewis and Gale, 1994). Iterative training workflows may also
include a step where the user is asked to review inconsistent or outlier
assessments (O’Neill et al., 2009).

3.6. Clustering 41
3.6 Clustering
Clustering helps to address cases in which decisions can and should be
made on an entire set of ESI at once. These may be final decisions (e.g.,
to mark each document family in a set of exact duplicates as responsive
or as not responsive) or they may be intermediate decisions in some
staged decision process (e.g., to include all documents held by some
custodian). As that second example illustrates, we use clustering with
the broadest possible interpretation to mean any way of grouping any-
thing. Clustering is often used with a narrower meaning in information
retrieval to mean the application of unsupervised learning techniques
to cluster similar (but not necessarily identical) items based on content
or metadata. Our broad definition subsumes that narrower one, but we
find the broad definition to be useful because many of the ways that
items are actually grouped in e-discovery today would not fall within
the scope of the narrower definition.
3.6.1 Exact Duplicates
The most straightforward form of clustering is the detection of exact
duplicates. The term “exact” is perhaps somewhat of an overstate-
ment, since inconsequential differences are often ignored. For example,
an email message that contains Chinese characters stored as Unicode
may be an exact duplicate of the same message found in another in-
formation system in which the Chinese characters are stored in some
other encoding (e.g., GB-2312). Detecting exact duplicates amidst in-
consequential variations requires (1) precisely defining which types of
variations are to be considered inconsequential, (2) preprocessing each
item to normalize the representation of each type of inconsequential
variation, (3) detecting bitwise identical normalized forms, (4) con-
structing any metadata for members of the set that may be needed to
support future computation.
One common example of this in e-discovery is detection of exact du-
plicate email messages. At least five potential sources of variation arise
in that task. First, as noted above, messages that were acquired from
different email systems may use different character codes to represent
the same characters. Second, messages that have the same attachments

42 Information Retrieval for E-Discovery
may have those attachments stored differently (e.g., as MIME in one
system, but as linked database records in another system). Third, some
copies may be partial, as in the case of the recipient’s copy of an email
message (which will lack any bcc field that may have been present in the
sender’s copy) or a “hidden email” recovered from text that was quoted
later in a reply chain (which may have the sender and the time sent,
but not any indication of whether there were cc addresses). Fourth,
email messages typically contain path fields in their header to allow
the route that a message followed to be traced, so naturally messages
received by different servers will have different path headers. Fifth, dif-
ferent copies of the same email message may be formatted differently
for display (e.g., with line breaks in different places to accommodate
different limitations of display devices). This list is not complete; many
other types of variations might occur that could be considered incon-
sequential in some settings (e.g., rendering the names of months in
different languages).
Once representations have been normalized, detection of exact du-
plicates is typically straightforward. The usual approach is to use a
hash function to generate a fingerprint for each message, and then (if
an absolute assurance of accuracy is required) to examine the normal-
ized form of every message that shares a common fingerprint to verify
that it indeed is bitwise identical to the other documents in that set.
The advantage of this approach is that it is computationally efficient,
requiring only O(n) time.
Once exact duplicates have been grouped, the metadata structure
can be built. In the case of email, it can be useful to record where each
message was found (both for traceability of the process and possibly to
support some types of social network or data flow analysis) and which
copy is most complete (for use both in processing and in display). For
email found in personal storage systems, the location in that storage
system might also be used to generate descriptive metadata (e.g., in
the case of named folders) or behavioral metadata (e.g., in the case of
a deleted-items folder).
Some variants of this process have been developed for other con-
tent types. Perhaps the best known is shingling, the use of overlapping
3.6. Clustering 43
subsets, to detect duplicate Web pages (which are pages that share
exact duplicates of many subsets) (Broder, 2000). In the four-stage
framework that we have described, shingling can be thought of as a
representation preprocessing step (in this case, one that is optimized
for scalability). Another important special case is when external meta-
data may result in otherwise apparently identical items not appropri-
ately being considered to be duplicates. This may, for example, happen
when copies of the same form letter are received from different peo-
ple (as often happens with public comments on proposed government
regulations). In such cases, the form letter is really more like an email
attachment and the transmittal metadata is an equally important part
of the complete item, even if that information is stored separately.
3.6.2 Near Duplicates
Detection of exact duplicates integrates well into acquisition, review
for responsiveness, and review for privilege, because all are set-based
operations and exact duplicate detection produces sets. So-called near-
duplicate detection can be useful for human-in-the-loop tasks such as
formulation, annotation of training data and sense-making, but at the
cost of introducing some additional complexities.
The basic approach to near duplicate detection is to define some
similarity (or distance) measure on pairs of items and then to group
the most similar items into (possibly overlapping) clusters. Since near-
duplicate is a graded state, near-duplicates can be ranked for display
purposes. The similarity measures and the decisions about how clusters
should be formed could be explicitly crafted, or either or both could be
learned. The similarity measure might be defined on any combination
of content and metadata. For content expressed as human language,
standard ways of generating term weights that emphasize the repeated
use of relatively rare terms can be useful (Robertson et al., 1994). In
some cases (e.g., when looking for subtle variations in contracts (Sayeed
et al., 2009)) techniques from plagiarism detection that are based on
modeling long sequences of identical or related words can be useful,
both for crafting similarity measures and for highlighting differences
when displaying items from a near-duplicate cluster (Stein et al., 2007).

44 Information Retrieval for E-Discovery
Some common examples of clustering techniques include single link,
complete link, and Ward’s method (Murtagh, 1983).
When learned, such approaches are normally referred to as unsu-
pervised. This is meant to distinguish such approaches from supervised
approaches that learn from manually annotated examples, but it is
useful to bear in mind that even unsupervised techniques are some-
how guided by the designer, since all learning systems rely on some
inductive bias to guide the learning process.
3.6.3 Thread Reconstruction
A third form of clustering that is important in e-discovery is the con-
struction of threads, which are chains of replies to (and sometimes also
forwarding of) messages. By grouping messages that are related in this
way, threading can increase the efficiency, consistency, and accuracy
of manual annotations. Automated classification can similarly benefit
from threading, either by using the threads directly (e.g., through hier-
archical classification) or by drawing additional indexing features from
other documents in the thread (e.g., from the path in the reply chain
back to the thread’s root).
The email standard allows, but does not require, explicit threading
using the in-reply-to and references header fields.6 This threading in-
formation may be missing, however, due to mailers not including the
header, or to links having been removed in some preprocessing phase.
Additional analysis based on detection of hidden emails, analysis of
common subject line conventions (e.g., prepending “Re:” for replies),
and temporal relationships can be used to supplement missing thread-
ing metadata. Thread reconstruction introduces some risk of conflating
unrelated content (as happens, for example, when replying to an old
message to start a new conversation). For this reason, it can be useful
to split threads based on very long latencies or apparent topic shifts
between messages (Joty et al., 2010).
6 The best-known algorithm for header-based threading is that of Zawinski, described at
http://www.jwz.org/doc/threading.html

3.7. Other E-Discovery Tasks 45
3.7 Other E-Discovery Tasks
David Lewis’ observation that all of e-discovery is classification is useful
as a way of focusing attention on the stages of the production process
that are directly tied to legal definitions of responsiveness and privilege.
However, the review process involves more than these two stages of
classification, and e-discovery involves much more than review. This
section describes several additional stages of e-discovery that either
draw on, or have effects on, information retrieval techniques.
3.7.1 Acquisition
Search technology does not actually find things; what it really does
is get rid of things that you don’t want to see. Anything that you
wish to “find” using search technology must be something you already
have, otherwise you could not represent it and thus you could not
search for it. Paraphrasing General Omar Bradley, we might say that
“academics talk about search; professionals talk about acquisition.”7
The acquisition process is both hard and important. It is hard because
the information that we seek might be on any of hundreds of devices,
organized in any of dozens of ways; some of it may not even be in digital
form. Acquisition is important because every relevant item that we do
not collect is not merely one we cannot find, but one we will not even
know we missed. On the positive side of the ledger, however, acquisition
is typically cheaper than review, because the unit of acquisition is a set
of documents, while the unit of review is a (usually much smaller)
document family (Pace and Zakaras, 2012).
The first step in acquisition is to figure out where the information
might be, a process known as data mapping (Fischer et al., 2011). Data
mapping requires understanding technical issues (such as server types
and file formats), policy issues (e.g., are employees allowed to automat-
ically forward their email to personal accounts), group behavior (e.g.,
which work teams share files using shared network drives? which use
Dropbox? which use a document management server? which just use
email attachments?), and individual behavior (e.g., does one of the con-
7 The Bradley quote was “amateurs talk about strategy, professionals talk about logistics.”
46 Information Retrieval for E-Discovery
tract managers keep personal copies of their email on their hard drive
to circumvent an email deletion policy?). These questions can extend
well beyond the remit of information technology staff; specialized teams
with the organizational and technical expertise to plan and conduct an
acquisition process are therefore often employed.
Information may be found in one of five broad types of systems: (1)
an individual device (e.g., a PC, PDA, or memory stick), (2) an op-
erational server maintained by the organization that is a party to the
lawsuit (e.g., an email server or a file server), (3) an operational server
maintained by some other organization (often referred to as a “cloud
service”), (4) a “backup” file system maintained for the purpose of
disaster recovery (e.g., backup tapes), or (5) a specialized server for re-
taining, for records management purposes, electronic records that may
not currently be in use. All five system types are within the scope of e-
discovery, but some systems make it easier to collect information than
others. It is common to begin by obtaining files from record manage-
ment systems and operational servers, and to move on to more difficult
sources only as gaps become apparent. There are legal standards for
“reasonable accessibility” that do not routinely require heroic measures
to recover files from hard-to-access sources, however.
Because backup file systems such as tape are designed for disaster
recovery rather than records management, substantial processing can
be required to make effective use of such systems for e-discovery. For
example, it is not uncommon to find the same file on dozens of tapes.
Until recently, backup tapes were therefore often considered not to be
“reasonably accessible.” Vendors are emerging, however, that offer stan-
dardized workflow for collection from backup media. Indeed, obtaining
ESI from backups has the advantage that it can sometimes be less dis-
ruptive to the ongoing activities of an organization than obtaining the
same ESI from operational systems would be. As with many aspects of
e-discovery, the understanding of what is reasonable and proportion-
ate is subject to change with developments in technology. By far the
most expensive source to collect from, though, are individual devices,
due to the vast number of devices in use, and the inherent difficulty of
separating personal and work (and system) files.
The practice of organizing acquisitions around custodians, inher-

3.7. Other E-Discovery Tasks 47
ited from the age of paper records, continues to be applied today. A
common stage of acquisition planning is to decide (or negotiate with
the requesting party) which custodians to include and which to exclude
from acquisition. One motivation for this is to decrease collection size.
For similar reasons, acquisition may be limited by date range. In cases
where it is as easy to collect data from all custodians and dates as it is
to limit the selection, exclusion by custodian and date may, however, be
a questionable strategy. With automated techniques, searching larger
collections is no harder than searching smaller ones; indeed, it may
actually be easier, due to the additional statistical evidence available
from larger collections. There is a quantifiable cost to collecting infor-
mation that is not needed, but there is also an unquantifiable risk from
failing to collect information that plausibly might be relevant (Wang
et al., 2009)..
3.7.2 Sense-Making
Search is an iterative process, built around what is known as the “sense-
making loop” (Dervin and Foreman-Wernet, 2003). Searchers learn
through experience what information they actually need, what infor-
mation is actually available, and what queries best match need with
availability. This process is made more complex in e-discovery by the
separation between the requesting party (who has the actual need) and
the producing party (who interacts with the collection). But even the
producing party may not at the outset know what the collection actu-
ally contains. This knowledge is necessary to inform case strategy and
pre-production negotiations, in particular since the parties may choose
to settle before the cost of production is incurred. The initial sense-
making loop performed by the producing party to understand their
own collection is known as “Early Case Assessment” (ECA) (Solomon
and Baron, 2009).
Two core activities are important in ECA: conceptualization, and
the identification of “hot documents.” Conceptualization involves un-
derstanding the contents of the collection at a high level: what sorts
of documents it contains; what the vocabulary (particularly the spe-
cialized vocabulary) is; what individuals appear in the collection; how

48 Information Retrieval for E-Discovery
these individuals relate to each other and to aspects of the case; and
how the collection might best be searched. Conceptualization is sup-
ported by a combination of algorithmic data manipulations such as
clustering and by the construction of appropriate (often visual) repre-
sentations of this data. This combination has come to be called “visual
analytics” (Thomas and Cook, 2006; Keim et al., 2010; Lemieux and
Baron, 2011)
Several algorithmic manipulation tools can be used for ECA. One
potentially useful type of tool is Online Analytic Processing (OLAP),
which was originally developed to explore the contents of large data
warehouses. OLAP allows for aggregation of data and summarization
of common relationships (Garcia-Molina et al., 2009). OLAP is thus
well suited to exploring metadata associated with the ESI in a collection
(e.g., date, custodian, email recipient) and to exploring ESI that is itself
data (rather than, for example, text or images). The technology is not
ideally suited to manipulating other context types—in particular, it is
less well suited to speech, and image features, and it can perform only
fairly rudimentary manipulations of text—but nevertheless OLAP can
be a useful tool early in the process because of its scalability. Other
types of tools for helping to make sense of large and diverse collections
include clustering, social network analysis, association rule mining, and
visualization (e.g., starfields) (Henseler, 2009; Gorg and Stasko, 2008).
The second core activity that in the popular parlance is bundled
as a part of ECA is the identification of so-called “hot documents.”
These are documents that are likely to be material to the case, and
in particular documents that have the potential to help settle the case
one way or the other. Identifying these documents early in the case can
help the producing party to prepare for the conference of the parties,
and in cases where settling the case early to avoid significant litigation
costs might be advisable, ECA may generate insights that could help
with making that decision. Because this task involves search and sense-
making performed by a user who actually has the information need, one
key technology here is ranked retrieval.
A limitation of ECA is that it is difficult to know when it has been
done well. As with any exploratory task, success is easier to recognize
than failure, and indeed if the task were so well specified that failure

3.7. Other E-Discovery Tasks 49
would be easily recognized, then it would not be an exploratory task
in the first place. As a result, there has to date been little work on
evaluation of ECA.
3.7.3 Redaction
Rigidly treating only the document family as the unit of retrieval would
mean that if even a small portion of one document were subject to a
claim of privilege then the entire family that contains that document
would need to be treated as privileged. The courts generally expect
that if relevant portions of a document exist that are not themselves
subject to a claim of privilege, those unprivileged portions should be
produced. This, then, calls for a redaction process that is similar to
that used when classified materials are reviewed for declassification or
when documents are reviewed for release in response to a public records
request such as those filed under the U.S. Freedom of Information Act.8
There are two broad classes of tools for supporting redaction. The
first is a simple extension of text classification tools to, for example, de-
tect privileged passages rather than privileged documents. Techniques
for identifying the appropriate subdocument scope range from simple
approaches based on overlapping sliding windows, to more complex
approaches based on the structure of specific types of ESI (e.g., auto-
matically detected topic shifts in recorded meetings). Redaction may
also be required for some types of personal information (e.g., phone
numbers), and standard tools are available for such purposes that are
based either on regular expressions or on sequence classifiers (e.g., Con-
ditional Random Fields) (Chakaravarthy et al., 2008).
The other type of tool supporting redaction is one that seeks to
detect inconsistent decisions about redaction on different documents.
Such tools were developed over a decade ago to support redaction of
classified information in scanned documents that were being reviewed
for public release. Each time a redaction decision is made the decision
is recorded. Then if a future redaction decision is made differently on
detectably similar content, the human redactor can be notified of the
discrepancy (Curtis, 1997). Because born-digital documents are cur-
8 http://www.foia.gov/

50 Information Retrieval for E-Discovery
rently far more common in e-discovery than in declassification, some
adaption of these tools to the exploit the characteristics of born-digital
documents might help to optimize these tools for e-discovery practice.
3.7.4 Receiving a Production
When the requesting party receives a production, they have the same
problem as the producing party when they first began examining their
documents: making sense of a collection. Thus, the technologies that
aided ECA for the producing party can also aid sense-making by the
requesting party. The requesting party has some additional challenges,
however, in that the collection available to them is typically far smaller
than the collection that was available to the producing party. Moreover,
they are less likely to have access to the kinds of tacit (i.e., unexter-
nalized) knowledge that the producing party could, if necessary, obtain
from their own employees to help with interpretation of the content.
Tools that support more advanced types of inference (e.g., entity link-
ing or calendar reconstruction) will therefore likely be of even greater
use to the requesting party than to the producing party.
3.8 For Further Reading
• Manning et al. (2008) provide an introduction to information
retrieval technologies that also covers topics in text classifi-
cation and clustering.• Hogan et al. (2010) present one way in which the specification
task might be approached that is interesting for the way it
delineates the automated and manual parts of the process.• A rich and very active professional discussion of e-discovery
topics is unfolding in the blogosphere, most notably on a
blog run by Ralph Losey.9 The legal trade press (e.g., Law
Technology News) is also a useful source of insight into what’s
attracting attention in the field.• Technology vendors and e-discovery service providers often
publish “white papers” that seek to give some insight into the
9 http://e-discoveryteam.com

3.8. For Further Reading 51
techniques that the use and that sometimes present results
from internal evaluations.

4
Evaluating E-Discovery
As with other fields of information retrieval, research and develop-
ment in e-discovery relies on the evaluation of retrieval effective-
ness (Voorhees, 2002). Moreover, the adversarial environment of civil
litigation places practical emphasis on evaluation in e-discovery prac-
tice. Indeed, evaluation should be, and increasingly is, an integral part
of an e-discovery production. Judges, litigants, and vendors are actively
grappling with questions of protocols and techniques for evaluating the
degree to which an actual production satisfies the production request.
Evaluation is therefore, one of the topics in e-discovery on which aca-
demic research can have a practical impact on current practice.
Broadly, evaluation serves two fundamental roles: (1) formative
evaluation allows improvements to be recognized during system devel-
opment, and (2) summative evaluation allows statements to be made
about suitability for some task (Sparck Jones and Galliers, 1995). How-
ever, there are two key differences. In much of the published work on
information retrieval the focus of summative evaluation has been on
making statements about the general suitability of some technique, rel-
ative to some alternative technique(s), where “general” refers to some
range of tasks, queries, and collections. Both generality and relativity
52

4.1. Evaluation Methods and Metrics 53
are potentially problematic in e-discovery, however. These limitations
arise because in e-discovery the adversarial nature of litigation means
that summative evaluation will sometimes need to address the abso-
lute effectiveness of a specific production from a specific collection in
response to a specific request. This aspect of evaluation can be an in-
tegral part of the process, as litigants, vendors and the courts grapple
with the question of whether the protocols and techniques used in a
specific case were reasonable. As a result of this imperative for absolute
measures that apply to specific cases, the research on evaluation in e-
discovery has to date focused much more on computation of confidence
intervals (which characterize an expected range of absolute effectiveness
values) than it has on statistical significance tests of relative differences.
We begin this chapter in Section 4.1 by describing the methods and
metrics used for evaluating the effectiveness of an e-discovery produc-
tion. The size of productions, and the need for reliable measures of
absolute effectiveness, make sampling and estimation important topics
that we discuss in Section 4.2. Measures of retrieval effectiveness rely on
human judgments of relevance, but human reviewers can be imperfect
predictors of the lead attorney’s conception of relevance, which leads
to measurement error in our evaluation; this is the topic of Section 4.3.
Finally, Section 4.4 suggests further reading.
4.1 Evaluation Methods and Metrics
The goal of review for responsiveness is to produce a set of relevant
documents from the collection or corpus in the producer’s possession.
The effectiveness of the production can therefore be directly measured
using set-based metrics (Section 4.1.1). Many statistical text analysis
tools can also rank the documents by estimated responsiveness. In-
deed, internally, they may work by ranking the documents first, then
automatically selecting a cutoff point; or the ranking itself might be
generated and reviewed by the producing party to manually select the
cutoff point. It can also be useful, therefore, to evaluate the effective-
ness of such a ranking using rank metrics (Section 4.1.2). While most
evaluation to date has assumed binary relevance, there has been some
work with graded relevance assessments (Section 4.1.3). Finally, the

54 Evaluating E-Discovery
Relevant Retrieved
Corpus
TN
FN
Fig. 4.1 Intersection of the set of relevant with the set of retrieved documents in a corpus.
RelevantTotal
1 0
Retrieved1 TP FP F
0 FN TN L
Total R I N
Table 4.1 Contingency table of documents assessed as relevant (columns) and retrieved bya system (rows).
quality of a production could be measured not just by the raw pro-
portion of relevant documents, but by the diversity of its coverage of
different aspects of relevance (Section 4.1.4).

4.1. Evaluation Methods and Metrics 55
4.1.1 Set-Based Metrics
The effectiveness of set retrieval is assessed by the retrieval result’s in-
tersection with the set of relevant documents (Figure 4.1). This inter-
section defines four document subsets: those both relevant and retrieved
(true positives); those retrieved, but not relevant (false positives); those
relevant, but not retrieved (false negatives); and those neither relevant
nor retrieved (true negatives) (Table 4.1).
Several metrics can be derived from these subset counts. Two met-
rics commonly used in retrieval evaluation are precision, the proportion
of retrieved documents that are relevant:
Precision =TP
TP + FP=
TP
F. (4.1)
and recall, the proportion of relevant documents that are retrieved:
Recall =TP
TP + FN=
TP
R. (4.2)
The two metrics are in tension, since optimizing one will tend to ad-
versely affect the other; increasing the size of the production, for in-
stance, raises recall but generally lowers precision. Taken to the ex-
treme, recall can be optimized by returning the full collection, and pre-
cision by returning only the one document whose relevance the system
is most certain of, neither of which are optimal behaviors in practice.
Therefore, any reasonable single-valued metric for set-based retrieval
effectiveness must account for both false positives and false negatives.
One such metric is the F1 measure, the harmonic mean of recall and
precision:
F1 =2
1/Precision + 1/Recall
= 2 · Precision · Recall
Precision + Recall=
2 · TP
2 · TP + FN + FP. (4.3)
The F1 measure can generalized by assigning different weights to recall
and precision, forming the Fβ measure (van Rijsbergen, 1979).
Another pair of complementary metrics, frequently used in the clas-
sification and medical diagnosis literature, are specificity and sensitiv-

56 Evaluating E-Discovery
ity:
Specificity =TP
TP + FN= Recall = True Positive Rate (4.4)
Fallout =FP
FP + TN= False Positive Rate (4.5)
Sensitivity =TN
TN + FP= 1 − Fallout . (4.6)
These are combined in the Matthews’ Correlation Coefficient
(MCC) (Baldi et al., 2000):
MCC =TP · TN − FP · FN√
R · F · I · L(4.7)
(see Table 4.1 for meaning of symbols).
Neither recall nor precision involve TN , the count of true nega-
tives; neither, therefore, does F1. The true negative count is, however,
included in sensitivity. The set of true negatives is predominantly made
up of documents that are neither relevant nor are likely to be mistaken
as relevant. The size of the set often depends more on how selective
the acquisition process was than it does on the specific retrieval pro-
cess that was employed. Metrics that exclude TN lose information; but
they also reduce sensitivity to the characteristics of a specific collection.
Recall and precision can thus be particularly useful when comparing
retrieval technologies for future use, while specificity and sensitivity
can be particularly useful when evaluating the results of a specific pro-
duction.
Another metric that is sometimes referred to in e-discovery is elu-
sion, the proportion of unretrieved documents that are relevant:
Elusion =FN
FN + TN. (4.8)
The chief attraction of elusion as a measure of retrieval completeness is
that it is straightforward to estimate via sampling (Section 4.2). Elu-
sion, however, includes the count of true negatives, and so is sensitive
to the degree of selectivity during the acquisition process. In some cases
elusion provides only limited information about the completeness of a
search, since in a large collection with few relevant documents a search
could produce no relevant documents and yet still have low elusion.

4.1. Evaluation Methods and Metrics 57
4.1.2 Rank-Sensitive Metrics
Production in e-discovery is a set-based, binary process; a document
either is produced, or it is not. However, many statistical classification
techniques independently generate a degree of match (or probability of
relevance) for each document, by which the documents can be ranked.
In ranked retrieval, the extensible top of this ranking can be returned to
the searcher. For set-based retrieval, a threshold is then selected, either
implicitly by the system itself, or based on sampling and human review,
and all documents ranked above this threshold are returned. The qual-
ity of the ranking that a system produces can usefully be evaluated
in either case. If a system directly estimates probabilities of relevance,
then the accuracy of those estimates can be directly measured, and
indeed that has been tried (Cormack et al., 2010). Most statistical
classification methods, however, produce document scores that can be
interpreted only as ordinal, and not as interval or ratio values (Stevens,
1946). In other words, scores produced by such systems can be useful
for comparing degrees (or probability) of relevance in a relative sense,
but we may not be able to easily make strong claims about the actual
degree or probability of relevance of any specific document.
Rank metrics are widely used in other subfields of information re-
trieval, such as Web search. Such metrics, however, are generally used
only to evaluate the head of a ranking, to, say, depth 1,000 at most
(and often to no more than depth 10), and they have primarily been
used for relative, precision-centric comparisons between systems rather
than absolute estimates of recall. In contrast, e-discovery productions
are generally much larger than 1,000 documents, and accurate esti-
mates of recall are required.
One approach to assess the ranking quality is to select the cutoff
point k in the ranking that would give the optimal score under the set
metric of interest, such as F1; this has been referred to as hypothetical
F1 (Cormack et al., 2010). An example hypothetical F1 calculation
is shown in Table 4.2. Hypothetical F1 sets an upper bound on the
achievable F1 score of an actual production.
Another approach to extending a set-based metric to ranked eval-
uation is to calculate the set-based metric at different ranking depths,

58 Evaluating E-Discovery
Rank Rel TP FP FN TN Prec Rec F1
1 1 1 0 2 5 1.00 0.33 0.50
2 0 1 1 2 4 0.50 0.33 0.40
3 1 2 1 1 4 0.67 0.67 0.67
4 0 2 2 1 3 0.50 0.67 0.57
5 0 2 3 1 2 0.40 0.67 0.50
6 0 2 4 1 1 0.33 0.67 0.44
7 1 3 4 0 1 0.43 1.00 0.60
8 0 3 5 0 0 0.38 1.00 0.55
Table 4.2 Example calculation of a hypothetical F1 score. A system has returned a rankingover an eight-document collection; the relevance of the document returned at each rankis shown in the second column. The third through sixth columns show the counts of true
positives, false positives, false negatives, and true negatives if the ranking were to be con-verted into a set retrieval by cutting it off at that depth. The final three columns show theprecision, recall, and F1 scores corresponding to the set retrievals at that rank. Note thatrecall invariably increases with rank, and precision generally decreases. The maximum F1
score of 0.67, occurring at depth 3, is the hypothetical F1 score for this ranking.
and then to either graph or summarize the results. Where two metrics
form a complementary pair, a common approach is to graph one metric
at each value of the other. Recall and precision form one such natural
pair, while sensitivity and specificity form another (Section 4.1.1).
In precision-recall curves, precision is plotted on the y axis against
recall on the x axis. Since multiple precision values often correspond
to a single recall value, interpolation is generally performed, where the
precision value for a recall point is the highest precision value at or
after that point (Buckley and Voorhees, 2005). As a result, an inter-
polated precision-recall curve decreases monotonically by construction.
An example precision-recall curve, with and without interpolation, is
shown in Figure 4.2.
Similarly, sensitivity (the true positive rate) is plotted on the y axis
against one minus specificity (the false positive rate) on the x axis, in a
plot that typically rises up and to the right. This combination is known
as the Receiver Operating Characteristic (ROC) curve, a name inher-
ited from signal detection theory. Precision-recall curves are insensitive
to the number of true negatives, and thus tend to emphasize precision
at high rank; ROC curves are sensitive to the number of true negatives,

4.1. Evaluation Methods and Metrics 59
0.0 0.2 0.4 0.6 0.8 1.0
0.0
0.2
0.4
0.6
0.8
1.0
Recall
Pre
cisi
on
InterpolatedRawArea under curve
Fig. 4.2 Example precision-recall curve, with and without interpolation. The ranking beingscored is the one shown in Table 4.2.
and thus tend to emphasize effectiveness at high recall levels (Cormack
et al., 2010).
Precision-recall and ROC curves give a visual representation of the
effectiveness of a search over multiple possible cutoff points down the
ranking. For direct comparison, statistical analysis, and optimization, it
is convenient to have a single numerical value to summarize the rate at
which effectiveness decays as one moves down the ranked list. One way
of doing this is to calculate the area under the curve (AUC). The area
under the interpolated precision-recall curve is shown in Figure 4.2. A
more commonly calculated area is the area under the ROC curve, so
much so that this metric is often referred to simply as AUC, though
we prefer the clearer acronym AUROC.
60 Evaluating E-Discovery
A problem with precision-recall and ROC curves, and the corre-
sponding area-under-the-curve measures, is that their calculation re-
quires knowledge of the relevance status of every document in the
collection. Alternatives that focus on head-of-ranking measures are
widely used in Web search. One such measure is average precision (AP),
which is the average of precisions at the ranks at which relevant doc-
uments are retrieved, with unretrieved documents assigned a precision
of zero (Buckley and Voorhees, 2005). The AP metric has a straightfor-
ward interpretation as the expected precision that a user would experi-
ence if they were to examine a ranked list from the top, stopping after
seeing some number of relevant documents (where a uniform distribu-
tion is assumed over the possible stopping points) (Robertson, 2008).
Average precision approximates the area under the full precision-recall
curve because the limited influence of lower-ranked documents in the
AP measure make it inherently a head-of-ranking measure. Similarly,
the Patent Retrieval Evaluation Score (PRES) metric (also known as
Normalized Recall) provides an approximation to AUROC that can
be calculated where only the head of the ranking is available (Magdy
and Jones, 2010). E-discovery, however, typically requires much deeper
evaluation of ranking quality. As with set-based metrics, estimates for
the AUROC metric that are well suited to e-discovery must therefore
be derived through sampling (Section 4.2).
4.1.3 Graded Relevance
The evaluation methods described above assume that there are no de-
grees of relevance, that a document is either wholly relevant or wholly
irrelevant. Some documents, however, while technically relevant, will
play no part in case development, while others may be crucial to the
case and perhaps even will be submitted as evidence. Although re-
view for responsiveness is a set-based task, that does not mean that
errors on different relevance classes are equally problematic. Low recall
would be less worrying if all the important documents were produced,
while high recall could be insufficient if crucial items were missed. For
this reason, an evaluation methodology that rests on the assumption
that documents are either relevant or not will at best be an imperfect

4.1. Evaluation Methods and Metrics 61
model of reality (Kekalainen and Jarvelin, 2002). In addition, exam-
ining graded relevance might yield some insight into the consequences
of inter-assessor disagreement (Section 4.3) because disagreement on
marginally relevant ESI might be less of a concern than disagreement
on ESI that is material to the facts at issue in a case would be.
The issue of graded relevance is under-examined within e-discovery,
but some work has been done. In the Ad Hoc and Relevance Feed-
back tasks of the TREC 2008 Legal Track, and the Batch task of the
TREC 2009 track, assessors were asked to differentiate between relevant
and highly relevant documents (Oard et al., 2008; Hedin et al., 2009).
The distinction between relevant and highly relevant may require more
legal understanding, including of case strategy, than that between non-
relevant and relevant. A survey of the assessors indicates that some
found the distinction easy to make, others hard (Oard et al., 2008).
Boolean search typically yielded somewhat better recall for highly rele-
vant documents (when compared with all relevant documents), perhaps
because the lawyers who constructed the Boolean queries were better
able to anticipate the ways in which terms would be used in highly
relevant documents.
4.1.4 Diversity
Another assumption made by the evaluation framework described
above is that document relevance is independent; that is, that our be-
lief in the relevance of one document is not influenced by our belief
in the relevance of any other document. In reality, though, documents
that provide the same information may make each other redundant,
and ideally this should be accounted for in evaluation. Because sta-
tistical classification methods excel at finding relevant documents that
are similar to the relevant documents already known to exist, it seems
a plausible (though at present speculative) concern that the high recall
achieved by statistical classification systems at evaluation efforts such
as TREC may be overstating their true effectiveness at finding docu-
ments that shed light on each important fact. There has been consider-
able research in the broader information retrieval field on determining
dependencies and redundancies in relevant information (Clarke et al.,

62 Evaluating E-Discovery
2008), but this question has not yet been systematically evaluated in
e-discovery.
The study of retrieval diversity typically requires identification of
the aspects of a topic, and of which documents belong to which aspect.
One potential source of such aspects (though not of an exhaustive de-
lineation of their populations) are the grounds for appeal lodged in
the TREC 2008 and TREC 2009 Legal Track Interactive tasks. Teams
appealed assessments they regarded as erroneous, and some grounds
for appeal are arranged around taxonomies of (alleged) error. The tax-
onomies of false negatives (that is, of actually relevant documents that
were judged not to be so) offer a starting ground for identifying as-
pects of relevance. Webber et al. (2010a), examining the appeals from
one heavily-appealing team in TREC 2008, identified 5 classes of false
negatives. Again, further work remains to be done on this issue.
4.2 Sampling and Estimation
The effectiveness of set retrieval is measured from some or all of the
contingency counts TP, FP, TN , and FN (Table 4.1). In calculating
these contingency counts, the set of retrieved documents is given by the
production, but the set of relevant documents must be determined by
human assessment. Relevance assessments are also required for rank-
sensitive metrics. Determining the full relevant set, however, would re-
quire manual assessment of the entire collection, which is not feasible.
Even the retrieved sets can run to hundreds of thousands of documents,
making exhaustive assessment impractical.1 Unbiased estimates of ef-
fectiveness are derived from limited assessment budgets using the tools
of random sampling, statistical estimation, and confidence intervals.
1 In e-discovery practice, the producing side may in fact review all documents in the produc-tion set before production, either specifically to remove false positives, or more commonlyas a privilege review in which some additional manual coding might also be performed.
However, even in such cases evaluation may be required for candidate production sets be-fore production enters the final-review stage. Additionally, when evaluation involves jointreview by both parties it may be infeasible for both parties to review the entire produc-tion. In either case, a sample only of the (candidate) production set may be drawn for
evaluation purposes.

4.2. Sampling and Estimation 63
4.2.1 Evaluation practice in e-discovery
Formerly, evaluations of the completeness of a retrieval were left up to
the professional judgment of lawyers involved. Blair and Maron (1985)
report a revealing study of the reliability of such judgments. Lawyers
acting for defendants in a real case were provided with a Boolean re-
trieval tool and asked to keep searching until they were confident they
had found 75% of the relevant documents in their client’s collection. A
sample of documents was then taken from the unretrieved segment of
the collection, and assessed for relevance by the same lawyers. Based
upon this sample, true recall was estimated at only around 20%. This
outcome should temper our reliance upon professional judgment alone
for assessing the completeness of document productions.
Recent e-discovery practice has placed emphasis on the importance
of statistically founded and (reasonably) objective measures of the com-
pleteness of a production, and on the centrality of sampling and estima-
tion to such measurement (Oehrle, 2011). In Victor Stanley v. Creative
Pipe, Magistrate Judge Grimm remarked that “[t]he only prudent way
to test the reliability of the keyword search is to perform some ap-
propriate sampling”.2 How sampling should be employed in practice to
validate e-discovery productions is in the process of being worked out
through the ESI protocols of prominent e-discovery cases.3 Common
features of these protocols are: an initial, pre-review random sample
of the full collection to estimate the prevalence of relevant documents
(and provide a seed set for a text classifier); provisions for attorneys
on both sides to consult on the relevance of both testing and training
documents; and a final sample, following determination of a candidate
production set, to estimate the effectiveness of the production effort.
A widely cited (but perhaps not so widely understood) estimation
goal is colloquially referred to as “95% ± 2%”, by which is meant that
the 95% confidence interval on the effectiveness measurement of inter-
est (typically prevalence or elusion) should have a width of at most
2 Victor Stanley, Inc. v. Creative Pipe, Inc., 269 F.R.D. 497 (D. Md. 2010).3 See the “For Further Reading” section (Section 4.4) of this chapter for details of three
current cases with substantial ESI protocols: Da Silva Moore v. Public Groupe; In Re:
Actos; and Global Aerospace v. Landow Aviation

64 Evaluating E-Discovery
±2% absolute, or 4% total from lower to upper bound. A maximum
width of ±2% on an exact binomial confidence interval (Section 4.2.2)
can be achieved by a sample no larger than 2,399 documents, a fig-
ure that crops up repeatedly (and, to the uninitiated, rather mysteri-
ously) in search protocols;4. The actual interval is only symmetric for
an estimated prevalence of 0.5, and it will become tighter the further
estimated prevalence is from 0.5.
Note that the “95% ± 2%” goal states only the statistical precision
with which the prevalence of relevant documents shall be measured;
it says nothing about the maximum level of estimated prevalence that
would be acceptable. The production protocol of Da Silva Moore v.
Publicis Groupe et al. states only that “[t]he purpose for this review is
to allow calculation of the approximate degree of recall and precision of
the search and review process used”, and that “[i]f Plaintiffs object to
the proposed review based on the random sample quality control results
[...] [t]he parties shall then meet and confer in good faith to resolve any
difficulties.” The protocol of Global Aerospace Inc. v. Landow Aviation,
in contrast, establishes 75% recall as the “acceptable recall criterion”.
Evaluation practice is very much under active development at the
time of writing. One issue that is still to be resolved is how to efficiently
estimate a statistically valid confidence interval on recall. The protocol
of Global Aerospace, for instance, appears to specify only that a point
estimate of recall be made, without specifying the accuracy of this
estimate; while the proposed protocol of Da Silva Moore (still under
discussion at the time of writing) specifies a confidence interval on
elusion, not on recall itself.
4.2.2 Estimating Prevalence and Precision
We start with the simplest case, that of estimating the proportion of rel-
evant documents in the collection prior to retrieval, or in the retrieved
or unretrieved segments of the collection once retrieval is complete.5
4 See the detailed protocol negotiated between the parties in Da Silva Moore v. PublicisGroupe et al., 11 Civ. 1279 (ALC) (AJP) at 5 (S.D.N.Y. Feb. 22, 2012) (Document 92 of
http://archive.recapthelaw.org/nysd/375665/).5 Throughout this and the following sections, the term “segment” is used to refer to any
set of documents on which prevalence (proportion of documents relevant) or yield (total

4.2. Sampling and Estimation 65
Applied to the retrieved segment, the estimate is of precision; for the
unretrieved segments, it is of elusion. Where the segment is the entire
collection, sampled typically before any retrieval is performed, then it
is prevalence that is being estimated.
We also start with the simplest form of sampling, a Simple (without-
replacement) Random Sample (SRS). This is a sample in which n items
are drawn at random from the population of N items, in such a way
that each of the(N
n
)combinations of n items are equally likely to be
selected. One sample design that achieves a simple random sample is
to draw one item at a time from the population, with each item having
an equal probability of being selected at each draw. The sample of
a retrieved or an unretrieved segment may be drawn after retrieval
(fixed n); or a sample may be drawn from the whole collection prior
to retrieval, and the segment sample induced by the retrieval process
itself (variable or sub-population n) (Cochran, 1977).
Let the size of the segment that is sampled from be N , with R
relevant and N −R irrelevant documents (N known, R unknown). We
wish to estimate π = R/N , the proportion of relevant documents in
the segment. A simple random sample of n documents is drawn. The
documents are assessed, and r of them are found to be relevant. Then:
p =r
n(4.9)
is an unbiased estimator of π, and N · p of R.
“Unbiased” is a technical statistical term, meaning that the aver-
age of p across an infinite number of resamples would be π. That an
estimator is unbiased does not mean that any particular estimate is ac-
curate; there is random variability in the set of items actually selected,
and p for that set might be higher or lower than π on the segment.
We therefore also need a measure of the (statistical) preciseness of the
estimator; this is provided by a confidence interval.
A 1 − α (for instance, 95% for α = 0.05) confidence interval on π
consists of a range [π, π] within which the true value of π falls with 1−α“confidence”; that is, if an infinite number of samples were drawn, and
number of relevant documents) is being estimated, such as the retrieved or unretrieved
parts of the collection, or the collection as a whole.

66 Evaluating E-Discovery
an interval calculated for each, then at least 1−α of the intervals would
include π. A two-tailed interval is one in which (roughly speaking, and
again averaging over an infinite number of resamples) Pr(π > π) ≈Pr(π < π). (Note that the symmetry here is in probability space, not
the space of the estimated parameter, and that strict symmetry even
in probability space is not required, so long as the 1 − α confidence
requirement is met.) In a one tailed, lower-bound interval, Pr(π >
π) = 0; the upper bound is set to the maximum theoretically possible
value of the metric estimated, which is generally 1.0.
An “exact” 1 −α two-tailed confidence interval is formed by invert-
ing two one-tailed α/2 hypothesis tests that use the sampling distribu-
tion of the statistic (here, p). The Clopper-Pearson “exact” binomial
confidence interval is based upon the binomial sampling distribution,
and is determined by solving for pl and pu in the equations:
n∑
k=r
(n
k
)pk
l (1 − pl)n−k = α/2 (4.10)
andr∑
k=0
(n
k
)pk
u(1 − pu)n−k = α/2 (4.11)
(setting the lower bound to 0 if r = 0, and 1 if r = n) (Clopper and
Pearson, 1934).
The interval assumes an infinite population, whereas the segments
being sampled from are finite in size. Thus, the Clopper-Pearson in-
terval tends to overstate interval width; the true “exact” interval is
hypergeometric (Katz, 1953). Even for an infinite population, the “ex-
act” binomial interval is generally conservative, providing intervals with
coverage wider than 1 −α (Agresti and Coull, 1998). For a sample size
of 2,399 and a large (if finite) population, the degree of conservatism is
not great, as Figure 4.3 indicates; coverage does not go above 96% un-
less population prevalence is below 2.5% or above 97.5% (though such
extreme prevalences are observed in e-discovery, for instance when es-
timating elusion).
Approximate binomial intervals may be used for analytic purposes
or to avoid conservatism of coverage. A simple approximation to the

4.2. Sampling and Estimation 67
0.0 0.2 0.4 0.6 0.8 1.0
0.94
0.95
0.96
0.97
0.98
0.99
1.00
Proportion relevant
Cov
erag
e
Fig. 4.3 Coverage of exact binomial confidence interval across different segment proportionsrelevant, for a sample size of 2,399 drawn from a segment size of 500,000.
exact binomial interval is the Wald interval, which uses the normal
approximation to the sample proportion:
p± zα/2
√p(1 − p)/n (4.12)
where zc is the 1 − c quantile of the standard normal distribution (for
instance, z0.025 = 1.96 for the 95% interval). The Wald interval is easy
to reason with; we can immediately see, for instance, that interval width
is maximized when p = 0.5, and that quadrupling sample size will
halve interval width (true and approximately true, respectively, for the
exact binomial interval as well). The Wald interval, however, is quite
inaccurate, unless n is large and p is not too far from 0.5 (Brown
et al., 2001). Various other approximate intervals (such as the Wilson

68 Evaluating E-Discovery
or “score” interval) address these problems, and offer mean (rather than
worst-case) coverage at the 1 − α level (Agresti and Coull, 1998).
4.2.3 Estimating Recall and Other Ratios
Recall is the true positive rate, TP/(TP + FN ); in other words, it
is a proportion of actually relevant documents that are retrieved. If
we could draw a random sample from the relevant documents, then
estimating recall would be no different from estimating precision (Simel
et al., 1991)—but we are given the retrieved set, and have to estimate
the relevant one, not the other way around.
If a uniform random sample of size n is drawn from the full pop-
ulation of size N , then a sub-population estimate on the relevant
documents can be formed. Let tp and fn be the number of true
positives and false negatives in the sample. Estimated recall is thenRecall = tp/(tp + fn). The exact binomial confidence interval is not
strictly correct here, however, since sample size is variable (though in
practice the inaccuracy is likely to be slight). The normal approxima-
tion (Equation 4.12) could be used instead, though subject to the usual
caveats about its accuracy. Note that in either case, the sample size to
apply in the calculation is not the sample size drawn from the full
collection, but the part of that sample that turns out to be relevant.
After the retrieval has been performed, independent samples can
be drawn from the retrieved and unretrieved segments, and recall es-
timated from these samples. The samples may be drawn at different
rates, with denser sampling for the retrieved than for the unretrieved
segment, in order to achieve better estimates of precision and F1. In-
dependent sampling at different rates leads to more accurate (that is,
lower variance) estimates of recall too, but at the cost of making the es-
timation process more complex. Independent estimates are made of the
number of true positives TP (i.e., the yield of the retrieved segment)
and the number of false negatives FN (i.e., the yield of the unretrieved
segment). Recall can then be estimated as:
Recall =TP
TP + FN. (4.13)
As a ratio between estimates, the estimate in Equation 4.13 is bi-
4.2. Sampling and Estimation 69
ased, and the bias can be substantial (Webber, 2012). Work on a bias-
corrected recall estimator is still to be done.
The confidence interval on recall with independent retrieved and
unretrieved samples is also problematic. Webber (2012) compares nine
approximate two-sided recall intervals, from six families, over three rep-
resentative retrieval scenarios. The interval of Simel et al. (1991), which
treats recall as a binomial proportion on actually relevant documents,
is highly inaccurate where the retrieved and unretrieved segments are
sampled separately and at different rates. The TREC Legal Track’s
Interactive task employed a normal approximation with propagation of
error on recall (Oard et al., 2008), but this runs into the same problems
as the normal approximation on the binomial proportion. Of the inter-
vals examined, Webber (2012) finds only those derived from (Bayesian)
beta-binomial posteriors on TP and FP to be unbiased (giving mean
coverage at nominal level with Monte Carlo simulation to the poste-
rior on recall), and finds a prior of α = β = 0.5 on the beta-binomial
hyper-parameters to give the most stable and balanced intervals. Note
however that these are approximate intervals; exact intervals (though
likely to be conservative, and computationally expensive) are also de-
sirable, but have not yet been derived.
Little work has been done on estimates of F1; but as a function
of recall and precision, it is likely to display similar behavior to, and
problems as, recall. The simple point estimate derived from TP, FP
and FN , for instance, is certain to be biased (though how badly is not
known). The beta-binomial posterior methods developed by Webber
(2012) for the interval on recall can be applied directly to F1, though
their accuracy has yet to be empirically validated.
4.2.4 Stratified Sampling
If different parts of the collection, or of the retrieved or unretrieved seg-
ment, can be identified as having different expected prevalences, then
the accuracy of estimates can be improved through stratified sampling.
In stratified sampling, a segment is divided into disjoint strata, and
a simple random sample of some fixed size is drawn from each stra-
tum. The gain in accuracy is larger the greater the difference between

70 Evaluating E-Discovery
strata prevalences; the biggest gain comes if the segment can be divided
into very low prevalence strata on the one hand, and moderate to high
prevalence strata on the other. Simply dividing the collection into re-
trieved and unretrieved parts using the retrieval system that is being
evaluated already achieves much of this effect in estimating collection
statistics, but further stratification is possible if auxiliary predictors of
probability of relevance are available. The TREC Legal Track’s Inter-
active task, for instance, extended stratification using multiple retrieval
results; l retrievals define 2l strata (some of which may be empty), with
the stratum included in no retrieval result set likely having very sparse
prevalence (Oard et al., 2008).
The yield (number of relevant documents) τ of a segment is the
sum of the yields τs of the strata into which the segment is divided.
If a simple random sample of ns is drawn from the Ns documents in
stratum s, and rs of these are found on assessment to be relevant, then
an unbiased estimate of segment prevalence is πs = ps = rs/ns, and
an unbiased estimate of τs is ts = Ns · ps. In turn, an unbiased point
estimate of segment yield, τ , is:
t = τ =∑
ts , (4.14)
summing over the strata in the segment. Finally, t/N gives an unbiased
estimate of segment prevalence π, where N is segment size. Unbiased
point estimates of simple values such as precision, and (generally bi-
ased) estimates of ratio values such as recall, are then formed from
these segment estimates in the usual way.
The simplest stratification design splits the total sample size pro-
portionally amongst the strata; that is, ns = n · Ns/N . Greater es-
timate accuracy, however, can be gained by assigning proportionally
more samples to strata where estimate variance is highest. In estimat-
ing a proportion π (such as prevalence), estimator variance is:
Var(π) = Var(p) =π(1 − π)
n(4.15)
which is greatest at π = 0.5. Therefore, assigning a higher sample rate
to strata expected to have prevalences closer to 0.5 reduces estimator
variance. The rate of change in standard error, s(p) =√
Var(π), is only

4.2. Sampling and Estimation 71
RelevantTotal
1 0
Retrieved1 2,500 2,500 5,000
0 2,500 495,000 495,000
Total 5,000 495,000 500,000Table 4.3 Example retrieval. The retrieval produces 5,000 documents from a 500,000-
document collection, and has recall and precision both of 0.5.
minor until π is far from 0.5; s(p|π = 0.2) is still 80% of s(p|π = 0.5).
Unretrieved strata, however, generally have prevalences much lower
than 0.2; greater estimate accuracy can therefore be achieved by al-
locating proportionally fewer samples to the unretrieved stratum, and
more to the retrieved strata.
Consider the example retrieval scenario in Table 4.3 (based very
loosely on Topic 204 of the TREC 2009 Legal Track’s Interactive task).
Only the retrieved sets and the total collection size (the values in the
rightmost column) are known to the evaluator; the rest must be es-
timated by sampling. Assume that the sample budget is 2,400 assess-
ments (one more than the magic 2,399, for the sake of whole rounding).
The sample could be applied as a simple random sample across the full
collection of 500,000 documents. Alternatively, a stratified sample could
be applied, with strata defined by the retrieved and unretrieved seg-
ments. The stratified sample could be divided proportionally by stra-
tum size, with 1% going to the retrieved stratum (since it is 1% of the
size of the collection). Alternatively, a higher proportion of the sample
(say, 10% or even 50%) might be allocated to the retrieved stratum,
since this is expected to have a prevalence closer to 50%, and therefore
with higher sampling variance, than the unretrieved stratum.
The effect of these different sampling choices on estimate variability
for the scenario in Table 4.3 is shown via cumulative estimate proba-
bilities in Figure 4.4. The 2.5 and 97.5 percentiles of these sampling
distributions are given in Table 4.4.6 The true yield for the scenario
6 These ranges are on the sample point estimates that might occur, given a known underlying
scenario; they are not the same as confidence intervals, which are an inference from an

72 Evaluating E-Discovery
3000 4000 5000 6000 7000 8000
Estimated yield
Cum
ulat
ive
prob
abili
ty
0.00
50.
025
0.1
0.5
0.9
0.97
50.
995
SRSStRS, smpl ret=1%StRS, smpl ret=10%StRS, smpl ret=50%
Fig. 4.4 Cumulative probability of point estimate of yield for the retrieval example inTable 4.3, for a sample size 2,400, applied either as a simple random sample across the
entire collection, or as a retrieval-stratified sample, with different proportions of the sampleallocated to the retrieved segment. Note the logit scale in the y (probability) axis.
is 5,000 relevant documents, or 1% of the collection. Given a simple
random sample of 2,400 documents, the 95% range of yield estimates
is from 3,172 to 7,190 relevant documents, or 0.63% to 1.43% (note
the asymmetry of the sampling distribution) – a width of over 4,000
documents. Even with the same proportional allocation per strata (1%
to the retrieved and 99% to the unretrieved segments), stratification
shrinks the interval by over 15%. Allocating a higher proportion (10%)
to the retrieved stratum shrinks the interval further, by almost 25%
observed sample back to an unknown underlying scenario, though the sampling interval
widths are indicative of confidence interval widths.

4.2. Sampling and Estimation 73
Sampling designPercentile
Width2.5% 97.5%
Simple random sampling 3172 7190 4018
Stratified sampling, 1% to retrieved 3352 6730 3378
Stratified sampling, 10% to retrieved 3583 6622 3039
Stratified sampling, 50% to retrieved 3275 7144 3869Table 4.4 Sampling distribution percentiles on estimated yield, for the scenario and sam-pling designs in Figure 4.4.
over the simple random sampling case (and the 10% allocation, se-
lected arbitrarily, is still not optimal); another way of looking at this
is that just over half as many assessments (around 1,360, rather than
2,400) are required to achieve a sampling interval of the same width.
Allocating half the samples to the retrieved stratum makes the interval
almost as wide as the simple random sampling case, but would allow
for more accurate measurement of the precision in the retrieved sample.
In every case, using stratified sampling leads to substantial savings in
effort or benefits (direct or indirect) in accuracy.
As with simple random sampling, confidence intervals under strati-
fied sampling are more complex than point estimates. A normal approx-
imation interval can be estimated by aggregating the per-stratum esti-
mate variances using propagation of error (Oard et al., 2008); however,
as observed in Section 4.2.3, the normal approximation is unreliable for
recall, and hence for F1, confidence intervals. If posterior methods with
Monte Carlo simulation are used, then the posteriors and simulations
are run on each stratum individually (Webber, 2012).
4.2.5 Unequal Sampling for Rank Metrics
Stratified sampling varies sampling probabilities by document subsets.
Unequal sampling generalizes this to predicting a separate probability
of relevance, and assigning a different inclusion probability, to each doc-
ument. Unequal sampling is particularly attractive for rank-sensitive
metrics, where different documents have different metric weights de-
pending upon their position in the ranking, and optimal inclusion prob-

74 Evaluating E-Discovery
abilities likewise depend upon rank (Aslam et al., 2006).
Some care must be taken in an unequal sampling design to set a fixed
inclusion probability πi for each document i if some fixed limit n on the
total sample size must be respected. A design that achieves both goals
is Sunter sampling, in which the main part of the ranking is sequentially
sampled item by item with probability equal to inclusion probability,
while a simple random sample is drawn from the tail of low-weight
elements of sufficient size to make up the total sample size (Sunter,
1977). Variants of Sunter sampling were used in the TREC Legal Track
Ad Hoc, Relevance Feedback, and Batch tasks from 2007 to 2009.
If an evaluation metric or other measure is the sum of scores on in-
dividual documents in a ranking then a point estimate is easily derived
from an unequal sample. Such metrics include discounted cumulative
gain (DCG), rank-biased precision (RBP), and (as special cases) pre-
cision at cutoff k and collection yield (Jarvelin and Kekalainen, 2000;
Moffat and Zobel, 2008). Let πk be the inclusion probability of the doc-
ument at rank k, wk be the weight of rank k, and rk be the relevance
of the document at rank k. Then an estimate of the metric µ is:
µ =∑ wk · rk
πk, (4.16)
where the sum is over all and only documents included in the sample.
An estimate of collection yield is derived by setting wk to 1 for all k.
The TREC 2009 Legal Track’s Ad Hoc task reports point estimates
of induced AP scores (Yilmaz and Aslam, 2006), but without confidence
intervals. Indeed, no method has yet been described for estimating full-
rank rank-sensitive metrics such as AUROC with confidence intervals
for general unequal sampling. The xinfAP method described by (Aslam
and Pavlu, 2008) gives an estimate of average precision, but it works
with a variant of stratified sampling, rather than with general unequal
sampling. The TREC 2010 and 2011 Legal Track’s Learning task cal-
culated ROC curves and AUROC values by estimating true and false
positive rates at every possible cutoff depth k, again using stratified
rather than general unequal sampling (Cormack et al., 2010). If a doc-
ument sampled at rank k + 1 is irrelevant, then this naive approach
often anomalously estimates the recall at rank k + 1 to be lower than
the recall at rank k. Aslam et al. (2006) describe an alternative, more
4.3. Measurement Error 75
complex unequal sampling technique for estimating average precision,
but it does not enforce a fixed sample size. Sunter sampling might be
combined with the method of Aslam et al. (2006) to provide a general-
purpose AP estimation method, and with estimation of true and false
positive rates at successive cutoff k (Cormack et al., 2010) to estimate
ROC curves and AUROC (though again with the above-cited anoma-
lous behavior), but further statistical work is required to determine the
bias and variance of this approach.
Confidence intervals under unequal sampling are also more complex
than with simple or stratified sampling. Even in the simple case of a
metric summed from independent document scores, inclusion proba-
bilities are no longer independent, and hence an estimate of sampling
variance must include co-variance (Brewer and H. anif, 1983). The vari-
ance of Sunter sampling has been derived (Sunter, 1977), as has that of
AP estimation under stratified sampling (Aslam and Pavlu, 2008). To
go from sampling variance, however, to a confidence interval requires
the application of the normal approximation, and as we have seen in
Section 4.2.3, the normal approximation interval is often inaccurate for
retrieval evaluation metrics. For instance, if a sparse unequal sample
through the lowest (i.e., least likely) ranks of a complete collection or-
dering were to produce no sampled relevant documents at these low
ranks, the normal approximation inference that this (partial) estimate
has zero standard error would surely be overly tight. While interest-
ing as a research question, unequal sampling may perhaps be unlikely
to be applied in e-discovery practice, due to the complexities of its
calculation (and of trying to explain these complexities in court).
4.3 Measurement Error
The statistical niceties of sampling and estimation in Section 4.2 have
rested upon the assumption that when we ask an assessor for a judg-
ment on a sampled item the relevance assessment that they produce
will be correct. Unfortunately, numerous studies, in e-discovery and
beyond, have found that the level of agreement on relevance between
assessors can be surprisingly low. Even a single assessor can make dif-
ferent assessments of the same document at different times. In this

76 Evaluating E-Discovery
section, we summarize the effect that assessor disagreement and error
has upon estimate accuracy and we describe metrics of assessor agree-
ment. Empirically observed levels of assessor disagreement and error
are discussed in Section 5.4.
Assessor disagreement can affect not just the measurement of ef-
fectiveness, but (given the high degree of manual effort involved in
an e-discovery production) actual effectiveness, too. For instance, the
training of machine classifiers relies upon sets of human-assessed, or an-
notated, documents, and these annotations are subject to disagreement.
The effect of assessor disagreement in relevance assessment on the ac-
curacy of machine classifiers is yet to be explored in the e-discovery
literature. Nevertheless, in view of the high levels of assessor disagree-
ment, the emerging practice of joint review of training and testing
assessments by both two parties (Section 4.2.1) has some advantages,
though it would be surprising if complete agreement upon annotations
were readily achieved.
4.3.1 The Effect of Measurement Error
Assume that we have a gold standard of relevance, and that an asses-
sor or set of assessors are making errors relative to this gold standard.
The situation is analogous to that of a search being evaluated against
a set of assessments; we can therefore reuse the contingency table in
Table 4.1 (Page 54), with the judgments of the erring assessor defin-
ing the “retrieved” dimension, and the authority of the gold standard
defining the “relevant” dimension. Let α = FP/(FP +TN ) be the false
positive rate, and β = FN/(FN +TP) be the false negative rate. Then
the bias through measurement error between the true proportion rele-
vant π and the measured proportion relevant ψ on the full population
is (Tenenbein, 1970):
bias = π − ψ = α(1 − ψ) − βψ . (4.17)
The squared bias is added to the sampling error to derive the mean-
squared error of our measurement-biased prevalence estimator pF ,
based on a n-sized sample:
MSE(pF ) =π(1 − π)
n+ bias2 . (4.18)
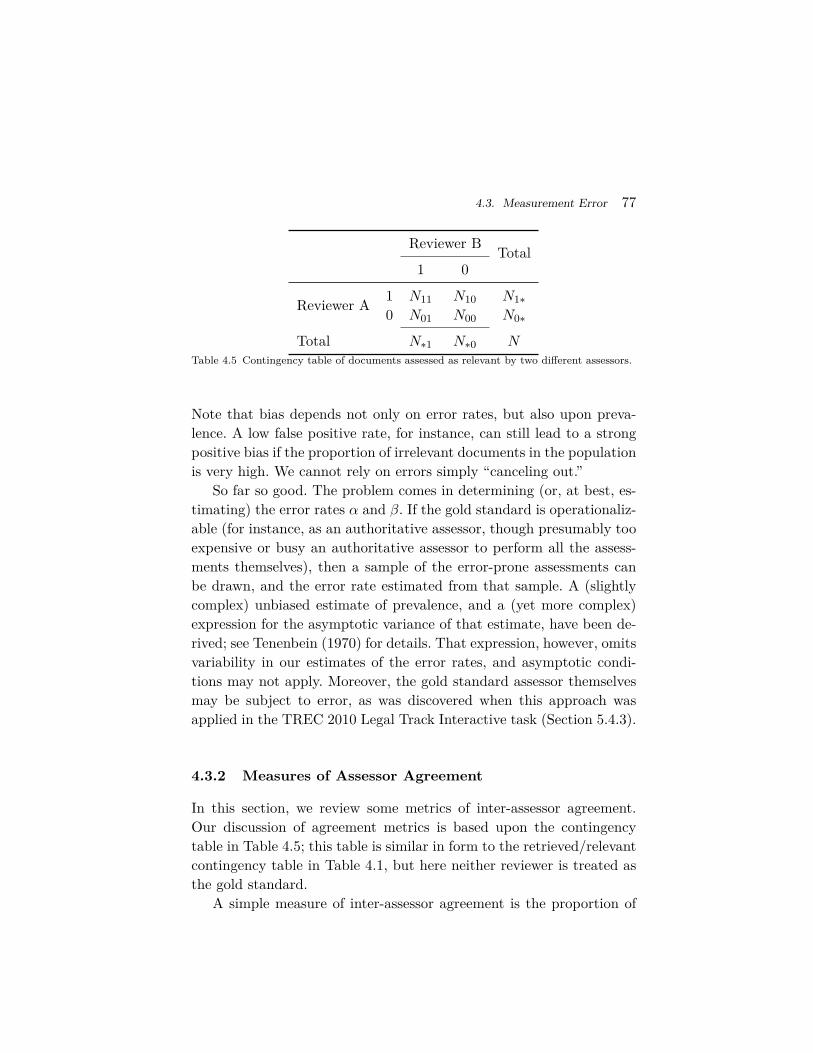
4.3. Measurement Error 77
Reviewer BTotal
1 0
Reviewer A1 N11 N10 N1∗
0 N01 N00 N0∗
Total N∗1 N∗0 NTable 4.5 Contingency table of documents assessed as relevant by two different assessors.
Note that bias depends not only on error rates, but also upon preva-
lence. A low false positive rate, for instance, can still lead to a strong
positive bias if the proportion of irrelevant documents in the population
is very high. We cannot rely on errors simply “canceling out.”
So far so good. The problem comes in determining (or, at best, es-
timating) the error rates α and β. If the gold standard is operationaliz-
able (for instance, as an authoritative assessor, though presumably too
expensive or busy an authoritative assessor to perform all the assess-
ments themselves), then a sample of the error-prone assessments can
be drawn, and the error rate estimated from that sample. A (slightly
complex) unbiased estimate of prevalence, and a (yet more complex)
expression for the asymptotic variance of that estimate, have been de-
rived; see Tenenbein (1970) for details. That expression, however, omits
variability in our estimates of the error rates, and asymptotic condi-
tions may not apply. Moreover, the gold standard assessor themselves
may be subject to error, as was discovered when this approach was
applied in the TREC 2010 Legal Track Interactive task (Section 5.4.3).
4.3.2 Measures of Assessor Agreement
In this section, we review some metrics of inter-assessor agreement.
Our discussion of agreement metrics is based upon the contingency
table in Table 4.5; this table is similar in form to the retrieved/relevant
contingency table in Table 4.1, but here neither reviewer is treated as
the gold standard.
A simple measure of inter-assessor agreement is the proportion of

78 Evaluating E-Discovery
elements they agree upon, which is simply termed agreement:
Agreement =N11 +N00
N. (4.19)
We can also consider agreement only on those instances that one re-
viewer or the other find relevant, particularly where (as is generally the
case in retrieval) relevant documents are relatively rare and of primary
interest. One measure of this is the overlap between relevant sets:
Overlap =N11
N11 +N10 +N01; (4.20)
another measure is positive agreement:
Positive Agreement =2 ·N11
2 ∗N11 +N10 +N01. (4.21)
Positive agreement is 2 · Overlap/(Overlap + 1), so overlap is always
less than positive agreement, unless both are 0 or 1. Both measures are
quoted in the literature; care must be paid as to which is in use. Positive
agreement is equal to the F1 score that would be computed by taking
one of the assessors as authoritative. Since under this assumption one
assessor’s recall is the other’s precision, and vice versa, this measure is
symmetric; we refer to this measure as mutual F1. Mutual F1 can be
interpreted as an approximate upper bound on measurable F1, given
assessor disagreement (Voorhees, 2000).
The interpretation of the agreement metric, and (to a lesser extent)
of positive agreement and overlap, depends upon marginal assessed
prevalence. Consider a pair of assessors whose agreement was purely
random, based upon their marginal assessed prevalence; where, for in-
stance, p11 = p1∗ · p∗1, where pab = Nab/N and ∗ indicates a don’t-care
condition. The larger these marginal frequencies p1∗ and p∗1 are, the
more likely agreement by chance would be. A metric which adjusts for
marginal prevalence is Cohen’s κ. Let pc = p1∗ · p∗1 + p0∗ · p∗0, the
proportion of agreement expected by chance, and po = p11 + p00, the
observed proportion of agreement. Then Cohen’s κ is defined as:
κ =po − pc
1 − pc. (4.22)
Tests of significance and (approximate) confidence intervals for Cohen’s
κ are given by Cohen (1960). Note that Cohen’s κ does not correct for

4.4. For Further Reading 79
the inherent difficulty of a topic, nor for sampling designs in which the
sampling is dependent upon one or the other assessor’s assessments.
The above measures are symmetric; agreement of A with B is the
same as agreement of B with A. Where one of the assessors is marked as
the authoritative or gold-standard one, then asymmetric measures can
also be used. Set-based evaluation metrics are generally asymmetric in
this way (though F1, as has been noted, is not). Another useful asym-
metric measure, from signal detection theory, is d′ (d-prime) (Wickens,
2002). Based upon (rather strong) assumptions about the nature of ev-
idence for relevance, and of the assessor’s response to this evidence, d′
promises to control for the assessor’s strictness (whether they require
a strong or only a weak degree of relevance), and measure only their
discriminative ability (how well they can distinguish the evidence of
relevance). The d′ measure has not been widely reported in the liter-
ature on assessor agreement (though see Roitblat et al. (2010)), and
it has issues of its own (e.g., it gives infinite values if any of the four
contingency cells in Table 4.5 is empty, and it is sensitive to marginal
prevalence). Nevertheless, in attempting to model, rather than merely
observe, assessor behavior, the metric merits attention.
4.4 For Further Reading
• Chapter 7 (“Evaluation”) of van Rijsbergen (1979) discusses
set-based and curvilinear metrics of retrieval effectiveness.
More recent evaluation has focused upon top-of-ranking mea-
sures; a discussion can be found in Chapter 3 (“Retrieval Sys-
tem Evaluation”) of Voorhees and Harman (2005). Clarke
et al. (2008) provides a good entry into the literature on
search diversity and its evaluation, while Kekalainen and
Jarvelin (2002) is a foundational study in the use of graded
relevance judgments in evaluation.• Thompson (2012) is an authoritative source on sampling
and estimation methods, though the classic text of Cochran
(1977) remains a more approachable exposition. An extensive
overview of the statistical treatment of measurement error is
contained in Buonaccorsi (2010).

80 Evaluating E-Discovery
• Examples of (proposed or agreed) protocols for e-discovery
are Da Silva Moore v. Publicis Groupe et al., 11 Civ.
1279 (ALC) (AJP) at 5 (S.D.N.Y. Feb. 22, 2012) (“Par-
ties’ proposed protocol [...] and Order”) (Document 92
of http://archive.recapthelaw.org/nysd/375665/); In
Re: Actos (Pioglitazone) Products Liability Litigation),
11 MD 2299 (W.D.La. Aug. 27, 2012) (“Case manage-
ment order: protocol [...]”) (http://pdfserver.amlaw.com/
legaltechnology/11-md-2299.pdf); and Global Aerospace
Inc., et al., v. Landow Aviation, L.P., et al., No. CL
61040 (Va. Cir. Ct. Apr. 9, 2012) (“Memorandum in sup-
port of motion for protective order approving the use
of predictive coding”) (http://www.ediscoverylaw.com/
MemoSupportPredictiveCoding.pdf)• The overview papers of the TREC Legal Track7 describe
many interesting experiments in assessing collective e-
discovery experiments. Particularly recommended are the
TREC 2008 report, for its description of a stratified sam-
pling and score estimation scheme on set-based retrieval in
the Interactive Task (Oard et al., 2008), though note this es-
timator is criticized in Webber (2012); and the TREC 2007
report, for its description of the unequal sampling and esti-
mation in the Ad Hoc Task (elaborated slightly in 2008 and
2009) (Tomlinson et al., 2007).
7 http://trec.nist.gov/proceedings/proceedings.html

5
Experimental Evaluation
Information retrieval is an empirical discipline, in part because theory
that can establish analytical bounds on retrieval effectiveness is lacking.
This places a premium on the development of evaluation resources.
Moreover, because some types of evaluation resources are expensive to
create, information retrieval researchers typically seek, when possible,
to create evaluation resources that can be used by many researchers and
practitioners. The usual focus of such resources is on the measurement
of retrieval effectiveness, not because efficiency is unimportant, but
rather because characterization of efficiency is more often analytically
tractable.
The vast majority of the investment in evaluation resources spe-
cific to e-discovery has focused on review for responsiveness, although
duplicate detection and review for privilege have also received some at-
tention. Experiment designs motivated by e-discovery tasks have also
made use of evaluation resources that were originally designed for other
purposes. We begin this chapter by describing the test collection (or
“Cranfield”) methodology for reusable and repeatable retrieval system
evaluation, and its application to e-discovery, in Section 5.1. We then
review the work of three groups that have created, or are planning
81

82 Experimental Evaluation
to create, evaluation resources specific to e-discovery information re-
trieval tasks: the TREC Legal Track (Section 5.2); the Electronic Dis-
covery Institute (Section 5.3.1); and the Electronic Discovery Refer-
ence Model (Section 5.3.2). Finally, Section 5.4 examines findings on
test collection design, particularly relating to assessor agreement, and
Section 5.4.4 summarizes experimental results on e-discovery system
design that these test collections have enabled.
5.1 Test Collection Design
The tasks of evaluation—sampling, assessment, and score estimation—
could be performed for the results of a single retrieval run. The assess-
ment task, however, is expensive, and it is therefore desirable to amor-
tize that cost over several evaluation cycles, either of one system (as it
is tuned for effectiveness), or of many different systems. It is also desir-
able to be able to compare several systems on a common benchmark,
whether these systems participate in the same experiment, or whether
they are run at different times and places. Finally, it is scientifically
desirable to be able to replicate previous results as closely as possible.
These three goals, of reusability, comparability, and reproducibility, are
all addressed by the creation of test collections.
A test collection consists of three core components. The first is the
set of documents1 upon which retrieval is to be executed (the collec-
tion). The second is a set of information need descriptions (the topics)
for which documents are to be retrieved by systems from the collection.
And the third are assessments (the relevance judgments) that specify
which documents in the collection are relevant to which topics.2 Eval-
uation using test collections consisting of these three components is
often referred to as the “Cranfield methodology,” after the founda-
tional retrieval experiments carried out at the library of the Cranfield
Aeronautical College (UK) in the 1950s and 1960s (Cleverdon, 1967).
Such test collections are frequently created as part of a formative (often
1 More generally, test collections could contain any form of ESI.2 Additional aspects of the evaluation design must also be addressed in the associated doc-
umentation, including the unit of retrieval (if that is not clear from context), and the wayin which evaluation measures should be estimated given the sampling strategy employed
when the collection was created.

5.1. Test Collection Design 83
community) experiment, such as the Cranfield experiments themselves,
or more recently the Text Retrieval Conference (TREC) (Voorhees and
Harman, 2005).3 Once created, however, such test collections can (it is
hoped) be reused for ongoing research, experimentation, and tuning.
The literature on test collection creation and use in information
retrieval experimentation is voluminous (Sanderson, 2010). Here, we
focus on those matters that relate particularly to e-discovery, using the
TREC Legal Track as the example. Chief among these is the need for a
different approach to selecting which documents should be judged for
relevance. In large test collections, it is not feasible to assess every doc-
ument for relevance. The traditional approach at TREC has been pool-
ing: taking the top k documents (where k = 100 is often used) from the
rankings submitted by systems participating in the collection-forming
community experiment; assessing all and only these documents; and as-
suming that unpooled documents are irrelevant (Sparck Jones and van
Rijsbergen, 1975). If the number of relevant documents is not too large,
and a diverse enough set of systems contribute to the pool, then it is
reasonable to expect that a substantial (and representative) portion of
the relevant documents will be included in the pool. Studies on early
TREC collections indicate that in such collections pooling does man-
age to find up to half the relevant documents; that, although absolute
scores may be inaccurate (particularly if they include recall) and sensi-
tive to variability in pooling, comparative scores are fairly stable; and
that unpooled systems (that don’t include human intervention) suffer
only mildly negative bias (Zobel, 1998; Sanderson and Zobel, 2005).
Pooling is not as suitable for e-discovery test collections, however,
even for the evaluation of the pooled systems themselves, let alone for
later reuse in evaluating new systems, because e-discovery seeks abso-
lute measures of effectiveness, most particularly of recall. This requires
some characterization of the full collection, both retrieved and unre-
trieved. The retrieval results, typically a set rather than a ranked list,
are often too large for exhaustive assessment. Moreover, the number
of relevant documents in the collection is also frequently too large for
pooling to locate a large proportion of them.
3 http://trec.nist.gov
84 Experimental Evaluation
Instead of pooling, a more nuanced approach to sampling must gen-
erally be used to select documents for assessment in an e-discovery
test collection; and indeed sampling has been used in the TREC Le-
gal Track since 2007. The availability of multiple unranked result sets
in the Legal Track’s Interactive Task allowed for stratification to be
performed based on set intersections, and a stratified estimate derived
(Section 4.2.4), whereas the ranked retrieval used in other Legal Track
tasks provided an even more fine-grained source for unequal sampling
(Section 4.2.5).
Evaluation using sampled assessments has been explored extensively
at the TREC Legal Track, and also in other applications of information
retrieval (Tomlinson et al., 2007; Yilmaz and Aslam, 2006; Carterette
et al., 2008). What has not yet been systematically studied, however,
in e-discovery or elsewhere, is the reusability of these sampled assess-
ments to evaluate new systems that did not contribute to the original
stratification (Soboroff, 2007). In pooling, the scores of new systems
are biased low, and the question to be answered is how low. For sam-
pled assessment, however, some score estimates even for new systems
can be statistically unbiased (that is, correct in expectation). The issue
instead is in the variability of these score estimates, as reflected in the
confidence interval, and therefore the question to be answered is how
much wider the confidence intervals would be expected to be for a new
system than for one that had contributed to the stratification. Work
on that question is clearly called for.
5.2 The TREC Legal Track
The most ambitious effort at creating public resources for e-discovery
evaluation was the Text Retrieval Conference (TREC) Legal Track.
Born in the run-up to the 2006 revision to the Federal Rules of Civil
Procedure, the principal goal of the track was to develop ways of eval-
uating search technology for e-discovery (Baron, 2007). As with all
TREC tracks, complementary goals included fostering the development
of a research community, development of reusable evaluation resources,
and establishment of baseline results against which future results could
informatively be compared. Comparison of alternative techniques is a

5.2. The TREC Legal Track 85
useful byproduct of TREC evaluations, although reported results must
be interpreted in light of both the research questions being explored
and the resources employed to achieve those results.
TREC operates on an annual cycle, with the documents being made
available to participating research teams in the first half of the year,
topics typically available around May, participant results due in early
around August, and results reported in November. Each year, TREC
sponsors a half dozen or so “tracks” that model different information
retrieval tasks. Tracks normally run for several years, with the evalu-
ation design being progressively refined and the participants gaining
experience with the task.
The TREC Legal Track ran for six years and developed two types
of reusable test collections: (1) a collection of nearly 7 million scanned
business records for which relevance judgments are available for just
over 100 topics, (2) a collection of roughly a half million email messages
(with attachments) for which relevance judgments are available for 13
topics and for which privilege judgments are also available.
5.2.1 The Legal Track CDIP Test Collection
The first collection was built over four years between 2006 and 2009
using Version 1.0 of the Complex Document Information Processing
(CDIP) document collection, which contained scanned documents re-
leased incident to the settlement of lawsuits between the state attor-
neys general and several tobacco companies and tobacco research insti-
tutes (Baron et al., 2006). Topics were defined by lawyers, and Boolean
queries were negotiated in a simulation of a conference of the parties.
Individual documents were the unit of retrieval. Documents were typ-
ically selected for judgment in a manner that gave preference to those
that were most highly ranked by the submitting teams, and relevance
judgments were typically made by law students. F1 at some fixed cutoff
was typically reported as the principal evaluation measure.
Because somewhat different procedures were used in different years,
the oversimplified summary in the previous paragraph masks a great
deal of complexity. In the first year, only very highly ranked documents
were judged; in subsequent years the maximum depth from which rel-

86 Experimental Evaluation
evant documents were sampled increased each year (in response to an
evolving understanding that some naturally occurring topics can have
very large numbers of relevant documents). Some topics have two, or
even three, sets of independently sampled and independently created
relevance judgments (because of subsequent use in Relevance Feedback
or Interactive Tasks in some years).
The evaluation measures also evolved over the years. In the first
year, the measure was Mean Average Precision (MAP), a ranked re-
trieval measure that gives emphasis to “early precision.” This proved
to be a poor match to the imperative in many e-discovery applications
for high recall in some fixed set, so in subsequent years the focus shifted
to set-based measures. The first of these to be tried was “Recall@B,”
which measures the fraction of the relevant documents that are esti-
mated to exist for a topic that were found by a system by rank B, where
B was the number of documents returned by the negotiated Boolean
query. That measure was designed to support comparison of statisti-
cal retrieval systems with rule-based Boolean systems. This proved to
be a remarkably challenging task for systems, perhaps in part because
current statistical systems do not make effective use of the operators
present in the Boolean queries. In later years, the track experimented
with a system-designated optimal rank cutoff for optimizing the F1
measure. This too proved to be a challenging task, perhaps because
current retrieval systems generate likelihoods rather than probabilities
of relevance.
In retrospect, the TREC Legal Track CDIP collection is impor-
tant mostly for its large number of topics and for its modeling of
the query formulation process in a way that produces representative
Boolean queries. However, three limitations are also clear. Most funda-
mentally, the CDIP collection (and indeed most information retrieval
test collections) model the problem in a manner that is in some sense
backwards: the research team is given some fixed form of the topic
statement and is then asked to build the best possible system. Real
users, by contrast, typically have some specific system at hand, and
they try to build the best possible query.
The second limitation was that the interest of e-discovery practi-

5.2. The TREC Legal Track 87
tioners in characterizing absolute effectiveness was not well supported
by the use of relatively large numbers of topics, each of which had a
relatively small number of relevance judgments. That problem arose be-
cause the relevance judgments for different topics were typically made
by different assessors, so the absolute values of many evaluation mea-
sures reported could depend as much on which assessors happened to
be selected as it did on the design of the system. Such an approach is
known to be suitable for making relative comparisons when all judges
have some core concept of relevance, even if they have different degrees
of liberal or conservative interpretations in the case of specific topics,
but it is also well known to yield substantial variations in the absolute
values of effectiveness measures.
The third challenge was that scanned documents are simply of less
interest for current e-discovery practice than born-digital documents
would be. Part of the reason for this is that the indexable features of the
CDIP collection (OCR text and manually assigned metadata) are not as
representative of the indexable features of born-digital documents. The
mediocre quality of the scanning (and thus the mediocre results of the
OCR) adversely affected recall, although methods of accommodating
this by stratification on estimated OCR accuracy are possible (Oard
et al., 2008).
A fourth limitation of the CDIP collection was that document fam-
ilies could not be easily modeled with the CDIP test collection. To-
gether, these limitations motivated the switch to an email collection
once the TREC Legal Track had accumulated enough experience with
the CDIP collection.
Of course, the CDIP collection would be particularly interesting to
some IR researchers for some of these same reasons. For example, it is
presently the largest and most diverse collection of scanned documents
for which relevance judgments are available for a substantial number of
topics. Moreover, each document in the CDIP collection is annotated
with a substantial amount of manually produced metadata, making
CDIP a useful test collection for metadata-based IR (Eichmann and
Chin, 2007). Both of these strengths of the collection are of potential
interest in e-discovery, the OCR because scanned attachments are not
uncommon in real cases, and the manual annotations because they

88 Experimental Evaluation
include Bates numbers (a serialization) that implicitly indicate physical
storage locations and because some of the metadata might be used as an
evaluation mode for the type of issue coding that is sometimes manually
performed at the same time as the review process in e-discovery.
5.2.2 The Legal Track Enron Collections
Collections of Enron emails have been used by academic researchers
and by e-discovery firms for many years and for many purposes. There
is, however, no single “Enron Collection.” By far the best known such
collection was produced as a collaboration between MIT, SRI and CMU
to support a joint research project involving email analysis (Klimt and
Yang, 2004). That collection became widely used because CMU made
it freely available on the Internet,4 but (at least in part to mitigate po-
tential privacy problems) they did so without attachments. As a result,
e-discovery firms typically obtained an Enron collection directly from
the contractor that hosted the materials for the Federal Energy Regula-
tory Commission (FERC), the agency that had originally released the
emails.5 The collections distributed by FERC were, however, different
on different dates because FERC withheld, and later re-released, some
messages as a result of ongoing legal actions and for other reasons. As
a result, e-discovery firms could not easily compare results that they
had obtained on different versions of the collection.
Two different FERC releases were actually used by the Legal Track.
The first version, obtained from one FERC release, was used only in
the TREC 2009 Interactive Task (Hedin et al., 2009). A processing er-
ror resulted in some incorrectly added content. As a result, a second
FERC release from a different date was processed the next year and a
best-effort mapping between the two releases was defined so that the
relevance judgments created in 2009 could be used as training data in
subsequent years.6 This second TREC Legal Track Enron Collection
was used in two quite different ways for (1) the 2010 Interactive Task
4 http://www.cs.cmu.edu/˜enron/5 http://www.ferc.gov/industries/electric/indus-act/wec/enron/info-release.asp6 Because the relevance judgments have been projected from the 2009 collection to the
collection used in 2010 and 2011, there is little need to refer back to the 2009 collection,
and for that reason currently only the 2010/2011 collection is widely available.

5.2. The TREC Legal Track 89
and (2) the 2010 and 2011 Learning Tasks (Grossman et al., 2011). One
key distinction was that document families were the focus of the Inter-
active Task, while individual documents were the focus of the Learning
Task.
Using email makes defining the set of “documents” to be searched
somewhat more complex than for some other document types. To
start with, an authoritative de-duplication was performed to remove
the large number of duplicates typically encountered in e-discovery.
This was intended to limit duplication of assessment effort, and it re-
flects current commercial practice. Next, the unit of retrieval had to be
be decided (e.g., document, family, or thread (Section 3.1)). Initially,
the family was chosen as the unit of retrieval for evaluation purposes,
but individual email attachments were also annotated for relevance.
This proved to be less than completely satisfactory because the rele-
vance judgment for the email message heading a family was based on
the entire family, thus precluding document-level evaluation for email
messages (document-level evaluation was, however, possible for attach-
ments). In later years, all judgments were made on individual docu-
ments (messages or attachments) and family-level relevance could then
be automatically inferred when desired for evaluation purposes.
5.2.3 The Interactive Task
In many ways, the Interactive Task was the centerpiece of the TREC
Legal Track—there were earlier tasks from which the Interactive Task
learned, and there were later tasks that built upon what the Inter-
active Task had uncovered. But those tasks are most easily placed in
context by presenting the Interactive Task first. The genesis of the In-
teractive Task was a pilot study run in 2008 using three topics and the
CDIP collection (Oard et al., 2008).7 The key innovation in the Inter-
active Task was to judge the relevance of several thousand documents
by using many different assessors, and then to allow participating re-
search teams to challenge relevance judgments that they believed to
have been assessed demonstrably incorrectly (Hedin and Oard, 2009).
7 An even earlier experiment with interactive evaluation, in 2007, was different in design
and far more limited in scope.

90 Experimental Evaluation
This resulted in a useful approximation to the single authoritative con-
ception of relevance that the senior attorney provides in a real case.
Importantly, the final assessor to whom such cases were appealed, re-
ferred to as the Topic Authority (TA), had been made available to
participating research teams, thus serving to limit measurement error
resulting from different interpretations of the production request be-
tween the participating research teams and the relevance assessment
process.
The presence of the TA addresses the problem of the subjectivity
of relevance by making the TA’s (necessarily subjective) conception
of relevance authoritative (though of course the TA’s conception it-
self could change over time, or it could be incorrectly applied in any
specific instance; see Section 5.4.3). Participants develop runs in con-
sultation with the TA (as production teams do with the overseeing
attorney in real life). The TA, though not directly performing first-
pass assessments, does instruct the first-pass assessors. And, perhaps
most importantly of all, the assessments of the first-pass assessors can
be appealed by teams to the TA for adjudication. For most topics, one
or more teams lodged a substantial number of such appeals.
If we were to assume that teams have been thorough in appealing
errors made by first-pass assessors, and the TA careful in adjudicat-
ing those appeals, then the post-adjudication assessments would be a
reasonably reliable embodiment of the TA’s conception of relevance.
It should be noted, however, that there is no incentive for any team
to appeal an assessment of not relevant for a document that no team
retrieved; some false negative errors may be missed, therefore, and the
recall of all participants perhaps somewhat overstated as a result.
One important feature of the Interactive Task was that participants
had the opportunity to align their working conception of relevance with
that of the TA. Based upon a study of inter-assessor agreement in a
different TREC track, Voorhees (2000) places an upper-bound of 0.65
on F1 scores that can realistically and measurably be achieved, given
assessor disagreement. However, teams in the TREC Legal Track’s In-
teractive Task have achieved estimated F1 scores above 0.8. We don’t
know what the upper bound on measurable F1 is for the Interactive
Task’s design, but we do have evidence that the standardizing influ-

5.2. The TREC Legal Track 91
ence of the TA does help. However, the reusability of the Interactive
Task collections for new systems has yet to be measured. The builders
of these new systems have access to written records of the topic au-
thority’s detailed guidance to participating teams, but not to the topic
authority themselves for consultation.
Appealing the judgments of first-tier assessors is a strength of the
evaluation design in the Interactive Task, but it was also a serious
limitation from the perspective of TREC schedules: never once in three
years were the final adjudicated relevance assessment available by the
time of the November conference. This ultimately led to termination of
the Interactive Task, not because it failed to meet its goals, but because
the process of doing so could not be reconciled with the constraints of
an annual evaluation cycle.
This design for the Interactive Task ultimately attracted signifi-
cant commercial interest and resulted in research designs that would
have been unaffordable had the Legal Track remained principally the
province of academic researchers. Ultimately, the Interactive Task pro-
duced a total of 10 relevance-oriented topics for the Enron collection
between 2009 and 2010 (Hedin et al., 2009; Cormack et al., 2010). The
principal evaluation measure was F1 on a set of documents received by
each team. Teams were not required to rank and then select a cutoff;
they could produce a set of putatively relevant documents in any way
that they wished. The best results on each topic were typically quite
good, often above F1 = 0.7. In large part this seems to be due to the
resources that commercial participants could bring to bear, although
some academic teams obtained excellent results as well.
5.2.4 The Learning Task
The Learning Task later emerged as a somewhat streamlined succes-
sor to the Interactive Task. The Learning Task focused on documents
rather than document families because experience with the Interactive
Task had indicated that results for document families could be com-
puted given relevance judgments for individual documents, but that
the reverse was not true. Rather than focusing on a single set of re-
sults, or a simple ranked list for which some cutoff would also need

92 Experimental Evaluation
Request text:
Documents referring to marketing or advertising restrictions pro-posed for inclusion in, or actually included in, the Master Set-tlement Agreement (“MSA”), including, but not limited to, re-strictions on advertising on billboards, stadiums, arenas, shoppingmalls, buses, taxis, or any other outdoor advertising.
Negotiated Boolean query:
((marketing OR advertis! OR promot! OR display!) w/10 (restrict!OR limit! OR prohibit! OR ban OR bans OR banned OR disallow!))AND ((“master settlement agreement” OR MSA) OR (billboard!OR arena! OR stadium! OR “shopping mall” OR bus OR buses ORtaxi! OR “outdoor advertising” OR subway OR station OR bannerOR marquee OR rail OR Amtrak OR “public transportation” OR“mass transit”))
Fig. 5.1 Request and negotiated Boolean query for Request 102 from the Ad Hoc Task ofthe TREC 2008 Legal Track.
to be specified, the Learning Task required participants to specify a
probability of relevance for each document. Such a capability would
suffice as a sole basis for estimation of two key quantities: the number
of relevant documents that exist, and, for any set of produced docu-
ments, how many of them were indeed relevant. With this information,
any measure of retrieval effectiveness could be computed for any set
of system-produced documents. TA adjudication of assessor disagree-
ment was also incorporated in the TREC Legal Track’s Learning Task
in 2011, but with a more structured form of interaction that was in-
tended to be more easily instrumented, and thus more easily leveraged
by future (nonparticipating) research teams.
5.2.5 The Ranked Retrieval Tasks
The Learning Task was in some ways a reprise of the first years of the
TREC Legal Track, in which ranked retrieval had been the focus. This
started in 2006 with the Ad Hoc Task, joined by the Relevance Feed-
back Task in 2007, and then merged as the Batch Task in 2009 (Baron
et al., 2006; Tomlinson et al., 2007; Oard et al., 2008; Hedin et al., 2009).
The most interesting aspect of these “ranked retrieval” tasks was that

5.3. Other Evaluation Venues 93
for each topic a Boolean query was negotiated between lawyers acting
on behalf of the two parties in some fictional dispute. Figure 5.1 gives
an example of such a request and the Boolean query negotiated for it
which, following practice at that time, was created without searching
the collection itself. The Ad Hoc Task was limited as a model of e-
discovery practice because systems were expected to operate without
interaction with a user, but based only on the query (e.g., the brief text
of a production request, or the negotiated Boolean query). Holding the
form of the query constant is useful early in the technology development
process, and it leads to very affordable evaluation designs, but it was at
the time already well understood that some degree of human interac-
tion could substantially improve results. The Relevance Feedback Task
approached this interaction in essentially the same way as the later
Learning Task, by providing some training examples, but the utility
of this approach was adversely affected by interassessor disagreement.
The Batch Task was essentially a continuation of the Relevance Feed-
back Task design, but with the explicit recognition that any team could
essentially perform an Ad Hoc Task simply by ignoring the available
relevance judgments; joining these as a Batch Task merely simplified
the reporting of results.
5.3 Other Evaluation Venues
The TREC Legal Track has received a good deal of attention, but it is
by no means the only such evaluation venue. In this section we briefly
describe two other groups that have brought together researchers and
practitioners to construct and employ evaluation resources.
5.3.1 The Electronic Discovery Institute Studies
One of the key limitations of TREC was that its commitment to de-
veloping sharable resources resulted in its collections not being fully
representative of the collections actually used in modern e-discovery
practice. Representativeness of the document collection is of particular
importance in information retrieval research because although test col-
lections can include an ensemble of topics, each test collection typically
includes only one set of documents. As a result, conclusions drawn on

94 Experimental Evaluation
a test collection are intimately bound to how representative the collec-
tion is for the actual (real-world) task. All of the TREC Legal Track
collections have two fundamental limitations: (1) they are far smaller
than many of the collections to be searched in many real matters, and
(2) they are themselves the result of some discovery-like process, and
thus they may be skewed with regard to actual collections in ways that
are difficult to characterize.
In an effort to address these challenges, a group of e-discovery pro-
fessionals formed the Electronic Discovery Institute (EDI) as a non-
profit organization and set out to conduct evaluations under the most
realistic possible settings.8 To do this, they had to forgo reusability, be-
cause real collections invariably contain real sensitive materials! Indeed,
EDI generally plans to destroy its test collections at the conclusion of
each evaluation. Strict nondisclosure procedures are of course required,
which to date has limited academic participation in EDI evaluations.
But in return for accepting these limitations, the EDI studies aim at
something that TREC never could—they seek to replicate the process-
ing of an actual matter using the actual collections, and to measure the
effect of alternative techniques for identifying responsive documents.
The scale of the EDI studies is impressive: millions of documents,
each with at least one relevance judgment (from the original review),
assembled at a cost of millions of dollars. The first EDI study, conducted
in 2008, suffered from low inter-annotator agreement between teams of
assessors who were working independently, the same problem faced by
TREC studies of the time (Roitblat et al., 2010; Oot et al., 2010). The
results of the 2008 EDI study were used by its organizers to start the
vigorous public discussion about the relative merits of automated and
manual review, as we describe below. A second EDI study is planned for
2013, reportedly drawing to some degree on evaluation design lessons
learned in the TREC Legal Track.
5.3.2 EDRM
Another group of e-discovery professionals came together to create the
Electronic Discovery Reference Model (EDRM), the workflow descrip-
8 http://www.ediscoveryinstitute.org/

5.4. Results of Research on Test Collection Design 95
tion for e-discovery practice depicted in Figure 2.1.9 Over the years,
EDRM (as the organization is now known) has emerged as one of the
principal standards bodies for e-discovery.10 EDRM is organized as a
series of projects, among which are EDRM XML (a proposed standard
metadata interchange standard for “load files”), the EDRM Dataset
Project, and the EDRM Search Project. The EDRM Dataset project
supported the TREC Legal Track by producing multiple versions (text,
native, and PST—a Microsoft email format) for the 2010 version of
the TREC Legal Track Enron collection. The EDRM Dataset project
also serves as the principal distribution agent for that collection, with
the topics and relevance judgments being available from TREC. There
are longer-term plans for the EDRM Dataset project to produce other
collections that will be of particular interest to information retrieval
researchers, including a test collection for deduplication. EDRM has
also established a Search Project, which may also ultimately produce
guidance and/or resources that would be of interest to the information
retrieval community. These projects also offer potential points of en-
gagement for information retrieval researchers who are seeking to help
guide the development of e-discovery practice.
5.4 Results of Research on Test Collection Design
The previous sections have introduced test collections developed for the
evaluation of e-discovery; we now turn to examine some of the results
of experiments using these collections. In this section, we consider what
has been learned about test collection design, in particular on the point
of inter-assessor disagreement and error (Section 4.3) and the use of a
topic authority to reduce that error. In Section 5.5, we examine exper-
iment results that focus on the design of effective e-discovery systems.

96 Experimental Evaluation
SourceMutual F1 Cohen’s κ
Mean SD Mean SD
Voorhees (2000) sample 0.58 0.24 0.48 0.25
Voorhees (2000) pool 0.45 0.22 0.41 0.23
Grossman and Cormack (2011b) sample 0.63 0.24 0.59 0.24
Grossman and Cormack (2011b) collection 0.44 0.29 0.43 0.29
Roitblat et al. (2010) (SRS of) collection 0.33 0 .09 0.18 0 .05
Webber et al. (2012) sample 0.76 0 .08 0.57 0 .09
Webber et al. (2010b) select 0.47 0 .15 0.31 0 .15
Wang and Soergel (2010) sample 0.48
Mean 0.53 0.43Table 5.1 Mean and sample standard deviation of assessor agreement reported in different
studies. Sample agreement for Voorhees (2000) is over all three assessor pairings (primary,A, and B); pool agreement only over primary vs. A and primary vs. B. (Standard deviationmeans are not shown since variance is over different populations, assessors alone for the last
three, both assessors and topics for the first four.)
5.4.1 Measured Assessor Agreement
There have been numerous studies measuring assessor agreement, in
e-discovery and elsewhere. We describe several of these studies below;
their results are summarized in Table 5.1.
In a classic study by Voorhees (2000) that predates work on e-
discovery, a sample of primary assessments by TREC assessors for 48
topics from the TREC 4 Ad Hoc track were also assessed by two sec-
ondary TREC assessors, and the agreement between the assessors mea-
sured; Table 5.1 reports agreement both on the sample, and estimated
agreement extrapolated to the pool. (A summary of other studies out-
side e-discovery can be found in Bailey et al. (2008).)
Grossman and Cormack (2011b) reported agreement between the
first-pass assessors and the official, post-adjudication assessments, for
9 http://www.edrm.net.10 The other principal e-discovery “standards” body is the Sedona Conference, which issues
“commentaries” that amount to practice guidelines. See https://thesedonaconference.
org.

5.4. Results of Research on Test Collection Design 97
the Interactive Task of the TREC 2011 Legal Track. As the official as-
sessments are intended to model the judgment of the topic authority,
which are authoritative by definition, these can be seen as measures of
assessor error. Table 5.1 reports agreement both on the sample drawn
by the task organizers for assessment, and extrapolated to the full col-
lection.
Roitblat et al. (2010) reported a re-review of a large production,
constructed by a Fortune 500 company in response to a regulatory
request. The re-review was performed on a simple random sample of
the collection by two independent review teams from an e-discovery
vendor.
Webber et al. (2012) had a stratified sample of documents from
Topic 204 of the TREC 2009 Legal Track Interactive Task reassessed by
two assessors (who were students without legal training), instructed for
one batch by the topic statement, and for a second batch by the same
detailed relevance guidelines used by the original first-tier assessors.
Agreement was calculated between the assessors and with the official
TREC assessments. Table 5.1 summarizes agreement between all three
assessor pairs on both batches (six figures in all), on the stratified
sample only.
Webber et al. (2010b) reported the three-way assessment, by a team
of seven assessors, of a selection of documents from the TREC 2010 Le-
gal Track Interactive Task. The documents selected where those where
the team’s production disagreed with the initial TREC assessments.
The figures in Table 5.1 are means across the 21 assessor pairs.
Finally, Wang and Soergel (2010) had 100 documents, sampled from
each of four topics from the TREC 2009 and TREC 2010 Legal Inter-
active Task, reassessed by four law and four library and information
studies students, comparing their agreement with each other using κ
(and with the official assessments using sensitivity and specificity). Ta-
ble 5.1 reports the mean κ values between assessors on the sample of
documents; insufficient information is provided to calculate κ standard
deviations or F1 scores.
The above studies span a wide range of assessors, collections, topics,
and sampling conditions; the results summarized in Table 5.1, therefore,
are not directly comparable, and are intended only to be indicative. F1

98 Experimental Evaluation
scores range generally from 0.44 to 0.63, with a single outlier each above
and below. The κ scores, meanwhile, vary generally between 0.31 and
0.59, with a single outlier below. The standard deviations indicate that
there is considerable variability between topics (the first four entries),
but less between assessors (the last four entries). Agreement scores on
samples tend to be higher than on populations, for κ as well as F1. The
samples generally work to reduce the disparity between relevant and ir-
relevant document counts, and are generally conditional on an assessor.
Both measures are evidently sensitive to these conditions, presumably
because they reduce the scope for one assessor to generate “false posi-
tives” (from the perspective of the other). With these caveats in mind,
two rough conclusions can be drawn from the results in Table 5.1. First,
mean F1 between a pair of assessors is around 0.5, and mean κ around
0.4. And second, agreement is highly dependent upon the topic (more
so than on the pair of assessors).
5.4.2 Characterizing Assessor Errors
In the TREC 2007 and TREC 2008 Legal Tracks, a Relevance Feed-
back Task was run in which the systems were told which (sampled)
documents had been assessed as relevant and which as not relevant in
the previous year. The feedback runs were not able consistently to beat
the Boolean baseline, and examination of the results pointed to asses-
sor disagreement as a possible culprit (Tomlinson et al., 2007; Oard
et al., 2008). Section 5.4.1 above summarizes observed levels of over-
all assessor agreement. In order to understand the causes and severity
of disagreement, and identify methods for reducing it (and limits on
its reducibility), we need to characterize the factors underlying dis-
agreement, and understand how assessors actually go about making
relevance assessments.
What makes for a reliable assessor? Wang and Soergel (2010) com-
pared the relevance assessments of law school and library science stu-
dents on four TREC Legal Track topics (row 8 of Table 5.1). Although
in an exit interview all four law school students stated that the believed
their legal training was important in performing the assessments, in
fact the study found little difference between the law school and li-

5.4. Results of Research on Test Collection Design 99
TA Opinion TA Correct Arguable TA Incorrect
Responsive 88% 8% 4%
Non-responsive 89% 3% 8%Table 5.2 Classification of assessor disagreement with topic authority by Grossman andCormack (2011a) across all seven topics for the TREC 2009 Legal Track’s Interactive Task.
brary science students in agreement with each other or with the official
assessments, or in assessment speed. (Further analysis of the same data
is performed in Wang (2011).)
In Webber et al. (2012) (row 6 of Table 5.1) two assessors indepen-
dently judged two batches of documents from the TREC Legal Track,
the first batch using only the topic statement, and the second batch
using the detailed guidelines written by the topic authority. The study
found that the detailed guidelines led to no increase in agreement, ei-
ther between assessors or with the official adjudicated assessments. The
study also found the experimental assessors (who were high school stu-
dents) to be more reliable than the first-pass TREC assessors (who were
law school students). As with Wang and Soergel (2010), these findings
raise questions about whether specialized expertise in e-discovery docu-
ment reviewing yields as large an effect as, for example, the conditions
under which that reviewing is performed. Efthimiadis and Hotchkiss
(2008) also reported no detectable difference in reliability between as-
sessors with a legal background and those without.
Assessor disagreement is founded upon some combination of inat-
tention, differing thresholds for relevance, and different conceptions of
relevance. “Relevance” is a foundational concept in retrieval science,
and there is a body of work examining what relevance is and how
people come to make a decision about what is relevant and what is
not (Saracevic, 2007). Surveying this literature, Bales and Wang (2006)
locate descriptions of no fewer than 230 distinct factors affecting per-
ceptions of relevance, which they consolidate into 14 relevance criteria.
Chu (2011) reports results from a questionnaire study of partici-
pants in the TREC 2007 Legal Track Interactive Task. In that year’s
task, participants were required to interactively search the collection,
looking for relevant documents (in subsequent years, the “interaction”

100 Experimental Evaluation
was also with a topic authority). The questionnaire asked participants
to select from a pre-existing list of 80 factors affecting assessments of
relevance. The most highly-rated factor was the specificity or amount
of information in the topic request.
In an effort to characterize the degree to which assessor disagree-
ment might be due to differences in conception of relevance, Gross-
man and Cormack (2011a) re-reviewed a sample of documents from
the TREC 2009 Legal Track’s Interactive Task for which the relevance
judgments had been overturned on appeal. Based on the topic author-
ity’s detailed relevance guidelines, they manually categorized the dis-
agreement into three categories: decision upon appeal was inarguably
correct; decision upon appeal was arguable; and decision on appeal was
inarguably incorrect. Teams had been instructed only to appeal if they
believed that the first-pass assessment clearly violated the relevance
guidelines, so it is unsurprising that on re-review these authors found
many of the first-pass judgments to be inarguably erroneous, as shown
in Table 5.2. What is more interesting is that they found about 5% of
the cases to be arguable, and they found that in another 5% of the cases
the TA’s judgment has been incorrect. We lack similar data for unap-
pealed documents, but the results do shed some light on the nature of
assessor and TA errors, at least in difficult cases.
5.4.3 Characterizing Topic Authority Reliability
Assessor error in e-discovery is defined relative to the informed profes-
sional opinion of attorney overseeing the e-discovery production. But
what of errors that this authority makes in applying their own concep-
tion of relevance, either because it changes over time, or else because
they misunderstand a document relative to their conception? We have
already seen that Grossman and Cormack (2011a) asserted that around
5% of adjudications by the TA in TREC 2009 were in unambiguous vi-
olation of their own relevance guidelines (see Table 5.2). Scholer et al.
(2011), in a study of TREC assessors from other tracks, found that
they disagree with themselves around 15% of the time when asked to
later judge the same document at different times.
Starting from the analysis of measurement error described in Sec-

5.4. Results of Research on Test Collection Design 101
tion 4.3.1, Webber et al. (2010a) proposed that first-pass assessments
should be sampled for adjudication, and this sample used to estimate
and then adjust for error rates. This approach was tried in the TREC
2010 Legal Track Interactive Task (Section 5.2.3), necessitating that
even appealed documents be adjudicated without the statements of
grounds for appeal (so that the topic authority could not distinguish
them from unappealed documents). The result was much lower appeal
success rates in TREC 2010 than in TREC 2009 (38% vs. 78%), de-
spite there having been no increase in the aggregate rate of appeals
(Cormack et al., 2010; Hedin et al., 2009). This suggests that the TA’s
judgments regarding relevance are affected by the degree of specificity
with which an appeal is lodged, either because without a specific ba-
sis stated for an appeal the TA might fail to notice some important
content, or because the argument stated in the appeal may serve to
help the TA refine (and thus perhaps change) their own conception of
relevance. Here we run into the fundamental limitation on using hu-
man cognition as a basis for evaluation: humans learn as they go, and
indeed they learn by reading. Thus, at least in some cases, the very
act of judging relevance can itself change the definition of relevance.
No gold standard can solve this problem for us; the best we can hope
to do is to model the effect in some way and then to account for that
modeled effect in our computation of measurement error.
5.4.4 Characterizing the Potential for Collection Reuse
Evaluation by sampled assessments has been explored extensively in
other applications of information retrieval (Tomlinson et al., 2007;
Yilmaz and Aslam, 2006; Carterette et al., 2008). What has not yet
been systematically studied, however, in e-discovery or elsewhere, is
the reusability of these sampled assessments to evaluate new systems
that did not contribute to the original stratification (Soboroff, 2007).
In pooling, scores of new systems are biased low, and the question to
be answered is how low. Reuse of a collection created by sampling, by
contrast, essentially involves using a pre-drawn sample, which will (if
the original sample was well drawn) at worst just result in a some-
what larger sampling error; the point estimates of the scores may well

102 Experimental Evaluation
be statistically unbiased (that is, correct in expectation). The ques-
tion, then, is focused on the width of the confidence interval rather
than on the point estimates of the scores. Sampling errors have been
well characterized for the two most recent Legal Track evaluation de-
signs (the Interactive Task and the Learning Task), and for the earlier
(rank-based) evaluation design (in the Ad Hoc, Relevance Feedback
and Batch Tasks) a suitable analytical framework has been identified.
5.5 Research on System and Process Design
The TREC Legal Track spans the era in which both concept search and
technology-assisted review were introduced into the e-discovery mar-
ketplace. Concept search proved to be difficult to evaluate using the
item-level decision metrics used at TREC, but those metrics proved to
be well suited for evaluating technology assisted review, and for com-
paring it with competing approaches. We therefore begin by reviewing
evaluation results for technology assisted review, manual review, and
keyword search.
5.5.1 Technology-Assisted Review
Brassil et al. (2009) review the reported results in the TREC 2008 and
2009 Legal Track’s Interactive Task, concluding that every system that
simultaneously achieved high precision and high recall, relative to the
other participating systems, relied on “human-assisted computer assess-
ment” (by which they meant what we refer to as technology-assisted
review). Subsequent results from 2010 and 2011 are consistent with
this finding. Importantly, these results span multiple organizations that
used different—and sometimes quite markedly different—approaches to
technology-assisted review; multiple production requests and two dif-
ferent collections (one production request for the CDIP collection of
scanned documents and 13 for some variant of the Enron collection
of email with attachments). There are also cases in which technology-
assisted review does relatively poorly, of course. To illustrate the range
of technology-assisted review approaches that have been tried, we re-
view three representative cases.
The Interactive Task design was developed by Bruce Hedin of H5,

5.5. Research on System and Process Design 103
an e-discovery service provider in San Francisco (USA). H5 created a
separate team, led by Christopher Hogan, which submitted results for
Topic 103 in 2008 and Topic 204 in 2009. The approach used in 2008 is
extensively documented in their TREC 2008 paper (Hogan et al., 2008)
and in a pair of conference papers (Bauer et al., 2009; Brassil et al.,
2009); according to Hogan et al. (2010), the approach used in 2009 was
similar. H5’s approach was based on using a team of specialists, in-
cluding: (1) a surrogate for the Topic Authority (TA) to learn the TA’s
conception of relevance and to make that available within the team,
(2) an expert in linguistics to help with crafting initial queries, (3)
an expert in text classification to train a classifier, and (4) annotators
to create training data.11 In 2008, H5 annotated over 8,000 training
examples for Topic 103 (for comparison, TREC annotated only 6.500
sampled documents as a basis for evaluation). This yielded quite good
results, with F1 measures of 0.705 and 0.801 in 2008 and 2009, re-
spectively. Indeed, when evaluated only on CDIP documents that were
automatically estimated to have high OCR accuracy, the 2008 results
were F1 = 0.798. Of course, many caveats are needed when interpret-
ing these results, including design limitations of the test collection (e.g.,
treating all unappealed documents as correctly assessed) and the fact
that results are available for only two production requests. In H5’s case,
an additional factor to bear in mind is that although the research team
and the evaluation designer had only arms-length interaction during
the evaluations, it would have been natural for them to share a com-
mon perspective on task and evaluation design. For all of these reasons,
it was important to see other teams achieve similar results.
Equivio, a company from Haifa (Israel), submitted results for Topic
205 and Topic 207 in 2009 (Sterenzy, 2009), and for Topic 303 in 2010,
achieving F1 scores of 0.684, 0.510 and 0.671, respectively. Equivio is
a system provider rather than a service provider, meaning that they
provide a standalone system that is intended to be used by a customer
to generate results themselves. For TREC, Equivio used their own sys-
tem to produce the submitted results. In contrast to H5’s approach,
11 H5 holds a patent (“System and method for high precision and high recall relevancysearching”, USPTO 8,296,309, October 23, 2012) which describes a method for semi-
automatically building a classifier using weighted Boolean queries.

104 Experimental Evaluation
Equivio relies on random sampling to generate initial results, and it
relies on a greater degree of automation for formative evaluation and
active learning.
The University of Waterloo (Canada) submitted results for Topics
201, 202, 203 and 207 in 2009 and for Topics 301, 302 and 303 in 2010,
achieving F1 scores of 0.840, 0.764, 0.769, 0.828 in the former year,
and 0.036, 0.275 and 0.228 in the latter. Their approach was differ-
ent from that of H5 and Equivio in at least one important way: snap
judgments (i.e., very rapid relevance assessments, averaging 7.5 seconds
per document) were used for classifier training at Waterloo, while H5
and Equivio presumably made more careful assessments (H5 does not
report the time devoted to assessment; Equivio reports an average of
about 40 seconds per assessment in 2009). In the 2009 Waterloo runs,
every submitted document had received a snap judgment. The consid-
erably lower results in 2010 may have resulted from some combination
of the two reported differences: (1) different assessors (all 2009 assess-
ments had been made by one assessor; in 2010 that assessor did not
participate), and (2) far fewer relevance assessments. Although it is
not possible to tease apart the effect of each factor from the reported
results, the difference in the number of positive relevance judgments is
striking, ranging from 141% to 275% of the number estimated (by the
track organizers) to exist in 2009, but only 5% to 34% of the number
estimated (by the track organizers) to actually exist in 2010. Thus in
2009 only a subset of the positive snap judgment assessments were sub-
mitted (those estimated by the classifier to be most reliable), while in
2010 many of the submitted results had never been seen by a human
assessor.
In TREC 2011, the Learning Task allowed participants to directly
request relevance annotations from the Topic Authority, and most par-
ticipants employed text classification techniques. It was found that 70%
recall could be achieved by productions of 1%, 3%, or 11% (across the
three different topics) of the collection, but that participating systems
were quite poor at actually picking the cutoff that achieved an optimal
recall-precision tradeoff (Grossman et al., 2011). One commercial sys-
tem employed a large number of additional in-house assessments (Zei-
noun et al., 2011), while the other two most effective Learning Task

5.5. Research on System and Process Design 105
Assessor pair Mutual F1 Cohen’s κ
Original vs. Manual A 0.28 0.16
Original vs. Manual B 0.27 0.15
Manual A vs. Manual B 0.44 0.24
Original vs. Auto C 0.34 0.25
Original vs. Auto D 0.38 0.29Table 5.3 Inter-assessor agreement reported by Roitblat et al. (2010).
systems trained text classifiers using only the Track-provided training
data. One system used logistic regression on character n-grams (War-
ren, 2011); the other fused together the results of a manually-written
Boolean query with a query constructed by extracted terms from the
assessed-relevant documents (Tomlinson, 2011).
Together, these results, and the results of the other teams who tried
technology-assisted review in the TREC Legal Track, suggest not only
that technology-assisted review can be rather effective (with the best
results probably being near the limits of measurement accuracy for the
evaluation designs used at the time), but also that the design space
to be explored among alternative approaches to technology-assisted
review is extensive.
5.5.2 Technology-Assisted versus Manual Review
While measures and comparisons of the effectiveness of systems for
technology-assisted review are of interest in themselves, another impor-
tant comparison for current e-discovery practice is between technology-
assisted review on the one hand, and the established approach of (linear
or keyword-filtered) manual review on the other (Grossman and Cor-
mack, 2011b; Russeth and Burns, 2010). To make such a comparison,
however, requires a gold standard to measure the two against.
Roitblat et al. (2010) took manual review as the gold standard, and
measure how close automated methods come to it. Their study took
an existing production performed by a large company in response to
a government regulatory request, using a team of 225 attorneys, who
reviewed over 2 million documents and found nearly 200,000 relevant,

106 Experimental Evaluation
at a cost of over $13 million USD. Two vendors of technology-assisted
review were asked to redo the production, independently of each other
and of the original production. One of these vendors, as part of their
standard internal processes, had two teams of manual reviewers inde-
pendently review the same random sample of 5,000 documents from
the original production.
Table 5.3 shows the results of the study by Roitblat et al.. The
problem with assessing the automated retrievals by how closely they
approximate manual review is immediately apparent: the manual re-
viewers disagree with each other so much that it is hard to know which
one the automated retrieval is meant to approximate. The only con-
clusion that Roitblat et al. (2010) were able to draw was that the
agreement of the automated productions with the manual reviewers
was no worse than of the manual reviewers with each other.
The alternative is to find a separate gold standard against which
both automated and manual reviews can be compared. Grossman and
Cormack (2011b) do this with the TREC 2009 Legal Track Interac-
tive Task (Section 5.2.3). They take the initial TREC review teams
as the manual reviewers; two high-scoring participants as examples of
technology-assisted review; and the final assessments, after adjudica-
tion of appeals by the topic authority.
The scores resulting from the manual and automatic evaluation of
Grossman and Cormack (2011b) are shown in Table 5.4. Measured by
precision and F1, the technology-assisted teams outperform the pseudo-
manual teams on four of the five topics, and by a wide margin; measured
by recall, the manual reviewers outperform on one topic, two are tied,
and the technology-assisted productions outperform on the remaining
two. Based on these results, Grossman and Cormack conclude that
technology-assisted production can be at least as effective as manual
review, if not more so, and at a fraction of the cost. These findings have
had a significant impact on the field, and have been cited in a judicial
opinion in da Silva Moore v. Publicis.12
12 Da Silva Moore v. Publicis Groupe et al., 11 Civ. 1279 (ALC) (AJP) (S.D.N.Y. Feb. 24,2012) (“Opinion and Order”) (Document 96 at http://archive.recapthelaw.org/nysd/
375665/.) (See Webber (2011) for a generally confirmatory re-analysis of these results.)

5.5. Research on System and Process Design 107
Topic Team Rec Prec F1
t201 System A 0.78 0.91 0.84
TREC (Law Students) 0.76 0.05 0.09
t202 System A 0.67 0.88 0.76
TREC (Law Students) 0.80 0.27 0.40
t203 System A 0.86 0.69 0.77
TREC (Professionals) 0.25 0.12 0.17
t204 System I 0.76 0.84 0.80
TREC (Professionals) 0.37 0.26 0.30
t207 System A 0.76 0.91 0.83
TREC (Professionals) 0.79 0.89 0.84
Table 5.4 Automated and manual effectiveness, from Grossman and Cormack (2011b).
5.5.3 Technology-Assisted Review versus Keyword Search
Prior to the adoption of automated text analysis methods such as
machine classification, the impracticality of exhaustive review of ESI
was tackled through Boolean keyword searches. The Boolean keyword
queries might be negotiated between the two sides prior to the pro-
duction process, and then simply applied, with matching documents
being manually reviewed. Or else a Boolean search tool might be in-
teractively used by an expert searcher to identify responsive ESI and
craft more accurate Boolean queries. An important question then is
how well automated methods compare with Boolean keyword searches.
Automated and Boolean methods were compared in the Ad Hoc
Task of the Legal Track of TREC 2006, TREC 2007, and TREC
2008 (Baron et al., 2006; Tomlinson et al., 2007; Oard et al., 2008).
The automated systems were batch systems; they were given a query
but no interaction with the user, and no relevance assessments to train
a classifier on. For each topic, a Boolean query was negotiated between
lawyers acting on behalf of the two sides in the fictional dispute, with-
out searching the collection itself. Figure 5.1 gives an example of such
a request and the Boolean query negotiated for it.
In TREC 2006, an expert searcher, experienced with the collec-

108 Experimental Evaluation
tion, was contracted to produce around 100 relevant documents for
each request, concentrating on those that a ranked retrieval system
was unlikely to produce (Baron et al., 2006). Through Boolean query
refinement, the expert searcher in TREC 2006 was able to find an 11%
more relevant documents than the negotiated Boolean queries. A far
larger number of relevant documents actually existed, however, since
the union of many retrieval systems yielded estimates of between 43%
(for one topic in 2006) and 350% (for one topic in 2007) more relevant
documents than the negotiated Boolean retrieval. The low estimated
recall of the negotiated Boolean query (22% in TREC 2007, 24% in
TREC 2008) came as a surprise to some, though it agrees with earlier
findings on Boolean query retrieval in e-discovery (Blair and Maron,
1985). In the TREC 2008 Legal Track, a distinction was made between
merely relevant and highly relevant documents, but even here, the ne-
gotiated Boolean query was on average only able to locate an estimated
33% of the highly relevant documents that were estimated to exist.
Clearly, there was considerable room for automated systems to im-
prove on the Boolean baseline. It proved, however, quite difficult for
any one automated systems to actually do so while maintaining a rea-
sonable level of precision. It wasn’t until TREC 2008 that automated
systems managed to beat the Boolean baseline as measured by F1, al-
though it is not clear the extent to which the difficulties in 2007 might
have resulted in part from an intentional focus on only lower-prevalence
topics in the first two years of the Legal Track. The most effective of
the automated runs from TREC 2008 employed a fusion of multiple re-
trieval techniques, then estimating the optimal number of documents
to return by a logistic regression of features trained on the previous
year’s results (Lynam and Cormack, 2008).
The automated systems discussed in Section 5.5.3 produced batch
runs, based only on the production request, without access to user
interaction or to annotations that could be used to train a classifier. In
the TREC 2007 and TREC 2008 Legal Track, a Relevance Feedback
Task was run (relevance feedback being in essence a simple approach
to text classification). The feedback runs were not able consistently
to beat the Boolean baseline in those years, but that may be in part
attributable to assessor disagreement between the assessments use to

5.5. Research on System and Process Design 109
train and the assessments used to test the systems (Tomlinson et al.,
2007; Oard et al., 2008). Assessor disagreement was later tackled in
the Interactive Task from TREC 2008 to TREC 2010 by using a topic
authority (Section 5.2.3), but without Boolean queries as a reference
condition.
5.5.4 Threshold Selection after Ranked Retrieval
Between 2008 and 2011, the TREC Legal Track included a task in
which participating teams sought to accurately estimate the number
of documents that should be produced to optimize some evaluation
measure (in all cases, F1). In 2008 and 2009, this was done in the
Ad Hoc and the Batch Tasks, respectively, by asking teams to submit
a ranked list and to specify what they estimated to be the optimal
cutoff below which documents should not be returned. In 2010 and
2011, this was done in the Learning Task by asking teams to submit
an estimate of the probability of relevance for each document, from
which the team’s best estimate of the optimal cutoff can be computed.
The results showed that reasonable estimates are possible, but that
considerable room for further improvement exists. For example, in 2010
the top four (of eight) participating teams achieved 87% 67%, 60%
and 63% (respectively) of the maximum possible F1 score that could
have been achieved given the ranking of their best run, because of
misestimating relevance probabilities, while in 2009 the corresponding
figures for the top two teams (of four) were 83% and 78% because of
misestimating cutoffs.
5.5.5 Finding “Hot” Documents
The 2008 Ad Hoc Task and the 2009 Batch Task of the TREC Legal
Track included two evaluations for each system, one using the standard
(broad) definition of relevance and a second using a narrower material-
ity standard (referred to in TREC as “highly relevant”). As expected,
far fewer documents are material than are relevant, but systems that
ranked documents well (relative to other systems) when judged by rel-
evance also tended to do well (relative to other systems) when judged
by materiality. For example, the same four teams achieved F1 scores
110 Experimental Evaluation
within 89% of the best run when scored by either standard.
5.5.6 Selection by Custodian
The risk of missing information through excluding seemingly less im-
portant custodians was studied by ZL Technologies in the TREC 2009
Legal Track Interactive Task (Wang et al., 2009). The team submitted
two result sets for Topic 203. In the first, they used a keyword search
process, achieving an F1 score of 0.292. For their second run, performed
by a separate team, they used a two-stage process in which the team
first selected four custodians in a manner similar to that used during
an acquisition process (specifically, they did so based on organizational
roles, not based on content) and then they conducted a similar keyword
search process, achieving an F1 score of 0.056. They reported that the
first (unconstrained) run found unique relevant documents held by 77 of
the 104 custodians. Although these results are based on a single search
method and a single topic, they do serve to illustrate the potential for
uncharacterized risks of insufficiently inclusive acquisition.
5.5.7 Classification for Privilege
An important innovation of the 2010 Interactive Task was the first
shared task evaluation of systems designed to detect privileged docu-
ments. The evaluation followed the design of the Interactive Task in
every detail (right down to privilege being referred to as a “topic”).
The evaluation of automated review for privilege was conducted in the
2010 TREC Legal Track’s Interactive Task by crafting Topic 304 as
a request for “all documents or communications that are subject to a
claim of attorney-client privilege, work-product, or other any other ap-
plicable privilege or protection, whether or not they are responsive to
any of the [other] document requests.” This was the only TREC topic
for which identifying privilege rather than topical relevance was the
goal; it (implicitly) modeled the case in which the entire collection had
already been determined to be responsive to some production request.
A joint team formed by a law firm (Cleary, Gottlieb, Steen & Hamilton)
and an e-discovery services provider (Backstop) submitted four runs,
and one run was submitted by another e-discovery services provider

5.6. For Further Reading 111
(Integreon). F1 measures ranged between 0.126 and 0.408, but of par-
ticular interest was the achievement of recall values of 0.715 and 0.633
(of the 20,176 privileged documents that were estimated by the track
coordinators to exist) for the two best runs. The best of these recall
results corresponds to reviewing 12% of the documents to find 71% of
the privileged documents. Although no published report on the meth-
ods used by that team (Cleary-Backstop) is available, the results do
indicate that automated techniques for privilege review have potential.
5.6 For Further Reading
• Sanderson (2010) is a comprehensive history of test collec-
tion based evaluation in information retrieval, with special
attention to studies of the reliability of the methodology. A
collection of papers about TREC is contained in Voorhees
and Harman (2005).• Each year’s Legal Track published an overview paper
that describes the collections and the methods that were
tried, and that summarizes some of the findings. These,
along with the reports of TREC participants on the runs
they submitted, can be found on the TREC proceed-
ings page at NIST, http://trec.nist.gov/proceedings/
proceedings.html. A summary of the Legal Track, with
links to reports, data, research papers, and other material,
can be found at http://trec-legal.umiacs.umd.edu/.
Additionally, Oard et al. (2010) gives a background and
overview for the first four years of the TREC Legal Track.• Roitblat et al. (2010) describes the technical findings of the
first EDI study, while Oot et al. (2010) draws out their im-
plications for a legal audience.• Pace and Zakaras (2012) review the published work on
technology-assisted review for e-discovery from a cost-
effectiveness perspective.• A detailed study of using a text-classification technology
(specifically, supervised probabilistic latent semantic anal-
ysis) in e-discovery is presented in Barnett et al. (2009).

6
Looking to the Future
The American sage Yogi Berra is quoted as having said “I never make
predictions, particularly about the future.” Writers of survey articles
apparently have no such compunctions. In this section, we recap some
of the most important gaps in our present knowledge and then offer
our thoughts on potentially productive research directions.
6.1 Some Important Things We Don’t Yet Know
Perhaps the most important open question faced by information re-
trieval researchers interested in e-discovery is how best to characterize
the causes and effects of measurement error. Information retrieval re-
searchers have over the years made an art of finessing the fact that they
don’t actually know what their users are looking for because all they
can see is their queries (and, more recently, their clicks). In e-discovery,
by contrast, we actually can know what the user is looking for, since
the stakes are high enough for that “user” (e.g., the lead attorney)
to devote considerable time and effort to clarifying their intent. This
opens new possibilities for evaluation using absolute measures, but we
don’t yet have well developed ways of fully exploiting this potential.
112

6.1. Some Important Things We Don’t Yet Know 113
Questions arising from the TREC Legal Track have recently inspired
some research on the types of mistakes assessors make, but more re-
mains to be done on not just modeling those errors, but also on learning
how best to statistically correct specific evaluation measures for their
effects.
A second important gap in our knowledge is how to design large
recall-focused test collections in ways that optimize reusability. We
know that we can characterize reusability using confidence intervals,
we know that in the worst case (of adversarial design of a system that
returns no assessed documents) those confidence intervals would span
the full spectrum of allowable values, and we expect that in most cases
that won’t happen. But at present we have essentially no experience
characterizing the relative cost, measured as the increase in the size of
the confidence interval, that would result from post-hoc use of a test
collection by a system that did not contribute to the sampling during
its construction.
When research work on e-discovery began, the assumption was that
once automated review for responsiveness was solved, the same tech-
nology could be more-or-less seamlessly applied to review for privilege.
That has turned out not to be the case in practice, or (so far) in re-
search. Advances in the automation of review for responsiveness have
not brought the hoped-for cost savings, since attorneys do not yet trust
automated methods for privilege review, and therefore frequently insist
on a manual review of the responsive set. Moreover, researchers have
yet to demonstrate to them that their fears are unfounded. Developing
techniques for automated privilege review, and building the test col-
lections on which they can be evaluated, are important tasks for the
immediate future.
Despite being included in every commercial workflow, evaluation of
deduplication remains a vast uncharted territory. Present techniques
take one of two approaches, either finding only exact bitwise matches
(after some preprocessing), in which case effectiveness evaluation is
unneeded, or finding near matches on a best-effort basis without evalu-
ation. Rather clearly, some near duplicates will be better choices than
others in terms of their effect on the degree to which downstream tasks
are able to balance costs and benefits, but, absent measurement, the

114 Looking to the Future
tuning of such systems remains rather a black art. The evaluation prob-
lem for deduplication resembles the evaluation problem for relevance
(to the extent that the goal of deduplication is to allow relevance de-
cisions to be made on a single exemplar), but there is much to be
done between that first recognition of the need and a repeatable and
affordable evaluation process that can yield useful insights.
Issues of privacy protection, and in particular how to prevent leak-
age of private data through repeated evaluation, will be important if
the research community is to move from an evaluation model based
on data distribution to one based on algorithm deposit. Algorithm de-
posit, which has been used to good effect for evaluation of email spam
filtering and music recommendation, offers promise as a repeatable and
reusable approach to experimentation with sensitive materials, but the
risks posed by such models in the face of adversarial behavior are not
yet well characterized. If you think they are, ask yourself whether you
would be willing to try an algorithm deposit model for conducting in-
formation retrieval experiments with nuclear launch codes. If not, you
probably don’t want to do that with highly sensitive corporate email
that contains confidential information that could affect stock prices,
professional reputations, and the protection of trade secrets. If people
are to allow academics to conduct experiments on the real data, they
are going to need real information security assurances.
There has to date been far less engagement with e-discovery by
researchers with expertise in information seeking behavior than by
system-oriented information retrieval researchers. To some extent this
makes sense—there is no information seeking behavior to study until
the requisite information systems exist. The problem is that all infor-
mation systems embed some model of the information seeking behavior
that they are designed to support, and thus someone must have given
design thought to information seeking behavior if such systems now
exist. But whether that thought was well informed is now water under
the bridge for e-discovery; we now have systems, and thus we have the
opportunity to study how people are using them. It’s therefore high
time that information seeking behavior researchers join the fray!
Present approaches to review tend to be polar, emphasizing manual
query formulation, machine learning approaches, or exhaustive review,

6.1. Some Important Things We Don’t Yet Know 115
mostly to the exclusion of the others. Some convergence is evident, but
we are still far from having a good understanding of the sorts of “all of
the above” techniques that could draw flexibly on the strengths of each
of these approaches. For example, despite half a decade having passed
since we learned in the TREC Legal Track that bag of words tech-
niques had trouble beating Boolean queries, our best machine learning
techniques still rely on a bag of words. It remains to be seen what
use can be made in automated review of entity extraction, document
metadata, social network analysis, the structure and patterns of email
communication, the temporal and organizational locality of responsive
information, and so forth. We have the test collections that we need if
we are to explore ways of doing better, and indeed there now seems to
be some work starting in that direction.
Research and technology development in e-discovery has focused to
date on the problem of automating review for production. But this
is only one of the phases in the e-discovery process. Prior to pro-
duction, parties must assess the strength of their position, determine
their strategies, and negotiate with their opponents, including on the
terms of the production itself—a stage known as “early case assess-
ment” (ECA). Since the great majority of civil cases are settled before
they go to trial, effective ECA tools are just as important as efficient
automated review systems, but have attracted far less research atten-
tion to date. A wide range of technologies are applicable here, such
as exploratory search and data analysis, data visualization and social
network analysis. And even before ECA in the process, attention is still
needed to the management of corporate document repositories in a way
that facilitates recurrent e-discovery and maximizes information value
for business purposes, issues involving another distinct set of research
questions.
The real test of research and development will be the widespread
adoption of what we have learned as a basis for best practices in the
law. There is still a vigorous debate playing out between lawyers, and
between lawyers and the courts, about precisely what questions we will
need to answer. But it seems fairly clear that the three basic questions
will be (1) how well do you expect to be able to do (for some given
cost)?, (2) how do you achieve that?, and (3) once you have done it, how

116 Looking to the Future
do you demonstrate how well you actually did? The key, from the per-
spective of information retrieval researchers, will be to remain attuned
to precisely how the courts ask those questions, and to inform the legal
community’s discussion of these issues based on our understanding of
the fundamental limitations of our own techniques.
6.2 Some Prognostications
It seems fairly safe to make two simple predictions. First, like Web
search, e-discovery will bridge many disciplines that have heretofore
been separate. Already, we have lawyers and information retrieval re-
searchers engaged in a rich discussion. However, information retrieval is
but one of the disciplines on which e-discovery relies. Advances in tech-
niques for automating review, and most especially in privilege review,
would rebalance the emphasis among disciplines, with disciplines as
diverse as visual analytics, data mining, and statistical process control
perhaps coming to the fore. Essentially, e-discovery is a team sport, and
the better we do on our part of the team’s work, the more important
it will become to integrate our work with those who bring expertise in
other parts of the puzzle. We will need polymaths who can move fluidly
between disciplines to help us recognize and enhance those connections.
Second, the ultimate questions in e-discovery are not about what
our technology will be able to do, or how our present legal system
will use what we can build, but rather about how the law and the
technology that supports it can and should co-evolve. Neither techno-
logical determinism nor social construction of technology can tell the
whole story; technology and society evolve together in complex ways
that depend in part on the path that brought us here. The world is a
complex place, and e-discovery practice in the USA is just one part of
that story. Other nations, with other legal systems, will follow different
paths. Moreover, our technology will be appropriated for purposes that
we might anticipate (e.g., transparency in government) and for others
that we might not. As a result, we need more than just polymaths
who can move between technical disciplines; we need polymaths who
can help us all to manage this somewhat chaotic and unpredictable
co-evolution.

6.3. For Further Reading 117
6.3 For Further Reading
• Baron (2011) is a commentary on the current state of the
field, and the future challenges and opportunities it faces, fo-
cusing on more iterative and cooperative discovery processes,
the adoption of automated text analysis tools, and standards
for better production quality control.• In Da Silva Moore v. Publicis Groupe et al., 11 Civ. 1279
(ALC) (AJP) (S.D.N.Y. Feb. 24, 2012) (“Opinion and Or-
der”)1, the court presented the first judicial opinion approv-
ing the use of computer-assisted coding (i.e., text classifica-
tion), creating an enormous splash in the e-discovery com-
munity (which can be traced in the blogosphere). The case is
ongoing, but this opinion offers important insight into what
the adaption of automated text analysis tools means for the
law.• In a reprise of “turtles all the way down,” those who study
how best to make and use information retrieval technology
are in turn studied by scholars working in the field of Sci-
ence, Technology and Society (STS). For classic critiques of
technological determinism, see Bijker et al. (1987) or Macken-
zie and Wajeman (1985). STS scholars can also be found in
abundance at the annual conference of the Society for So-
cial Studies of Science (4S). Which, of course, leads to the
question of who studies the STS scholars?
1 Document 96 at http://archive.recapthelaw.org/nysd/375665/

7
Conclusion
When finally apprehended, bank robber Willie Sutton was asked by
a reporter why he robbed banks. His answer was disarmingly simple:
“because that’s where the money is.” So it is in information retrieval
as well—we work on the problems where the money is. We do so not
merely because those problems are important to our society, at least as
judged by a strictly financial yardstick, but also because those “chal-
lenge problems” become the laboratories within which we develop tech-
nologies that will also be important in ways that perhaps we can’t even
yet envision. In a very real sense, technology and society meet “where
the money is.” Over the last decade, e-discovery has emerged as one of
these laboratories for innovation, and there’s no sign of that changing
any time soon.
It used to be said that ranked retrieval was demonstrably better
than exact-match techniques that returned a set. A close reading of
that literature indicates, however, that the unstated caveat was better
for the person with the information need. The research to date on e-
discovery seems to suggest the opposite conclusion: when the requesting
party is not able to see the collection, then what they need is a set
of documents, and the best way we know (at least so far) to get a
118

119
set of documents is to build a classifier that seeks to produce that
set. That’s not to say that there is not a place for ranked retrieval in
e-discovery. But as Willie Sutton would remind us, the money in e-
discovery is presently being spent largely on review for responsiveness
and privilege, and those activities by their nature (at least the way the
law is presently structured) are set-based. If Willie Sutton were alive
today and working on e-discovery, he would be working on set-based
retrieval.
A second truism in information retrieval research is that we can
make relative effectiveness comparisons fairly reliably, but that abso-
lute measures of effectiveness are elusive because different people have
different conceptions of relevance. Not all truisms are true, however. In
particular, research on e-discovery has shown that it is possible (using
an interactive experiment design) to give systems and assessors nearly
the same conception of relevance, and that doing so yields results that
can be useful for cases in which some single authority exists (e.g., the
lead attorney for one of the parties).
Reliance on interactive evaluations is sometimes seen as problem-
atic, however, because a third factor shaping the world view of informa-
tion retrieval researchers is that interactive experiments are expensive
and often inconclusive. At the same time that e-discovery researchers
were learning that “expensive” is a relative concept and that e-discovery
is indeed a viable setting for studies that might well be far too expen-
sive in other applications, Web researchers were learning how to do
informative interactive A-B studies at heretofore unimaginable scales
at quite modest (relative) costs. Predicting a renaissance in interactive
experimentation might be overstating the case, but nevertheless it now
seems quite clear that e-discovery has something to offer researchers
who are interested in that kind of work.
The research on e-discovery has, of course, not all been focused on
broad ideas with transformational potential. Indeed, the progress has
been incremental. We find it quaint and perhaps a bit humorous that
early newspapers looked like pamphlets, and that early news Web sites
looked like newspapers. Others studying us will see the same type of
behavior in our use of Mean Average Precision in the first year of the
TREC Legal Track, of course. Paradigm shifts are rare; science most

120 Conclusion
often advances in small steps. We now know much more about evalu-
ation design for set-based retrieval from large collections than we did
before. We know more about how to control measurement error when
absolute effectiveness measures are important. We have new test col-
lections containing scanned documents and email (with attachments).
All of these advances, and several others, will have effects that reach
far beyond e-discovery.
But the results of research are more than just what we learn; those
who learn it are also changed. We now have e-discovery researchers in
our midst who first practiced law but now study information retrieval,
and who first studied information retrieval but now practice law. Re-
search is in many ways a craft in the sense intended by the guilds of
old: research produces researchers. Including, now that you have read
this volume, you.

A
Interpreting Legal Citations
Common law relies upon evidence and precedent. It is natural, there-
fore, that legal writing, in the courts and in scholarly journals, is marked
by extensive citations; one journal article selected at random has 219
footnotes, almost all citations, in its 48 single-column pages. Legal writ-
ing must cite not only to standard publications, such as books and ar-
ticles, but also to legislation, case law, and court filings, across multiple
jurisdictions, and issued by various, sometimes overlapping publishers.
It is not surprising, therefore, that rigorous and complex standards for
legal citation have been developed by the profession. In the US, these
standards are systematized in The Bluebook, a 500-page guide now
in its 19th edition (Harvard Law Review, 2010)—a guidebook so in-
timidating that it has brought forth in turn guidebooks to it (Barris,
2010). While full fluency in creating such citations is not required for
readers (nor, fortunately, for writers) of this survey, some familiarity
in deciphering them is helpful. We are only able in this appendix to
examine citation standards in US law (as in the preceding we have only
been able to consider the effect US law and precedent on e-discovery
practice).
121

122 Interpreting Legal Citations
A.1 Case Law
Case law consists of the written opinions of judges explaining their
judgment in cases before them. The filings, evidence, arguments, and
in-process remarks of the judge are not part of case law, though some
of these may be reproduced by the judge in his or her written opinion.
Case law is the main form of precedent in common law countries such
as the United States.
Citation to a case law in the US follows the general format:
Plaintiff v. Defendant, Volume Series FirstPage [, Cit-
edPage] ([Venue] Year).
Take a citation touching on waiver of privilege due to over-production
as an example:
Mt. Hawley Ins. Co. v. Felman Prod., Inc., 271 F.R.D.
125, 136 (S.D.W.Va. 2010)
The case had the Mt. Hawley Insurance Company suing Felman Pro-
ductions (over an alleged fraudulent insurance claim). The opinion is
reported in volume 271 of the Federal Rules Decisions (a series, or in
legal terms “reporter”, of case law published by West Publishing), start-
ing on page 125; the particular point the citer wishes to draw attention
to is located on page 136. The case was heard in the U.S. District Court
for the Southern District of West Virginia, and was decided in 2010.
In legal writing, the citation is frequently followed in parentheses by a
summary or quotation of the point the citer asserts the case speaks to.
Naturally, one is unlikely to have the 300-odd volumes of the Federal
Rules Decisions ready to hand. Nowadays, case law is generally accessed
through online portals. Supreme court decisions are publicly available
(for instance, through Google Scholar), but many other jurisdictions
are only available through subscription services such as WestLaw and
LexisNexis (which may be accessible through your institution). When
searching for a specific case, the Volume–Series–FirstPage format (such
as “271 F.R.D. 125”) is the surest to find the sought-after case docu-
ments, though the names of the parties (such as “Mt. Hawley v. Fel-
man”) has better recall for informal commentary on the case.

A.2. Statutes and Rules 123
A.2 Statutes and Rules
The format of a statute citation depends upon the jurisdiction issuing
the statute. State statutes citation format varies from state to state; a
sample format is:
State Code Title §Section [(Publisher Year)] .
For instance,
Md. Code Ann. Lab. & Empl. §3-712
is a statute in the Annotated Labor and Employment Code of Mary-
land, coming into effect on October 1, 2012, which prevents employers
from asking current or potential employees for their social media pass-
words (something with evident implications for e-discovery). Federal
statutes are cited as:
TitleNumber Code §Section [(VolumeYear)] .
For example,
28 U.S.C. §1920
is a statute of the United States (federal) Code, under Title 28 (de-
noting subject area), Section 1920, which defines costs that may be
recovered in a court case; whether this allows the victorious party to
claim e-discovery costs from their opponents is currently under dispute.
The regulations most directly affecting the practice of e-discovery,
however, are not statute law, but state and federal rules of civil proce-
dure, most importantly the Federal Rules of Civil Procedure (FRCP)
themselves. The FRCP are issued by the United States Supreme Court,
subject only to veto by Congress. The FRCP are cited simply in the
form:
Fed. R. Civ. P. Rule [Section . . . ].
So, for instance,
Fed. R. Civ. P. 26(b)(2)(C)(iii)

124 Interpreting Legal Citations
is the sub-item in the FRCP which requires the court to limit the scope
of discovery if it determines that the expense outweighs the benefit
(the principle of proportionality). Note that, although the FRCP are
updated from time to time (mostly notably to cover ESI in 2006, and
most recently in 2010), the revision year of the cited rule is generally
not stated. Citations to state rules of civil procedure (most, but not
all, of which are based upon the federal rules) generally follow a similar
format, but with the state’s abbreviation prepended. Rules and statutes
are generally publicly available on the web.
A.3 Other Court Documents
The opinions of case law are what comes out of a case; the docket
is what goes into it. A case docket consists of the filings, affidavits,
transcripts, motions, orders, and other documents submitted and pro-
duced in the course of a case. These do not establish precedent, and
so are not frequently cited by lawyers, except as back-references within
the one case, or in the appeal hearing for a previous case. Nor are
these documents printed by court reporters as part of case law, mak-
ing that citation format inapplicable (as it is for cases currently being
argued). These documents do, however, contain interesting informa-
tion about current e-discovery procedure, about points at issue in e-
discovery practice, and about the beliefs, attitudes, and understandings
(or lack thereof) of trial participants regarding e-discovery. Moreover,
court documents are published as a trial proceeds, and provide evolv-
ing insight (and spectator opportunities) for ongoing cases of current
interest (of which there are at least two in the e-discovery realm at time
of writing).
Citation formats for citing to court documents seem to vary more
widely than for case law and statutes; the formal Bluebook standard
is somewhat obscure and does not appear generally used. The general
principle is that the case must be specified (which is the easy part),
then the document within the case (which is not so straightforward).
A frequently-used format, and the one we follow, is thus:
Plaintiff v. Defendant, CaseId [at Page] (Venue Date)
(Title) .

A.3. Other Court Documents 125
So, for instance:
Da Silva Moore v. Publicis Groupe et al., 11 Civ. 1279
(ALC) (AJP) at 5 (S.D.N.Y. Feb. 22, 2012) (“Parties’
proposed protocol [...] and Order”)
cites to page 5 of an e-discovery protocol, made an order of the court
and filed on February 22nd, 2012, in the Da Silva Moore v. Publicis
Groupe case (case number 11 Civ. 1279), being heard in the District
Court of the Southern District of New York.
Unless a case is sealed by the order of the judge, court documents
are public records; but accessing them is not straightforward. The of-
ficial portal for US federal court documents is PACER (Public Access
to Court Electronic Records). Access to documents through PACER,
however, requires not only an account, but also the payment of a
charge per sheet (10 cents at the time of writing). As anyone who
has been charged per page by a lawyer can tell you, legal documents
are not compactly formatted; the cost of downloads from PACER can
therefore quickly mount. Limited coverage of dockets are provided free
through sites such as justia.com and recapthelaw.org. When a ref-
erence to the docket of an in-process is made, we provide the URL of a
page giving (partial) free coverage for that docket, with the document
number of document within that docket. So, for instance, the above-
cited Da Silva Moore v. Publicis Groupe protocol is Document 92 at
http://archive.recapthelaw.org/nysd/375665/.

Acknowledgements
This survey would simply not have been possible without the patient
explanations of a very large number of people to what was originally
terra incognita for those of us from the world of information retrieval
research. Among these patient souls are participants in the TREC Le-
gal Track, the DESI and SIRE workshops, and the Sedona Conference,
and the guest speakers in our graduate course on e-discovery at the
University of Maryland. The authors are particularly indebted to Ja-
son R. Baron, Gordon V. Cormack, Maura R. Grossman, Bruce Hedin,
David D. Lewis, Ian Soboroff, Paul Thompson, Stephen Tomlinson and
Ellen Voorhees for their contributions to the ideas that are embodied
in the TREC Legal Track; to Ophir Frieder and David Grossman, at
the time at IIT, Venkat Rangan of Clearwell Systems, and John Wang
of the EDRM Data Set project for their help in building the TREC
test collections; and to Anne Kershaw, Patrick Oot and Herb Roitblat
for creating the EDI evaluations as a counterpart to TREC. This work
has been supported in part by the National Science Foundation under
grant IIS-1065250. Any opinions, findings, and conclusions or recom-
mendations expressed in this material are those of the authors and do
not necessarily reflect the views of the National Science Foundation.
126

Notations and Acronyms
Acronym Meaning
4S Society for Social Studies of Science
ACM Association for Computing Machinery
AP Average Precision
AUC Area Under Curve
AUROC Area Under ROC
bcc Blind Carbon Copy (an email header)
CMU Carnegie Mellon University
cc Carbon Copy (an email header)
CDIP Complex Document Information Processing (test collection)
DESI Discovery of Electronically Stored Information (workshop series)
DCG Discounted Cumulative Gain
ECA Early Case Assessment
EDI Electronic Discovery Institute
EDRM Electronic Discovery Reference Model
EDRMS Electronic Document and Record Management System
ESI Electronically Stored Information
FERC Federal Energy Regulatory Commission
FRCP Federal Rules of Civil Procedure
IIT Illinois Institute of Technology
IR Information Retrieval
127

128 Notations and Acronyms
Acronym Meaning
MAP Mean Average Precision
MCC Matthews’ Correlation Coefficient
MD5 Message Digest 5 (hash algorithm)
MIME Multimedia Internet Message Extensions
MIT Massachusetts Institute of Technology
OCR Optical Character Recognition
OLAP On-Line Analytic Processing
OLE Object Linking and Embedding
PDA Personal Digital Assistant
PRES Patent Retrieval Evaluation Score
PST Personal Storage Table (email file format)
RBP Rank-Based Precision
ROC Receiver Operating Characteristic
SIGIR ACM Special Interest Group on Information Retrieval
SIRE SIGIR Information Retrieval for E-Discovery (workshop)
SLA Service Level Agreement
SRS Simple Random Sample
STS Science, Technology and Society
TA Topic Authority
TREC Text Retrieval Conference
USA United States of America
USD United States Dollars

References
Agrawal, R., Mannila, H., Srikant, R., Tolvonen, H., and Verkamo, A. I.
(1996). Fast discovery of association rules. Advances in Knowledge
Discovery and Data Mining, 12:307–328.
Agresti, A. and Coull, B. A. (1998). Approximate is better than “ex-
act” for interval estimation of binomial proportions. The American
Statistician, 52(2):119–126.
Aslam, J. and Pavlu, V. (2008). A practical sampling strategy for effi-
cient retrieval evaluation. Technical report, Northeastern University.
Aslam, J., Pavlu, V., and Yilmaz, E. (2006). A statistical method
for system evaluation using incomplete judgments. In Dumais, S.,
Efthimiadis, E., Hawking, D., and Jarvelin, K., editors, Proc. 29th
Annual International ACM SIGIR Conference on Research and De-
velopment in Information Retrieval, pages 541–548, Seattle, Wash-
ington, USA.
Attfield, S. and Blandford, A. (2010). Discovery-led refinement in e-
discovery investigations: sensemaking, cognitive ergonomics and sys-
tem design. Artificial Intelligence and Law, 18(4):387–412.
Bailey, P., Craswell, N., Soboroff, I., Thomas, P., de Vries, A., and
Yilmaz, E. (2008). Relevance assessment: are judges exchangeable
129

130 Notations and Acronyms
and does it matter? In Myaeng, S.-H., Oard, D. W., Sebastiani,
F., Chua, T.-S., and Leong, M.-K., editors, Proc. 31st Annual Inter-
national ACM SIGIR Conference on Research and Development in
Information Retrieval, pages 667–674, Singapore, Singapore.
Baldi, P., Brunak, S., Chavin, Y., Andersen, C. A. F., and Nielsen, H.
(2000). Assessing the accuracy of prediction algorithms for classifi-
cation: an overview. Bioinformatics, 16(5):412–424.
Bales, S. and Wang, P. (2006). Consolidating user relevance criteria: A
meta-ethnography of empirical studies. In Proceedings of the 42nd
Annual Meeting of the American Society for Information Science and
Technology.
Balog, K. (2008). People Search in the Enterprise. PhD thesis, Uni-
versity of Amsterdam.
Barnett, T., Godjevac, S., Renders, J.-M., Privault, C., Schneider, J.,
and Wickstrom, R. (2009). Machine learning classification for doc-
ument review. In DESI III: The ICAIL Workshop on Globaal E-
Discovery/E-Disclosure.
Baron, J. R. (2007). The TREC Legal Track: Origins and reflections
on the first year. The Sedona Conference Journal, 8.
Baron, J. R. (2008). Towards a new jurisprudence of information re-
trieval: What constitutes a ’reasonable’ search for digital evidence
when using keywords? Digital Evidence and Electronic Signature
Law Review, 5:173–178.
Baron, J. R. (2009). E-discovery and the problem of asymmetric knowl-
edge. Mercer Law Review, 60:863.
Baron, J. R. (2011). Law in the age of exabytes: Some further thoughts
on ’information inflation’ and current issues in e-discovery search.
Richmond Journal of Law and Technology, 17(3).
Baron, J. R., Lewis, D. D., and Oard, D. W. (2006). TREC-2006
legal track overview. In Voorhees, E. and Buckland, L. P., editors,
Proc. 15th Text REtrieval Conference, pages 79–98, Gaithersburg,
Maryland, USA. NIST Special Publication 500-272.
Baron, J. R., Oard, D. W., Elsayed, T., and Wang, L. (October 6, 2008).
No, Not That PMI: Creating Search Technology for E-Discovery.
Powerpoint slides.
Barris, L. J. (2010). Understanding and mastering The Bluebook. Car-

Notations and Acronyms 131
olina Academic Press, 2nd edition.
Bauer, R. S., Brassil, D., Hogan, C., Taranto, G., and Brown, J. S.
(2009). Impedance matching of humans and machines in high-q in-
formation retrieval systems. In Proceedings of the IEEE International
Conference on Systems, Man and Cybernetics, pages 97–101.
Bennett, S. and Millar, S. (2006). Multinationals face e-discovery chal-
lenges. International Financial Law Review, 25:37–39.
Berman, M. D., Barton, C. I., and Grimm, P. W., editors (2011).
Managing E-Discovery and ESI: From Pre-Litigation Through Trial.
American Bar Association.
Bijker, W. E., Hughes, T. P., and Pinch, T. J., editors (1987). The
Social Construction of Technological Systems: New direct ions in the
sociology of history and technology. MIT Press.
Blair, D. and Maron, M. E. (1985). An evaluation of retrieval effec-
tiveness for a full-text document-retrieval system. Communications
of the ACM, 28(3):289–299.
Borden, B. B. (2010). E-discovery alert: The demise of linear review.
Borden, B. B., McCarroll, M., Vick, B. C., and Wheeling, L. M. (2011).
Four years later: How the 2006 amendments to the federal rules have
reshaped the e-discovery landscape and are revitalizing the civil jus-
tice system. Richmond Journal of Law and Technology, 17(3).
Brassil, D., Hogan, C., and Attfield, S. (2009). The centrality of user
modeling to high recall with high precision search. In Proceedings of
the IEEE International Conference on Systems, Man and Cybernet-
ics, pages 91–96.
Brewer, K. R. W. and H. anif, M. (1983). Sampling with unequal proba-
bilities. Springer.
Broder, A. Z. (2000). Identifying and filtering near-duplicate docu-
ments. In 11th Annual Symposium on Combinatorial Pattern Match-
ing, pages 1–10.
Brown, L. D., Cai, T. T., and DasGupta, A. (2001). Interval estimation
for a binomial proportion. Statistical Science, 18(2):101–133.
Buckley, C. and Voorhees, E. (2005). Retrieval system evaluation. In
Voorhees and Harman (2005), chapter 3.
Buonaccorsi, J. P. (2010). Measurement Error: Models, Methods, and
Applications. Chapman and Hall/CRC.

132 Notations and Acronyms
Carroll, J. L. (2010). Proportionality in discovery: A cautionary tale.
Campbell Law Review, 32(3):455–466.
Carterette, B., Pavlu, V., Kanoulas, E., Aslam, J., and Allan, J. (2008).
Evaluation over thousands of queries. In Myaeng, S.-H., Oard, D. W.,
Sebastiani, F., Chua, T.-S., and Leong, M.-K., editors, Proc. 31st
Annual International ACM SIGIR Conference on Research and De-
velopment in Information Retrieval, pages 651–658, Singapore, Sin-
gapore.
Chakaravarthy, V. T., Gupta, H., Roy, P., and Mohania, M. K. (2008).
Efficient techniques for document sanitization. In Proceedings of the
17th International Conference on Information and Knowledge Man-
agement (CIKM), pages 843–852.
Chaplin, D. T. (2008). Conceptual search – ESI, litigation and the issue
of language. In DESI II: Second International Workshop on Support-
ing Search and Sensemaking for Electronically Stored Information in
Discovery Proceedings, London, UK.
Chu, H. (2011). Factors affecting relevance judgment: A report from
TREC legal track. Journal of Documentation, 67(2):264–278.
Clarke, C. L. A., Kolla, M., Cormack, G. V., Vechtomova, O., Ashkan,
A., Buttcher, S., and MacKinnon, I. (2008). Novelty and diversity
in information retrieval evaluation. In Myaeng, S.-H., Oard, D. W.,
Sebastiani, F., Chua, T.-S., and Leong, M.-K., editors, Proc. 31st
Annual International ACM SIGIR Conference on Research and De-
velopment in Information Retrieval, pages 659–666, Singapore, Sin-
gapore.
Cleverdon, C. W. (1967). The Cranfield tests on index language devices.
Aslib Proceedings, 19:173–192.
Clopper, C. J. and Pearson, E. S. (1934). The use of confidence or
fiducial limits illustrated in the case of the binomial. Biometrika,
26(4):404–413.
Cochran, W. G. (1977). Sampling Techniques. John Wiley & Sons, 3rd
edition.
Cohen, J. (1960). A coefficient of agreement for nominal scales. Edu-
cational and Psychological Measurement, 20(1):37–46.
Conrad, J. G. (2010). E-discovery revisited: the need for artificial intel-

Notations and Acronyms 133
ligence beyond information retrieval. Artificial Intelligence and Law,
18(4):321–345.
Cormack, G. V., Grossman, M. R., Hedin, B., and Oard, D. W. (2010).
Overview of the TREC 2010 Legal Track. In Voorhees, E. and Buck-
land, L. P., editors, Proc. 19th Text REtrieval Conference, pages
1:2:1–45, Gaithersburg, Maryland, USA.
Curtis, T. (1997). Declassification overview. In Doermann, D., editor,
Proceedings of the 1997 Symposium on Document Image Understand-
ing Technology, page 39.
Dervin, B. and Foreman-Wernet, L., editors (2003). Sense-Making
Methodology Reader: Selected writings of Brenda Dervin. Hampton
Press.
Doermann, D. (1998). The indexing and retrieval of document imgaes:
A survey. Computer Vision and Image Understanding, 70(3):287–
298.
Dumais, S., Platt, J., Heckerman, D., and Sahami, M. (1998). Inductive
learning algorithms and representations for text categorization. In
Proc. and 7th and ACM International Conference on Information
and Knowledge Management, pages 148–155.
Dumais, S. T., Joachims, T., Bharat, K., and Weigend, A. S. (2003).
Sigir 2003 workshop report: Implicit measures of user interests and
preferences. SIGIR Forum, 37(2):50–54.
Efthimiadis, E. N. and Hotchkiss, M. A. (2008). Legal discovery: does
domain expertise matter? Proc. Am. Soc. Info. Sci. Tech., 45:1–2.
Eichmann, D. and Chin, S.-C. (2007). Concepts, semantics and syntax
in e-discovery. In DESI I: The ICAIL Workshop on Supporting Search
and Sensemaking for Electronically Stored Information in Discovery
Proceedings, Palo Alto, CA, USA.
Elsayed, T., Oard, D. W., and Namata, G. (2008). Resolving personal
names in email using context expansion. In Proceedings of the 46th
Annual Meeting of the Association for Computational Linguistics,
pages 941–949.
Facciola, J. M. and Redgrave, J. M. (2009). Asserting and challenging
privilege claims in modern litigation: the Facciola-Redgrave frame-
work. The Federal Courts Law Review, 4:19–54.
Fischer, S., Davis, R. E., and Berman, M. D. (2011). Gathering, re-
134 Notations and Acronyms
viewing, and producing esi: An eight-stage proc ess. In Berman et al.
(2011), chapter 14.
Force, D. C. (2010). From Peruvian Guano to electronic records: Cana-
dian e-discovery and records professionals. Archivaria, 69:1–27.
Fuhr, N., Govert, N., Kazai, G., and Lalmas, M. (2002). INEX: INi-
tiative for the Evaluation of XML Retrieval. In Proceedings of the
SIGIR 2002 Workshop on XML and Information Retrieval, pages
1–9.
Garcia-Molina, H., Ullman, J. D., and Widom, J. (2009). Database
systems—The complete book (2. ed.). Pearson Education.
Gorg, C. and Stasko, J. (2008). Jigsaw: Investigative analysis on text
document collections through visualization. In DESI II: Second In-
ternational Workshop on Supporting Search and Sensemaking for
Electronically Stored Information in Discovery Proceedings, London,
UK.
Grimm, P. W., Yurmit, L., and Kraeuter, M. P. (2011). Federal Rule of
Evidence 502: Has it Lived Up to its Potential? Richmond Journal
of Law and Technology, 17(3).
Grossman, M. R. and Cormack, G. V. (2011a). Inconsistent assessment
of responsiveness in e-discovery: difference of opinion or human er-
ror? In DESI IV: The ICAIL Workshop on Setting Standards for
Searching Electronically Stored Information in Discovery Proceed-
ings, pages 1–11, Pittsburgh, PA, USA.
Grossman, M. R. and Cormack, G. V. (2011b). Technology-assisted
review in e-discovery can be more effective and more efficient than
exhaustive manual review. Richmond Journal of Law and Technol-
ogy, 17(3):11:1–48.
Grossman, M. R., Cormack, G. V., Hedin, B., and Oard, D. W. (2011).
Overview of the TREC 2011 Legal Track. In Voorhees, E. and Buck-
land, L. P., editors, Proc. 20th Text REtrieval Conference, page 20pp,
Gaithersburg, Maryland, USA.
Harter, S. (1986). Online Information Retrieval: Concepts, principles,
and techniques. Academic Press.
Harvard Law Review (2010). The Bluebook: A Uniform System of
Citation. The Harvard Law Review Association, 19th edition.
Hedin, B. and Oard, D. W. (2009). Replication and automation of

Notations and Acronyms 135
expert judgments: information engineering in legal e-discovery. In
SMC’09: Proceedings of the 2009 IEEE international conference on
Systems, Man and Cybernetics, pages 102–107.
Hedin, B., Tomlinson, S., Baron, J. R., and Oard, D. W. (2009).
Overview of the TREC 2009 Legal Track. In Voorhees, E. and
Buckland, L. P., editors, Proc. 18th Text REtrieval Conference, pages
1:4:1–40, Gaithersburg, Maryland, USA. NIST Special Publication
500-278.
Henseler, H. (2009). Network-based filtering for large email collections
in e-discovery. In DESI III: The ICAIL Workshop on Globaal E-
Discovery/E-Disclosure.
Heuer, R. J. (1999). Psychology of Intelligence Analysis. Center for the
Study of Intelligence.
Higgins, J. P. T. and Green, S. (2008). Cochrane Handbook for Sys-
tematic Reviews of Interventions. John Wiley & Sons.
Hoad, T. C. and Zobel, J. (2003). Methods for identifying versioned
and plagiarized documents. Journal of the American Society for
Information Science and Technology, 54(3):203–215.
Hogan, C., Bauer, R. S., and Brasil, D. (2010). Automation of le-
gal sensemaking in e-discovery. Artificial Intelligence and Law,
18(4):431–457.
Hogan, C., Brassil, D., Rugani, S. M., Reinhart, J., Gerber, M., and
Jade, T. (2008). H5 at TREC 2008 legal interactive: User model-
ing, assessment and measurement. In Voorhees, E. and Buckland,
L. P., editors, Proc. 17th Text REtrieval Conference, pages 2:18:1–9,
Gaithersburg, Maryland, USA. NIST Special Publication 500-277.
Jansen, B. J., Spink, A., and Taksa, I., editors (2009). Handbook of
Research on Web Log Analysis. Information Science Reference.
Jarvelin, K. and Kekalainen, J. (2000). IR evaluation methods for
retrieving highly relevant documents. In Yannakoudis, E., Belkin,
N. J., Leong, M.-K., and Ingwersen, P., editors, Proc. 23rd Annual
International ACM SIGIR Conference on Research and Development
in Information Retrieval, pages 41–48, Athens, Greece.
Joachims, T. (1998). Text categorization with support vector machines:
Learning with many relevant features. In Nedellec, C. and Rouveirol,
C., editors, Proc. 10th European Conference on Machine Learning,

136 Notations and Acronyms
pages 137–142.
Joshi, S., Contractor, D., Ng, K., Deshpande, P. M., and Hampp, T.
(2011). Auto-grouping emails for fast e-discovery. Proceedings of
VLDB Endowment, 4(12):1284–1294.
Joty, S., Carenini, G., Murray, G., and Ng, R. T. (2010). Exploiting
conversation structure in unsupervised topic segmentation for emails.
In Proc. 2010 Conference on Empirical Methods in Natural Language
Processing, pages 388–398, MIT, Massachusetts, USA.
Juaola, P. (2006). Authorship attribution. Foundations and Trends in
Information Retrieval, 1(3):233–334.
Katz, L. (1953). Confidence intervals for the number showing a certain
characteristic in a population when sampling is without replacement.
Journal of the American Statistical Association, 48(262):256–261.
Keim, D., Kohlhammer, J., Ellis, G., and an Mansmann, F., editors
(2010). Mastering the Information Age: Solving Problems with Visual
Analytics. Eurographics Association.
Kekalainen, J. and Jarvelin, K. (2002). Using graded relevance as-
sessments in IR evaluation. Journal of the American Society for
Information Science and Technology, 53(13):1120–1129.
Kershaw, A. and Howie, J. (2009). Report on Kershaw-Howie survey
of e-discovery providers pertaining to deduping strategies.
Kershaw, A. and Howie, J. (2010). Exposing context: Email threads
reveal the fabric of conversations. Law Technology News.
Kiritchenko, S., Matwin, S., and Abu-hakima, S. (2004). Email clas-
sification with temporal features. In Proc. International Intelligent
Information Systems.
Klimt, B. and Yang, Y. (2004). Introducing the Enron corpus. In Proc.
1st Conference on Email and Anti-Spam, page 2pp, Mountain View,
CA, USA.
Laplanche, R., Delgado, J., and Turck, M. (2004). Concept search
technology goes beyond keywords. Information Outlook, 8(7).
Lemieux, V. L. and Baron, J. R. (2011). Overcoming the digital
tsunami in e-discovery: Is visual analytics the answer? Canadian
Journal of Law and Technology, 9:33–50.
Lewis, D. D. and Gale, W. A. (1994). A sequential algorithm for
training text classifiers. In Croft, W. B. and van Rijsbergen, C. J.,

Notations and Acronyms 137
editors, Proc. 17th Annual International ACM SIGIR Conference
on Research and Development in Information Retrieval, pages 3–12,
Dublin, Ireland.
Logan, D. and Childs, S. (May 24, 2012). Magic quadrant for e-
discovery software. Gartner Research Report.
Lynam, T. R. and Cormack, G. V. (2008). MultiText Legal experi-
ments at TREC 2008. In Voorhees, E. and Buckland, L. P., editors,
Proc. 17th Text REtrieval Conference, pages 2:56:1–5, Gaithersburg,
Maryland, USA. NIST Special Publication 500-277.
Mackenzie, D. A. and Wajeman, J., editors (1985). The Social Shaping
of Technology. McGraw Hill.
Magdy, W. and Jones, G. J. F. (2010). PRES: A score metric for eval-
uating recall-oriented information retrieval applications. In Chen,
H.-H., Efthimiadis, E. N., Savoy, J., Crestani, F., and Marchand-
Maillet, S., editors, Proc. 33rd Annual International ACM SIGIR
Conference on Research and Development in Information Retrieval,
pages 611–618, Geneva, Switzerland.
Manmatha, R., Han, C., and Riseman, E. (1996). Word spotting: a
new approach to indexing handwriting. In Proc. 1996 IEEE Com-
puter Science Conferen on Computer Vision and Pattern Recogni-
tion, pages 631–637.
Manning, C. D., Raghavan, P., and Schutze, H. (2008). Introduction
to Information Retrieval. Cambridge University Press.
Marcus, R. L. (2006). E-discovery & beyond: Toward Brave New World
or 1984? 25:633–689.
Marley, K. and Cochrane, P. (1981). Online training and practice man-
ual for ERIC database searchers. ERIC Clearinhouse on Information
Resources, 2nd edition.
Martin, S., Sewani, A., Nelson, B., Chen, K., and Joseph, A. D. (2005).
Analyzing behavioral features for email classification. In Proc. 2nd
Conference on Email and Anti-Spam, page 8pp.
McGann, J. (August 3, 2010). Lesson from the news of the world
scandal: Data is forever. Forbes.
Medioni, G., Cohen, I., Bremond, F., Hongeng, S., and Nevatia,
R. (2001). Event detection and analysis from video streams.
IEEE Transactions on Pattern Analysis and Machine Intelligence,

138 Notations and Acronyms
23(8):873–889.
Moffat, A. and Zobel, J. (2008). Rank-biased precision for measurement
of retrieval effectiveness. ACM Transactions on Information Systems,
27(1):1–27.
Murtagh, F. (1983). A survey of recent advances in hierarchical clus-
tering algorithms. The Computer Journal, 36(4):354–359.
Nelson, S. D. and Simek, J. (2009). Technology tips for cutting e-
discovery costs. Information Management Journal, 43(2).
Oard, D. W. (2009). Multilingual information access. In Bates, M. J.
and Maack, M. N., editors, Encyclopedia of Library and Information
Sciences, 3rd Edition. Taylor and Francis.
Oard, D. W., Baron, J. R., Hedin, B., Lewis, D. D., and Tomlinson, S.
(2010). Evaluation of information retrieval for E-discovery. Artificial
Intelligence and Law, pages 1–40. published online.
Oard, D. W., Hedin, B., Tomlinson, S., and Baron, J. R. (2008).
Overview of the TREC 2008 legal track. In Voorhees, E. and Buck-
land, L. P., editors, Proc. 17th Text REtrieval Conference, pages
3:1–45, Gaithersburg, Maryland, USA. NIST Special Publication
500-277.
Oehrle, R. T. (2011). Retrospective and prospective statistical sam-
pling in legal discovery. In DESI IV: The ICAIL Workshop on Setting
Standards for Searching Electronically Stored Information in Discov-
ery Proceedings, Pittsburgh, PA, USA.
Olsson, J. S. and Oard, D. W. (2009). Combining evidence from lvcsr
and ranked utterance retrieval for robust domain-specific ranked re-
trieval. In Proceedings of the 32nd Annual International ACM SIGIR
Conference on Research and Development in Information Retrieval,
pages 91–98.
O’Neill, J., Privault, C., Renders, J.-M., Ciriza, V., and Bauduin, G.
(2009). DISCO: Intelligent help for document review. In DESI III:
The ICAIL Workshop on Globaal E-Discovery/E-Disclosure.
Oot, P., Kershaw, A., and Roitblat, H. L. (2010). Mandating reason-
ableness in a reasonable inquiry. Denver Law Review, 87(2):533–559.
Pace, N. M. and Zakaras, L. (2012). Where the Money Goes: Under-
standing Litigant Expenditures for Producing Electronic Discovery.

Notations and Acronyms 139
RAND.
Paul, G. L. and Baron, J. R. (2007). Information inflation: Can the legal
system adapt? Richmond Journal of Law and Technology, 13(3).
Perer, A., Shneiderman, B., and Oard, D. W. (2006). Using rhythms of
relationships to understand email archives. Journal of the American
Society for Information Science and Technology, 57(14):1936–1948.
Quinlan, J. R. (1998). C4.5: Programs for Machine Learning. Morgan
Kaufmann.
Robertson, S. (2008). A new interpretation of average precision. In
Myaeng, S.-H., Oard, D. W., Sebastiani, F., Chua, T.-S., and Leong,
M.-K., editors, Proc. 31st Annual International ACM SIGIR Confer-
ence on Research and Development in Information Retrieval, pages
689–690, Singapore, Singapore.
Robertson, S., Walker, S., Jones, S., Hancock-Beaulieu, M. M., and
Gatford, M. (1994). Okapi at TREC-3. In Harman, D., editor,
Proc. 3rd Text REtrieval Conference, pages 109–126, Gaithersburg,
Maryland, USA. NIST Special Publication 500-225.
Roitblat, H. L., Kershaw, A., and Oot, P. (2010). Document categoriza-
tion in legal electronic discovery: computer classification vs. manual
review. Journal of the American Society for Information Science and
Technology, 61(1):70–80.
Russeth, R. and Burns, S. (2010). Why my human document reviewer
is better than your algorithm. ACC Docket: The Journal of the
Association of Corporate Counsel, 28(4):18–31.
Salton, G. and Waldstein, R. K. (1978). Term relevance weights in on-
line information retrieval. Information Processing and Management,
14(1):29–35.
Sanderson, M. (2010). Test collection based evaluation of information
retrieval systems. Foundations and Trends in Information Retrieval,
4(4):247–375.
Sanderson, M. and Zobel, J. (2005). Information retrieval system eval-
uation: effort, sensitivity, and reliability. In Marchionini, G., Moffat,
A., Tait, J., Baeza-Yates, R., and Ziviani, N., editors, Proc. 28th
Annual International ACM SIGIR Conference on Research and De-
velopment in Information Retrieval, pages 162–169, Salvador, Brazil.
Saracevic, T. (2007). Relevance: A review of the literature and a frame-

140 Notations and Acronyms
work for thinking on the notion in information science. Part III: Be-
havior and effects of relevance. Journal of the American Society for
Information Science and Technology, 58(13):2126–2144.
Sayeed, A., Sarkar, S., Deng, Y., Hosn, R., Mahindru, R., and Raja-
mani, N. (2009). Characteristics of document similarity measures for
compliance analysis. In Proceedings of the 18th International Con-
ference on Information and Knowledge Management (CIKM), pages
1207–1216.
Scheindlin, S., Capra, D. J., and The Sedona Conference (2012). Elec-
tronic Discovery and Digital Evidence: Cases and Materials (Amer-
ican Casebook). West Publishers, 2nd edition.
Scholer, F., Turpin, A., and Sanderson, M. (2011). Quantifying test
collection quality based on the consistency of relevance judgements.
In Ma, W.-Y., Nie, J.-Y., Baeza-Yates, R., Chua, T.-S., and Croft,
W. B., editors, Proc. 34th Annual International ACM SIGIR Confer-
ence on Research and Development in Information Retrieval, pages
1063–1072, Beijing, China.
Scott, S. and Matwin, S. (1999). Feature engineering for text classifica-
tion. In Proc. 16th International Conference on Machine Learning,
pages 379–388.
Sebastiani, F. (2002). Machine learning in automated text categoriza-
tion. ACM Computing Surveys, 34(1):1–47.
Shin, C., Doermann, D., and Rosenfeld, A. (2001). Classification of
document pages using structure-based features. Internal Journal on
Document Analysis and Recognition, 3(4):232–247.
Simel, D. L., Samsa, G. P., and Matchar, D. B. (1991). Likelihood ratios
with confidence: sample size estimation for diagnostic test studies.
Journal of Clinical Epidemiology, 44(8):763–770.
Soboroff, I. (2007). A comparison of pooled and sampled relevance
judgments. In Clarke, C. L. A., Fuhr, N., Kando, N., Kraaij, W., and
de Vries, A., editors, Proc. 30th Annual International ACM SIGIR
Conference on Research and Development in Information Retrieval,
pages 785–786, Amsterdam, the Netherlands.
Solomon, R. D. and Baron, J. R. (2009). Bake offs, demos & kicking
the tires: A practical litigator’s brief guide to evaluating early case
assessment software & search & review tools.

Notations and Acronyms 141
Sparck Jones, K. and Galliers, J. R. (1995). Evaluating Natural Lan-
guage Processing Systems: An Analysis and Review. Springer LNAI
1083.
Sparck Jones, K. and van Rijsbergen, C. J. (1975). Report on the
need for and provision of an ‘ideal’ test collection. Technical report,
University Computer Laboratory, Cambridge.
Stein, B., Koppel, M., and Stamatatos, E. (2007). Plagiarism analy-
sis, authorship identification, and near-duplicate detection: Pan’07.
SIGIR Forum, 41(2):68–71.
Sterenzy, T. (2009). Equivio at TREC 2009 Legal Interactive. In
Voorhees, E. and Buckland, L. P., editors, Proc. 18th Text REtrieval
Conference, pages 1:17:1–3, Gaithersburg, Maryland, USA. NIST
Special Publication 500-278.
Stevens, C. (1993). Knowledge-Based Assistance for Handling Large,
Poorly Structured Information Spaces. PhD thesis, University of Col-
orado.
Stevens, S. (1946). On the theory of scales of measurement. Science,
103(2684):677–680.
Stewart, E. and Banks, P. N. (2000). Preservation of information in
nonpaper formats. In Banks, P. N. and Pilette, R., editors, Preser-
vation: Issues and Planning, chapter 18. ALA Editions.
Sunter, A. B. (1977). List sequential sampling with equal or unequal
probabilities without replacement. Journal of the Royal Statistical
Society. Series C (Applied Statistics), 26(3):261–268.
Taylor, R. S. (1962). Process of asking questions. American Documen-
tation, 13:391–396.
Tenenbein, A. (1970). A double sampling scheme for estimating from
binomial data with misclassifications. Journal of the American Sta-
tistical Association, 65(331):1350–1361.
The Sedona Conference (2007a). The Sedona Guidelines: Best practice
guidelines & commentary for managing information & records in the
electronic age.
The Sedona Conference (2007b). The Sedona Principles, Second Edi-
tion: Best practice recommendations and principles for addressing
electronic document production.

142 Notations and Acronyms
The Sedona Conference (2007c). The Sedona Conference Best Prac-
tices Commentary on the Use of Search and Information Retrieval
Methods in E-Discovery. The Sedona Conference Journal, 8:189–223.
The Sedona Conference (2008a). The Sedona Canada principles: Ad-
dressing electronic discovery.
The Sedona Conference (2008b). The Sedona Conference commentary
on non-party production & rule 45 subpoenas.
The Sedona Conference (2008c). The Sedona Conference commentary
on preservation, management and identification of sources of infor-
mation that are not reasonably accessible.
The Sedona Conference (2008d). The Sedona Conference cooperation
proclamation.
The Sedona Conference (2010a). The Sedona Conference commentary
on proportionality in electronic discovery.
The Sedona Conference (2010b). The Sedona Conference glossary: E-
discovery & digital information management.
The Sedona Conference (2011a). The Sedona Canada commentary on
practical approaches for cost containment.
The Sedona Conference (2011b). The Sedona Conference database
principles: Addressing the preservation & production of databases &
database information in civil litigation. Public Comment Version.
Thomas, J. J. and Cook, K. A. (2006). A visual analytics agenda. IEEE
Computer Graphics and Applications, 26(1):10–13.
Thompson, S. K. (2012). Sampling. John Wiley & Sons, New York,
3rd edition.
Tomlinson, S. (2011). Learning task experiments in the TREC 2011
Legal Track. In Voorhees, E. and Buckland, L. P., editors, Proc.
20th Text REtrieval Conference, page 14pp, Gaithersburg, Maryland,
USA.
Tomlinson, S., Oard, D. W., Baron, J. R., and Thompson, P. (2007).
Overview of the TREC 2007 legal track. In Voorhees, E. and Buck-
land, L. P., editors, Proc. 16th Text REtrieval Conference, pages
5:1–34, Gaithersburg, Maryland, USA. NIST Special Publication
500-274.
van Rijsbergen, C. J. (1979). Information Retrieval. Butterworths,

Notations and Acronyms 143
London, 2nd edition.
Voorhees, E. (2000). Variations in relevance judgments and the mea-
surement of retrieval effectiveness. Information Processing & Man-
agement, 36(5):697–716.
Voorhees, E. (2002). The philosophy of information retrieval evalua-
tion. In Peters, C., Braschler, M., Gonzalo, J., and Kluck, M., ed-
itors, Proc. 2nd Workshop of the Cross-Lingual Evaluation Forum,
volume 2406 of Lecture Notes in Computer Science, pages 355–370,
Darmstadt, Germany. Springer.
Voorhees, E. and Harman, D., editors (2005). TREC: Experiment and
Evaluation in Information Retrieval. The MIT Press.
Wang, A. (2006). The Shazam music recognition service. Communica-
tions of the ACM, 49(8):44–48.
Wang, J. (2011). Accuracy, agreement, speed, and perceived difficulty
of users’ relevance judgments for e-discovery. In Proc. SIGIR Infor-
mation Retrieval for E-Discovery Workshop, pages 1:1–10, Beijing,
China.
Wang, J., Coles, C., Elliott, R., and Andrianakou, S. (2009). ZL Tech-
nologies at TREC 2009 legal interactive: Comparing exclusionary
and investigative approaches for electronic discovery using the TREC
Enron corpus. In The Eighteenth Text REtrieval Conference Proceed-
ings (TREC 2009).
Wang, J. and Soergel, D. (2010). A user study of relevance judgments
for e-discovery. Proc. Am. Soc. Info. Sci. Tech., 47:1–10.
Warren, R. (2011). University of waterloo at TREC 2011: A social
networking approach to the Legal Learning track. In Voorhees, E.
and Buckland, L. P., editors, Proc. 20th Text REtrieval Conference,
page 4pp, Gaithersburg, Maryland, USA.
Webber, W. (2011). Re-examining the effectiveness of manual review.
In Proc. SIGIR Information Retrieval for E-Discovery Workshop,
pages 2:1–8, Beijing, China.
Webber, W. (2012). Approximate recall confidence intervals. In sub-
mission.
Webber, W., Oard, D. W., Scholer, F., and Hedin, B. (2010a). Assessor
error in stratified evaluation. In Proc. 19th ACM International Con-
ference on Information and Knowledge Management, pages 539–548,

144 Notations and Acronyms
Toronto, Canada.
Webber, W., Scholer, F., Wu, M., Zhang, X., Oard, D. W., Farrelly,
P., Potter, S., Dick, S., and Bertolus, P. (2010b). The Melbourne
team at the TREC 2010 legal track. In Voorhees, E. and Buckland,
L. P., editors, Proc. 19th Text REtrieval Conference, pages 49:1–12,
Gaithersburg, Maryland, USA.
Webber, W., Toth, B., and Desamito, M. (2012). Effect of written in-
structions on assessor agreement. In Hersh, W., Callan, J., Maarek,
Y., and Sanderson, M., editors, Proc. 35th Annual International
ACM SIGIR Conference on Research and Development in Informa-
tion Retrieval, Portland, Oregon, USA. to appear.
Wickens, T. D. (2002). Elementary Signal Detection Theory. Oxford
University Press.
Wilson, T. (1999). Models in information behaviour research. Journal
of Documentation, 55(3):249–270.
Yilmaz, E. and Aslam, J. (2006). Estimating average precision with
incomplete and imperfect judgments. In Yu, P. S., Tsotras, V., Fox,
E. A., and Liu, B., editors, Proc. 15th ACM International Confer-
ence on Information and Knowledge Management, pages 102–111,
Arlington, Virginia, USA.
Zeinoun, P., Laliberte, A., Puzicha, J., Sklar, H., and Carpenter, C.
(2011). Recommind at TREC 2011 Legal Track. In Voorhees, E.
and Buckland, L. P., editors, Proc. 20th Text REtrieval Conference,
page 12pp, Gaithersburg, Maryland, USA.
Zhang, J., Yong, Y., and Lades, M. (1997). Face recognition: eigen-
face, elastic matching, and neural nets. Proceedings of the IEEE,
85(9):1423–1435.
Zhao, F. C., Oard, D. W., and Baron, J. R. (2009). Improving search
effectiveness in the legal e-discovery process using relevance feedback.
In ICAIL 2009 DESI III Global E-Discovery/E-Disclosure Workshop.
Zhu, G., Zheng, Y., Doermann, D., and Jaeger, S. (2009). Signature
detection and matching for document image retrieval. IEEE Trans-
actions on Pattern Analysis and Machine Intelligence.
Zobel, J. (1998). How reliable are the results of large-scale information
retrieval experiments? In Croft, W. B., Moffat, A., van Rijsbergen,
C. J., Wilkinson, R., and Zobel, J., editors, Proc. 21st Annual Inter-

Notations and Acronyms 145
national ACM SIGIR Conference on Research and Development in
Information Retrieval, pages 307–314, Melbourne, Australia.
Related Documents