Report No: AUS0000606 . Informal water markets in an urbanising world: Some unanswered questions . 1/28/2019 . WAT . Public Disclosure Authorized Public Disclosure Authorized Public Disclosure Authorized Public Disclosure Authorized

Welcome message from author
This document is posted to help you gain knowledge. Please leave a comment to let me know what you think about it! Share it to your friends and learn new things together.
Transcript
Report No: AUS0000606
.
Informal water markets in an urbanising world:
Some unanswered questions
. 1/28/2019
. WAT
.
Pub
lic D
iscl
osur
e A
utho
rized
Pub
lic D
iscl
osur
e A
utho
rized
Pub
lic D
iscl
osur
e A
utho
rized
Pub
lic D
iscl
osur
e A
utho
rized
1
.
.
© 2019 The World Bank
1818 H Street NW, Washington DC 20433
Telephone: 202-473-1000; Internet: www.worldbank.org
Some rights reserved
This work is a product of the staff of The World Bank. The findings, interpretations, and conclusions expressed in this work
do not necessarily reflect the views of the Executive Directors of The World Bank or the governments they represent. The
World Bank does not guarantee the accuracy of the data included in this work. The boundaries, colors, denominations, and
other information shown on any map in this work do not imply any judgment on the part of The World Bank concerning the
legal status of any territory or the endorsement or acceptance of such boundaries.
Rights and Permissions
The material in this work is subject to copyright. Because The World Bank encourages dissemination of its knowledge, this
work may be reproduced, in whole or in part, for noncommercial purposes as long as full attribution to this work is given.
Attribution—Please cite the work as follows: “Garrick, D., O’Donnell, E., Damania, R., Moore, S., Brozović, N., Iseman, T.
2019. Informal water markets in an urbanising world: some unanswered questions. © World Bank.”
All queries on rights and licenses, including subsidiary rights, should be addressed to World Bank Publications, The World
Bank Group, 1818 H Street NW, Washington, DC 20433, USA; fax: 202-522-2625; e-mail: [email protected].
2
Informal water markets in an urbanising world: Some unanswered questions
3
Table of Contents
Summary ....................................................................................................................... 5
Can informal water markets fill the gap? ................................................................... 6 Formal water markets have lagged, while informal markets have flourished ............... 7
Box 1: Varieties of Water Markets: Markets in Water versus Markets in Water Services ............ 9 The prevalence of informal markets ................................................................................ 11
A brief history of informal urban water markets ......................................................................... 11
The unsettled questions ................................................................................................. 13 Q1: Do informal markets prey on the poor? ....................................................................... 16
Box 2: Are Informal Urban Water Markets in Kathmandu Competitive? ...... Error! Bookmark not
defined. Q2: Do informal markets crowd out formal water systems? ........................................ 26 Q3: Do informal markets deliver dirty water? ................................................................ 29
Box 3: Scarce Data on Water Quality ........................................................................................... 31 Box 4: Fragility and Informal Water Markets in Yemen ............................................................... 33
Q4: Are informal water markets unsustainable? ............................................................. 34
Box 5: Can Water Markets Deliver Environmental Outcomes? ................................................... 35 Q5: Would regulation improve performance of informal markets? ............................. 36
The Path Forward ....................................................................................................... 39 References ........................................................................................................................... 44
4
Table of Figures Figure 1. Selected types of informal water vendors for urban and peri-urban regions ......................... 10 Figure 2. Percentage of Sampled Population purchasing Vended Water ................................................... 13 Figure 3. Studies per year: primary and review studies of water markets ............................................... 16 Figure 4. Supply Chain and the Structure of Informal Vending in Kathmandu ......................................... 19 Figure 5. Ratio of the price for vended water to the price for water from piped connections .......... 21 Figure 6. Price of water from tanker truck operators ................................................................................... 22
Table of Tables
Table 1. Informal Markets: Advantages and Disadvantages of Small Water Enterprises ...................... 14 Table 2 Studies of urban water markets that address competitiveness ...................................................... 18
Table 3. Toolkit for improving the performance of informal water markets ........................................... 43
Acknowledgements:
Background papers were prepared regarding Kathmandu (Aditi Raina, Jane Zhao, Laxman Kunwar,
Yvonne Chen, Dale Whittington, and Xun Wu), Yemen (Naif Abu-Lohom, Yasuo Konishi, Yogita
Mumssen, Bilkis Zabara, and Scott Moore), Spain (Lucia De Stefano and Nuria Hernandez-Mora),
India (Tushaar Shah), and water markets and the environment (Thomas Iseman)

5
Summary
Delivering safe and sustainable water supplies presents a fundamental challenge for an urbanising
planet. Approximately 1.5 million people migrate to cities and their peri-urban fringes each week,
and the fastest growth occurs in small to intermediate sized cities where infrastructure and
governance capacity lag (Birkmann et al., 2016). Piped water systems are struggling to keep pace. In
this context formal water markets have languished, while informal water markets have proliferated
and thrived. This report takes stock of what is known about informal markets and asks whether
they exploit the needy, earn exceptional profits or in fact provide a valuable and cost effective
service to a vast unserved urban population.
The cost of extending piped connections for a global population approaching 10 billion by 2050 is
estimated to surpass $60 trillion in capital asset values (Larsen et al., 2016). This scale of investment
is out of reach in many parts of the world where the need is greatest.
There is increasing evidence that past paradigms may not be sufficient or scalable, highlighting the
need for innovations and sparking interest in water markets to improve water allocation and water
service delivery. In this context, there has been growing consideration of ‘off-grid’ alternatives for
delivering on the Sustainable Development Goals (SDGs). Informal water markets, involving small-
scale water enterprises, are one example of this trend. This report takes stock of the global
evidence on informal water markets with a primary focus on small-scale, private water service
providers in urban contexts. The focus is on whether and how informal markets can be part of an
overall strategy to provide safe, affordable and reliable water services, particularly for the poor.
The report investigates the theory, evidence and gaps regarding informal markets for water services.
The analysis draws on data from over 100 studies of informal urban water markets, published in the
past forty years with a primary focus on the findings from the past 10 years. It also documents two
in-depth studies from Kathmandu and Yemen, which provide insight from two regions at the leading
edge of urbanisation and fragility challenges, respectively.
A review of the published literature on informal water markets illustrates a paradox: formal water
markets have languished, while informal water markets have proliferated and thrived in response to
inadequate piped water networks. The existing evidence on the performance of informal water
markets is thin and contradictory, yielding five unsettled questions:
1. Do informal markets prey on the poor?
2. Do informal markets crowd out formal water systems?
3. Do informal markets deliver dirty water?
4. Are informal water markets unsustainable?
5. Would regulation improve performance?
6
The available evidence is inconclusive, yet sufficient to conclude that informal markets are not
automatically predatory and often satisfy crucial needs that may be beyond the ability and capacity of
conventional water utilities. The global experience features a wide range of outcomes. In some
cases, informal markets have proven to be competitive and complementary to formal water systems,
serving as extensions to piped networks and forming part of public-private partnerships. In other
cases, informal vending represents the only option when states fail. Many of the classic critiques of
informal vending, particularly the relatively high prices, can be explained by limited economies of
scale and high, unsubsidized costs of acquisition, treatment and distribution relative to piped systems.
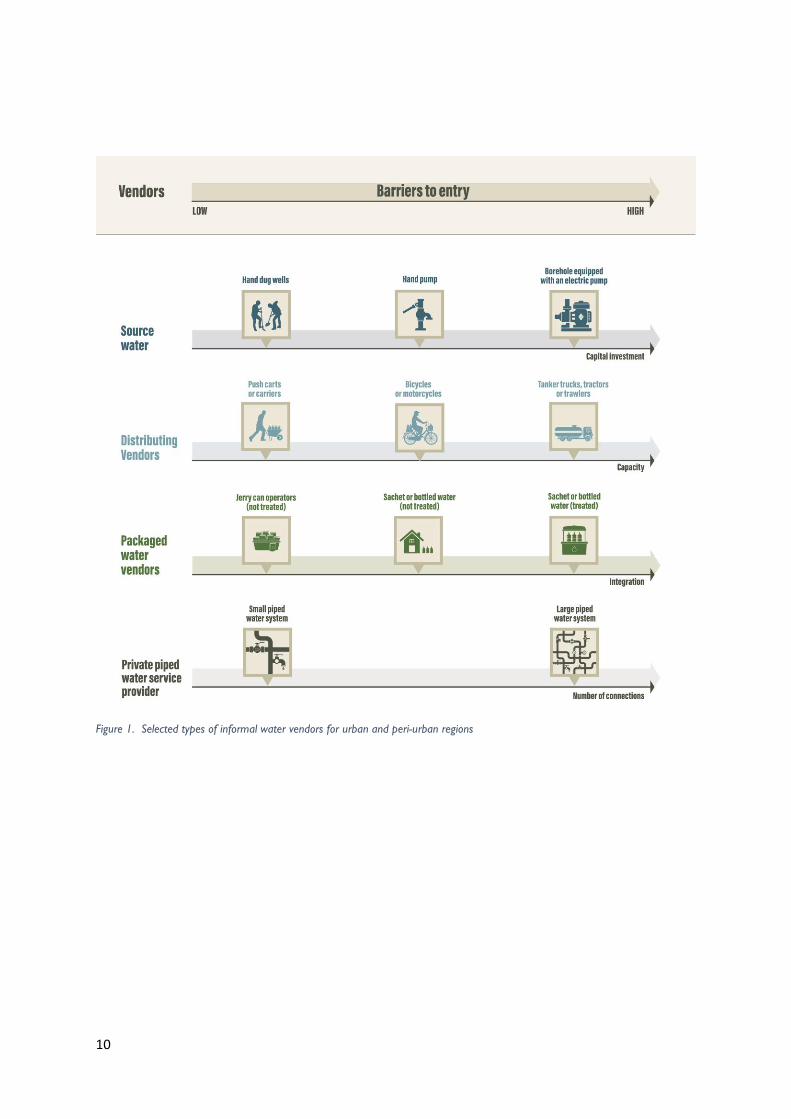
The low barriers to entry mean that vendors may struggle to form associations or cartels to exert
market power or crowd out formal systems (Figure 1). Quality and sustainability impacts are
virtually uncharted, however, suggesting that improved monitoring and informational interventions
are urgently needed even when regulation is unwise or infeasible.
The WHO/UNICEF Joint Monitoring Programme identified packaged and tanker water as viable
water sources for meeting SDG 6.1 in 2017, illustrating the potential for informal vending to
contribute safe, affordable water services under certain circumstances. Realising this potential will
require low-cost monitoring and well-targeted interventions. We identify the tools available for
regulators, vendors and consumers to realise this potential and limit the pitfalls. The appropriate
mix of regulation and informational interventions hinges on the capacity of governments to foster
competition and design effective regulations.
A key and under-appreciated insight of this review is that policy recommendations to regulate
informal markets need to pay close attention to incentives, oligopoly and informational asymmetry,
especially in circumstances where regulatory capacity is weak and enforcement is limited. When
regulatory capacity is limited, consumers should be empowered with information and treatment
options to deal with water quality and public health risks, and exert market pressure on suppliers to
lift standards of service. In contexts where regulations can be enforced – often a challenge in
developing country contexts where needs are greatest – it would be reasonable to seek a regulatory
approach to regulate trade and ensure that safe supplies are delivered at a competitive price.
Can informal water markets fill the gap?
Water markets address two main purposes. First, they can facilitate the reallocation of water across
competing uses. The earliest definitions of water markets refer to voluntary reallocation of water-
use rights between willing buyers and willing sellers acting in response to price signals (Saliba and
Bush, 1987). But water markets are more diverse than this. The term ‘water market’ can refer to a
variety of transactions involving a range of water-related goods and services [Box 1]. The second
purpose of water markets has been to provide value-added services in the distribution, treatment

7
and/or packaging of water for irrigation and urban uses. Markets in water services increase access
to water through the participation of private service providers in water service delivery.
Markets vary in their degree of formality and the types of regulations governing access, use,
reallocation, pricing and quality of water. Rather than a binary of formal or informal systems, there
is increasing focus on the spectrum of formality and the proliferation of hybrid approaches. Despite
the blurring boundaries between formal and informal, we start with the paradox: formal markets
have lagged, while informal markets are flourishing.
Formal water markets have lagged, while informal markets have flourished
While formal water markets have encountered barriers, informal markets are widespread and come
in diverse forms. Small, private water enterprises1 have played a role in acquiring and delivering
water since the dawn of human society (Stoler et al., 2012). Their contemporary growth can be
traced to the twin pressures of groundwater-driven irrigation development and rapid urbanisation,
and sometimes the combination of the two. Agricultural water markets expanded in South Asia
with the boom of private tube-wells in the 1970s. In India, markets in groundwater emerged to
support farmers who lacked capital to drill their own wells. The owners of wells sell water or rent
mobile diesel pumps. Groundwater markets have fuelled irrigation development and help to lift
millions out of poverty in South Asia. In the period from 1976 to 1997, the irrigation area in India
supported by hired irrigation services increased 20-fold, supporting 25 million farmers (Mukherji,
2008). However, recent evidence demonstrates starkly the predictable tragedy of the commons
outcome. Depleting groundwater levels are associated with rising rural poverty; groundwater which
once acted as a buffer against rainfall variation no longer does in areas where aquifers are depleted.
Markets in these contexts have likely had two conflicting effects. On the one hand, the availability of
water from wells on contiguous farms reduces the pressure to drill a new well which may reduce
pressures on the aquifer. Conversely, the ability to sell water increases the returns of water
abstraction, creating incentives to use more water (Shah and Chowdhury, 2017). Informal
agricultural water markets are also active in regions with formal markets. For example, farmers in
Spain, Mexico and the Western US buy, sell or lease water rights within the boundaries of their
districts and users’ associations without undergoing the formal administrative procedures set out by
the state government for transactions outside their borders (De Stefano and Hernández-Mora,
2016).
1 Informal water markets have been associated with a range of related terms. Small-scale private water service providers have also been described as ‘small water enterprises’, ‘small water entrepreneurs’, ‘small scale independent providers’, ‘water vendors’, ‘aguateros’, and ‘water concessionaires’. More specific terms include standpipe/kiosk operators, mobile distributors (e.g. tanker trucks and hand carts), sachet or bottled water sellers, and household resellers.

8
In the urban context, informal water vendors fill gaps left by incomplete or inadequate piped water
supplies across the global south, from Cochabamba and Coimbatore to Kisumu. Up to a quarter of
the urban population in Latin America and nearly half of urban dwellers in Africa rely on small-scale
providers for at least a portion of their water supply according to the last major efforts to survey
and estimate global trends (Kariuki and Schwartz, 2005). Experiences in Asia and Africa illustrate
the scale of activity. In Chennai for example, 25% of demand is met by the 700 privately owned
tanker trucks which deliver 125 million litres per day (Venkatachalam, 2015); Kathmandu relies on
tankers for approximately 20% of its water supply (Institute of Water Policy team). In Ghana, the
share of urban water users relying on sachet water as a primary drinking water source has more
than tripled, rising from 13.8% in 2010 to 43.1% in 2014 (Stoler, 2017). These examples illustrate the
prevalence of the informal sector filling gaps and extending coverage of piped systems. Even where
piped connections exist, reliability and quality problems have spurred demand for water from small-
scale, private water service providers. In other regions, the informal sector comprises the only
option. In contexts of fragility, conflict and violence, informal vendors may constitute the sole, or
primary, source of drinking water and water for other uses, as illustrated in parts of Jordan, Angola
and Yemen (Cain, 2018). In other settings, the distinction between formal and informal is blurred, as
informal vending becomes integrated into supply chains through concessions, memoranda of
understanding and other semi-formal arrangements with public and private water utilities.
The rest of the report focuses on informal markets in the context of urban and peri-urban water
supplies, including rapidly growing rural towns.

9
Box 1: Varieties of Water Markets: Markets in Water versus Markets in Water Services
Water markets involve many different types of goods and services. There have been recent efforts to
distinguish markets in water from markets in water services. Markets in water trade water-related goods, including the right to access bulk water at a specific place and time. Other water-related goods include packaged or bottled water, which has become an active global market. Markets in water services involve water-related services and private participation in supplying value-added services, including pumping, treatment, transport and storage of water supplies. In almost all cases, water markets involve a supply chain that links multiple markets from source to consumer.
Typologies distinguish water markets by their technologies and institutions, and, by extension, the associated barriers to entry and competitiveness. Extraction and transporting water involve different capital investments and barriers to entry depending on the pumping and canal infrastructure for irrigation and the alternative forms of distribution in urban settings (source water markets, distributing vendors, direct vendors, bottling and purification services and storage). For example, piped water networks involve economies of scale and properties of a natural monopoly that can restrict competitiveness and pose barriers to entry that do not exist for fixed point water sources or distributing vendors.
The institutions governing markets range from formal to informal in terms of property rights, price regulation and quality standards. Formal water markets will involve an adjudication or permitting process for access to the water source, as well as rules governing reallocation, treatment, delivery and storage. Informal water markets rely on local rules and norms. In practice, almost all markets involve a mixture of formal and informal characteristics. Informal markets may also coexist with formal markets, governing local transactions and small-scale, private water providers alongside formal transactions.
Markets in water and markets in water services vary markedly across sectors. In agricultural water markets, transactions often involve usufructuary rights to access and use bulk water supplies. Formal markets involve the lease or purchase of usufructuary water rights to access a volume or share of water under certain conditions; informal markets may rely on customary arrangements for exchanges of bulk water supply. Agricultural water markets also involve trade in water services, enabling the buying and selling of access to infrastructure, particularly groundwater pumping capacity and irrigation water delivery services. Derivative products include insurance services, such as dry-year options and rotational pools.
10
Figure 1. Selected types of informal water vendors for urban and peri-urban regions

11
The prevalence of informal markets
A brief history of informal urban water markets
Water vending has been recognized as an important source of water for urban and peri-urban
households for decades. Drawers of Water, the classic 1972 study on domestic water use and
environmental health in East Africa, estimated that 21% of households in urban areas were supplied
by vendors, particularly in lower income communities. Today in many parts of the world an even
larger proportion of people rely on informal distribution networks. A rare longitudinal study
updated that work in the early 2000s, confirming that vending remained prevalent in urban settings,
particularly where piped connections were limited (White et al., 1972, Thompson, 2001).
There are three waves in the literature – (1) isolated field studies (1960s to 1980s), (2) global
surveys and studies during the early phases of privatisation (1990s and early 2000s), and (3) during
the past 15 years, coinciding with the adoption of the Millennium Development Goals. Each phase
has involved an assessment of the potential and pitfalls of informal urban water markets.
Field assessments in the 1980s examined informal vending through in-depth studies of different
communities.2 These studies made several contributions to our understanding of informal urban
water markets, regarding their importance as a source of water in urban contexts, the willingness to
pay by consumers, the competitiveness of the market, and the costs of delivering vended water.
The findings challenged the prevailing conventional wisdom that informal vendors are charging
extortionate prices, and explored the policy implications, noting: (1) vended water is expensive (as a
share of income for the poor), but not necessarily highly profitable, due to the high costs of hauling
water (e.g. in Ukunda, Kenya; Whittington et al., 1989); (2) willingness to pay can be driven, in part,
by the perception that vended water is better quality than the public system (e.g. in Onitsha, Nigeria;
Whittington et al., 1991) and (3) there is limited evidence that vendors have sufficient market power
to control price (e.g. in Khartoum, Sudan; Cairncross and Kinnear, 1991). These studies also led to
policy recommendations. Informal vendors were viewed as a pragmatic complement to formal
water systems, where “an intervention to increase the number and efficiency of these vendors might
produce a more rapid and replicable improvement in the standard of service” compared with formal
2 An estimated 40% of households in a survey of 12 low-income communities relied on vendors in the early 1980s ZAROFF, B. & OKUN, D. A. 1984. Water vending in developing countries. Aqua 5, 289-295.; other estimates suggested 20-30% of urban populations in the developing world depended on vendors BRISCOE, J. 1985. Water Supply and Sanitation in the Health Sector in the Asia Region: Information Needs and Program Priorities.. The first wave of in-depth studies examined vending operations in urban Haiti, Kenya, Nigeria and Sudan FASS, S. 1988. Political Economy in Haiti: the Drama of Survival, New Brunswick, USA, Transaction Publishers, WHITTINGTON, D., LAURIA, D. T., OKUN, D. A. & MU, X. 1989. Water vending activities in developing countries: A case study of Ukunda, Kenya. International Journal of Water Resources Development, 5, 158-168, WHITTINGTON, D., LAURIA, D. T. & MU, X. 1991. A Study of Water Vending and Willingness to Pay for Water in Onitsha, Nigeria. World Development, 19, 179-198, CAIRNCROSS, S. & KINNEAR, J. 1991. Water vending in urban Sudan. Water Resources Development, 7, 267-273..
12
water supply systems (Cairncross and Kinnear, 1991: 267). The existence of informal vending and
willingness to pay high prices for their services were also seen as evidence that consumers would be
willing to pay for the extension of piped systems if quality and reliability are sufficient.
The second wave of research occurred in the context of global debates about water privatisation. A
series of studies at the turn of the century and early 2000s examined the role of the public and
private sectors in delivering water and sanitation for the poor. Solo (1999) identified the
phenomenon of ‘speciation’ in which a diverse range of small-scale providers evolve in response to
local conditions. During this period, efforts to assess global trends increased. Cross-sectional
comparisons gauged the trends in different regions. In an influential 10-country study in Africa,
Collignon and Vezina (2000) estimated that 75% of the urban poor secure their water from ‘small
independent providers’ including vendors, water truckers and network providers. This study
highlighted the different characteristics of water vending along the supply chain from a quasi-
monopoly of water sources to the relatively large number and variety of independent providers,
tracking the water from source to household. Typologies were developed to distinguish small-scale
private water service providers (SPSP) according to their relationship to the source of water
(dependent versus independent) and the types of technology employed, drawing from analysis of
10,000 SPSPs across 48 countries (Kariuki and Schwartz, 2005). The studies of this period also
highlighted that informal markets can offer a complementary water system (Kjellén, 2000, Kjellén
and McGranahan, 2006), and they are not restricted to stop-gap enterprises (Solo 1999).
The third phase coincides with the period for achieving the Millennium Development Goals (and now
the SDGs) in a context of rapid urbanisation and climate change. It involves an expansion of interest
in several themes related to the drivers and impacts of informal water markets, such as: water and
financial flows in the informal versus formal systems; consumption patterns and motivations; prices
of vended water along the supply chain in comparison with piped systems; determinants of price;
competition and organisation among vendors; regulation and enforcement issues; and water quality
(both perception and reality).
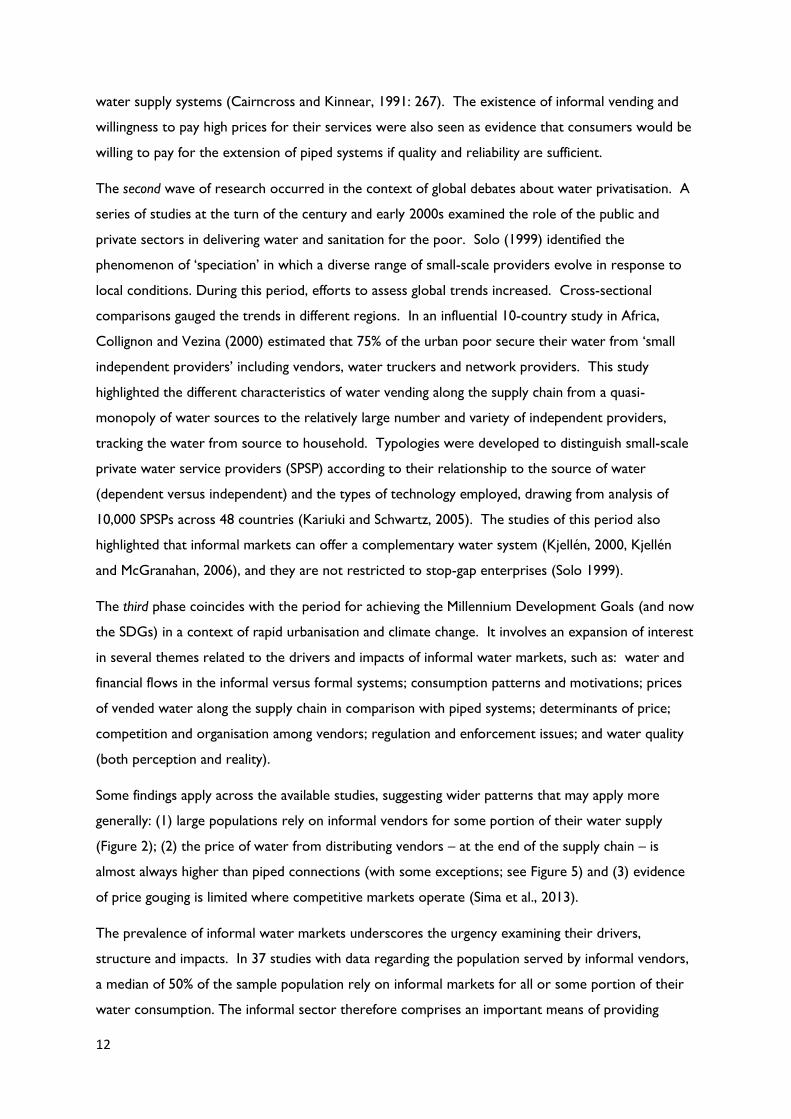
Some findings apply across the available studies, suggesting wider patterns that may apply more
generally: (1) large populations rely on informal vendors for some portion of their water supply
(Figure 2); (2) the price of water from distributing vendors – at the end of the supply chain – is
almost always higher than piped connections (with some exceptions; see Figure 5) and (3) evidence
of price gouging is limited where competitive markets operate (Sima et al., 2013).
The prevalence of informal water markets underscores the urgency examining their drivers,
structure and impacts. In 37 studies with data regarding the population served by informal vendors,
a median of 50% of the sample population rely on informal markets for all or some portion of their
water consumption. The informal sector therefore comprises an important means of providing

13
access to drinking water and other water uses even though the majority of water often flows
through the formal water system. Accordingly, the following sections of this report address key
issues regarding the performance of informal water markets. The following sections address key
unsettled questions regarding their performance.
Figure 2. Percentage of sampled population purchasing vended water
The unsettled questions Despite their prevalence, informal markets remain poorly understood and are often viewed as
transitory and undesirable (Baker 2009). The role of small water enterprises – ranging from source
water owners to mobile vendors – in water service delivery remains largely uncharted and
hampered by measurement challenges associated with their informal nature. In the absence of
evidence, informal water markets are considered to be inextricably linked with exploitation of the
poor: extortionary pricing, poor water quality and unequal access. Informal water markets are
subject to limited regulation by central governments, and often operate in the context of corruption
and capacity constraints. Yet, the distinction between informal and formal systems is not always
sharp in practice (Ranganathan, 2016), and informal vendors are increasingly being assessed in light of
the alternatives.

14
A counter narrative has emerged, which recognises that informal water vendors can be a force for
good under specific conditions and contexts. Existing evidence suggests that some informal markets
are competitive, marked by limited barriers to entry and multiple vendors which exert limited
influence over price, and face increasing consumer pressure to improve quality. Professional
associations exist in some instances, offering a bridge between formal and informal water systems
that provides a blended model of water service delivery. In other cases, tanker owners control
large fleets of trucks, and may also own water sources, purification facilities and packaging units,
which increases their control of the supply chain and improves their margins. Social norms also
influence the behaviour of water vendors who may donate water to poor and marginal households
in the communities were water is sourced. The specific characteristics and impacts of informal
water markets are an empirical question illustrating that informal water markets have potential
advantages and disadvantages (Table 1).
Table 1. Informal Markets: Advantages and Disadvantages of Small Water Enterprises
Advantages Disadvantages
Full recovery of costs and financially
sustainable, or they go out of business
Limited unaccounted losses of water
No upfront connection fees
Demand driven, with capacity to reach
poor
Flexible to local conditions
Less dependent on costly utility
infrastructure
Limited public subsidy or borrowing
Higher charge per unit compared
with (often government-subsidised)
piped connections
Lack of regulation of price and quality
Operation outside of legal structures
Limited water quality monitoring
Potential for conflict with local
utilities
Potential extortion by local officials
Little consumer protection
Limited transparency
Source: Adapted from (Solo, 1999, Opryszko et al., 2009)
This section examines five unsettled questions regarding informal water markets.
(1) Do informal markets prey on the poor?
(2) Do informal markets undermine formal water systems?
(3) Do informal markets deliver dirty water?
(4) Are informal markets unsustainable?
(5) Would regulation improve the performance of informal markets?
15
This synthesis is followed by two additional questions to guide the path forward:
What characteristics of informal urban water markets should be monitored?
Which policy tools and informational interventions can improve outcomes for the poor?
It must be recognized at the outset that existing data on informal water markets are deficient in
several respects. First, the data and measurement of key variables are inconsistent and difficult to
compare. Second, the geographic and temporal coverage of studies is limited, particularly in regions
subject to fragility, conflict, and violence, where informal markets may be more prevalent, and highly
dynamic in response to changes in infrastructure, urbanisation or climate. Third, very few studies
attempt rigorous cross-national comparison, limiting understanding of the emergence, evolution, and
impact of informal water markets. This report attempts to advance understanding of informal water
markets despite patchy and fragmentary data by taking stock of what is known about informal water
markets, and identifying implications and gaps for research and practice.
In some cases, answering these questions requires addressing the counter-factual, which is not
always possible on the basis of available evidence. However, this section provides initial insight on
these questions by reviewing the existing evidence from approximately 150 studies over the past 40
years, over two-thirds of which focused on urban markets. Primary studies explore specific empirical
examples of water markets, and either generated new data (for example, by conducting surveys or
interviews) or accessed existing data in a new way (for instance, some studies relied on existing large
scale household surveys, and used this data to support new analysis of a water market). Review
studies usually explored more than one location, and relied on existing information. Investigations of
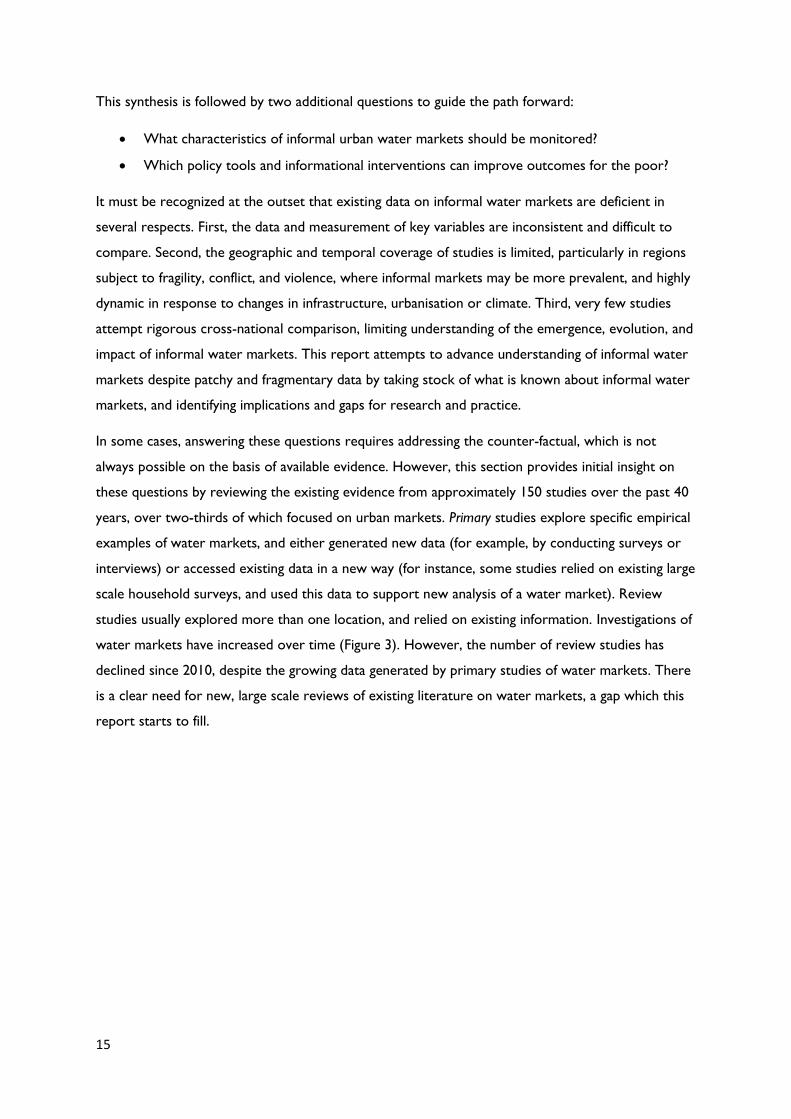
water markets have increased over time (Figure 3). However, the number of review studies has
declined since 2010, despite the growing data generated by primary studies of water markets. There
is a clear need for new, large scale reviews of existing literature on water markets, a gap which this
report starts to fill.
16
Figure 3. Studies per year: primary and review studies of water markets (based on a rolling three-year average)
The primary studies of water markets in urban contexts have been drawn mainly from examples in
Africa, South America and South Asia with Sub-Saharan Africa (n=42) and South Asia (n=13)
comprising the lion’s share. The empirical estimates of water volumes, prices and structure rely on
data from the past 20 years with a few exceptions. Most countries were only represented by one
study (21 of the 38 countries represented), with a further seven countries having two studies each
and the rest with three or more (e.g. Kenya).
Q1: Do informal markets prey on the poor?
To answer this question requires clarity regarding what is meant by preying upon the poor, which
involves unpacking the following inter-related issues:
Are informal markets competitive?
How do informal markets compare with the alternatives for the poor?
Are informal markets competitive? To answer this question, it is necessary to compare the situation
to that which would prevail if water supply were perfectly competitive. Where vendors confront
little or no competition there will be a tendency to charge the highest price that the market will
bear. In this sense informal markets may prey upon consumers by exploiting their market power in
situations where collusion or barriers to entry limit competition. Where prices are higher, this may
disproportionately impact the poor.
The view that informal markets prey upon the poor is often based upon a simple comparison of the
frequently subsidized prices paid by consumers to a utility for piped water, to that charged by an
informal water vendor. Such comparisons are fraught with difficulties. From a methodological
0
1
2
3
4
5
6
7
8
1985 1990 1995 2000 2005 2010 2015 2020
Primary
Review

17
perspective, few price comparisons include the upfront connection fee which is often charged by
operators of piped water systems, nor do they explicitly identify the extent to which utility prices
are subsidised by taxpayers. In other situations, the higher prices charged by vendors may simply
reflect their higher costs of supply, particularly driven by the costs of water delivery including
transport. Where there are significant economies of scale in the delivery of water, informal suppliers
may face disproportionately higher costs of supplying water, which all else equal, would be reflected
in higher prices (Whittington et al., 1989, Whittington et al., 1991).
Finally, how do informal markets compare with the alternatives? Most water supply utilities
command considerable market power since as natural monopolies they face limited competition
within their service areas. There are therefore few market driven incentives to induce
improvements in service quality and cost efficiency. This brings the risk that utilities, as natural
monopolies, will exploit their market power in ways that may be less obvious. Where regulators
control the price charged by utilities, market power can be exploited by inflating costs, or providing
poor and unreliable services, or under-investing in maintenance.
Moreover, informal water markets reach beyond the water lines where the only alternative may be
water collection from untreated sources. Any discussion of the impacts of informal water markets
on the poor therefore needs to consider the alternatives for households and businesses. Informal
markets may provide an appealing alternative in such circumstances, as illustrated by the high
willingness to pay for vended water for drinking water purposes.
In sum, generalizations are hazardous. Given a government monopoly that underperforms, there is
a possibility that private provision, if sufficiently competitive or contestable, may more equitably
distribute water to households (Solo, 2003, Zuin et al., 2011). But the reverse may also hold.
Rendering to the private sector sole access to a market whose demand is highly inelastic would
inevitably result in price levels that will be deemed extortionary, and increases the incentives for
corruption (Ranganathan, 2014).
This section examines the existing evidence to understand the range of global experience and the
potential policy implications, while also highlighting the need for additional research to fully answer
this question. Existing evidence is insufficient for generalisation, but suggests informal markets are
not automatically predatory.
Evidence
Few studies directly examined the question: how competitive is a particular water market? Doing so
requires analysis of the number of buyers and sellers, vendor organization, price-setting and detailed
analysis of profitability. Only a handful of studies directly consider the issue of competition in
informal water markets (here we focus on the existing evidence on competitiveness, prices, the
18
costs of service delivery driving these trends and the accessibility of water for the poor and non-
poor populations, noting that the evidence is not representative.
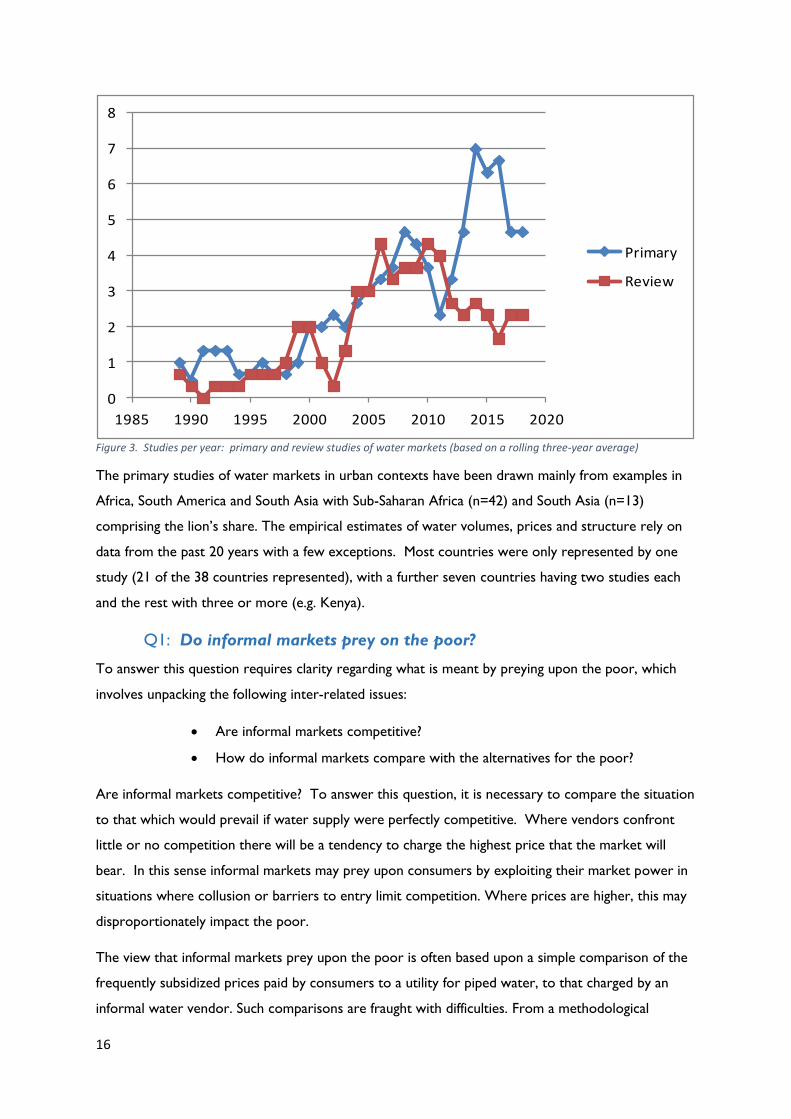
Here we focus on the existing evidence on competitiveness, prices, the costs of service delivery
driving these trends and the accessibility of water for the poor and non-poor populations, noting
that the evidence is not representative (
Table 2).
Table 2 Studies of urban water markets that address competitiveness
Study Key finding Measurement
Whittington et al.
(1989), Ukunda,
Kenya
Water markets in Ukunda are competitive. Vended water is
expensive relative to other sources, and this reflects the cost of
operating the water business rather than high profits.
Detailed analysis of
vendor costs, revenues
and profits
Whittington et al.
(1991), Onitsha,
Nigeria
Large numbers of sellers (trucks, small retailers, distributing
vendors) with no set customers or routes limit the power of
the water vendors to set prices. However, vended water prices
are high, and there is evidence that the private tanker trucks
are able to capture ‘monopoly profits’.
Detailed analysis of
vendor costs, revenues
and profits
Hailu et al. (2011),
Nairobi, Kenya
The most common reason given for prices for most types of
water vendor was the prices set by competitors, which
indicated a high level of competition. However, nearly one
quarter of tap and borehole vendors set prices based on what
they thought the customer could pay. Tanker trucks set prices
based on their costs, but many trucks were located at a central
point, increasing the likelihood of coordination. Approximately
one-third of vendors entered the business because of a belief
that it was profitable.
Analysis of how prices are
set (interview data)
Wutich et al.
(2016),
Cochabamba,
Bolivia
Approximately 10% of truck drivers are unionized, with the
remaining drivers considered pirata (pirate) operators.
Most drivers do not have set routes for business; however,
regular customers are strongly expected to stick to one
supplier. Truck owners set water prices based on costs of
supply (particularly fuel), but drivers are not compelled to stick
to these prices.
Analysis of vendor
organisation (unions) and
relationship between
vendors and consumers
Youngstedt et al.
(2016), Niamey,
Niger
Water delivery offers above average income, but is not
considered a suitable job for Nigerien men (only for Mali
immigrants). Ga’ruwa (water deliverers) support each other
‘with almost union-like solidarity’. Ga’ruwa buy their water
from a single point and agree not to compete for customers or
territories.
Detailed examination of
hand cart water vendors,
including the cultural and
financial barriers to entry
Ahlers et al.
(2013), Maputo,
Mozambique
Competition between different water providers does not
necessarily lead to lower prices and higher quality water
services due to ‘captive customers’ and ‘strong-arm tactics’ of
professional associations.
Assessment of
competition between
different water providers
Zuin et al. 2011,
Zuin et al. 2014,
Maputo,
Mozambique
The decision of where to purchase water is multi-dimensional,
as water resold from other households was the cheapest
available water, but other factors lowered overall satisfaction in
households depending on this supply. Household resellers
Interview and survey data
of households and water
resellers, water quality
samples

19
operated at a small profit, but were motivated by social norms
(rather than profit-maximizing).
In the absence of rigorous evidence about the competitiveness of informal markets, what do we
know about the price and pricing of water in informal water markets? Unsurprisingly, the price of
water tends to increase across the supply chain, which starts with bulk water sales from source
water owners (e.g. public or private boreholes) and can include fixed points for distribution (e.g.
kiosks or standpipes) or mobile distribution by tanker truck or carts (Figure 4). Water treatment
and packaging may also occur at the source or at other stages of the distribution process.
Figure 4. Supply chain and the structure of informal vending in Kathmandu (Adapted from Raina et al., 2018)
Several recent studies illustrate how prices increase across the supply chain. For instance, in Dar Es
Salaam, the price of water from piped water supply networks range from $0.64-$0.75/m3 (2017
dollars), which is less than the average from the IBnet database of about $0.91/m3. By comparison,
the informal sector charges higher prices and includes fixed points that charge between $8.63 to
$10.3/m3), tanker trucks that charge $5.26 to $11.28/m3 and carts with prices in the range of
$11.27-$18.80/m3 (Bayliss and Tukai, 2011).
20
In Kathmandu, a rare longitudinal study draws on a repeat sampling in 2001 and 2014 to illustrate
how water and money flow through the supply chain: source owners charged $0.38/m3 (2014
dollars) to tanker truck vendors, who charged households on average $2.25/m3. Mobile vendors of
jar water (20 L containers) are sold for $21.50 to $31.50 per cubic meter. The markets in the
Kathmandu example are marked by relatively low barriers to entry and high levels of competition.
There is evidence from several studies that vending is not always profitable, which suggests that
higher prices reflect the cost of water supply, rather than market power (Whittington et al., 1989).
However, this varies widely between vendor types and locations (see Whittington et al. (1991)).
In the absence of data on costs, most studies of water markets compare the price of vended water
to that of piped connections, to draw inferences about market power and extortionary pricing
behaviour. A World Bank study on private tankers in Yemen found that households surveyed in
Sana’a pay YER400-1,000/m3 (USD 1.60-USD 4/m3) for water purchased from tanker trucks
compared to YER146/m3 (USD 0.48/m3) for municipal water supply. In Aden, the second largest city,
surveyed households pay YER1,000-3,000/m3 (USD 4-USD 12/m3) for non-desalinated water and
YER 4,000-YER5,000/m3 (USD16-USD20/m3) for desalinated tanker truck water, while municipal
water supply costs range from YER31-120/m3 (USD0.12-USD0.50/m3). It is necessary to emphasize
that such comparisons are likely to be highly misleading in situations where the costs of supplying
water through informal networks differ from piped connections, and where subsidies, or price-cap
regulations distort the prices that are charged by official piped networks.
In the early 2000s, a global review of price data from 93 locations in 47 countries identified
substantial variation in price but confirmed the mark-ups of vended water in comparison to piped
connections. The average mark-up for point source informal vendors (kiosks) was 4.5 times the
price charged by the utility, while mobile vendors delivering water from door-to-door charged 12
times the price of the piped water supply network (Kariuki and Schwartz 2005). In 2010, a review of
23 cities showed that average tanker prices were almost 10 times the average cost of municipal
piped supplies, with mobile water vendors being just over eight times the cost of piped supplies
(Keener et al., 2010). Recent studies illustrate similar results. In Dar es Salaam, Bayliss and Tukai
(2011) found that low-income householders pay as much as $17/m3 – 30 times the price of water
from piped connections and 17 times the price of water from formal systems in OECD countries.
The median mark-up is 10 times higher based on the 40 studies with the relevant data examined for
this report (Figure 5 and 6). There is also considerable variability within and across sites, and the
methodology for comparing the costs of water from vendors to formal piped providers varied

21
significantly across the studies.3 As an example within a single site, the mark-up for tanker water in
Mexico City varies from 15 to 55 times the price of piped connections (Baisa et al, 2010). Across all
of the sites, the mark-up ranges from none to 100, illustrated by household resale in Mozambique
(no mark-up) to tanker prices in Iran (100 times), respectively (Zuin et al, 2014; Molle et al, 2011).
The highest mark-ups, with a maximum ratio of 100:1, were found in the peri-urban areas of
Mumbai, India (Angueletou-Marteau, 2007), and the village of Jalalabad, Iran (Molle et al., 2004),
however each of these studies lacked detail on the methods used to obtain these data. The two
studies showing the next highest mark-up were much more detailed. In Ukunda, Kenya, Whittington
et al. (1989) showed that private vendors were selling water at 30 to 60 times the price of water
available from water utilities. In Mexico City, Baisa et al. (2010) found that the operators of water
tankers were selling water at a mark-up of 15-55 times the price of water available from water
utilities. However, both of these studies also demonstrated that the private vendors were not
making significant profits, due to the expense of collecting and transporting water to buyers. In sum
the anecdotal, and hence incomplete, evidence that is available appears to suggest that the higher
prices charged by these vendors reflects the elevated costs of supplying a service with inherent scale
economies through informal channels that may bring further cost disadvantages.
3 Bottled water prices were typically much higher than the ratios provided here (500-750), but have been excluded from this dataset because bottled water is found in most cities, and is always sold at a high mark-up HAWKINS, G. 2017. The impacts of bottled water: an analysis of bottled water markets and their interactions with tap water provision. WIREs Water, 4, 10.1002/wat2.1203..

22
Figure 5. Ratio of the price for vended water to the price for water from piped connections (mean in blue with bars representing the
range from minimum to maximum, as specified in primary studies)
2.00
100.00
51.00
0.1
1.0
10.0
100.0A
sunc
ión
, Par
agua
y (2
003)
Map
uto
, Mo
zam
biq
ue
(2
01
1)
Map
uto
, Mo
zam
biq
ue
(2
01
3)
Du
rban
, So
uth
Afr
ica
(200
1)
Map
uto
, Mo
zam
biq
ue
(2
01
4)
Nia
mey
, Nig
er (
2016
)
Ban
dung
Cit
y &
Jak
arta
(In
don
esia
)
Cor
dob
a, A
rgen
tina
(20
03)
Khar
toum
, Sud
an (
1991
)
Lim
a, I
ca &
Cu
zco
Pe
ru (
20
03
)
Nia
mey
, Nig
er (
2008
)
Ban
galo
re, I
ndia
(201
4)
Ch
en
na
i, In
dia
(20
15
)
Gua
tem
ala
Cit
y, G
uate
mal
a (2
003)
Ind
ore
, In
dia
(2
00
4)
Mu
ltip
le c
itie
s, E
l Sal
vado
r (2
005)
Bar
ran
quill
a, C
olo
mbi
a (2
003
)
Kar
ach
i, P
akis
tan
(1
99
9)
Bag
uio
Cit
y, P
hilip
pine
s (2
014)
Man
ila, P
hilip
pine
s (2
014)
Mu
ltip
le t
owns
, Uga
nda
(2
008)
Jaka
rta,
Indo
nes
ia (
1994
)
Khar
toum
, Sud
an (
1992
)
Man
ila, P
hilip
pine
s (1
998)
Ke
nya
, th
ree
cit
ies
(20
05
)
Kisu
mu
, Ken
ya (
201
4)
Da
r E
s Sa
laa
m,
Tan
zan
ia (
20
11
)
Ad
dis
Ab
aba,
Eth
iop
ia (
20
14
)
Dar
Es
Sala
am,
Tan
zan
ia (
200
0)
Dar
Es
Sala
am,
Tan
zan
ia (
201
4)
Mu
ltip
le t
ow
ns,
Gh
ana
(20
10
)
Jaip
ur,
Ind
ia (
20
04
)
Nag
pu
r, In
dia
(2
00
4)
On
itsh
a, N
iger
ia (
1991
)
Nai
robi
, Ken
ya (2
011
)
Jord
an (
mu
ltip
le lo
cati
ons)
(20
13)
Mex
ico
Cit
y, M
exic
o (
20
10
)
Uku
nda
, Ken
ya (
1989
)
Jala
lab
ad v
illag
e, I
ran
(2
004)
Rat
io o
f ve
nd
ed
wat
er
pri
ce t
o p
rice
of
wat
er
uti
lity
,
or
cost
of
wat
er
to v
en
do
r (m
inim
um
, m
axim
um
an
d m
ean
)
Study location and year
23
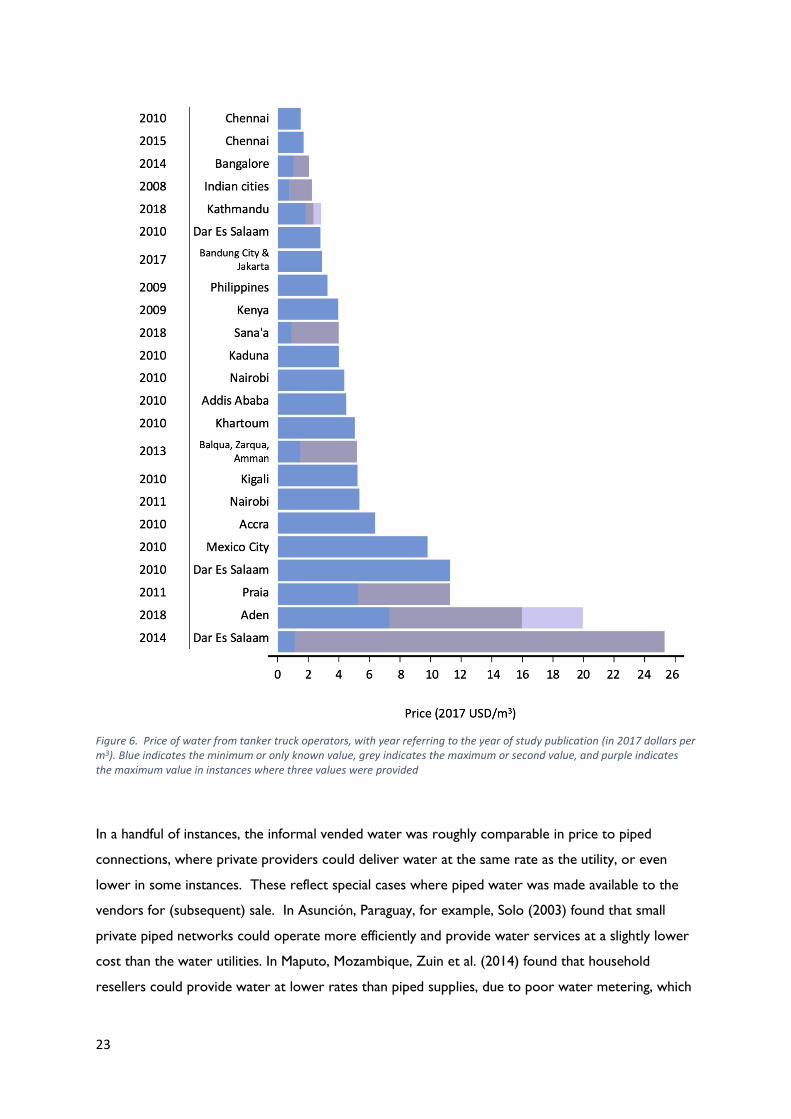
Figure 6. Price of water from tanker truck operators, with year referring to the year of study publication (in 2017 dollars per m3). Blue indicates the minimum or only known value, grey indicates the maximum or second value, and purple indicates the maximum value in instances where three values were provided
In a handful of instances, the informal vended water was roughly comparable in price to piped
connections, where private providers could deliver water at the same rate as the utility, or even
lower in some instances. These reflect special cases where piped water was made available to the
vendors for (subsequent) sale. In Asunción, Paraguay, for example, Solo (2003) found that small
private piped networks could operate more efficiently and provide water services at a slightly lower
cost than the water utilities. In Maputo, Mozambique, Zuin et al. (2014) found that household
resellers could provide water at lower rates than piped supplies, due to poor water metering, which
24
meant that some household resellers were not being charged for the full quantity of water they used
and were thus able to pass on the water from the piped connection at negligible costs.
If informal vendors earn higher profits by selling to the poor, this would provide suggestive evidence
of discriminatory, or even extortionary pricing. A number of studies do in fact claim that there is a
‘poverty penalty’: the poor pay more per unit of water for similar types of water (Hailu et al., 2011).
Although there are examples of price differences to support these arguments, the evidence is
inconclusive. While prices vary by location and type of service offered, it is difficult to determine if
these differences reflect variations in costs, or variations in profits. In addition, poor households
typically purchase vended water in small unit sizes, such as bottles, jerry cans and sachets, which are
associated with the most expensive water in the supply chain. For example, the highly active sachet
markets in Ghana sell 500ml packets of water in bundles of 30 (15L total), which often have higher
unit costs than the bottled water and tanker water services delivered to the richer households in
the city.
Conversely, there is also evidence that in some cities higher prices are charged in the wealthier
suburbs and to commercial buyers. For instance, in Amman, tanker trucks charge a higher price for
wealthier consumers (Gerlach and Franceys 2009). The tankers are regulated by the Ministry of
Water to charge from $2.47 to $2.82/m3 in winter and summer season; these prices can be
compared with actual charges up to $10.58/m3 for rich versus $1.27-$4.23 for poor and $1.76 for
commercial (Gerlach and Franceys, 2009). The poor face other barriers to access, however, due to
their lack of storage; vendors often have minimum volumetric sales. In Amman, vendors require a
2m3 minimum volume, which can exclude the poor or require consumers to pool resources. In
other cases, informal water markets account for the poor by donating water to households in the
source region (Kathmandu) or charging lower prices to the poor. Tanker drivers may also offer
flexible payment schemes, such as the option to purchase water on credit, which could be attractive
to low-income customers.
The comparison between vended water and formal systems fails to address fundamental issues about
the structure of informal markets. First, some of the case study evidence suggests that informal
markets are often competitive, which limits the market power of vendors to charge extortionate
prices [Box 2]. In contrast with piped water supply networks, market power is limited when
barriers to entry are low and there are limited economies of scale. In the active informal markets
of Chennai and Kathmandu, for example, hundreds of mobile vendors serve urban dwellers, which
limit the influence of any individual vendors to control prices. Even when associations or
coordination occurs, the impacts on the poor are unclear. In some circumstances, price setting is
influenced, and tempered, by social norms that reduce the price for the poor, while in other cases,
efforts to control prices by associations or cartels prove difficult to enforce due to competitive

25
pressures and entry of entrepreneurs competing on price and/or quality. In Cochabamba, vendors
associations determined prices, but enforcement was uneven and there are limited barriers to entry
for ‘pirate vendors’ who are not bound by the association’s decisions (Wutich et al 2016). In Dar es
Salaam, interviews suggested that markets were competitive despite the extensive communication
among vendors about price; price was determined ‘according to water availability’ and at a level
which allows vendors to ‘support each other’ by ensuring costs are recovered; the study concludes
that vendors are ‘not making spectacular profits’ (Bayliss and Tukai 2011).
Second, vendors must recover their costs, which often explains the mark-up. The costs of vending
water include the cost of the source water, treatment and delivery, as well as any fees or taxes
imposed by government. The costs vary according to the scarcity of water, the treatment
technologies used, and the transport distance and delivery technologies. Vended water is also
labour intensive. Further, the informal nature of the sector makes financing risky, which increases
the cost of capital and is passed onto the consumer. Financing of vehicles, treatment facilities and
related expenditures relies on sources with high interest rates when personal savings or family loans
are unavailable.
In terms of alternatives, the existing evidence suggests that the comparison of informal vendors to
piped water supply networks is flawed. Piped water supply systems are often subsidized or
incomplete, which gives rise to the emergence of informal vending in the first place. It may be more
appropriate to compare informal vendors with formal markets in bottled water where they exist, or
a hypothetical competitive equilibrium. In many cases, the informal markets may represent the best
alternative in the short term, raising questions about the long-term implications and impact on
formal water systems (question two) and the role of regulation in ensuring better social, economic
and environmental outcomes (question five). However, more research is needed, particularly
detailed household-level surveys, to adequately gauge both the extent to which the poor willingly
pay higher prices for water delivered via informal markets in exchange for higher quality and the
impact of these purchases on total household income.

26
Box 2: Are Informal Urban Water Markets in Kathmandu Competitive?
Kathmandu, Nepal has a booming water vending industry due to conditions common to many cities: a municipal
utility that fails to deliver adequate water to its population over a significant period of time, and a rapidly
growing population that is partly dependent on alternative sources of water. Many cities in the developing world
exhibit similar features and issues. Data collected by Raina et al. in 2014 from in-person interviews with 120
water vendors and from respondents in 1,500 households, as well as from key informant interviews, create a
nuanced portrait of the structure of the informal water market in Kathmandu.
The study documented five main types of water vending: commercial water source abstraction, tanker truck
delivery, bottled water production, household delivery by distributing vendors, and sale of both bulk and bottled
water by retail outlets such as neighbourhood kiosks and private shops. These functions may be consolidated in
various ways. Financial analysis of the revenues and costs of commercial water source vendors and tanker truck
vendors reveal that these businesses do not appear to be earning monopoly rents. That is, these components of
the water vending supply chain appear reasonably competitive.
The information obtained from the household and water vendor surveys was used to estimate the city-wide
scale of quantities of water sold and of money paid and received at different points in the water vending supply
chain. 700 tanker trucks supplied the city with water obtained from 210 commercial water sources.
Approximately 200 bottled water vendors were selling 20-liter plastic jars and 1-liter bottles to shops and
families. Calculations show that during the dry season of 2014, households and businesses purchased
approximately 370,000 to 500,000 m3/month from the private water market, generating total revenues for
commercial water source vendors, tanker truck vendors, and bottled water vendors of about US$1 million per
month. This represents about 20% of the water used by households in Kathmandu in that dry season.
Commercial water source vendors sold 269,000 m3 of water each month and received US$103,000/month from
households, businesses, and tanker truck vendors. Tanker truck vendors delivered and sold 371,000 m3 of water
and received US$806,000/month, of which 31,000 m3 was sold to retail outlets. The average price of bulk water
sold by tanker truck vendors was US$2.17 per cubic meter at the time of the study.
This research shows that at the time of the study (2014), water vendors in Kathmandu Valley operated a
diverse, heterogeneous group of businesses. There was a supply chain with two main products: bulk water and
bottled drinking water. Transactions occurred in four main markets: two upstream markets (between water
source owners and tanker trucks, and between bottled water vendors and distributing vendors) and two
consumer markets (between tanker truck vendors and consumers and between distributing vendors and
consumers).
Each type of water vending business faced its own unique operational challenges and competitive pressures.
Revenues, costs, and profits varied along the supply chain depending on the type, size, and integration of
business operations. The characteristics of buyers and sellers also varied. Some water vendors were both buyers
and sellers of water. Some water vendors were vertically integrated in the sense that they were involved in
different phases in the supply chain, while others focused on only a single activity. But the influence of these
associations on the behavior of different types of water vendors seems to have been modest; many water
vendors reported that they did not follow the pricing guidelines promoted by the associations. It appears that
competitive pressures are too strong for the associations to exert price control. Policy interventions such as
designing governance structures and regulatory frameworks may be needed in the future to address potential
negative welfare consequences resulting from water vending, but such interventions do not appear to be
necessary in Kathmandu. The high willingness to pay for vended water suggests that tariff increases may prove
feasible when new water supplies arrive from the Melamchi Water Supply project.
(Source: Raina et al, 2018)

27
Q2: Do informal markets crowd out formal water systems? Where the formal sector inadequately distributes water to its citizens, consumers must turn to
alternative sources of supply. And where there is unmet demand, markets may emerge to fill
residual needs. In this sense it seems unlikely that informal markets undermine formal utilities over
the long term, although informal vendors can establish powerful lobbies or vested interests that
block extensions of formal systems.
Conventional economics would suggest that these markets have evolved in response to policy
failures and the uneven performance of formal utilities. In such cases the formal and informal
markets are more likely to be complementary rather than competitors. However, competition
(substitutability) could emerge in situations where the formal and informal sectors compete for
inputs (access to water), or customers, or where the formal sector colludes with the informal to
restrict access and expansion of infrastructure networks, which can drive demand for the informal
sector. These are situations where the presence of the informal sector may impede the growth of
the formal sector, by reducing demand for, or eroding profits of, the formal sector. Bottled water
markets, for instance, may also lead to lower expectations of water quality from water utilities
(Hawkins, 2017).
Where formal and informal markets overlap (as they do for potable water almost universally) – two
outcomes may emerge. Consumers may benefit from greater choice and latent competition between
the sectors, resulting in perhaps lower prices and better service. Most often such markets become
segmented – with private suppliers focusing upon a higher value-added niche – such as “purified”
drinking water.
Evidence
The existing evidence on the effect of informal markets on formal systems is patchy, but broadly
confirms expectations of economists; informal vendors fill a gap in formal water systems due to
coverage, reliability, quality, or all of the above. In the case of overlapping informal and formal
systems for delivering drinking water, the evidence is less clear. There are examples of latent
competition between the formal and informal sector with cases such as Ghana and Chennai where
the informal sector for sachet and bottled water has grown even where piped connections exist.
This competition should lead to improved service quality for drinking water, but the effect on price
is less clear due to the differences between packed and piped water supplies, and the impact of
subsidies on tariff structures for formal water systems.
The global experience suggests that the relationship between informal markets and formal water
systems can also be complex. Informal markets are linked with formal systems in several ways,

28
which can both undermine and strengthen formal systems depending on the circumstances. First,
informal vendors often rely on public boreholes for some portion of their water supply. This has led
to negotiation, concessions or memoranda of understanding to secure bulk water tariffs for informal
vendors. For example, community groups in Addis Ababa have negotiated with the local water
utility to gain recognition as ‘public fountains’ to support urban and peri-urban dwellers who lack
piped connections (Ayalew et al. 2010). The public fountains act as a stopgap until the formal system
extends its piped network.
In Kenya, the emergence of the informal sector has steadily evolved into a delegated management
model where standpipe operators have become extensions of the water network. These emerging
forms of public-private partnerships can have several advantages, including the creation of an
important source of revenue for formal water systems selling bulk water to informal vendors. This
revenue can support investments in water service delivery and expansion of the formal water
system.
The presence of informal vendors may also undermine the formal system and its expansion. In
Amman, water sales to tanker operators generated $16.9M (2005 dollars) in revenue per year,
which provides resources to the water ministry, but threaten its long term financial viability by
eroding the customer base connected to the formal system (Gerlach and Franceys, 2009) 439).
Interactions between informal and formal systems can exacerbate corruption, including: rent
extraction, unofficial taxes by local and public officials and conflicts of interest when government
officials operate side businesses as informal vendors. Vendors regularly report conflicts with water
utilities and complain that formal systems are ill equipped to deal with small-scale service providers
or see them as competition.
Conversely, formal water systems accuse vendors of hostility, violence and vandalism to prevent
expansion of the water network into regions served by informal vendors. Such behaviour throws
into question whether the informal sector can offer a transitional or stopgap water supply in fast
growing regions because expansion of formal water supply networks threatens businesses and jobs
tied to informal vending. Such considerations are far from trivial, as experienced in Ghana where
the sachet market supports a thriving set of small-scale and industrial water vendors. Vendor
associations have established a potential bridge between entities by encouraging cooperation among
vendors (Wutich et al., 2016), fostering dialogue with utilities and reducing rent-seeking behaviour
(Solo, 2003).
From the consumer perspective, informal vending has unpredictable impacts on formal water
systems. On the one hand, the proliferation of informal markets illustrates the high willingness to
pay for water services, which has been interpreted as evidence that consumers would pay for piped
water supplies of sufficient reliability or quality (Whittington et al, 1991; and Kathmandu case study,

29
volume 2). On the other hand, some consumers are unwilling to pay for piped connections due to
limited confidence in the public water systems; Chennai is a case in point, where surveyed
populations express low willingness to pay for improved piped connections (Venkatachalam 2015).
In such situations the proliferation of informal vendors can crowd out government investments in
formal water systems due to the low likelihood of recovering costs, creating a vicious cycle.
Differences in the pricing of water can also lead consumers to opt out of formal systems. In line
with the expectations of market segmentation, water from informal vendors is sold in a range of
volumes from bulk water sales to fill storages to individual bottles, jars or cans of drinking water. In
the case of bulk water sales, businesses and wealthy residents may choose water from informal
vendors rather than consume water from formal water supply networks. In Amman, for example,
some wealthier consumers have opted out of the public water supply network to avoid sanitation
charges. In the case of drinking water and other domestic uses, the poor pay high unit prices but
consume relatively low volumes, posing relatively limited risk to formal systems, where the poor are
already unlikely to be connected, and are less likely to pay for services when they are. However,
the prevalence of informal vendors may reduce the pressure to extend the formal water supply
network given the challenges of collecting payments from poor households with piped connections.
This dynamic has raised the question whether informal vending perpetuates poverty by allowing
governments to shirk their water provision duties, by alleviating a key pressure point (wealthy users
who might otherwise lobby government effectively to improve services), as well as enabling
governments to report that the poor have ‘access’ to improved water supplies.
The cases of informal markets in contexts of fragility, conflict and violence, however, suggest that
informal vendors may be the only viable option. In Luanda, Angola, the failure of the formal supply
network has led to official acceptance of the informal sector (Cain 2014). Informal markets in
Yemen play a similar role, exposing the water scarcity, quality and public health risks tied to informal
vending when public systems fail and there is insufficient capacity for regulation. This highlights the
potential need for informational interventions and tools for monitoring the impacts of the informal
sector with limited resources.
Overall, the global experience provides limited evidence that informal vendors undermine formal
water systems. However, it does raise several issues, including the difficulty of distinguishing formal
and informal water systems. In many parts of the world, the informal is seen as extension of the
formal, and a variety of arrangements are emerging to coordinate informal markets and formal water
systems. These raise questions about the potential and limits of regulation (Question 5) as the
informal sector gains increasing recognition as a potential path to water security.
30
Q3: Do informal markets deliver dirty water?
While the quantity of water is an attribute that is readily observable, the quality of water is not. In
many regions with active informal markets, water quality needs to be considered in comparison with
other available sources, including piped water supplies, where they are available, or unimproved
sources. Water that is clear and odourless can be unsafe and even lethal. Hence markets cannot be
relied upon to deliver the quality of water that is deemed safe in terms of its microbial and chemical
content. To determine whether water is safe for consumption requires access to specialized
services and laboratory equipment, all of which lie far beyond what is available to consumers,
especially in the moment of completing a transaction.
Where an attribute is unobservable, intense competition could lead to a race to the bottom – a
result associated with the celebrated “market for lemons theory”. If purifying water is expensive,
but the quality of water cannot be observed by buyers, then sellers of low quality water can
undercut the higher quality vendors. Lack of information leads to an adverse selection problem –
the lower cost low quality water, drives the high-quality product out of the market. However, in
circumstances where repeat sales affect consumer demand, concerns about reputation may alleviate
adverse selection problems.
As a result, policy makers have promoted the idea of regulating the quality of water supplied by
informal water markets. While appealing, such proposals must assume that enforcement of
regulations is feasible and compliance is perfect. In situations where corruption is widespread or
implementation is uneven, regulations cannot be relied upon to deliver safe water to consumers. In
such circumstances public information campaigns will be more effective to inform consumers of the
risks and where feasible governments could provide subsidies for household water purification and
safe storage.
This may suggest a dual strategy in settings with weak enforcement where markets and competition
are used to control price and make water affordable (where this is feasible and appropriate). But
controlling the quality of water is encouraged at the user level with information campaigns and
support for point-of-use purification and storage equipment. For instance, it has been suggested that
tankers can be clearly marked to signal their registration with regulatory authorities and by
implication the sale of “safe” water. Yet the success of such a strategy also depends on a functioning
regulatory regime and consumers being aware of, and understanding, any such label (Wutich et al.,
2016).
Evidence
Improved water quality is a major driver of demand for vended water, yet the microbiological and
chemical content of vended water remains largely uncharted [Box 3] (Ayalew et al., 2014, Oprysko

31
et al., 2009). On the one hand, poor quality vended water has been associated with high incidence
of diarrhoea, the prevalence of coliform bacteria and increased risk of contamination as water is
moved from one parcel to another along the supply chain (Kjellen and McGranahan 2006). Lack of
treatment can elevate these risks. In Nigeria, 70% of formal vendors supplied some treated water,
but 85% of informal vendors were supplying untreated water (Olajuyigbe et al., 2012). Conversely,
some studies have demonstrated lower incidence of diarrhoea in children relying on vended water,
particularly sachet water (Stoler et al., 2012).
In our review half (n=28) of the primary studies addressing informal urban water markets consider
quality in some form. Four of these highlight that poor water quality of the formal system is a
primary driver of demand for vended water, ranging from Kenya and Khartoum to Lagos and the
Lower Rio Grande Valley.
Since the market is driven by concerns about the safety of water, vendors have a greater incentive
to pay attention to water quality due to their reputation and the prospect of repeat sales (Kjellen
2000). As a result, most studies that examined the perceptions of water quality note that vended
water is perceived by consumers as higher quality than piped connections, or comparable. Several
studies document the consumer perception that water quality is higher for some forms of vended
water, such as sachets (Bakker et al., 2008, Adekalu et al., 2002, Bayliss and Tukai, 2011). Demand
for higher quality water underpins the higher willingness to pay for vended water in some settings
(Whittington et al., 1989). However, contamination of vended water due to dirty storage containers
was cited as a challenge in Ghana, Bandung City (Indonesia), and Tanzania (Ainuson 2010, Nastiti
2017, Bayliss and Tukai, 2011). There may also be structural elements beyond the control of
informal service providers. For example, if water laboratories or water testing kits or chlorine
tablets are scarce in the market – or exorbitantly priced – that would prevent even willing providers
from taking water quality measures.

32
In the absence of regulation and data, consumer perceptions are based on colour, odour, taste and
reputation of vendors – all imperfect proxies for water quality. In Onitsha, Nigeria, the quality of
vended water was perceived to be good, and better than the water from the public system
(Whittington et al 1991). Perceptions are also based on reputation and norms with vendors
advertising quality to gain repeat business. In Amman, quality is cited as the main concern of tanker
customers, rather than price, with approximately 43% of the households relying on tanker water
noting quality as a problem and only 18.4% considering tanker water comparable in quality to the
formal system (Gerlach and Francey 2009). Prices also vary according to perceptions of quality,
including differences in the prices based on the salinity levels associated with different sources of
vended water in Tanzania and Yemen (Bayliss and Tukai 2011).
Water treatment constitutes one of the value-added services supplied by vendors. In Kathmandu,
reverse osmosis processes are used by bottled water facilities (IWP team). Chlorination is expected
from tankers in Luanda, Angola at a cost of 0.12/m3; the added costs of treatment has led some
vendors to attempt to shirk these requirements. The lack of enforcement capacity exacerbates the
asymmetry of information between the vendors and consumers regarding water quality. In such
cases, the primary recourse has involved boycotts by consumers when water-borne diseases can be
traced to negligent vendors. This highlights the crucial value of regulations that empower consumers
to act collectively against the market power of water vendors.
The global experiences have led to the calls for water quality regulation. In many locations, the
ministries of health, food safety and related entities have nominally imposed some form of water
Box 3: Scarce Data on Water Quality
Data are inconclusive regarding the relative microbial and chemical quality of water in informal urban water markets and alternative sources. Unpublished studies cited by Opryszko and colleagues (2009) examined water quality in the kiosks and sachet packets of Central Java and Ghana, respectively. The studies documented improved drinking water quality in Central Java compared with the formal system, whilst there were greater risks in Ghana of bacterial contamination in hand packaged sachet water compared with factories.
Six published studies conducted water quality testing, all within the past 10 years. Zuin and colleagues (2011) examine the bacteriological quality at the point of collection for household resale from standpipes and private tap connections, illustrating no significant difference in quality according to E. coli samples. Ayalew and colleagues (2014) collected 414 samples in Kisumu and Addis Ababa to test for thermotolerant coliforms (TTCs) at different points along the supply chain. In Kisumu (n=318), the test for TTC was positive in 84% of samples with evidence that the deterioration in quality occurs during household storage (100% of samples) compared with borehole (50%) and the standpipe or household tap (26.1%). The results for Addis Ababa (n=96) were similar but less striking, contrasting household storage (51.9%) with tap (20%) and borehole (25%) results. Chemical and bacterial testing of water supplied by tankers in Cape Coast, Ghana identified elevated levels of E-coli, colour, turbidity and total iron, and failure to meet WHO standards (Obeng et al 2010).
The quality of water sold in the sachet water market, and other packaged water markets, has received far more attention than other markets within the supply chain. In one of the most comprehensive studies, Stoler and colleagues assess the bacteriologic quality for sachet markets in Accra, Ghana (Stoler et al., 2014). None of the 60 samples detected faecal contamination, and over 80% were within recommended thresholds for bacteria counts. Their analysis also demonstrated that brand reputation provided a strong indicator of quality by comparing consumer perceptions of water quality with testing results. This research suggests that efforts to promote informational interventions and feedback to consumers can prove effective.

33
quality regulation, ranging from registration to inspection. In Ghana, the food and standards board
impose quality standards for sachet markets, but smaller operators prove difficult to enrol and track.
In such settings, bottom up methods are promoted for quantifying consumer satisfaction and
conducting spot checks of water quality. In Aden, Yemen, the local water utility conducts occasional
water quality inspections of private wells that sell water to tankers [Box 4]. In addition, the Traffic
Department has a certified specialist testing center for vehicle safety inspection (including checking
the quality of tanker trucks).
Such initiatives confront the conundrum of regulating water quality in a context of competitive
markets and governance failure. Stringent water quality standards impose additional costs for water
vendors that can put them out of business. When such obstacles can or have been overcome, the
capacity for enforcement is limited. Therefore, improved water quality in the informal sector may
rely on low-cost treatment and improved storage options, coupled with capacity building for
vendors and the access to low-cost credit for investment in treatment technologies. Informational
interventions to monitor and report quality at low cost can support such initiatives and build the
baseline data required for tracking the changes in water quality in relation to variation in demand,
sources and climate shocks.

34
Box 4: Fragility and Informal Water Markets in Yemen
Beset by poverty, water scarcity, and conflict, Yemen is facing one of the world’s most severe water supply and sanitation crises. Yemen is subject to a range of challenges that in combination render it one of the world’s most fragile states. Abu-Lohom and colleagues (2018) document the rise of informal markets in Sana’a and Aden to fill a gap left by the deterioration of formal municipal water supply networks as a result of ongoing conflict. The effective collapse of formal municipal water supply and water quality systems in Sana’a and Aden since 2016 has created a substantial gap in water service provision. In Aden, home to what is likely Yemen’s most functional remaining urban water supply system, municipal supplies account for around 24 million m3 of water annually, whereas the demand is estimated to be more than 39 million m3. Prior to 2016, pumps operated 22 hours per day, but as of 2017, pumps are operating less than 8 hours per day.
In response, illegal well drilling has apparently increased along with reliance on private water tanker trucks. In Aden, small-scale private desalination plants also operate to fill the water supply gap. Household survey results confirm that private water tanker trucks are increasingly filling the gap in water service provision caused by decreasing use of formal municipal water networks. The transformation has been particularly marked in Sana’a, where municipal water service utilization fell from 44% of surveyed households pre-conflict to 28%. In Aden, despite the fact that 71% of respondents continue to receive some water from formal municipal sources, nearly half of respondents also reported using private water tanker truck delivery services, suggesting that informal markets fill gaps in service provision even where formal water supply systems remain functional.
The study suggests that while private water tanker deliveries are considerably more expensive than municipal piped water, there is some evidence of market competition and efficiency with respect to the responsiveness of private service providers in delivering water to households. However, the data also raise significant concerns related to impact on the poor, water quality, and environmental sustainability. In the absence of municipal water deliveries, the poor appear to obtain most of their water through charity, which may be subject to disruption or interruption. The absence of any effective government regulation of private water tanker trucks also raises the possibility of contamination throughout the supply chain and over-abstraction of source wells. A water quality analysis conducted at source wells, within tanker trucks, and in household water tanks indicated high levels of Total Dissolved Solids (TDS), as well as some evidence of fecal contamination. While comparative data is not available for municipal piped water supplies, these results raise the prospect that the rise of private water tanker truck distribution systems may increase the risk of contracting waterborne illnesses and otherwise spreading contaminants throughout the urban water supply system. The study highlights the critical role that informal markets can play in urban water supply systems,
particularly in the context of state fragility, conflict, and violence. Second, it suggests that, contrary
to some strands in the extant literature, such informal systems are not necessarily objectionable or
inferior to municipal piped water supply networks, and in some circumstances they may offer an
acceptable complement or substitute. Indeed, the fact that private water tanker trucks have been
contracted by some international NGOs to facilitate water delivery in Yemen suggests that aid and
development agencies should consider whether tanker trucks might offer a useful delivery
mechanism for water supply and sanitation services. Third and finally, the case of Yemen underlines
the need to consider externalities such as the spread of communicable waterborne diseases and
groundwater mining alongside distributional issues in the analysis of both formal and informal
markets for water.
(Source: Abu-Lohom et al, 2018)
35
Q4: Are informal water markets unsustainable?
Informal urban water markets can exacerbate groundwater depletion and impair surface water flows
where water is scarce, unregulated and unmetered. The impacts of informal urban water markets
on water resource sustainability therefore depend on the types of water sources and associated
oversight. Source water markets include public and private boreholes with varying rules and
enforcement related to depletion.
Where informal markets rely on public boreholes, water utilities may restrict access and
withdrawals to maintain well productivity and manage local depletion. However, the political will
and regulatory capacity to curb unsustainable water depletion will be limited in regions where formal
water systems already struggle to keep pace with coverage and demand. Any effort to restrict
access can have unpredictable or underestimated knock-on effects. For example, registration of
source water owners can erect a barrier to entry that limits competitiveness and coverage by
informal water markets. Further, the environmental impacts need to be compared with alternative
water supply models, including centralized storage and distribution networks.
Where informal markets rely on private boreholes, efforts to conserve the resource base depend on
self-regulation by associations or local norms established by source water communities. Policy and
informational interventions to enhance sustainability rely on strategies to register borehole
locations, meter water depletion and expand public boreholes and fixed point water sources to
reduce pressure in vulnerable regions.
Evidence
Beyond the water quality issues noted in the previous section, the environmental and sustainability
impacts of informal urban water markets are almost completely unknown [Box 5]. The
environmental impact is unclear or unspecified in 47 of the 58 primary urban studies (~81%). The
remaining cases include studies from regions experiencing severe water stress where growing urban
demands intensify scarcity and competition, exemplified by experiences in Jordan, Iran and Pakistan,
as well as the case of Yemen introduced above (Molle et al., 2004). In Sana’a, for example, well
owners reported a decline in both depth to groundwater and total volume. Average estimated well
capacity in Sana’a was approximately 17.7 m3/hour, while average reported pumping volumes were
243 m3/day. Well owners reported an average estimated decline in well volume capacity of 100
m3/day.
Although the resource sustainability impacts are essentially uncharted, the environmental
consequences of packaged water have also received growing attention and alarm. A household
expenditure survey indicates that approximately 10-11 million liters of sachet water is consumed per
36
day in both Ghana and Nigeria, producing approximately 28,000 tonnes per year in plastic waste,
often in regions without formal waste disposal facilities (Wardrop et al., 2017).
Box 5: Can Water Markets Deliver Environmental Outcomes? The conservation community has been using water markets to address environmental needs for decades, with a focus on keeping water in rivers and wetlands in the arid Western United States, Spain and Australia. In many places, water has been diverted for use by agriculture, mining and growing cities, leaving rivers, streams and wetlands with little or no water. By acquiring water rights through markets, conservation groups can re-dedicate the water to natural systems, enhancing habitat and recreation. This property-based approach is consistent with history in land acquisition by The Nature Conservancy and some other conservation organisations: securing interest in property through markets and setting it aside for conservation purposes. Of necessity, this has tended to limit environmental water acquisition to locations in which formal rights to water exist.
While the concept underlying the use of water markets for the environment is clear, the execution is complex. Many of the challenges are consistent with those facing water markets broadly: variable hydrology, complex water rights, murky legal authority, and cumbersome process. Environmental water acquisitions face an additional challenge, in that in many places water rights, even if legally acquired, cannot be dedicated to environmental purposes and protected from downstream diversion.
Nonetheless, market-oriented transactions for environmental water have flourished over the last 30 years, evolving from simple two-party agreements to acquire a single water right into basin-wide approaches that engage diverse players (cites, agriculture, recreation and environment), use a variety of market-based mechanisms (acquisitions, leases, options), and achieve multiple objectives (habitat, water quality, recreation, reliability). As Kendy et al. observed, “these efforts have achieved large-scale successes by embedding restoration goals with broader, multi-stakeholder water-sharing agreements to address shared water scarcity risks” (Kendy et al., 2018). These approaches have been widely used in the Western United States, and The Nature Conservancy has evaluated potential water market applications in Australia, Chile, and other arid places around the world.
Environmental groups also acknowledge the limitations (and potential perils) of markets. Among them are: a pure market can neglect the environment, and conservation groups may not have sufficient funds to acquire water needed for environmental purposes; if water markets shift water from agriculture, there could be inadvertent impacts to environmental resources (as well as local impacts to food production); and some communities and cultures are not receptive to treating water as a private, market good. These risks underscore the need for thoughtful structuring of markets that considers the environment and other under-represented sectors. It also highlights the opportunity to ‘nudge’ informal markets toward more sustainable outcomes by supporting institutional strengthening and governance structures to offer participants incentives for conservation.
(Source: Iseman, 2018)

37
Q5: Would regulation improve performance of informal markets?
Informal markets occupy a position often seen as ‘beyond the reach of regulation’ (Gerlach and
Francey 2010). By definition, informal markets operate with limited, if any, regulation. Concerns
about monopolistic pricing, poor water quality and unsustainable extractions have triggered calls for
the informal sector to be regulated to address price, quality, and water resource abstraction,
respectively. In regions with agricultural and intersectoral trading, licencing and trading rules also
address water resource abstraction and third-party effects associated with the buying and selling of
source water (i.e. bulk water supplies).
Where informal markets operate in monopolistic or oligopolistic settings the suppliers will charge
prices as high as the market will withstand – though at times the price set may be tempered by social
norms and community pressures. In such circumstances it is tempting to suggest that regulation of
either prices or entry conditions is needed to protect consumers from the extortionary powers of
water vendors.
As in other contexts of market power, there is little doubt that regulations to protect consumers
would be highly desirable in circumstances where they can be adequately enforced. In most poor and
many developing country settings however, a key concern is whether regulations can in fact be
enforced. In these contexts, the benefits of regulating informal markets need to be balanced with the
costs of doing so, including the enforcement burden. In cases where compliance is imperfect and
corruption prevails – stricter regulations simply create opportunities for rent extraction (bribery) and
may have very limited impact on outcomes.
Recognizing these limits might suggest the need for targeted and differentiated policy approaches. In
circumstances where enforcement is feasible and monopolies are prevalent, stricter regulations would
be desirable for consumers. But in low compliance regimes, recognizing the limits of effective
regulation might suggest the need for other approaches to tackle market failures. For instance,
interventions could take the form of lowering entry barriers, creating alternative sources of supply
(perhaps a public utility tanker), providing information on prices charged, promoting consumer
associations to counter the market power of sellers, or increasing information and consumer feedback.
Evidence
Informal markets face limited regulation by definition. However, contrary to perceptions of
lawlessness and mafia control, informal markets are frequently subject to some forms of regulation.
The most common form includes registration of informal vendors with the water regulator or
licencing as a business. For example, proposed legislation in Turkana County (Kenya) will require
vendors serving greater than 25m3/day for domestic purposes to secure a permit. In Tanzania,
vendors are required to secure business licenses. In a non-representative survey of small-scale

38
service providers in Bangladesh, Cambodia, Kenya and Philippines, a majority reported holding some
form of licence or registration (Baker 2009). Ninety percent of mobile water distributors held a
permit for water sales, while many also held permits for water abstraction or transport. Over 80%
of tanker trucks held business licenses with only hand carters lagging this trend (Baker 2009).
The experience in Yemen shows that providing incentives for registration is crucial. UNICEF is
refurbishing tanker trucks for free in Sana’a city in exchange for the tanker owners agreeing to
register with them. The tanks are painted a distinctive blue colour with the logos of UNICEF, the
Ministry of Water and Environment and NWRA – the water regulator – on them. This signals to
customers that the trucks are in compliance and the water is of good quality, although the long-term
effectiveness is unclear.
It is unclear, however, how many informal vendors comply with such requirements. Large-scale
vendors may be more likely to register and operate as legitimate businesses than smaller ones,
posing concerns for the poor who may depend disproportionately on smaller-scale vendors. In the
sachet markets of Ghana, for example, the barriers to entry are so low that smaller vendors can
evade regulation through a ‘cat-and-mouse’ game due to their mobility, lack of machinery and ability
to switch mobile phone SIM cards when pursued by authorities (Stoler et al., 2012).
Beyond registration and licencing, there are four key arenas: price regulation, reducing barriers to
entry (which can create tensions with drives to increase licensing requirements), assuring water
quality (Question 3) and maintaining resource availability (Question 4).
Price regulation seeks to thwart monopolistic pricing and address pro-poor objectives, including
affordability. These efforts have centred on the establishment of tariff schedules that specify the
price of bulk water paid by informal vendors and restrict the price vendors can charge end users.
Fixed resale prices have also been attempted in multiple locations, including Jordan, Tanzania and
Zambia. In the case of Zambia, private vendors have operated public kiosks under contract with the
public utility and are bound by tariff structures set by regulation. Similar models have been
developed in Kenya. Even when contracts have been arranged between water utilities and vendors
on a set resale price, however, the actual resale price has been shown to be higher (Collignon and
Vezina 2000, Uwazi 2010). This is illustrated by Dar Es Salaam, where vendors charged Tshs 50 for
a 20-litre container despite tariff regulation to cap rates at Tshs 20. This is predictable. If price is
capped below the market clearing level, those consumers who remain unserved (at the regulated
price) can be charged higher prices in the “shadow” market that will inevitably emerge when there is
unmet demand. In fact, the significant reviews of urban water markets all focus on regulations that
increase price transparency (rather than regulating prices directly) to help empower consumers
(Kjellén and McGranahan, 2006, Keener et al., 2010, Collignon and Vézina, 2000, Solo, 2003).
39
Regulations also seek to foster competition by limiting barriers to entry. Informal vendors may face
limited regulatory barriers to entry due to the low enforcement of registration and licencing
requirements in many locations. However, businesses without licences cannot access low-interest
loans, which increases costs that are subsequently passed on to consumers. In other cases, small-
scale service providers are prohibited: until recently, private concessionaires in Manila and Jakarta
held exclusive rights to deliver water within a given service area, which imposes a barrier to entry
and precludes small-scale providers from competing or addressing gaps.
A 2006 survey of small-scale service providers in Bangladesh, the Philippines, Kenya and Cambodia
identified the prevalence of a series of challenges and business constraints; respondents cited a
number of factors linked with a weak or inconsistent regulatory environment. Over 40% of purified
water sellers in the Philippines cited poor government sector policies as a severe problem; over
one-third of informal vendors in Kenya and Bangladesh complained of problems associated with the
public utility linked to pricing, availability and corruption. In a multi-country study across Latin
America, Solo highlighted the problem of failed regulations, particularly service area restrictions and
inappropriate tariffs which failed to protect customers, but limited new entrants and stymied
competitive forces (Solo, 2003).
In the regulatory vacuum, self-regulation by vendor associations, norms and social capital address
price and barriers to entry. In many locations, the poor, hospitals, schools and religious groups
receive free or cheap water from source owners in the informal sector, as illustrated by Dar Es
Salaam and Kathmandu. In the latter, 87% of source water owners offered free water to the local
communities; such measures reflect efforts by source owners to secure and maintain their social and
legal licence to operate, as local permission is required to drill boreholes (Kathmandu case). Other
examples include norms of reciprocity as vendors see consumers as neighbours (Zuin et al. 2014).
The associated norms of reciprocity can ensure pricing is at or below market clearing levels; but it
can also cut both ways, as vendors demand loyalty and will cut off consumers who buy from another
vendor (Wutich et al 2016). And as noted above, a shadow market may emerge where unserved or
under-served customers are forced to pay higher prices. In other cases, such as Luanda, social
capital has led vendors to contribute to wider infrastructure services and to charge prices based
only on cost recovery even when demand may allow higher rates (Cain 2014).
However, evidence is also emerging of price discrimination. In Nairobi, nearly one quarter of tap
water vendors and private borehole vendors set prices based on their estimates of what the
customer could pay (Hailu et al., 2011). In Kisumu, Sima et al. (2013) found that price variation could
not be explained by need alone, and was likely to be highest in areas where customers could afford
the higher prices.

40
The difficulties associated with regulating price and barriers to entry have led to several
recommendations for policy and informational interventions to promote transparency of price
information and empower consumers to make informed choices regarding their water sources and
point-of-use treatment options. Efforts to regulate quality [Question 3] and water resource
abstraction [Question 4] have proven more challenging.
The path forward
It is nearly fifty years since Drawers of Water exposed the complexities of water use and water
sources in Eastern Africa, identifying the entrepreneurial roles played by vendors in urban and rural
sites. Informal water markets have since proliferated – and persisted – amidst urban
transformations across the global south.
Over the past 10 years, several studies have illustrated how informal water markets can be a force
for good and bad. They have also shown that formal and informal systems can be complementary,
but also come into conflict. The path forward requires an improved understanding of informal
markets to guide whether and how to regulate or intervene in the market, as well as opportunities
to integrate small-scale private water service providers as an off-grid component of the water supply
system.
This concluding section considers two questions:
What characteristics of informal water markets should be monitored, and how?
Which policy tools and informational interventions can improve outcomes?
Monitoring priorities. Monitoring of informal vending is patchy, inconsistent and may prove risky
for the researcher and the participants in the market. Although aspects of informal vending are
plainly visible, basic data on vendors and consumers, volume, prices, profitability and water quality
are not. Opryszko and colleagues (2009) identified key priorities for research and policy related to
water quality, hygiene promotion, health outcomes, community perceptions, financing, pricing and
demand, costs and market structure, and the water quantity impacts. The recognition of water
vending as a potential ‘improved source’ of water under the joint monitoring programme of the
WHO and UNICEF in 2017 adds urgency to fill these gaps by identifying the conditions and contexts
where vended water is safe and affordable. Doing so requires low cost monitoring of key attributes
at a sufficient spatial and temporal resolution to pick out the trends relevant for different research
questions, policy choices and planning decisions.
The review suggests that monitoring should prioritise metrics that:
Measure participation (of vendors and consumers) and its drivers;
Map the supply chain and vending network (from source to storage);

41
Assess competitiveness (profitability, price and vendor organisation); and
Monitor impacts on water quality, sustainability, and the poor.
Addressing these priorities requires a census and survey of vendors and consumers. First,
participation captures the types and number of vendors and consumers, including an understanding
of the proportion of sampled populations relying on vended water for some portion of its water
supply. It also requires surveys to understand the determinants of participation, particularly the
factors driving consumption. Second, information regarding the vending network illustrates the flow
of water and money through the supply chain: the volume of water and financial flows associated
with distinct water source, distributing vendors, and water packaging and purification. It also
identifies the spatial extent of vending activity, which can be compared and understood in relation to
the piped water system to assess complementarity beyond the boundaries of existing water lines, as
well as overlaps where demand for vended water is driven by unreliable or poor quality water.
Understanding the structure and competitiveness of informal markets can identify where pricing is
driven by market power and more likely to exploit the poor. It can also pinpoint priorities for
extending formal systems where unmet demand is greatest. Third, assessing competitiveness
requires information regarding profitability, vendor organisation and interactions between vendors
and the water utility. This involves data on the cost, revenue and profitability of vended water, as
well as the level of cooperation between vendors in price-setting. Gaining such information requires
observations of vendors and their cooperation with data collection given the sensitivities and grey
legal area. In such conditions, it is important to establish trust and provide incentives to encourage
vendors to supply such information. Vendors need to see such information as part of a legitimate
business operation and can also use such information to reduce their own costs by better
understanding the market.
The impacts of water vending on water quality, sustainability and poverty are essentially uncharted
due to conceptual and measurement problems. Water quality involves both perceptions and
observations of changes from source to storage. Monitoring water quality is expensive which
requires priorities regarding the types of contaminants, sampling and monitoring of water quality
across the supply chain. Ongoing work in Ghana, Ethiopia and Tanzania compares perceptions of
water quality with testing to understand how water quality varies along the supply chain and how it
compares with alternative water sources. Systematic approaches to surveying consumers, spot
inspection and water quality monitoring can identify what drives demand for vended water, how
water affects public health risks, and different strategies for testing and treatment to mitigate risks.
Given the substantial proportion of water supplied by informal means (approximately 20-25% in
some large cities of Asia), a greater understanding of the cumulative impacts of informal vending on
water resource sustainability is needed. Information on water resource sustainability is needed to

42
understand how water supply impacts on groundwater depletion, including the impacts on local
agricultural, peri-urban and ecosystem water needs in the source regions. Such data are important
in arid and semi-arid regions, as are tracking the volume of water extracted at each source, changes
in water levels and the impact of vending on competition between water users in the source region.
Metrics and methodology. Existing studies exhibit wide variation in measurement and sampling
approaches. Key questions include: (i) how to ensure a representative sample, (ii) the frequency of
monitoring and (iii) the accuracy and reliability of data gathered through surveys (given the sensitive
nature of the information and recall challenges) and water quality monitoring. Representative
samples are needed for cross-sectional comparisons while time-series data allow tracking over time
to examine a series of factors influencing demand (climate variability and extremes, changes in
coverage by piped systems). The sampling strategy in Kathmandu in 2001 and 2015 illustrates the
importance of accounting for differences in socioeconomic characteristics and access to piped
supplies across neighbourhoods.
The rapid social, economic, and environmental changes in regions with vended water suggest that
much greater attention is needed to the dynamics of informal markets and their interaction with
formal systems. The frequency of monitoring will vary according to policy and planning decisions,
ranging from continuous and daily monitoring in regions experiencing episodic disruptions to
coverage or quality, to situations where periodic benchmarking is needed to examine how vending
varies in relation to changing infrastructure networks, urbanisation patterns or socioeconomic
conditions.
A more standardized and coherent framework for monitoring raises opportunities to leverage and
integrate vending into wider development of nationally representative surveys, impact evaluations
and associated data systems established for the SDGs.
Policy responses. The case for regulating informal markets has focussed on price, quality and, in a
water-scarce region, groundwater sustainability. In regions with sufficient capacity for regulation and
enforcement, regulations provide a framework for promoting competition among vendors, water
quality standards and water abstraction licencing. Competition can spur reductions in costs and
innovation that can be passed on to consumers; regulatory strategies for spurring competition
include licencing, bulk water agreements, and the reduction of barriers for vending enterprises to
become legitimate businesses and gain access to financing. In other cases, well intentioned
regulations to promote competition through standards of service and pricing may erect new barriers
to entry that arbitrarily filter out credible vending enterprises and create a regulatory burden for
businesses and resource constrained agencies. Therefore, the benefits of regulation need to be

43
weighed against the costs for vendors and enforcement agencies, as well as the unintended
consequences and perverse incentives (Gerlach and Franceys 2010).
Informal water markets therefore present a paradox. Effective regulation requires institutional
capacity, yet informal vendors exist precisely because such capacity, and the underpinning
information to guide regulation, are sorely lacking, particularly in contexts of fragility, conflict and
violence. The case for regulation is more tenuous in such settings. In the worst case, poorly
designed regulation can exacerbate the problems by worsening corruption and pushing vending
further to the peripheries. Such conditions can lead to perverse incentives for vendors to sabotage
formal water systems by destroying infrastructure or poaching consumers.
In this context, the range of potential interventions has expanded beyond regulation (Baker et al,
2009), highlighting informational interventions that can ‘nudge’ informal markets to improved
outcomes and create the data and information base to guide consumers, vendors and regulators.
The main tools and approaches can be considered in two categories (Table 3): enabling or regulating
vendors versus empowering consumers. The appropriate options will depend on several factors,
particularly when considering regulatory options in the context of fragile states, corruption or
limited institutional capacity. Hence the first step in identifying the appropriate tools involves
diagnosing the regulatory capacity and information base for interventions. In situations of perfect
regulation with enforcement capacity, the objective is to promote efficiency by reducing barriers to
entry and fostering competition, whilst regulating quality and sustainability. Conversely, when states
fail, information and treatment interventions can empower consumers to cope with the sub-optimal
outcomes.
Permitting and licencing allow vendors to operate legitimate businesses. Legitimation and associated
efforts to create an enabling environment for vending enterprises can increase access to credit and
business development support. These steps contribute to the professionalization of water vending
and the potential for vendors associations to self-regulate pricing and quality, increase access to
financing and establish a point of contact for vendors to negotiate and cooperate with water utilities.
In some circumstances the presence of an alternative supplier may even spur the utility to improve
its performance – though this cannot be assured where there is an expectation of subsidies and
bailouts. Consumer information campaigns can enhance transparency regarding water sources,
quality and prices, whilst different low cost treatment can equip consumers to safeguard their
supplies when state capacity for regulation is limited.

44
Table 3. Toolkit for improving the performance of informal water markets
Capacity Strong rule of law Fragile state
Objective Enabling or regulating vendors Informing and empowering consumers
Intervention Regulate quality and sustainability
Foster competition
Inform consumers about quality, price
Low-cost treatment options
Potential
tools
Regulation of price
Regulation of quality
Spot inspection of water
quality
Licencing and legitimation
Enabling vending enterprises
Fostering self-regulation
through vendors’ associations
Establishing public-private
partnerships
Enhancing transparency and
consumer information
Increasing low-cost treatment
options at the point of use
Point-of-use treatment
Lowering barriers to entry by
enabling household resale
Enabling vending enterprises as
an accepted and legitimate means
of water supply

45
References
ABU-LOHOM, N. M., KONISHI, Y., MUMSSEN, Y., ZABARA, B. & MOORE, S. M. 2018. Water
supply in a war zone: A preliminary analysis of two urban water tanker supply systems in the Republic of Yemen (English). Water Policy [in press].
ADEKALU, K. O., OSUNBITAN, J. A. & OJO, O. E. 2002. Water sources and demand in South
Western Nigeria: implications for water development planners and scientists. Technovation,
22, 799-805.
AHLERS, R., SCHWARTZ, K. & PEREZ GUIDA, V. 2013. The myth of ‘healthy’ competition in the
water sector: The case of small scale water providers. Habitat International, 38, 175-182.
ANGUELETOU-MARTEAU, A. 2007. Informal water suppliers meeting water needs in the peri-
urban areas of Mumbai, India. Grenoble, France: Laboratoire d'Economie de la Production et
de l'Integration Internationale (LEPII).
BAISA, B., DAVIS, L. W., SALANT, S. W. & WILCOX, W. 2010. The welfare costs of unreliable
water service. Journal of Development Economics, 92, 1-12.
BAKKER, K., KOOY, M., SHOFIANI, N. E. & MARTIJN, E.-J. 2008. Governance Failure: Rethinking
the Institutional Dimensions of Urban Water Supply to Poor Households. World
Development, 36, 1891–1915.
BAYLISS, K. & TUKAI, R. 2011. Services and supply chains: The role of the domestic private sector
in water service delivery in Tanzania. New York, NY: United Nations Development
Programme.
BIRKMANN, J., WELLE, T., SOLECKI, W., LWASA, S. & GARSCHAGEN, M. 2016. Boost resilience
of small and mid-sized cities. Nature News, 537, 605.
BRISCOE, J. 1985. Water Supply and Sanitation in the Health Sector in the Asia Region: Information
Needs and Program Priorities.
CAIN, A. 2018. Informal water markets and community management in peri-urban Luanda, Angola.
Water International, 43, 205-216.
CAIRNCROSS, S. & KINNEAR, J. 1991. Water vending in urban Sudan. Water Resources
Development, 7, 267-273.
COLLIGNON, B. & VÉZINA, M. 2000. Independent Water and Sanitation Providers in African
Cities: Full Report of a Ten-Country Study. Washington D.C.: UNDP-World Bank Water
and Sanitation Program.
DE STEFANO, L. & HERNÁNDEZ-MORA, N. 2016. Los mercados informales de aguas en España:
una visión de conjunto ('Informal water markets in Spain: an overview' English translation by
L. De Stefano). In: GÓMEZ-LIMÓN, J. A. & CALATRAVA, J. (eds.) Los mercados de agua en
España: presente y perspectivas. Spain: Cajamar Caja Rural.
FASS, S. 1988. Political Economy in Haiti: the Drama of Survival, New Brunswick, USA, Transaction
Publishers.
GERLACH, E. & FRANCEYS, R. 2009. Regulating water services for the poor: The case of Amman.
Geoforum, 40, 431-441.
HAILU, D., RENDTORFF-SMITH, S. & TSUKADA, R. 2011. Small-Scale Water Providers in Kenya:
Pioneers or Predators? New York, NY: UNDP.
HAWKINS, G. 2017. The impacts of bottled water: an analysis of bottled water markets and their
interactions with tap water provision. WIREs Water, 4, 10.1002/wat2.1203.
KARIUKI, M. & SCHWARTZ, J. 2005. Small Scale Private Service Providers of Water Supply and
Electricity: A Review of Incidence, Structure, Pricing and Operating Characteristics
Washington, D.C.: The World Bank.
KEENER, S., LUENGO, M. & BANERJEE, S. 2010. Provision of Water to the Poor in Africa:
Experience with Water Standposts and the Informal Water Sector. Washington, D.C.: The
World Bank.
KENDY, E., AYLWARD, B., ZIEMER, L. S., RICHTER, B. D., COLBY, B. G., GRANTHAM, T. E.,
SANCHEZ, L., DICHARRY, W. B., POWELL, E. M. & MARTIN, S. 2018. Water Transactions
for Streamflow Restoration, Water Supply Reliability, and Rural Economic Vitality in the
46
Western United States. JAWRA Journal of the American Water Resources Association, 54, 487-
504.
KJELLÉN, M. 2000. Complementary Water Systems in Dar es Salaam, Tanzania: The Case of Water
Vending. International Journal of Water Resources Development, 16, 143-154.
KJELLÉN, M. & MCGRANAHAN, G. 2006. Informal Water Vendors and the Urban Poor. London,
UK: International Institute for Environment and Development.
LARSEN, T. A., HOFFMANN, S., LÜTHI, C., TRUFFER, B. & MAURER, M. 2016. Emerging solutions
to the water challenges of an urbanizing world. Science, 352, 928-933.
MOLLE, F., MAMANPOUSH, A. & MIRANZADEH, M. 2004. Robbing Yadullah’s Water to Irrigate
Saeid’s Garden: Hydrology and Water Rights in a Village of Central Iran. Colombo, Sri
Lanka: International Water Management Institute.
MUKHERJI, A. 2008. Spatio-temporal analysis of markets for groundwater irrigation services in India:
1976–1977 to 1997–1998. Hydrogeology Journal, 16, 1077–1087.
OLAJUYIGBE, A. E., ROTOWA, O. O. & ADEWUMI, I. J. 2012. Water Vending in Nigeria - A Case
Study of Festac Town, Lagos, Nigeria. Mediterranean Journal of Social Sciences, 3, 229-239.
OPRYSZKO, M. C., HUANG, H., SODERLUND, K. & SCHWAB, K. J. 2009. Data gaps in evidence-
based research on small water enterprises in developing countries. Journal of Water and
Health, 7, 609-622.
RAINA, A., ZHAO, J., KUNWAR, L., CHEN, Y. J., WHITTINGTON, D. & WU, X. 2018. The
Structure of Water Vending Markets in Kathmandu, Nepal. Water Policy [in press].
RANGANATHAN, M. 2016. Rethinking Urban Water (In)formality. In: CONCA, K. & WEINTHAL,
E. (eds.) The Oxford Handbook of Water Politics and Policy. Oxford Handbooks Online: Oxford
University Press.
SALIBA, B. & BUSH, D. B. 1987. Water markets in theory and practice: market transfers, water values,
and public policy, Westview Press.
SHAH, T. & CHOWDHURY, S. D. 2017. Farm Power Policies and Groundwater Markets:
Contrasting Gujarat with West Bengal (1990–2015). Economic and Political Weekly, LII, 39-47.
SIMA, L. C., KELNER-LEVINE, E., ECKELMAN, M. J., MCCARTY, K. M. & ELIMELECH, M. 2013.
Water flows, energy demand, and market analysis of the informal water sector in Kisumu,
Kenya. Ecological Economics, 87, 137–144.
SOLO, T. M. 1999. Small-scale entrepreneurs in the urban water and sanitation market. Environment
and Urbanization, 11, 117-132.
SOLO, T. M. 2003. Independent Water Entrepreneurs in Latin America: The other private sector in
water services. Washington, D.C.: The World Bank.
STOLER, J. 2017. From curiosity to commodity: a review of the evolution of sachet drinking water
in West Africa. WIREs Water, 4, e1206. STOLER, J., FINK, G., WEEKS, J. R., OTOO, R. A., AMPOFO, J. A. & HILL, A. G. 2012. When urban
taps run dry: Sachet water consumption and health effects in low income neighborhoods of
Accra, Ghana. Health Place, 18, 250–262.
STOLER, J., TUTU, R. A., AHMED, H., FRIMPONG, L. A. & BELLO, M. 2014. Sachet Water Quality
and Brand Reputation in Two Low-Income Urban Communities in Greater Accra, Ghana.
The American Journal of Tropical Medicine and Hygiene, 90, 272-278.
THOMPSON, J. 2001. Drawers of water II: 30 years of change in domestic water use & environmental
health in east Africa. Summary, Iied.
VENKATACHALAM, L. 2015. Informal water markets and willingness to pay for water: a case study
of the urban poor in Chennai City, India. International Journal of Water Resources Development,
31, 134-145.
WARDROP, N. A., DZODZOMENYO, M., ARYEETEY, G., HILL, A. G., BAIN, R. E. & WRIGHT, J.
2017. Estimation of packaged water consumption and associated plastic waste production
from household budget surveys. Environmental Research Letters, 12, 074029.
WHITE, G. F., BRADLEY, D. J. & WHITE, A. U. 1972. Drawers of water. Domestic water use in East
Africa. Drawers of water. Domestic water use in East Africa.
WHITTINGTON, D., LAURIA, D. T. & MU, X. 1991. A Study of Water Vending and Willingness to
Pay for Water in Onitsha, Nigeria. World Development, 19, 179-198.

47
WHITTINGTON, D., LAURIA, D. T., OKUN, D. A. & MU, X. 1989. Water vending activities in
developing countries: A case study of Ukunda, Kenya. International Journal of Water Resources
Development, 5, 158-168.
WUTICH, A., BERESFORD, M. & CARVAJAL, C. 2016. Can Informal Water Vendors Deliver on the
Promise of A Human Right to Water? Results From Cochabamba, Bolivia. World
Development, 79, 14-24.
YOUNGSTEDT, S. M., KEOUGH, S. B. & IDRISSA, C. 2016. Water Vendors in Niamey: Considering
the Economic and Symbolic Nature of Water. African Studies Quarterly, 16, 27-46.
ZAROFF, B. & OKUN, D. A. 1984. Water vending in developing countries. Aqua 5, 289-295.
ZUIN, V., ORTOLANO, L., ALVARINHO, M., RUSSEL, K., THEBO, A., MUXIMPUA, O. & DAVIS, J.
2011. Water supply services for Africa’s urban poor: the role of resale. Journal of Water and
Health, 9, 773-784.
ZUIN, V., ORTOLANO, L. & DAVIS, J. 2014. The entrepreneurship myth in small-scale service
provision: Water resale in Maputo, Mozambique. Journal of Water, Sanitation and Hygiene for Development, 4, 281-292.
Related Documents