School of Industrial Design, Faculty of the Built Environment The University of New South Wales, NSW, Australia March, 2013 Informal e-waste recycling in China An investigation into informal e-waste recycling and households’ disposal behaviour in China Xian Li A thesis submitted in fulfillment of the requirements for the degree of Doctor of Philosophy

Welcome message from author
This document is posted to help you gain knowledge. Please leave a comment to let me know what you think about it! Share it to your friends and learn new things together.
Transcript
School of Industrial Design, Faculty of the Built Environment The University of New South Wales, NSW, Australia
March, 2013
Informal e-waste recycling in China
An investigation into informal e-waste recycling
and households’ disposal behaviour in China
Xian Li
A thesis submitted in fulfillment of the requirements for the
degree of Doctor of Philosophy
PLEASE TYPE THE UNIVERSITY OF NEW SOUTH WALES
Thesis/Dissertation Sheet Surname or Family name: Li
First name: Xian
Other name/s:
Abbreviation for degree as given in the University calendar: PhD
School: Industrial Design
Faculty: Faculty of Built Environment
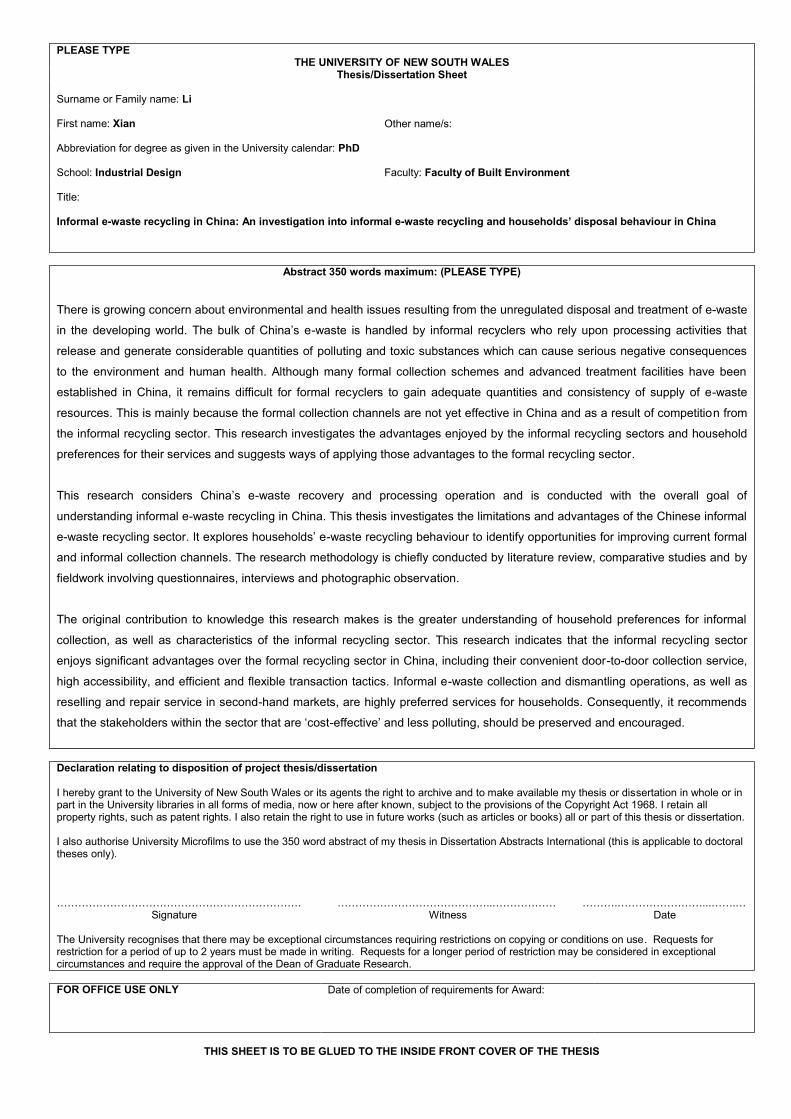
Title: Informal e-waste recycling in China: An investigation into informal e-waste recycling and households’ disposal behaviour in China
Abstract 350 words maximum: (PLEASE TYPE)
There is growing concern about environmental and health issues resulting from the unregulated disposal and treatment of e-waste
in the developing world. The bulk of China’s e-waste is handled by informal recyclers who rely upon processing activities that
release and generate considerable quantities of polluting and toxic substances which can cause serious negative consequences
to the environment and human health. Although many formal collection schemes and advanced treatment facilities have been
established in China, it remains difficult for formal recyclers to gain adequate quantities and consistency of supply of e-waste
resources. This is mainly because the formal collection channels are not yet effective in China and as a result of competition from
the informal recycling sector. This research investigates the advantages enjoyed by the informal recycling sectors and household
preferences for their services and suggests ways of applying those advantages to the formal recycling sector.
This research considers China’s e-waste recovery and processing operation and is conducted with the overall goal of
understanding informal e-waste recycling in China. This thesis investigates the limitations and advantages of the Chinese informal
e-waste recycling sector. It explores households’ e-waste recycling behaviour to identify opportunities for improving current formal
and informal collection channels. The research methodology is chiefly conducted by literature review, comparative studies and by
fieldwork involving questionnaires, interviews and photographic observation.
The original contribution to knowledge this research makes is the greater understanding of household preferences for informal
collection, as well as characteristics of the informal recycling sector. This research indicates that the informal recycling sector
enjoys significant advantages over the formal recycling sector in China, including their convenient door-to-door collection service,
high accessibility, and efficient and flexible transaction tactics. Informal e-waste collection and dismantling operations, as well as
reselling and repair service in second-hand markets, are highly preferred services for households. Consequently, it recommends
that the stakeholders within the sector that are ‘cost-effective’ and less polluting, should be preserved and encouraged. Declaration relating to disposition of project thesis/dissertation I hereby grant to the University of New South Wales or its agents the right to archive and to make available my thesis or dissertation in whole or in part in the University libraries in all forms of media, now or here after known, subject to the provisions of the Copyright Act 1968. I retain all property rights, such as patent rights. I also retain the right to use in future works (such as articles or books) all or part of this thesis or dissertation. I also authorise University Microfilms to use the 350 word abstract of my thesis in Dissertation Abstracts International (this is applicable to doctoral theses only). …………………………………………………………… Signature
……………………………………..……………… Witness
……….……………………...…….… Date
The University recognises that there may be exceptional circumstances requiring restrictions on copying or conditions on use. Requests for restriction for a period of up to 2 years must be made in writing. Requests for a longer period of restriction may be considered in exceptional circumstances and require the approval of the Dean of Graduate Research. FOR OFFICE USE ONLY
Date of completion of requirements for Award:
THIS SHEET IS TO BE GLUED TO THE INSIDE FRONT COVER OF THE THESIS
II
Acknowledgements
No one walks alone on the journey of life. This research would not have been possible
without the support of many people. It is now my opportunity to express my gratitude
to all of them who provided great assistance, support and encouragement.
First and foremost, I would like to thank my supervisor Dr. Miles Park, who enlightened
me with such a meaningful research topic. His critical comments were essential to
frame and improve this research. In addition, I would like to thank my supervisor Assoc.
Prof. Oya Demirbilek whose constant academic guidance and warm encouragement
were a crucial motivator. In addition, a big thanks to the assistance of my editor Dr.
John Blair, who improved my work to a fine piece of writing and supported me with his
professional opinion and enthusiastic friendliness. I also would like to thank all the
anonymous survey participants and interviewees involved in my research.
To my friends at FBE, especially Vivien, Wenjie, Andrea Wechsler, Eveline Mussi,
Prajakta, Gabriele Lobaccaro, Jamie and Bo, I am grateful for your persistent friendship
and various supports. Thanks Suzie Scandurra, your patience and thoughtful help
always offer a ray of sunshine for my research life. In addition, I would like to thank my
best friends Eric and Dr. Wenmin, who help me to cope with stress and overcome
difficulties in my darker moments.
I would not have been able to complete this without the love and support of my family.
I must especially thank my parents and in-laws, who helped me with my hyperactive
son while I was overseas. Your time and efforts allowed me to dedicate sufficient time
to carry out this research. Also thanks to my wonderful son, Yihong. It was you who

III
was my motivation to accomplish this dissertation on time. In particular, I am truly
grateful to my beloved husband, Sheng, who scarified his career and accompanied me
for the last four years, supporting me with everything he has. Your passion of life, your
love and inspiration helped a mother get through the hardest of times.
Xian Li
March 2013
V
ORIGINALITY STATEMENT
‘I hereby declare that this submission is my own work and to the best of my knowledge it
contains no materials previously published or written by another person, or substantial
proportions of material which have been accepted for the award of any other degree or
diploma at UNSW or any other educational institution, except where due acknowledgement is
made in the thesis. Any contribution made to the research by others, with whom I have
worked at UNSW or elsewhere, is explicitly acknowledged in the thesis. I also declare that the
intellectual content of this thesis is the product of my own work, except to the extent that
assistance from others in the project's design and conception or in style, presentation and
linguistic expression is acknowledged.’
Signed ……………………………………………..............
Date ……………………………………………..............
COPYRIGHT STATEMENT
‘I hereby grant the University of New South Wales or its agents the right to archive and to make available my thesis or dissertation in whole or part in the University libraries in all forms of media, now or here after known, subject to the provisions of the Copyright Act 1968. I retain all proprietary rights, such as patent rights. I also retain the right to use in future works (such as articles or books) all or part of this thesis or dissertation. I also authorise University Microfilms to use the 350 word abstract of my thesis in Dissertation Abstract International (this is applicable to doctoral theses only). I have either used no substantial portions of copyright material in my thesis or I have obtained permission to use copyright material; where permission has not been granted I have applied/will apply for a partial restriction of the digital copy of my thesis or dissertation.'
Signed ……………………………………………...........................
Date ……………………………………………...........................
AUTHENTICITY STATEMENT
‘I certify that the Library deposit digital copy is a direct equivalent of the final officially approved version of my thesis. No emendation of content has occurred and if there are any minor variations in formatting, they are the result of the conversion to digital format.’
Signed ……………………………………………...........................
Date ……………………………………………...........................
Publications
Xian Li, Miles Park, and Oya Demirbilek, "Informal WEEE Recycling in China: A Field
Study of Stakeholders in Tianjin," International Journal of Environmental Science and
Development, vol. 3, no. 5, pp. 422-426, 2012.
Li, Xian, Miles Park, and Oya Demirbilek. "Comparison of Informal and Regulated WEEE
Collection Methods in China." 2012 International Conference on Environmental,
Biomedical and Biotechnology, IPCBEE vol.41, Singapore.
Li, Xian, Miles Park, and Oya Demirbilek. “The Significance of the Informal Waste of
Electronic and Electrical Equipment Collection Infrastructure in China: A Case Study in
Tianjin”, Ninth International Conference on Environmental, Cultural, Economic and
Social Sustainability, Hiroshima, Japan, 2013
VI
Abstract
There is growing concern about environmental and health issues resulting from the
unregulated disposal and treatment of e-waste in the developing world. The bulk of China’s e-
waste is handled by informal recyclers who rely upon processing activities that release and
generate considerable quantities of polluting and toxic substances which can cause serious
negative consequences to the environment and human health. Although many formal
collection schemes and advanced treatment facilities have been established in China, it
remains difficult for formal recyclers to gain adequate quantities and consistency of supply of
e-waste resources. This is mainly because the formal collection channels are not yet effective
in China and as a result of competition from the informal recycling sector. This research
investigates the advantages enjoyed by the informal recycling sectors and household
preferences for their services and suggests ways of applying those advantages to the formal
recycling sector.
This research considers China’s e-waste recovery and processing operation and is conducted
with the overall goal of understanding informal e-waste recycling in China. This thesis
investigates the limitations and advantages of the Chinese informal e-waste recycling sector. It
explores households’ e-waste recycling behaviour to identify opportunities for improving
current formal and informal collection channels. The research methodology is chiefly
conducted by literature review, comparative studies and by fieldwork involving questionnaires,
interviews and photographic observation.
The original contribution to knowledge this research makes is the greater understanding of
household preferences for informal collection, as well as characteristics of the informal
recycling sector. This research indicates that the informal recycling sector enjoys significant
advantages over the formal recycling sector in China, including their convenient door-to-door

VII
collection service, high accessibility, and efficient and flexible transaction tactics. Informal e-
waste collection and dismantling operations, as well as reselling and repair service in second-
hand markets, are highly preferred services for households. Consequently, it recommends that
the stakeholders within the sector that are ‘cost-effective’ and less polluting, should be
preserved and encouraged.
VIII
Table of Contents
ACKNOWLEDGEMENTS II
ABSTRACT VI
TABLE OF CONTENTS VIII
LIST OF FIGURES XII
LIST OF TABLES XVI
GLOSSARY OF ABBREVIATIONS AND ACRONYMS XVIII
CHAPTER 1: INTRODUCTION 1
1.1. OVERVIEW OF E-WASTE GENERATION AND ENVIRONMENTAL ISSUES 2
1.1.1. E-WASTE GENERATION 2
1.1.2. INFORMAL RECYCLING IN DEVELOPING COUNTRIES 3
1.1.3. ENVIRONMENTAL IMPACTS FROM E-WASTE RECYCLING 5
1.1.4. E-WASTE STREAMS FOR INFORMAL RECYCLING SECTORS IN CHINA 8
1.2. RESEARCH AIM, RESEARCH QUESTIONS AND METHODS 11
1.3. ORGANIZATION OF THE RESEARCH 14
1.4. THE STRUCTURE OF THE THESIS 15
CHAPTER 2: GLOBAL PERSPECTIVES OF E-WASTE MANAGEMENT 18
2.1. OVERVIEW OF E-WASTE AND GLOBAL STRATEGIES 18
2.1.1. DEFINITIONS, CATEGORIES AND COMPOSITION OF E-WASTE 18
2.1.2. E-WASTE GENERATION AND HANDLING 21
2.2. E-WASTE DISMANTLING AND RECYCLING 24
2.2.1. WEEE RECYCLABILITY AND HAZARDOUSNESS 24
2.2.2. THE E-WASTE RECYCLING CHAIN AND PROCESSING METHODS 26
2.2.3. STRATEGIES TO AVOID E-WASTE DISPOSAL 28
2.3. WHO IS RESPONSIBLE? - RECYCLING SYSTEMS AND MANAGEMENT IN DEVELOPED COUNTRIES 31
2.3.2. E-WASTE COLLECTION CHANNELS 32
2.3.3. PHYSICAL AND FINANCIAL INSTRUMENTS OF EPR 34
2.3.4. ECONOMIC INCENTIVES FOR PRODUCERS 35
2.3.5. WEEE MANAGEMENT IN DEVELOPING COUNTRIES 37
IX
CHAPTER 3: E-WASTE RECYCLING IN CHINA 42
3.1. FORMAL AND INFORMAL E-WASTE RECYCLING SECTORS 42
3.1.1. E-WASTE COLLECTION CHANNELS IN CHINA 42
3.1.2. STAKEHOLDERS IN INFORMAL AND FORMAL RECYCLING SYSTEMS 45
3.1.3. RECYCLING TECHNOLOGIES BY FORMAL AND INFORMAL SECTORS 47
3.1.4. COST AND PROFITS IN THE FORMAL AND INFORMAL RECYCLING SECTORS 49
3.2. OFFICIAL STRATEGIES FOR WEEE MANAGEMENT IN CHINA 52
3.2.1. LEGISLATION AND LIMITATIONS 52
3.2.2. REGULATORY INTERVENTIONS IN RURAL INFORMAL WORKSHOPS 56
3.2.3. ESTABLISHING FORMAL RECYCLING SYSTEMS IN CHINA 56
3.2.4. EFFECTIVENESS OF OFFICIAL STRATEGIES 58
CHAPTER 4: HOUSEHOLDS’ DISPOSAL OPTIONS AND THE MAIN COLLECTION CHANNELS IN
CHINA 63
4.1. CHINESE HOUSEHOLDS’ DISPOSAL OPTIONS 63
4.1.1. HOUSEHOLD DISPOSAL OPTIONS AND THEIR OBLIGATIONS IN COUNTRIES 63
4.1.1.1. Disposal options for households 63
4.1.1.2. Obligations of households 65
4.1.2. E-WASTE DISPOSAL BEHAVIOUR AND PREFERENCES BY CHINESE HOUSEHOLDS 66
4.1.3. FACTORS INFLUENCING DISPOSAL BEHAVIOUR 72
4.2. INFORMAL COLLECTION 76
4.2.1. DEVELOPMENT OF INFORMAL COLLECTORS 77
4.2.2. E-WASTE HANDLING PROCEDURES 79
4.2.3. ADVANTAGES AND LIMITATIONS OF INFORMAL COLLECTION 81
4.3. THE TRADE-IN SCHEME 82
4.3.1. DEVELOPMENT OF THE TRADE-IN SCHEME 83
4.3.2. E-WASTE HANDLING PROCEDURES 84
4.3.3. ADVANTAGES AND LIMITATIONS OF THE TRADE-IN SCHEME 86
4.3.4. SUMMARY OF THE TWO COLLECTION SYSTEMS 89
4.4. SUMMARY OF THE LITERATURE REVIEW IN THIS RESEARCH 91
CHAPTER 5: RESEARCH FRAMEWORK AND METHODOLOGY 93
5.1. RESEARCH METHODOLOGY 93
5.1.1. THEORETICAL PERSPECTIVES 93
5.1.2. RESEARCH METHODS 95
5.1.3. MIXED-METHODS RESEARCH 97
5.1.4. FIELD STUDIES AND RELEVANT METHODS 100
5.1.5. FIELD STUDIES LOCATIONS 101
5.2. FIELD STUDY A: TRANSECT WALK 104
5.2.1. RESEARCH QUESTIONS IN FIELD STUDY A 104
5.2.2. DESIGN OF TRANSECT WALK 105
5.2.3. DATA ANALYSIS 107
5.3. FIELD STUDY B: QUESTIONNAIRE AND INTERVIEW WITH HOUSEHOLDS 107
5.3.1. BEHAVIOURAL MODEL AND FOUR THEMES IN FIELD STUDY B 108
5.3.1.1. Previous research models on recycling behaviour 108
5.3.1.2. The Theory of Planned Behaviour (TPB) model 110
5.3.1.3. Adapted TPB in China 111
X
5.3.2. RESEARCH QUESTIONS IN FIELD STUDY B 114
5.3.3. QUESTIONNAIRE DESIGN 115
5.3.3.1. Targeting e-waste categories and disposal behaviour 116
5.3.3.2. Design of questionnaires 117
5.3.3.3. Distribution of questionnaire 123
5.3.3.4. Piloting the questionnaire 124
5.3.4. FOLLOW-UP INTERVIEWS AND PHOTOGRAPHICAL OBSERVATION 125
5.3.5. DATA ANALYSIS 126
CHAPTER 6: INFORMAL RECYCLING SYSTEM: RESULTS OF FIELD STUDY A 128
6.1. LOCATING INFORMAL STAKEHOLDERS 129
6.2. THE RANGE OF STAKEHOLDERS AND THEIR CHARACTERISTICS 130
6.2.1. INFORMAL DOOR-TO-DOOR COLLECTORS 130
6.2.2. REPAIR MARKETS AND SECOND-HAND SHOPS 134
6.2.3. ICT STREET TRADERS 138
6.2.4. COMPONENT SUPPLIERS 140
6.2.5. COLLECTION AND DISMANTLING CENTRES 142
6.3. COLLECTION PREFERENCES 144
6.4. CHARACTERISTICS OF INFORMAL RECYCLING SYSTEM 147
CHAPTER 7: E-WASTE DISPOSAL BEHAVIOUR OF HOUSEHOLDS 150
7.1. RESPONSE RATE 150
7.2. HOW/ BEHAVIOUR 151
7.2.1. UNDERSTANDING E-WASTE CATEGORIES 151
7.2.2. DETAILED BEHAVIOUR WITHIN THE SEVEN CATEGORIES 152
7.2.3. WHICH TYPE OF RECYCLING BEHAVIOUR IS MOST POPULAR? 156
7.3. WHY/MOTIVATION 157
7.3.1. WHY OBSOLESCENCE? 158
7.3.2. WHY TRADE/ RECYCLE? 162
7.3.2.1. Informal collectors 163
7.3.2.2. Trade-in with retailers 165
7.3.2.3. Second-hand markets and selling on-line 167
7.3.2.4. Collection sites/bins, producer take-back and formal collection companies 169
7.3.2.5. Summary: evaluation of disposal channels 172
7.3.3. WHY STOCKPILE? 173
7.3.4. WHY DUMP? 182
7.3.5. TRANSFER AND DONATION 184
7.4. ATTITUDES TO RECYCLING HOUSEHOLD BATTERIES 184
7.5. SATISFACTION AND EXPECTATIONS 187
7.5.1. SATISFACTION WITH INFORMAL COLLECTORS 187
7.5.2. EXPECTATIONS ABOUT FORMAL COLLECTION METHODS 188
7.5.3. PREFERENCES FOR WEEE COLLECTION METHODS 190
CHAPTER 8: ANALYSIS AND DISCUSSION 192
8.1. HOUSEHOLDS’ PREFERENCE FOR INFORMAL COLLECTION SERVICES 192
8.2. RECYCLING LARGE AND SMALL E-WASTE ITEMS 196
8.3. ADVANTAGES OF INFORMAL SECTOR COLLECTION AND PROCESSING 198
XI
8.3.1. VITALITY OF THE SECOND-HAND MARKETS 198
8.3.2. CLEANER COLLECTION AND DISMANTLING PROCESSES WITHIN URBAN AREAS 203
8.3.3. OTHER CONTRIBUTIONS BY INFORMAL RECYCLING 205
8.4. FACTORS THAT INFLUENCE HOUSEHOLDS’ DISPOSAL BEHAVIOUR 207
CHAPTER 9: CONCLUSIONS AND RECOMMENDATIONS 211
9.1. HOW THE RESEARCH QUESTIONS HAVE BEEN ADDRESSED 211
9.2. CONTRIBUTIONS TO KNOWLEDGE 213
9.3. LIMITATIONS OF THE RESEARCH 215
9.4. RECOMMENDATIONS 217
9.4.1. USE OF INFORMAL RECYCLING SECTORS 218
9.4.2. IMPROVING TRADE-IN SCHEME 220
9.4.3. ESTABLISHING COLLECTION FACILITIES FOR PORTABLE ELECTRONIC PRODUCTS AND HAZARDOUS WASTE
221
9.4.4. EXPLORING NEW COLLECTION CHANNELS 223
9.4.5. RAISING ENVIRONMENTAL AWARENESS 224
9.4.6. STRENGTHEN WEEE LEGISLATION AND EPR IN CHINA 225
9.5. FURTHER RESEARCH 226
REFERENCES 228
APPENDIX A1: WEEE REGULATIONS IN CHINA 246
APPENDIX A2: FIVE FINANCING MODELS AND RELEVANT ECONOMIC INSTRUMENTS FOR E-WASTE RECYCLING
SYSTEMS IN DEVELOPED COUNTRIES 247
APPENDIX A3: QUESTIONNAIRE OF E-WASTE RECYCLING BEHAVIOUR FOR HOUSEHOLD (ENGLISH VERSION)248
APPENDIX A4: QUESTIONNAIRE OF E-WASTE RECYCLING BEHAVIOUR FOR HOUSEHOLD (CHINESE
ORIGINAL VERSION) 254
APPENDIX B1: LIST OF PROPOSED INTERVIEW QUESTIONS FOR FIELD STUDY A (INFORMAL STAKEHOLDERS) 258
APPENDIX B2: SCHEDULE AND INFORMATION OF INTERVIEWERS IN FIELD STUDY B (HOUSEHOLD INTERVIEW)
259
APPENDIX B3: LIST OF PROPOSED INTERVIEW QUESTIONS FOR FIELD STUDY B (HOUSEHOLDS’
INTERVIEW) 260
APPENDIX B4: DEMOGRAPHIC COMPOSITION (N=469) 262
APPENDIX C1: APPROVAL OF ETHICS APPLICATION FOR FIELD STUDY A 263
APPENDIX C2: APPROVAL OF ETHICS APPLICATION FOR FIELD STUDY B 264
XII
List of Figures
Figure 1-1: Research design framework and chapter contents .................................................. 14
Figure 2-1: Percentages of e-waste generation by category in the EU ...................................... 20
Figure 2-2: E-waste recycling Chain ............................................................................................ 26
Figure 2-3: Priorities of the six sustainability options for WEEE recovery .................................. 28
Figure 2-4: Strategies of Eco-design along the product’s life cycle ............................................ 29
Figure 3-1: E-waste distribution and processing between urban and rural areas in China ........ 45
Figure 3-2: Relationships between e-waste recycling stakeholders in China ............................. 46
Figure 3-3: Official strategies and stakeholders involved along the formal and informal
recycling chains in China ............................................................................................................. 59
Figure 4-1: E-waste disposal behaviour by households .............................................................. 65
Figure 4-2: A typical informal door-to-door collector ................................................................. 80
Figure 4-3: Material and financial flows of the Chinese trade-in scheme .................................. 85
Figure 4-4: E-waste streams and stakeholders of current WEEE recycling systems in China..... 89
Figure 4-5: E-waste streams after the suspension of the trade-in scheme ................................ 91
Figure 5-1: The research design framework of two field studies ............................................... 99
Figure 5-2: Framework of the TPB model ................................................................................. 111
Figure 5-3: Adapted TPB model for the Chinese recycling context .......................................... 113
Figure 5-4: Four behavioural themes in the adapted TPB for guiding Field Study B ................ 114
Figure 6-1: Informal e-waste stakeholders involved in Field Study A ....................................... 129
Figure 6-2: Collectors and their small vehicles (tricycles and auto-tricycles) ........................... 132
XIII
Figure 6-3: Large vehicles for collecting a number of items ..................................................... 132
Figure 6-4: WEEE distribution following door-to-door collection ............................................ 133
Figure 6-5: Front yards selling large appliances from repair shops .......................................... 135
Figure 6-6: The street view of a second-hand market .............................................................. 135
Figure 6-7: Used mobile phones exhibited in an ICT repair shop ............................................. 136
Figure 6-8: Working environments and tools used in informal repair shops ........................... 137
Figure 6-9: Customers and the thriving second-hand markets ................................................ 137
Figure 6-10: Used products that packed and presented as new .............................................. 138
Figure 6-11: Working characteristics of the ICT street traders ................................................. 140
Figure 6-12: Informal components suppliers hidden unobtrusively in narrow alleys .............. 141
Figure 6-13: Second-hand and brand new components in supplier shops .............................. 142
Figure 6-14: Appliances waiting for dismantling ...................................................................... 143
Figure 6-15: Component materials and e-scraps after dismantling ......................................... 144
Figure 6-16: E-waste streams by category ................................................................................ 146
Figure 6-17: E-waste resources decline in quantity with the involvement of informal
stakeholders .............................................................................................................................. 147
Figure 7-1: Understanding the different types of e-waste ....................................................... 152
Figure 7-2: How the seven categories of e-waste are being disposed of ................................. 154
Figure 7-3: Disposal behaviour among combined categories of e-waste by households ........ 156
Figure 7-4: Disposal methods commonly used by households ................................................. 157
Figure 7-5: Reasons for obsolescence (%) ................................................................................ 158
Figure 7-6: Products prone to technological obsolescence ...................................................... 160
XIV
Figure 7-7: An old shaver has been replaced by a new one .................................................... 161
Figure 7-8: Percentages of respondents that had repaired e-products ................................... 161
Figure 7-9: Market share of major collection channels among seven surveyed categories of e-
waste ......................................................................................................................................... 162
Figure 7-10: Percentages of e-waste disposed of through informal collectors ........................ 163
Figure 7-11: Reasons for disposing of e-waste through the informal collectors ...................... 164
Figure 7-12: Percentages of e-waste disposed of through the trade-in scheme ..................... 166
Figure 7-13: Motivation for using the trade-in scheme rather than informal collection ......... 166
Figure 7-14: Percentages of products disposed of through second-hand markets .................. 168
Figure 7-15: Percentages of products disposed of through on-line trade ................................ 168
Figure 7-16: Waste recycling categories in Shanghai’s communities ....................................... 170
Figure 7-17: Bins for classifying rubbish and the collected hazardous waste in a community of
Shanghai .................................................................................................................................... 171
Figure 7-18: Specially designed recycling boxes for batteries (red), mobile phones and small EEs
(yellow) and paper (green) in a community of Shanghai .......................................................... 171
Figure 7-19: Percentages of e-waste categories stockpiled by households ............................. 173
Figure 7-20: Various categories of e-waste stockpiled by households ..................................... 175
Figure 7-21: Reasons for households stockpiling their obsolete products ............................... 176
Figure 7-22: “Safe” music player sets for children (a car audio unit and a car battery) ........... 177
Figure 7-23: A TV used in a dangerous condition ..................................................................... 178
Figure 7-24: Small EE being stored by households ................................................................... 179
Figure 7-25: Re-purposed mobile phone .................................................................................. 180
Figure 7-26: Obsolete LHH appliances temporarily kept by households .................................. 180
XV
Figure 7-27: New and old washing machines owned by Mrs Xu .............................................. 181
Figure 7-28: Aged rubber apron within the old washing machine ........................................... 181
Figure 7-29: The percentages of e-waste dumped by households ........................................... 182
Figure 7-30: The reasons for e-waste being dumped ............................................................... 183
Figure 7-31: The percentages of people that noticed and made use of battery recycling boxes
.................................................................................................................................................. 185
Figure 7-32: Methods of disposing of batteries ........................................................................ 185
Figure 7-33: Attitudes to battery recycling from the questionnaire results ............................. 186
Figure 7-34: Batteries kept by households ............................................................................... 187
Figure 7-35: Households’ preferences for collecting small EE .................................................. 190
Figure 7-36: Responsibilities for e-waste collection ................................................................. 191
Figure 8-1: Two lines between satisfaction and expectation levels ......................................... 194
Figure 8-2: Updated e-waste material flows following the Field Study A ................................ 200
Figure 8-3: E-waste material flows in Tianjin and the relationship between informal
stakeholders .............................................................................................................................. 202
Figure 8-4: The TPB model adapted for the specific Chinese context after field work ............ 210
Figure 9-5: A possible intervention point for mitigating environmental impacts from deep-
processing ................................................................................................................................. 219
XVI
List of Tables
Table 1-1: Hazardous substances in e-waste and their potential adverse health effects ............ 7
Table 1-2: Estimates of annual e-waste production, disposal, recovery, and import/export in
selected regions/countries (in million tons) (2010) ...................................................................... 9
Table 1-3: Production of several categories of e-products in China (in millions item) .............. 10
Table 1-4: Relationship between aim, research questions and research methods .................... 13
Table 2-1: WEEE categories and composition by EU directive (2002) ........................................ 19
Table 2-2: Components or e-waste items and corresponding hazardous materials present .... 25
Table 2-3: Three main collection channels worldwide and examples in each group ................. 32
Table 2-4: WEEE regulations, collection infrastructure and recycling technologies in selective
developing countries................................................................................................................... 39
Table 3-1: Stakeholders involved in the informal e-waste recycling system in developing
countries ..................................................................................................................................... 47
Table 3-2: Recycling activities by formal and informal recyclers in China .................................. 48
Table 3-3: Average recycling cost and profits in the informal and formal sectors ..................... 50
Table 3-4: Comparison of characteristics of formal recycling and informal recycling................ 52
Table 3-5: Aspects of WEEE management in China: limitations and opportunities ................... 60
Table 4-1: Percentage of Chinese households’ disposal options in eight studies ...................... 69
Table 4-2: Classifications and names of collectors ..................................................................... 77
Table 4-3: Estimated numbers of people involved in the formal and informal e-waste recycling
industries in China ....................................................................................................................... 79
Table 4-4: Comparison of formal and informal collection methods from the literature ........... 90
XVII
Table 5-1: Research perspectives of paradigm position ............................................................. 94
Table 5-2: The two field studies and research methods ........................................................... 101
Table 5-3: Research questions and methods involved in Field Study A ................................... 105
Table 5-4: Explanations of three factors in TPB model ............................................................. 111
Table 5-5: Research questions and methods in the Field Study B ............................................ 115
Table 5-6 : Disposal behaviour categories in the research study ............................................. 117
Table 5-7: Measuring household satisfaction and the six indicators ........................................ 122
Table 7-1: Sample size of questionnaire in Tianjin ................................................................... 150
Table 7-2: Design of the matrix question in the questionnaire ................................................ 153
Table 7-3: Percentages of Life spans of various products ........................................................ 158
Table 7-4: Evaluation of accessible channels by surveyed households .................................... 172
Table 7-5: Households’ satisfaction level with the informal collectors .................................... 188
Table 7-6: Households’ expectations about formal collection channels .................................. 189
Table 8-1: Motivation for households’ disposal behaviour ...................................................... 208
Table 8-2: Factors and sub-factors influencing Chinese households’ e-waste disposal behaviour
.................................................................................................................................................. 210
XVIII
Glossary of Abbreviations and Acronyms
3R Reduce, Reuse, Recycle
CRT Cathode ray tube
EU European Union
EOL End-of-life
EEE Electronic and Electrical Equipment
EE Electrical Equipment
EPR Extended Producer Responsibility
GDP Gross Domestic Product
ICT Information And Communications Technology
IPR Individual Producer Responsibility
CPR Collective producer responsibility
NDRC National Development and Reform Commission
OECD Organization for Economic Co-operation and Development
OEM Original Equipment Manufacturer
PC Personal Computer
PVC Poly Vinyl Chloride
RoHS Restriction of Hazardous Substances Directive
WEEE Waste of Electronic and Electrical Equipment
LHH appliance Large Household appliance
1
CHAPTER 1: INTRODUCTION
Waste of electrical and electronic equipment (WEEE), also refers to e-waste (UNEP, 2007a) is
one of the fastest growing waste streams in the world (Song et al., 2012; UNEP, 2007a;
Widmer et al., 2005; World Bank, 2004). The growing e-waste quantities and the hazardous
materials they often contain have focused attention on how e-waste is handled. E-waste
recycling activities, particularly conducted by informal recyclers in many developing countries
have caused serious negative consequences to the environment and human health (Puckett,
2005; Sepúlveda et al., 2010).
Environmental impacts resulting from informal recycling activities in China have raised the
attention of global environmentalists and organizations including Greenpeace, UNEP, and the
Basel Convention (BAN, 2002; Puckett, 2005; UNEP, 2007a, 2007b, 2011). China is the largest
e-waste importer worldwide (Zoeteman et al., 2010) and simultaneously, produces an
enormous amount of e-waste domestically. Moreover, nearly all these e-waste resources in
China are processed by the informal recycling sector. Although the formal recycling operations
in China have the capacity to handle large volumes of e-waste safely, their collection methods
are not effective and they only account for a small proportion of total e-waste handled in
China (Chi et al., 2011).
The research was conducted with the overall goals of contributing to the body of knowledge
on informal e-waste recycling in China, and to the improvement of the current e-waste
recycling systems in China. It seeks to understand the negative impact that results from e-
waste recycling and the ways to minimalize the environmental impact and health risks, not
only to the employees of informal recycling plants, but also to the residents locally and
regionally. This thesis investigates the advantages and limitations of the Chinese informal e-
waste recycling sector. In addition, there is the question of how the formal recycling system
2
can gain sufficient e-waste resources to be able to compete with the informal sector and make
it a viable business proposition. The research is chiefly conducted by literature review,
comparative studies and by fieldwork involving questionnaires, interviews and photographic
observation.
1.1. Overview of e-waste generation and environmental issues
1.1.1. E-waste generation
Statistically, there are 20-50 million tonnes of e-waste generated globally per year and this
number is still climbing at an annual rate of 3% - 5% (UNEP, 2007a; World Bank, 2004). In
twenty seven European Union (EU) countries, the total amount of e-waste generation ranges
from 8.3 to 9.1 million tonnes anually (Schluep et al., 2009) or 14 to 15 kg per capita (UNEP,
2007a). In some less-developed countries, such as India and China, although the e-waste
generation per capita is smaller and less than 1kg, the total quantity is growing at an
exponential pace. The growing market and rapid obsolescence around the world will see e-
waste increasing in future years (Goosey, 2004; Schluep, et al., 2009, p. 50; UNEP, 2007a).
Despite growing concern regarding e-waste generation around the world, there is a lack of
coherent data because of inherent challenges in obtaining such information globally (Miller et
al., 2012).
China is the largest producer and consumer of electronic and electrical equipment (EEE or e-
products) in the world. In parallel, enormous amounts of e-waste have been generated
domestically in China. It is estimated that the quantities of e-waste from four major categories
of large appliances (TVs, Refrigerators, Air conditioners, Clothes Washing Machines), and PCs
were over 885,000 units in 2005 and is expected to reach 2,820,000 units by 2020 (Liu. et al.,
2006). From 1993 to 2003, the number of PC users in China had increased by 1052% whilst the
average growth all over the world was much lower, at 181% (Streicher-Porte, 2005). Up to the
3
end of 2011, the number of PC users in China had reached 1.34 billion. If the average lifespan of
a PC is 3.5 years (Yang et al., 2008), more than 1 billion PCs would be obsolete every three years
in China. In addition to the large appliances and equipment mentioned above, waste from
mobile phones is also growing dramatically due to the increasing consumption and fast
obsolescence. The number of mobile phone users in China had reached 740 million in 2010
(CCID, 2010), and exceeded 1 billion at the end of 2011 (MIIT, 2012). Moreover, due to
technology innovation and lower prices for new items, the life span of Information and
Communications Technology (ICT) products such as PCs and mobile phones is getting shorter in
China, which further stimulates e-waste generation (Liu., et al., 2006; Yang, et al., 2008).
Furthermore, the huge number of consumers and the still-unsaturated market of e-products in
the poorer rural areas in China (Chi, et al., 2011; He et al., 2006; Ke, 2009; Liu et al., 2006) is
likely to fuel increasing e-waste generation in the coming decades.
1.1.2. Informal recycling in developing countries
E-waste collection and recycling in many developing countries such as China and India are
characterized by a group of informal sectors (Boeni et al., 2006; SAKANO, 2007; Streicher-Porte,
2005). This form of informal e-waste recycling is widely developed in many other countries and
cities worldwide, such as Cambodia, Bangalore, Chennai, Delhi and New Delhi in India, Lagos in
Nigeria and Karachi in Pakistan and in Malaysia (Liu., et al., 2006; Terazono et al., 2006;
Williams, 2008; Yang, et al., 2008). Even in many developed countries, where formal recycling
systems already exist, minor e-waste streams are operated by the informal recycling sector, for
example in Korea, Taiwan, and Japan (Boeni, et al., 2006; SAKANO, 2007; Streicher-Porte, 2005;
Terazono, et al., 2006; UNEP, 2007a).
The informal sector has been defined by many scholars and characterized as self-employed,
small-scale, labour-intensive, unregulated or unregistered activities, and operating beyond the
4
monitoring and supervision of different levels of government officials (Blackman, 2000;
Briassoulis, 1999; Gërxhani, 2004; Guha-Khasnobis et al., 2006; Hart, 1973; Wilson et al., 2006).
In this research, the informal recycling sector refers to unregistered individuals or private
operations outside official supervision and regulatory control. By contrast, the formal recycling
sector refers to operations that are organized and regulated by the government/nation or
registered organizations.
In developing countries, the lack of any formal e-waste regulation and the low-investment
needed to run a recycling business, attract a large number of individual informal recyclers.
Informal recyclers use the quickest way to separate the valuable components and materials
manually before burning or casual dumping. They recover materials and precious metals using
rudimentary methods such as smashing, open roasting, smelting and acid bath treatment,
without any pollution control facilities or protection for workers (UNEP, 2007b). A wide range
of toxic and hazardous subtances that are commonly used in the production of electronic
products have been released (Xu et al., 2006). Plus the generation secondary and tertiary toxic
substances, these toxins include bromated flame-retardants, PCB1 (Polychlorinated Biphenyls),
Polybrominated Diphenyl Ether (PBDEs2) (Rahman, et al., 2001) and heavy metals such as
mercury, cadmium, chromium and lead, most of which have been linked to cancer, nervous
system impairments, abnormalities of infants and other fatal diseases (Bhuie et al., 2004; Y. Li
et al., 2008). Consequently, severe negative impacts resulting from improper recycling
activities has led to irreversible consequences to environment and human health (Brigden et
1PCBs, namely Polychlorinated Biphenyls, are one of the Persistent Organic Pollutant (POPs), resistant to
degradation of photolytic, biological and chemical forms and perpetually persists in the food chain. Given the serious pollution to the environment, use of PCBs has been forbidden in the production of electronic equipment since 1960s in America (Saarisalo, 2009).
2PBDEs are used as flame-retardant additives in plastics and are widely used in cases of electronic
devices and electrical appliances, as well as the computer circuit boards (Rahman et al., 2001).
5
al., 2005; Huo, 2007; Puckett, 2005; Puckett et al., 2002; Robinson, 2009; Sepúlveda, et al.,
2010; Xing et al., 2009; Xu, et al., 2006).
1.1.3. Environmental impacts from e-waste recycling
Guiyu, where is the biggest e-waste informal recycling centre around the world, is an instructive
example to discuss informal e-waste recycling activities. Guiyu is located in China and are
notorious for serious pollution levels resulting from improper recycling activities (EzineMark,
2011; Fu et al., 2012; Huo, 2007; Li, et al., 2008; Sepúlveda, et al., 2010; Xing, et al., 2009; Xu, et
al., 2006). Informal e-waste recycling activities in Guiyu involve 21 villages, 300 private
enterprises, 5,500 family-based workshops, and approximately 60,000 employees (Robinson,
2009; Xin hua, 2005). Also due to the labour requirements for informal recycling, this poor
rural area attracts considerable labour from surrounding areas. As a result, more than 200,000
people have migrated to Guiyu and the population in Guiyu doubled to 400,000 in 2003 (Fu, et
al., 2012). Eighty percent of families in Guiyu are engaged in e-waste recycling businesses,
including pregnant women and children (EzineMark, 2011; Fu, et al., 2012; Shinkuma & Huong,
2009).
Guiyu treats over 20 million tonnes of e-waste annually. The raw materials that were
recovered in Guiyu in 2004 were estimated to be worth approximate 800 million RMB (USD
123 million)(Chi, et al., 2011). E-waste recycling has become the most significant industry in
Guiyu and more than 90% of industry’s gross financial value comes from the e-waste recycling
business (Fu, et al., 2012). Such economic value is created at the expense of significant
environmental and human health sacrifices (EzineMark, 2011; Zoeteman, et al., 2010). Little
protection is available to workers and for surrounding population. Goggles, masks, or gloves
are rarely used or provided for employees (Sepúlveda, et al., 2010). Dangerous processing
methods include:
6
1. Incineration: Open burning of coated wires and Poly Vinyl Chloride (PVC) cable to
extract the copper; open burning of unwanted scraps (Wong & Luksemburg, 2007);
2. Smashing: Manually dismantling products with simple tools such as hammers, chisels,
screwdrivers (Puckett, et al., 2002; Wen, 2006);
3. Heating circuit boards: Removing IC chips and solder from printed circuit boards by
heating them over coal-fired grills (Puckett, et al., 2002; Shinkuma & Huong, 2009);
4. Acid leaching: Acid baths to recover gold and other precious metals (Wong &
Luksemburg, 2007);
5. Direct disposal: The residual e-scrap after dismantling, as well as the toxic acid liquid is
directly posed into fields or local rivers (Huo, 2007; Robinson, 2009; Sepúlveda, et al.,
2010; Xing, et al., 2009).
Such dangerous informal e-waste recycling practices have been the cause of major
environmental impacts. For example, the lead levels in the local river (Lianjiang River) has been
recorded as 2,400 times higher than the recommended level by the World Health
Organization’s Drinking Water Guidelines (Puckett, et al., 2002; Xin hua, 2005). More than half
of the population in Guiyu have developed respiratory issues, skin problems or digestive
diseases (Puckett, 2002) and 82% of young children (aged from one to six) were suffering from
lead poisoning (Xu, et al., 2006). In Guiyu, large doses of PCBs have contaminated fish, crops
and human milk (Xu, et al., 2006).
In addition to the organic compounds, heavy metals cycle eternally and often move up the
food chain to carnivores and humans in the process of bio accumulation. A study from Huo et
al. (2007) compared the blood lead levels (BLLs) in 226 children (below six years old) living in
two cities in China including Guiyu. The result from this study suggested that children living in
7
Guiyu had significantly higher BLLs compared with those living in another sample city.
Additionally, the study observed a significant increasing trend in BLLs with increasing age in
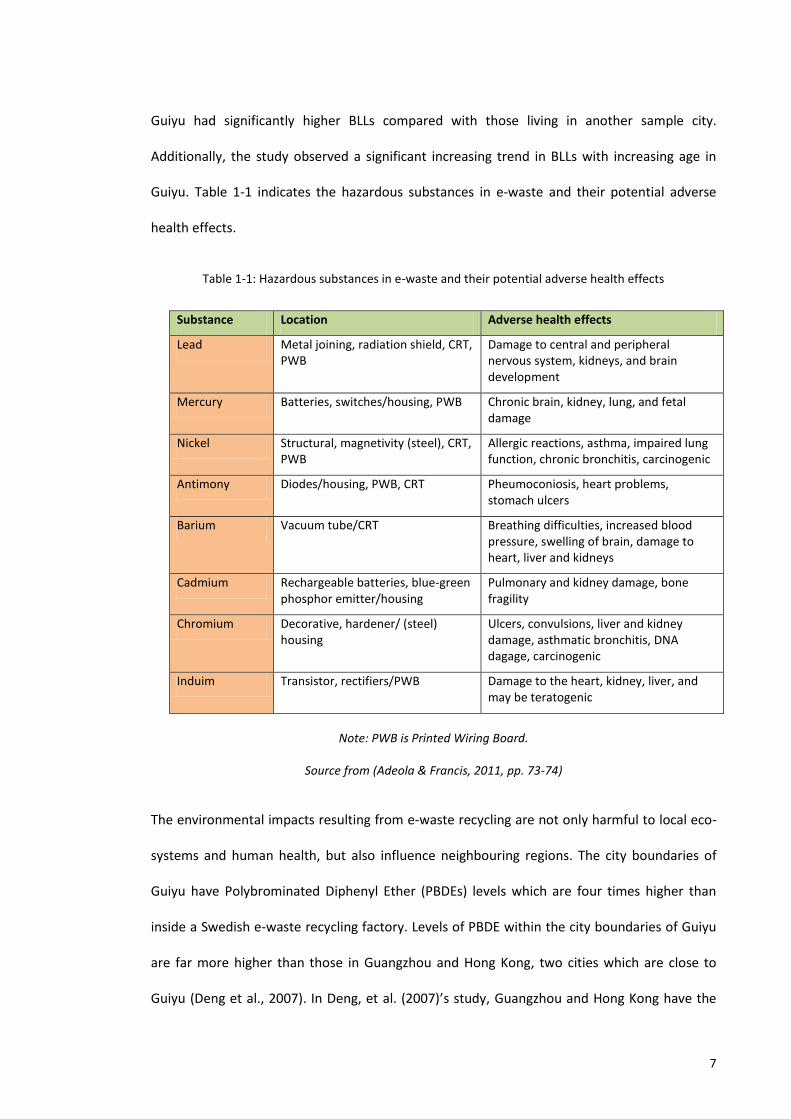
Guiyu. Table 1-1 indicates the hazardous substances in e-waste and their potential adverse
health effects.
Table 1-1: Hazardous substances in e-waste and their potential adverse health effects
Substance Location Adverse health effects
Lead Metal joining, radiation shield, CRT, PWB
Damage to central and peripheral nervous system, kidneys, and brain development
Mercury Batteries, switches/housing, PWB Chronic brain, kidney, lung, and fetal damage
Nickel Structural, magnetivity (steel), CRT, PWB
Allergic reactions, asthma, impaired lung function, chronic bronchitis, carcinogenic
Antimony Diodes/housing, PWB, CRT Pheumoconiosis, heart problems, stomach ulcers
Barium Vacuum tube/CRT Breathing difficulties, increased blood pressure, swelling of brain, damage to heart, liver and kidneys
Cadmium Rechargeable batteries, blue-green phosphor emitter/housing
Pulmonary and kidney damage, bone fragility
Chromium Decorative, hardener/ (steel) housing
Ulcers, convulsions, liver and kidney damage, asthmatic bronchitis, DNA dagage, carcinogenic
Induim Transistor, rectifiers/PWB Damage to the heart, kidney, liver, and may be teratogenic
Note: PWB is Printed Wiring Board.
Source from (Adeola & Francis, 2011, pp. 73-74)
The environmental impacts resulting from e-waste recycling are not only harmful to local eco-
systems and human health, but also influence neighbouring regions. The city boundaries of
Guiyu have Polybrominated Diphenyl Ether (PBDEs) levels which are four times higher than
inside a Swedish e-waste recycling factory. Levels of PBDE within the city boundaries of Guiyu
are far more higher than those in Guangzhou and Hong Kong, two cities which are close to
Guiyu (Deng et al., 2007). In Deng, et al. (2007)’s study, Guangzhou and Hong Kong have the
8
highest level of PBDEs compared to several areas sampled worldwide, but the two Chinese
cities PBDE levels are 100 times lower than in Guiyu.
The level of pollution in Guiyu is only one example of many, though it is a particularly bad
example and just a tip of the iceberg. Other than Guiyu, there are many other informal
recycling sites around the world. Although the scale of informal recycling business varies in
regions and countries, recycling activities by the informal recycling sector are similarly
dangerous. Moreover, such polluting informal recyclers and workshops in many developing
such as China and India, not only recycle domestic e-waste, but also deal with e-waste
imported from overseas.
1.1.4. E-waste streams for informal recycling sectors in China
There are three main sources of e-waste in China: domestic obsolescence of e-products,
imported e-waste and e-waste from Original Equipment Manufacturers (OEMs). Domestic
obsolescence refers to the e-waste produced by households and institutions such as schools,
offices and hospitals and imported e-waste is transported across boundaries from other
countries. The e-waste from OEMs consists of defective items produced during the
manufacturing process. Section 1.1.1 discussed domestic e-waste generation in China and the
e-waste streams from overseas and OEMs are discussed below.
Trans-boundary movements of e-waste
Other than the increasing domestic e-waste generation, China is the biggest country to accept
the e-waste from developed countries (Zoeteman, et al., 2010). It has been estimated that the
U.S. annually exports 50% to 80% of domestic e-waste to less developed countries, 90% of
which is transferred to China (BAN, 2002; Puckett, et al., 2002; The Natural Edge project, 2006;
Widmer, et al., 2005). Compared with less than 5.7 million tonnes e-waste generated
9
domestically, it is estimated that 2.6 million tonnes of e-waste was imported in 2010
(Zoeteman, et al., 2010). These cross-boundary e-waste streams originate from Japan, South
Korea, Europe, and the U.S. (BAN, 2002; Hosoda, 2007; Nordbrand, 2009; Puckett, et al., 2002;
Terazono et al., 2004; The Natural Edge project, 2006; Widmer, et al., 2005). At the same time,
the e-waste recipient countries not only involve China, but also include India, Pakistan (Lee &
Na, 2010; Puckett, et al., 2002; Widmer, et al., 2005), South Africa, and Nigeria (Puckett, 2005).
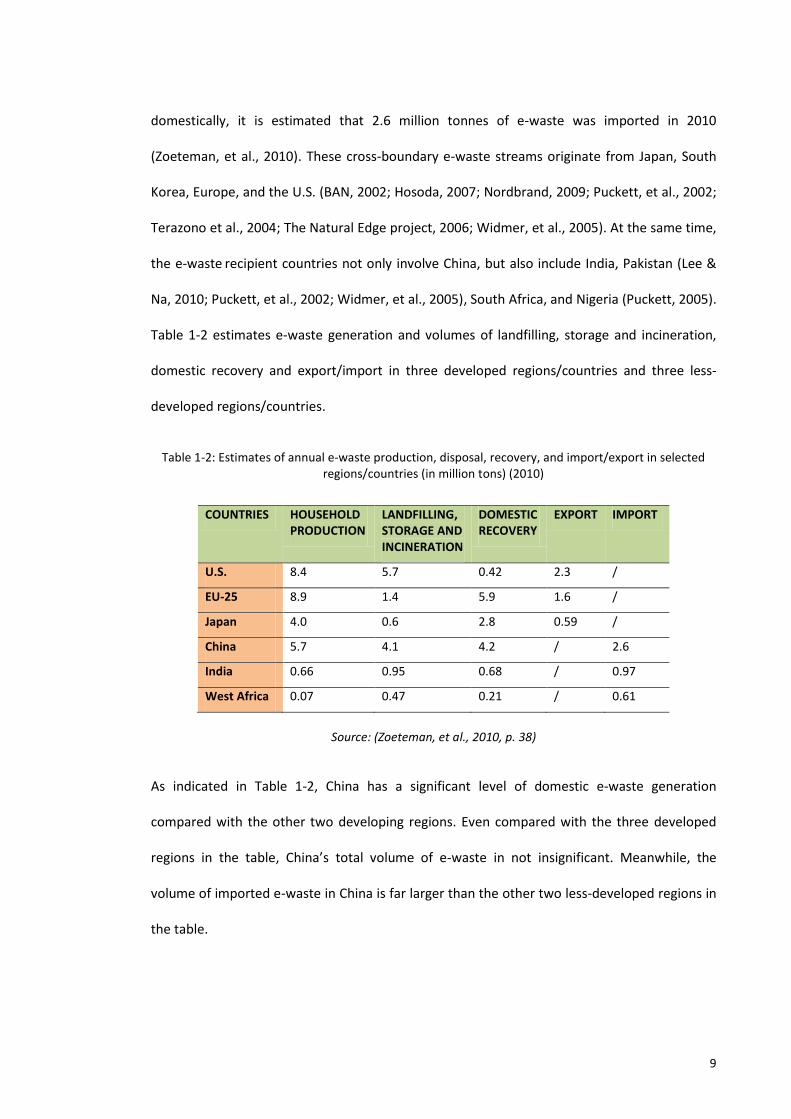
Table 1-2 estimates e-waste generation and volumes of landfilling, storage and incineration,
domestic recovery and export/import in three developed regions/countries and three less-
developed regions/countries.
Table 1-2: Estimates of annual e-waste production, disposal, recovery, and import/export in selected regions/countries (in million tons) (2010)
COUNTRIES HOUSEHOLD PRODUCTION
LANDFILLING, STORAGE AND INCINERATION
DOMESTIC RECOVERY
EXPORT IMPORT
U.S. 8.4 5.7 0.42 2.3 /
EU-25 8.9 1.4 5.9 1.6 /
Japan 4.0 0.6 2.8 0.59 /
China 5.7 4.1 4.2 / 2.6
India 0.66 0.95 0.68 / 0.97
West Africa 0.07 0.47 0.21 / 0.61
Source: (Zoeteman, et al., 2010, p. 38)
As indicated in Table 1-2, China has a significant level of domestic e-waste generation
compared with the other two developing regions. Even compared with the three developed
regions in the table, China’s total volume of e-waste in not insignificant. Meanwhile, the
volume of imported e-waste in China is far larger than the other two less-developed regions in
the table.
10
E-waste from Original Equipment Manufacturers (OEMs)
Besides the two significant e-waste resources in China (e-waste produced by households and
imported e-waste), China also produces enormous amount of e-waste from the large number
of manufacturing of electronic and electrical equipment (EEE or e-products) in China (Manhart,
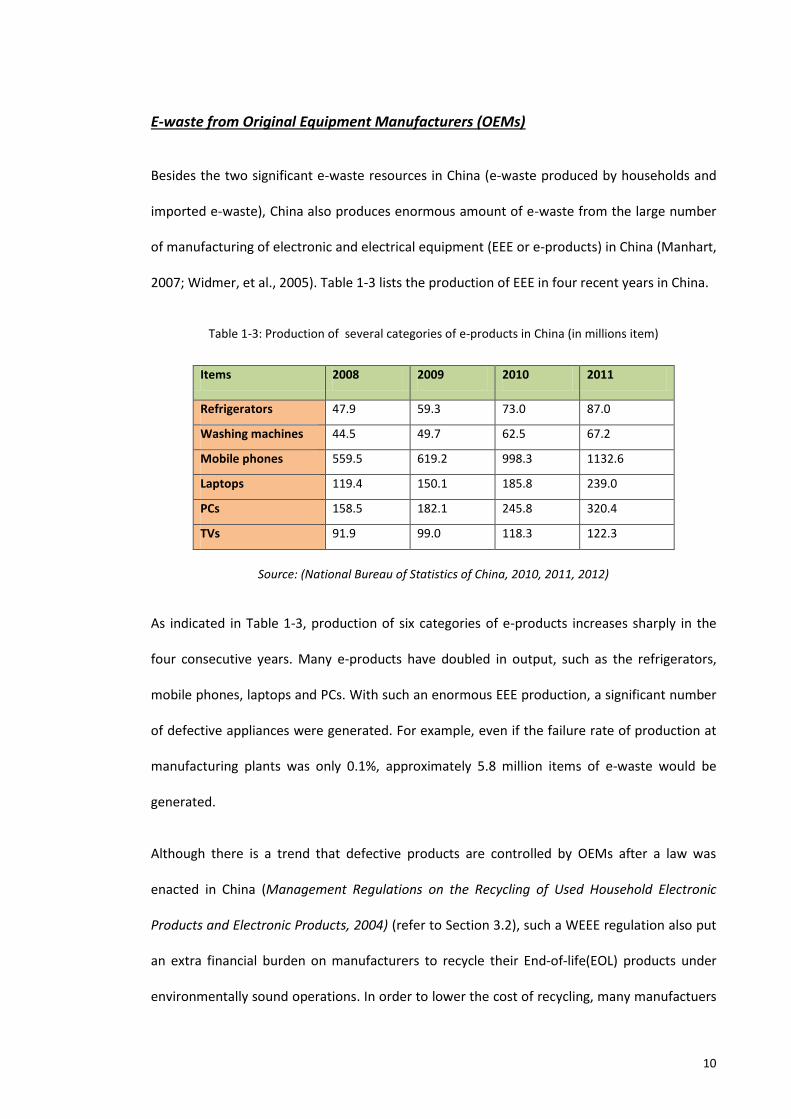
2007; Widmer, et al., 2005). Table 1-3 lists the production of EEE in four recent years in China.
Table 1-3: Production of several categories of e-products in China (in millions item)
Items 2008 2009 2010 2011
Refrigerators 47.9 59.3 73.0 87.0
Washing machines 44.5 49.7 62.5 67.2
Mobile phones 559.5 619.2 998.3 1132.6
Laptops 119.4 150.1 185.8 239.0
PCs 158.5 182.1 245.8 320.4
TVs 91.9 99.0 118.3 122.3
Source: (National Bureau of Statistics of China, 2010, 2011, 2012)
As indicated in Table 1-3, production of six categories of e-products increases sharply in the
four consecutive years. Many e-products have doubled in output, such as the refrigerators,
mobile phones, laptops and PCs. With such an enormous EEE production, a significant number
of defective appliances were generated. For example, even if the failure rate of production at
manufacturing plants was only 0.1%, approximately 5.8 million items of e-waste would be
generated.
Although there is a trend that defective products are controlled by OEMs after a law was
enacted in China (Management Regulations on the Recycling of Used Household Electronic
Products and Electronic Products, 2004) (refer to Section 3.2), such a WEEE regulation also put
an extra financial burden on manufacturers to recycle their End-of-life(EOL) products under
environmentally sound operations. In order to lower the cost of recycling, many manufactuers
11
and small-scale factories privately transfer their e-waste to informal recycling workshops (Li et
al., 2012b). Rather than paying extra recycling expenses for their EOL products by law, these
small-medium manufacturers can be paid by traders in the informal sector. Moreover, other
than e-waste from domestic OEMs, there is evidence that much of the e-waste processed in
Guiyu comes directly from overseas OEMs or related customer service departments. Such
illegal dumping involves many well-known brands such as AMD, HP, Samsung and Panasonic
(Millward, 2012).
Due to a lack of effective formal recycling systems, majority of the three e-waste streams are
flowing into the informal workshops in China. The environment in China has to face
unprecedented challenges from the side effects of e-waste recycling.
1.2. Research aim, research questions and methods
This research investigates the informal e-waste recycling sector in China due to its enormous
amount of e-waste resources and serious pollution resulting from e-waste recycling activities.
In reviewing the e-waste recycling and associated environmental issues with the informal
recycling sector in China, this research was conducted with the overall aim of contributing to
the improvement of the current e-waste recycling systems in China. The aim of research
addresses three research questions (RQ) as follow:
RQ1: What e-waste recycling systems exist in China and how do they compare
internationally?
This first question explores e-waste recycling and relevant e-waste management around the
world, particularly examining global e-waste regulations and the Extended Producer
Responsibility (EPR) strategies that are applied in developed countries (Chapter 2). This
question also examines strategies of e-waste management by the Chinese Government in
terms of strengthening the legislative framework, investing in up-to-date recycling
12
technologies and facilities, establishing formal recycling systems and formal collection
channels (Chapter 3). It discusses the effectiveness from these e-waste management projects
and e-waste legislative framework in China; it addresses the limitations of e-waste
management in China. After discussing the official e-waste management strategies and their
effectiveness, the biggest challenge for the formal e-waste recycling systems is collecting
sufficient e-waste from households to gain economies of scale in collection and processing.
RQ2: What are the advantages and limitations of various e-waste recycling systems in China?
The second research question aims to compare the current situation of recycling systems in
China and explore the characteristics of both formal and informal recycling systems (Chapter
3). Given the important role of the informal recycling sector in China, this study examines the
advantages and limitations of the informal recycling. A field study was conducted to explore
the recycling operations by various informal e-waste recycling stakeholders.
In addition, two collection methods: informal collection and the trade-in scheme are chosen as
being representative of informal and formal collection systems. Besides the dominant informal
collectors, a trial trade-in scheme operated between 2009 and 2011, which was supported by
the Chinese Government, showed a promise in competing with the informal collectors in terms
of a large collection market share (Yang, et al., 2008). This study compares the two collection
methods in terms of procedures, features, and attitudes from households.
RQ3: Does the disposal behaviour of households offer opportunities to improve current
collection systems?
Households are essential stakeholders in the e-waste recycling systems because they control a
significant amount of e-waste at source. In other words, identifying the factors that influence
households’ e-waste recycling behaviour could be a positive way to mitigate the negative
environmental and human health damage currently resulting from the informal e‐waste
13
recycling. Therefore, the third research question tries to identify the opportunities available to
improve current collection methods by examining households’ recycling behaviour. The factors
that influence e-waste recycling behaviour on the part of individual households also must be
understood because they determine whether obsolete products flow into formal or informal
recycling systems. Therefore, this research on the one hand, compares the available collection
channels for households and household preferences regarding e-waste disposal strategies. On
the other hand, the study also investigates a wide range of factors that influence households’
disposal behaviour. This research question is answered using both literature review (Chapter 4)
and field study techniques (Chapter 7).
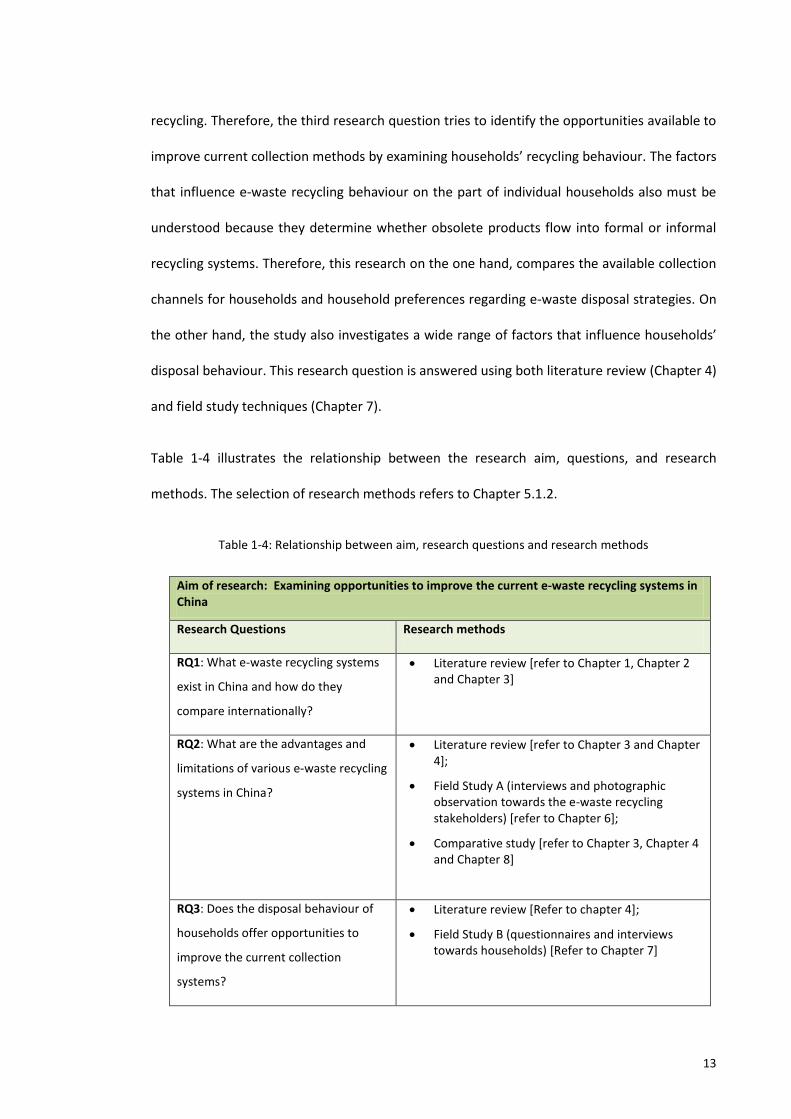
Table 1-4 illustrates the relationship between the research aim, questions, and research
methods. The selection of research methods refers to Chapter 5.1.2.
Table 1-4: Relationship between aim, research questions and research methods
Aim of research: Examining opportunities to improve the current e-waste recycling systems in China
Research Questions Research methods
RQ1: What e-waste recycling systems
exist in China and how do they
compare internationally?
Literature review [refer to Chapter 1, Chapter 2 and Chapter 3]
RQ2: What are the advantages and
limitations of various e-waste recycling
systems in China?
Literature review [refer to Chapter 3 and Chapter 4];
Field Study A (interviews and photographic observation towards the e-waste recycling stakeholders) [refer to Chapter 6];
Comparative study [refer to Chapter 3, Chapter 4 and Chapter 8]
RQ3: Does the disposal behaviour of
households offer opportunities to
improve the current collection
systems?
Literature review [Refer to chapter 4];
Field Study B (questionnaires and interviews towards households) [Refer to Chapter 7]
14
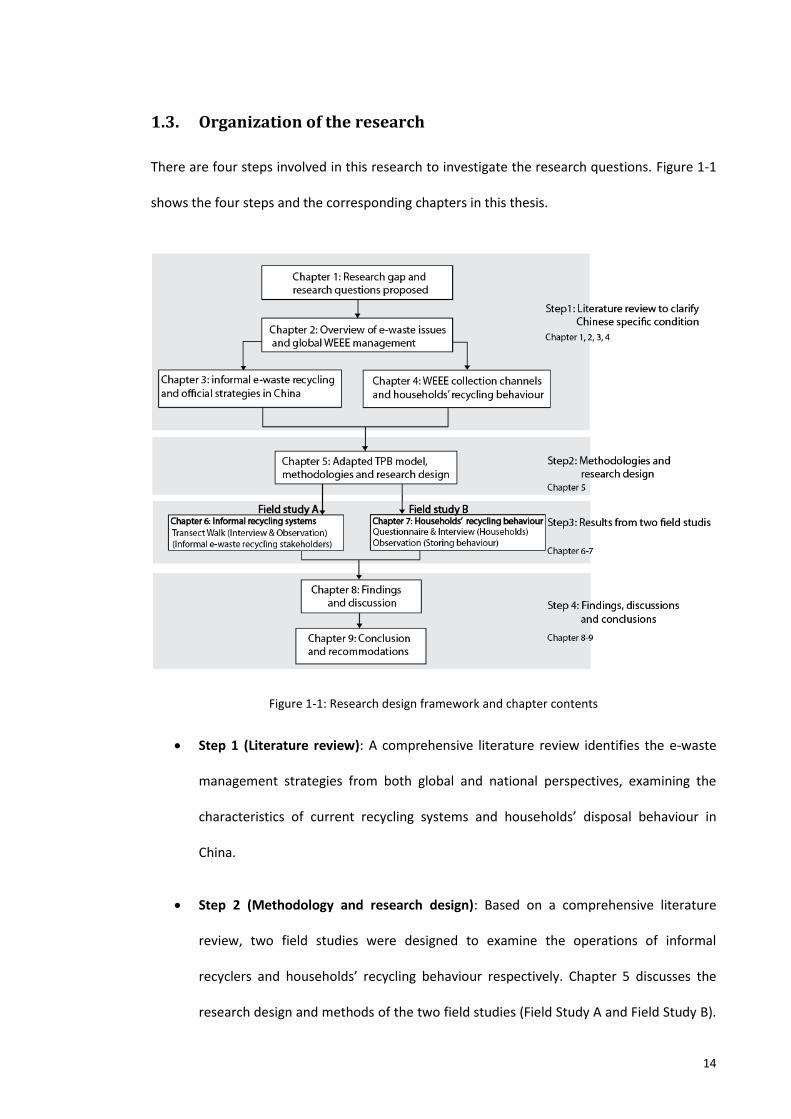
1.3. Organization of the research
There are four steps involved in this research to investigate the research questions. Figure 1-1
shows the four steps and the corresponding chapters in this thesis.
Figure 1-1: Research design framework and chapter contents
Step 1 (Literature review): A comprehensive literature review identifies the e-waste
management strategies from both global and national perspectives, examining the
characteristics of current recycling systems and households’ disposal behaviour in
China.
Step 2 (Methodology and research design): Based on a comprehensive literature
review, two field studies were designed to examine the operations of informal
recyclers and households’ recycling behaviour respectively. Chapter 5 discusses the
research design and methods of the two field studies (Field Study A and Field Study B).
15
This step proposes an adapted TPB model based on the specific e-waste recycling
context in China, which model was applied to guide the behavioural field study (Field
Study B).
Step 3 (Results from two field studies): Chapter 6 and Chapter 7 reveal the results
from Field Study A and Field Study B.
Step 4 (Discussion and conclusions): Chapter 8 and Chapter 9 discuss the findings and
offer conclusions of the research. Research findings are discussed and compared with
the existing literature in the field. Recommendations are made to improve current
collection systems in China and further studies are proposed.
1.4. The structure of the thesis
This thesis is spread over nine chapters.
Chapter 1 introduces definitions of e-waste and informal recycling sectors, identifies global e-
waste volume and the serious pollution resulting from informal e-waste recycling operations in
China. The research aim and questions for the research study are proposed in this chapter.
Chapter 2 gives an overview of the e-waste categories and composition, indicating the
hazardousness and recyclability of e-waste materials. This chapter explores the strategies that
are being used to overcome e-waste problems and it identifies various e-waste management
strategies from a global perspective, including various collection channels and the Extended
Producer Responsibility (EPR) strategies. The literature review in Chapter 2 concludes that
developing countries cannot duplicate the e-waste management strategies and effective
collection schemes due to the involvement of informal sectors. Effective legislative
frameworks and formal collection schemes have to develop on the basis of the particular
situation and context.
16
Chapter 3 identifies the vitality of informal recycling in China by comparing it to the formal
recycling systems in terms of stakeholders, recycling technologies, and recycling costs. In
addition, this chapter investigates the Chinese Government’s e-waste management strategies
and relevant effectiveness. This Chapter indicates that effective formal collection channels,
which can gain e-waste resources from households, play an essential role in the management
of e-waste in China.
Chapter 4 examines the available collection channels in China and households’ disposal
preferences based on pre-existing studies in China. This chapter particularly discusses the
features of the two major collection channels: the informal collector and a formal trade-in
scheme. A comparison study was conducted to compare the two collection channels in terms
of handling procedures, strength and limitations, and e-waste material and financial flows. It
addresses the promise of trade-in scheme, and the advantages enjoyed by the informal
collectors.
Chapter 5 describes the overarching methodology, including the theoretical perspective,
design of two field studies, and the techniques involved in the field studies. On the basis of the
comprenhensive literature review regarding current collection systems and Chinese
households’ recycling behaviour, this chapter chooses the Theory of Planned Behaviour (TPB)
model, adapts it on the basis of the Chinese recycling context, and uses the adapted TPB model
to guide Field Study B.
Chapter 6 reveals the results of Field Study A. Field study A examines the operations of the
informal recycling sectors by interviewing a number of informal e-waste recycling stakeholders
and photographically observing their working environment and recycling activities. The
activities of informal stakeholders were identified and a local e-waste streams chart in Tianjin
was constructed from the results of Field Study A. This chapter found the environmental
17
benefits from informal recycling operations, particular the collection, repair/refurbishment,
and dismantling operations within the urban areas of Tianjin, far outweigh their disadvantages.
Chapter 7 investigates the e-waste disposal behaviour of households in terms of
HOW/behaviour, WHY/motivation, attitudes to recycling and Satisfaction/Expectations. Rather
than examining e-waste recycling behaviour in general, this study identifies disposal behaviour
across the seven specific categories of e-waste. From the results of Field Study B, households’
varying disposal behaviour for different categories of e-waste suggests there are limitations to
the current collection systems. In addition, households’ satisfaction and expectations provide
potential for improving the current collection systems. Their disposal preferences are
influenced by many factors such as economic reward offered by collection channels and
households’ perceived residual value of products.
Chapter 8 discusses the findings from the two field studies. Results from the two field studies
are compared with findings from pre-existing studies. This chapter indicates that formal
recycling sectors in China are difficult to compete with the low-cost and secretive informal
recyclers. Moreover, the convenience of informal collectors and environmental benefits from
informal recycling operations can be adopted by the formal recycling sector.
Chapter 9 concludes the main findings from the research. It proposes strategies to improve the
e-waste recycling systems in China, identifies the need for further research.
18
CHAPTER 2: GLOBAL PERSPECTIVES OF E-WASTE MANAGEMENT
Chapter 2 defines terminology used in the thesis. It offers an overview of various definitions,
and descriptions of how e-waste or WEEE is categorised, covering both the hazardousness and
the value inherent in e-waste recycling. In addition, this chapter identifies WEEE management
strategies in terms of global legislation and effective financing models.
2.1. Overview of e-waste and global strategies
2.1.1. Definitions, categories and composition of e-waste
Many official and academic organizations have attempted to define and improve the term of
Waste electrical and electronic equipment (WEEE) or ‘e-waste’. In 2001, the Organization for
Economic Cooperation and Development OECD defined e-waste as ‘any appliance using an
electric power supply that has reached its end-of-life (EOL) (OECD, 2001).’ In 2002, the
definition of e-waste has been embodied by the Basel Action Network (BAN): “e-waste
encompasses a broad and growing range of electronic devices ranging from large household
devices such as refrigerators, air conditioners, cell phones, personal stereos, and consumer
electronics to computers, which have been discarded by their users” (Puckett, et al., 2002).
Also in 2002, the EU WEEE directive improved the definition by including not only the e-
products, but also the components and accessories: “Electrical or electronic equipment which
is waste...including all components, sub-assemblies and consumables, which are part of the
product at the time of discarding” (EU., 2002, 2012, 2003). This definition from the EU
Directive has become the most widely accepted definition around the world and both terms
(e-waste or WEEE) are used interchangeably in this study. They are based upon the EU
Directive and refer to various forms of electronic devices and components that have ceased to
be of any value to the end-users.
19
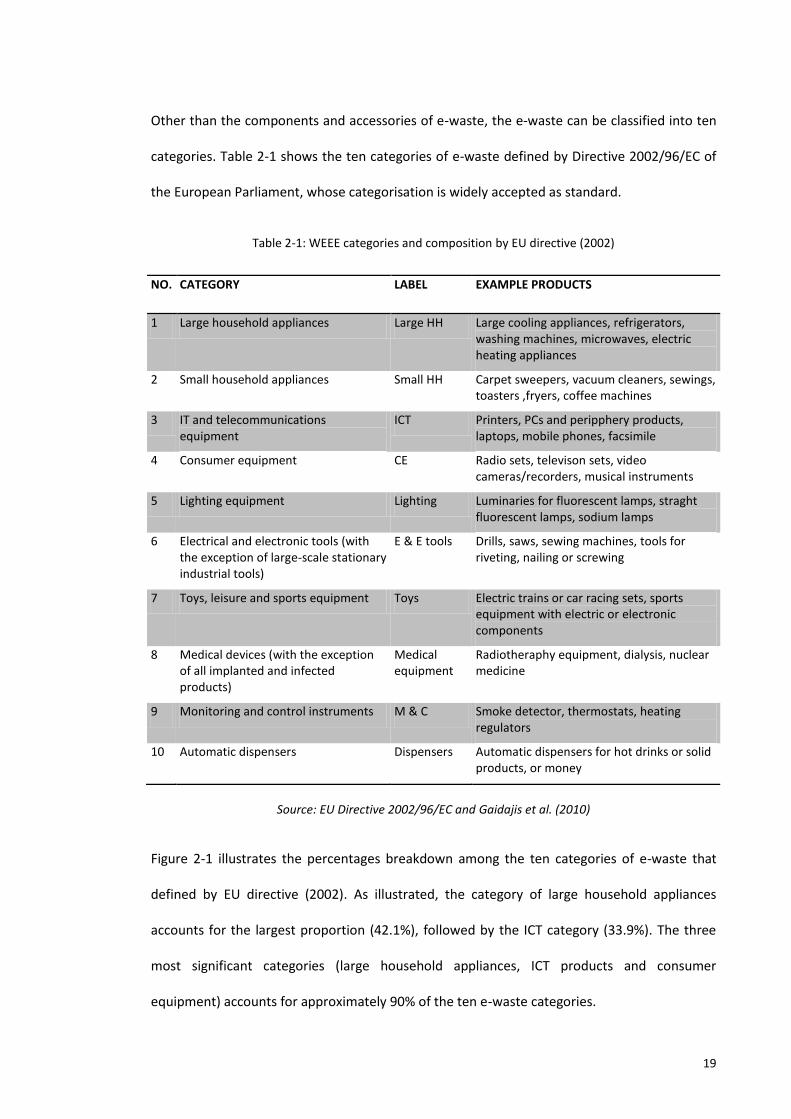
Other than the components and accessories of e-waste, the e-waste can be classified into ten
categories. Table 2-1 shows the ten categories of e-waste defined by Directive 2002/96/EC of
the European Parliament, whose categorisation is widely accepted as standard.
Table 2-1: WEEE categories and composition by EU directive (2002)
NO. CATEGORY LABEL EXAMPLE PRODUCTS
1 Large household appliances Large HH Large cooling appliances, refrigerators, washing machines, microwaves, electric heating appliances
2 Small household appliances Small HH Carpet sweepers, vacuum cleaners, sewings, toasters ,fryers, coffee machines
3 IT and telecommunications equipment
ICT Printers, PCs and peripphery products, laptops, mobile phones, facsimile
4 Consumer equipment CE Radio sets, televison sets, video cameras/recorders, musical instruments
5 Lighting equipment Lighting Luminaries for fluorescent lamps, straght fluorescent lamps, sodium lamps
6 Electrical and electronic tools (with the exception of large-scale stationary industrial tools)
E & E tools
Drills, saws, sewing machines, tools for riveting, nailing or screwing
7 Toys, leisure and sports equipment Toys Electric trains or car racing sets, sports equipment with electric or electronic components
8 Medical devices (with the exception of all implanted and infected products)
Medical equipment
Radiotheraphy equipment, dialysis, nuclear medicine
9 Monitoring and control instruments M & C Smoke detector, thermostats, heating regulators
10 Automatic dispensers Dispensers Automatic dispensers for hot drinks or solid products, or money
Source: EU Directive 2002/96/EC and Gaidajis et al. (2010)
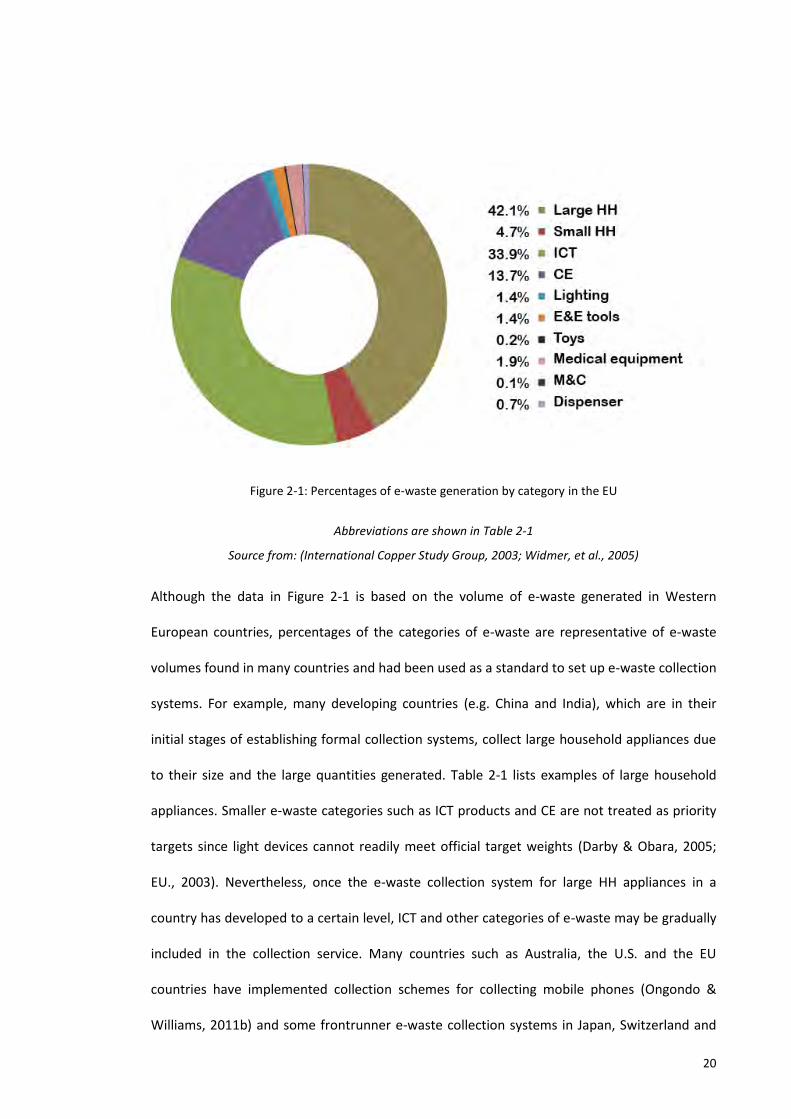
Figure 2-1 illustrates the percentages breakdown among the ten categories of e-waste that
defined by EU directive (2002). As illustrated, the category of large household appliances
accounts for the largest proportion (42.1%), followed by the ICT category (33.9%). The three
most significant categories (large household appliances, ICT products and consumer
equipment) accounts for approximately 90% of the ten e-waste categories.
20
Figure 2-1: Percentages of e-waste generation by category in the EU
Abbreviations are shown in Table 2-1
Source from: (International Copper Study Group, 2003; Widmer, et al., 2005)
Although the data in Figure 2-1 is based on the volume of e-waste generated in Western
European countries, percentages of the categories of e-waste are representative of e-waste
volumes found in many countries and had been used as a standard to set up e-waste collection
systems. For example, many developing countries (e.g. China and India), which are in their
initial stages of establishing formal collection systems, collect large household appliances due
to their size and the large quantities generated. Table 2-1 lists examples of large household
appliances. Smaller e-waste categories such as ICT products and CE are not treated as priority
targets since light devices cannot readily meet official target weights (Darby & Obara, 2005;
EU., 2003). Nevertheless, once the e-waste collection system for large HH appliances in a
country has developed to a certain level, ICT and other categories of e-waste may be gradually
included in the collection service. Many countries such as Australia, the U.S. and the EU
countries have implemented collection schemes for collecting mobile phones (Ongondo &
Williams, 2011b) and some frontrunner e-waste collection systems in Japan, Switzerland and
21
the Netherlands have already included all ten categories of WEEE under their collection
systems (Hischier et al., 2005).
2.1.2. E-waste generation and handling
In developed countries, there are three major sectors that generate e-waste (BAN, 2002) (refer
to Chapter 1.1.4 for definitions of the three e-waste streams):
1. Individuals/households
2. Businesses, institutions and governments
3. Original equipment manufacturers (OEMs)
In developing countries, besides these three sectors mentioned above, there is a fourth
category of e-waste stream - imported e-waste. This e-waste stream comes from developed
countries that export their e-waste and the following paragraphs discuss the three significant
disposal methods used by developed countries, including landfill/incineration, export to
developing countries and domestic recycling. In developed countries, e-waste generated from
these three sectors listed above is normally collected by formal domestic collection systems.
After the collection stage, e-waste is disposed of e-waste at a national level, as follows:
1. Landfill and incineration: According to Environmental Protection Agency (EPA) from
the U.S., more than 3.2 million tons of e-waste ended up in U.S. landfills in 1997
(Puckett, et al., 2002). In Australia, the majority of collected e-waste from households
was sent to landfill before 2011 (Ongondo & Williams, 2011a). Statistically,
approximately 180 million WEEE items have in landfills in Australia (Ongondo et al.,
2011d). Although the landfill is regarded as the lowest cost of all waste handling
methods in a “labour-expensive” society, enormous amounts of toxic substances have
contaminated the soil and enter the ecological systems (Hansmann et al., 2006). In the
U.S. for example, 70% of the lead that exist in landfill sites comes from the e-waste
22
(Puckett, et al., 2002). Consequently, land filling e-waste is gradually being banned in
the Organization for Economic Co-operation and Development (OECD) countries
(Zoeteman, et al., 2010). For example, landfilling CRT3 has been forbidden in the U.S.
since 2001 due to the contamination resulting from heavy metals, particularly the lead.
Australia also launched a Product Stewardship scheme in 2011 to reduce e-waste to
landfill and encourage enterprises to return and recycle TVs and computers (Australia
Government, 2011).
2. Export to developing countries: As a consequence of e-waste in landfills, some
developed countries such as the U.S. tried to transfer collected e-waste to prisons,
where it was dismantled and recycled by low-cost labour – ie prisoners (Brigden K,
2008; Puckett, et al., 2002). Since the Occupational Safety and Health Regulations
provides an assurance of prisoners’ health (Geiselman, 2002), such dangerous
recycling operations that may lead to contact with toxic substances within the e-waste,
were gradually transferred to less-developed countries (refer to Chapter 1.1.4 for
statistics of trans-boundary e-waste movements in six countries/regions)(BiBo &
Yamamoto, 2010; Puckett, 2005).
There are many reasons for the phenomenon of transboundary e-waste movements
and the main motive behind it is associated with financial incentives. In developed
countries, strict legislative enforcement has raised the cost of e-waste disposal,
making export of e-waste cheaper than domestic recycling (Ni & Zeng, 2009; Williams
et al., 2008). Furthermore, e-waste brokers can be paid twice to export e-waste:
In developed countries, e-waste brokers receive payment for accepting the e-
waste;
3 CRT is an important component in many consumer products such as TVs and computer monitors (refer
to hazardous substances within CRT in Table 2-2).
23
They receive payment again from informal recycling sectors in developing
countries (Puckett, et al., 2002).
Given the double-economic incentives and the cost of e-waste disposal and labour,
some developed countries refused to become parties to the Basel Convention4 and
maintained the export of e-waste to less-developed countries such as the biggest e-
waste exporting country - the U.S. (Puckett, et al., 2002). As indicated in Table 1-2 in
Chapter 1, the most largest amount of e-waste exports to less developed countries
comes from the U.S. (Zoeteman, et al., 2010). There are also other reasons for the
trans-boundary e-waste movements such as limited environmental legislation,
abundance of cheap labour and cost (e.g. $1.50/day in China) in the importing
countries and profit-maximizing informal recyclers (Chi, et al., 2011; Chung &
Murakami-Suzuki, 2008; Puckett, 2005; World Bank, 2004). Moreover, many
developing countries require tremendous amounts of recyclable material that
extracted from e-waste recycling for further industrial development (Chong et al.,
2009; Chung & Murakami-Suzuki, 2008; SEPA, 2004; Widmer, et al., 2005).
Consequently, the implementation of both Basel convention and the Chinese e-waste
laws that control the illegal imports may hinder but cannot prevent the e-waste trade
(Zoeteman, et al., 2010). For example, although batteries and 21 categories of e-waste
are included on the forbidden list of the Chinese e-waste regulation, there is still a
wide range of components not covered, such as waste of electrical motors, wires,
cables and electrical scraps (Yang, et al., 2008). As a result, many speculators dismantle
e-waste into parts before importing into China in order to evade customs inspection
4 The Basel Convention - an international agreement which aims to prevent the trans-boundary trade of
e-waste and lower environmental impacts in the ‘recipient countries’ was launched in 1992. More than 150 countries ratified the convention (BAN, 2002; Puckett, et al., 2002; The Natural Edge project, 2006; Widmer, et al., 2005).
24
(BAN, 2002). Enormous quantities of e-waste devices are exported under the name of
“recycling under stipulated procedures”, “reuse” or “charity to developing countries”
(CEC, 2008; Dalrymple, 2007; Puckett, et al., 2002). However, the majority of e-waste
streams in fact flow into the informal recycling workshops located in poor villages of
developing countries (BiBo & Yamamoto, 2010; Lee & Na, 2010).
3. Domestic recycling: In developed countries, domestic recycling operations at a
national level are based on existing collection and recycling systems in a country,
particularly existing collection systems. In developing countries, e-waste recycling
mainly depends on the informal recycling sector. The e-waste recycling systems in
developed countries will be discussed in Section 2.3 and the informal recycling is in
Chapter 3.
2.2. E-waste dismantling and recycling
This section discusses the valuable materials and toxic substances within e-waste. Then, it
examines recycling operations and technologies applied by formal recycling operations.
2.2.1. WEEE recyclability and hazardousness
While there are many toxic substances within e-waste, there are also many valuable materials,
which enable e-waste recycling to become a profitable business. Compared to most municipal
solid waste, e-waste is regarded as an “urban mining” due to the large quantities of precious
metals present such as gold, silver, and copper. It has been claimed that the amount of gold
recovered from 1 tonne of PCs is equivalent to that recovered from 17 tonnes of gold ore
(ETBC, 2010). There are 143 kg of copper, 0.5 kg of gold, and 2 kg of Stannum in 1 ton of circuit
boards for example (Ifeng, 2012b; Soderstrom.U, 2004).
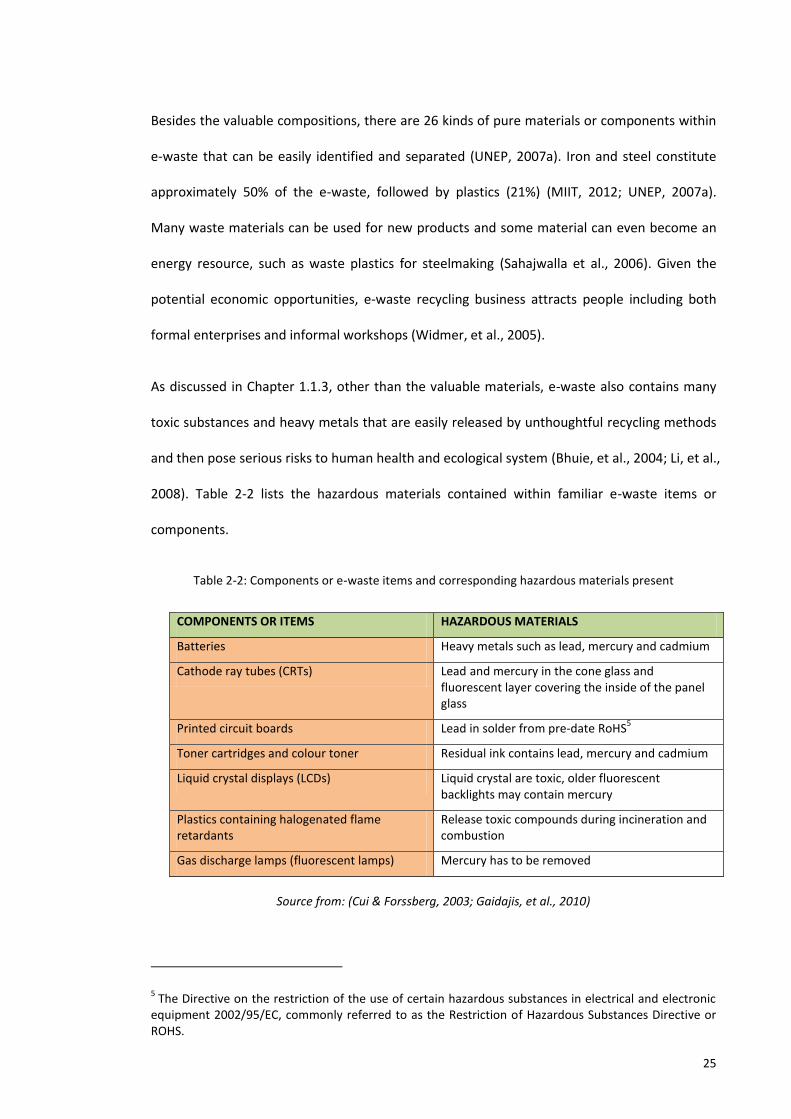
25
Besides the valuable compositions, there are 26 kinds of pure materials or components within
e-waste that can be easily identified and separated (UNEP, 2007a). Iron and steel constitute
approximately 50% of the e-waste, followed by plastics (21%) (MIIT, 2012; UNEP, 2007a).
Many waste materials can be used for new products and some material can even become an
energy resource, such as waste plastics for steelmaking (Sahajwalla et al., 2006). Given the
potential economic opportunities, e-waste recycling business attracts people including both
formal enterprises and informal workshops (Widmer, et al., 2005).
As discussed in Chapter 1.1.3, other than the valuable materials, e-waste also contains many
toxic substances and heavy metals that are easily released by unthoughtful recycling methods
and then pose serious risks to human health and ecological system (Bhuie, et al., 2004; Li, et al.,
2008). Table 2-2 lists the hazardous materials contained within familiar e-waste items or
components.
Table 2-2: Components or e-waste items and corresponding hazardous materials present
COMPONENTS OR ITEMS HAZARDOUS MATERIALS
Batteries Heavy metals such as lead, mercury and cadmium
Cathode ray tubes (CRTs) Lead and mercury in the cone glass and fluorescent layer covering the inside of the panel glass
Printed circuit boards Lead in solder from pre-date RoHS5
Toner cartridges and colour toner Residual ink contains lead, mercury and cadmium
Liquid crystal displays (LCDs) Liquid crystal are toxic, older fluorescent backlights may contain mercury
Plastics containing halogenated flame retardants
Release toxic compounds during incineration and combustion
Gas discharge lamps (fluorescent lamps) Mercury has to be removed
Source from: (Cui & Forssberg, 2003; Gaidajis, et al., 2010)
5 The Directive on the restriction of the use of certain hazardous substances in electrical and electronic
equipment 2002/95/EC, commonly referred to as the Restriction of Hazardous Substances Directive or ROHS.
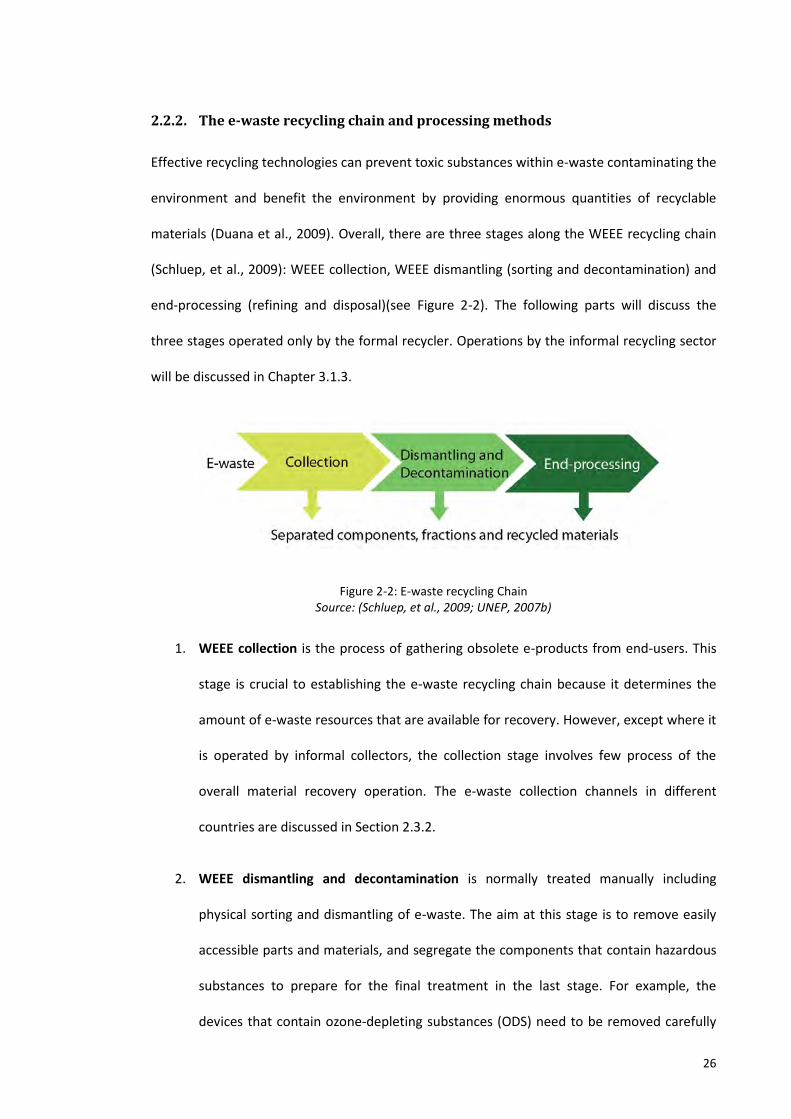
26
2.2.2. The e-waste recycling chain and processing methods
Effective recycling technologies can prevent toxic substances within e-waste contaminating the
environment and benefit the environment by providing enormous quantities of recyclable
materials (Duana et al., 2009). Overall, there are three stages along the WEEE recycling chain
(Schluep, et al., 2009): WEEE collection, WEEE dismantling (sorting and decontamination) and
end-processing (refining and disposal)(see Figure 2-2). The following parts will discuss the
three stages operated only by the formal recycler. Operations by the informal recycling sector
will be discussed in Chapter 3.1.3.
Figure 2-2: E-waste recycling Chain Source: (Schluep, et al., 2009; UNEP, 2007b)
1. WEEE collection is the process of gathering obsolete e-products from end-users. This
stage is crucial to establishing the e-waste recycling chain because it determines the
amount of e-waste resources that are available for recovery. However, except where it
is operated by informal collectors, the collection stage involves few process of the
overall material recovery operation. The e-waste collection channels in different
countries are discussed in Section 2.3.2.
2. WEEE dismantling and decontamination is normally treated manually including
physical sorting and dismantling of e-waste. The aim at this stage is to remove easily
accessible parts and materials, and segregate the components that contain hazardous
substances to prepare for the final treatment in the last stage. For example, the
devices that contain ozone-depleting substances (ODS) need to be removed carefully
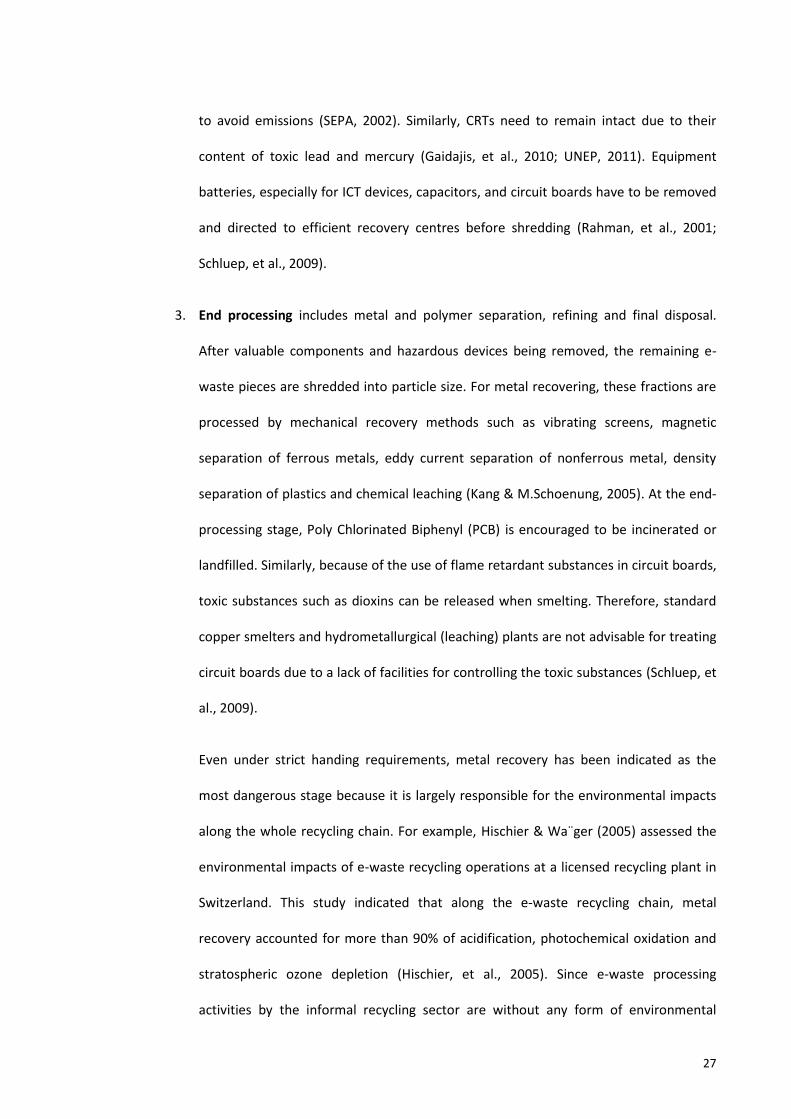
27
to avoid emissions (SEPA, 2002). Similarly, CRTs need to remain intact due to their
content of toxic lead and mercury (Gaidajis, et al., 2010; UNEP, 2011). Equipment
batteries, especially for ICT devices, capacitors, and circuit boards have to be removed
and directed to efficient recovery centres before shredding (Rahman, et al., 2001;
Schluep, et al., 2009).
3. End processing includes metal and polymer separation, refining and final disposal.
After valuable components and hazardous devices being removed, the remaining e-
waste pieces are shredded into particle size. For metal recovering, these fractions are
processed by mechanical recovery methods such as vibrating screens, magnetic
separation of ferrous metals, eddy current separation of nonferrous metal, density
separation of plastics and chemical leaching (Kang & M.Schoenung, 2005). At the end-
processing stage, Poly Chlorinated Biphenyl (PCB) is encouraged to be incinerated or
landfilled. Similarly, because of the use of flame retardant substances in circuit boards,
toxic substances such as dioxins can be released when smelting. Therefore, standard
copper smelters and hydrometallurgical (leaching) plants are not advisable for treating
circuit boards due to a lack of facilities for controlling the toxic substances (Schluep, et
al., 2009).
Even under strict handing requirements, metal recovery has been indicated as the
most dangerous stage because it is largely responsible for the environmental impacts
along the whole recycling chain. For example, Hischier & Wa g̈er (2005) assessed the
environmental impacts of e-waste recycling operations at a licensed recycling plant in
Switzerland. This study indicated that along the e-waste recycling chain, metal
recovery accounted for more than 90% of acidification, photochemical oxidation and
stratospheric ozone depletion (Hischier, et al., 2005). Since e-waste processing
activities by the informal recycling sector are without any form of environmental
28
control, metal recovery by them would be far more hazardous than that from formal
recyclers.
2.2.3. Strategies to avoid e-waste disposal
The principal of 3R’s (reduce, reuse, and recycle) is a well-known concept of waste
minimization. In responses to the 3Rs, there are six e-waste recovery options as follows: direct
reuse, repair, refurbishment, remanufacturing, cannibalization, and recycling (Dhaka, 2010;
Thiery et al., 1995; Zoeteman, et al., 2010). Figure 2-3 shows the priorities of the six WEEE
recovery methods.
Figure 2-3: Priorities of the six sustainability options for WEEE recovery
Source: (Thiery, et al., 1995)
Normally, the average life of a product consists of three stages: active life (the effective use
time), negative life (period of reuse or service time after refurbishing) and storage time (the
time of stockpiling after obsolescence) (UNEP, 2007a). As indicated in Figure 2-3, of the six e-
waste recovery options, five of them refer to reuse strategies to extend the negative life of a
product. By contrast, recycling e-waste is the lowest priority option of the e-waste utilization.
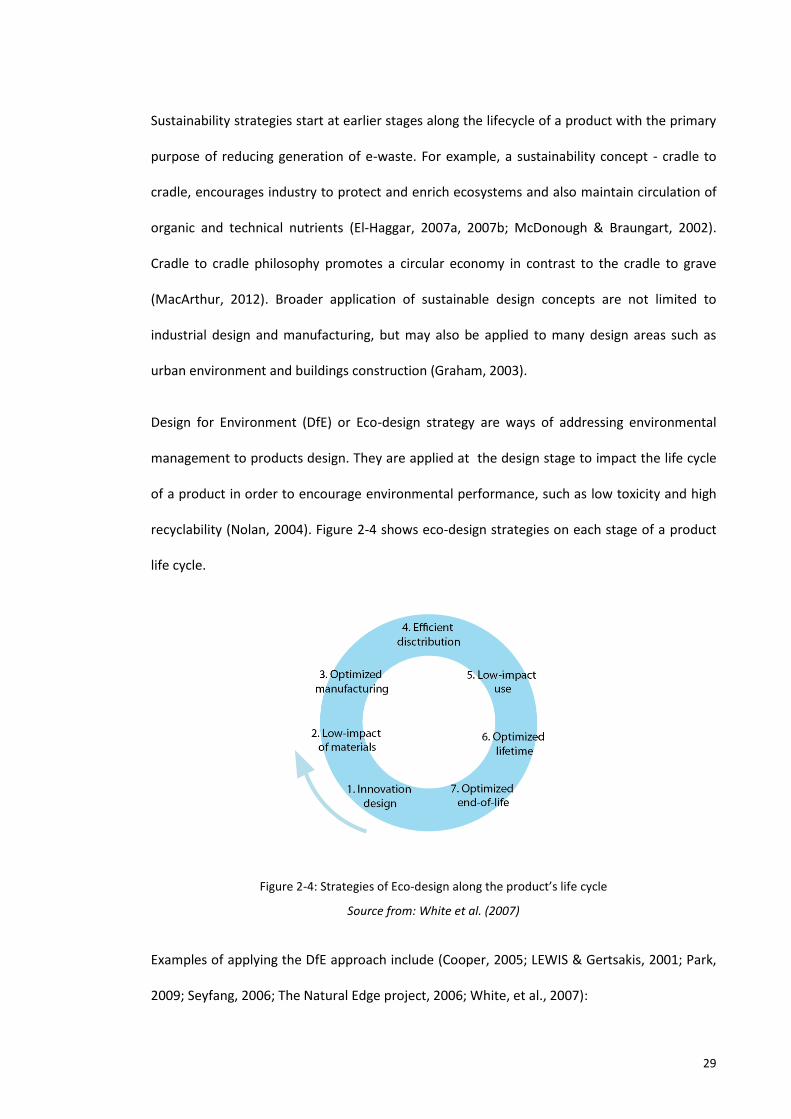
29
Sustainability strategies start at earlier stages along the lifecycle of a product with the primary
purpose of reducing generation of e-waste. For example, a sustainability concept - cradle to
cradle, encourages industry to protect and enrich ecosystems and also maintain circulation of
organic and technical nutrients (El-Haggar, 2007a, 2007b; McDonough & Braungart, 2002).
Cradle to cradle philosophy promotes a circular economy in contrast to the cradle to grave
(MacArthur, 2012). Broader application of sustainable design concepts are not limited to
industrial design and manufacturing, but may also be applied to many design areas such as
urban environment and buildings construction (Graham, 2003).
Design for Environment (DfE) or Eco-design strategy are ways of addressing environmental
management to products design. They are applied at the design stage to impact the life cycle
of a product in order to encourage environmental performance, such as low toxicity and high
recyclability (Nolan, 2004). Figure 2-4 shows eco-design strategies on each stage of a product
life cycle.
Figure 2-4: Strategies of Eco-design along the product’s life cycle
Source from: White et al. (2007)
Examples of applying the DfE approach include (Cooper, 2005; LEWIS & Gertsakis, 2001; Park,
2009; Seyfang, 2006; The Natural Edge project, 2006; White, et al., 2007):
30
1. Encouraging reduce ecological footprints (low-impact use);
2. Encouraging longer life of products and slower obsolescence (optimized lifetime);
3. Reducing the overall number of parts and materials used (low-impact of materials);
4. Standardisation of components for easy repair, cleaning and replacement (innovation
design);
5. Avoiding glues that make sorting difficult (low-impact of materials);
6. Using water-based paints which can be easily dissolved (low-impact of materials);
7. Encouraging and promoting the green package (innovation design);
In addition to the eco-design strategies mentioned above, “product leasing” is also regarded as
an effective method of optimizing lifetime and end-of-life stages (The Natural Edge project,
2006). Australia has leased more than 600,000 computers before 2001 and approximately
240,000 computers are collectively returned from leasing institutions annually (Meinhardt,
2006). In addition, according to the EU directive, after 2005 producers had to label a WEEE
symbol on an EEE product before placing it on the market (EU., 2003). Producers are obligated
to provide information for refurbishment, treatment, and reuse of EEE. The “eco-labelling” can
also help consumers make informed purchases by endorsing environmentally responsible
products. Moreover, placing “warning labels” on products is also a positive reminder for
popularizing the information on toxicity and facilitate recycling when customers disposing EOL
products (The Natural Edge project, 2006).
While there are various strategies that can minimize e-waste generation and optimize the life
cycle of a product, it is unavoidable that the quantities of e-waste increase considerably due to
the growing market in developing countries and rapid obsolescence in affluent countries
(Goosey, 2004; Schluep, et al., 2009, p. 50; UNEP, 2007a). After e-products become obsolete
31
and discarded by users, sound e-waste recycling systems in many developed countries take
over the responsibilities of managing and recycling e-waste.
2.3. Who is responsible? - Recycling systems and management in
developed countries
Many countries have established their own formal e-waste recycling systems. The following
sections describe the collection and recycling systems, which are based on the principal
strategy of WEEE management - Extended Producer Responsibility (EPR) strategy. The EPR
influences majority of global WEEE regulations and provide an institutional framework for e-
waste collection, recycling and treatment in developed countries. A well-defined EPR is
essential for establishing an effective WEEE management system, formulating detailed
financial and physical responsibilities for all stakeholders (Lindquist, 2000; Zoeteman, et al.,
2010).
2.3.1. Extended Producer Responsibility (EPR)
In order to establish a well-structured recycling system, OECD governments have spent
considerable effort on establishing legislative reforms. In response to the WEEE Directive
2002/96/EC, which aims to reduce WEEE generation, enhance eco-design and encourage
sustainable recovery, all EU members are obligated to have an operational EOL recovery
system by 2005 (EU., 2003). Meanwhile, a Polluter-Pays Principle (PPP) was originally
advocated as a measure of addressing the responsibilities of the Original Equipment
Manufacturers (OEMs); it was adopted in a majority of developed countries before the
appearance of Extended Producer Responsibility (EPR) (OECD, 2001).
“EPR is an environmental policy approach in which a producer’s responsibility for a product
(physical and/or financial) is extended to the post-consumer stage of a product’s life cycle
(OECD, 2001, p. 18).”
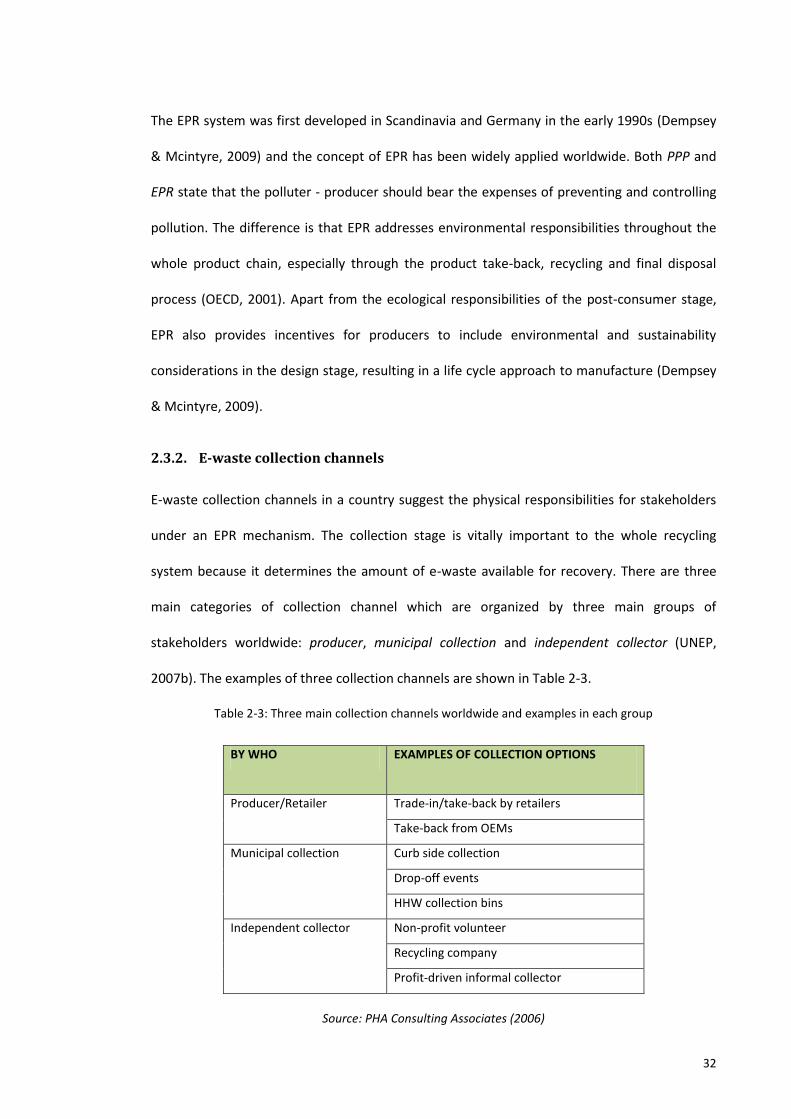
32
The EPR system was first developed in Scandinavia and Germany in the early 1990s (Dempsey
& Mcintyre, 2009) and the concept of EPR has been widely applied worldwide. Both PPP and
EPR state that the polluter - producer should bear the expenses of preventing and controlling
pollution. The difference is that EPR addresses environmental responsibilities throughout the
whole product chain, especially through the product take-back, recycling and final disposal
process (OECD, 2001). Apart from the ecological responsibilities of the post-consumer stage,
EPR also provides incentives for producers to include environmental and sustainability
considerations in the design stage, resulting in a life cycle approach to manufacture (Dempsey
& Mcintyre, 2009).
2.3.2. E-waste collection channels
E-waste collection channels in a country suggest the physical responsibilities for stakeholders
under an EPR mechanism. The collection stage is vitally important to the whole recycling
system because it determines the amount of e-waste available for recovery. There are three
main categories of collection channel which are organized by three main groups of
stakeholders worldwide: producer, municipal collection and independent collector (UNEP,
2007b). The examples of three collection channels are shown in Table 2-3.
Table 2-3: Three main collection channels worldwide and examples in each group
BY WHO EXAMPLES OF COLLECTION OPTIONS
Producer/Retailer Trade-in/take-back by retailers
Take-back from OEMs
Municipal collection Curb side collection
Drop-off events
HHW collection bins
Independent collector Non-profit volunteer
Recycling company
Profit-driven informal collector
Source: PHA Consulting Associates (2006)
33
Producer/retailer take-back allows the consumer to return the e-waste to retailers or
directly to the manufacturer or distributor. Normally, retailer take-back schemes are
arranged by relevant producers. Meanwhile, retailers can promote their products by
encouraging customers to return old products to get a discount on new purchases or
cash back for the old item. Some retailer take-back schemes may depend upon the
purchase of new electronic products and some may not, such as in Japan. Here,
customers can return e-waste to retailers without buying new items (Chung &
Murakami-Suzuki, 2008; Lee & Na, 2010). The retailer and producer take-back schemes
are aimed at different groups of end-users. For example, retailer take-back programs
mainly target individual end-users (Business to Consumer) (B2C) while the producer
take-back programmes aim at groups (Business to Business) (B2B) and large quantities
of EOL products from institutions (UNEP, 2007b). The latter often exists as a form of
product leasing arrangement, so the manufacturer is not only providing repair service
to the leaser, but is also responsible for taking back their EOL products.
Municipal collection is widely applied in many affluent societies such as the U.S.,
Canada, EU countries, and Australia. Municipal collection appears in various forms,
including periodical collections such as kerbside pick-up, drop-off events (Kang &
M.Schoenung, 2005) and collection bins to collect the household hazardous waste
(HHW) component (PHA Consulting Associates, 2006). The detailed implementation of
collection practices vary greatly in countries due to different WEEE management and
legislative frameworks.
Apart from producer take-back and municipal collection, independent collection exists
in both developed and developing countries, involving non-profit collection or profit-
driven collection operations (PHA Consulting Associates, 2006). The non-profit
collection activities are mostly organized by non-profit volunteers or Non-Government
34
Organizations (NGOs) while many profit-driven collections are self-organized by
informal individual collectors.
The collection operations in developed countries mainly depend on formal collection channels
such as municipal collection and producer/retailer take-back. By contrast, e-waste collection
and recycling in developing countries emphasizes a high level of informal recyclers (European
Communities, 2006; Wu & Yenming J, 2007). Although various collection projects and channels
have been established in countries, the efficiency of collection rate varies greatly (Darby &
Obara, 2005; Huisman J, 2008; Kang & M.Schoenung, 2005).
2.3.3. Physical and financial instruments of EPR
The EPR for EOL products are divided into physical responsibility (who collects/recycles?) and
financial responsibilities (who pays?). A well-implemented EPR strategy should clearly indicate
who should collect and who should pay. According to the EPR, the producer is not the only
stakeholder to take on responsibilities because part responsibilities (either physical or financial)
can be passed on to other stakeholders (OECD, 2001).
Under the EPR strategies, there are two generic collection mechanisms through which the
producers can take physical and financial responsibility in different ways (Rotter et al., 2009):
Collective Producer Responsibility (CPR) and Individual Producer Responsibility (IPR). Under the
CPR system, producers are collectively responsible for WEEE generation of all e-products
(Dempsey & Mcintyre, 2009, p. 215), while under the IPR system, manufacturers are only
responsible for the products arising from themselves (Dempsey & Mcintyre, 2009). Therefore,
when under the CPR system, all producers share the financial responsibilities according to their
market share of products while under the IPR system, producers financially responsible for
collected e-waste. These two systems applied in different countries according to the local
circumstances such as e-waste generation and the density of population. For example, CPR is
35
preferable in less densely populated regions because a single producer has significantly less
access to e-waste resources compared to that in urban areas (OECD, 2001).
Physical and economic responsibilities are shifting in countries due to different WEEE
legislation and established collection mechanisms (Rossem et al., 2006; UNEP, 2007b). For
instance, producers in Japan and South Korea are more physically involved in WEEE recycling.
Under the WEEE collection system in Japan, producers have to fulfil legal obligations to take-
back and recycle their EOL products either by themselves or by making contracts with third-
party companies (BiBo & Yamamoto, 2010; Chung & Murakami-Suzuki, 2008; European
Communities, 2006; Kejing & Shanshan, 2009). Therefore, in Japan or South Korea, some
producers or a group of producers own recycling facilities by themselves (Chong, et al., 2009;
Lee et al., 2007). By contrast, Taiwan and the producers in California are only financially
obliged to EPR and e-waste collection operations are conducted by municipal collection
systems (Lee & Na, 2010; Manomaivibool et al., 2008).
2.3.4. Economic incentives for producers
The EPR strategy indicates not only the responsibilities of e-waste, but also suggests the
economic incentives for producers. According to the EPR, producers can pass on the financial
responsibility to customers. There are three economic instruments to share the financial
responsibility with customers, which are as follows:
An Advanced Recycling Fee (ARF) is a recycling fee paid by customers when they
purchase electronic products (Schluep, et al., 2009). This fee is levied based on the
estimated costs of collection and treatment of products in the context of EPR (OECD,
2001). However, ARF is only applied in a limited number of regions and at varying
levels around the world. For example, in some states of U.S., video display devices
measuring more than four inches (10.16 cm) are subject to the fee (Equalization, 2012).
36
An End-of-Life Fee is charged when end-users dispose of the obsolete product. Such
an instrument is also applied in limited regions, such as in Australia and Japan. For
example, end-users in Japan have to pay a Recycling Fee when disposing of large
households appliances through a recycling tickets system (BiBo & Yamamoto, 2010;
Chung & Murakami-Suzuki, 2008; European Communities, 2006; Kejing & Shanshan,
2009).
A Deposit-refund system requires a payment/deposit when the product is purchased
and the deposit is refunded fully or partially when the product is returned. South
Korea is one country which collected households’ e-waste based on the deposit-refund
scheme. Although the collection rate in South Korea increased gradually during the
implementation period, from 1993 to 1999, the collection rate was still under 10% and
considered to be quite low (Chung & Murakami-Suzuki, 2008). This incentive is mostly
used for collecting high numbers of particular recyclables such as bottles and cans. For
the collection of e-waste items, it applies to a limited range and only includes such as
batteries and fluorescent light bulbs in few countries (OECD, 2001).
Other than the three economic instruments associated with customers, there are other
economic incentives for producers such as material taxes and subsidies (OECD, 2001).
In addition to economic incentives for producers, EPR also has detailed models to guide
producers in how to allocate their financial decisions and fund the supply chains of e-waste
recycling (UNEP, 2007b). There are five widely applied financial models connected with the
above economic incentives for producers and provide guidance for producers to allocate funds.
Appendix A2 shows the five financial models and relevant economic instruments in EPR.
Normally, the recycling fee that collected from customers and producers would be passed to a
“Producer Responsibility Organisation”(PRO), which is responsible for e-waste collection,
37
transportation and recycling on the basis of the fundamental principal of EPR (UNEP, 2007a).
When using economic instruments, some of the physical and financial responsibilities of the
WEEE system have to be allocated first because it determines how recycling fees or tax
revenues from stakeholders are apportioned (OECD, 2001).
As discussed, the EPR indicates the detailed e-waste management strategies in terms of who
collects, who pays, how to motive, and how to finance the whole recycling chain. However, the
development and implementation of EPR varies considerably around the world. Many EU
countries such as Switzerland, The Netherlands, Belgium and Sweden are in an advanced stage
of implementing the legislation, constructing advanced recovery facilities, and establishing
collection systems (Zoeteman, et al., 2010). Japan and Taiwan are frontrunners of WEEE
management among Asian countries (Chung & Murakami-Suzuki, 2008). By contrast, the
implementation of EPR is slow in many developing countries and some countries do not have
EPR or any formal recycling system.
2.3.5. WEEE management in developing countries
E-waste collection and recycling in many developing countries are characterized by a high level
of self-organized informal recycling sectors (Boeni, et al., 2006; SAKANO, 2007; Streicher-Porte,
2005). As discussed in Chapter 1.1, informal recycling sectors process e-waste by rudimentary
methods and have caused severe negative impacts to the environment and human health. The
countries that mainly depend on informal recycling systems include Cambodia, Yemen, Lagos,
Nigeria, India, Malaysia, Sri Lanka, Thailand, and China (Boeni, et al., 2006; SAKANO, 2007;
Streicher-Porte, 2005; UNEP, 2007a, 2007b).
Table 2-4 maps the level of development of WEEE recycling systems in selected developing
countries, which depend on the informal recycling sector or barely have any form of formal
recycling system. Three important aspects associated with the level of development of e-waste

38
recycling in a country are compared and ranked. The three aspects include a legal framework,
separate collection channels, and recycling technologies.
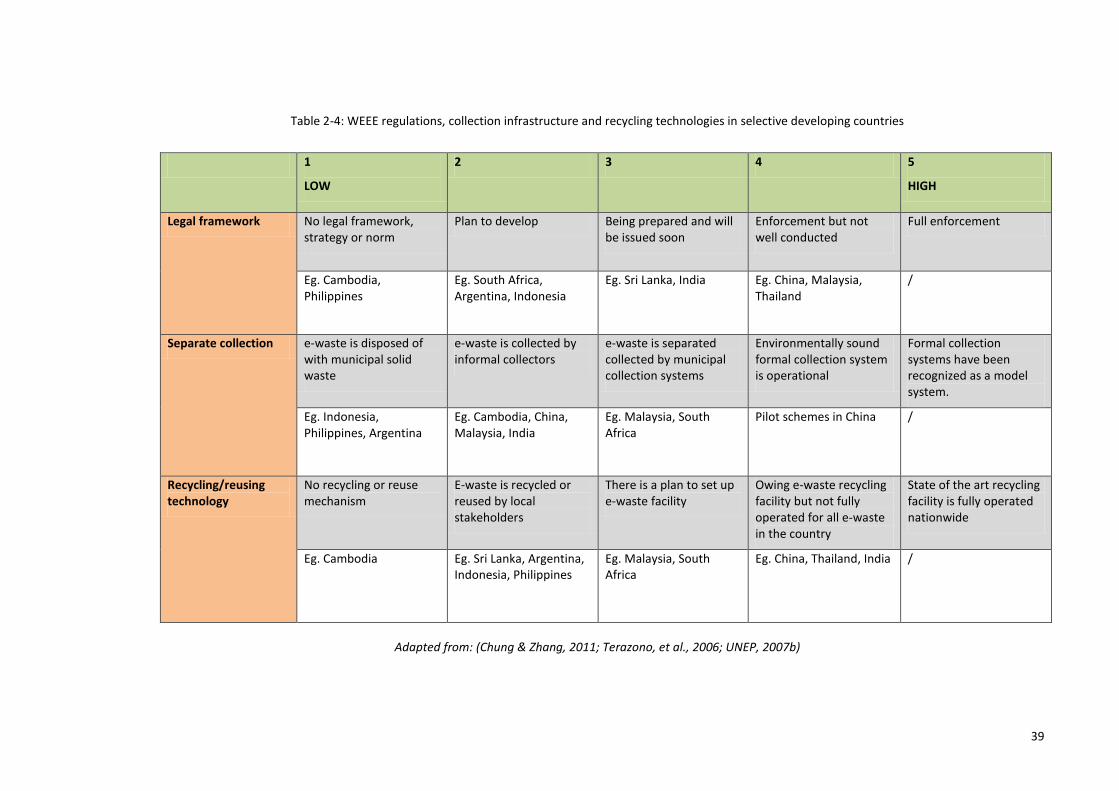
39
Table 2-4: WEEE regulations, collection infrastructure and recycling technologies in selective developing countries
1
LOW
2 3 4 5
HIGH
Legal framework No legal framework, strategy or norm
Plan to develop Being prepared and will be issued soon
Enforcement but not well conducted
Full enforcement
Eg. Cambodia, Philippines
Eg. South Africa, Argentina, Indonesia
Eg. Sri Lanka, India Eg. China, Malaysia, Thailand
/
Separate collection e-waste is disposed of with municipal solid waste
e-waste is collected by informal collectors
e-waste is separated collected by municipal collection systems
Environmentally sound formal collection system is operational
Formal collection systems have been recognized as a model system.
Eg. Indonesia, Philippines, Argentina
Eg. Cambodia, China, Malaysia, India
Eg. Malaysia, South Africa
Pilot schemes in China /
Recycling/reusing technology
No recycling or reuse mechanism
E-waste is recycled or reused by local stakeholders
There is a plan to set up e-waste facility
Owing e-waste recycling facility but not fully operated for all e-waste in the country
State of the art recycling facility is fully operated nationwide
Eg. Cambodia Eg. Sri Lanka, Argentina, Indonesia, Philippines
Eg. Malaysia, South Africa
Eg. China, Thailand, India /
Adapted from: (Chung & Zhang, 2011; Terazono, et al., 2006; UNEP, 2007b)
40
Legal framework: A legal framework is an important indicator of e-waste management
in a country in terms of providing official criteria of enforcement for infringements. As
indicated in Table 2-4, many developing countries have begun to formulate their WEEE
legislative frameworks. Countries like China, Malaysia, and Thailand have created
timely WEEE legislation despite not being well developed. By contrast, the level of
legislative development in many other developing countries varies greatly while some
still have no legal framework. However, even in the countries that have established
legal frameworks, such as China, many studies have indicated that the effectiveness of
regulations have been hindered because most regulations are directly interpreted
from EU directives which contain little consideration of local informal recycling
systems (Manomaivibool, et al., 2008; Sinha-Khetriwal et al., 2005; UNEP, 2011; Yang,
et al., 2008).
Separate collection: As also indicated in Table 2-4, e-waste collection infrastructures in
many developing countries is still in a low-level development. Many countries have no
formal collection channel/infrastructure for e-waste disposal and much e-waste is
disposed of along with municipal refuse (e.g. in Indonesia, Philippines and Argentina).
By contrast, the e-waste in Cambodia, China, Malaysia, and India are collected by self-
organized informal sectors. No country in the table has effective e-waste collection
infrastructure operated under formal collection systems.
Recycling and reuse facilities in a country are essential to environmental controlled e-
waste recycling operations and the sustainability of e-waste recycling. As indicated in
Table 2-4, many countries still do not have any formal recycling facilities. Even
countries that own advanced e-waste recycling facilities such as China, Thailand and
India, they are not fully operational (Chi, et al., 2011). From the literature, local
informal recyclers compete with formal sectors and are incompatible with the formal
41
recycling sector and the advanced recycling technologies (Yang, et al., 2008). As a
result, environmental issues associated with informal e-waste recycling are still a
serious problem in nearly all developing countries.
All in all, due to the predominance of the informal recycling sectors in developing countries,
simply establishing a formal collection infrastructure or introducing e-waste legislative
framework from advanced countries is difficult to improve the e-waste recycling systems in
developing countries. Under the informal recycling systems, many informal sectors operate
beyond official supervision. No matter how effective new legislation appears to be or what
improvements are made to current formal recycling systems, informal recycling operations are
hard to supervise and control. Although there are many successful practices in WEEE
management in some leading countries, it is difficult to replicate directly successful WEEE
legislative frameworks or recycling mechanisms in developing countries due to varying
recycling systems and cultures (Sinha-Khetriwal, et al., 2005). In order to mitigate the e-waste
problems in developing countries, it is necessary to understand local informal recycling sectors
before proposing effective strategies. The next chapter will identify the characteristics of the
informal recycling sector and discuss the vitality of informal recyclers in China.
42
CHAPTER 3: E-WASTE RECYCLING IN CHINA
Although the formal recycling system has gradually been established in China, the informal e-
waste recycling sector still dominates e-waste collection and recycling. This chapter identifies
the features of both informal and formal recycling systems in China. It discusses the Chinese e-
waste regulations and strategies to establish formal recycling systems.
3.1. Formal and informal e-waste recycling sectors
E-waste recycling in China can be divided into two: a formal recycling sector and an informal
recycling sector. Each recycling sector is comprised of a series of stakeholders that perform
specific roles in a complex supply chain. Formal stakeholders in this study refer to those
sectors involved in the collection or recycling operations, which are organized or regulated by
the government, municipality, or producers/retailers. Informal stakeholders are mostly
unregistered individuals and businesses involved with e-waste recycling.
3.1.1. E-waste collection channels in China
E-waste flows into either formal or informal recycling systems through various collection
channels. Institutions/enterprises/government, individuals/households and original equipment
manufacturers (OEMs) are regarded as three groups of e-waste generators when discussing e-
waste resources. The e-waste collection channels conducted by both formal and informal
stakeholders in China are as follow:
1. Informal door-to-door collectors: The door-to-door collector is a conventional
collection channel in China, which depends on collectors travelling door-to-door to
purchase obsolete products from households. The majority of Chinese households use
door-to-door collectors to recycle e-waste and more than 60% of e-waste is collected
by this way (Wang et al., 2011). Compared to many e-waste collection sites requiring
43
households to return their obsolete products, the door-collection service is convenient
(Schluep, et al., 2009). A detailed description of this category of informal collectors is
in Chapter 4.2 below.
2. Second-hand markets: The second-hand market is composed of repair shops. Because
both registered and informal repair shops exist in China, it is difficult to define the
nature of the second-hand market. In addition to the repair services offered by formal
repair shops, the informal repair shops also offer second-hand appliances for sale. The
literature suggests that only small numbers of e-waste in second-hand markets directly
come from households (Yang, et al., 2008). Majority of second-hand products are
received from informal collectors and informal dismantling centres (Wang, et al., 2011).
However, according to the survey results in this research, a large percentage of
households directly sold their obsolete products in second-hand markets, particularly
the smaller electronic products (refer the results in Chapter 7.2).
3. Formal on-line trading: As a result of the development of consumer to consumer (C2C)
on-line trading platforms, China has become one of the largest Internet market in the
world in terms of the volume of on-line transaction (Wong et al., 2004). Households
are able to sell their obsolete but functional products on-line, a strategy that might
provide more financial reward than selling to informal collectors or physical second-
hand markets.
4. Formal trial trade-in scheme: A trial trade-in scheme operated from 2009 to 2011
(hereafter as trade-in scheme) encouraged households to return their obsolete
products to assigned local retailers. In addition to receiving a discount for purchasing
new items, households could also get a compensation for recycling the product (A
detailed description appears in Chapter 4.3).
44
5. Formal producer take-back: In response to the WEEE regulations in China, a number
of producers have launched take-back schemes free of charge, including many well-
known companies such as Nokia, DELL, LENOVO, HP and Motorola (Chi, et al., 2011;
European Communities, 2006; Lu, 2008). The take-back activities mainly target large
quantities of e-waste from institutions and enterprises.
6. Formal e-waste/ hazardous waste bins: In addition to the manufacturer and retailer
take-back schemes, municipalities in China have established garbage bins for
hazardous waste in communities in the eight cities of Shanghai, Beijing, Guangzhou,
Shenzhen, Hangzhou, Nanjing, Xiamen, and Guilin (Xinhua, 2011).
7. Others channels: There are also small numbers of e-waste items submitted directly to
formal collection companies (Liu., et al., 2006; Zeng et al., 2010), or through donation
to charities.
According to a number of informal reports, enormous quantities of e-waste are collected by
various collection channels in cities and will be sorted and dismantled in the rural-urban
continuum areas (Huaxin green spring, 2006; tec, 2010). After dismantling and classification,
functional parts and products are sent back to the second-hand markets in city areas. The rest
of this dismantled e-waste after dismantling (called e-scrap) is transferred to rural areas for
deep-processing. Familiar destinations for e-waste end-processing include Shantou, Taizhou,
Qingyuan and Foshan (tec, 2010). Figure 3-1 indicates the e-waste distribution and processing
between urban and rural areas in China.
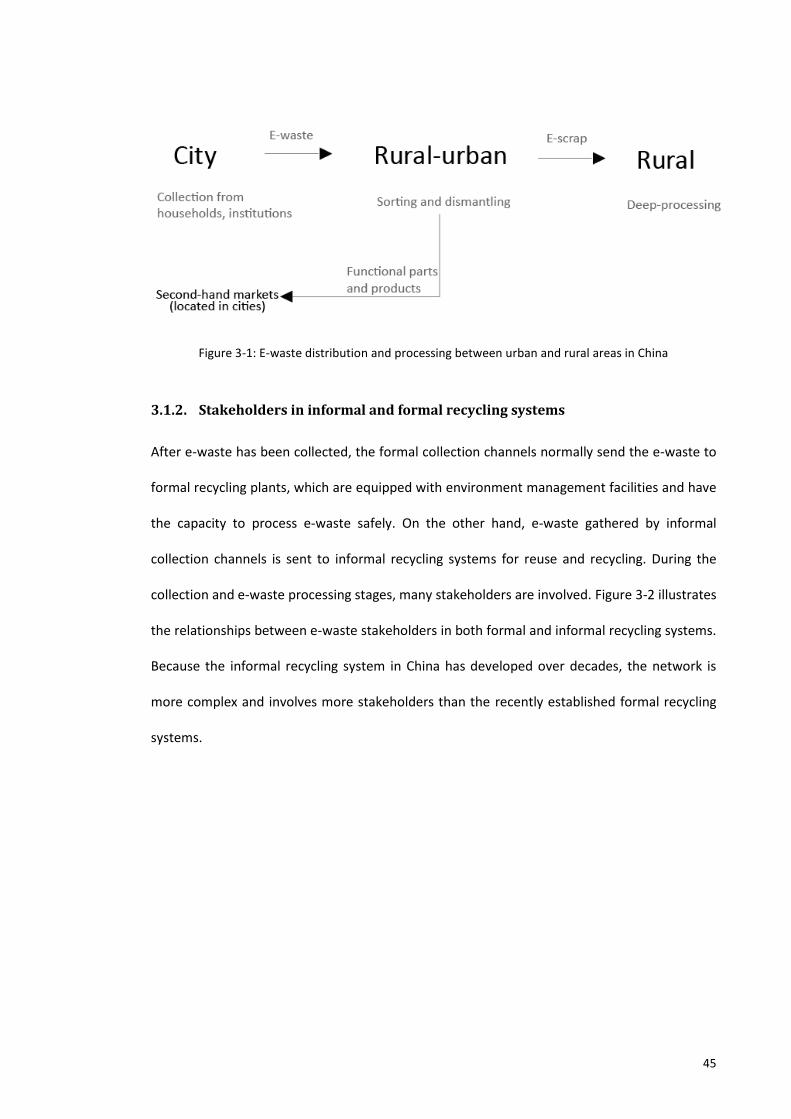
45
Figure 3-1: E-waste distribution and processing between urban and rural areas in China
3.1.2. Stakeholders in informal and formal recycling systems
After e-waste has been collected, the formal collection channels normally send the e-waste to
formal recycling plants, which are equipped with environment management facilities and have
the capacity to process e-waste safely. On the other hand, e-waste gathered by informal
collection channels is sent to informal recycling systems for reuse and recycling. During the
collection and e-waste processing stages, many stakeholders are involved. Figure 3-2 illustrates
the relationships between e-waste stakeholders in both formal and informal recycling systems.
Because the informal recycling system in China has developed over decades, the network is
more complex and involves more stakeholders than the recently established formal recycling
systems.
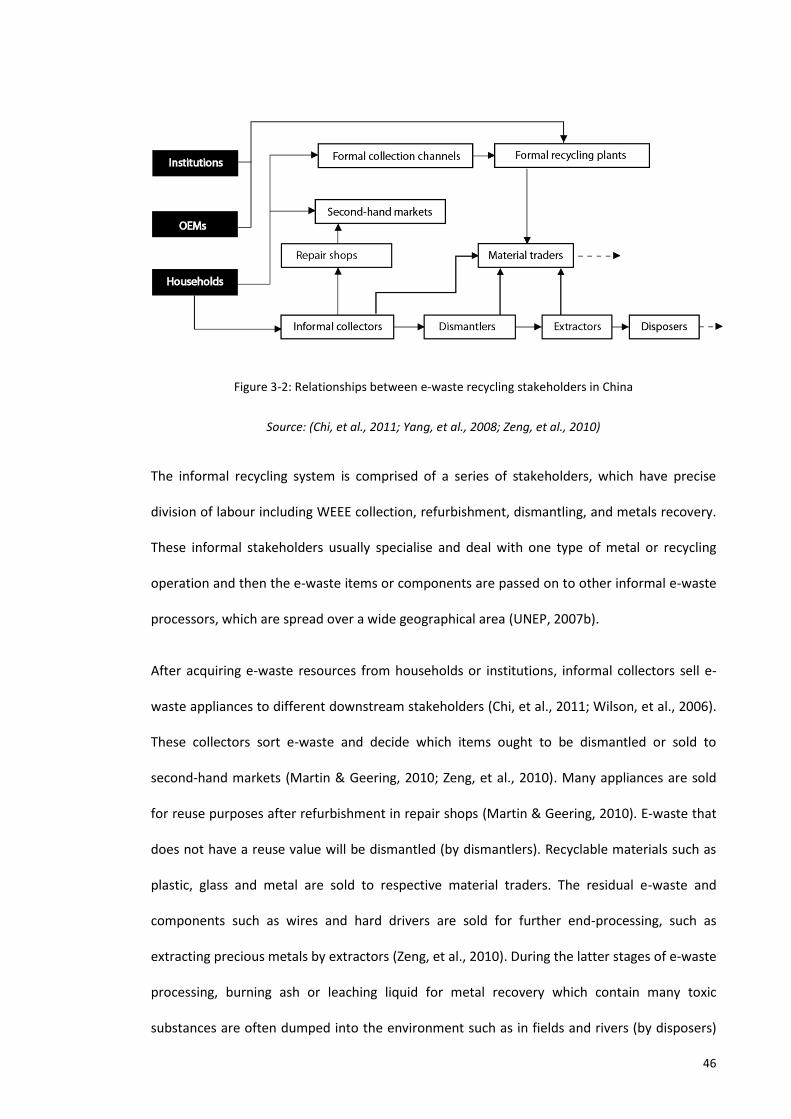
46
Figure 3-2: Relationships between e-waste recycling stakeholders in China
Source: (Chi, et al., 2011; Yang, et al., 2008; Zeng, et al., 2010)
The informal recycling system is comprised of a series of stakeholders, which have precise
division of labour including WEEE collection, refurbishment, dismantling, and metals recovery.
These informal stakeholders usually specialise and deal with one type of metal or recycling
operation and then the e-waste items or components are passed on to other informal e-waste
processors, which are spread over a wide geographical area (UNEP, 2007b).
After acquiring e-waste resources from households or institutions, informal collectors sell e-
waste appliances to different downstream stakeholders (Chi, et al., 2011; Wilson, et al., 2006).
These collectors sort e-waste and decide which items ought to be dismantled or sold to
second-hand markets (Martin & Geering, 2010; Zeng, et al., 2010). Many appliances are sold
for reuse purposes after refurbishment in repair shops (Martin & Geering, 2010). E-waste that
does not have a reuse value will be dismantled (by dismantlers). Recyclable materials such as
plastic, glass and metal are sold to respective material traders. The residual e-waste and
components such as wires and hard drivers are sold for further end-processing, such as
extracting precious metals by extractors (Zeng, et al., 2010). During the latter stages of e-waste
processing, burning ash or leaching liquid for metal recovery which contain many toxic
substances are often dumped into the environment such as in fields and rivers (by disposers)
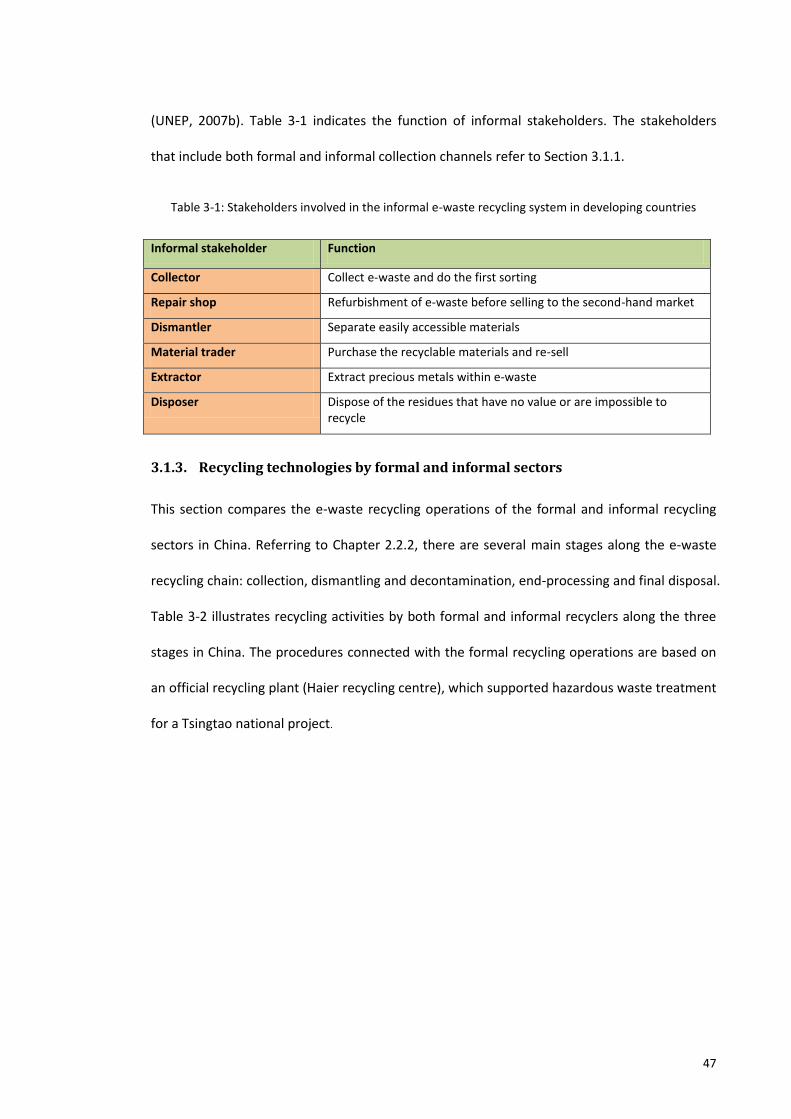
47
(UNEP, 2007b). Table 3-1 indicates the function of informal stakeholders. The stakeholders
that include both formal and informal collection channels refer to Section 3.1.1.
Table 3-1: Stakeholders involved in the informal e-waste recycling system in developing countries
Informal stakeholder Function
Collector Collect e-waste and do the first sorting
Repair shop Refurbishment of e-waste before selling to the second-hand market
Dismantler Separate easily accessible materials
Material trader Purchase the recyclable materials and re-sell
Extractor Extract precious metals within e-waste
Disposer Dispose of the residues that have no value or are impossible to recycle
3.1.3. Recycling technologies by formal and informal sectors
This section compares the e-waste recycling operations of the formal and informal recycling
sectors in China. Referring to Chapter 2.2.2, there are several main stages along the e-waste
recycling chain: collection, dismantling and decontamination, end-processing and final disposal.
Table 3-2 illustrates recycling activities by both formal and informal recyclers along the three
stages in China. The procedures connected with the formal recycling operations are based on
an official recycling plant (Haier recycling centre), which supported hazardous waste treatment
for a Tsingtao national project.
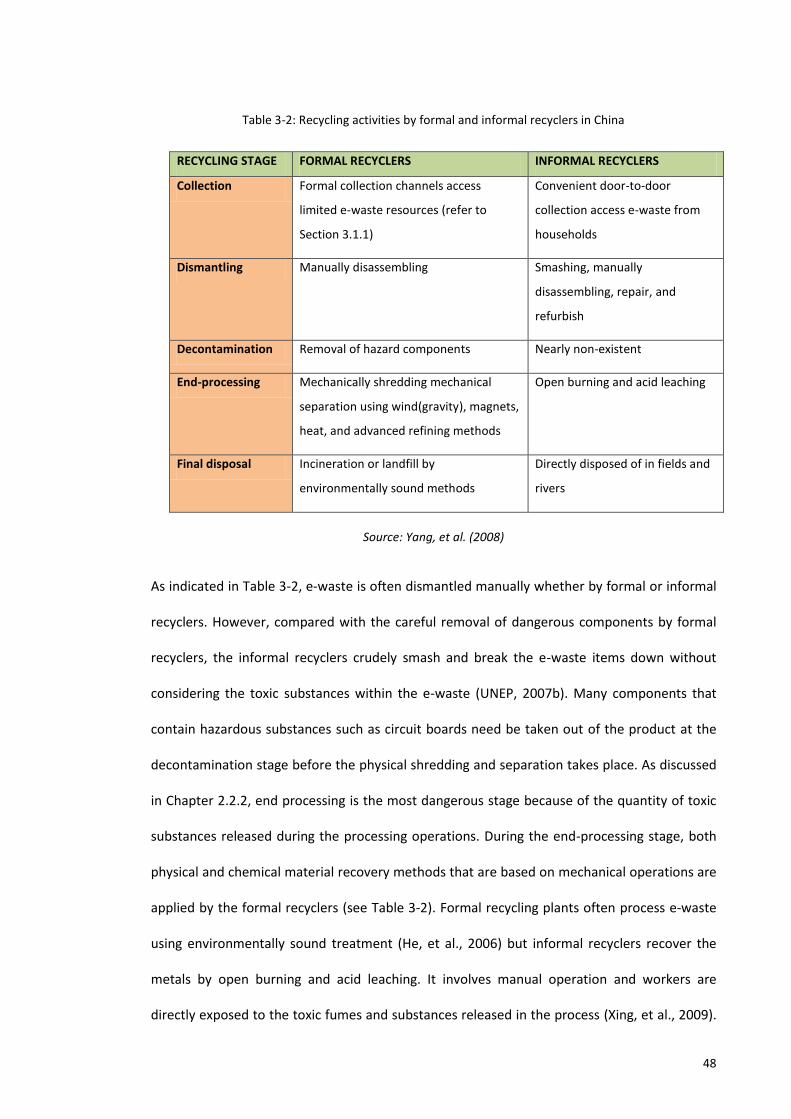
48
Table 3-2: Recycling activities by formal and informal recyclers in China
RECYCLING STAGE FORMAL RECYCLERS INFORMAL RECYCLERS
Collection Formal collection channels access
limited e-waste resources (refer to
Section 3.1.1)
Convenient door-to-door
collection access e-waste from
households
Dismantling Manually disassembling Smashing, manually
disassembling, repair, and
refurbish
Decontamination Removal of hazard components Nearly non-existent
End-processing Mechanically shredding mechanical
separation using wind(gravity), magnets,
heat, and advanced refining methods
Open burning and acid leaching
Final disposal Incineration or landfill by
environmentally sound methods
Directly disposed of in fields and
rivers
Source: Yang, et al. (2008)
As indicated in Table 3-2, e-waste is often dismantled manually whether by formal or informal
recyclers. However, compared with the careful removal of dangerous components by formal
recyclers, the informal recyclers crudely smash and break the e-waste items down without
considering the toxic substances within the e-waste (UNEP, 2007b). Many components that
contain hazardous substances such as circuit boards need be taken out of the product at the
decontamination stage before the physical shredding and separation takes place. As discussed
in Chapter 2.2.2, end processing is the most dangerous stage because of the quantity of toxic
substances released during the processing operations. During the end-processing stage, both
physical and chemical material recovery methods that are based on mechanical operations are
applied by the formal recyclers (see Table 3-2). Formal recycling plants often process e-waste
using environmentally sound treatment (He, et al., 2006) but informal recyclers recover the
metals by open burning and acid leaching. It involves manual operation and workers are
directly exposed to the toxic fumes and substances released in the process (Xing, et al., 2009).
49
Moreover, after the end-processing stage, many residues that contain large quantities of toxic
substances are directly disposed of in nearby fields, rivers or even by open burning by the
informal recyclers. The environment and human health within or around the informal recycling
areas can be seriously degraded by the rudimentary e-waste processing methods (refer to the
environmental impacts in Chapter 1.1).
Although the formal operations have far more environmentally safe facilities than informal
operations in China, it is hard for formal recycling plants to obtain sufficient e-waste resources
from households. A well-developed collection system handling abundant e-waste resources for
downstream recycling sectors is absent. As indicated in Table 3-2, informal collectors purchase
obsolete products door-to-door while the formal collection channels only obtain limited e-
waste resources from households. Consequently, many formal recycling plants cannot
maintain normal running due to the lack of WEEE resources (Yang, et al., 2008). Next section
compares the cost and profits between formal and informal sectors in order to identify why
formal recycling system is hard to survive in China.
3.1.4. Cost and profits in the formal and informal recycling sectors
In order to identify the vitality of the informal sectors, this section compares the operating
costs of informal and formal recyclers. Four aspects of recycling costs are discussed: payment
to owner, transportation cost, value after recycling (value after material recovery or
refurbishment of appliances) and final profits. The formal recycling operations that are based
on the Tsingtao national project was conducted in 2004 in Tsingtao, Shandong province,
established a formal collection network and developed key technologies and equipment for
WEEE recycling.
The Tsingtao national project established a scalable recycling plant, which was designed to
process 200,000 household appliances and with an ultimate capacity of up to 600,000 in the
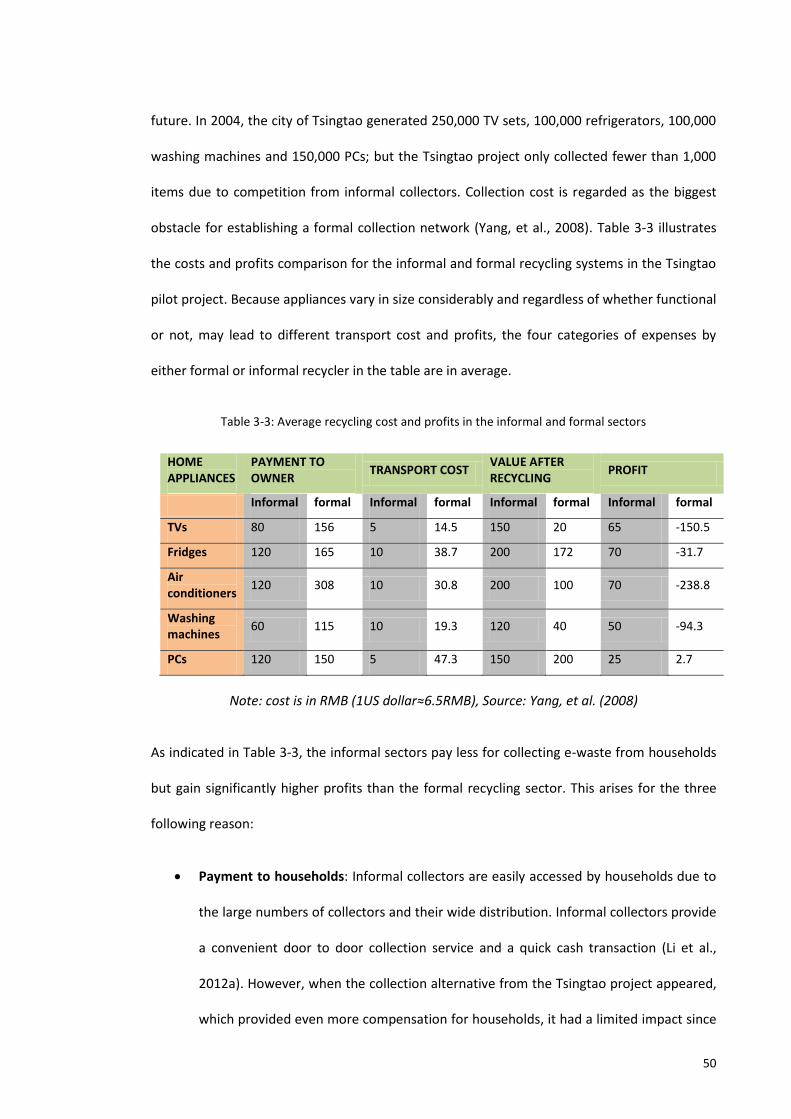
50
future. In 2004, the city of Tsingtao generated 250,000 TV sets, 100,000 refrigerators, 100,000
washing machines and 150,000 PCs; but the Tsingtao project only collected fewer than 1,000
items due to competition from informal collectors. Collection cost is regarded as the biggest
obstacle for establishing a formal collection network (Yang, et al., 2008). Table 3-3 illustrates
the costs and profits comparison for the informal and formal recycling systems in the Tsingtao
pilot project. Because appliances vary in size considerably and regardless of whether functional
or not, may lead to different transport cost and profits, the four categories of expenses by
either formal or informal recycler in the table are in average.
Table 3-3: Average recycling cost and profits in the informal and formal sectors
HOME APPLIANCES
PAYMENT TO OWNER
TRANSPORT COST VALUE AFTER RECYCLING
PROFIT
Informal formal Informal formal Informal formal Informal formal
TVs 80 156 5 14.5 150 20 65 -150.5
Fridges 120 165 10 38.7 200 172 70 -31.7
Air conditioners
120 308 10 30.8 200 100 70 -238.8
Washing machines
60 115 10 19.3 120 40 50 -94.3
PCs 120 150 5 47.3 150 200 25 2.7
Note: cost is in RMB (1US dollar≈6.5RMB), Source: Yang, et al. (2008)
As indicated in Table 3-3, the informal sectors pay less for collecting e-waste from households
but gain significantly higher profits than the formal recycling sector. This arises for the three
following reason:
Payment to households: Informal collectors are easily accessed by households due to
the large numbers of collectors and their wide distribution. Informal collectors provide
a convenient door to door collection service and a quick cash transaction (Li et al.,
2012a). However, when the collection alternative from the Tsingtao project appeared,
which provided even more compensation for households, it had a limited impact since
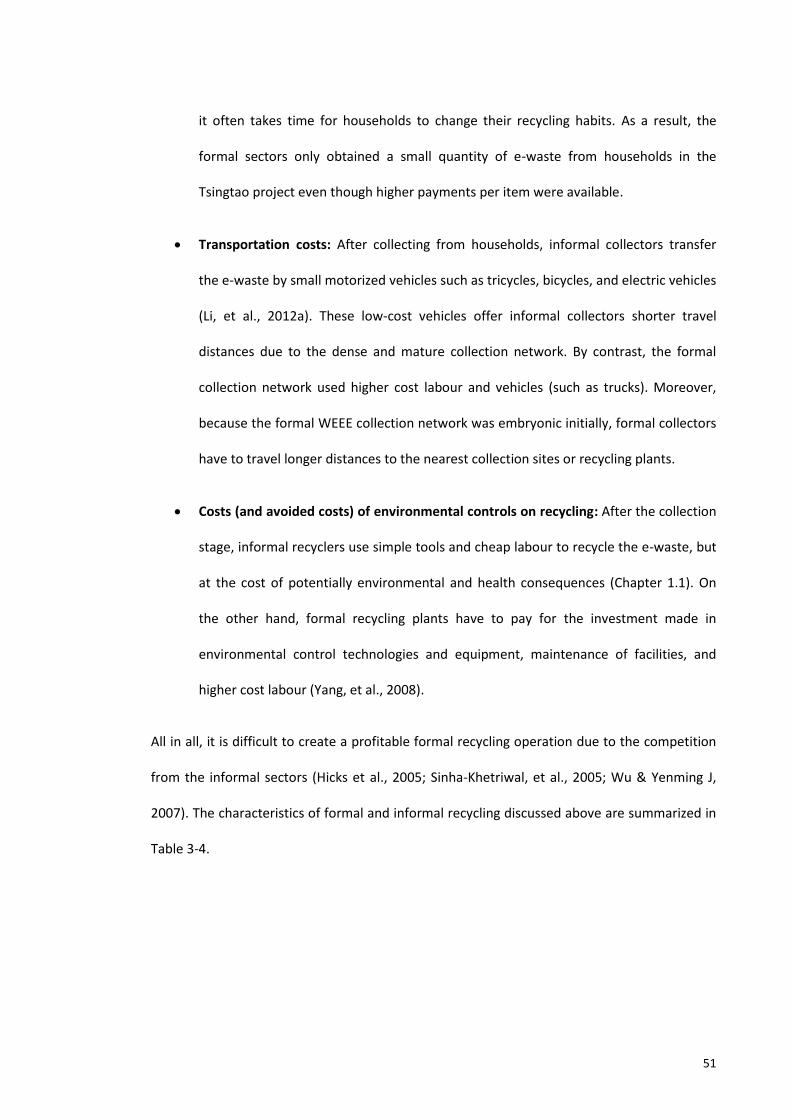
51
it often takes time for households to change their recycling habits. As a result, the
formal sectors only obtained a small quantity of e-waste from households in the
Tsingtao project even though higher payments per item were available.
Transportation costs: After collecting from households, informal collectors transfer
the e-waste by small motorized vehicles such as tricycles, bicycles, and electric vehicles
(Li, et al., 2012a). These low-cost vehicles offer informal collectors shorter travel
distances due to the dense and mature collection network. By contrast, the formal
collection network used higher cost labour and vehicles (such as trucks). Moreover,
because the formal WEEE collection network was embryonic initially, formal collectors
have to travel longer distances to the nearest collection sites or recycling plants.
Costs (and avoided costs) of environmental controls on recycling: After the collection
stage, informal recyclers use simple tools and cheap labour to recycle the e-waste, but
at the cost of potentially environmental and health consequences (Chapter 1.1). On
the other hand, formal recycling plants have to pay for the investment made in
environmental control technologies and equipment, maintenance of facilities, and
higher cost labour (Yang, et al., 2008).
All in all, it is difficult to create a profitable formal recycling operation due to the competition
from the informal sectors (Hicks et al., 2005; Sinha-Khetriwal, et al., 2005; Wu & Yenming J,
2007). The characteristics of formal and informal recycling discussed above are summarized in
Table 3-4.
52
Table 3-4: Comparison of characteristics of formal recycling and informal recycling
CHARACTERISTICS FORMAL RECYCLERS
INFORMAL RECYCLERS
Legislative Authorized Un-authorized
Technical Comprehensive Rudimentary dismantling and material recovery
Environmental Pollution controlled Polluting
Economic High cost and lower revenue Lower cost and higher revenue
Social Mechanization Increased employment
Popularity New launched scheme Conventional recycling method
Market share Limited Dominating
Collection network Embryonic network Mature network
Source: Adapted from (Li, et al., 2012a; Wang & Huisman, 2010)
3.2. Official strategies for WEEE management in China
In order to reduce environmental impacts resulting from WEEE recycling, the Chinese
Government has attempted to strengthen the legislative framework, formalize the informal
recyclers and establish a formal recycling system (Chi, et al., 2011; Manhart, 2007; Wu &
Yenming J, 2007). The following sections discuss the effectiveness of official strategies to
identify the limitations and potential of WEEE management in China.
3.2.1. Legislation and limitations
There are three governmental agencies in China (Yang, et al., 2008) working on establishing
WEEE regulations and outlining related issues: the State Environmental Protection
Administration (SEPA); the National Development and Reform Commission (NDRS); and the
Ministry of Information Industry (MII). Five e-waste regulations have been established by the
three government agencies that address the following aspects (refer to Appendix A1 for details
in the five regulations) (Chi, et al., 2011; European Communities, 2006; Yang, et al., 2008):
53
1. Reduce e-waste at source: Three e-waste laws from SEPA were launched based on 3Rs
principal, which consider environmental impacts along the whole life cycle of products.
The three directives involve:
a. Forbidding the importation of 21 categories of e-waste and components;
b. Reducing the generation of e-waste and increasing the e-waste recycling and
reuse rates;
c. Minimizing environmental impacts during the e-waste recycling processes.
2. Green design and production of IT products: The “Management measures for
prevention and control of pollution of IT products” from the department of MII aims to
control environmental impacts along the whole life cycle of a product, which includes:
a. Restriction of six toxic and hazardous substances in the production of IT
equipment (Lead, Mercury, Cadmium, Chromic, Polybrominated Biphenyl (PBB)
or Polybrominated Diphenyl Ethers (PBDE));
b. Labelling harmful materials on products for sale;
c. Design, production and packaging of IT products by environmentally sound
methods;
d. Producers (including importers) of IT products are responsible for collecting,
recycling, and disposing of their End of Life (EOL) products.
3. Stakeholders’ responsibilities and target categories of e-waste: The “Administrative
ordinance on recycling and treatment of discarded electric and electronic appliances”
from NDRS addresses the responsibilities of stakeholders along the recycling chain.
Responsibility for stakeholders includes:
54
a. Distributor - collection and delivery of WEEE to recyclers;
b. Recyclers - reuse, disassembly and final deposition using pollution control safeguards;
violators of the national e-waste processing standards will be fined from ¥50,000 to
¥500,000 (approximately $7300-$73,000 USD) (Ni & Zeng, 2009);
c. Consumers - collect and return e-waste to certified collectors;
These laws follow the international trend and provide basic legal guidance for clean production
and clean WEEE recycling. However, because the legislative framework in China is only now
being constructed, many directives are directly transferred from EU legislation, with
insufficient consideration of the particular Chinese context (Yang, et al., 2008). There are
several significant limitations with the WEEE legislative framework in China, including:
No specific legislative department: Rather than a particular WEEE department which
focuses on legislation, three governmental ministries with different emphases are
engaged in drafting and reforming WEEE laws in China (Schluep, et al., 2009).
Consequently, the progress of legislation has been slow due to the multiple functions
performed by the departments and a complicated hierarchical approval system in
China (Schluep, et al., 2009). For instance, one of the laws from SEPA (Technology
Policy on Prevention and Control of Waste Electrical and Electronic Pollution) was
proposed in February 2004 (Yu et al., 2008) and updated in 2008 (China Environmental
Law, 2009). After being approved by Premier Wen Jiabao, it was not finally enacted
until 2011 (Lehman et al., 2009). Similarly, another e-waste regulation (Administrative
ordinance on recycling and treatment of discarded electrical and electronic appliances)
was drafted in 2004 and enacted until 2012 (for details of the laws see Appendix A1).
Varying cultural and collection systems: As discussed earlier, e-waste collection and
recycling in China is dominated by the informal recycling sector, whose operations are
55
barely influenced by official legislative restrictions. Only one regulation makes a
mention of a strategy of “formalizing the informal sectors”. However, there is no
specific WEEE legislation suggesting detailed strategies on how formalizing should be
conducted. In addition, China has more than thirty provinces, which vary in
geographical condition, culture, and level of economic development. Trying to apply a
standard WEEE legislation across the whole country was difficult (Schluep, et al., 2009).
Poor implementation and vague definition of EPR responsibilities: Although the
directive from the NDRC policy indicates the responsibilities of producers, only IT
producers are listed. In addition, only three stakeholders are involved in EPR - the
producers, recyclers and customers. Retailers and municipalities are not included in
the WEEE legislation yet. Moreover, insufficient incentives are provided for
stakeholders, and thus it is hard for stakeholders, particularly the producers, to take
on board recycling responsibilities (Yang, et al., 2008).
Limited effectiveness on households: Households are the main customers of informal
collectors, who provide an e-waste supply for informal recycling systems. Since the
enactment of the Administration ordinance on recycling and treatment of discarded
electric and electronic appliances (for details refer to Chapter 3.2.1), e-waste from
institutions and Original Equipment Manufacturers (OEMs) tends to be controlled by
formal recycling companies (Mo et al., 2009). Even though this legislation also specifies
a degree of responsibility on end-users, the penalty ordinances for infringement are
vaguely defined (Liu, et al., 2006). Due to such poor enforcement of legislative
restrictions on individuals and households, as well as the convenient service offered by
informal collectors, the majority of households sell their products to informal
collectors in China (Puckett, et al., 2002; World Bank, 2004).
56
3.2.2. Regulatory interventions in rural informal workshops
The environmental impacts resulting from informal recycling activities are particularly serious
in the rural areas such as Guiyu. Not only domestic e-scrap recycled but also imported e-waste
from other countries is processed. The Chinese Government is aware of the seriousness of the
problem in remote rural areas and has focused pollution mitigation attempts in regions like
Guiyu. Strategies directed towards local informal recycling workshops include legislation
banning and closing down private recycling operations (Chi, et al., 2011). However, informal
recycling activities require minimal skills and facilities so the whole recycling operation is
locationally, highly flexible (Chi, et al., 2011). Consequently, in order to escape the supervision
of government environmental protection departments, after intervention by official
departments, informal recycling workshops in Guiyu have spread to other regions such as the
poor regions in Zhejiang, Tianjin, Hunan, and Shandong (Chi, et al., 2011; Liu, et al., 2006;
Shinkuma & Huong, 2009).
Due to the counterproductive effects of for example, seizing recyclers’ tools and closing their
workshops, the Chinese Government then has tried to guide informal recycling operations by
formalizing their operations and providing technical support. Additionally, formal recycling
plants in local areas are under construction (Chi, et al., 2011; Shinkuma & Huong, 2009).
3.2.3. Establishing formal recycling systems in China
In response to the EU directives and EPR on an international level, the Chinese Government
and manufacturers have attempted to establish formal recycling systems. These strategies
include:
1. Encouraging formal collection schemes: Manufacturers such as Nokia, DELL, LENOVO,
HP and Motorola took the lead to introduce collection schemes in 2005, taking back
their products from households without a charge in 40 cities across China (Chi, et al.,
57
2011; European Communities, 2006; Lu, 2008). The Chinese Government also
launched a pilot trade-in scheme from 2009 to December 2011, encouraging
households to return their obsolete products to retailers (MOF, 2009) (refer to Chapter
4.3 for details). With legislative encouragement, many formal collection companies
have an opportunity to cooperate with retailers and take-back EOL products from
households.
2. Establishing formal recycling plants and introducing environmentally sound facilities:
The Chinese Government has launched national pilot projects in four major coastal
cities: Tianjin, Beijing, Tsingtao, Zhejiang since 2004, with the purpose of building up a
better formal collection network and improving e-waste recycling technologies (Chi, et
al., 2011; Yang, et al., 2008). By 2011, more than twenty national recycling plants had
been established nationwide, all equipped with a large handling capacity and with
environmental control facilities and technologies such as magnetic separation (Chi, et
al., 2011; Wen, 2006).
3. Encourage ecological waste recycling flows: Sustainable Recycling Industrial Parks
have been established in five industrial cities: Tianjin, Taicang, Ningbo, Zhangzhou and
Taizhou, and encourage efficient use and environmentally sound recovery of waste
(Shinkuma & Huong, 2009). Waste generated in these Recycling Industrial Parks, can
be mutually used in other plants, a practical example of industrial ecology in operation
(Guo, 2011). In addition, solid waste and water processed from these recycling
operations are treated and discharged under environmental norms (Shinkuma &
Huong, 2009).
Although the formal recycling sector in China has undertaken several elements of the
collection and recycling stages, most projects have achieved limited success. For example,
many national recycling plants with a large handling capacity and with environmental control
58
facilities could not reach their design capacity due to a lack of e-waste supply (refer to Section
3.1.4). In addition, many formal collection schemes such as manufacturer take-back and
municipal e-waste collection only collect a small amount of e-waste items.
There is only a trade-in scheme showed a promising market share. A case study was conducted
in 2009 by Yao et al. (2009) which indicated that more households used to the trade-in scheme
(36%) than the informal collectors (34%) (Refer to Chapter 4.3 for details of trade-in).
Although the trade-in scheme has only a slightly larger proportion than the informal collectors
from the literature, the appearance of trade-in has challenged the domination of e-waste
handling by the informal collectors.
3.2.4. Effectiveness of official strategies
As discussed in this section, in addition to establishing a legislative framework at a national
level, the Chinese Government has intervened at different stages along the recycling chain.
Figure 3-3 illustrates the official strategies along the formal and informal recycling chains in
China.
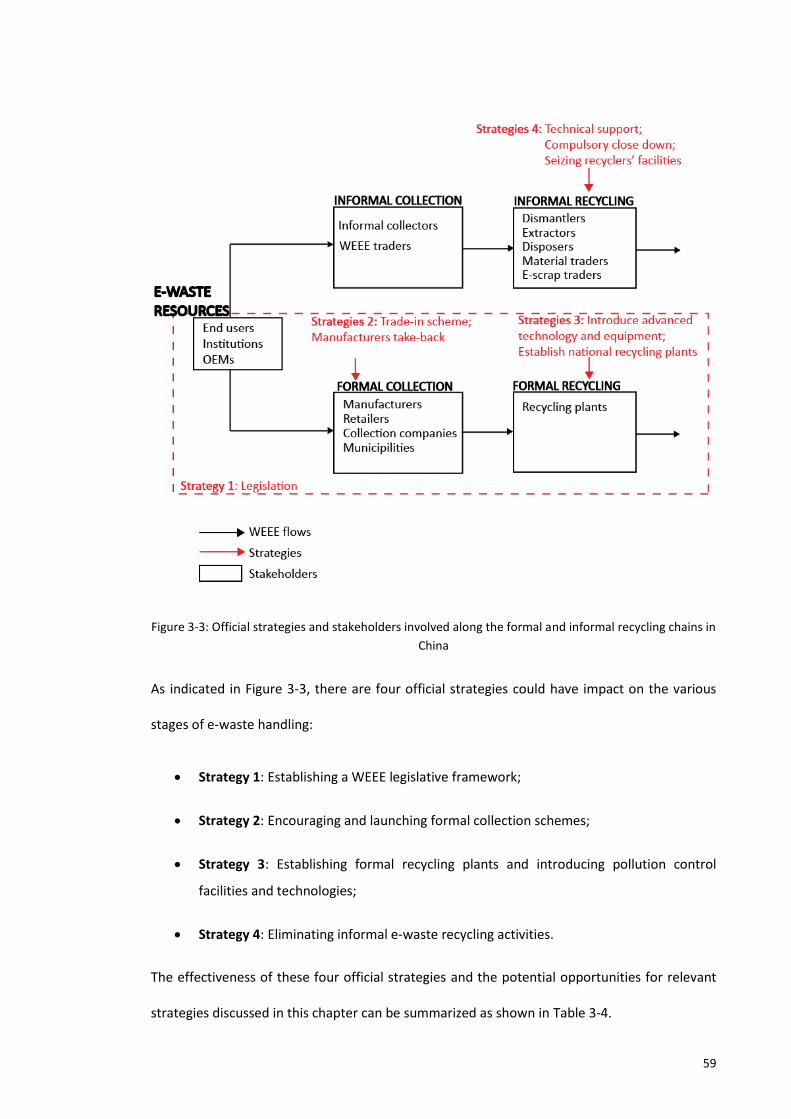
59
Figure 3-3: Official strategies and stakeholders involved along the formal and informal recycling chains in
China
As indicated in Figure 3-3, there are four official strategies could have impact on the various
stages of e-waste handling:
Strategy 1: Establishing a WEEE legislative framework;
Strategy 2: Encouraging and launching formal collection schemes;
Strategy 3: Establishing formal recycling plants and introducing pollution control
facilities and technologies;
Strategy 4: Eliminating informal e-waste recycling activities.
The effectiveness of these four official strategies and the potential opportunities for relevant
strategies discussed in this chapter can be summarized as shown in Table 3-4.
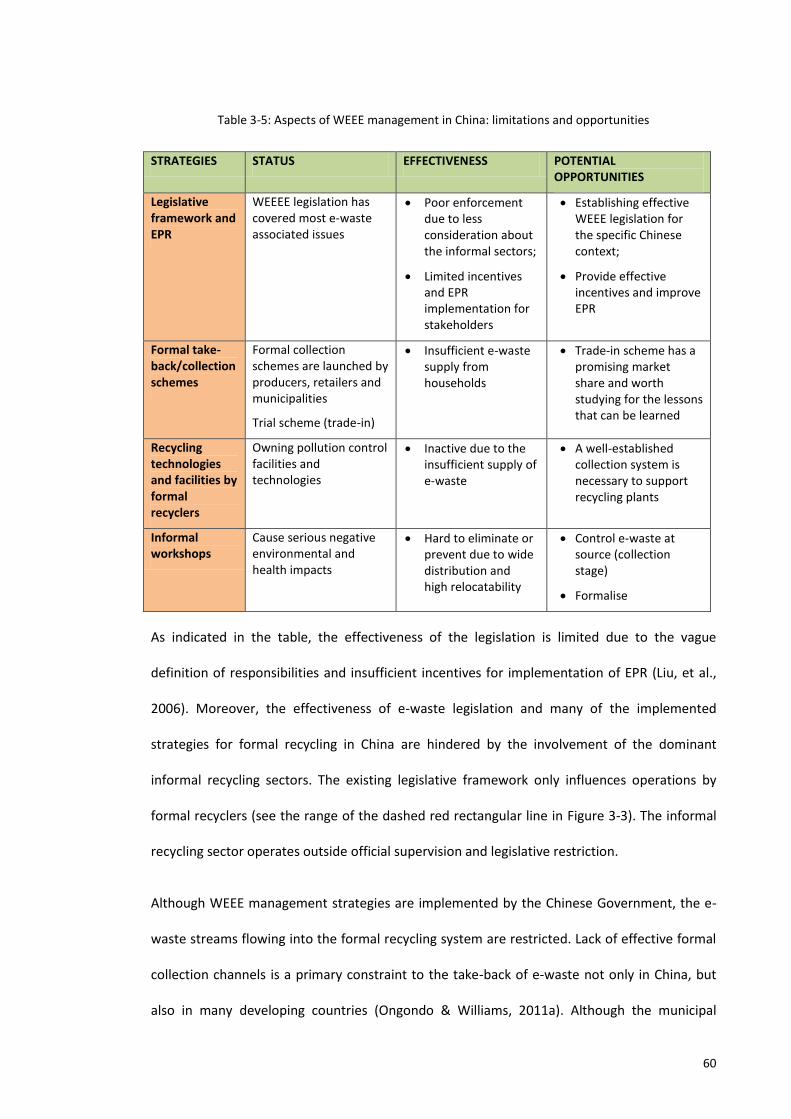
60
Table 3-5: Aspects of WEEE management in China: limitations and opportunities
STRATEGIES STATUS EFFECTIVENESS POTENTIAL OPPORTUNITIES
Legislative framework and EPR
WEEEE legislation has covered most e-waste associated issues
Poor enforcement due to less consideration about the informal sectors;
Limited incentives and EPR implementation for stakeholders
Establishing effective WEEE legislation for the specific Chinese context;
Provide effective incentives and improve EPR
Formal take-back/collection schemes
Formal collection schemes are launched by producers, retailers and municipalities
Trial scheme (trade-in)
Insufficient e-waste supply from households
Trade-in scheme has a promising market share and worth studying for the lessons that can be learned
Recycling technologies and facilities by formal recyclers
Owning pollution control facilities and technologies
Inactive due to the insufficient supply of e-waste
A well-established collection system is necessary to support recycling plants
Informal workshops
Cause serious negative environmental and health impacts
Hard to eliminate or prevent due to wide distribution and high relocatability
Control e-waste at source (collection stage)
Formalise
As indicated in the table, the effectiveness of the legislation is limited due to the vague
definition of responsibilities and insufficient incentives for implementation of EPR (Liu, et al.,
2006). Moreover, the effectiveness of e-waste legislation and many of the implemented
strategies for formal recycling in China are hindered by the involvement of the dominant
informal recycling sectors. The existing legislative framework only influences operations by
formal recyclers (see the range of the dashed red rectangular line in Figure 3-3). The informal
recycling sector operates outside official supervision and legislative restriction.
Although WEEE management strategies are implemented by the Chinese Government, the e-
waste streams flowing into the formal recycling system are restricted. Lack of effective formal
collection channels is a primary constraint to the take-back of e-waste not only in China, but
also in many developing countries (Ongondo & Williams, 2011a). Although the municipal
61
collection bins for hazardous waste and producer take-back have been applied in some parts
of China, only limited quantities of e-waste resources have been collected. Compared with the
vitality of the informal recycling sector, the development of a formal recycling sector in China
is limited. The trade-in scheme showed itself as the most promising collection scheme which
could potentially compete with informal collectors (Yao, et al., 2009). Unfortunately, since the
trade-in scheme was suspended at the end of 2011, many formal collection companies and
recycling plants had to stop running because e-waste flows from households were reduced to
very limited amounts again. The majority of e-waste from households has inevitably returned
to the competitive and relatively efficient informal recycling sector.
All in all, formal e-waste recycling operations and e-waste collection schemes in China have so
far been incapable of making WEEE recycling a viable and sustainable business due to the
fierce competition of informal recycling. The scale, distribution, flexibility and lack of visibility
of informal recycling operations make it difficult to control it by either mandatory laws or
formalized strategies (Chi, et al., 2011; Yang, et al., 2008). The informal collectors offer a low
recycling cost and convenient service in their way of collecting households’ e-waste resources.
Households are the direct users of formal and informal collection channels and are essential to
a sustainable future in China because they control e-waste at source. Many studies indicate
that the development of informal e-waste recycling results from the unwillingness of
consumers to return their obsolete products to formal collection channels and the lack of
awareness of potential hazards of the e-waste they generate (Chi, et al., 2011; Finlay & Liechti,
2008; Hicks, et al., 2005; Osibanjo & Nnorom, 2007). Therefore, accessing sufficient e-waste
resources from households to support formal recycling plants is a challenge for developing
formal e-waste management systems in China. An effective formal collection system, which
can gain e-waste resources from households plays an essential role in the management of e-
waste in China.
62
Meanwhile, China cannot simply replicate successful regulations or management models from
other countries due to the influence of the informal recycling operators. Conventional
recycling culture and ingrained reward concept absorbed by Chinese households, formal
collection has to be designed based on informal collection principles. Therefore, it is necessary
to understand informal collection from the perspective of households in order to understand
why they are so successful in attracting customers.
63
CHAPTER 4: HOUSEHOLDS’ DISPOSAL OPTIONS AND THE MAIN
COLLECTION CHANNELS IN CHINA
As indicated in Chapter 3, effective formal collection channels, which can gain e-waste
resources from households, play an essential role in the management of e-waste in China.
Raising the e-waste collection rate depends more on social factors (Schluep, et al., 2009),
particularly on the involvement of households (Huang et al., 2006). Given the important role of
Chinese households in e-waste disposal, this chapter identifies households’ e-waste disposal
behaviour and discusses the features of the main collection channels in China. Two significant
collection methods - informal collection and trade-in schemes - are selected as being
representative of informal and formal collection systems.
4.1. Chinese households’ disposal options
This section examines households’ disposal behaviour and identifies the proportions of various
household disposal behaviours through a comparative study from existing studies. This section
also discusses the factors that influence people’s recycling behaviour from the literature.
4.1.1. Household disposal options and their obligations in countries
4.1.1.1. Disposal options for households
There are four main destinations for e-waste after it becomes obsolete: stockpiling, transfer to
friends or relatives, directly dumped and recycled through available collection channels. The
four disposal behaviours and the obsolescence of e-waste are discussed below.
Relative and absolute obsolescence: Advertising stimulates quick obsolescence and influences
consumers to replace their functional products in favour of newer technology (Ongondo &
Williams, 2011a). Such phenomena refer to “relative” obsolescence (Cooper, 2004) (or
perceived obsolescence)(Ongondo & Williams, 2011a, 2011c), which results in a “discretionary
64
replacement that consumers are not necessarily motivated by rational cost-benefit
considerations relating to product functionality” (Cooper, 2004, p. 425). It needs to be
distinguished from that arising from product failure (worn out or broken) or absolute
obsolescence (Cooper, 2005). Relative obsolescence is promoted by product innovations and
incremental changes in features, and is also influenced by consumers’ status and self-identity
(Park, 2009). As a result, relative obsolescence accelerates e-waste obsolescence and leads to
a shorter lifespan of products, particularly the innovative ICT products (Park, 2009).
Transfer to friends and relatives: As a consequence of relative obsolescence, large amounts of
e-waste are perfectly functional when being discarded (van Hinte, 1997; White, et al., 2007).
Therefore, many end-users spontaneously extend the active life of products such as passing
them to friends or relatives or placing them for resale in second-hand markets (Ongondo &
Williams, 2011a)(the term of active life was introduced in Chapter 2.2.3).
Stockpile and dump: In addition, many households keep their obsolete products (GAO, 2008;
Wagner, 2009) because they think products still have value and could be used one day (Ketai
et al., 2008; Li et al., 2006; Ongondo & Williams, 2011a; Terazono, et al., 2006; Wang et al.,
2010). The residual value bestowed by households is defined as a perceived residual value by
Ongondo and Williams (2011a), which is an important factor influencing households’ e-waste
disposal behaviour from this research (Table 8-1 in Chapter 8 shows the results from Field
Study B). Once households confer a low perceived residual value, the obsolete products are
likely to be dumped quickly.
Recycle through available collection channels: In addition to the disposal behaviour discussed
above, households have various options based on different e-waste collection channels and
recycling systems. In general, the e-waste collection schemes are organized by three
stakeholders: municipal collection, producer/retailer take-back or independent collectors such
as informal collectors. Table 2-3 in Chapter 2 gives details of the three collection groups. The
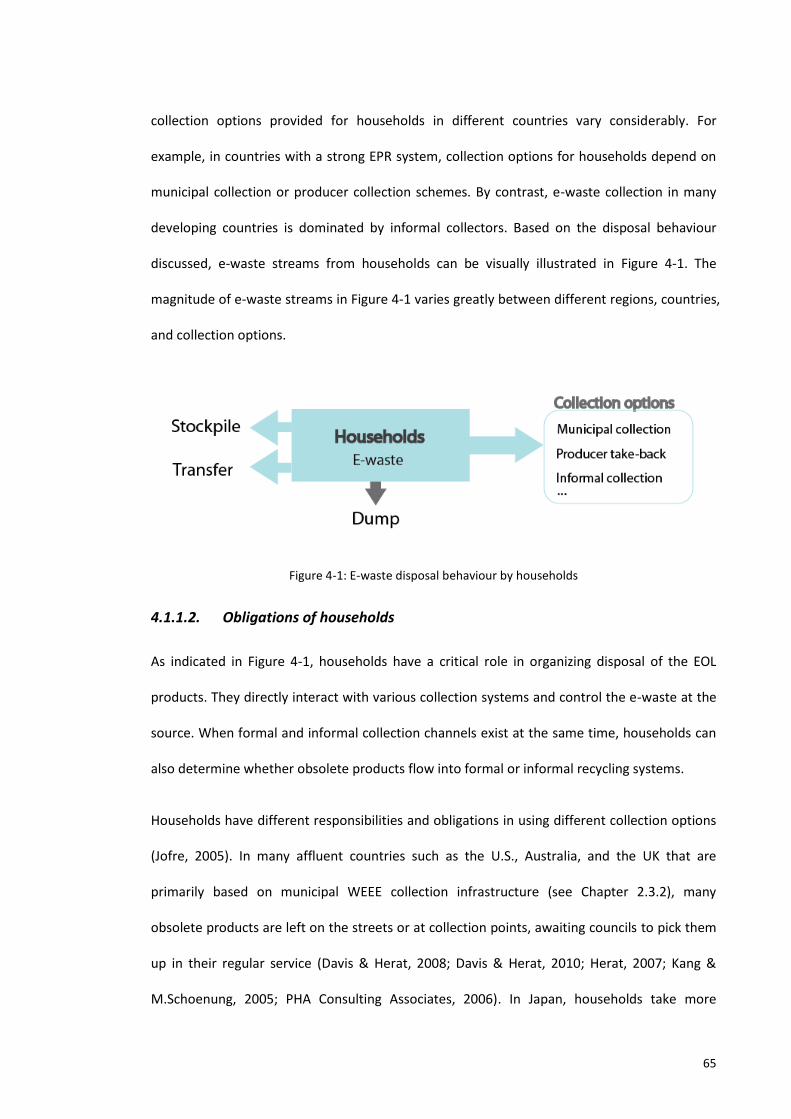
65
collection options provided for households in different countries vary considerably. For
example, in countries with a strong EPR system, collection options for households depend on
municipal collection or producer collection schemes. By contrast, e-waste collection in many
developing countries is dominated by informal collectors. Based on the disposal behaviour
discussed, e-waste streams from households can be visually illustrated in Figure 4-1. The
magnitude of e-waste streams in Figure 4-1 varies greatly between different regions, countries,
and collection options.
Figure 4-1: E-waste disposal behaviour by households
4.1.1.2. Obligations of households
As indicated in Figure 4-1, households have a critical role in organizing disposal of the EOL
products. They directly interact with various collection systems and control the e-waste at the
source. When formal and informal collection channels exist at the same time, households can
also determine whether obsolete products flow into formal or informal recycling systems.
Households have different responsibilities and obligations in using different collection options
(Jofre, 2005). In many affluent countries such as the U.S., Australia, and the UK that are
primarily based on municipal WEEE collection infrastructure (see Chapter 2.3.2), many
obsolete products are left on the streets or at collection points, awaiting councils to pick them
up in their regular service (Davis & Herat, 2008; Davis & Herat, 2010; Herat, 2007; Kang &
M.Schoenung, 2005; PHA Consulting Associates, 2006). In Japan, households take more
66
financial responsibility and have to pay a recycling fee when they dispose of their large
appliances through the e-waste recycling system (BiBo & Yamamoto, 2010; Chung &
Murakami-Suzuki, 2008; European Communities, 2006; Zhang & Wei, 2009).
In China, instead of paying a charge or moving large appliances to collection sites, households
can receive payments, as well as a door-to-door service from informal collectors when
disposing of their obsolete products. Although there are also formal collection channels for
Chinese households, informal collectors are preferred (as noted in the following section for
advantages of informal collectors). The available e-waste collection channels for the Chinese
households are shown in Chapter 3.1.1.
Since negative consequences such as considerable pollution tend to result from informal
recycling activities, guiding households’ e-waste recycling behaviour is essential if a health and
environmental improvement is to be achieved in China (McKenzie-Mohr, 2000). If the formal
recycling systems want to gain sufficient e-waste resources from the Chinese households, it is
necessary to understand households’ e-waste collection options and their disposal preferences
before proposing effective formal collection schemes.
4.1.2. E-waste disposal behaviour and preferences by Chinese households
This section compares survey results from eight previous studies with respect to how Chinese
households dispose of their obsolete products. There are three reasons for examining the
results of previous studies:
To identify what disposal options might be available for Chinese households.
To identify which disposal options are most popular for households.
To help frame the field studies in this research.
67
Table 4-1 below presents disposal behaviour in the eight studies from the literature. As
indicated in Table 4-1, when examining households’ disposal behaviour, the studies often
target different products (see column two for definitions of e-waste in questionnaires). There
is a variety of behaviour defined in the different studies but several conclusions can be derived
by comparing the survey results across the eight studies:
Dominant informal collectors: Despite the eight studies being based on different
research aims, informal collection is the most significant collection method and shown
as the most popular recycling option for households. Informal collection is the only
recycling option in Surveys 2 and 3, which means in those two field studies, 100% of
recycled e-waste comes from informal collectors. Only Study 4 shows that a new
trade-in scheme is slightly more popular than the informal collectors.
Appearance of a pilot trade-in scheme: A trade-in scheme was applied from 2009 to
2011 and thus the trade-in collection option only appears in the most recent three
studies. The three studies were conducted in three cities and the contribution they
made to total recycling varied from 4% to 36%. However, in the study by Yao, et al.
(2009), the recently launched trade-in collection scheme (36%) overtook the informal
collectors (34%) and became a promising formal collection channel to compete with
the informal collectors.
Significant percentages of stockpiling and dumping behaviour: Other than the
informal collection and trade-in scheme, substantial e-waste items are stockpiled and
thrown away by Chinese households. In the study from Yang, Lu et al. (2008), 70% of e-
waste was stockpiled by residents in Beijing. Another study by Wang, et al. (2011)
indicates that 37% of e-waste was thrown away as trash by the survey participants
from Beijing.
68
A small market for formal collection channels in general: It is worth noting that
except the trade-in scheme, other formal collection channels only take small
proportions of the collection market. For example, from an online-survey conducted
among 1100 end-users, only 4% of respondents sent their obsolete products back to
producers. Collection companies also accounted for a very small market with only 3%
of households in Guangzhou submitting their e-waste to the collectors representing
collection companies. Huang, et al. (2006) showed a larger proportion for producer
take-back but there was a lack of description about the “producer” option so it is not
clear whether this producer take-back scheme is comparable to the other studies.
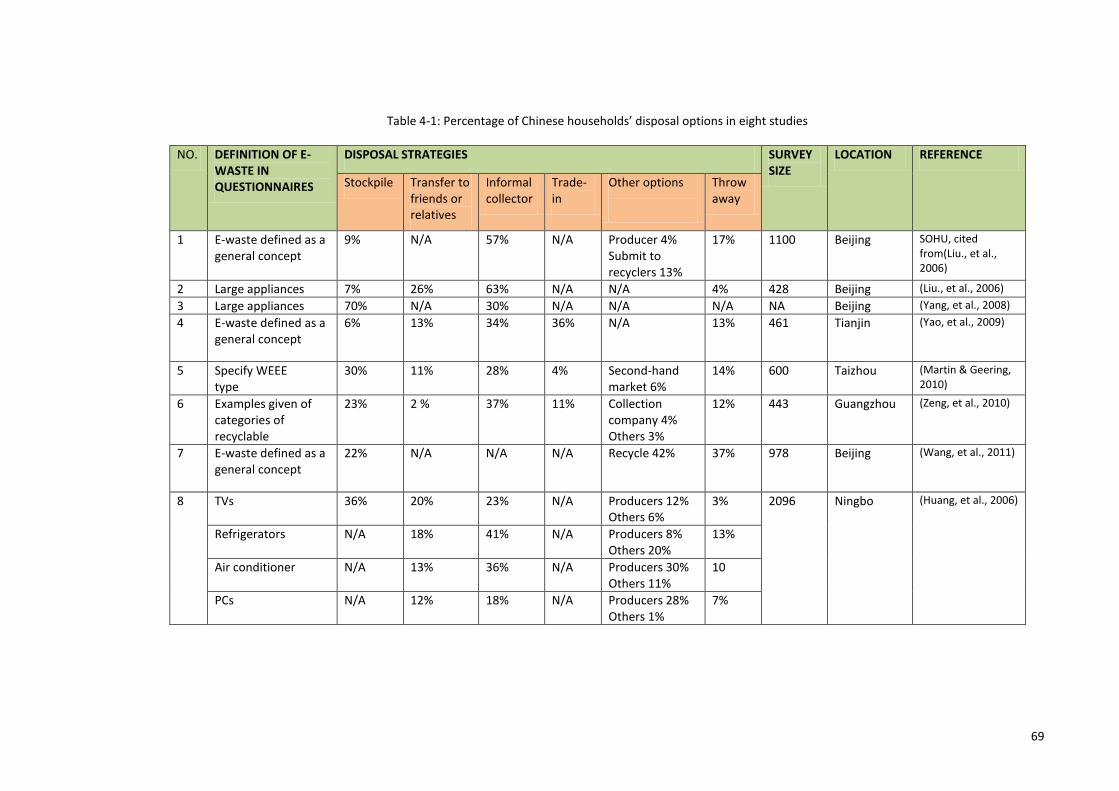
69
Table 4-1: Percentage of Chinese households’ disposal options in eight studies
NO. DEFINITION OF E-WASTE IN QUESTIONNAIRES
DISPOSAL STRATEGIES SURVEY SIZE
LOCATION REFERENCE
Stockpile Transfer to friends or relatives
Informal collector
Trade-in
Other options
Throw away
1 E-waste defined as a general concept
9% N/A 57% N/A Producer 4% Submit to recyclers 13%
17% 1100 Beijing SOHU, cited from(Liu., et al., 2006)
2 Large appliances 7% 26% 63% N/A N/A 4% 428 Beijing (Liu., et al., 2006)
3 Large appliances 70% N/A 30% N/A N/A N/A NA Beijing (Yang, et al., 2008)
4 E-waste defined as a general concept
6% 13% 34% 36% N/A 13% 461 Tianjin (Yao, et al., 2009)
5 Specify WEEE type
30% 11% 28% 4% Second-hand market 6%
14% 600 Taizhou (Martin & Geering, 2010)
6 Examples given of categories of recyclable
23% 2 % 37% 11% Collection company 4% Others 3%
12% 443 Guangzhou (Zeng, et al., 2010)
7 E-waste defined as a general concept
22% N/A N/A N/A Recycle 42% 37% 978 Beijing (Wang, et al., 2011)
8 TVs 36% 20% 23% N/A Producers 12% Others 6%
3% 2096 Ningbo (Huang, et al., 2006)
Refrigerators N/A 18% 41% N/A Producers 8% Others 20%
13%
Air conditioner N/A 13% 36% N/A Producers 30% Others 11%
10
PCs N/A 12% 18% N/A Producers 28% Others 1%
7%
70
The market share of disposal options reflects households’ disposal preferences and to some
extent, reflects the market share of a collection system. However, as indicated, the survey
results vary greatly in different studies, which make it difficult to understand households’
disposal behaviour and the status of the collection market. This influences the effectiveness of
strategies proposed if they are based on the survey results. The following part identifies the
possible reasons that lead to the large discrepancies noted in the data.
1. Varying definitions of what is meant by e-waste (see the second column in Table 4-1):
some studies gave examples to explain e-waste. For example, some studies defined e-
waste as large appliances, including PCs, TVs, washing machines, air conditioners and
refrigerators (e.g. Study 2 and Study 3). Other studies only studied the e-waste in
general, without any further explanation or giving example items (e.g. Study 1, Study 4
and Study 7). However, although e-waste was identically defined as large appliances in
Surveys 2 and 3, the proportions of stockpiling were 7% and 70% respectively. The
sizeable disparity may result from participants’ personal assumptions. For example,
participants may assume that the e-waste can only take one of the large appliances
(such as PCs or TVs). On the other hand, households’ disposal behaviour for PCs and
TVs varies greatly (Martin & Geering, 2010). Moreover, some studies specified e-waste
categories and examined the disposal behaviour of each category respectively (e.g.
Study 5 and Study 8). From the results of Martin and Geering (2010) and Huang, et al.
(2006)’ studies, households had varying disposal behaviour towards different
categories of e-waste.
2. Location of surveys: in view of the huge economic differences between urban and
country areas in China, the location of the survey is influenced by the demographic
characteristics of the area, which thus influences disposal behaviour and the survey
results (Chi, et al., 2011; He, et al., 2006; Ke, 2009; Liu, et al., 2006).
71
3. Various available collection options across regions: as the implemented levels of
formal collection systems vary considerably in different regions in China, households
may have different e-waste recycling options. For example, when the majority of
regions in China depended on the traditional informal collection, some big cities had
launched a pilot trade-in scheme. As a result, the trade-in scheme only appears in
recent studies and the first stage of the trade-in scheme only appeared in selected
cities and regions (as noted in the following section for details of development of the
trade-in scheme). Therefore, available collection methods, which are closely
associated with the location and time of surveys, could be one reason that leads to a
variance of the eight survey results.
4. Other factors: there are other factors such as the construction of survey questions,
designing of question options, social economic factors, ethical impacts, etc. could
influence the survey results.
Given the results of the comparative study, when designing surveys to examine households’
disposal behaviour, it is particularly necessary to specify the e-waste categories because
people may have different disposal behaviour with various categories of e-waste. In addition, it
is also necessary to specify information on the survey background, such as the time, survey
location, and particularly the existing collection options for households.
The comparative study above suggests that informal collection is the most significant option
for Chinese households. The trade-in scheme is a recently launched collection scheme that has
gained a gradually increasing market share according to the three survey studies (Study 4,
Study 5 and Study 6). The trade-in scheme tends to be a promising collection method that
could compete with informal collectors and deserves further study. In addition, given that the
proportions of e-waste stockpiled and simply thrown away are significant, it is worth
identifying why households would rather discard their e-waste than sell it to collectors in China.
72
4.1.3. Factors influencing disposal behaviour
Psychological approaches have a central role in creating a sustainable future by changing
peoples’ behaviour (McKenzie-Mohr, 2000), which approach is more efficient than simply
applying sustainable technology and design techniques (Derijcke & Uitzinger, 2006; Wever et
al., 2008). Households’ perceptions regarding cause-and-effect relationships greatly influences
people’s behaviour (Folkes, 1988; Guagnano et al., 1995) and is important influence in
designing effective behaviour changing strategies (Biswas et al., 2000; Darby & Obara, 2005; Fu
mao et al., 2011; Hornik et al., 1995; McKenzie-Mohr, 2000; Pieters et al., 1998; Rose et al.,
1992). Therefore, the nature of those perceptions and the factors that influence households’
waste disposal behaviour are critical information for decision makers to develop better e-
waste collection schemes (Darby & Obara, 2005; Davis & Morgan, 2008; Huang, et al., 2006;
Hurlimann et al., 2009; Tonglet et al., 2004b). It thus follows that examining the behaviour of
households, particularly the factors that influence e-waste disposal behaviour is essential to
improving collection infrastructure and its supporting strategies (Darby & Obara, 2005; Davis &
Morgan, 2008; Hurlimann, et al., 2009; Schluep, et al., 2009; Tonglet, et al., 2004b).
There are two phases that can be identified in psychological research regarding waste recycling.
The first phase ranged from around 1970 to 1982, and explored factors on a moral level
(Thøgersen, 1996). It assumed that people are egoistic utility maximisers and their behaviour
can be stimulated by costs, benefits and punishments (Hornik, et al., 1995; Mannetti et al.,
2004; Porter et al., 1995). Subsequent studies suggested that the motivation for behaviour
would disappear if purely external incentives were withdrawn (Curlee, 1986). However, since
the value of many recyclable materials keeps declining and the cost of recycling labour
increases, it is difficult to ensure continuity of external incentives based on monetary values in
developed countries (Mansur, 1997). Thus, the second phase attempts to involve internal
incentives such as social and psychological motivators that could bring long-term
73
commitments (Hornik, et al., 1995). As a result, the second phase is based on a broader
“attitude motivation” approach to guide the recycling behaviour (Mannetti, et al., 2004).
According to the two psychological research phases, many variables that influence households’
perception and thus influence their e-waste recycling behaviour are identified. The following
parts discuss the factors from a literature review:
Hornik, et al. (1995) first conducted a comprehensive literature review that classified
all variables from more than 400 articles and covered 67 empirical studies over more
than 20 years. The variables in their study were classified into five groups: extrinsic
incentives (e.g., monetary rewards); intrinsic incentives (e.g., personal satisfaction of
recycling); internal facilitators (e.g., awareness of recycling and knowledge about
recycling programs); external facilitators (requirements of personal resources such as
time, space, money and effort), and demographic variables (Hornik, et al., 1995).
Based on Hornik’s work, many studies have investigated and verified a series of factors
that affect people’s recycling behaviour. Ongondo and Williams (2011a) compared four
case studies of recycling collection schemes in the UK. The results from this study
identified a series of variables that influence households’ disposal behaviour and thus
influence the e-waste collection rate. These variables include households’ attitudes,
perception, values, environmental awareness level, age, gender, employment status
and storage space.
Saphores et al. (2006) conducted a survey among 3000 households in California, U.S.
and found that households who always recycled general waste such as papers, and
bottles were more willing to recycle e-waste. Furthermore, households who a have
shorter distance to access the nearest collection points are more likely to recycle e-
waste. In addition to the mentioned factors of recycling habits and convenience of
74
infrastructure, this study also suggested that households’ recycling behaviour was
related to demographic factors such as age, gender and education.
Van Beukering and Van den Bergh (2006) found income as a determinant that could
influence recycling behaviour. They suggest that high-income people were more
inclined to voluntarily participate in recycling schemes. However, the willingness
declines if such recycling becomes time-intensive. This suggests that people’s
perceptions and attitudes towards time are critical determinants influencing people’s
recycling behaviour (Wang, et al., 2011). These factors are closely related to the
convenience of recycling infrastructure.
Darby and Obara (2005) conducted a survey on small electronic waste recycling in
Cardiff, UK, to examine the correlation between recycling behaviour and income level.
This study found that low-income people rarely participated in the recycling program
due to the inconvenient of transportation to drop points. In addition, low-income
people were inclined to keep small e-waste for longer time, and give them away for
reuse. Low-income people themselves were also more likely to use second-hand
products than high-income people. The study also found similar tendencies to those
identified in the California study, with recycling behaviour applied to other resources
such as paper and plastics having a beneficial spillover effect on e-waste recycling
behaviour (Saphores, et al., 2006). It is worth noting that such a spillover effect could
also exist in China because informal door-to-door collectors purchase both recyclables
and e-waste at the same time.
Due to the similarity of collection infrastructure between e-waste and general
recyclable waste in many countries, many e-waste recycling studies are based on the
municipal waste recycling methods and behavioural models. As a result, factors
influencing peoples’ waste recycling behaviour are indicative to those affecting e-
75
waste recycling behaviour. Many variables have been tested for their influence on
people’s propensity to recycle waste in general. These variables include social
influence (similar to moral norms and subjective norms), recycling habits (similar to
past experience), knowledge and awareness of environmental issues, economic
incentives, storage capacity, situational factors like transportation distance, time of
transaction, amount of effort involved, motivation and regulatory restriction (Chung et
al., 2010; Davis & Morgan, 2008; Hornik, et al., 1995; Lindquist, 2000; Perrin & Barton,
2001; Pieters, et al., 1998; Saphores, et al., 2006; Tonglet et al., 2004a).
However, no matter the variables for e-waste recycling or for waste recycling in general, all
these variables can hardly be directly applied in China due to the variation of e-waste
collection infrastructure and the more general e-waste recycling systems available.
Households’ behaviour varies in different countries due to a variety of reasons. For example, e-
waste tends to be stockpiled by the households in America. In California, there are an
estimated 6 million obsolete televisions and computers stockpiled in households (Saphores, et
al., 2006). Three quarters of all computers ever sold in the U.S. are in storages awaiting
disposal (Worldwatch Institute, 2005). Studies suggested that availability of storage capacity is
one of the reasons behind large quantities of WEEE stockpiling in America (ETBC, 2010;
Meinhardt, 2006; USEPA, 2000; Wagner, 2009). By contrast, households from the UK, where
the tendency is to have insufficient storage space compared to the U.S, are likely to dispose of
large obsolete appliances through recycling systems or donate to charities (Ongondo &
Williams, 2011a) while small accessories such as TV remote are most likely be disposed along
with house refuse (Ongondo et al., 2011e).
Influenced by the e-waste tradeable culture and the competition of informal collectors,
Chinese households must have different perceptions and thus those variables influencing their
e-waste recycling behaviour may vary greatly. Therefore, in order to identify the variables that
76
influence people’s e-waste recycling behaviour in China, it is necessary to consider the special
Chinese recycling context and treat the Chinese households as a separate target group.
However, in China, there is a lack of studies examining households’ waste recycling behaviour,
not to mention the e-waste behaviour.
Wang, et al. (2011) conducted one of the few existing studies that explored the correlation
between factors and e-waste recycling behaviour in China. Analysing the results of 1173
questionnaires, recycling habit was identified as the most significant factor influencing
behaviour, followed by economic benefits. Convenience of recycling facilities and service is
another critical aspect influencing households’ recycling behaviour. An additional factor,
residential economic condition also shows a close relationship with the households’ recycling
behaviour. Moreover, people who rented a house were less likely to stockpile e-waste
compared with people who owned the house, which might be because of limited storage space.
Meanwhile, the economic characteristic is also supported by the results from Li, et al. (2006),
who conducted a survey among three groups of residents in Beijing, including bungalows, a
university community and the general community. It found that people among the three
groups of residents showed a great variance on disposing of their obsolete products.
4.2. Informal collection
As indicated by the comparative study in Section 4.1.2, informal collection and trade-in
schemes are two significant e-waste collection options for Chinese households. Given the
important role of Chinese households in recycling and the lack of studies on the households’
behavioural studies in China, it is necessary to identify the major collection options for Chinese
households before examining their behaviour. In addition to the informal collection, this study
discusses the trade-in scheme. It compares the two important collection options in terms of
procedures, advantages, and limitations.
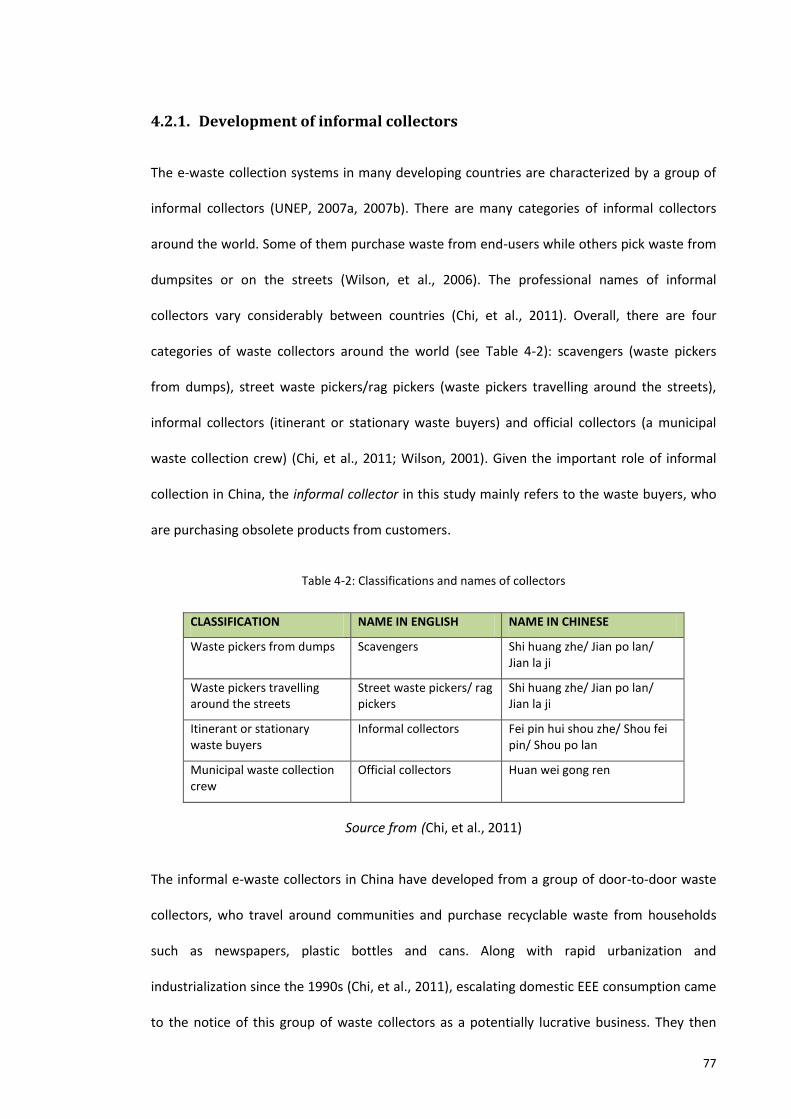
77
4.2.1. Development of informal collectors
The e-waste collection systems in many developing countries are characterized by a group of
informal collectors (UNEP, 2007a, 2007b). There are many categories of informal collectors
around the world. Some of them purchase waste from end-users while others pick waste from
dumpsites or on the streets (Wilson, et al., 2006). The professional names of informal
collectors vary considerably between countries (Chi, et al., 2011). Overall, there are four
categories of waste collectors around the world (see Table 4-2): scavengers (waste pickers
from dumps), street waste pickers/rag pickers (waste pickers travelling around the streets),
informal collectors (itinerant or stationary waste buyers) and official collectors (a municipal
waste collection crew) (Chi, et al., 2011; Wilson, 2001). Given the important role of informal
collection in China, the informal collector in this study mainly refers to the waste buyers, who
are purchasing obsolete products from customers.
Table 4-2: Classifications and names of collectors
CLASSIFICATION NAME IN ENGLISH NAME IN CHINESE
Waste pickers from dumps Scavengers Shi huang zhe/ Jian po lan/ Jian la ji
Waste pickers travelling around the streets
Street waste pickers/ rag pickers
Shi huang zhe/ Jian po lan/ Jian la ji
Itinerant or stationary waste buyers
Informal collectors Fei pin hui shou zhe/ Shou fei pin/ Shou po lan
Municipal waste collection crew
Official collectors Huan wei gong ren
Source from (Chi, et al., 2011)
The informal e-waste collectors in China have developed from a group of door-to-door waste
collectors, who travel around communities and purchase recyclable waste from households
such as newspapers, plastic bottles and cans. Along with rapid urbanization and
industrialization since the 1990s (Chi, et al., 2011), escalating domestic EEE consumption came
to the notice of this group of waste collectors as a potentially lucrative business. They then
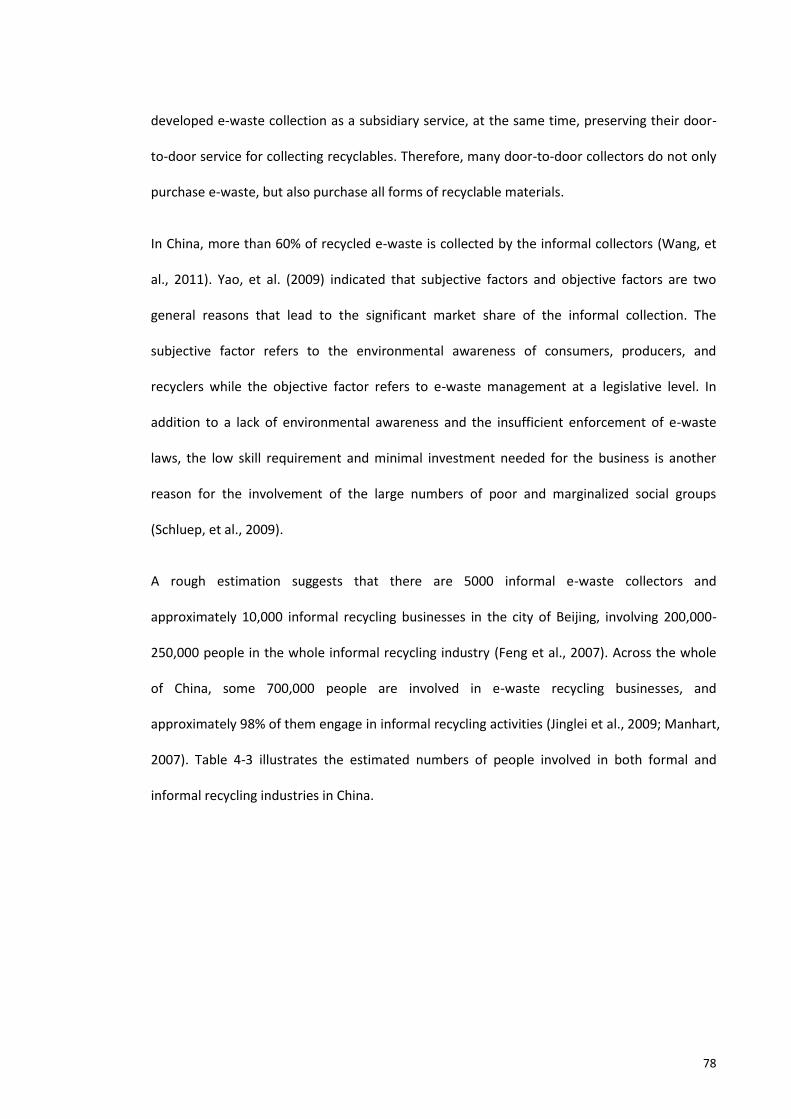
78
developed e-waste collection as a subsidiary service, at the same time, preserving their door-
to-door service for collecting recyclables. Therefore, many door-to-door collectors do not only
purchase e-waste, but also purchase all forms of recyclable materials.
In China, more than 60% of recycled e-waste is collected by the informal collectors (Wang, et
al., 2011). Yao, et al. (2009) indicated that subjective factors and objective factors are two
general reasons that lead to the significant market share of the informal collection. The
subjective factor refers to the environmental awareness of consumers, producers, and
recyclers while the objective factor refers to e-waste management at a legislative level. In
addition to a lack of environmental awareness and the insufficient enforcement of e-waste
laws, the low skill requirement and minimal investment needed for the business is another
reason for the involvement of the large numbers of poor and marginalized social groups
(Schluep, et al., 2009).
A rough estimation suggests that there are 5000 informal e-waste collectors and
approximately 10,000 informal recycling businesses in the city of Beijing, involving 200,000-
250,000 people in the whole informal recycling industry (Feng et al., 2007). Across the whole
of China, some 700,000 people are involved in e-waste recycling businesses, and
approximately 98% of them engage in informal recycling activities (Jinglei et al., 2009; Manhart,
2007). Table 4-3 illustrates the estimated numbers of people involved in both formal and
informal recycling industries in China.
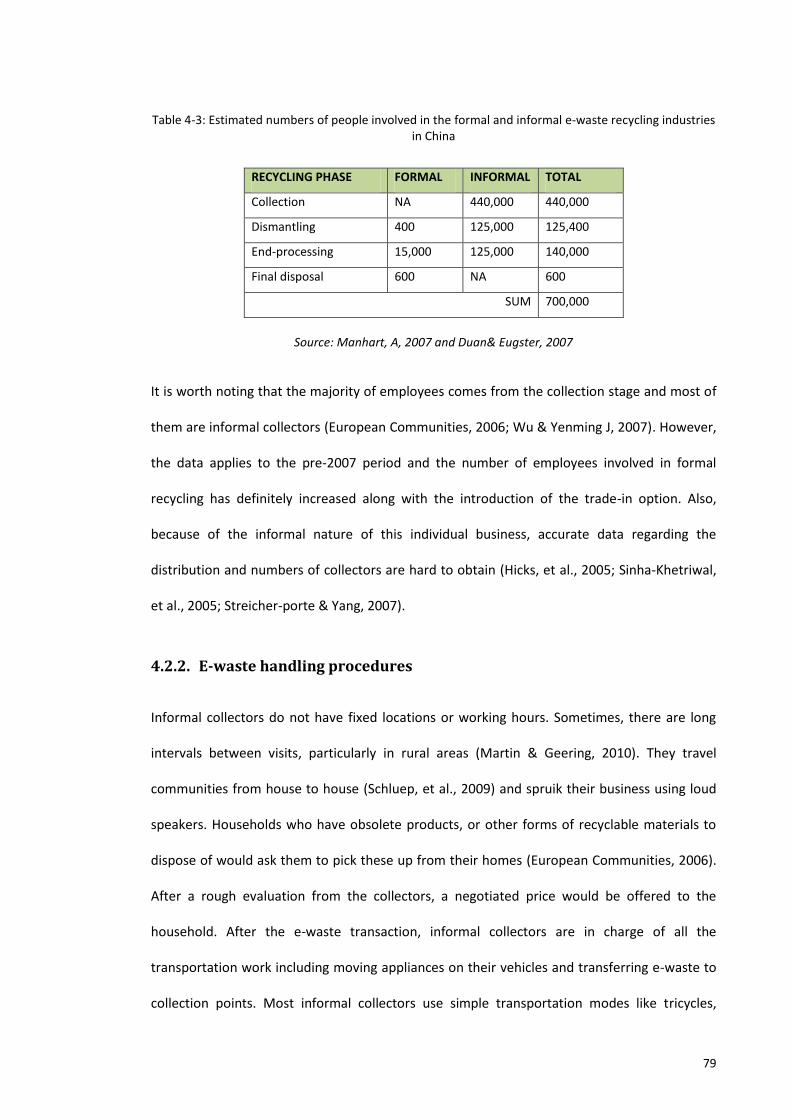
79
Table 4-3: Estimated numbers of people involved in the formal and informal e-waste recycling industries in China
RECYCLING PHASE FORMAL INFORMAL TOTAL
Collection NA 440,000 440,000
Dismantling 400 125,000 125,400
End-processing 15,000 125,000 140,000
Final disposal 600 NA 600
SUM 700,000
Source: Manhart, A, 2007 and Duan& Eugster, 2007
It is worth noting that the majority of employees comes from the collection stage and most of
them are informal collectors (European Communities, 2006; Wu & Yenming J, 2007). However,
the data applies to the pre-2007 period and the number of employees involved in formal
recycling has definitely increased along with the introduction of the trade-in option. Also,
because of the informal nature of this individual business, accurate data regarding the
distribution and numbers of collectors are hard to obtain (Hicks, et al., 2005; Sinha-Khetriwal,
et al., 2005; Streicher-porte & Yang, 2007).
4.2.2. E-waste handling procedures
Informal collectors do not have fixed locations or working hours. Sometimes, there are long
intervals between visits, particularly in rural areas (Martin & Geering, 2010). They travel
communities from house to house (Schluep, et al., 2009) and spruik their business using loud
speakers. Households who have obsolete products, or other forms of recyclable materials to
dispose of would ask them to pick these up from their homes (European Communities, 2006).
After a rough evaluation from the collectors, a negotiated price would be offered to the
household. After the e-waste transaction, informal collectors are in charge of all the
transportation work including moving appliances on their vehicles and transferring e-waste to
collection points. Most informal collectors use simple transportation modes like tricycles,
80
bicycles, or small vans to lower the cost of waste collection (results from field study, refer to
Chapter 6). Figure 4-2 indicates an informal e-waste collector and e-waste components
collected.
Figure 4-2: A typical informal door-to-door collector
Photo by the author, for detailed results please refer to Chapter 6
Martin and Geering (2010) indicated that the profits earned by the informal door-to-door
collectors are from three alternative aspects: 1) Selling obsolete products directly for reuse; 2)
Extracting components for reuse; 3) Selling for dismantling and material recovery. In other
words, after purchasing from households, e-waste are sold to the highest bidder (Chi, et al.,
2011; Wilson, et al., 2006). The bidders include not only the people from dismantling centres,
but also the traders from second-hand markets. Some of the collectors also dismantle large
appliances into pieces and sell components and recyclable materials respectively to different
traders (Zeng, et al., 2010). Therefore, informal collectors are in charge of the first stage of e-
waste classification, distributing a variety of sorted e-waste, components, and materials to
downstream recyclers. In addition to providing e-waste resources for material recovery,
informal collectors also provide resources for the second-hand markets.
81
4.2.3. Advantages and limitations of informal collection
At a time when many developed countries were introducing strategies to manage the e-waste
that was being discarded on the streets, China already had a mature self-organizing informal
collection system. Households gain several benefits when trading with informal collectors in
China, which lead to a high collection rate by the informal collection method. The advantages
of the informal collection methods from the perspective of households are as follow:
1) High accessibility: Due to the large numbers of informal collectors, their working
locations are highly geographically dispersed which provides convenient access for
households (Schluep, et al., 2009).
2) Convenient door-to-door collection: The door-to-door collection service is convenient
for households, particularly for elderly people and women, who cannot move large
appliances easily (Li, et al., 2012a). Compared to many municipal collection methods in
developed countries, door-to-door collection places no pressure on the consumers to
return their waste to assigned collection points (Schluep, et al., 2009).
3) Efficient: Compared to the complicated procedure of the trade-in scheme, informal
collectors can also offer ready cash transactions after a quick evaluation (Li, et al.,
2012a).
In addition to the benefits for households, there are also environmental and social benefits
from the informal collection. Although the downstream informal workshops have produced
considerable negative impacts, the collection stage causes few environmental impacts. First,
their simple transportation (bicycles, tricycles and electric vehicles) tend to produce few
emissions due to negligible consumption of petrol. In addition, the informal collectors travel
shorter distances than formal recyclers due to their mature networks, which saves
transportation cost and also contribute to a low-emission. Moreover, their efficient manual
82
sorting procedures (Chi, et al., 2011) ensures the capture of potential products that can be
refurbished or repaired for resale and reuse. This contributes to a reduced demand for new
products and consequently for the exploitation of raw materials. Additionally, given the large
numbers of self-employed individuals and small-business employees, informal collection to
some extent provides large numbers of job opportunities for Chinese society. Furthermore, the
informal sectors are self-organized operations, so government resources for organizing e-
waste collection and recycling are not needed; it potentially reduces the official financial
budget for waste management.
However, there are also disadvantages with the informal collection method. Li, et al. (2012a)
indicated households had concerns linked with, for example, the trustworthiness of informal
collectors when they entered a home to move appliances and dissatisfaction with the price
offered for unpopular e-waste items such as mobile phones. In addition, the informal
collectors keep transferring e-waste resources from households to informal recycling
workshops. As discussed in Chapter 1.1, the downstream informal workshops have produced
substantial quantities of pollution, which strictly speaking originate from the deliveries of the
informal collectors.
4.3. The trade-in scheme
Households in China have been spoiled by the convenient informal collection service and e-
waste tradable market (UNEP, 2007a; Wang & Huisman, 2010), which make formal collection
systems hard to develop (Wang & Huisman, 2010). According to the results from the
comparative study in Section 4.1.2, the trade-in scheme is the most significant formal
collection method in China. Since the trade-in scheme is a relatively new program, there is
little literature that has introduced or discussed the scheme. This section of the chapter
examines the features of what appears to be the most promising formal e-waste collection
83
channel in terms of procedures, advantages, and limitations, aiming to provide fundamental
information to understand the trade-in scheme to be established.
4.3.1. Development of the trade-in scheme
A trade-in scheme was one strategy proposed by the Chinese authorities between 2009 and
2011(hereafter as trade-in scheme), in order to encourage the substitution of old inefficient
electronic consumer products for new ones, and to improve the efficiency of energy use and
reduce the pollution of the environment. The trade-in scheme was a trial formal collection
scheme that also provided e-waste resources for the formal recycling plants.
In contrast with trade-in schemes in other countries, the Chinese trade-in scheme was
organized and financially sponsored by the Chinese authorities instead of retailers or
manufacturers. The organization of a nation-wide scheme requires the coordination of five
official departments including the Ministry of Finance, Ministry of Commerce, National
Development and Reform Commission, the Ministry of Industry and Information Technology
and the Environmental Protection Department. All arrangements proposed by the five
departments had to be submitted to the State Council for approval before implementation
(MOF, 2009).
The implementation of the pilot trade-in scheme took place in two stages. The first stage was
from June 2009 to May 2010, launched on a small-scale and only applied in five cities (Beijing,
Tianjin, Shanghai, Fuzhou, and Changsha) and four provinces (Jiangsu, Zhejiang, Shandong, and
Guangdong) (MOF, 2009). Because large quantities of e-waste items were collected as part of
the first stage trial, the second stage of the trade-in scheme was extended to a wider range of
areas in China until the end of 2011. However, at the end of 2011, this collection method was
suspended, without an official explanation (Baike, 2011b; Zhe Li, 2010), yet the advantages
and disadvantages of the popular collection option are worth discussing.
84
4.3.2. E-waste handling Procedures
The trade-in scheme encouraged households to return five types of appliances to assigned
retailers. The five appliances include TVs, Refrigerators, Air conditioners, Washing machines,
and PCs. Households receive a subsidy – effectively a discount - from the trade-in scheme
when they are purchasing new appliances. Normally, the amount of subsidy is equal to 10% of
the price of the new item. There are also upper limits on subsidies. For example, a new TV or
PC can attract a maximum 400RMB discount while an air conditioner can get a maximum of
350RMB. Refrigerators and washing machines receive lower subsidies, 300RMB and 250RMB
respectively (6RMB≈1USD). According to official directive of the trade-in scheme, there are
mainly three steps of the trade-in scheme (MOF, 2009):
i. Return e-waste: Households have two options to return obsolete products. First,
households can make an appointment with qualified collection companies. The
company collects obsolete product(s) by a visiting collection service and provides a
trade-in voucher. In addition to the voucher, a small amount of compensation for the
recycled product is offered to households, which is similar to the recycling
compensation from informal collectors. The collection company is obliged to input
relevant information into the trade-in online system later including product category,
brand, manufacturer, serial number, end-user’s name and identification. The second e-
waste returning option for households is updated after the first one and aims to raise
efficiency (BJCOC, 2010). Households do not have to contact the collection companies
in advance. They can purchase new products first and hand over the old appliance
when a new product is delivered (Xin Kuai, 2009). In such a case, the e-waste collection
and delivering activities are combined, which in practice, saves end-users’ time and the
cost of transportation.
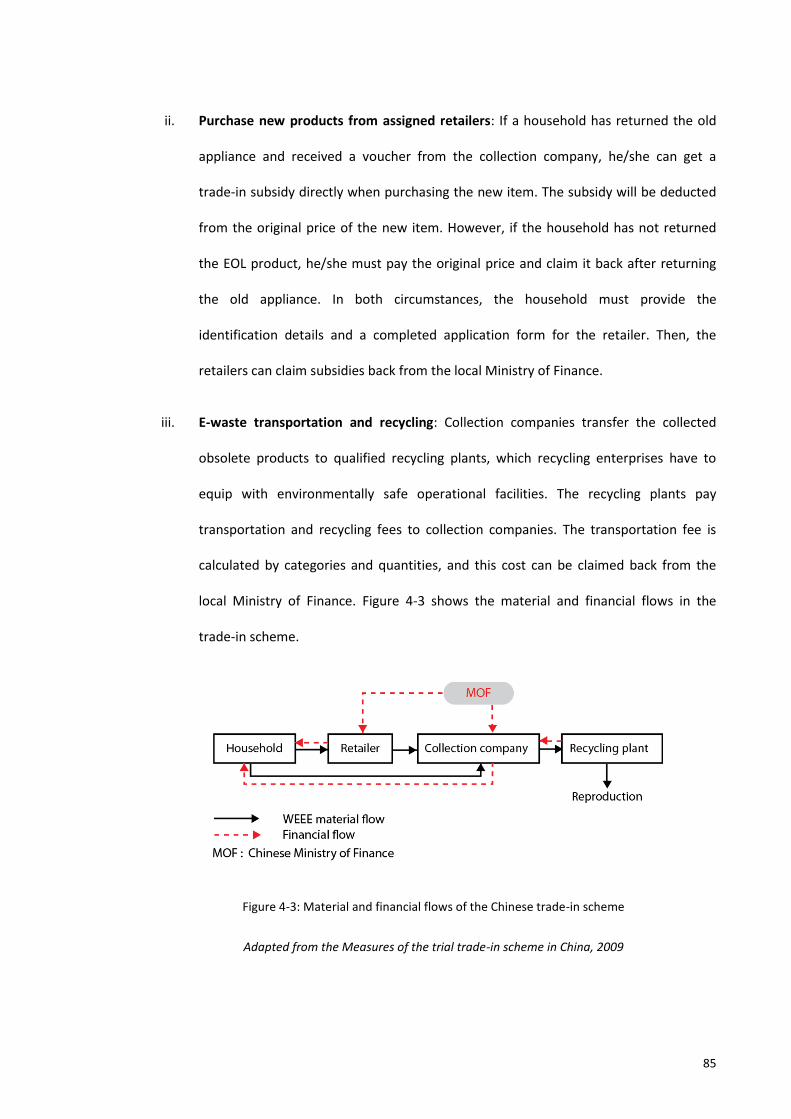
85
ii. Purchase new products from assigned retailers: If a household has returned the old
appliance and received a voucher from the collection company, he/she can get a
trade-in subsidy directly when purchasing the new item. The subsidy will be deducted
from the original price of the new item. However, if the household has not returned
the EOL product, he/she must pay the original price and claim it back after returning
the old appliance. In both circumstances, the household must provide the
identification details and a completed application form for the retailer. Then, the
retailers can claim subsidies back from the local Ministry of Finance.
iii. E-waste transportation and recycling: Collection companies transfer the collected
obsolete products to qualified recycling plants, which recycling enterprises have to
equip with environmentally safe operational facilities. The recycling plants pay
transportation and recycling fees to collection companies. The transportation fee is
calculated by categories and quantities, and this cost can be claimed back from the
local Ministry of Finance. Figure 4-3 shows the material and financial flows in the
trade-in scheme.
Figure 4-3: Material and financial flows of the Chinese trade-in scheme
Adapted from the Measures of the trial trade-in scheme in China, 2009
86
4.3.3. Advantages and limitations of the trade-in scheme
The trial trade-in scheme has shown potential success during the trial period. Up to February
2011, 134 million items of household appliances have been collected under the trade-in
scheme (MOFCOM, 2011). Survey results from Yao, et al. (2009) indicates that conventional
informal collection has been overtaken by the recently launched trade-in collection scheme.
The Chinese trade-in scheme is different to that in other countries because this form of take-
back scheme is mostly organized by producers or retailers (PHA Consulting Associates, 2006).
The Chinese Government has made considerable effort to attract households to participate in
it. In order to change households’ recycling behaviour, the Chinese trade-in scheme has
provided several incentives to compete with the conventional informal collection system
which represent unusual practices in other countries (Li, et al., 2012a):
i. Door-to-door collection: The Chinese trade-in scheme provides a door-to-door service,
which is modelled on informal collection practice. Compared with door-to-door
collection by informal collectors, formal collection companies offer high
trustworthiness. For example, it is safer for formal collectors to enter households’
homes and there is also less risk for counterfeit currency to be passed by formal
collectors. By comparison, trade-in schemes applied in many other countries require
households to return obsolete products on their own.
ii. Double compensations for households: Households can get double rewards from the
trade-in scheme including the subsidy direct from retailers and recycling compensation
from collection companies (shown in the dotted line in Figure 4-3). In other countries,
normally, households only get a discount for purchasing new items. Compared to the
informal collectors, Chinese households get an extra economic reward from the trade-
in scheme.
87
Other than the direct benefits for households, the trade-in scheme has a positive
environmental contribution in terms of reducing the quantities of e-waste that flow into
informal workshops. In addition, this competitive collection scheme promises to achieve as
high a collection rate as gained by informal collection. The practical aspects of the trade-in
scheme seem to have potential to provide valuable experience for decision makers in the
quest to establish an effective formal collection system in China.
Although the trade-in scheme has claimed a significant market in its initial stages, the
collection scheme is still a trial and could be improved. Several limitations can be identified as
follows (Li, et al., 2012a):
i. Limited range of trade-in products: In the initial stage of the trade-in scheme, only five
categories of large appliances (TVs, Refrigerators, Air conditioners, Washing machines,
and PCs) were covered. Many other product categories also generating huge
quantities such as mobile phones, have not been included in the trade-in scheme yet.
According to a result from an on-line survey, 68.9% of 14,047 respondents stated that
mobile phones should be included in the trade-in scheme (Hu & Pan, 2009). Mobile
phones have a higher approval rate than refrigerators (64.4%), washing machines
(63.4%) and air conditioners (56.1%).
ii. Limited frequency of trading: According to one condition of the trade-in scheme,
households cannot trade more than five times with the same identify card. As well as
acting as a measure to avoid cheating, it also causes difficulty for consumers who want
to replace a number of obsolete products.
iii. Complicated procedures: Households have to prepare several documents when
claiming the subsidies such as the receipt for the new product, as well as a completed
application form and their photo identification. Although the process of returning old
88
products has been improved by combining collection and delivering activities, the
trade-in is still much more time consuming than many other disposal options.
iv. Lower recycling compensation: Overall, the total economic reward from the trade-in
scheme is higher than that from the informal collectors. However, except the subsidy
for purchasing new items, payment from the trade-in scheme for recyclables is lower
than from the informal collectors (IT Times, 2009; Xin Kuai, 2009). For example, a
brand-new product and a ten-year product gain similar recycling compensation from
the trade-in scheme. The trade-in scheme considers most circumstances of replacing
very old items because the beneficial economic incentive is based upon the discount of
purchasing new product. By contrast, informal collectors can be flexible about the
price and they offer according to the condition of the products.
v. Cheating exists among retailers: This happens in the form of stealing customers’
information and is done by unscrupulous retailers in order to promote their products
to consumers who are ineligible to get subsidies (SOHU, 2011).
vi. Financial burden from the Chinese Government: There are two subsidies released by
the authorities, one for retailers and one for transportation for collection companies
(see Figure 4-3: the financial flows released from the MOF). Although the trade-in
scheme has brought a high collection rate, it is still difficult to make e-waste recycling a
profitable business due to the huge financial contribution by government. Up until
2011, the Chinese government has contributed approximately RMB 2 billion (equalling
USD0.3 billion) to support this project (Baike, 2011a).
Unfortunately, since the trade-in scheme was suspended at the end of 2011 (Baike, 2011b; Li,
2010), hundreds of collection companies and recycling plants involved in the trade-in scheme
have almost ceased trading (Ifeng, 2012b). Other than the trade-in operation, very few formal
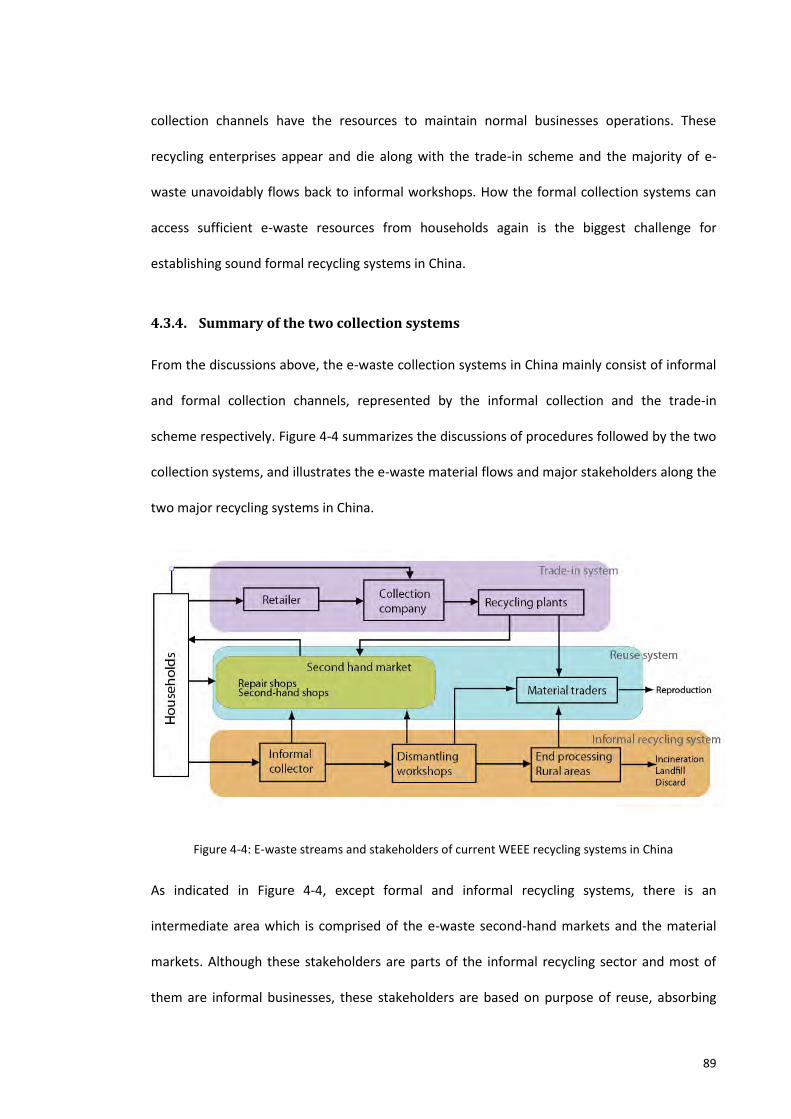
89
collection channels have the resources to maintain normal businesses operations. These
recycling enterprises appear and die along with the trade-in scheme and the majority of e-
waste unavoidably flows back to informal workshops. How the formal collection systems can
access sufficient e-waste resources from households again is the biggest challenge for
establishing sound formal recycling systems in China.
4.3.4. Summary of the two collection systems
From the discussions above, the e-waste collection systems in China mainly consist of informal
and formal collection channels, represented by the informal collection and the trade-in
scheme respectively. Figure 4-4 summarizes the discussions of procedures followed by the two
collection systems, and illustrates the e-waste material flows and major stakeholders along the
two major recycling systems in China.
Figure 4-4: E-waste streams and stakeholders of current WEEE recycling systems in China
As indicated in Figure 4-4, except formal and informal recycling systems, there is an
intermediate area which is comprised of the e-waste second-hand markets and the material
markets. Although these stakeholders are parts of the informal recycling sector and most of
them are informal businesses, these stakeholders are based on purpose of reuse, absorbing
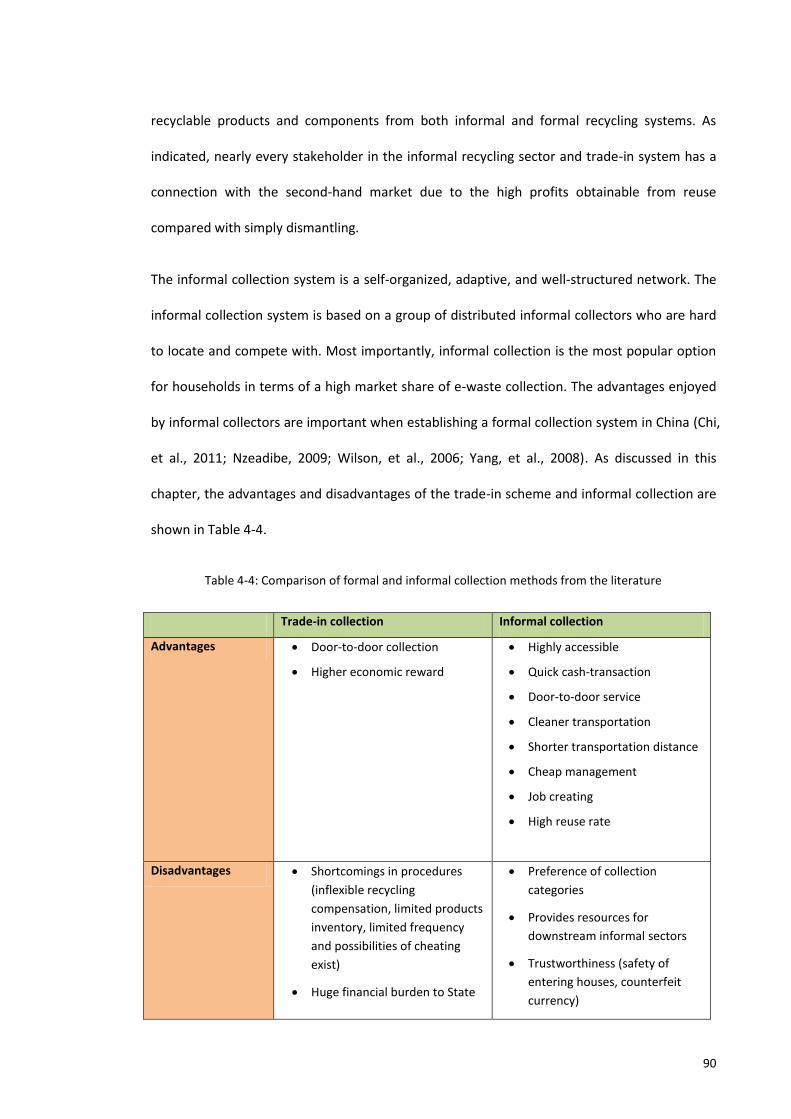
90
recyclable products and components from both informal and formal recycling systems. As
indicated, nearly every stakeholder in the informal recycling sector and trade-in system has a
connection with the second-hand market due to the high profits obtainable from reuse
compared with simply dismantling.
The informal collection system is a self-organized, adaptive, and well-structured network. The
informal collection system is based on a group of distributed informal collectors who are hard
to locate and compete with. Most importantly, informal collection is the most popular option
for households in terms of a high market share of e-waste collection. The advantages enjoyed
by informal collectors are important when establishing a formal collection system in China (Chi,
et al., 2011; Nzeadibe, 2009; Wilson, et al., 2006; Yang, et al., 2008). As discussed in this
chapter, the advantages and disadvantages of the trade-in scheme and informal collection are
shown in Table 4-4.
Table 4-4: Comparison of formal and informal collection methods from the literature
Trade-in collection Informal collection
Advantages Door-to-door collection
Higher economic reward
Highly accessible
Quick cash-transaction
Door-to-door service
Cleaner transportation
Shorter transportation distance
Cheap management
Job creating
High reuse rate
Disadvantages Shortcomings in procedures
(inflexible recycling
compensation, limited products
inventory, limited frequency
and possibilities of cheating
exist)
Huge financial burden to State
Preference of collection
categories
Provides resources for
downstream informal sectors
Trustworthiness (safety of
entering houses, counterfeit
currency)
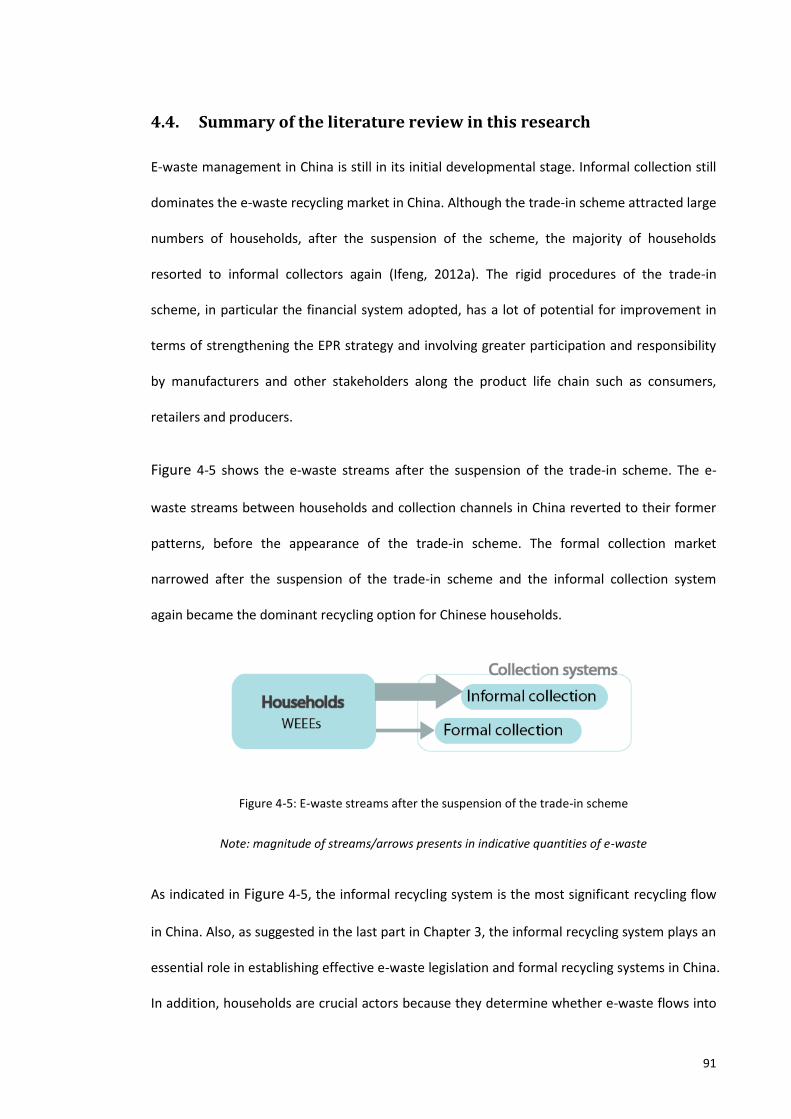
91
4.4. Summary of the literature review in this research
E-waste management in China is still in its initial developmental stage. Informal collection still
dominates the e-waste recycling market in China. Although the trade-in scheme attracted large
numbers of households, after the suspension of the scheme, the majority of households
resorted to informal collectors again (Ifeng, 2012a). The rigid procedures of the trade-in
scheme, in particular the financial system adopted, has a lot of potential for improvement in
terms of strengthening the EPR strategy and involving greater participation and responsibility
by manufacturers and other stakeholders along the product life chain such as consumers,
retailers and producers.
Figure 4-5 shows the e-waste streams after the suspension of the trade-in scheme. The e-
waste streams between households and collection channels in China reverted to their former
patterns, before the appearance of the trade-in scheme. The formal collection market
narrowed after the suspension of the trade-in scheme and the informal collection system
again became the dominant recycling option for Chinese households.
Figure 4-5: E-waste streams after the suspension of the trade-in scheme
Note: magnitude of streams/arrows presents in indicative quantities of e-waste
As indicated in Figure 4-5, the informal recycling system is the most significant recycling flow
in China. Also, as suggested in the last part in Chapter 3, the informal recycling system plays an
essential role in establishing effective e-waste legislation and formal recycling systems in China.
In addition, households are crucial actors because they determine whether e-waste flows into
92
either formal or informal recycling systems. Knowledge of their preferences and disposal
behaviour are essential to if effective strategies are to be proposed to improve the formal
collection channels in China. Given the crucial role of households and the informal recycling
system, further field studies will address two aspects:
i. Examining the operations and the advantages of informal recycling systems: Given
the advantages enjoyed by the informal collectors, there is a consensus among many
studies that the informal collectors could be formalized rather than compete with the
well-structured mature informal collection system (Chi, et al., 2011; Nzeadibe, 2009;
Wilson, et al., 2006; Yang, et al., 2008). This research identified the advantages and
limitations of the informal recycling system by a transect walk, to identify
opportunities to formalize informal stakeholders and reduce the negative impacts to
the environment and human health.
ii. Examining opportunities to improve formal collection channels by investigating
households’ e-waste disposal behaviour: The literature in Section 4.1 suggests that
very few studies have been conducted in China to examine households’ recycling
behaviour. Behavioural studies from other countries cannot be applied in China due to
the variation of e-waste collection infrastructure in countries. This research
investigated households’ e-waste disposal behaviour and the factors that influence it,
in order to identify opportunities to increase e-waste collection rate and improve the
formal collection systems.
93
CHAPTER 5: RESEARCH FRAMEWORK AND METHODOLOGY
Based upon the literature review undertaken in Chapter 2, Chapter 3 and Chapter 4 which
establishes the context and knowledge framework of the research topic, this chapter provides
a research framework of the methodology. This chapter starts with a brief discussion of the
epistemological stance and theoretical perspective of the study. The theoretical perspective
underpins the chosen methodology, and thus provides a foundation that is based on logic and
research scope criteria (Crotty, 1998). The adopted methodology and research methods follow.
This Chapter also includes the design framework of the two field studies and a discussion of
the design process.
5.1. Research methodology
5.1.1. Theoretical perspectives
Theoretical perspectives are often grounded in an epistemology that is the study of the nature
of knowledge (Mont, 2004; Schwandt, 1997). For example, traditional scientific studies are
grounded in a positivist epistemology, which holds to objective truth and meaningful reality
and does not rely on the operation of any consciousness (Crotty, 1998). On the other hand,
other academic disciplines such as the social sciences and humanities claim that such an
objective perspective is inadequate in understanding the world. Consequently, by adopting a
subjective perspective, post-positivism and subjectivism research position themselves at polar
opposites to the implied objectivism of scientific positivism. A subjective perspective is usually
based on the subject’s feelings, beliefs, attitudes or values. Some epistemologies
accommodate both by adopting a trans-disciplinary approach - constructionism.
Constructionism requires a more accommodating research perspective than positivism or
subjectivism. It adopts a research stance that suggests that truth comes into existence and is
constructed by the subject’s engagement with the issue at hand. Such an epistemological
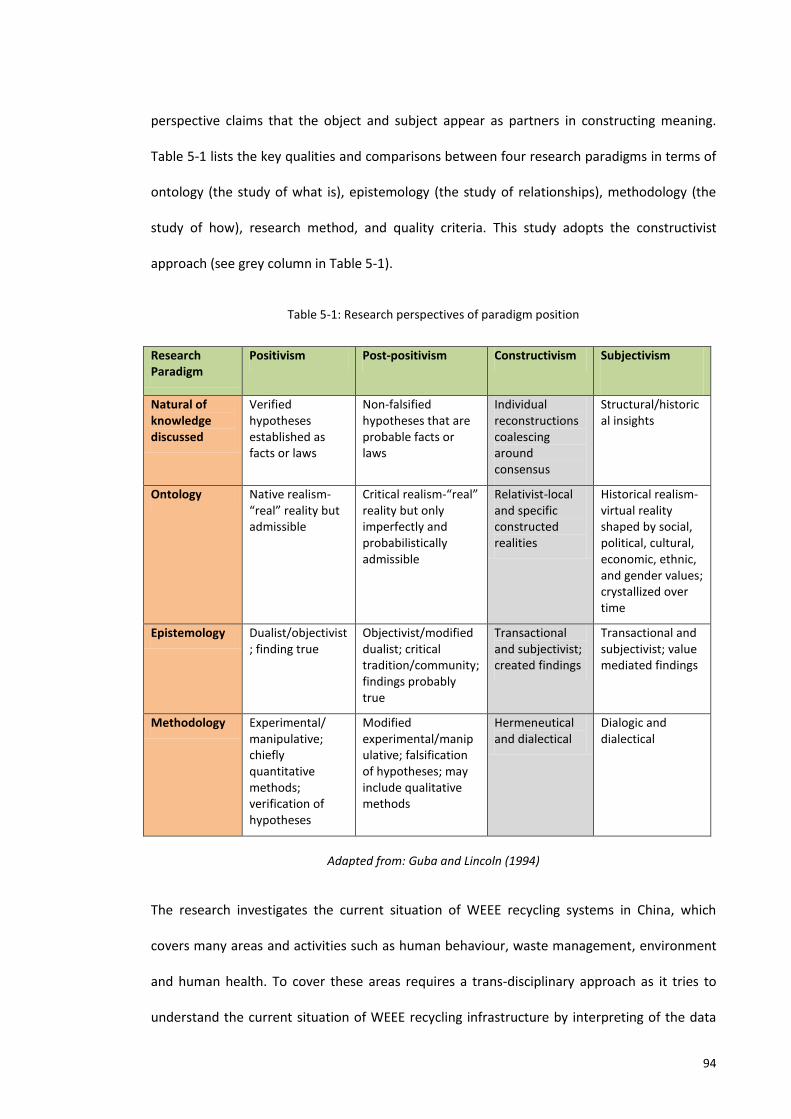
94
perspective claims that the object and subject appear as partners in constructing meaning.
Table 5-1 lists the key qualities and comparisons between four research paradigms in terms of
ontology (the study of what is), epistemology (the study of relationships), methodology (the
study of how), research method, and quality criteria. This study adopts the constructivist
approach (see grey column in Table 5-1).
Table 5-1: Research perspectives of paradigm position
Research Paradigm
Positivism Post-positivism Constructivism Subjectivism
Natural of knowledge discussed
Verified hypotheses established as facts or laws
Non-falsified hypotheses that are probable facts or laws
Individual reconstructions coalescing around consensus
Structural/historical insights
Ontology Native realism-“real” reality but admissible
Critical realism-“real” reality but only imperfectly and probabilistically admissible
Relativist-local and specific constructed realities
Historical realism-virtual reality shaped by social, political, cultural, economic, ethnic, and gender values; crystallized over time
Epistemology Dualist/objectivist; finding true
Objectivist/modified dualist; critical tradition/community; findings probably true
Transactional and subjectivist; created findings
Transactional and subjectivist; value mediated findings
Methodology Experimental/ manipulative; chiefly quantitative methods; verification of hypotheses
Modified experimental/manipulative; falsification of hypotheses; may include qualitative methods
Hermeneutical and dialectical
Dialogic and dialectical
Adapted from: Guba and Lincoln (1994)
The research investigates the current situation of WEEE recycling systems in China, which
covers many areas and activities such as human behaviour, waste management, environment
and human health. To cover these areas requires a trans-disciplinary approach as it tries to
understand the current situation of WEEE recycling infrastructure by interpreting of the data
95
from interviews of stakeholders and households. This study also tries to identify people’s
recycling behaviour by both quantitative and qualitative methods. Such an approach seeks the
understanding from the user’s perspective, which aims to construct realities in terms of the
experiences of using the collection systems. With the application of qualitative research
methods, the author becomes ‘involved’ in the study and acquires a constructivist approach.
This research also involves an empirical study, which seeks to understand what influences the
disposal behaviour of households. Since disposal behaviour mostly occurs due to behavioural
factors, the research examines the factors from the households’ perspective, and avoids being
an independent subject, which approach posits its stance in the constructivist epistemology.
Furthermore, the research examines the overarching current situation of e-waste recycling
systems by comprehensive literature reviews and empirical studies from other perspectives.
Therefore, after comparing the main epistemologies, a constructivist perspective has been
adopted in order to identify the socially constructed factors and phenomena of WEEE recycling
behaviour.
5.1.2. Research methods
Different research methods can produce very different results and thus influence the validity
of the research. According to the research aims and research questions (refer to Chapter 1.2),
there are four research methods applied in this study.
1. Literature review
The literature review is a methodological foundation of all research (Ranjit, 2005). The
literature review in this research addresses the e-waste recycling in China and focuses in
particular on the informal recycling sector. After formulating the research questions, the
literature review is also essential for conceptualising a research design and establishing valid
research questions and reliable research instruments. In addition, the literature review
96
provides foundational supports for collecting and processing data such as the adoption of
research methods to approach target groups (refer to Section 5.2.2 and Section 5.3.3). There
are mainly three literature reviews in this research, Chapter 2, Chapter 3 and Chapter 4 (see
Chapter 1, Section 1.4 for the detailed contents of these Chapters).
2. Applying the Theory Planned Behaviour (TPB) model
After comparing the three behavioural research models from the literature, the TPB model is
used as a psychological model to guide the field study, which aims to explore households’
recycling behaviour (refer to Section 5.3.1). The background for applying the TPB model is
different in China, where it is based on informal recycling systems. Therefore, when applying
the TPB model in China, it has to be adapted based on an understanding of existing recycling
systems and available collection channels for Chinese households (details of adapted TPB
model refer to Section 5.3.1).
3. Comparative study
The comparative study is used to compare the features of the formal and informal collection
and recycling systems. This study explores the advantages and disadvantages of the informal
recycling by comparing it to the formal recycling systems by way of collection methods,
collected volumes of e-waste, recycling cost, recycling procedures and technologies, and
environmental impacts (refer to Chapter 3). Additionally, informal collection and the trade-in
scheme, which are the most significant collection methods in China, are compared according
to the attitudes and feedback from households in the behavioural field study (refer to Chapter
8). Therefore, the comparative study is conducted through both the literature review and field
studies.
97
4. Field studies
Since the informal recycling play a crucial role from which to create effective and successful
formal recycling systems in China, this research conducted a field study to observe and
examine e-waste recycling operations by informal recycling sectors in Tianjin. Field Study A
consists of a photographic observation and interviews with available informal e-waste
stakeholders including two groups of collectors, second-hand markets, repair shops,
component suppliers and dismantling centres.
Moreover, a subsequent field study (Field Study B) was conducted to investigate households’
e-waste disposal behaviour in terms of four aspects: HOW/behaviour, WHY/motivation,
attitudes to recycling and Satisfaction/Expectations (refer to Section 5.3.1 for definitions of
four themes). Social survey research is an important research method to gain unbiased data to
support or negate a statement, investigate new knowledge, identify correlations between
variables, and generalize explanations to guide decision makers (Backstrom & Charles Herbert,
1963; Buckingham & Alan, 2004; Neuman & William Lawrence, 2003). Both quantitative and
qualitative methods are involved in the social survey and 1200 questionnaires were distributed
in Tianjin. Furthermore, another 15 households participated in the follow-up interviews.
5.1.3. Mixed-methods research
“Mixed-methods research draws upon both quantitative and qualitative methodological
approaches to answer a particular research question—Hewson (2006)”. This research adopts a
trans-disciplinary approach which is applicable to a constructivist methodology (refer to
Section 5.1.1), utilising a mixed research method that includes both quantitative and
qualitative methods can produce better outcomes because these two methods provide a
complement for each other (Morse, 1991). Overall, there are three strategies that are
conducted in different orders for applying a mixed-methods research (Hewson, 2006). The
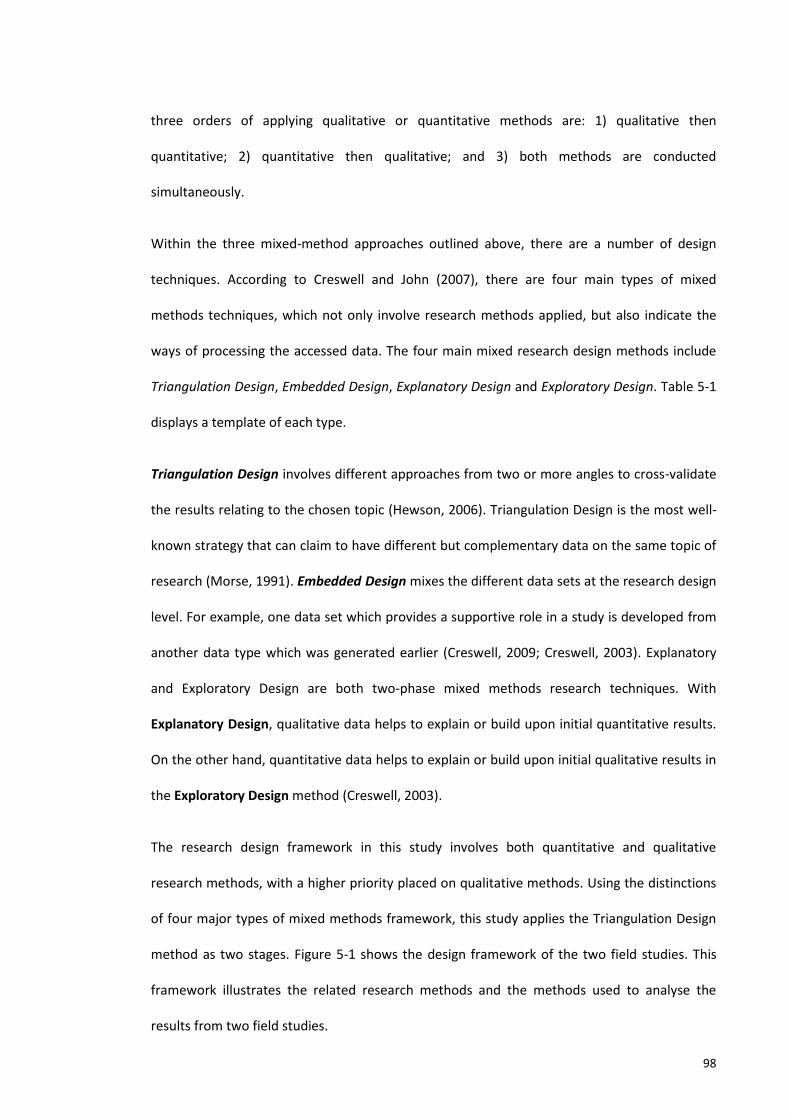
98
three orders of applying qualitative or quantitative methods are: 1) qualitative then
quantitative; 2) quantitative then qualitative; and 3) both methods are conducted
simultaneously.
Within the three mixed-method approaches outlined above, there are a number of design
techniques. According to Creswell and John (2007), there are four main types of mixed
methods techniques, which not only involve research methods applied, but also indicate the
ways of processing the accessed data. The four main mixed research design methods include
Triangulation Design, Embedded Design, Explanatory Design and Exploratory Design. Table 5-1
displays a template of each type.
Triangulation Design involves different approaches from two or more angles to cross-validate
the results relating to the chosen topic (Hewson, 2006). Triangulation Design is the most well-
known strategy that can claim to have different but complementary data on the same topic of
research (Morse, 1991). Embedded Design mixes the different data sets at the research design
level. For example, one data set which provides a supportive role in a study is developed from
another data type which was generated earlier (Creswell, 2009; Creswell, 2003). Explanatory
and Exploratory Design are both two-phase mixed methods research techniques. With
Explanatory Design, qualitative data helps to explain or build upon initial quantitative results.
On the other hand, quantitative data helps to explain or build upon initial qualitative results in
the Exploratory Design method (Creswell, 2003).
The research design framework in this study involves both quantitative and qualitative
research methods, with a higher priority placed on qualitative methods. Using the distinctions
of four major types of mixed methods framework, this study applies the Triangulation Design
method as two stages. Figure 5-1 shows the design framework of the two field studies. This
framework illustrates the related research methods and the methods used to analyse the
results from two field studies.
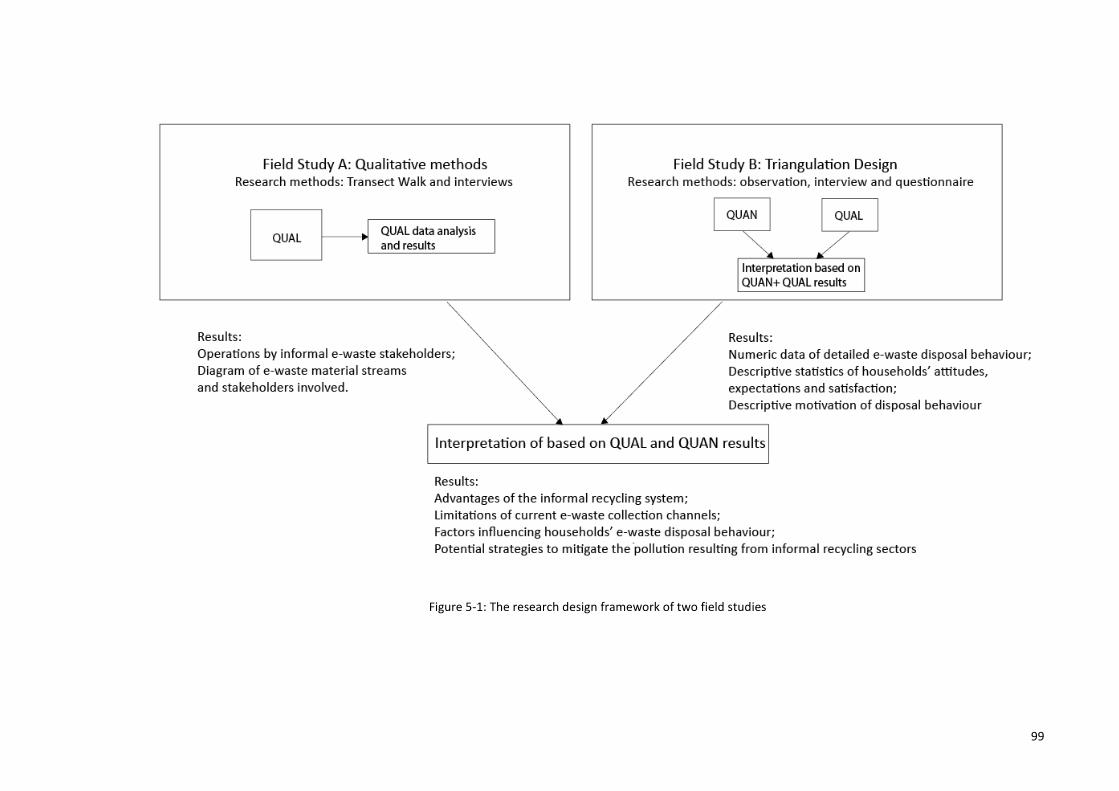
99
Figure 5-1: The research design framework of two field studies
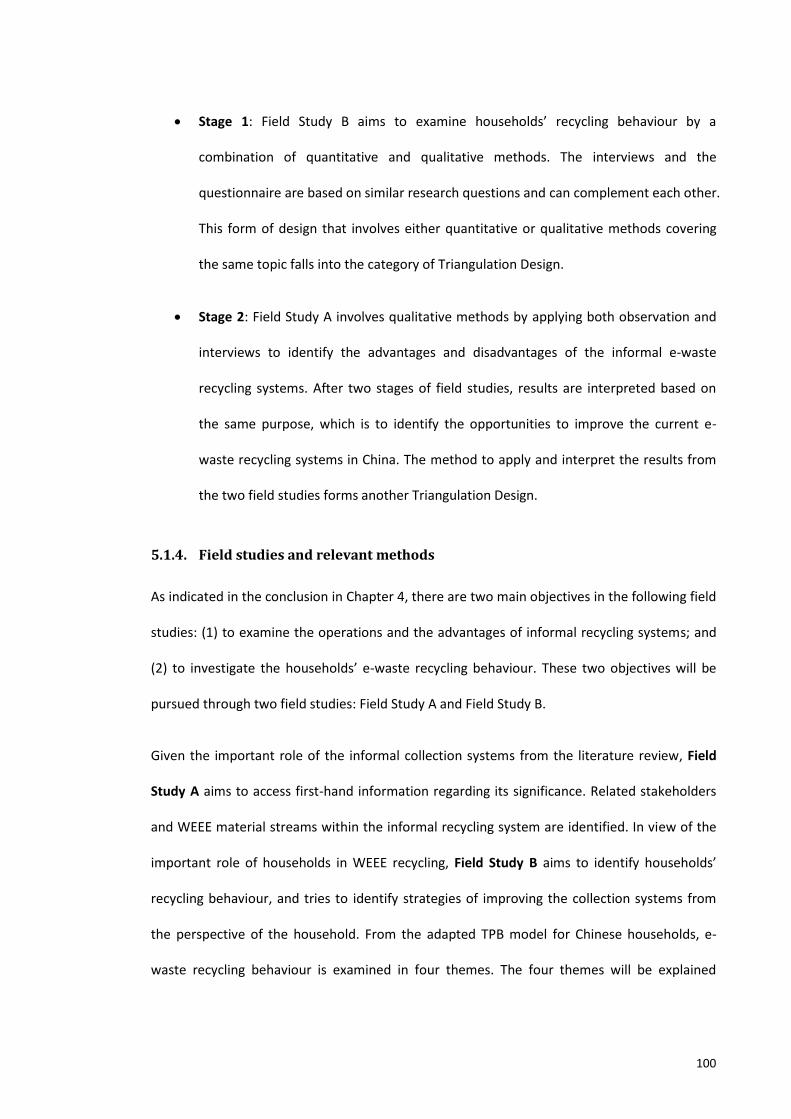
100
Stage 1: Field Study B aims to examine households’ recycling behaviour by a
combination of quantitative and qualitative methods. The interviews and the
questionnaire are based on similar research questions and can complement each other.
This form of design that involves either quantitative or qualitative methods covering
the same topic falls into the category of Triangulation Design.
Stage 2: Field Study A involves qualitative methods by applying both observation and
interviews to identify the advantages and disadvantages of the informal e-waste
recycling systems. After two stages of field studies, results are interpreted based on
the same purpose, which is to identify the opportunities to improve the current e-
waste recycling systems in China. The method to apply and interpret the results from
the two field studies forms another Triangulation Design.
5.1.4. Field studies and relevant methods
As indicated in the conclusion in Chapter 4, there are two main objectives in the following field
studies: (1) to examine the operations and the advantages of informal recycling systems; and
(2) to investigate the households’ e-waste recycling behaviour. These two objectives will be
pursued through two field studies: Field Study A and Field Study B.
Given the important role of the informal collection systems from the literature review, Field
Study A aims to access first-hand information regarding its significance. Related stakeholders
and WEEE material streams within the informal recycling system are identified. In view of the
important role of households in WEEE recycling, Field Study B aims to identify households’
recycling behaviour, and tries to identify strategies of improving the collection systems from
the perspective of the household. From the adapted TPB model for Chinese households, e-
waste recycling behaviour is examined in four themes. The four themes will be explained
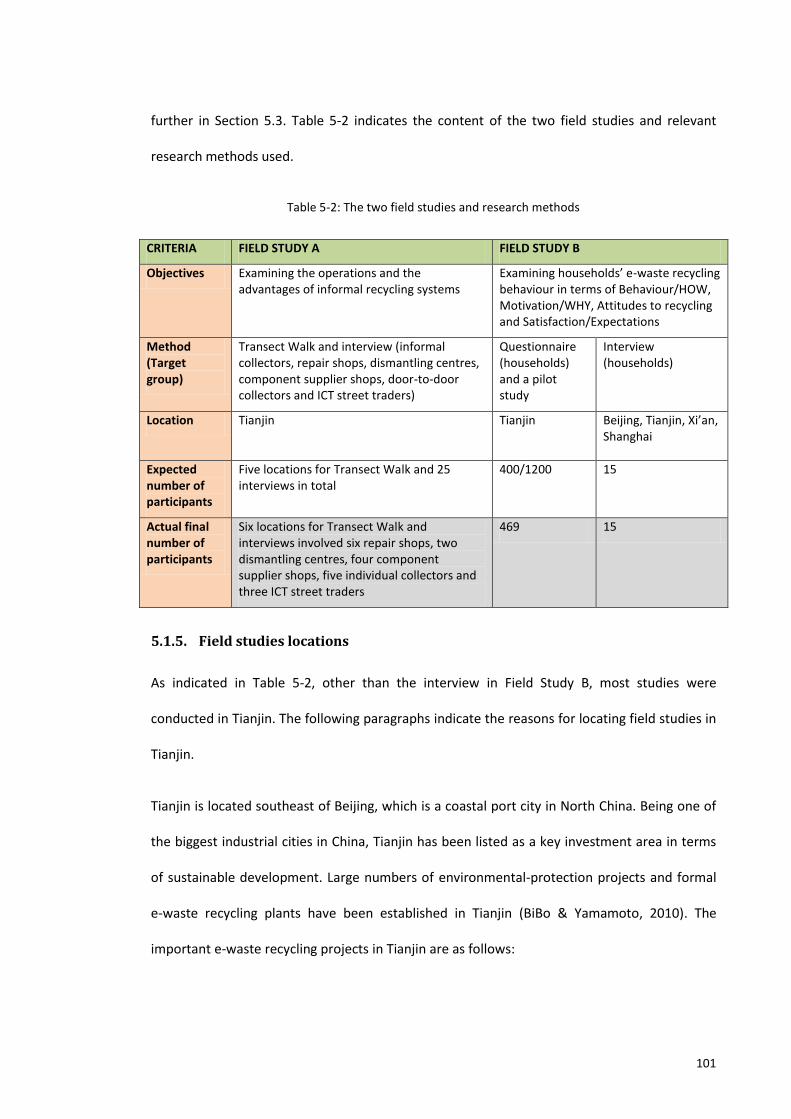
101
further in Section 5.3. Table 5-2 indicates the content of the two field studies and relevant
research methods used.
Table 5-2: The two field studies and research methods
CRITERIA FIELD STUDY A FIELD STUDY B
Objectives Examining the operations and the advantages of informal recycling systems
Examining households’ e-waste recycling behaviour in terms of Behaviour/HOW, Motivation/WHY, Attitudes to recycling and Satisfaction/Expectations
Method (Target group)
Transect Walk and interview (informal collectors, repair shops, dismantling centres, component supplier shops, door-to-door collectors and ICT street traders)
Questionnaire (households) and a pilot study
Interview (households)
Location Tianjin
Tianjin Beijing, Tianjin, Xi’an, Shanghai
Expected number of participants
Five locations for Transect Walk and 25 interviews in total
400/1200 15
Actual final number of participants
Six locations for Transect Walk and interviews involved six repair shops, two dismantling centres, four component supplier shops, five individual collectors and three ICT street traders
469 15
5.1.5. Field studies locations
As indicated in Table 5-2, other than the interview in Field Study B, most studies were
conducted in Tianjin. The following paragraphs indicate the reasons for locating field studies in
Tianjin.
Tianjin is located southeast of Beijing, which is a coastal port city in North China. Being one of
the biggest industrial cities in China, Tianjin has been listed as a key investment area in terms
of sustainable development. Large numbers of environmental-protection projects and formal
e-waste recycling plants have been established in Tianjin (BiBo & Yamamoto, 2010). The
important e-waste recycling projects in Tianjin are as follows:
102
i. There were 6 large scale national e-waste recycling plants established in Tianjin before
2011, among the 21 nationwide, at that time (Chi, et al., 2011).
ii. Tianjin was one of the pilot cities for the trade-in scheme for collecting e-waste (MOF,
2009).
iii. Tianjin owns a number of Recycling Industrial Parks, which involve a variety of
sustainable plants, aiming to promote efficient and environmentally safe recovery of
waste from other plants (Shinkuma & Huong, 2009).
iv. When manufacturers launched the free formal collection schemes before 2005, Tianjin
was also one of the pilot cities (Chi, et al., 2011; European Communities, 2006; Lu,
2008).
Moreover, Tianjin possesses the following important characteristics for conducting the
Transect Walk and questionnaires:
i. Comprehensive formal and informal collection systems: Given the various formal
recycling projects that were launched in Tianjin, households there have more
opportunities to dispose of their e-waste through formal collection channels such as
trade-in, manufacturer take-back or a collection service from formal collection
companies. By contrast, e-waste collection in most regions of China has been
dominated by informal collection. In addition, because Tianjin was one of the earliest
areas that launched the pilot trade-in scheme, households in Tianjin are more likely to
be familiar with it and thus provide better feedback for the survey, such as the
differing attitudes towards informal and formal trade-in collection options.
ii. Enormous amounts of e-waste resources: there are mainly three e-waste resources in
Tianjin, including e-waste generated from local residents, e-waste exported by Japan,
and considerable volumes of e-waste produced by large numbers of OEMs.
103
1) People living in Tianjin have comparatively higher incomes (National Bureau of
Statistics of China, 2011), which thus stimulates the consumption of electronic
products. Tianjin is the sixth largest city nationally in terms of its large
population (11.8 million) and land area. Moreover, until 2011, the per capita
gross domestic product (GDP) in Tianjin had jumped above that for Beijing and
Shanghai, taking the first place in China (National Bureau of Statistics of China,
2011). Therefore, households in Tianjin produce more e-waste than other
regions in China due to the large population and high income levels (L. Li et al.,
2008; Yao, et al., 2009).
2) A new growth area called Binhai, was established in Tianjin, which has
gathered more than 500 international companies, many of which are
electronic products manufacturers such as the famous brands SAMSUNG,
MOTOROLA, LG and Panasonic. As indicated in Chapter 1.1, a considerable
amount of e-waste is generated by manufacturing, particularly considering
such large numbers of manufacturers in Tianjin.
3) Other than the e-waste from OEMs, there are studies which indicate that
Tianjin is also a major target for accepting e-waste, which is exported illegally
by Japan (Terazono, et al., 2004).
iii. Fully-fledged informal collection systems: Given the large quantity of e-waste
resources in Tianjin, the informal recycling systems appear to be comparatively well-
developed in terms of comprehensive functions along the e-waste recycling chain.
Field Study A examined the e-waste operations of local informal recycling stakeholders,
and Tianjin is one of the ideal cities to conduct the study.
104
Besides the questionnaire and Transect Walk, this study involved an interview study in order to
gain an in-depth and comprehensive understanding of e-waste disposal behaviour and observe
the e-waste collection infrastructure in different cities of China. Four cities - Tianjin, Beijing,
Shanghai, and Xi’an, are selected as targets for the follow-up interviews. Tianjin is the target
city for conducting Field Study A. Beijing and Shanghai have launched hazardous e-waste
collection service using public bins strategically placed in communities in these two cities
(Xinhua, 2011). Therefore, it is possible to evaluate the effectiveness of collection bins from
households in Beijing and Shanghai. Compared to these relatively well-developed coastal cities,
Xi’an is located in the centre of China and tends to display rather different disposal behaviour.
5.2. Field Study A: Transect Walk
As suggested in Section 5.1.4, there are two field studies in this research (refer to Table 5-2).
This section introduces the design of Field Study A in terms of aims, research questions,
methods of accessing targets and methods of data analysis.
5.2.1. Research questions in Field Study A
Field Study A examines the operations and the advantages of informal recycling. There are
three groups of research questions for Field Study A: e-waste resource preferences by informal
various stakeholders, function of stakeholders and operation of the e-waste recycling activities
within the urban area of Tianjin (see Table 5-3). Two research methods were applied in the
Transect Walk – interviews and observation.
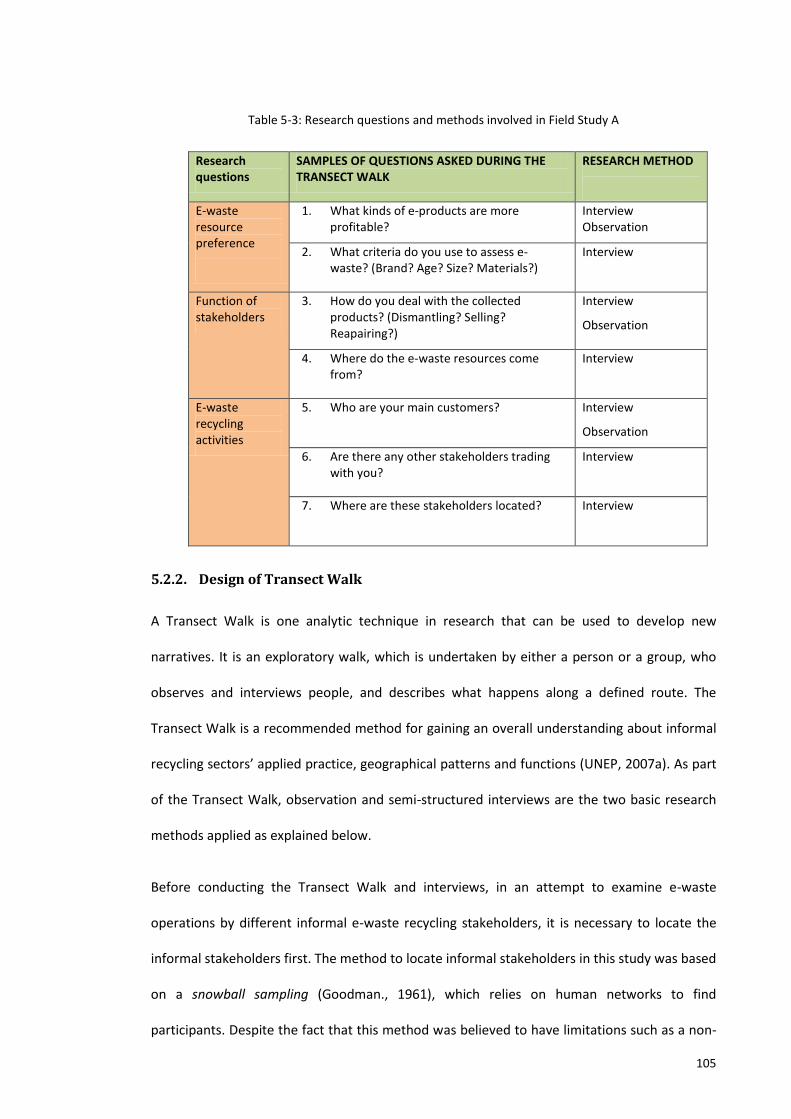
105
Table 5-3: Research questions and methods involved in Field Study A
Research questions
SAMPLES OF QUESTIONS ASKED DURING THE TRANSECT WALK
RESEARCH METHOD
E-waste resource preference
1. What kinds of e-products are more profitable?
Interview Observation
2. What criteria do you use to assess e-waste? (Brand? Age? Size? Materials?)
Interview
Function of stakeholders
3. How do you deal with the collected products? (Dismantling? Selling? Reapairing?)
Interview
Observation
4. Where do the e-waste resources come from?
Interview
E-waste recycling activities
5. Who are your main customers? Interview
Observation
6. Are there any other stakeholders trading with you?
Interview
7. Where are these stakeholders located? Interview
5.2.2. Design of Transect Walk
A Transect Walk is one analytic technique in research that can be used to develop new
narratives. It is an exploratory walk, which is undertaken by either a person or a group, who
observes and interviews people, and describes what happens along a defined route. The
Transect Walk is a recommended method for gaining an overall understanding about informal
recycling sectors’ applied practice, geographical patterns and functions (UNEP, 2007a). As part
of the Transect Walk, observation and semi-structured interviews are the two basic research
methods applied as explained below.
Before conducting the Transect Walk and interviews, in an attempt to examine e-waste
operations by different informal e-waste recycling stakeholders, it is necessary to locate the
informal stakeholders first. The method to locate informal stakeholders in this study was based
on a snowball sampling (Goodman., 1961), which relies on human networks to find
participants. Despite the fact that this method was believed to have limitations such as a non-
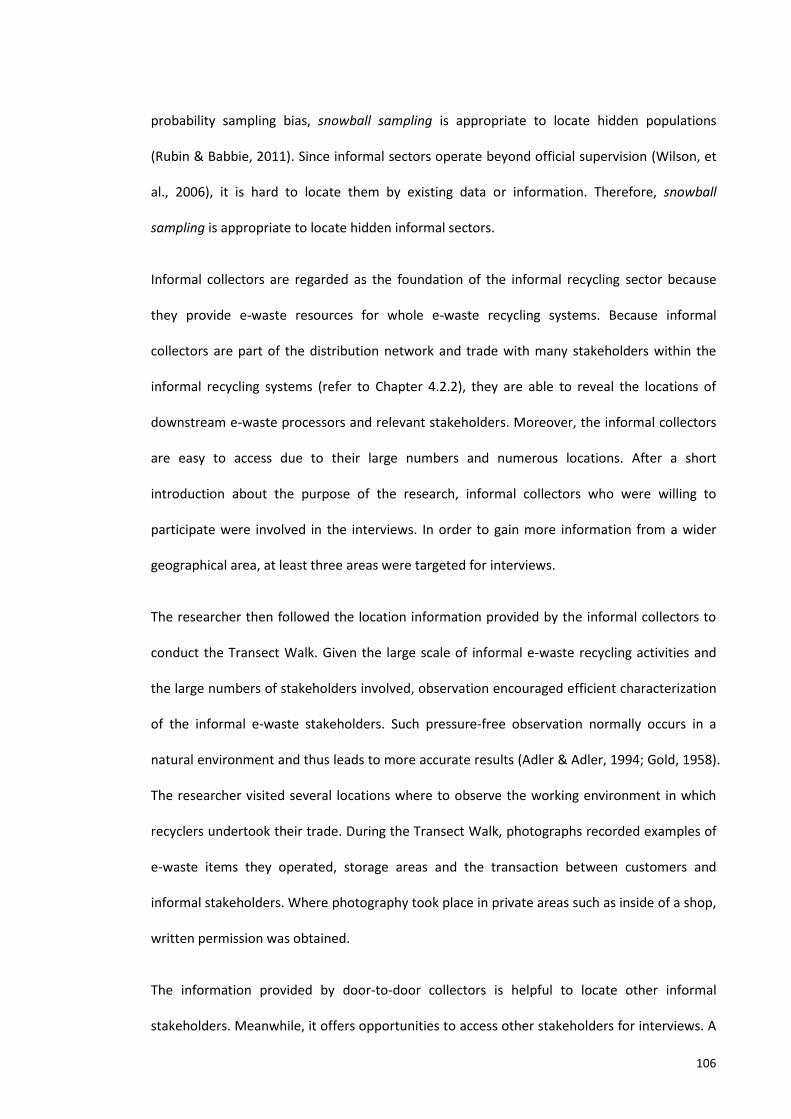
106
probability sampling bias, snowball sampling is appropriate to locate hidden populations
(Rubin & Babbie, 2011). Since informal sectors operate beyond official supervision (Wilson, et
al., 2006), it is hard to locate them by existing data or information. Therefore, snowball
sampling is appropriate to locate hidden informal sectors.
Informal collectors are regarded as the foundation of the informal recycling sector because
they provide e-waste resources for whole e-waste recycling systems. Because informal
collectors are part of the distribution network and trade with many stakeholders within the
informal recycling systems (refer to Chapter 4.2.2), they are able to reveal the locations of
downstream e-waste processors and relevant stakeholders. Moreover, the informal collectors
are easy to access due to their large numbers and numerous locations. After a short
introduction about the purpose of the research, informal collectors who were willing to
participate were involved in the interviews. In order to gain more information from a wider
geographical area, at least three areas were targeted for interviews.
The researcher then followed the location information provided by the informal collectors to
conduct the Transect Walk. Given the large scale of informal e-waste recycling activities and
the large numbers of stakeholders involved, observation encouraged efficient characterization
of the informal e-waste stakeholders. Such pressure-free observation normally occurs in a
natural environment and thus leads to more accurate results (Adler & Adler, 1994; Gold, 1958).
The researcher visited several locations where to observe the working environment in which
recyclers undertook their trade. During the Transect Walk, photographs recorded examples of
e-waste items they operated, storage areas and the transaction between customers and
informal stakeholders. Where photography took place in private areas such as inside of a shop,
written permission was obtained.
The information provided by door-to-door collectors is helpful to locate other informal
stakeholders. Meanwhile, it offers opportunities to access other stakeholders for interviews. A
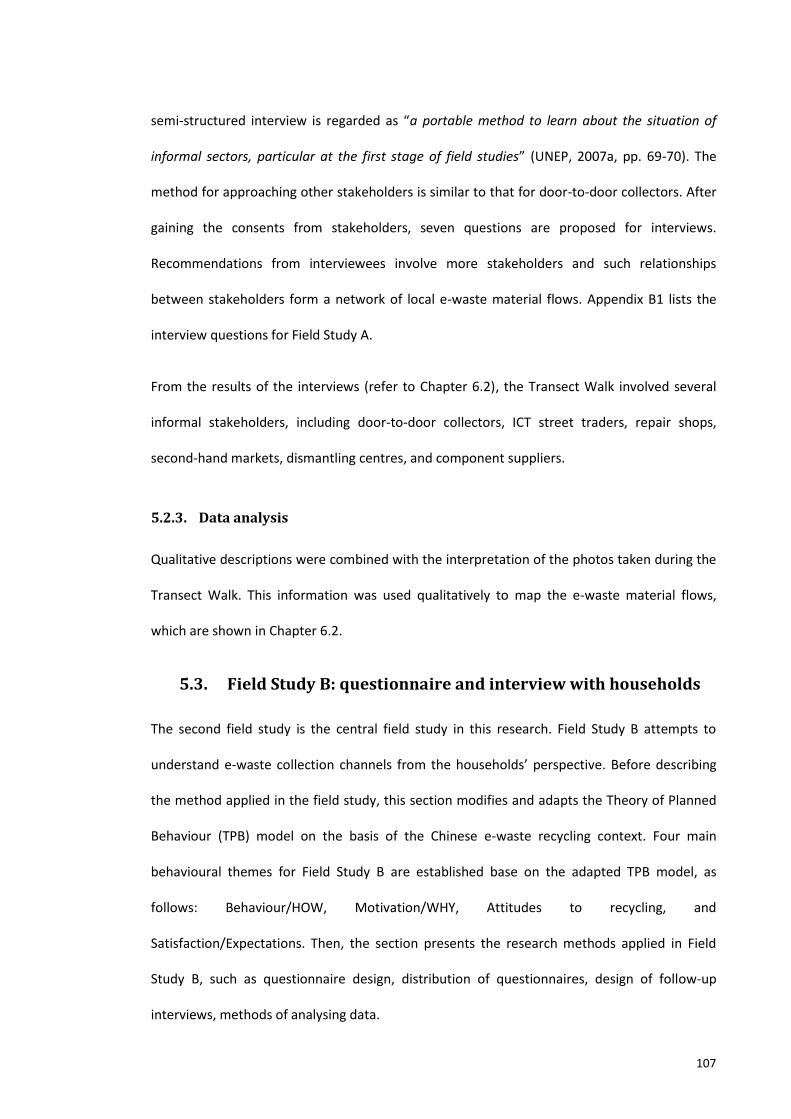
107
semi-structured interview is regarded as “a portable method to learn about the situation of
informal sectors, particular at the first stage of field studies” (UNEP, 2007a, pp. 69-70). The
method for approaching other stakeholders is similar to that for door-to-door collectors. After
gaining the consents from stakeholders, seven questions are proposed for interviews.
Recommendations from interviewees involve more stakeholders and such relationships
between stakeholders form a network of local e-waste material flows. Appendix B1 lists the
interview questions for Field Study A.
From the results of the interviews (refer to Chapter 6.2), the Transect Walk involved several
informal stakeholders, including door-to-door collectors, ICT street traders, repair shops,
second-hand markets, dismantling centres, and component suppliers.
5.2.3. Data analysis
Qualitative descriptions were combined with the interpretation of the photos taken during the
Transect Walk. This information was used qualitatively to map the e-waste material flows,
which are shown in Chapter 6.2.
5.3. Field Study B: questionnaire and interview with households
The second field study is the central field study in this research. Field Study B attempts to
understand e-waste collection channels from the households’ perspective. Before describing
the method applied in the field study, this section modifies and adapts the Theory of Planned
Behaviour (TPB) model on the basis of the Chinese e-waste recycling context. Four main
behavioural themes for Field Study B are established base on the adapted TPB model, as
follows: Behaviour/HOW, Motivation/WHY, Attitudes to recycling, and
Satisfaction/Expectations. Then, the section presents the research methods applied in Field
Study B, such as questionnaire design, distribution of questionnaires, design of follow-up
interviews, methods of analysing data.
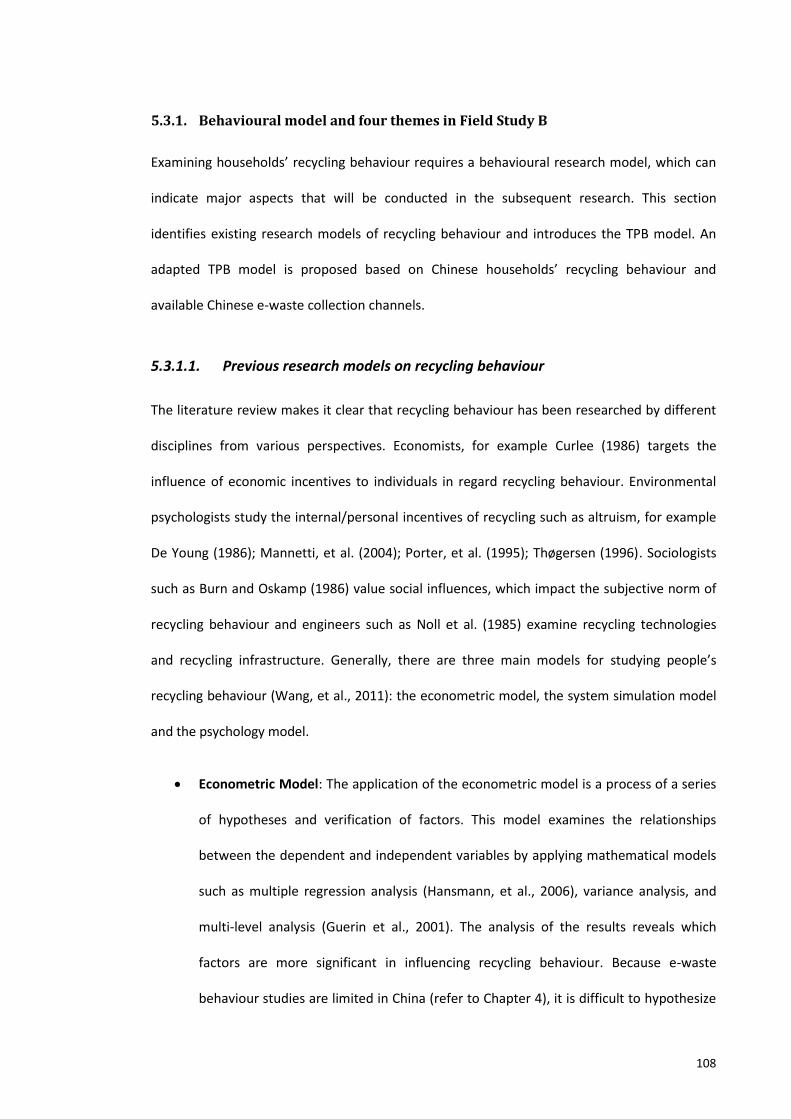
108
5.3.1. Behavioural model and four themes in Field Study B
Examining households’ recycling behaviour requires a behavioural research model, which can
indicate major aspects that will be conducted in the subsequent research. This section
identifies existing research models of recycling behaviour and introduces the TPB model. An
adapted TPB model is proposed based on Chinese households’ recycling behaviour and
available Chinese e-waste collection channels.
5.3.1.1. Previous research models on recycling behaviour
The literature review makes it clear that recycling behaviour has been researched by different
disciplines from various perspectives. Economists, for example Curlee (1986) targets the
influence of economic incentives to individuals in regard recycling behaviour. Environmental
psychologists study the internal/personal incentives of recycling such as altruism, for example
De Young (1986); Mannetti, et al. (2004); Porter, et al. (1995); Thøgersen (1996). Sociologists
such as Burn and Oskamp (1986) value social influences, which impact the subjective norm of
recycling behaviour and engineers such as Noll et al. (1985) examine recycling technologies
and recycling infrastructure. Generally, there are three main models for studying people’s
recycling behaviour (Wang, et al., 2011): the econometric model, the system simulation model
and the psychology model.
Econometric Model: The application of the econometric model is a process of a series
of hypotheses and verification of factors. This model examines the relationships
between the dependent and independent variables by applying mathematical models
such as multiple regression analysis (Hansmann, et al., 2006), variance analysis, and
multi-level analysis (Guerin et al., 2001). The analysis of the results reveals which
factors are more significant in influencing recycling behaviour. Because e-waste
behaviour studies are limited in China (refer to Chapter 4), it is difficult to hypothesize
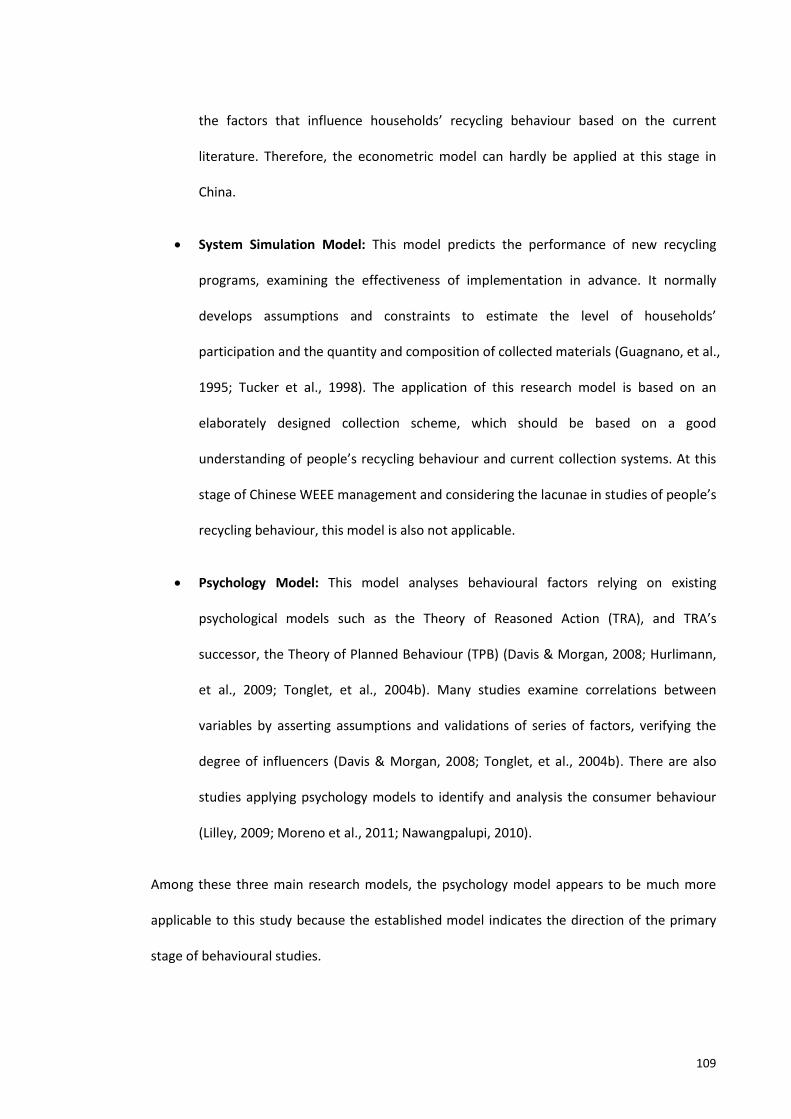
109
the factors that influence households’ recycling behaviour based on the current
literature. Therefore, the econometric model can hardly be applied at this stage in
China.
System Simulation Model: This model predicts the performance of new recycling
programs, examining the effectiveness of implementation in advance. It normally
develops assumptions and constraints to estimate the level of households’
participation and the quantity and composition of collected materials (Guagnano, et al.,
1995; Tucker et al., 1998). The application of this research model is based on an
elaborately designed collection scheme, which should be based on a good
understanding of people’s recycling behaviour and current collection systems. At this
stage of Chinese WEEE management and considering the lacunae in studies of people’s
recycling behaviour, this model is also not applicable.
Psychology Model: This model analyses behavioural factors relying on existing
psychological models such as the Theory of Reasoned Action (TRA), and TRA’s
successor, the Theory of Planned Behaviour (TPB) (Davis & Morgan, 2008; Hurlimann,
et al., 2009; Tonglet, et al., 2004b). Many studies examine correlations between
variables by asserting assumptions and validations of series of factors, verifying the
degree of influencers (Davis & Morgan, 2008; Tonglet, et al., 2004b). There are also
studies applying psychology models to identify and analysis the consumer behaviour
(Lilley, 2009; Moreno et al., 2011; Nawangpalupi, 2010).
Among these three main research models, the psychology model appears to be much more
applicable to this study because the established model indicates the direction of the primary
stage of behavioural studies.
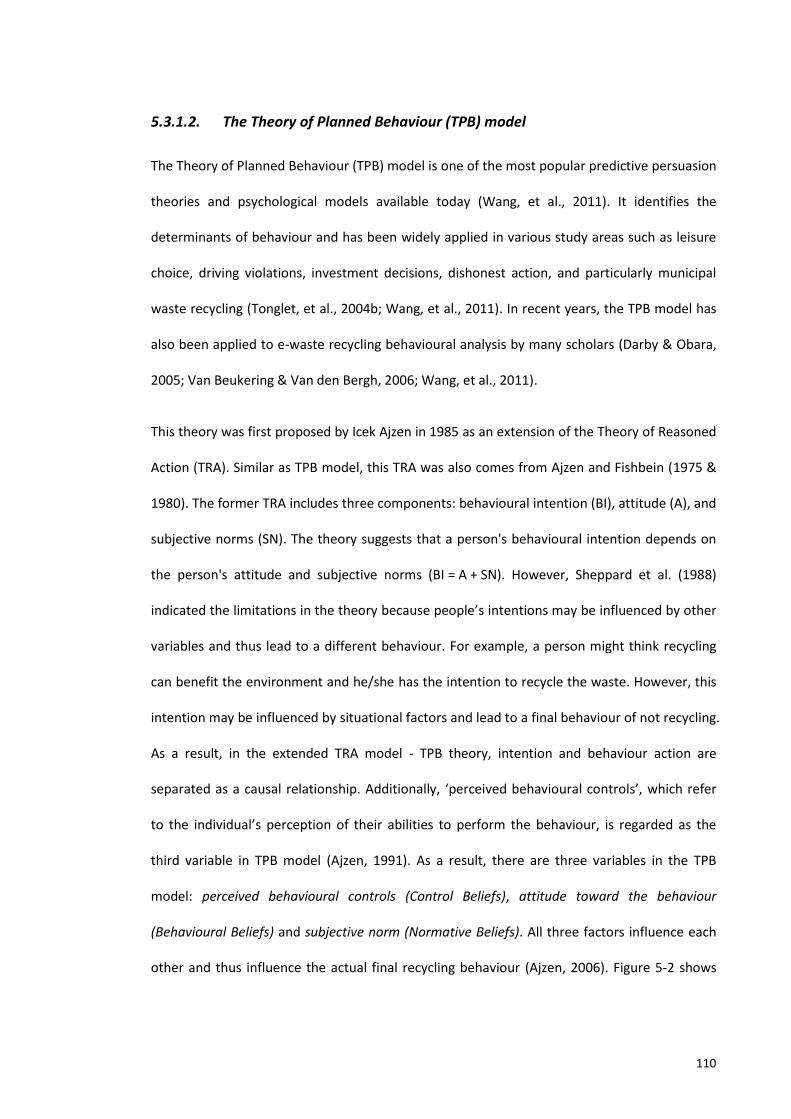
110
5.3.1.2. The Theory of Planned Behaviour (TPB) model
The Theory of Planned Behaviour (TPB) model is one of the most popular predictive persuasion
theories and psychological models available today (Wang, et al., 2011). It identifies the
determinants of behaviour and has been widely applied in various study areas such as leisure
choice, driving violations, investment decisions, dishonest action, and particularly municipal
waste recycling (Tonglet, et al., 2004b; Wang, et al., 2011). In recent years, the TPB model has
also been applied to e-waste recycling behavioural analysis by many scholars (Darby & Obara,
2005; Van Beukering & Van den Bergh, 2006; Wang, et al., 2011).
This theory was first proposed by Icek Ajzen in 1985 as an extension of the Theory of Reasoned
Action (TRA). Similar as TPB model, this TRA was also comes from Ajzen and Fishbein (1975 &
1980). The former TRA includes three components: behavioural intention (BI), attitude (A), and
subjective norms (SN). The theory suggests that a person's behavioural intention depends on
the person's attitude and subjective norms (BI = A + SN). However, Sheppard et al. (1988)
indicated the limitations in the theory because people’s intentions may be influenced by other
variables and thus lead to a different behaviour. For example, a person might think recycling
can benefit the environment and he/she has the intention to recycle the waste. However, this
intention may be influenced by situational factors and lead to a final behaviour of not recycling.
As a result, in the extended TRA model - TPB theory, intention and behaviour action are
separated as a causal relationship. Additionally, ‘perceived behavioural controls’, which refer
to the individual’s perception of their abilities to perform the behaviour, is regarded as the
third variable in TPB model (Ajzen, 1991). As a result, there are three variables in the TPB
model: perceived behavioural controls (Control Beliefs), attitude toward the behaviour
(Behavioural Beliefs) and subjective norm (Normative Beliefs). All three factors influence each
other and thus influence the actual final recycling behaviour (Ajzen, 2006). Figure 5-2 shows
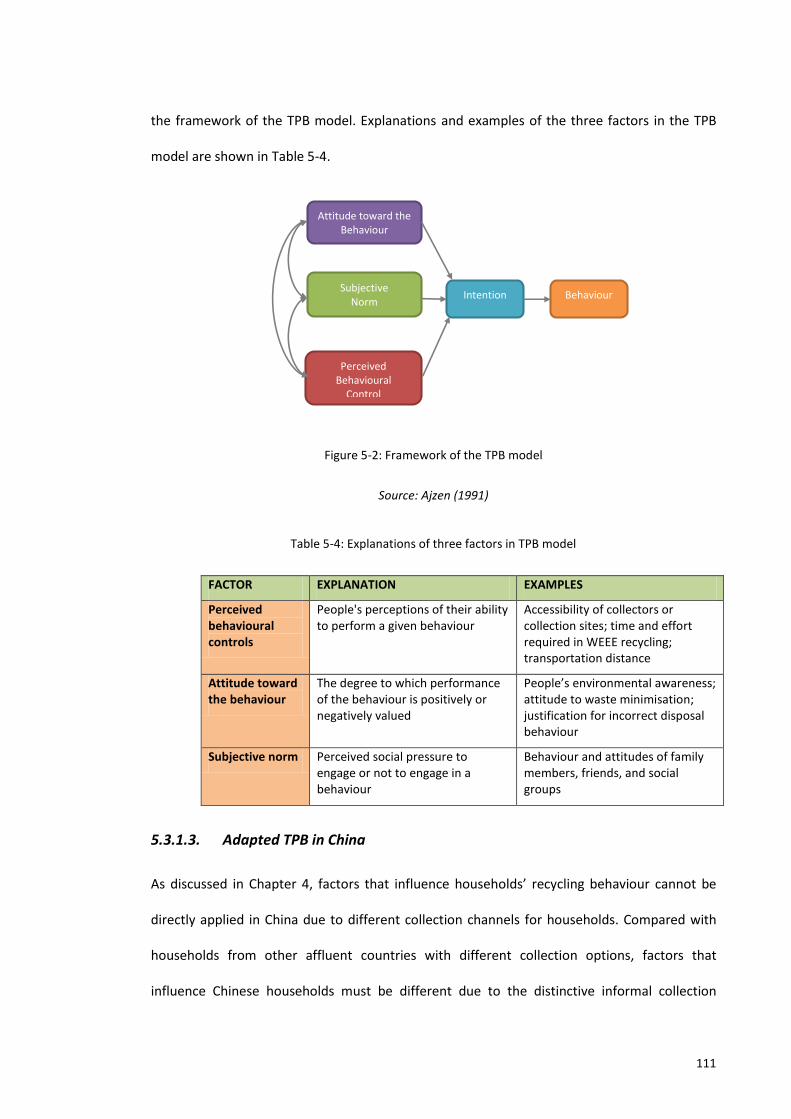
111
the framework of the TPB model. Explanations and examples of the three factors in the TPB
model are shown in Table 5-4.
Attitude toward the Behaviour
Intention Behaviour Subjective
Norm
Perceived Behavioural
Control
Figure 5-2: Framework of the TPB model
Source: Ajzen (1991)
Table 5-4: Explanations of three factors in TPB model
FACTOR EXPLANATION EXAMPLES
Perceived behavioural controls
People's perceptions of their ability to perform a given behaviour
Accessibility of collectors or collection sites; time and effort required in WEEE recycling; transportation distance
Attitude toward the behaviour
The degree to which performance of the behaviour is positively or negatively valued
People’s environmental awareness; attitude to waste minimisation; justification for incorrect disposal behaviour
Subjective norm Perceived social pressure to engage or not to engage in a behaviour
Behaviour and attitudes of family members, friends, and social groups
5.3.1.3. Adapted TPB in China
As discussed in Chapter 4, factors that influence households’ recycling behaviour cannot be
directly applied in China due to different collection channels for households. Compared with
households from other affluent countries with different collection options, factors that
influence Chinese households must be different due to the distinctive informal collection
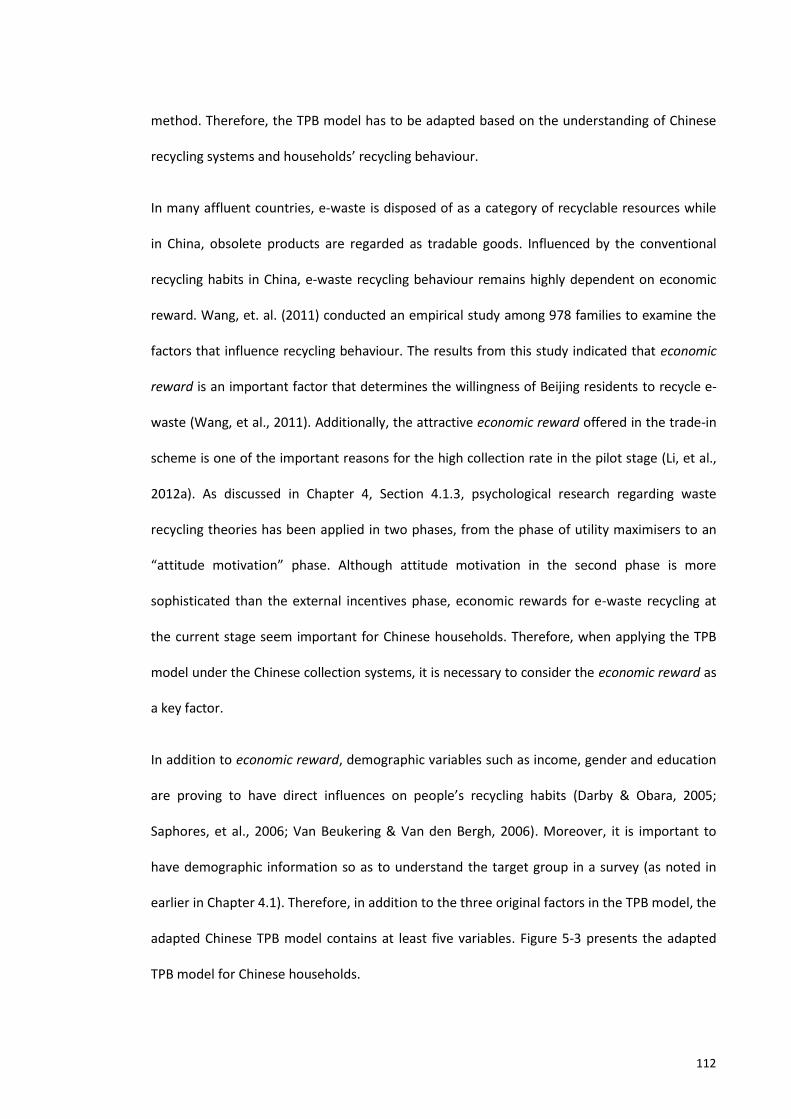
112
method. Therefore, the TPB model has to be adapted based on the understanding of Chinese
recycling systems and households’ recycling behaviour.
In many affluent countries, e-waste is disposed of as a category of recyclable resources while
in China, obsolete products are regarded as tradable goods. Influenced by the conventional
recycling habits in China, e-waste recycling behaviour remains highly dependent on economic
reward. Wang, et. al. (2011) conducted an empirical study among 978 families to examine the
factors that influence recycling behaviour. The results from this study indicated that economic
reward is an important factor that determines the willingness of Beijing residents to recycle e-
waste (Wang, et al., 2011). Additionally, the attractive economic reward offered in the trade-in
scheme is one of the important reasons for the high collection rate in the pilot stage (Li, et al.,
2012a). As discussed in Chapter 4, Section 4.1.3, psychological research regarding waste
recycling theories has been applied in two phases, from the phase of utility maximisers to an
“attitude motivation” phase. Although attitude motivation in the second phase is more
sophisticated than the external incentives phase, economic rewards for e-waste recycling at
the current stage seem important for Chinese households. Therefore, when applying the TPB
model under the Chinese collection systems, it is necessary to consider the economic reward as
a key factor.
In addition to economic reward, demographic variables such as income, gender and education
are proving to have direct influences on people’s recycling habits (Darby & Obara, 2005;
Saphores, et al., 2006; Van Beukering & Van den Bergh, 2006). Moreover, it is important to
have demographic information so as to understand the target group in a survey (as noted in
earlier in Chapter 4.1). Therefore, in addition to the three original factors in the TPB model, the
adapted Chinese TPB model contains at least five variables. Figure 5-3 presents the adapted
TPB model for Chinese households.
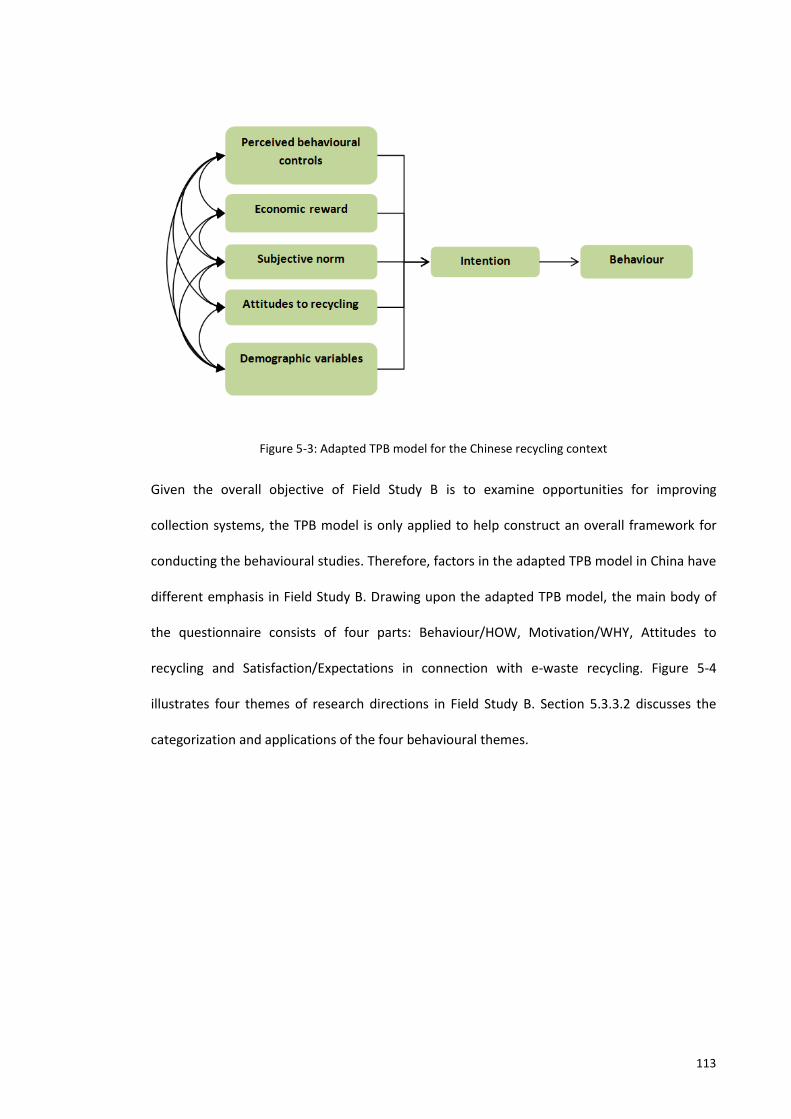
113
Figure 5-3: Adapted TPB model for the Chinese recycling context
Given the overall objective of Field Study B is to examine opportunities for improving
collection systems, the TPB model is only applied to help construct an overall framework for
conducting the behavioural studies. Therefore, factors in the adapted TPB model in China have
different emphasis in Field Study B. Drawing upon the adapted TPB model, the main body of
the questionnaire consists of four parts: Behaviour/HOW, Motivation/WHY, Attitudes to
recycling and Satisfaction/Expectations in connection with e-waste recycling. Figure 5-4
illustrates four themes of research directions in Field Study B. Section 5.3.3.2 discusses the
categorization and applications of the four behavioural themes.
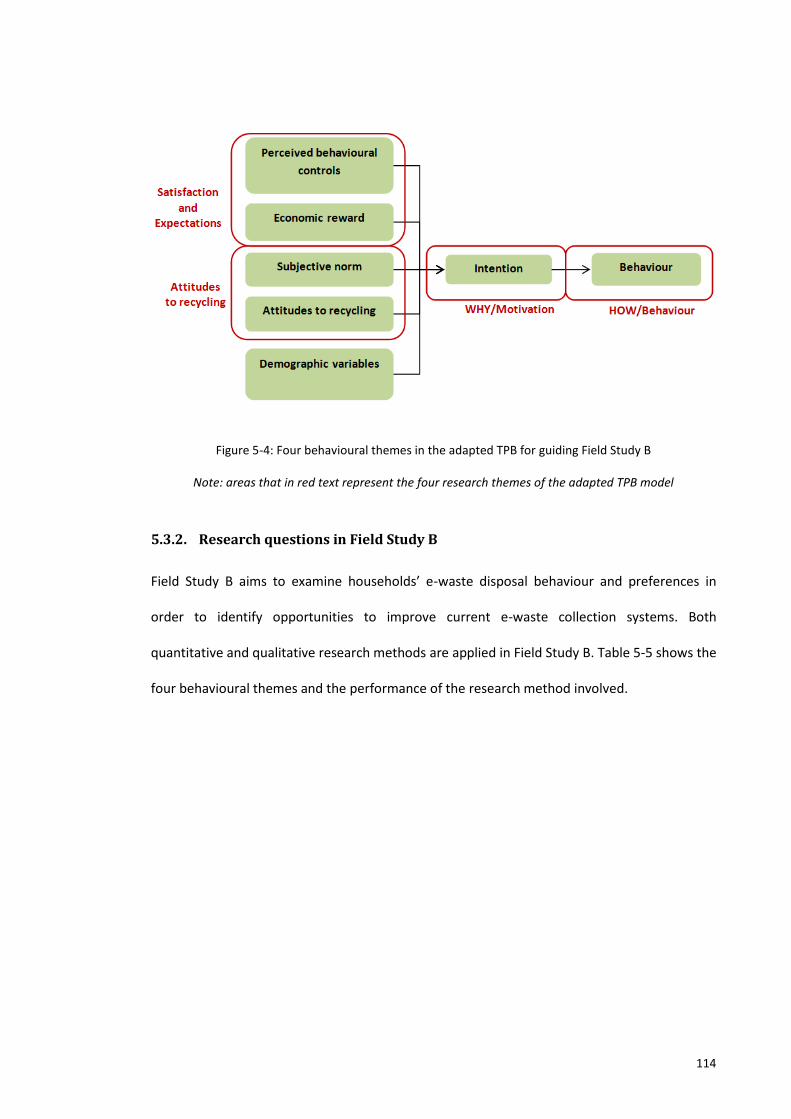
114
Figure 5-4: Four behavioural themes in the adapted TPB for guiding Field Study B
Note: areas that in red text represent the four research themes of the adapted TPB model
5.3.2. Research questions in Field Study B
Field Study B aims to examine households’ e-waste disposal behaviour and preferences in
order to identify opportunities to improve current e-waste collection systems. Both
quantitative and qualitative research methods are applied in Field Study B. Table 5-5 shows the
four behavioural themes and the performance of the research method involved.
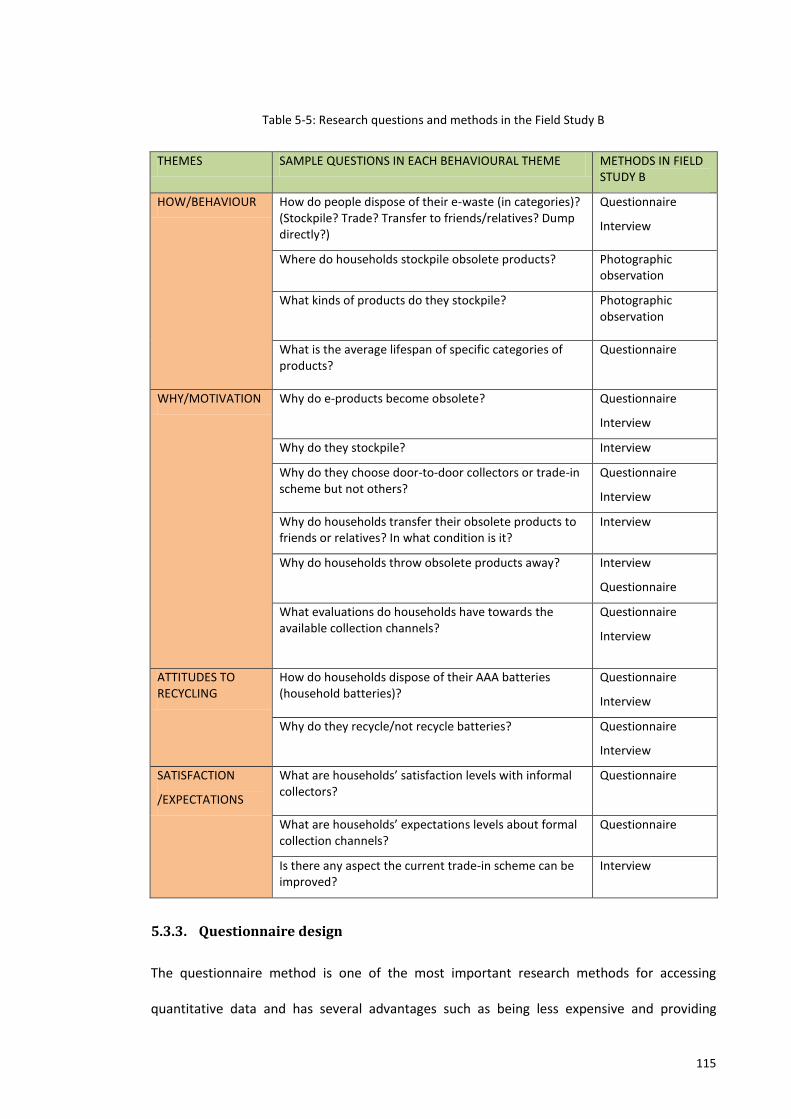
115
Table 5-5: Research questions and methods in the Field Study B
THEMES SAMPLE QUESTIONS IN EACH BEHAVIOURAL THEME METHODS IN FIELD STUDY B
HOW/BEHAVIOUR How do people dispose of their e-waste (in categories)? (Stockpile? Trade? Transfer to friends/relatives? Dump directly?)
Questionnaire
Interview
Where do households stockpile obsolete products? Photographic observation
What kinds of products do they stockpile?
Photographic observation
What is the average lifespan of specific categories of products?
Questionnaire
WHY/MOTIVATION Why do e-products become obsolete? Questionnaire
Interview
Why do they stockpile? Interview
Why do they choose door-to-door collectors or trade-in scheme but not others?
Questionnaire
Interview
Why do households transfer their obsolete products to friends or relatives? In what condition is it?
Interview
Why do households throw obsolete products away?
Interview
Questionnaire
What evaluations do households have towards the available collection channels?
Questionnaire
Interview
ATTITUDES TO RECYCLING
How do households dispose of their AAA batteries (household batteries)?
Questionnaire
Interview
Why do they recycle/not recycle batteries? Questionnaire
Interview
SATISFACTION
/EXPECTATIONS
What are households’ satisfaction levels with informal collectors?
Questionnaire
What are households’ expectations levels about formal collection channels?
Questionnaire
Is there any aspect the current trade-in scheme can be improved?
Interview
5.3.3. Questionnaire design
The questionnaire method is one of the most important research methods for accessing
quantitative data and has several advantages such as being less expensive and providing
116
greater anonymity (Jupp, 2006; Ranjit, 2005, p. 131). Referring to Table 5-5, the Field Study B is
critical to gain an overall understanding of households’ recycling behaviour. The following sub-
sections describe the target e-waste in the questionnaire, design of the questionnaire and
interview, distribution method of questionnaire and its piloting.
5.3.3.1. Targeting e-waste categories and disposal behaviour
This study examines the disposal methods of specific categories of e-waste. There are seven
categories of products targeted in the field study. The seven categories include three large
household appliances (LHH) (TVs, washing machines, and refrigerators); three ICT products
(mobile phones, laptops, and PCs); and small electrical equipment (EE).
In view of the significant quantities of waste that they generate, five categories of e-waste are
targeted as key items at the first stage of WEEE management in China. The five categories of
products are TVs, washing machines, refrigerators, PCs and air conditioners (Yang, et al., 2008).
Strictly, according to the EU definition (refer to Table 2-1 in Chapter 2 for definition of ten
categories of e-waste), TVs are consumer equipment, rather than large household appliances.
In this study, TVs, washing machines and fridges are selected and putted into a same category -
large household appliances, by their larger sizes than normal electrical appliances.
Meanwhile, mobile phones, laptops and PCs were studied as a group of ICT products in the
survey due to their rapid obsolescence and large numbers (CCID, 2010; Yang, et al., 2008). In
addition, small electrical equipment (small EE) such as hair dryers, rice cookers and coffee
machines is taken as a single e-waste group to study households disposal behaviour in the
survey.
In order to investigate households’ detailed disposal behaviour, eight available disposal
strategies that were identified from the literature review were investigated in this study.
Chapter 3.1.1 discusses the e-waste collection options for Chinese households in details. Table
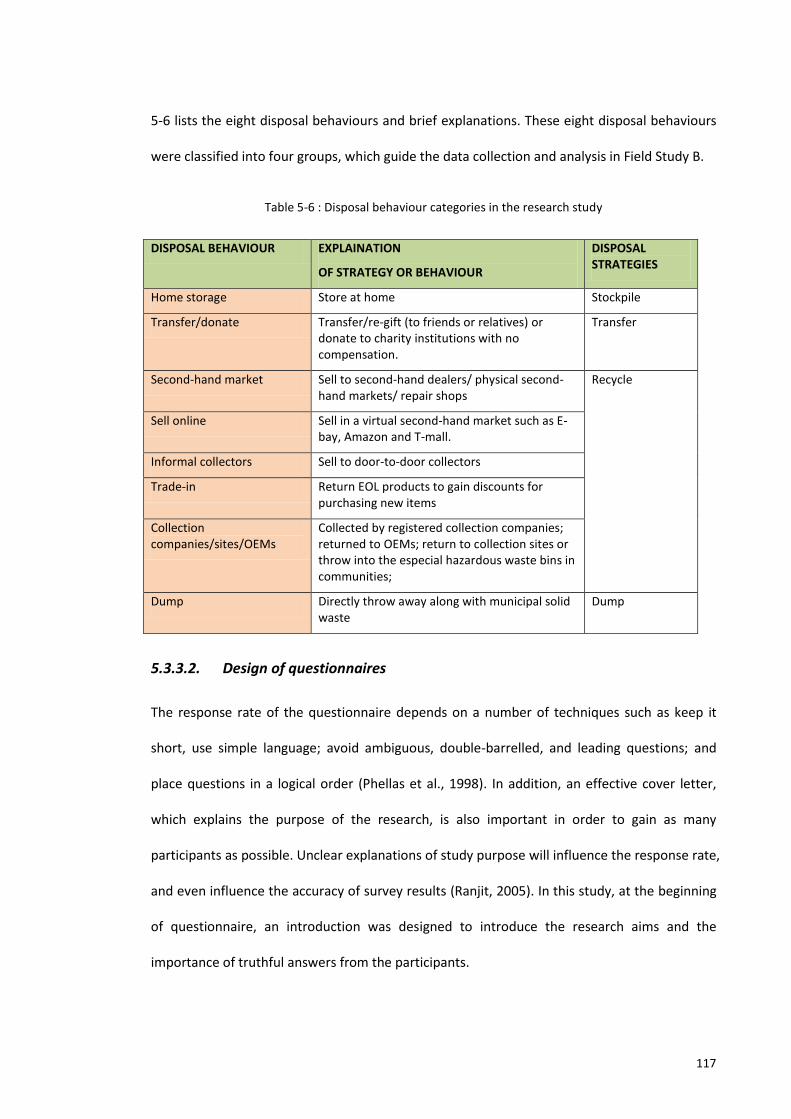
117
5-6 lists the eight disposal behaviours and brief explanations. These eight disposal behaviours
were classified into four groups, which guide the data collection and analysis in Field Study B.
Table 5-6 : Disposal behaviour categories in the research study
DISPOSAL BEHAVIOUR EXPLAINATION
OF STRATEGY OR BEHAVIOUR
DISPOSAL STRATEGIES
Home storage Store at home Stockpile
Transfer/donate Transfer/re-gift (to friends or relatives) or donate to charity institutions with no compensation.
Transfer
Second-hand market Sell to second-hand dealers/ physical second-hand markets/ repair shops
Recycle
Sell online Sell in a virtual second-hand market such as E-bay, Amazon and T-mall.
Informal collectors Sell to door-to-door collectors
Trade-in Return EOL products to gain discounts for purchasing new items
Collection companies/sites/OEMs
Collected by registered collection companies; returned to OEMs; return to collection sites or throw into the especial hazardous waste bins in communities;
Dump Directly throw away along with municipal solid waste
Dump
5.3.3.2. Design of questionnaires
The response rate of the questionnaire depends on a number of techniques such as keep it
short, use simple language; avoid ambiguous, double-barrelled, and leading questions; and
place questions in a logical order (Phellas et al., 1998). In addition, an effective cover letter,
which explains the purpose of the research, is also important in order to gain as many
participants as possible. Unclear explanations of study purpose will influence the response rate,
and even influence the accuracy of survey results (Ranjit, 2005). In this study, at the beginning
of questionnaire, an introduction was designed to introduce the research aims and the
importance of truthful answers from the participants.
118
Other than the four behavioural themes in Figure 5-4, demographic characteristics were also
examined in this last part of the questionnaire to understand the background of the survey
participants. Therefore, the main body of the questionnaire consists of five parts:
Behaviour/HOW, Motivation/WHY, Attitudes to recycling, Satisfaction/Expectations in
connection with e-waste recycling and demographic information. Appendix A3 is the English
version of questionnaire design.
Part A: HOW/Behaviour
The question of ‘how do households dispose of their e-waste’ provides an opportunity
to examine households’ disposal preferences, understanding the popularity of
available collection channels and limitations of existing collection infrastructure. The
HOW question offers an opportunity to understand whether the trade-in scheme has a
large enough market share so that it can compete with informal collectors. In addition,
this study examined households’ detailed disposal behaviour for specific categories of
products, which could lead to the preparation of more targeted strategies for dealing
with various categories of e-waste. The HOW question was examined in three steps as
follow:
At the very beginning, a warm-up question was designed to test the
interviewee’s understanding of e-waste. As discussed in Chapter 4.1, varying
understanding of the WEEE definition by households may be one of the
important reasons influencing the survey results. Consequently, the first
warm-up question tried to evaluate whether households have identical
understanding of what WEEE consists of.
Other than the first warm-up question, e-waste disposal behaviour was
examined in two parts: the first question examined recycling behaviour
119
covering all categories of e-waste. This question asked survey participants
“which disposal method(s) have you ever used to dispose of obsolete
products?” This question aims to identify the most popular collection options.
Survey participants could choose any method used, whether for handling large
appliances or small household devices.
Although many surveys were conducted about how people dispose of their e-
waste, survey results vary greatly due to different methods of conducting
surveys (as noted in earlier in Chapter 4.1). Rather than examining e-waste as a
general, the second part examined disposal behaviour for specific categories of
e-waste, which provided insights into disposal behaviour. The second
behavioural question was designed as a table question, requiring specific
answers about disposal behaviour for seven categories of products.
Participants could have multiple answers because they might have several
products in one category.
Part B: WHY/Motivation
Motivation encompasses a number of factors that influence households’ behaviour.
Understanding consumers’ perceptions of cause-and-effect is central to examine the
factors that influence consumer behaviour (Folkes, 1988; Pieters, et al., 1998). This
study examined the motivation of disposal behaviour, which is the quickest method to
get a comprehensive understanding about WHY households dispose of obsolete
products by certain recycling channel. In addition to recycling through available
collection channels, many obsolete products were stockpiled or dumped by Chinese
households (See Chapter 4 for discussions). Therefore, investigating why people dump
or stockpile obsolete products provides an opportunity to identify the limitations of
available collection channels. Besides the four categories of disposal behaviour, this
120
part of the theme also examines the life span of seven categories of products, and
reasons for obsolescence.
The motivation behind behaviour will be a subject of the first questionnaire and
further explored in the follow-up interviews. In the questionnaire design, the open-
ended questions allow survey participants to write down the reasons if significant
reasons are omitted. Meanwhile, the interviews allowed households to have more
time and opportunities to specify and explain their reasons for specific disposal
behaviour. The motivation behind notable disposal behaviour including trading with
informal collectors, stockpiling, dumping obsolete products was directly examined in
the questionnaire. It is worth to note that piloting stage is also important to
complement the potential options, which will be introduced later.
Part C: Attitudes to recycling
The behavioural theme of “attitudes to recycling” involves two factors in the adapted
TPB model, - the attitude toward the behaviour and the subjective norm (refer to
Figure 5-4). The attitude toward the behaviour is households’ internal attitudes, which
is influenced by people’s environmental awareness, by their attitude to waste
minimisation and justification for incorrect disposal behaviour (Biswas, et al., 2000;
Davis & Morgan, 2008; Hansmann, et al., 2006; Hornik, et al., 1995; Saphores, et al.,
2006). The subjective norm refers to social influences such as the behaviour and
attitudes of family members, friends, and social groups (Pieters, et al., 1998). Hornik,
et al. (1995) and Hester and Harrison (2009) state that social norms of waste recycling
behaviour have to be supported by the enforcement of regulation at a national level.
Therefore, these two terms, subjective norm and attitudes to recycling are reflected by
households’ personal environmental awareness and the social influences, which were
studied through households’ battery recycling behaviour in this study.
121
Because of the low value of the materials within the batteries, informal collectors in
China never accept them, even if they are free. Batteries are real “waste” for Chinese
households in terms of their low-economic value. The battery recycling behaviour
reflects households’ environmental awareness and social influence by other people,
without any involvement of economic reward. Therefore, household battery recycling
is used as a baseline topic to understand people’s environmental awareness and their
attitude to recycle in this study.
There are three aspects to examine households’ battery recycling behaviour in this
study: the popularity of battery collection infrastructure; households’ disposal
behaviour of batteries; and their attitudes to battery recycling. Moreover, whether the
convenience of collection infrastructure influences households’ recycling willingness
was evaluated.
Part D: Satisfaction and Expectations
The factor of households’ perceived behavioural controls in the TPB model (refer to
Figure 5-4) was examined by households’ satisfaction with informal collection and
expectations about formal collection methods in this study. Consumers often attribute
their own behaviour more to situational (external) factors than to dispositional
(internal) factors (Fiske & Taylor, 1991; Pieters, et al., 1998). In recycling studies,
perceived behavioural controls are the perception of efforts involved in the recycling
activities, such as the accessibility of collectors or collection sites, time and effort
required in WEEE recycling, and transportation distance (Davis & Morgan, 2008; Hornik,
et al., 1995; Perrin & Barton, 2001; Pieters, et al., 1998; Saphores, et al., 2006; Tonglet,
et al., 2004a, 2004b; Wang, et al., 2011). Additionally, although economic reward is
discussed as a new factor in the adapted TPB model, here it can be considered as one
characteristic of the collection system and can be combined under this theme.
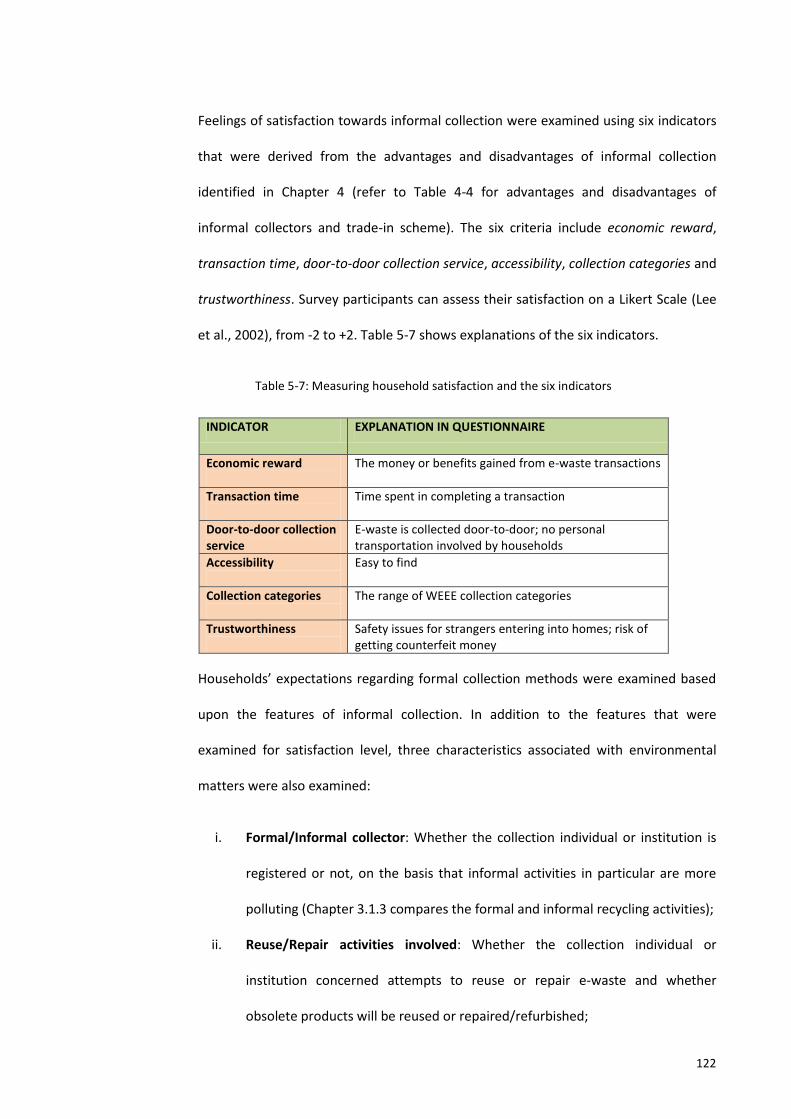
122
Feelings of satisfaction towards informal collection were examined using six indicators
that were derived from the advantages and disadvantages of informal collection
identified in Chapter 4 (refer to Table 4-4 for advantages and disadvantages of
informal collectors and trade-in scheme). The six criteria include economic reward,
transaction time, door-to-door collection service, accessibility, collection categories and
trustworthiness. Survey participants can assess their satisfaction on a Likert Scale (Lee
et al., 2002), from -2 to +2. Table 5-7 shows explanations of the six indicators.
Table 5-7: Measuring household satisfaction and the six indicators
INDICATOR EXPLANATION IN QUESTIONNAIRE
Economic reward
The money or benefits gained from e-waste transactions
Transaction time
Time spent in completing a transaction
Door-to-door collection service
E-waste is collected door-to-door; no personal transportation involved by households
Accessibility
Easy to find
Collection categories
The range of WEEE collection categories
Trustworthiness
Safety issues for strangers entering into homes; risk of getting counterfeit money
Households’ expectations regarding formal collection methods were examined based
upon the features of informal collection. In addition to the features that were
examined for satisfaction level, three characteristics associated with environmental
matters were also examined:
i. Formal/Informal collector: Whether the collection individual or institution is
registered or not, on the basis that informal activities in particular are more
polluting (Chapter 3.1.3 compares the formal and informal recycling activities);
ii. Reuse/Repair activities involved: Whether the collection individual or
institution concerned attempts to reuse or repair e-waste and whether
obsolete products will be reused or repaired/refurbished;
123
iii. Environmental pollution: Whether the collection individuals or institutions will
pollute the environment by their recycling activities.
Similar to the form of question in the preceding section about Satisfaction, survey
participants were asked to evaluate the importance of a number of criteria on a five
level scale from -2 to +2.
Part E: Demographic characteristics
Demographic variables were examined in this study only to understand the
background of the survey participants. The demographic information includes income,
gender, age and education.
The original questionnaire and the translation version of the questionnaire are shown in
Appendix A4 and A3. The last part was designed to examine socioeconomic demographic
characteristics of survey participants.
5.3.3.3. Distribution of questionnaire
Postal questionnaires (distributed via mail) and online surveys are cheaper to conduct,
generally costs less and can enlarge the target group within a wider geographic coverage than
personal distributions (Bourque & Fielder, p. 10; Dillman & Don, 2007, p. 252; Sax et al., 2003).
However, both postal and online surveys require the researcher to gain the contact details and
wait for responses to become available (Evans & Mathur, 2005; Phellas, et al., 1998; Sax, et al.,
2003). In order to ensure the trustworthiness of the survey and gain a high response rate
quickly, this research improved the postal distribution method and despatched the paper
questionnaire in schools rather than through an unfamiliar researcher. These disadvantages
were overcome by distributing questionnaires in trustworthy schools. The school-distribution
method saved time and funds.
124
There were 1200 structured questionnaires given out to two high schools after gaining official
permission. The procedures of distribution are as follow:
i. Deans of the two participating schools introduced the survey at a parents meeting. To
avoid participants feeling unwelcome pressure if the questionnaire were distributed by
teachers directly to parents or students, the questionnaires were placed in a corner of
each classroom. Parents could either take a questionnaire after the parents meeting
finished or ask their children to take it home for them. The project information
statement stated clearly that their participation was absolutely voluntary.
ii. After they completed the questionnaire at home, parents can either returned the
questionnaire by themselves, or had their children return it anytime during the school
day, voluntarily and anonymously. Returned questionnaires were also collected in the
corner of each classroom. From the parents’ perspective, official departments have
more authority than the unfamiliar researcher, and thus the former leads to a higher
response rate (87%). The period of survey lasted two weeks.
5.3.3.4. Piloting the questionnaire
Piloting the questionnaire is an effective method minimising invalid responses and improving
research design (Gray, 2004). Unlike the interviews, participants involved in the questionnaire
study would have no opportunity to ask questions. Therefore, before distributing thousands of
questionnaires, a small-group pilot project was done to make sure the questions were clear
and reasonable. The objectives of the pilot questionnaire in this study were as follows:
To ensure whether the contents of questions, particularly the table questions were
easy to understand;
To ensure if significant options are covered in each question;
To establish how long it took for each participant to complete a questionnaire;
125
To identify possible ways of shortening the length of questionnaire.
The design of the questionnaire was revised following feedback from the piloting exercise.
There were 15 households involved in the pilot questionnaire. Most participants finished the
questionnaire within 15 minutes and all the participants agreed that the length of
questionnaire was acceptable. Several participants provided useful suggestions to clarify the
table questions and options in individual questions.
5.3.4. Follow-up interviews and photographical observation
Although the questionnaire has various advantages, it has limitations when dealing with
complex questions. An in-depth semi-structured interview is appropriate to complement the
results from questionnaires in complicated situations. The extended length of time spent with
an informant enhances the rapport between researcher and informant, and thus the
corresponding understanding and confidence leads to in-depth and accurate results (Ranjit,
2005).The in-depth semi-structured interview, compared with limited options or answering
spaces in the questionnaire, investigate insightful information particular the WHY questions
(Phellas, et al., 1998). Consequently, the semi-structured interviews were applied to
complement the data obtained from the questionnaire.
There were two objectives to the interview study:
To complement the questionnaire examining households’ recycling behaviour,
particularly focus on several aspects to examine: 1) households’ attitudes comparison
between informal collectors and trade-in scheme; 2) motivations of trading channels
and reasons for stockpiling and dumping behaviour; 3) households’ suggestions for
formal collection channels; and
126
To provide opportunities for the researcher to observe: 1) local e-waste collection
infrastructure in communities in four target cities (Tianjin, Beijing, Shanghai, and Xi’an);
2) the obsolete products kept by households (what and where).
The interview participants were recruited from an online survey. Volunteer participants were
asked to provide their contact numbers so that follow-up interviews could take place. The URL
for the on-line questionnaire is: http://www.askform.cn/115736-191083.aspx. Since the online
survey was conducted nationwide to recruit participants, the on-line survey of households was
not limited to Tianjin. The researcher selected 15 families representing different income levels
and age groups in the four target cities.
The interviews were conducted by visiting household’s homes in these four cities. There were
two significant advantages of the interview location. Firstly, participants were more relaxed
being interviewed in the familiar environment, which lead to more detailed and accurate
results. Secondly, by visiting homes, the researcher was able to observe recycling and
stockpiling behaviours. Rather than being subjectively described by the households,
observation by the same researcher and applying the same standards can obtain better results.
Moreover, in front of the stockpiled products, householders more easily interpreted and
specified their explanations for stockpiling. Once permission was gained, the researcher can
also take pictures of the areas of stockpiling. Questions proposed in the interviews refer to
Appendix B1.
5.3.5. Data analysis
The TPB model not only guides the direction of field studies under four themes, but also infers
the method for analysing the survey results. In Field Study B, the results were analysed also
according to the four themes: HOW/behaviour, WHY/motivation, attitudes to recycling and
Satisfaction/Expectations. Given both research approaches (questionnaire and interview)
127
proposed similar research questions, the results from two methods were analysed together.
The interviews search for the deeper motivations of recycling behaviour helps to understand
the results from the questionnaire.
SPSS Statistics is software used for statistical analysis. It is used in this study to process large
amounts of data collected from the questionnaires. The Multiple Dichotomy6 method was
used to code and input data since most questions are multiple answer questions. A Likert scale,
which is a psychometric scale that involves qualitative rating scale, for example, evaluate one’s
satisfaction from 1 to 7, was applied to evaluate and analyse their satisfaction with informal
collectors and their expectations about formal collection methods. A matrix diagram was used
to describe different behaviour towards seven categories of e-waste.
6 Results that are from either single answer or multiple answer questions will be code as 1 or 0. The
number of inputted variables depends on the number of selections by respondents (IBM, 2010, p. 106). For example, in a multiple answer question with five options, if the results are A, C, E, then the coding should be 1, 0, 1, 0, 1.
128
CHAPTER 6: INFORMAL RECYCLING SYSTEM: RESULTS OF FIELD
STUDY A
As discussed in Chapter 3, the informal recycling sector plays an essential role in establishing
effective formal recycling systems in China. Given the important role of the informal recycling
sector, Field Study A examines the operations and the advantages of informal recycling
systems. Field Study B is a survey examining households’ e-waste disposal behaviour, whose
results will be presented in the next chapter.
Field Study A was conducted as a Transect Walk, which includes photographic observation and
interviews with informal e-waste stakeholders. This chapter presents the results from the
Transect Walk including the characteristics of each stakeholder and their collection
preferences regarding e-waste. The characteristics of the stakeholders are discussed in the
following sections. E-waste material flows in Tianjin were mapped in a flow chart. Figure 6-1
indicates the informal stakeholders involved in this field study.
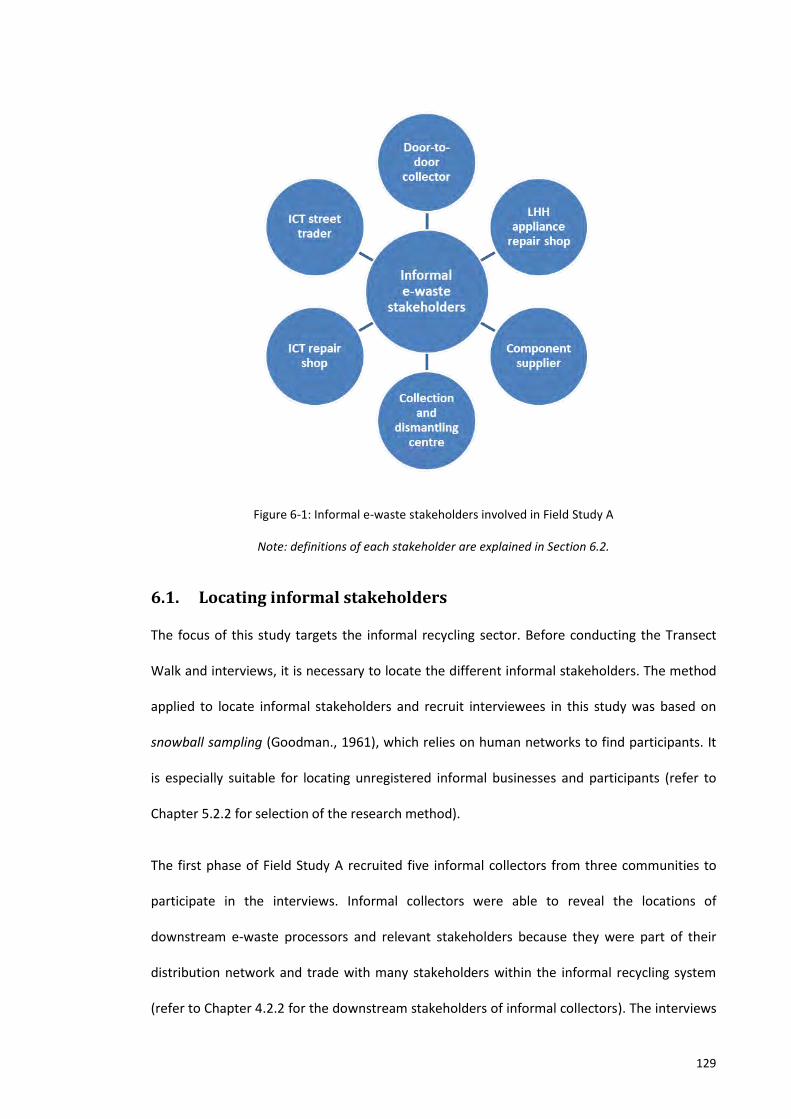
129
Figure 6-1: Informal e-waste stakeholders involved in Field Study A
Note: definitions of each stakeholder are explained in Section 6.2.
6.1. Locating informal stakeholders
The focus of this study targets the informal recycling sector. Before conducting the Transect
Walk and interviews, it is necessary to locate the different informal stakeholders. The method
applied to locate informal stakeholders and recruit interviewees in this study was based on
snowball sampling (Goodman., 1961), which relies on human networks to find participants. It
is especially suitable for locating unregistered informal businesses and participants (refer to
Chapter 5.2.2 for selection of the research method).
The first phase of Field Study A recruited five informal collectors from three communities to
participate in the interviews. Informal collectors were able to reveal the locations of
downstream e-waste processors and relevant stakeholders because they were part of their
distribution network and trade with many stakeholders within the informal recycling system
(refer to Chapter 4.2.2 for the downstream stakeholders of informal collectors). The interviews
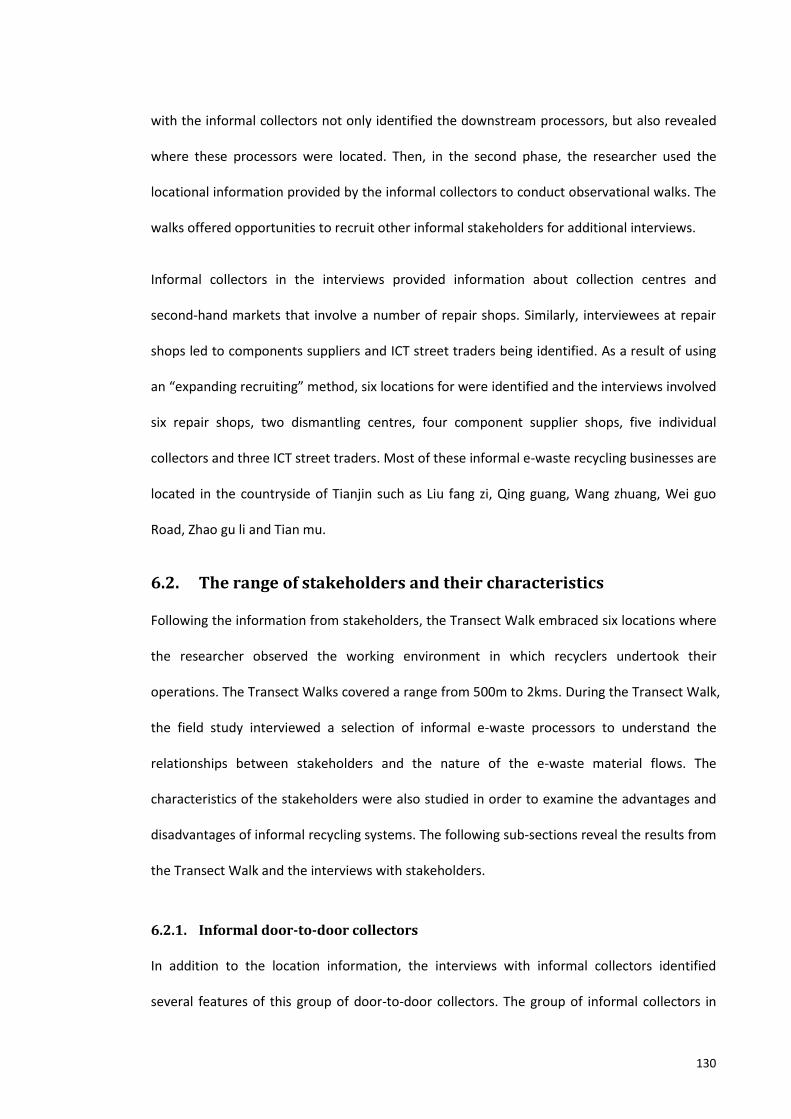
130
with the informal collectors not only identified the downstream processors, but also revealed
where these processors were located. Then, in the second phase, the researcher used the
locational information provided by the informal collectors to conduct observational walks. The
walks offered opportunities to recruit other informal stakeholders for additional interviews.
Informal collectors in the interviews provided information about collection centres and
second-hand markets that involve a number of repair shops. Similarly, interviewees at repair
shops led to components suppliers and ICT street traders being identified. As a result of using
an “expanding recruiting” method, six locations for were identified and the interviews involved
six repair shops, two dismantling centres, four component supplier shops, five individual
collectors and three ICT street traders. Most of these informal e-waste recycling businesses are
located in the countryside of Tianjin such as Liu fang zi, Qing guang, Wang zhuang, Wei guo
Road, Zhao gu li and Tian mu.
6.2. The range of stakeholders and their characteristics
Following the information from stakeholders, the Transect Walk embraced six locations where
the researcher observed the working environment in which recyclers undertook their
operations. The Transect Walks covered a range from 500m to 2kms. During the Transect Walk,
the field study interviewed a selection of informal e-waste processors to understand the
relationships between stakeholders and the nature of the e-waste material flows. The
characteristics of the stakeholders were also studied in order to examine the advantages and
disadvantages of informal recycling systems. The following sub-sections reveal the results from
the Transect Walk and the interviews with stakeholders.
6.2.1. Informal door-to-door collectors
In addition to the location information, the interviews with informal collectors identified
several features of this group of door-to-door collectors. The group of informal collectors in
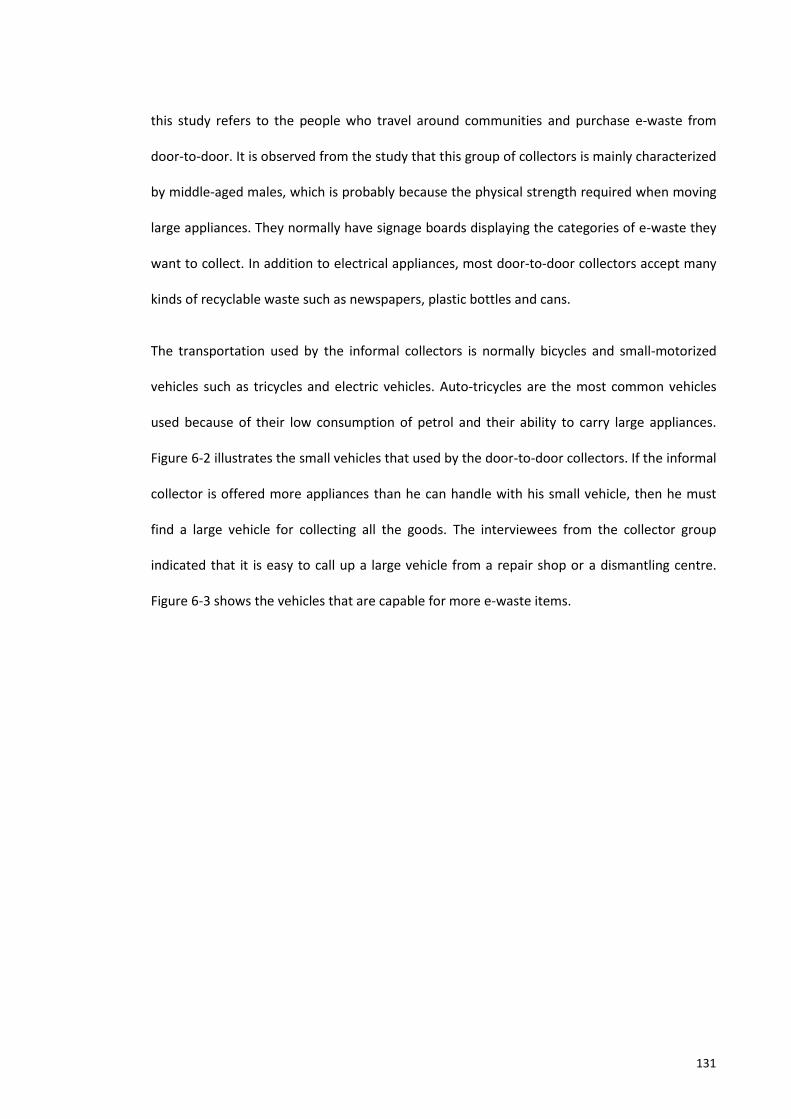
131
this study refers to the people who travel around communities and purchase e-waste from
door-to-door. It is observed from the study that this group of collectors is mainly characterized
by middle-aged males, which is probably because the physical strength required when moving
large appliances. They normally have signage boards displaying the categories of e-waste they
want to collect. In addition to electrical appliances, most door-to-door collectors accept many
kinds of recyclable waste such as newspapers, plastic bottles and cans.
The transportation used by the informal collectors is normally bicycles and small-motorized
vehicles such as tricycles and electric vehicles. Auto-tricycles are the most common vehicles
used because of their low consumption of petrol and their ability to carry large appliances.
Figure 6-2 illustrates the small vehicles that used by the door-to-door collectors. If the informal
collector is offered more appliances than he can handle with his small vehicle, then he must
find a large vehicle for collecting all the goods. The interviewees from the collector group
indicated that it is easy to call up a large vehicle from a repair shop or a dismantling centre.
Figure 6-3 shows the vehicles that are capable for more e-waste items.
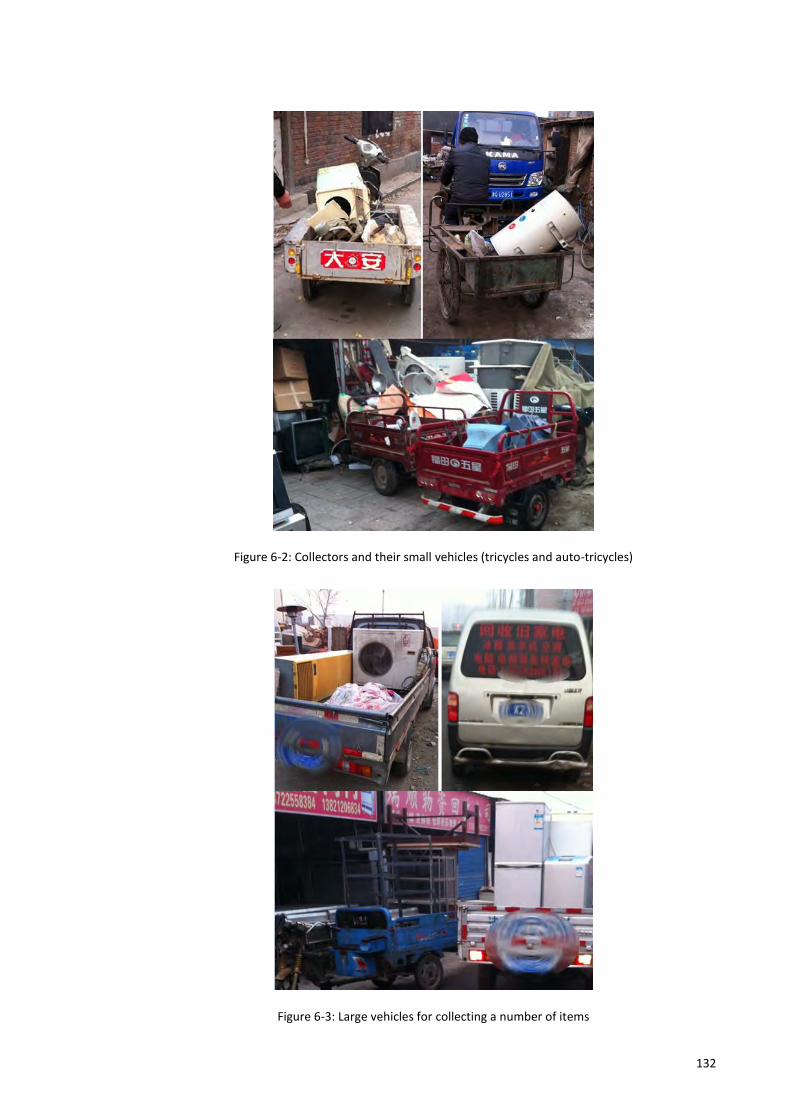
132
Figure 6-2: Collectors and their small vehicles (tricycles and auto-tricycles)
Figure 6-3: Large vehicles for collecting a number of items
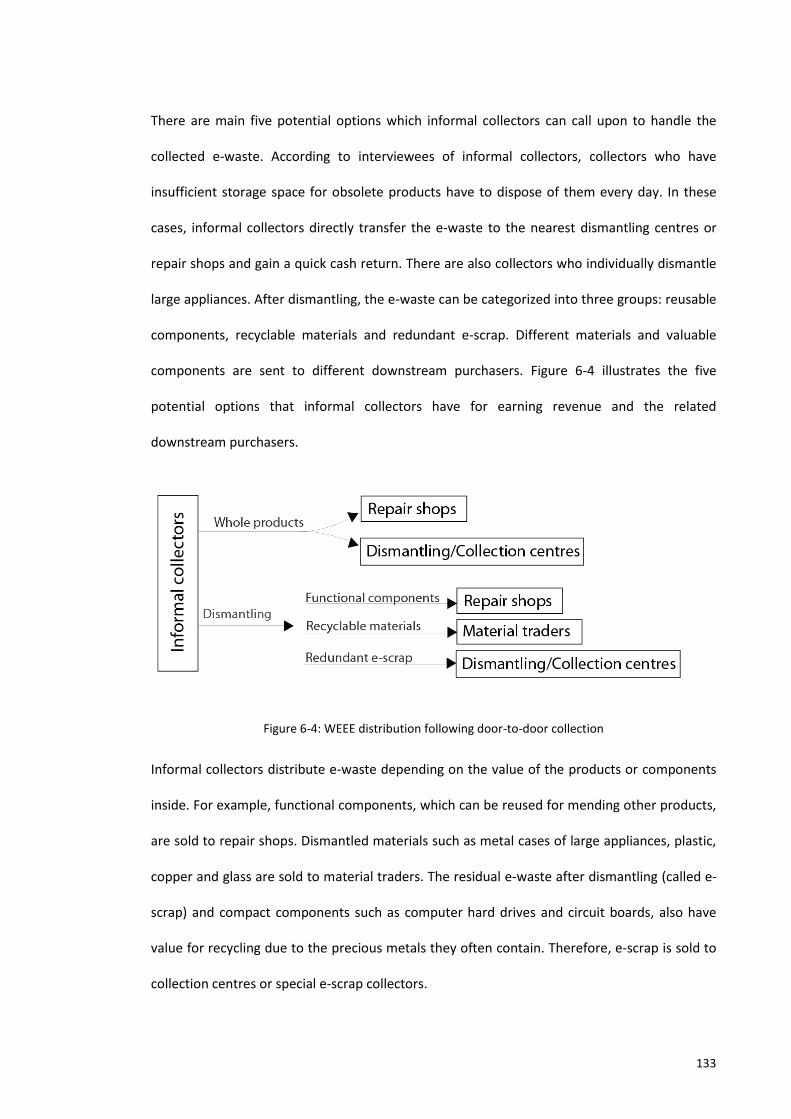
133
There are main five potential options which informal collectors can call upon to handle the
collected e-waste. According to interviewees of informal collectors, collectors who have
insufficient storage space for obsolete products have to dispose of them every day. In these
cases, informal collectors directly transfer the e-waste to the nearest dismantling centres or
repair shops and gain a quick cash return. There are also collectors who individually dismantle
large appliances. After dismantling, the e-waste can be categorized into three groups: reusable
components, recyclable materials and redundant e-scrap. Different materials and valuable
components are sent to different downstream purchasers. Figure 6-4 illustrates the five
potential options that informal collectors have for earning revenue and the related
downstream purchasers.
Figure 6-4: WEEE distribution following door-to-door collection
Informal collectors distribute e-waste depending on the value of the products or components
inside. For example, functional components, which can be reused for mending other products,
are sold to repair shops. Dismantled materials such as metal cases of large appliances, plastic,
copper and glass are sold to material traders. The residual e-waste after dismantling (called e-
scrap) and compact components such as computer hard drives and circuit boards, also have
value for recycling due to the precious metals they often contain. Therefore, e-scrap is sold to
collection centres or special e-scrap collectors.
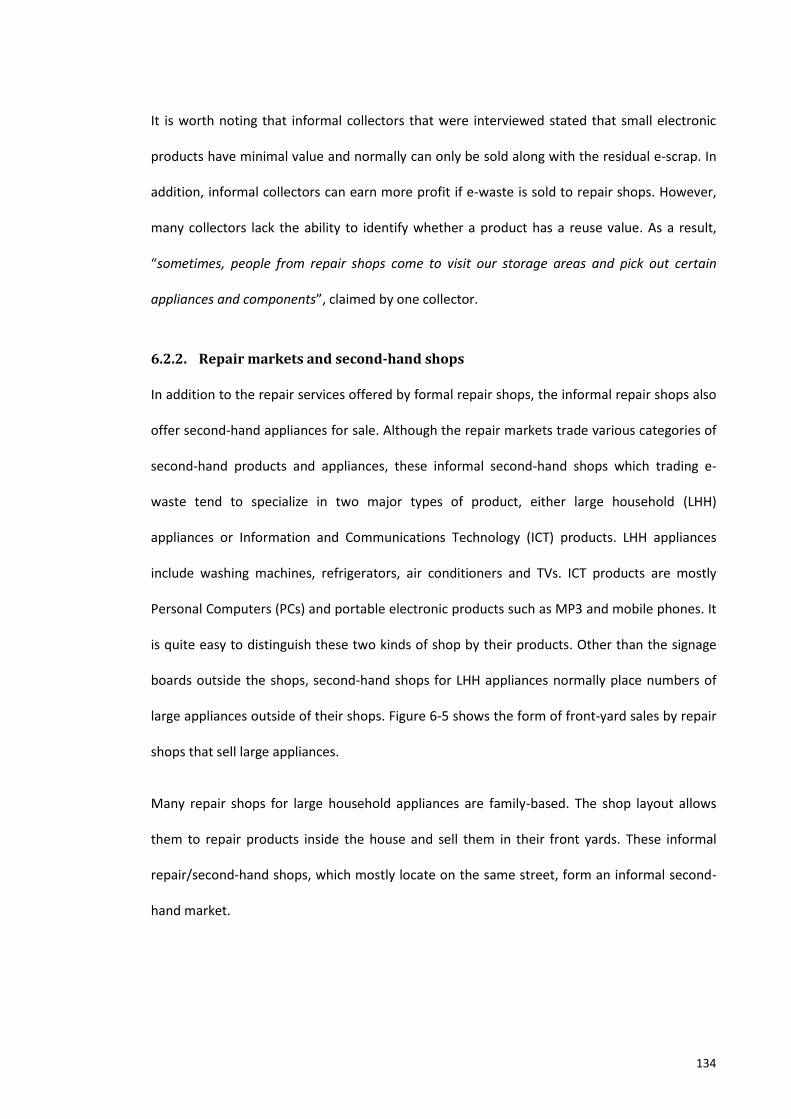
134
It is worth noting that informal collectors that were interviewed stated that small electronic
products have minimal value and normally can only be sold along with the residual e-scrap. In
addition, informal collectors can earn more profit if e-waste is sold to repair shops. However,
many collectors lack the ability to identify whether a product has a reuse value. As a result,
“sometimes, people from repair shops come to visit our storage areas and pick out certain
appliances and components”, claimed by one collector.
6.2.2. Repair markets and second-hand shops
In addition to the repair services offered by formal repair shops, the informal repair shops also
offer second-hand appliances for sale. Although the repair markets trade various categories of
second-hand products and appliances, these informal second-hand shops which trading e-
waste tend to specialize in two major types of product, either large household (LHH)
appliances or Information and Communications Technology (ICT) products. LHH appliances
include washing machines, refrigerators, air conditioners and TVs. ICT products are mostly
Personal Computers (PCs) and portable electronic products such as MP3 and mobile phones. It
is quite easy to distinguish these two kinds of shop by their products. Other than the signage
boards outside the shops, second-hand shops for LHH appliances normally place numbers of
large appliances outside of their shops. Figure 6-5 shows the form of front-yard sales by repair
shops that sell large appliances.
Many repair shops for large household appliances are family-based. The shop layout allows
them to repair products inside the house and sell them in their front yards. These informal
repair/second-hand shops, which mostly locate on the same street, form an informal second-
hand market.
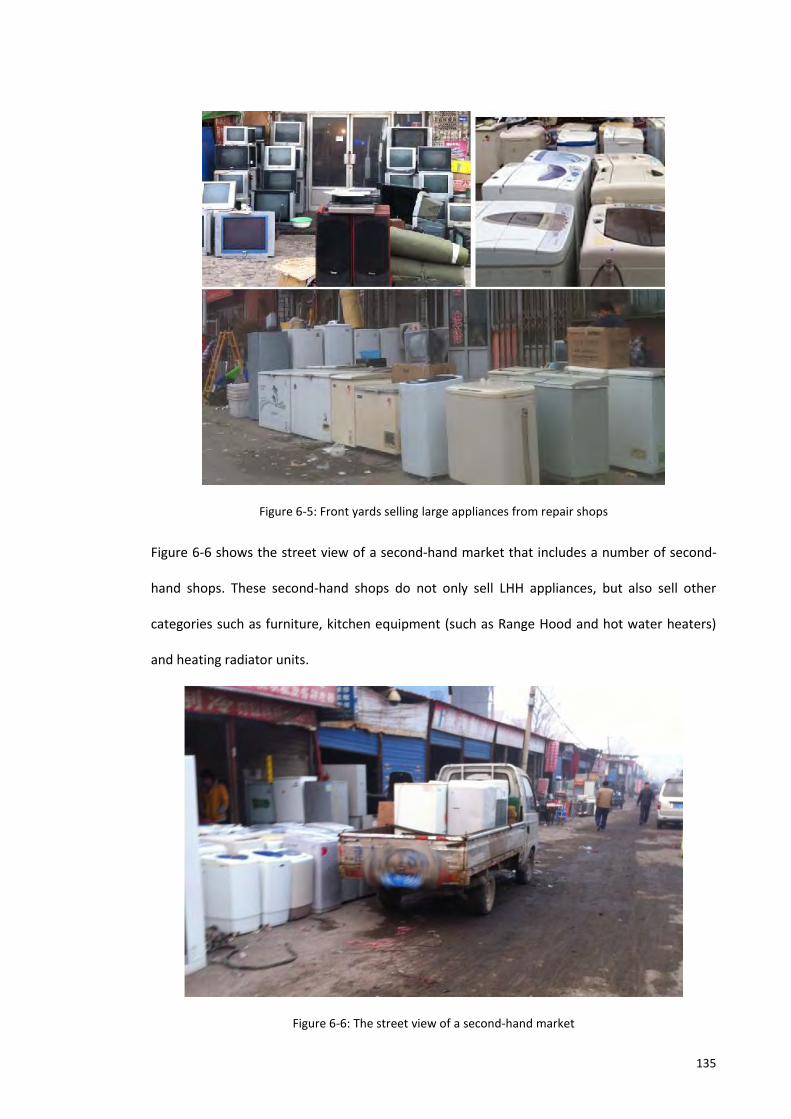
135
Figure 6-5: Front yards selling large appliances from repair shops
Figure 6-6 shows the street view of a second-hand market that includes a number of second-
hand shops. These second-hand shops do not only sell LHH appliances, but also sell other
categories such as furniture, kitchen equipment (such as Range Hood and hot water heaters)
and heating radiator units.
Figure 6-6: The street view of a second-hand market
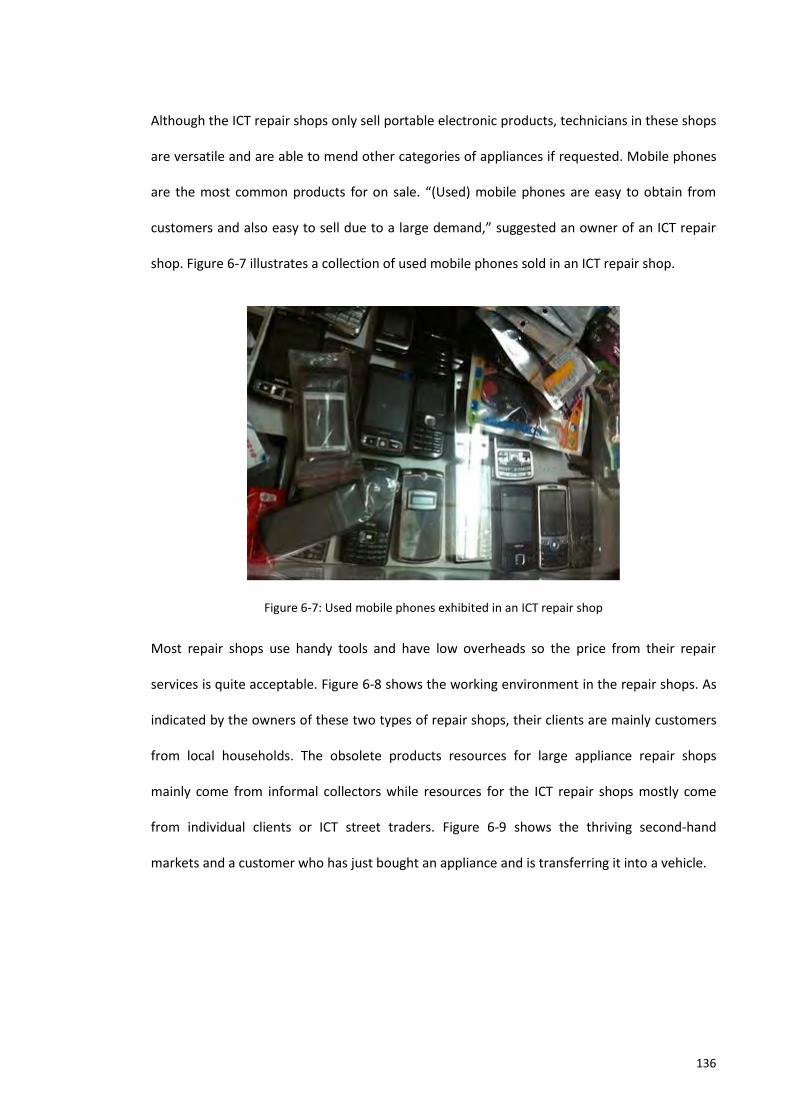
136
Although the ICT repair shops only sell portable electronic products, technicians in these shops
are versatile and are able to mend other categories of appliances if requested. Mobile phones
are the most common products for on sale. “(Used) mobile phones are easy to obtain from
customers and also easy to sell due to a large demand,” suggested an owner of an ICT repair
shop. Figure 6-7 illustrates a collection of used mobile phones sold in an ICT repair shop.
Figure 6-7: Used mobile phones exhibited in an ICT repair shop
Most repair shops use handy tools and have low overheads so the price from their repair
services is quite acceptable. Figure 6-8 shows the working environment in the repair shops. As
indicated by the owners of these two types of repair shops, their clients are mainly customers
from local households. The obsolete products resources for large appliance repair shops
mainly come from informal collectors while resources for the ICT repair shops mostly come
from individual clients or ICT street traders. Figure 6-9 shows the thriving second-hand
markets and a customer who has just bought an appliance and is transferring it into a vehicle.
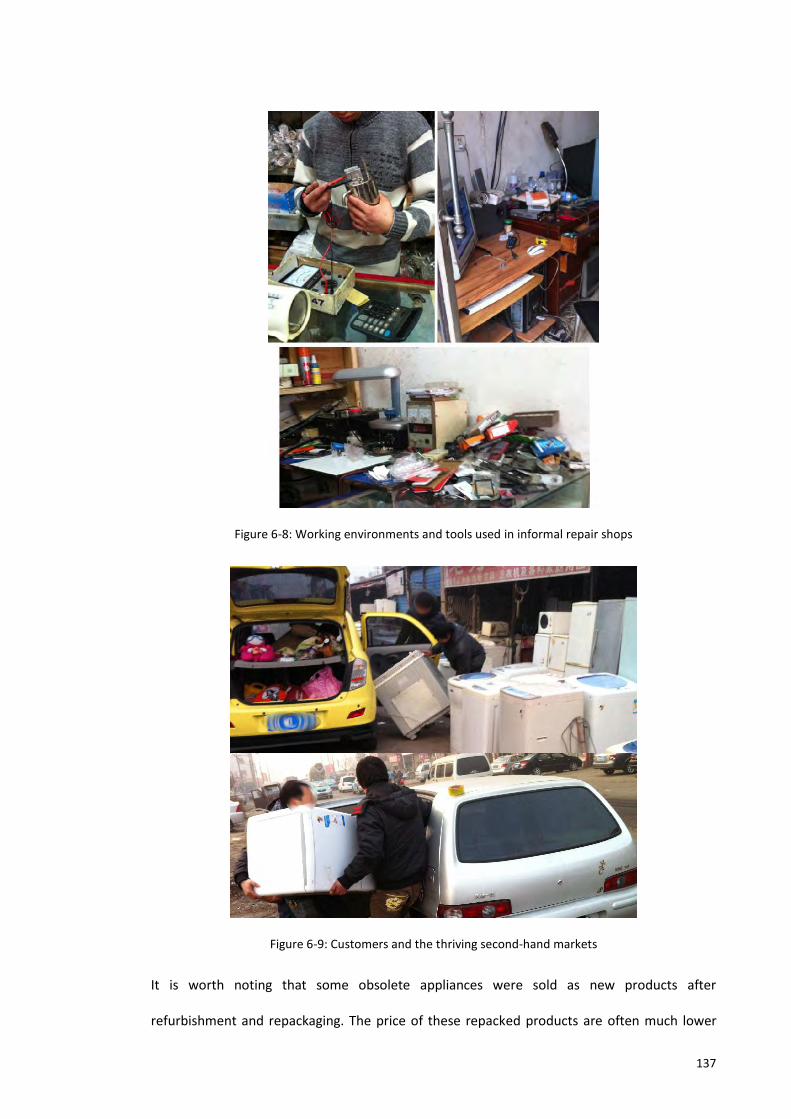
137
Figure 6-8: Working environments and tools used in informal repair shops
Figure 6-9: Customers and the thriving second-hand markets
It is worth noting that some obsolete appliances were sold as new products after
refurbishment and repackaging. The price of these repacked products are often much lower
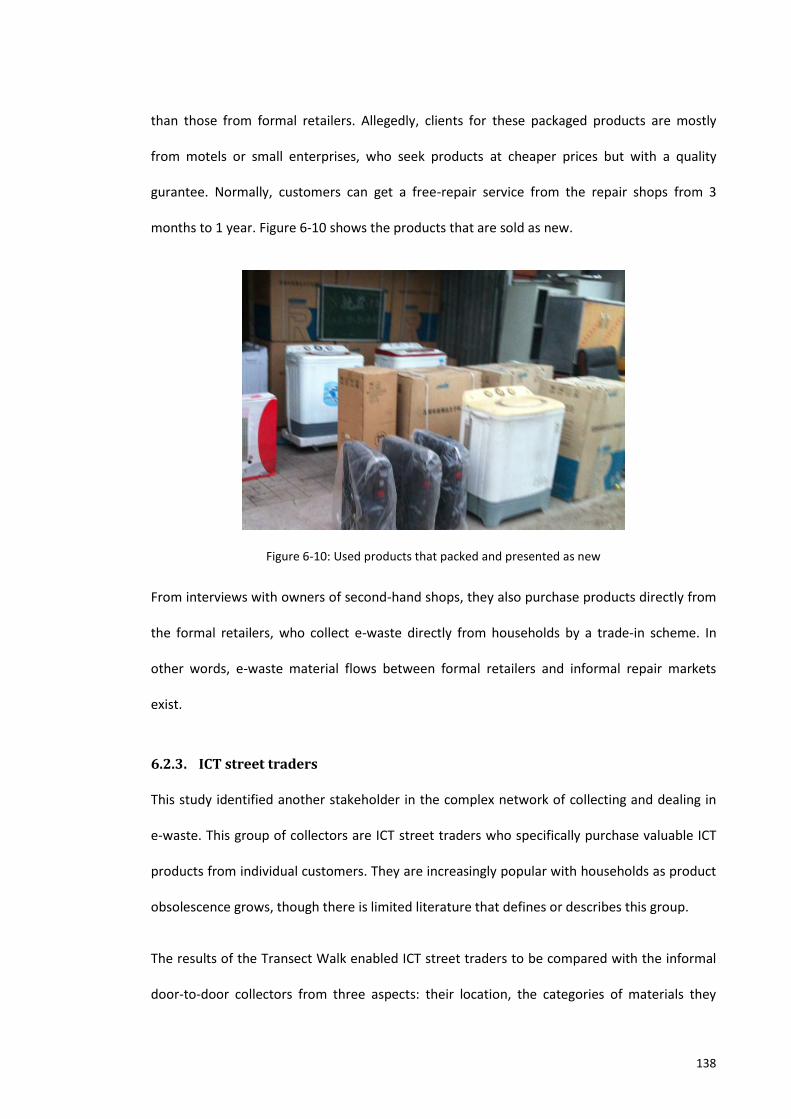
138
than those from formal retailers. Allegedly, clients for these packaged products are mostly
from motels or small enterprises, who seek products at cheaper prices but with a quality
gurantee. Normally, customers can get a free-repair service from the repair shops from 3
months to 1 year. Figure 6-10 shows the products that are sold as new.
Figure 6-10: Used products that packed and presented as new
From interviews with owners of second-hand shops, they also purchase products directly from
the formal retailers, who collect e-waste directly from households by a trade-in scheme. In
other words, e-waste material flows between formal retailers and informal repair markets
exist.
6.2.3. ICT street traders
This study identified another stakeholder in the complex network of collecting and dealing in
e-waste. This group of collectors are ICT street traders who specifically purchase valuable ICT
products from individual customers. They are increasingly popular with households as product
obsolescence grows, though there is limited literature that defines or describes this group.
The results of the Transect Walk enabled ICT street traders to be compared with the informal
door-to-door collectors from three aspects: their location, the categories of materials they
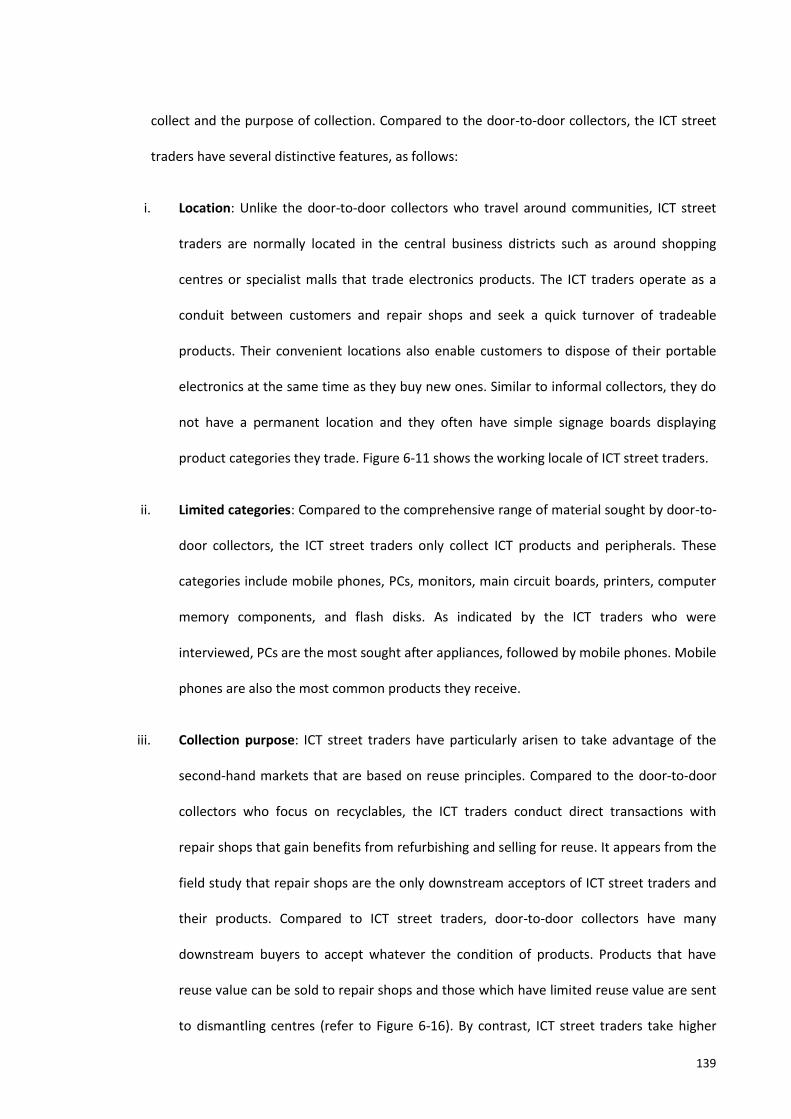
139
collect and the purpose of collection. Compared to the door-to-door collectors, the ICT street
traders have several distinctive features, as follows:
i. Location: Unlike the door-to-door collectors who travel around communities, ICT street
traders are normally located in the central business districts such as around shopping
centres or specialist malls that trade electronics products. The ICT traders operate as a
conduit between customers and repair shops and seek a quick turnover of tradeable
products. Their convenient locations also enable customers to dispose of their portable
electronics at the same time as they buy new ones. Similar to informal collectors, they do
not have a permanent location and they often have simple signage boards displaying
product categories they trade. Figure 6-11 shows the working locale of ICT street traders.
ii. Limited categories: Compared to the comprehensive range of material sought by door-to-
door collectors, the ICT street traders only collect ICT products and peripherals. These
categories include mobile phones, PCs, monitors, main circuit boards, printers, computer
memory components, and flash disks. As indicated by the ICT traders who were
interviewed, PCs are the most sought after appliances, followed by mobile phones. Mobile
phones are also the most common products they receive.
iii. Collection purpose: ICT street traders have particularly arisen to take advantage of the
second-hand markets that are based on reuse principles. Compared to the door-to-door
collectors who focus on recyclables, the ICT traders conduct direct transactions with
repair shops that gain benefits from refurbishing and selling for reuse. It appears from the
field study that repair shops are the only downstream acceptors of ICT street traders and
their products. Compared to ICT street traders, door-to-door collectors have many
downstream buyers to accept whatever the condition of products. Products that have
reuse value can be sold to repair shops and those which have limited reuse value are sent
to dismantling centres (refer to Figure 6-16). By contrast, ICT street traders take higher
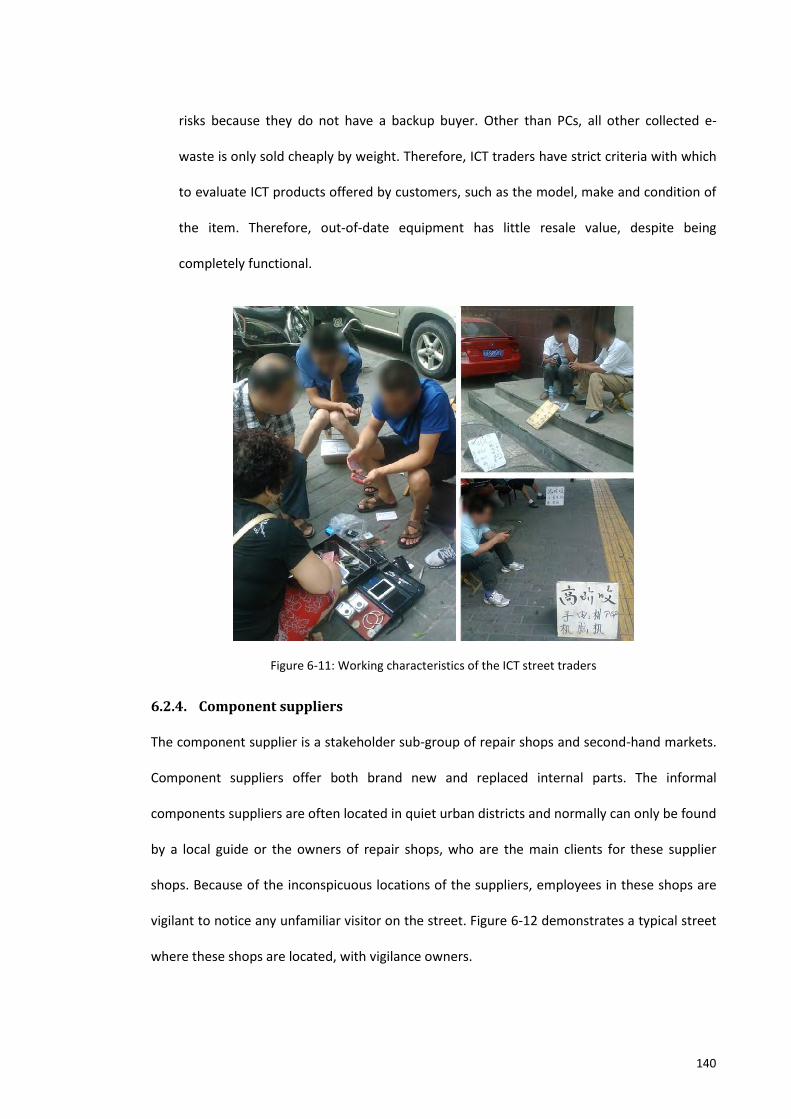
140
risks because they do not have a backup buyer. Other than PCs, all other collected e-
waste is only sold cheaply by weight. Therefore, ICT traders have strict criteria with which
to evaluate ICT products offered by customers, such as the model, make and condition of
the item. Therefore, out-of-date equipment has little resale value, despite being
completely functional.
Figure 6-11: Working characteristics of the ICT street traders
6.2.4. Component suppliers
The component supplier is a stakeholder sub-group of repair shops and second-hand markets.
Component suppliers offer both brand new and replaced internal parts. The informal
components suppliers are often located in quiet urban districts and normally can only be found
by a local guide or the owners of repair shops, who are the main clients for these supplier
shops. Because of the inconspicuous locations of the suppliers, employees in these shops are
vigilant to notice any unfamiliar visitor on the street. Figure 6-12 demonstrates a typical street
where these shops are located, with vigilance owners.
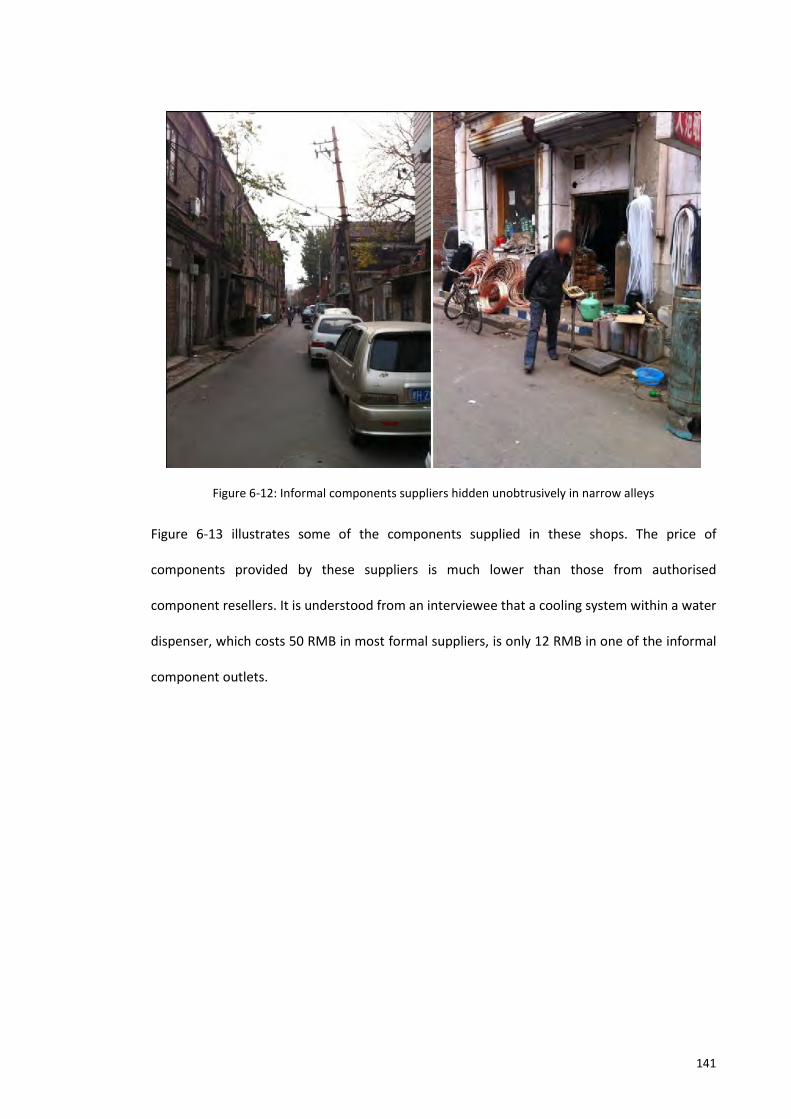
141
Figure 6-12: Informal components suppliers hidden unobtrusively in narrow alleys
Figure 6-13 illustrates some of the components supplied in these shops. The price of
components provided by these suppliers is much lower than those from authorised
component resellers. It is understood from an interviewee that a cooling system within a water
dispenser, which costs 50 RMB in most formal suppliers, is only 12 RMB in one of the informal
component outlets.
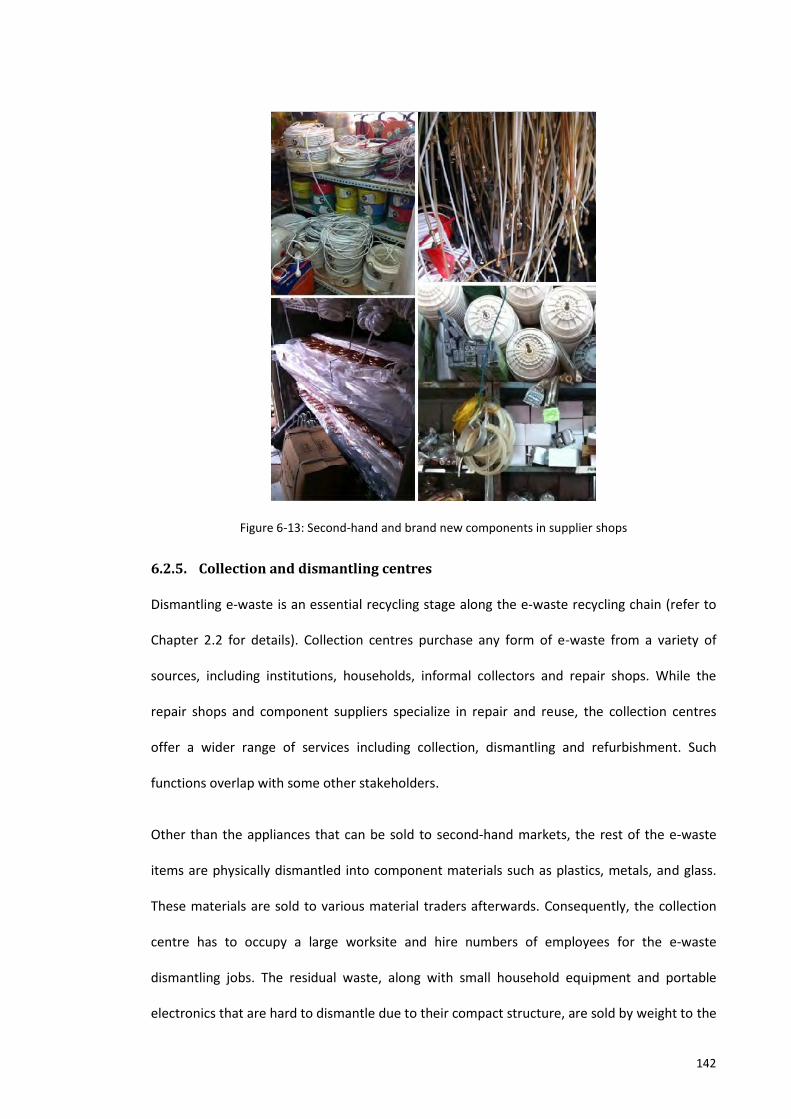
142
Figure 6-13: Second-hand and brand new components in supplier shops
6.2.5. Collection and dismantling centres
Dismantling e-waste is an essential recycling stage along the e-waste recycling chain (refer to
Chapter 2.2 for details). Collection centres purchase any form of e-waste from a variety of
sources, including institutions, households, informal collectors and repair shops. While the
repair shops and component suppliers specialize in repair and reuse, the collection centres
offer a wider range of services including collection, dismantling and refurbishment. Such
functions overlap with some other stakeholders.
Other than the appliances that can be sold to second-hand markets, the rest of the e-waste
items are physically dismantled into component materials such as plastics, metals, and glass.
These materials are sold to various material traders afterwards. Consequently, the collection
centre has to occupy a large worksite and hire numbers of employees for the e-waste
dismantling jobs. The residual waste, along with small household equipment and portable
electronics that are hard to dismantle due to their compact structure, are sold by weight to the
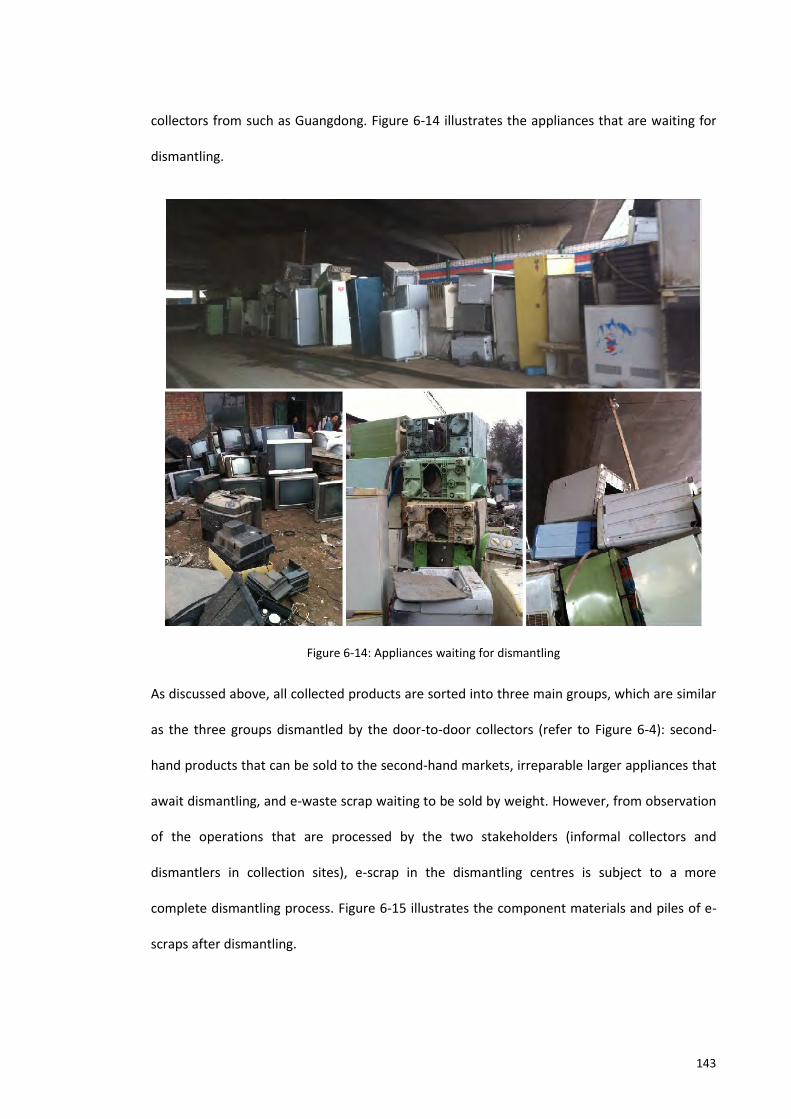
143
collectors from such as Guangdong. Figure 6-14 illustrates the appliances that are waiting for
dismantling.
Figure 6-14: Appliances waiting for dismantling
As discussed above, all collected products are sorted into three main groups, which are similar
as the three groups dismantled by the door-to-door collectors (refer to Figure 6-4): second-
hand products that can be sold to the second-hand markets, irreparable larger appliances that
await dismantling, and e-waste scrap waiting to be sold by weight. However, from observation
of the operations that are processed by the two stakeholders (informal collectors and
dismantlers in collection sites), e-scrap in the dismantling centres is subject to a more
complete dismantling process. Figure 6-15 illustrates the component materials and piles of e-
scraps after dismantling.
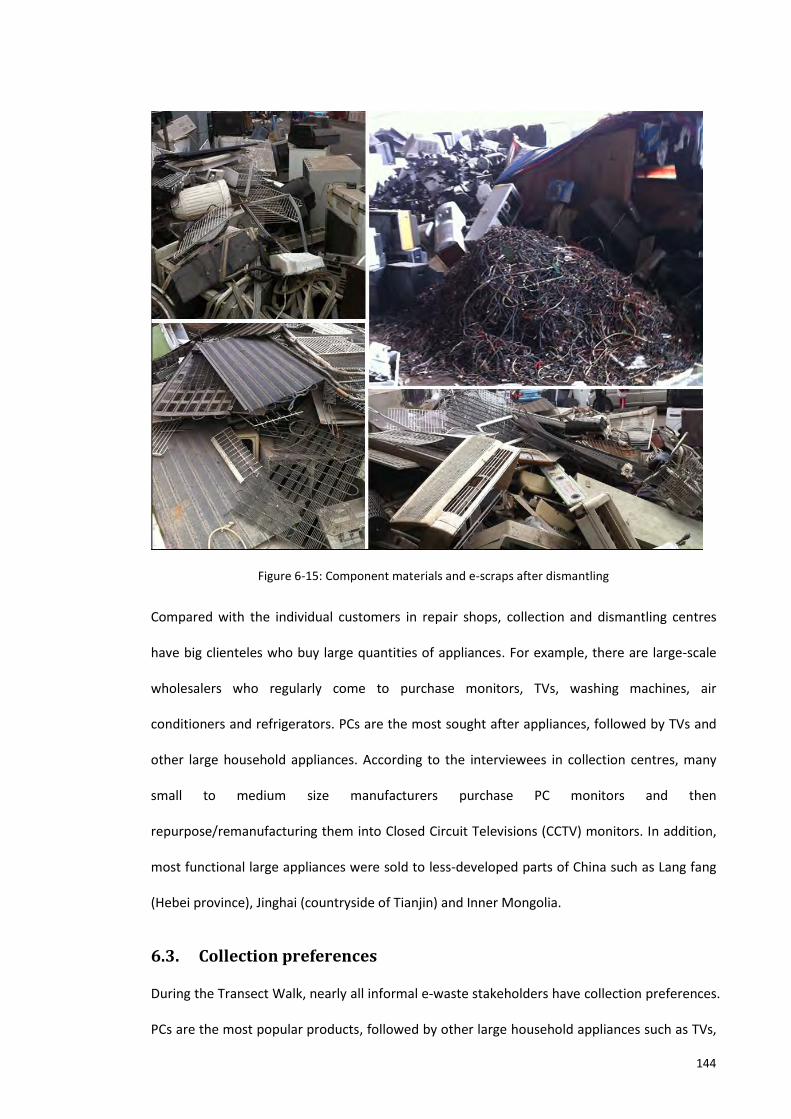
144
Figure 6-15: Component materials and e-scraps after dismantling
Compared with the individual customers in repair shops, collection and dismantling centres
have big clienteles who buy large quantities of appliances. For example, there are large-scale
wholesalers who regularly come to purchase monitors, TVs, washing machines, air
conditioners and refrigerators. PCs are the most sought after appliances, followed by TVs and
other large household appliances. According to the interviewees in collection centres, many
small to medium size manufacturers purchase PC monitors and then
repurpose/remanufacturing them into Closed Circuit Televisions (CCTV) monitors. In addition,
most functional large appliances were sold to less-developed parts of China such as Lang fang
(Hebei province), Jinghai (countryside of Tianjin) and Inner Mongolia.
6.3. Collection preferences
During the Transect Walk, nearly all informal e-waste stakeholders have collection preferences.
PCs are the most popular products, followed by other large household appliances such as TVs,
145
refrigerators, washing machines, and air conditioners. Other than the high demand in the
second-hand markets for these products, there are valuable components and large quantities
of recyclable materials within large appliances. Large appliances normally contain valuable
components, such as the compressors in refrigerators or air conditioners, and the electrical
motors in washing machines. “Even without valuable components, large appliances will result
in more materials after dismantling,” stated one worker in the collection centre. As a
consequence, these large appliances are popular regardless of condition because they can be
sold either for reuse or for dismantling.
By contrast, small household appliances and portable electronic products such as radios,
stereos, rice cookers, dryers and fans rarely trade at good prices, particular when dealing with
the door-to-door collectors. “We do not know how to evaluate the products and most cases,
we just sell them by weight”, said one door-to-door collector, “and because of the reduced
demand for small equipment, many households offer small devices free.” In such cases,
informal collectors are willing to accept all products because, at worst, they can sell them by
weight.
As discussed above, different e-waste categories flow into different stakeholders, depending
on the value of products. Figure 6-16 illustrates the different categories of e-waste being
reused or recycled through the two groups of informal collectors.
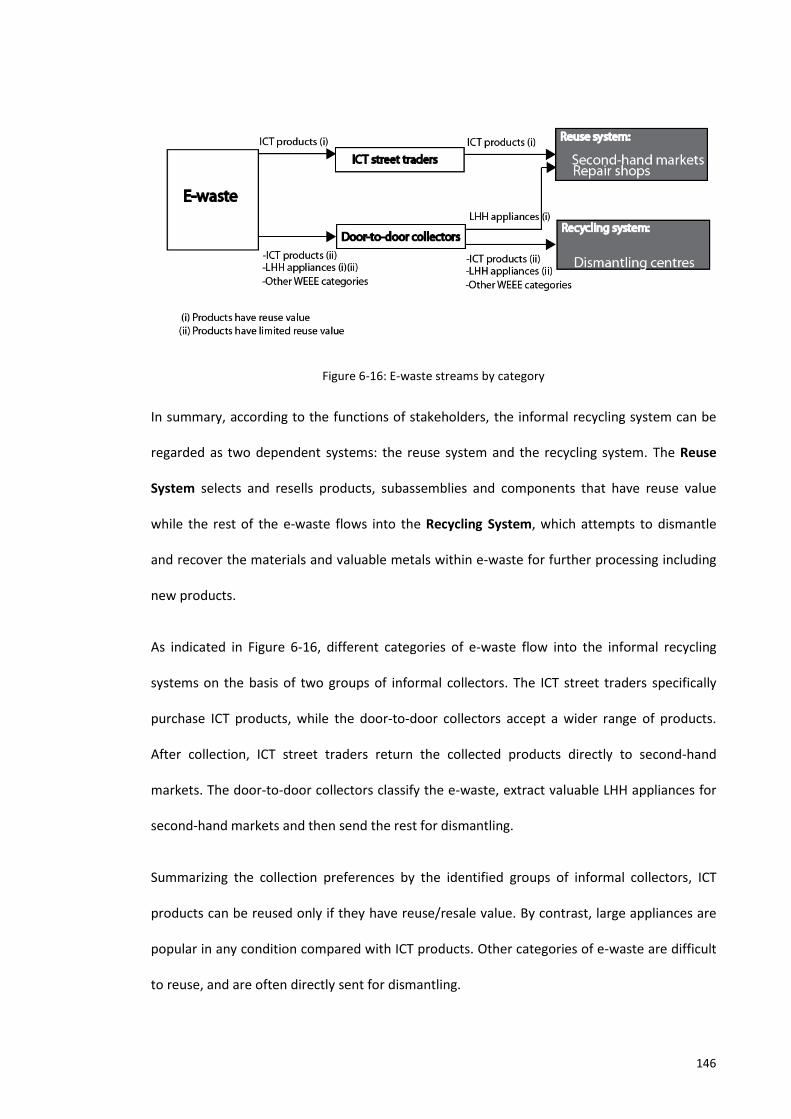
146
Figure 6-16: E-waste streams by category
In summary, according to the functions of stakeholders, the informal recycling system can be
regarded as two dependent systems: the reuse system and the recycling system. The Reuse
System selects and resells products, subassemblies and components that have reuse value
while the rest of the e-waste flows into the Recycling System, which attempts to dismantle
and recover the materials and valuable metals within e-waste for further processing including
new products.
As indicated in Figure 6-16, different categories of e-waste flow into the informal recycling
systems on the basis of two groups of informal collectors. The ICT street traders specifically
purchase ICT products, while the door-to-door collectors accept a wider range of products.
After collection, ICT street traders return the collected products directly to second-hand
markets. The door-to-door collectors classify the e-waste, extract valuable LHH appliances for
second-hand markets and then send the rest for dismantling.
Summarizing the collection preferences by the identified groups of informal collectors, ICT
products can be reused only if they have reuse/resale value. By contrast, large appliances are
popular in any condition compared with ICT products. Other categories of e-waste are difficult
to reuse, and are often directly sent for dismantling.
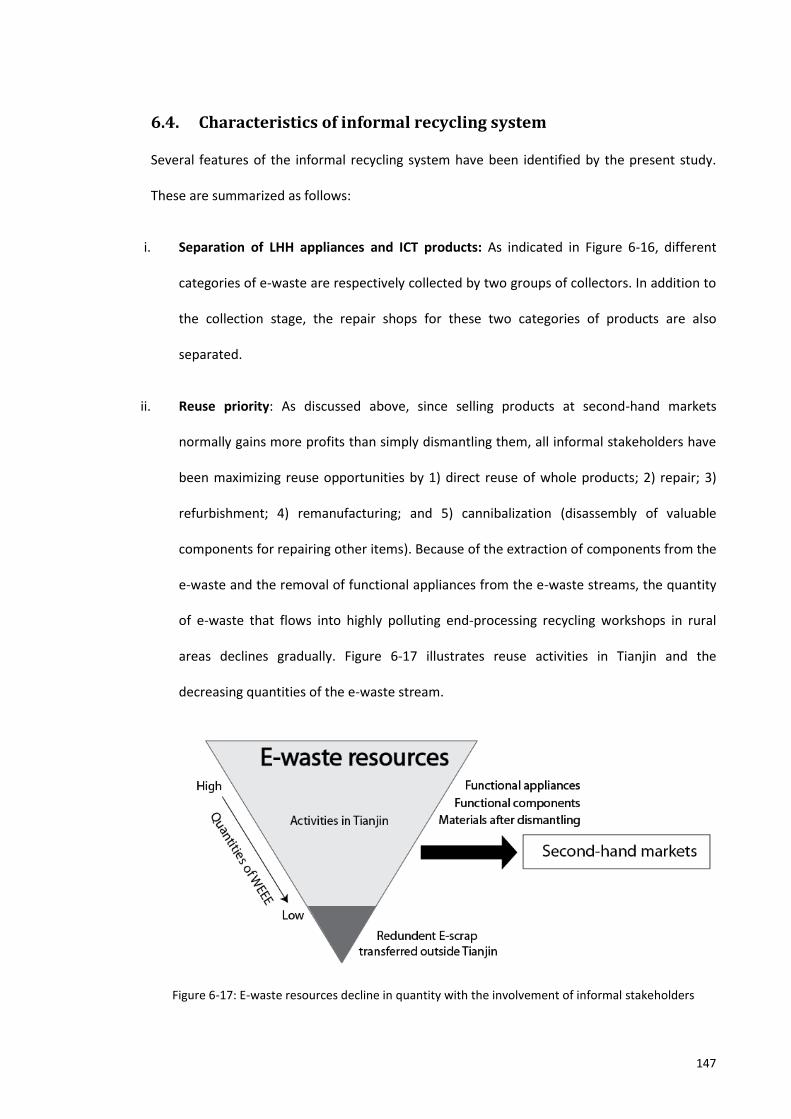
147
6.4. Characteristics of informal recycling system
Several features of the informal recycling system have been identified by the present study.
These are summarized as follows:
i. Separation of LHH appliances and ICT products: As indicated in Figure 6-16, different
categories of e-waste are respectively collected by two groups of collectors. In addition to
the collection stage, the repair shops for these two categories of products are also
separated.
ii. Reuse priority: As discussed above, since selling products at second-hand markets
normally gains more profits than simply dismantling them, all informal stakeholders have
been maximizing reuse opportunities by 1) direct reuse of whole products; 2) repair; 3)
refurbishment; 4) remanufacturing; and 5) cannibalization (disassembly of valuable
components for repairing other items). Because of the extraction of components from the
e-waste and the removal of functional appliances from the e-waste streams, the quantity
of e-waste that flows into highly polluting end-processing recycling workshops in rural
areas declines gradually. Figure 6-17 illustrates reuse activities in Tianjin and the
decreasing quantities of the e-waste stream.
Figure 6-17: E-waste resources decline in quantity with the involvement of informal stakeholders
148
iii. Cleaner recycling activities within urban areas: Results from this stage of the research
indicate that the e-waste recycling system within the urban area involves many reuse and
physical dismantling activities. However, the deep-processing recycling activities that
release large quantities of toxic substances through acid leaching and open burning (refer
to Chapter 3), have not been found in this study. As indicated in Figure 6-17, most e-scrap
has been transferred outside of Tianjin for further processing. Therefore, e-waste
recycling activities within urban areas are far more environmentally acceptable than the
deep-processing activities in the region of Guiyu.
iv. Cheap labour and low costs of refurbishment: Results from this stage of the research
indicate that except the informal collectors, all informal processors are located in less-
developed urban areas. It is also easier to gain employment at lower labour rates in the
informal sector compared with the formal recycling system. Additionally, although some
skills are necessary for refurbishment, costs are still low because numerous small
businesses handle refurbishment themselves, which avoid the need to hire extra labour.
The low price of components and cheap labour leads to overall low costs of refurbishment,
thus stimulating the development of EEE second-hand markets in China.
v. Market-driven and flexible: Results from this field study indicated that informal recyclers
are flexible in collecting obsolete products according to the demands of the collection
market (refer to Section 6.3). Informal stakeholders are responsive to customers’
demands and can adjust their service to meet households’ requirements and lower their
collection and recycling costs. For example, repair shops can mend devices in-store or
provide a visiting repair service. Similarly, ICT street traders can also offer a door-
collection service for PCs. In addition, informal collectors travel across communities with
their cost-effective small vehicles although they use large vehicles if transferring for a
number of items.

149
Given the advantages enjoyed by informal recyclers, as well as the difficulties that formal
recyclers have in competing with them (refer to Chapter 3), it would be more cost-effective to
guide rather than compete or attempt to eliminate the informal recycling sectors in China.
Further discussion refers to Chapter 8.3.
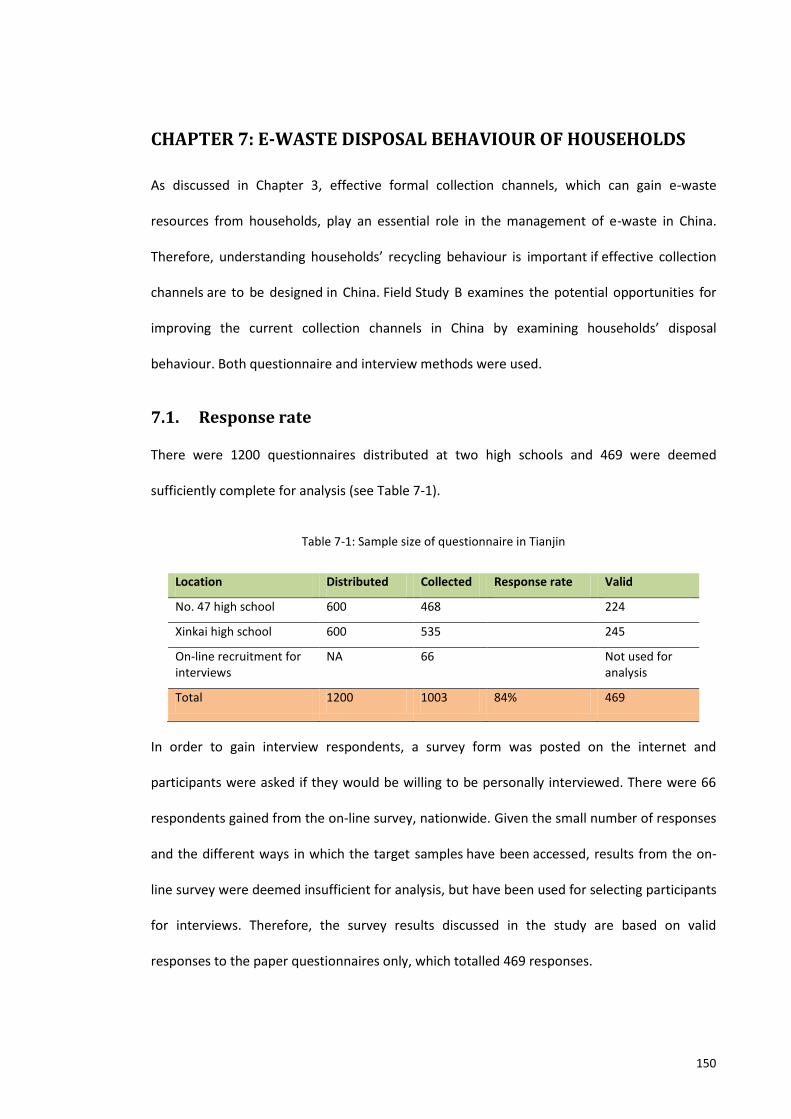
150
CHAPTER 7: E-WASTE DISPOSAL BEHAVIOUR OF HOUSEHOLDS
As discussed in Chapter 3, effective formal collection channels, which can gain e-waste
resources from households, play an essential role in the management of e-waste in China.
Therefore, understanding households’ recycling behaviour is important if effective collection
channels are to be designed in China. Field Study B examines the potential opportunities for
improving the current collection channels in China by examining households’ disposal
behaviour. Both questionnaire and interview methods were used.
7.1. Response rate
There were 1200 questionnaires distributed at two high schools and 469 were deemed
sufficiently complete for analysis (see Table 7-1).
Table 7-1: Sample size of questionnaire in Tianjin
Location Distributed Collected Response rate Valid
No. 47 high school 600 468 224
Xinkai high school 600 535 245
On-line recruitment for interviews
NA 66 Not used for analysis
Total 1200 1003 84% 469
In order to gain interview respondents, a survey form was posted on the internet and
participants were asked if they would be willing to be personally interviewed. There were 66
respondents gained from the on-line survey, nationwide. Given the small number of responses
and the different ways in which the target samples have been accessed, results from the on-
line survey were deemed insufficient for analysis, but have been used for selecting participants
for interviews. Therefore, the survey results discussed in the study are based on valid
responses to the paper questionnaires only, which totalled 469 responses.
151
Participants in structured interviews were selected from the 66 on-line responders. Fifteen
households were selected for interview representing different age groups, income levels and
locations. Appendix B4 shows the demographic composition of the survey households.
Schedules of interviews and locations of participants are shown in Appendix B2.
The following sections discuss the results from the Field Study B according to the four
behavioural themes: HOW/Behaviour, WHY/Motivation, Attitudes to recycling and
Satisfaction/Expectations (classification of four behavioural themes refers to Chapter 5.3).
Results in each of the following sections include the data gained by both questionnaire and
interview methods.
7.2. HOW/ Behaviour
As discussed in Chapter 4.1, defining what is meant by e-waste is essential to the survey results
of behavioural studies. Therefore, this study examines recycling behaviour by category of e-
waste. Before identifying detailed disposal behaviour, an introductory question that examines
the understanding of e-waste is asked. It was designed to verify the statement that concluded
in Chapter 4.1.
7.2.1. Understanding e-waste categories
This question in the survey instrument about e-waste categories is designed to test
households’ understanding about what is and what is not e-waste. Figure 7-1 illustrates the
results from the questionnaires.
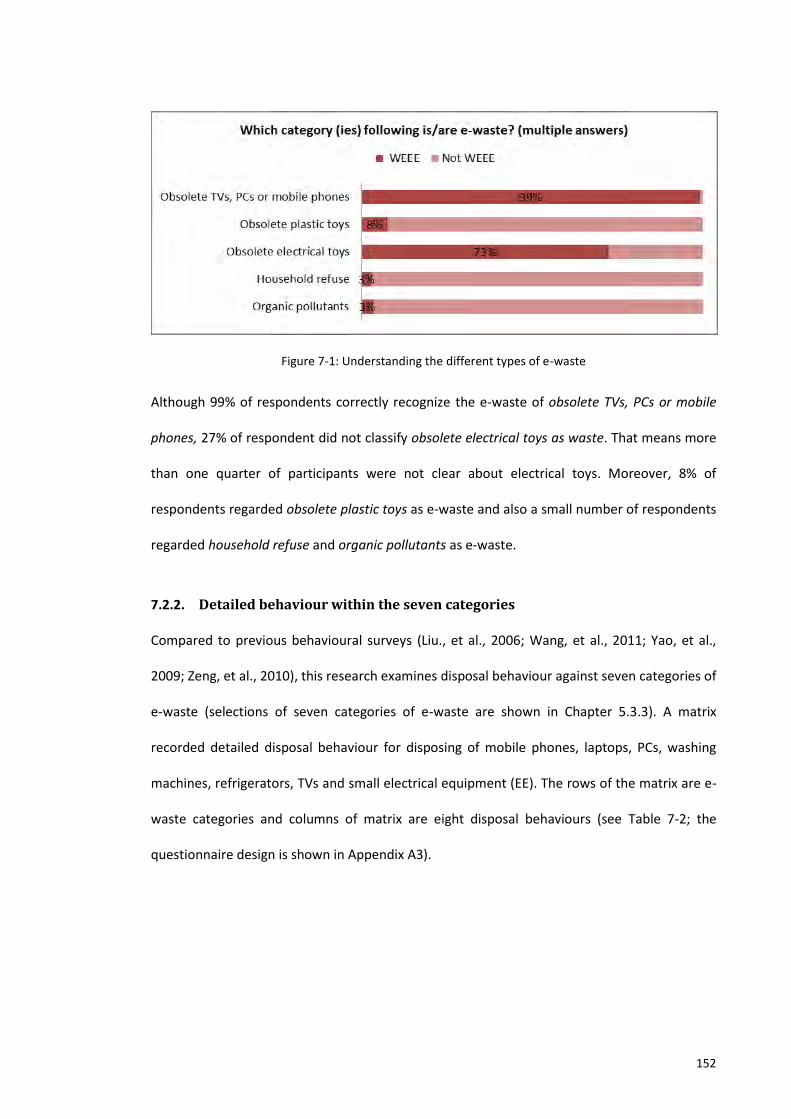
152
Figure 7-1: Understanding the different types of e-waste
Although 99% of respondents correctly recognize the e-waste of obsolete TVs, PCs or mobile
phones, 27% of respondent did not classify obsolete electrical toys as waste. That means more
than one quarter of participants were not clear about electrical toys. Moreover, 8% of
respondents regarded obsolete plastic toys as e-waste and also a small number of respondents
regarded household refuse and organic pollutants as e-waste.
7.2.2. Detailed behaviour within the seven categories
Compared to previous behavioural surveys (Liu., et al., 2006; Wang, et al., 2011; Yao, et al.,
2009; Zeng, et al., 2010), this research examines disposal behaviour against seven categories of
e-waste (selections of seven categories of e-waste are shown in Chapter 5.3.3). A matrix
recorded detailed disposal behaviour for disposing of mobile phones, laptops, PCs, washing
machines, refrigerators, TVs and small electrical equipment (EE). The rows of the matrix are e-
waste categories and columns of matrix are eight disposal behaviours (see Table 7-2; the
questionnaire design is shown in Appendix A3).
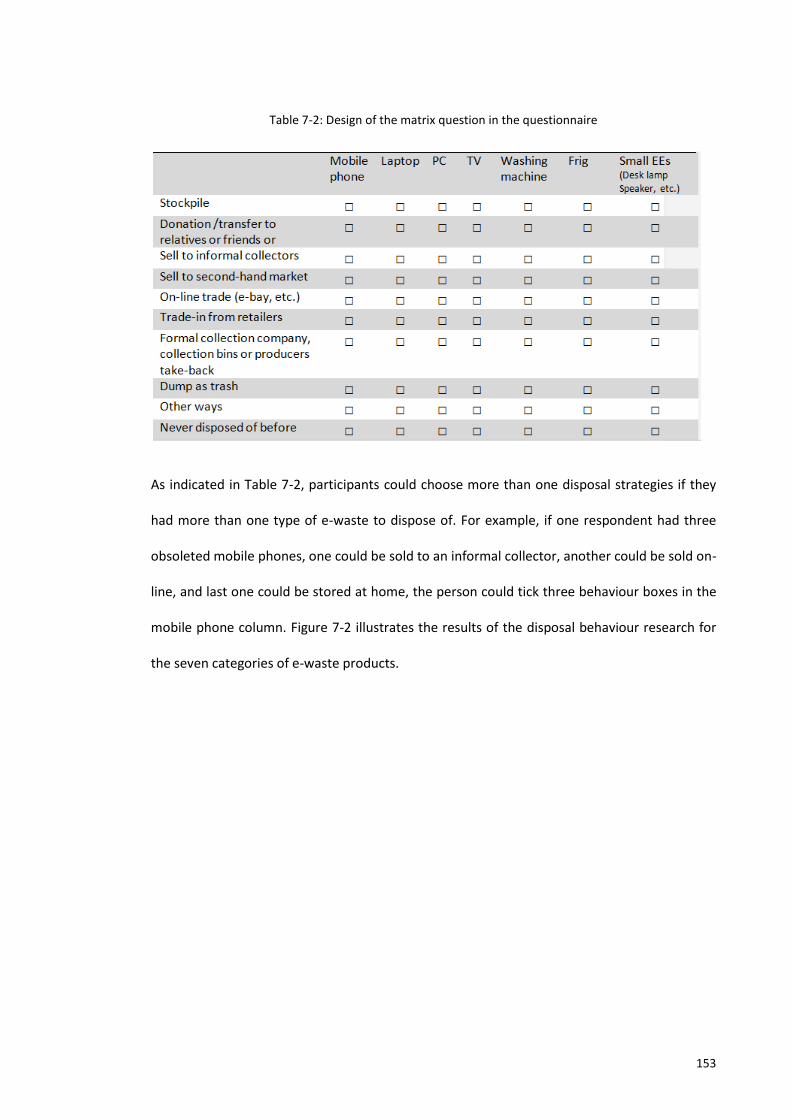
153
Table 7-2: Design of the matrix question in the questionnaire
As indicated in Table 7-2, participants could choose more than one disposal strategies if they
had more than one type of e-waste to dispose of. For example, if one respondent had three
obsoleted mobile phones, one could be sold to an informal collector, another could be sold on-
line, and last one could be stored at home, the person could tick three behaviour boxes in the
mobile phone column. Figure 7-2 illustrates the results of the disposal behaviour research for
the seven categories of e-waste products.
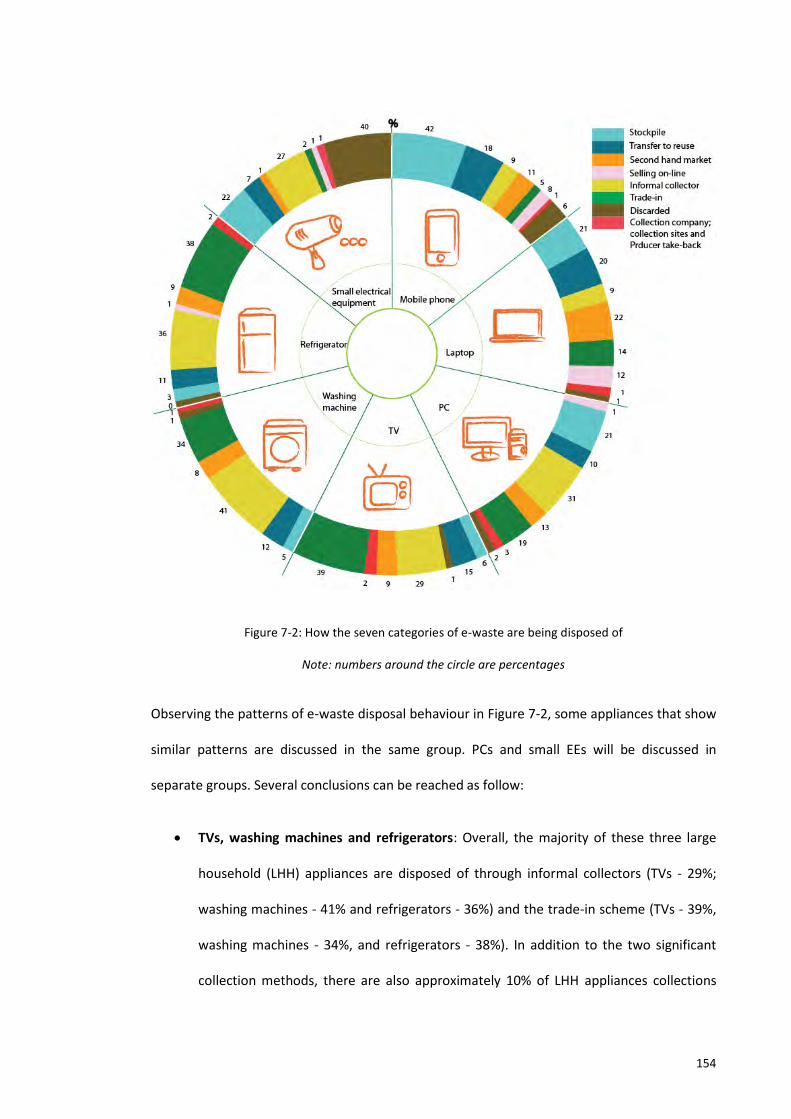
154
Figure 7-2: How the seven categories of e-waste are being disposed of
Note: numbers around the circle are percentages
Observing the patterns of e-waste disposal behaviour in Figure 7-2, some appliances that show
similar patterns are discussed in the same group. PCs and small EEs will be discussed in
separate groups. Several conclusions can be reached as follow:
TVs, washing machines and refrigerators: Overall, the majority of these three large
household (LHH) appliances are disposed of through informal collectors (TVs - 29%;
washing machines - 41% and refrigerators - 36%) and the trade-in scheme (TVs - 39%,
washing machines - 34%, and refrigerators - 38%). In addition to the two significant
collection methods, there are also approximately 10% of LHH appliances collections
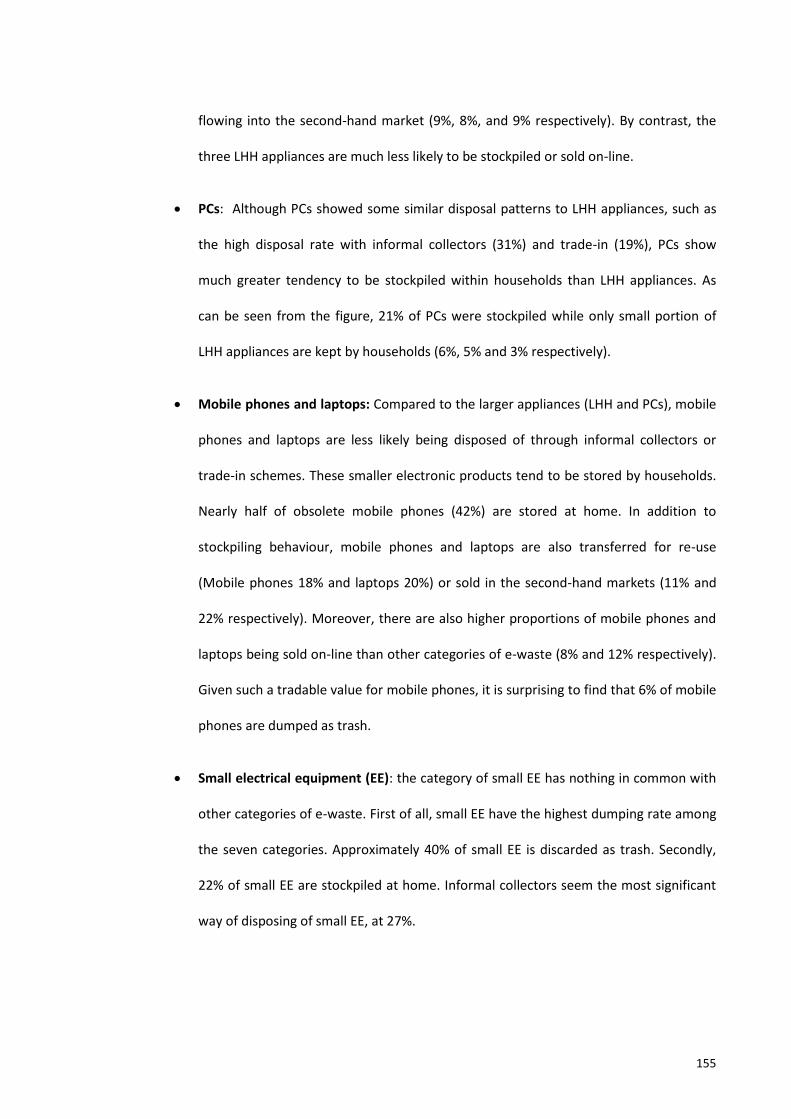
155
flowing into the second-hand market (9%, 8%, and 9% respectively). By contrast, the
three LHH appliances are much less likely to be stockpiled or sold on-line.
PCs: Although PCs showed some similar disposal patterns to LHH appliances, such as
the high disposal rate with informal collectors (31%) and trade-in (19%), PCs show
much greater tendency to be stockpiled within households than LHH appliances. As
can be seen from the figure, 21% of PCs were stockpiled while only small portion of
LHH appliances are kept by households (6%, 5% and 3% respectively).
Mobile phones and laptops: Compared to the larger appliances (LHH and PCs), mobile
phones and laptops are less likely being disposed of through informal collectors or
trade-in schemes. These smaller electronic products tend to be stored by households.
Nearly half of obsolete mobile phones (42%) are stored at home. In addition to
stockpiling behaviour, mobile phones and laptops are also transferred for re-use
(Mobile phones 18% and laptops 20%) or sold in the second-hand markets (11% and
22% respectively). Moreover, there are also higher proportions of mobile phones and
laptops being sold on-line than other categories of e-waste (8% and 12% respectively).
Given such a tradable value for mobile phones, it is surprising to find that 6% of mobile
phones are dumped as trash.
Small electrical equipment (EE): the category of small EE has nothing in common with
other categories of e-waste. First of all, small EE have the highest dumping rate among
the seven categories. Approximately 40% of small EE is discarded as trash. Secondly,
22% of small EE are stockpiled at home. Informal collectors seem the most significant
way of disposing of small EE, at 27%.
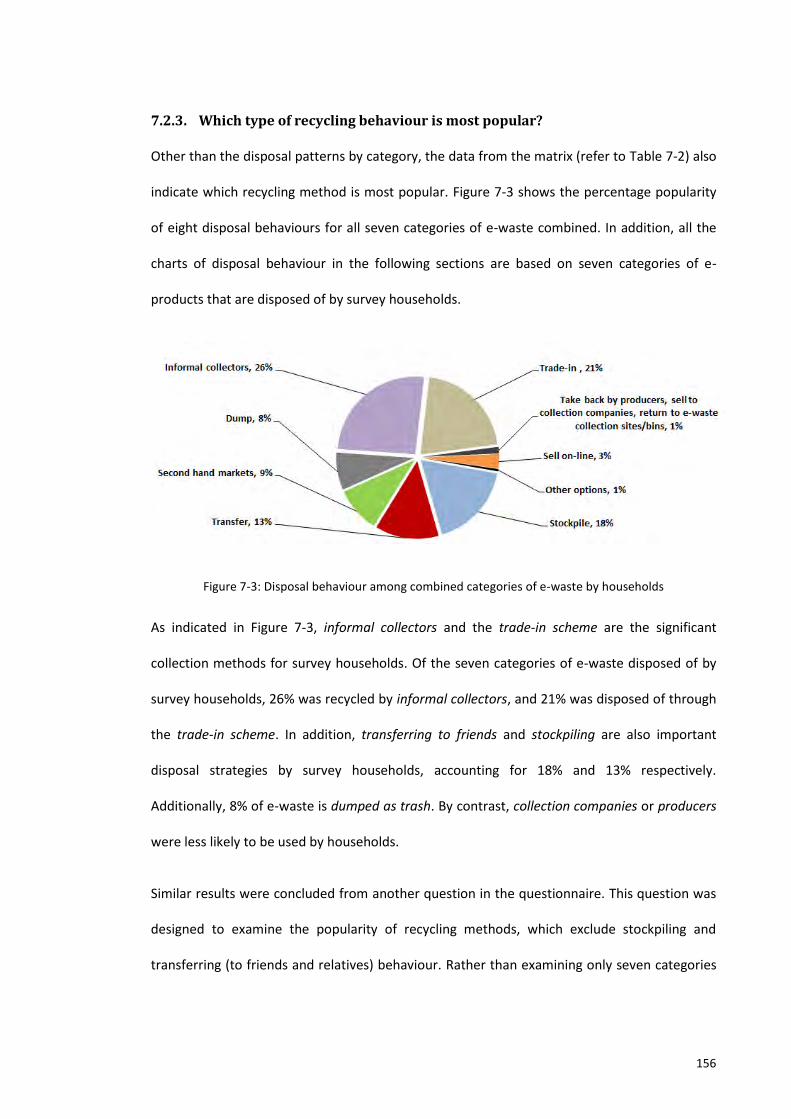
156
7.2.3. Which type of recycling behaviour is most popular?
Other than the disposal patterns by category, the data from the matrix (refer to Table 7-2) also
indicate which recycling method is most popular. Figure 7-3 shows the percentage popularity
of eight disposal behaviours for all seven categories of e-waste combined. In addition, all the
charts of disposal behaviour in the following sections are based on seven categories of e-
products that are disposed of by survey households.
Figure 7-3: Disposal behaviour among combined categories of e-waste by households
As indicated in Figure 7-3, informal collectors and the trade-in scheme are the significant
collection methods for survey households. Of the seven categories of e-waste disposed of by
survey households, 26% was recycled by informal collectors, and 21% was disposed of through
the trade-in scheme. In addition, transferring to friends and stockpiling are also important
disposal strategies by survey households, accounting for 18% and 13% respectively.
Additionally, 8% of e-waste is dumped as trash. By contrast, collection companies or producers
were less likely to be used by households.
Similar results were concluded from another question in the questionnaire. This question was
designed to examine the popularity of recycling methods, which exclude stockpiling and
transferring (to friends and relatives) behaviour. Rather than examining only seven categories
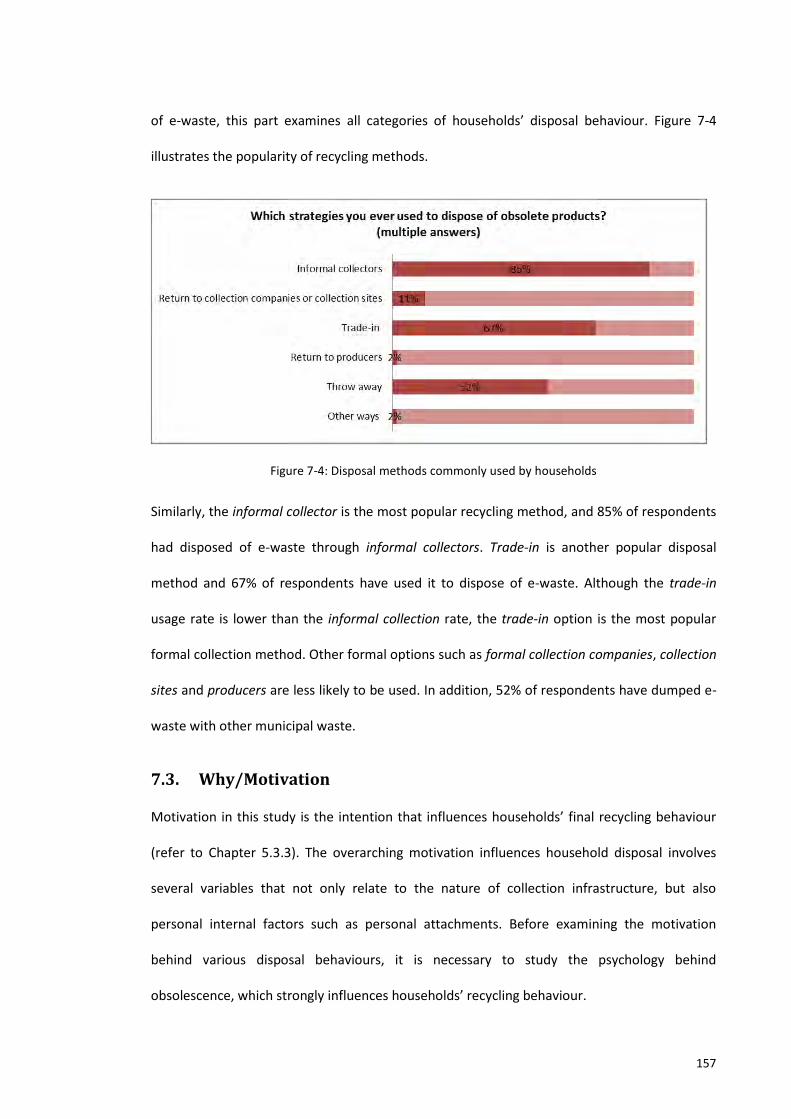
157
of e-waste, this part examines all categories of households’ disposal behaviour. Figure 7-4
illustrates the popularity of recycling methods.
Figure 7-4: Disposal methods commonly used by households
Similarly, the informal collector is the most popular recycling method, and 85% of respondents
had disposed of e-waste through informal collectors. Trade-in is another popular disposal
method and 67% of respondents have used it to dispose of e-waste. Although the trade-in
usage rate is lower than the informal collection rate, the trade-in option is the most popular
formal collection method. Other formal options such as formal collection companies, collection
sites and producers are less likely to be used. In addition, 52% of respondents have dumped e-
waste with other municipal waste.
7.3. Why/Motivation
Motivation in this study is the intention that influences households’ final recycling behaviour
(refer to Chapter 5.3.3). The overarching motivation influences household disposal involves
several variables that not only relate to the nature of collection infrastructure, but also
personal internal factors such as personal attachments. Before examining the motivation
behind various disposal behaviours, it is necessary to study the psychology behind
obsolescence, which strongly influences households’ recycling behaviour.
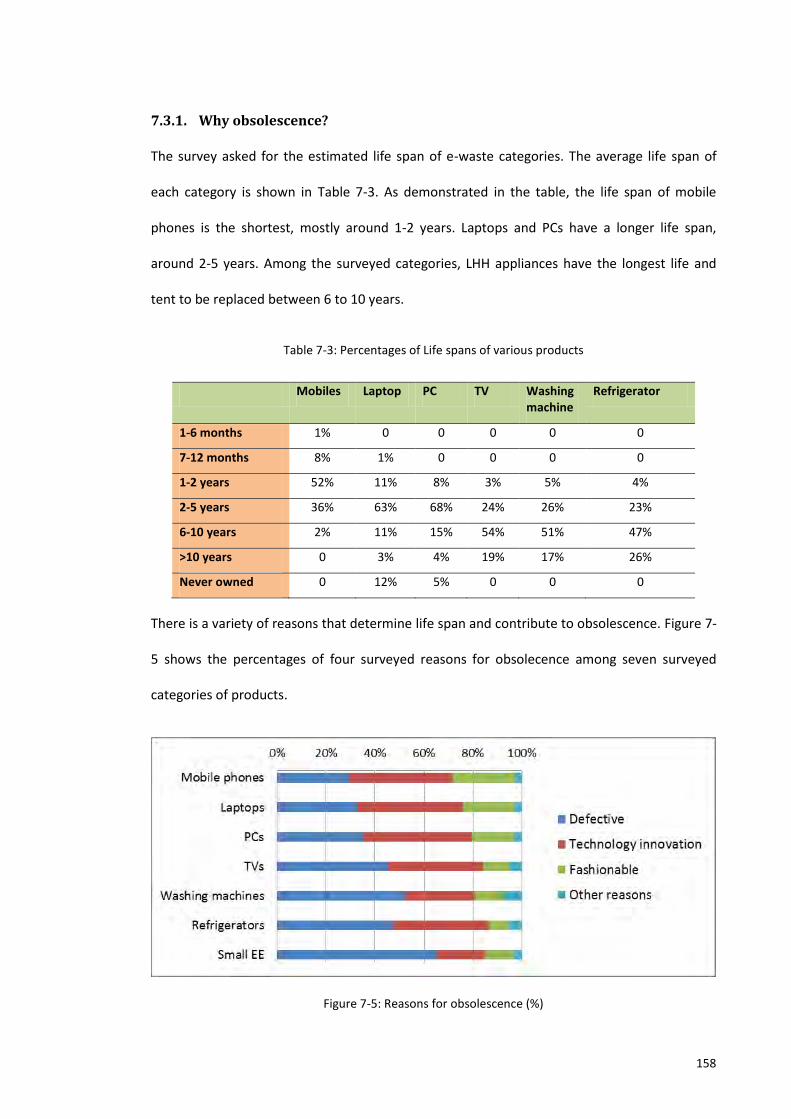
158
7.3.1. Why obsolescence?
The survey asked for the estimated life span of e-waste categories. The average life span of
each category is shown in Table 7-3. As demonstrated in the table, the life span of mobile
phones is the shortest, mostly around 1-2 years. Laptops and PCs have a longer life span,
around 2-5 years. Among the surveyed categories, LHH appliances have the longest life and
tent to be replaced between 6 to 10 years.
Table 7-3: Percentages of Life spans of various products
Mobiles Laptop PC TV Washing machine
Refrigerator
1-6 months 1% 0 0 0 0 0
7-12 months 8% 1% 0 0 0 0
1-2 years 52% 11% 8% 3% 5% 4%
2-5 years 36% 63% 68% 24% 26% 23%
6-10 years 2% 11% 15% 54% 51% 47%
>10 years 0 3% 4% 19% 17% 26%
Never owned 0 12% 5% 0 0 0
There is a variety of reasons that determine life span and contribute to obsolescence. Figure 7-
5 shows the percentages of four surveyed reasons for obsolecence among seven surveyed
categories of products.
Figure 7-5: Reasons for obsolescence (%)
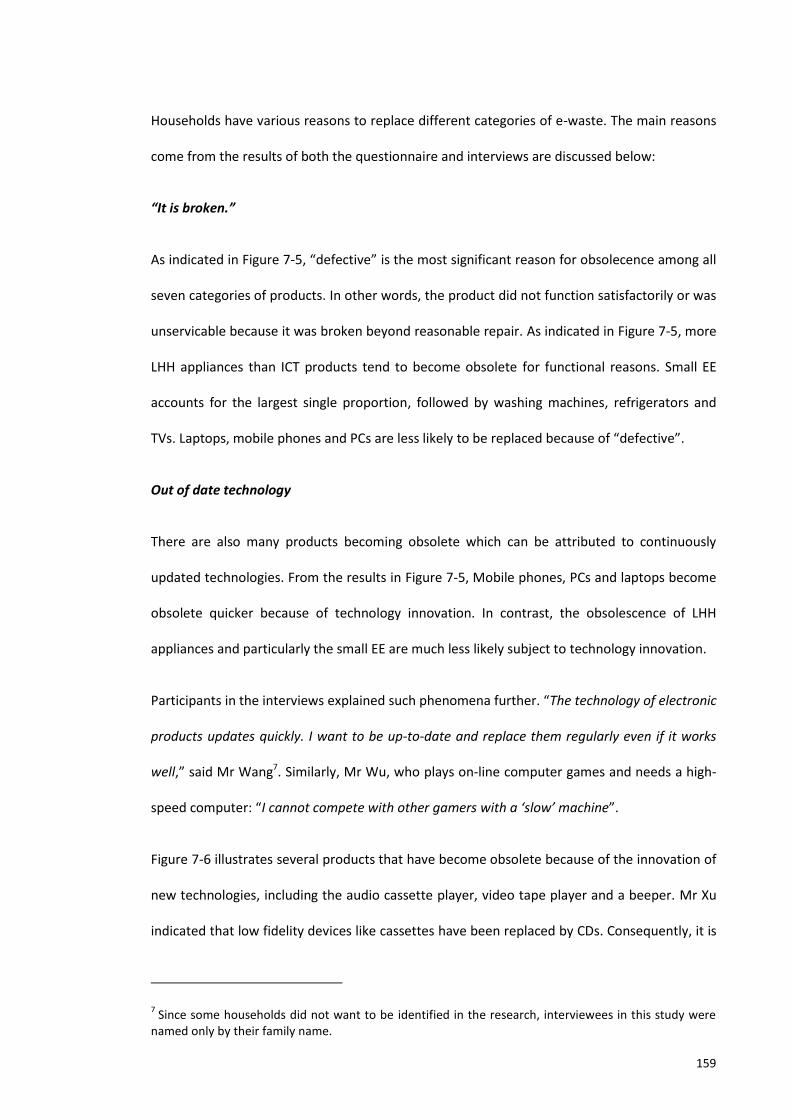
159
Households have various reasons to replace different categories of e-waste. The main reasons
come from the results of both the questionnaire and interviews are discussed below:
“It is broken.”
As indicated in Figure 7-5, “defective” is the most significant reason for obsolecence among all
seven categories of products. In other words, the product did not function satisfactorily or was
unservicable because it was broken beyond reasonable repair. As indicated in Figure 7-5, more
LHH appliances than ICT products tend to become obsolete for functional reasons. Small EE
accounts for the largest single proportion, followed by washing machines, refrigerators and
TVs. Laptops, mobile phones and PCs are less likely to be replaced because of “defective”.
Out of date technology
There are also many products becoming obsolete which can be attributed to continuously
updated technologies. From the results in Figure 7-5, Mobile phones, PCs and laptops become
obsolete quicker because of technology innovation. In contrast, the obsolescence of LHH
appliances and particularly the small EE are much less likely subject to technology innovation.
Participants in the interviews explained such phenomena further. “The technology of electronic
products updates quickly. I want to be up-to-date and replace them regularly even if it works
well,” said Mr Wang7. Similarly, Mr Wu, who plays on-line computer games and needs a high-
speed computer: “I cannot compete with other gamers with a ‘slow’ machine”.
Figure 7-6 illustrates several products that have become obsolete because of the innovation of
new technologies, including the audio cassette player, video tape player and a beeper. Mr Xu
indicated that low fidelity devices like cassettes have been replaced by CDs. Consequently, it is
7 Since some households did not want to be identified in the research, interviewees in this study were
named only by their family name.
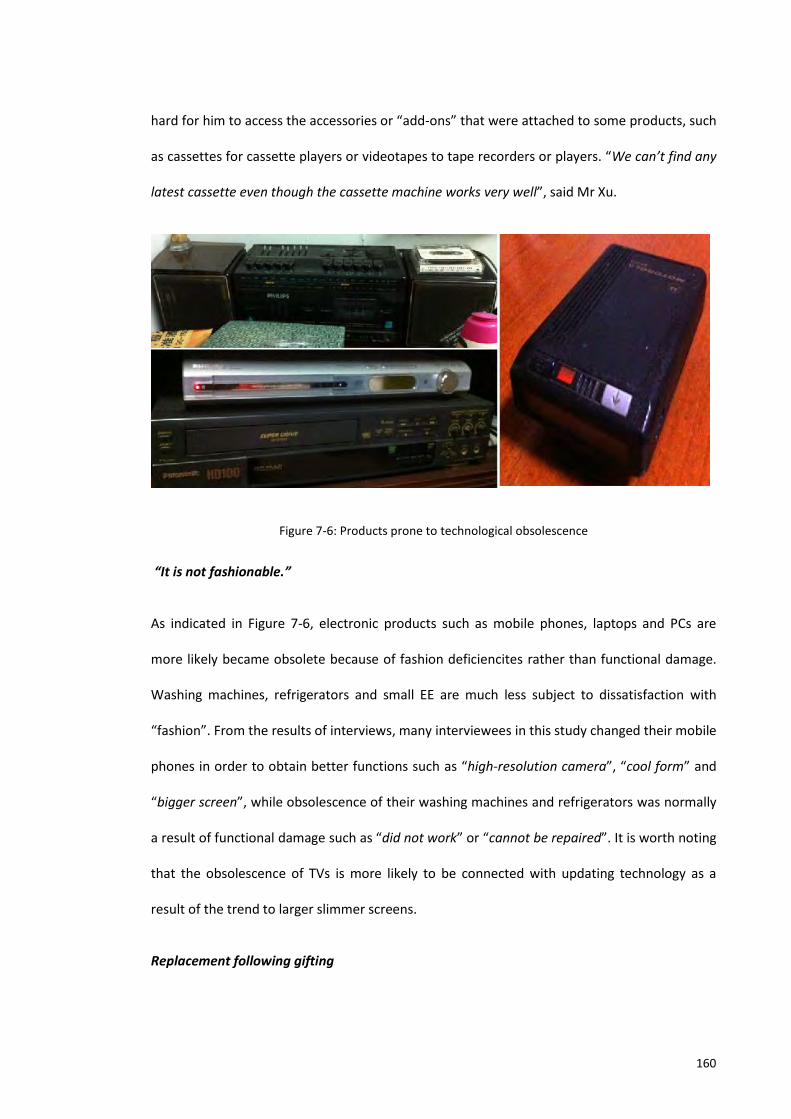
160
hard for him to access the accessories or “add-ons” that were attached to some products, such
as cassettes for cassette players or videotapes to tape recorders or players. “We can’t find any
latest cassette even though the cassette machine works very well”, said Mr Xu.
Figure 7-6: Products prone to technological obsolescence
“It is not fashionable.”
As indicated in Figure 7-6, electronic products such as mobile phones, laptops and PCs are
more likely became obsolete because of fashion deficiencites rather than functional damage.
Washing machines, refrigerators and small EE are much less subject to dissatisfaction with
“fashion”. From the results of interviews, many interviewees in this study changed their mobile
phones in order to obtain better functions such as “high-resolution camera”, “cool form” and
“bigger screen”, while obsolescence of their washing machines and refrigerators was normally
a result of functional damage such as “did not work” or “cannot be repaired”. It is worth noting
that the obsolescence of TVs is more likely to be connected with updating technology as a
result of the trend to larger slimmer screens.
Replacement following gifting
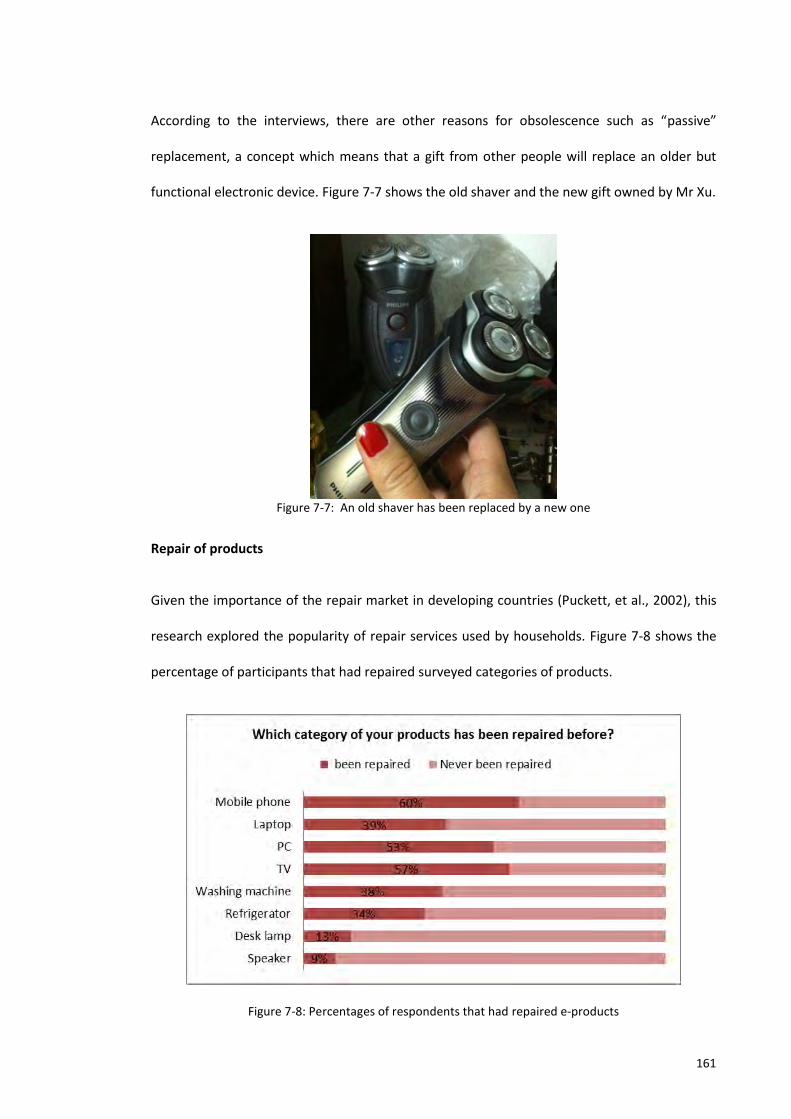
161
According to the interviews, there are other reasons for obsolescence such as “passive”
replacement, a concept which means that a gift from other people will replace an older but
functional electronic device. Figure 7-7 shows the old shaver and the new gift owned by Mr Xu.
Figure 7-7: An old shaver has been replaced by a new one
Repair of products
Given the importance of the repair market in developing countries (Puckett, et al., 2002), this
research explored the popularity of repair services used by households. Figure 7-8 shows the
percentage of participants that had repaired surveyed categories of products.
Figure 7-8: Percentages of respondents that had repaired e-products
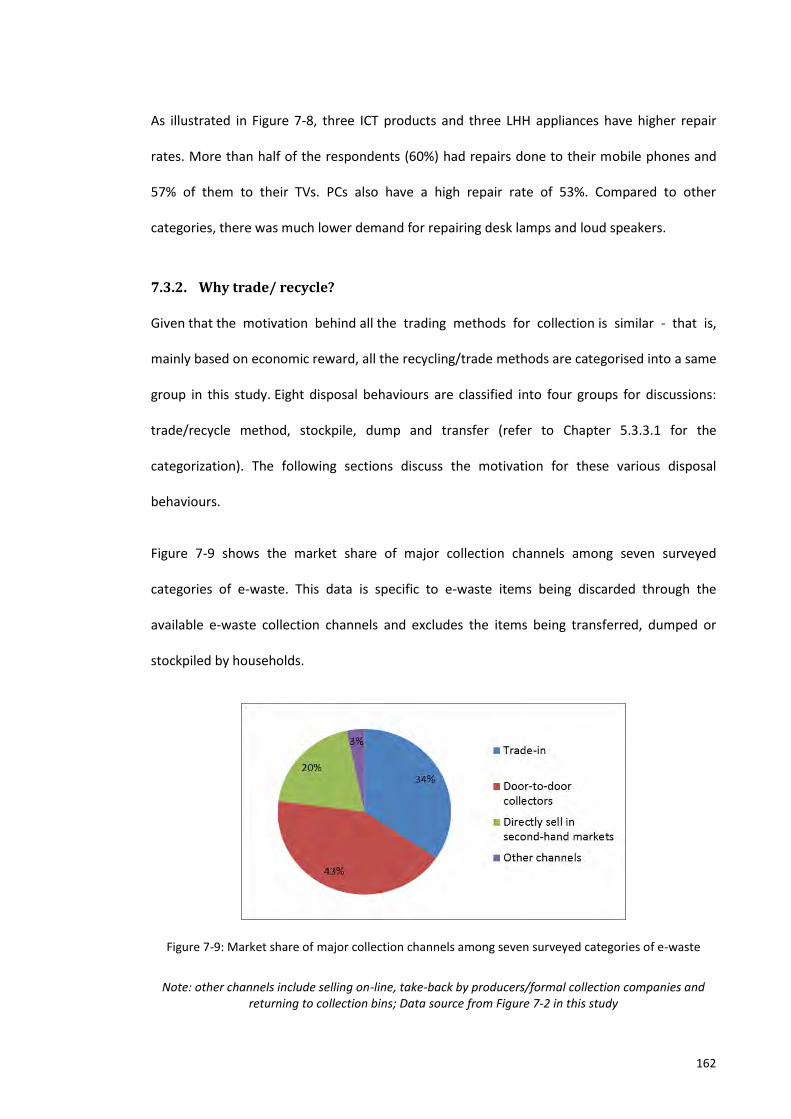
162
As illustrated in Figure 7-8, three ICT products and three LHH appliances have higher repair
rates. More than half of the respondents (60%) had repairs done to their mobile phones and
57% of them to their TVs. PCs also have a high repair rate of 53%. Compared to other
categories, there was much lower demand for repairing desk lamps and loud speakers.
7.3.2. Why trade/ recycle?
Given that the motivation behind all the trading methods for collection is similar - that is,
mainly based on economic reward, all the recycling/trade methods are categorised into a same
group in this study. Eight disposal behaviours are classified into four groups for discussions:
trade/recycle method, stockpile, dump and transfer (refer to Chapter 5.3.3.1 for the
categorization). The following sections discuss the motivation for these various disposal
behaviours.
Figure 7-9 shows the market share of major collection channels among seven surveyed
categories of e-waste. This data is specific to e-waste items being discarded through the
available e-waste collection channels and excludes the items being transferred, dumped or
stockpiled by households.
Figure 7-9: Market share of major collection channels among seven surveyed categories of e-waste
Note: other channels include selling on-line, take-back by producers/formal collection companies and returning to collection bins; Data source from Figure 7-2 in this study
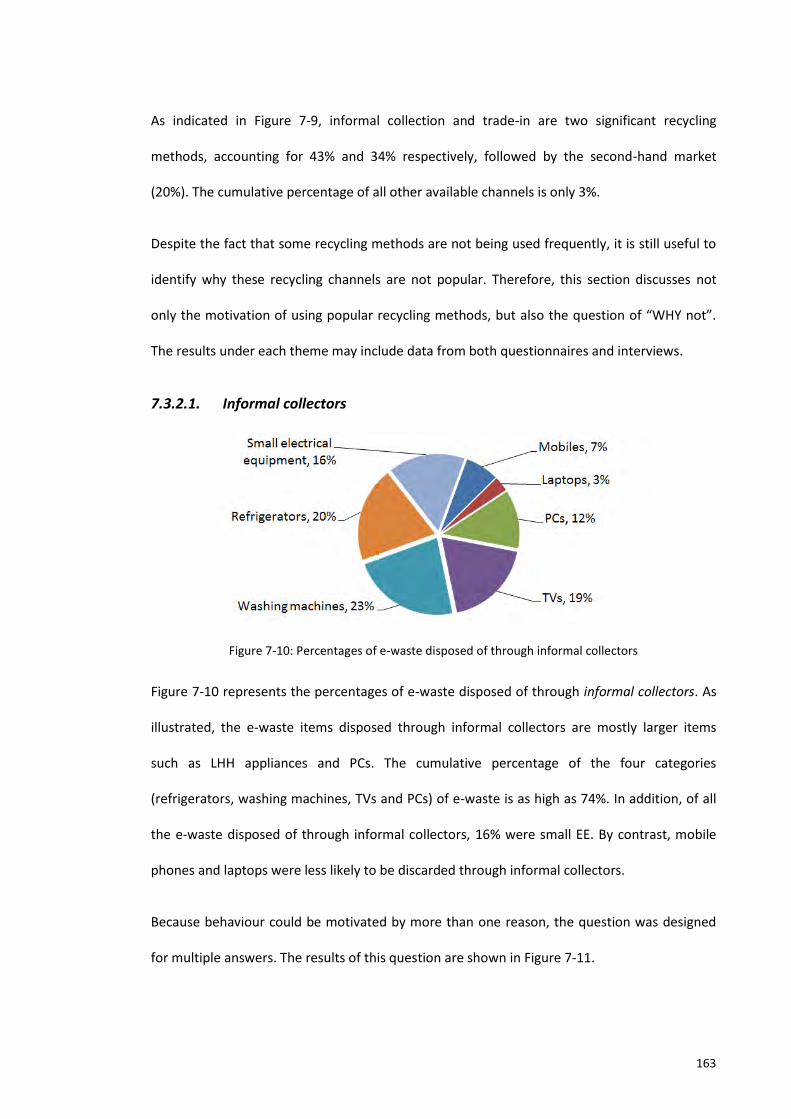
163
As indicated in Figure 7-9, informal collection and trade-in are two significant recycling
methods, accounting for 43% and 34% respectively, followed by the second-hand market
(20%). The cumulative percentage of all other available channels is only 3%.
Despite the fact that some recycling methods are not being used frequently, it is still useful to
identify why these recycling channels are not popular. Therefore, this section discusses not
only the motivation of using popular recycling methods, but also the question of “WHY not”.
The results under each theme may include data from both questionnaires and interviews.
7.3.2.1. Informal collectors
Figure 7-10: Percentages of e-waste disposed of through informal collectors
Figure 7-10 represents the percentages of e-waste disposed of through informal collectors. As
illustrated, the e-waste items disposed through informal collectors are mostly larger items
such as LHH appliances and PCs. The cumulative percentage of the four categories
(refrigerators, washing machines, TVs and PCs) of e-waste is as high as 74%. In addition, of all
the e-waste disposed of through informal collectors, 16% were small EE. By contrast, mobile
phones and laptops were less likely to be discarded through informal collectors.
Because behaviour could be motivated by more than one reason, the question was designed
for multiple answers. The results of this question are shown in Figure 7-11.
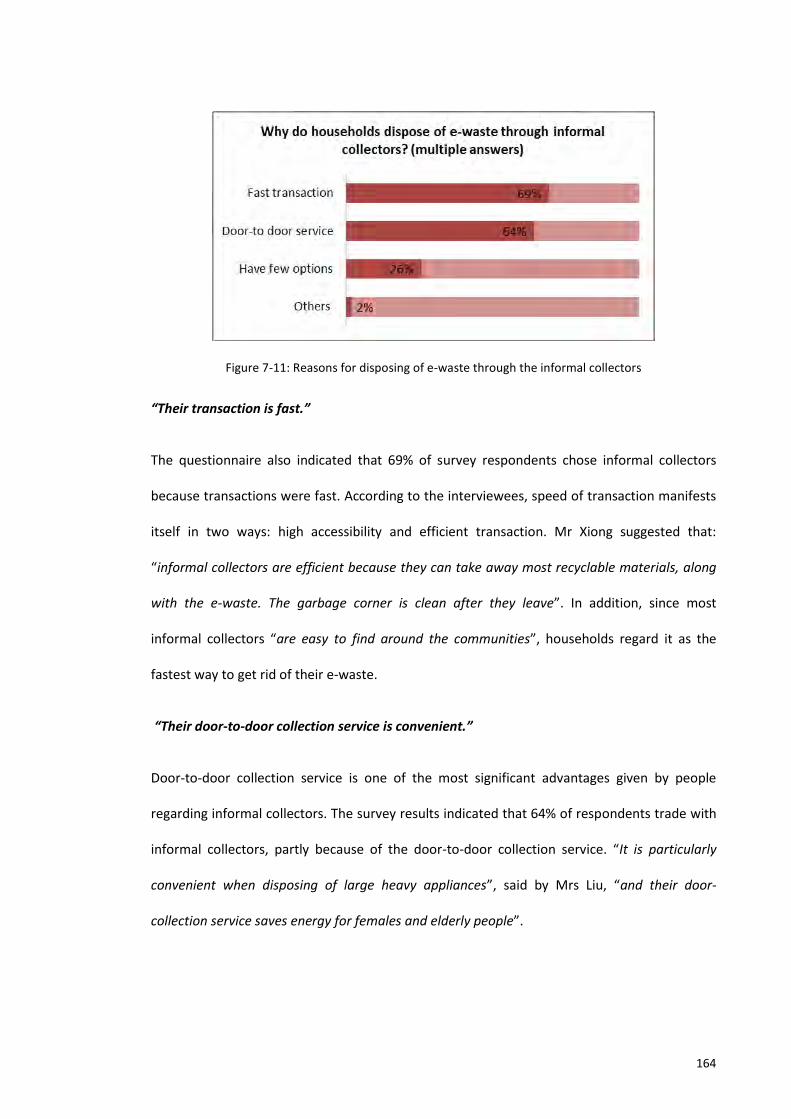
164
Figure 7-11: Reasons for disposing of e-waste through the informal collectors
“Their transaction is fast.”
The questionnaire also indicated that 69% of survey respondents chose informal collectors
because transactions were fast. According to the interviewees, speed of transaction manifests
itself in two ways: high accessibility and efficient transaction. Mr Xiong suggested that:
“informal collectors are efficient because they can take away most recyclable materials, along
with the e-waste. The garbage corner is clean after they leave”. In addition, since most
informal collectors “are easy to find around the communities”, households regard it as the
fastest way to get rid of their e-waste.
“Their door-to-door collection service is convenient.”
Door-to-door collection service is one of the most significant advantages given by people
regarding informal collectors. The survey results indicated that 64% of respondents trade with
informal collectors, partly because of the door-to-door collection service. “It is particularly
convenient when disposing of large heavy appliances”, said by Mrs Liu, “and their door-
collection service saves energy for females and elderly people”.
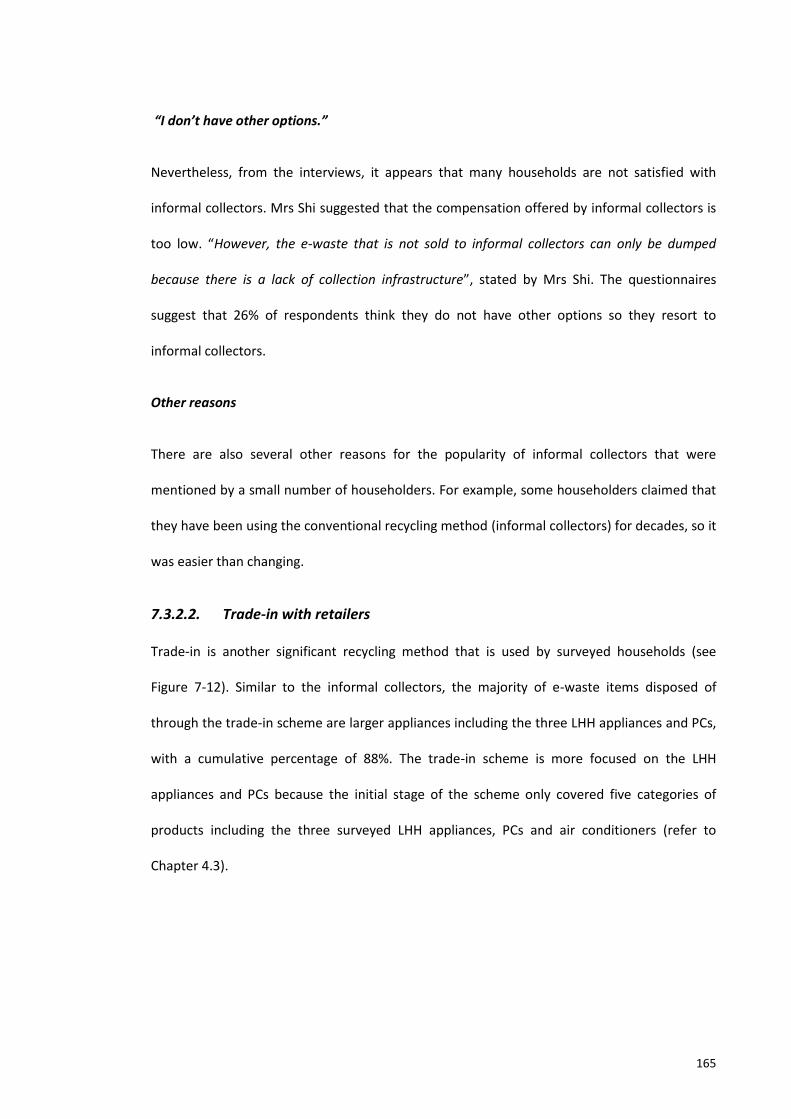
165
“I don’t have other options.”
Nevertheless, from the interviews, it appears that many households are not satisfied with
informal collectors. Mrs Shi suggested that the compensation offered by informal collectors is
too low. “However, the e-waste that is not sold to informal collectors can only be dumped
because there is a lack of collection infrastructure”, stated by Mrs Shi. The questionnaires
suggest that 26% of respondents think they do not have other options so they resort to
informal collectors.
Other reasons
There are also several other reasons for the popularity of informal collectors that were
mentioned by a small number of householders. For example, some householders claimed that
they have been using the conventional recycling method (informal collectors) for decades, so it
was easier than changing.
7.3.2.2. Trade-in with retailers
Trade-in is another significant recycling method that is used by surveyed households (see
Figure 7-12). Similar to the informal collectors, the majority of e-waste items disposed of
through the trade-in scheme are larger appliances including the three LHH appliances and PCs,
with a cumulative percentage of 88%. The trade-in scheme is more focused on the LHH
appliances and PCs because the initial stage of the scheme only covered five categories of
products including the three surveyed LHH appliances, PCs and air conditioners (refer to
Chapter 4.3).
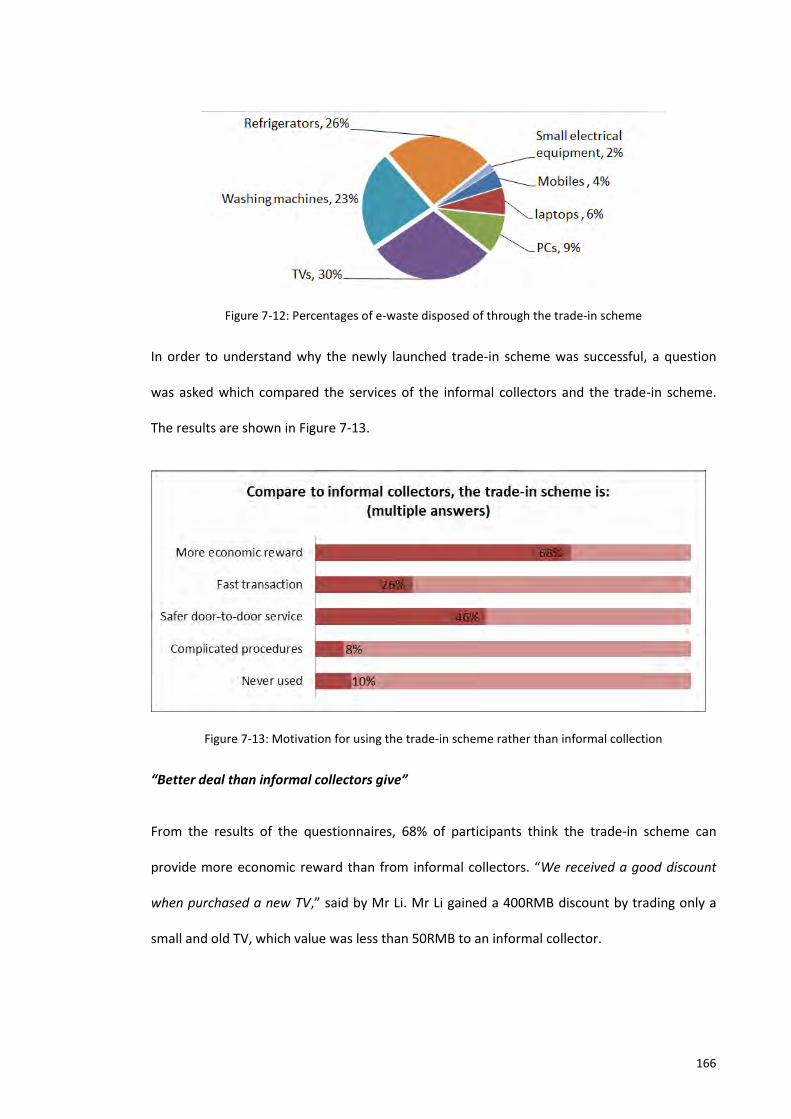
166
Figure 7-12: Percentages of e-waste disposed of through the trade-in scheme
In order to understand why the newly launched trade-in scheme was successful, a question
was asked which compared the services of the informal collectors and the trade-in scheme.
The results are shown in Figure 7-13.
Figure 7-13: Motivation for using the trade-in scheme rather than informal collection
“Better deal than informal collectors give”
From the results of the questionnaires, 68% of participants think the trade-in scheme can
provide more economic reward than from informal collectors. “We received a good discount
when purchased a new TV,” said by Mr Li. Mr Li gained a 400RMB discount by trading only a
small and old TV, which value was less than 50RMB to an informal collector.
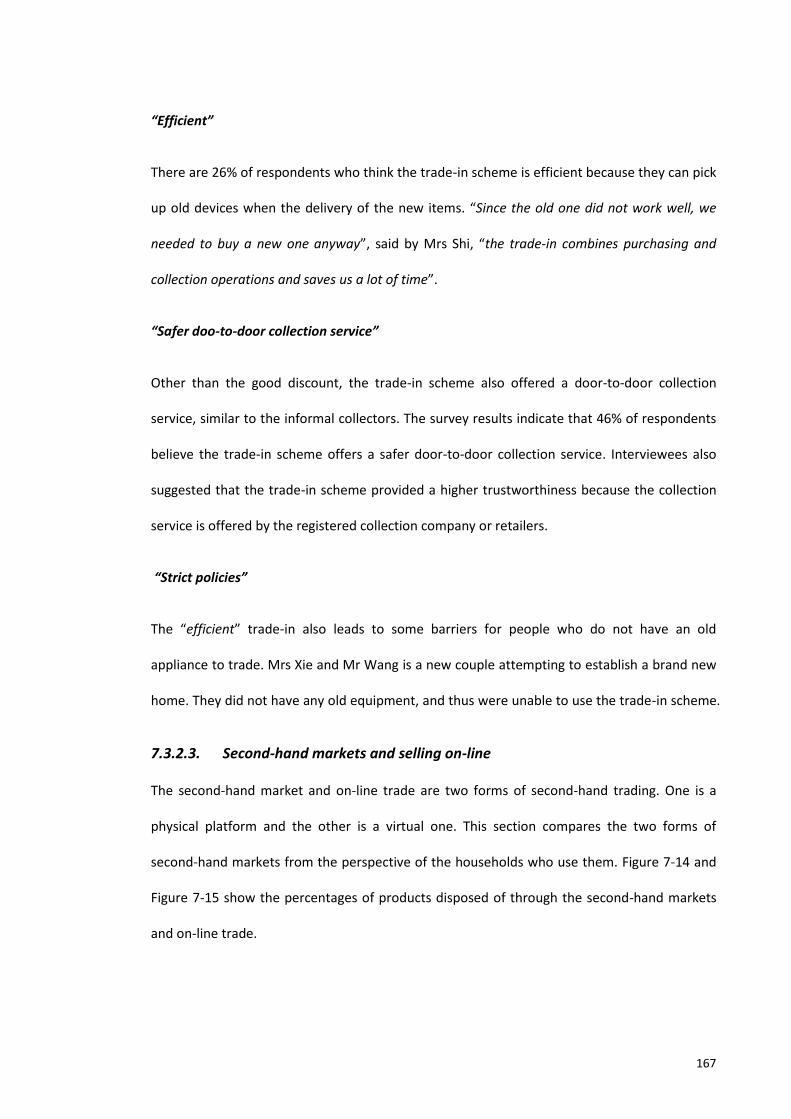
167
“Efficient”
There are 26% of respondents who think the trade-in scheme is efficient because they can pick
up old devices when the delivery of the new items. “Since the old one did not work well, we
needed to buy a new one anyway”, said by Mrs Shi, “the trade-in combines purchasing and
collection operations and saves us a lot of time”.
“Safer doo-to-door collection service”
Other than the good discount, the trade-in scheme also offered a door-to-door collection
service, similar to the informal collectors. The survey results indicate that 46% of respondents
believe the trade-in scheme offers a safer door-to-door collection service. Interviewees also
suggested that the trade-in scheme provided a higher trustworthiness because the collection
service is offered by the registered collection company or retailers.
“Strict policies”
The “efficient” trade-in also leads to some barriers for people who do not have an old
appliance to trade. Mrs Xie and Mr Wang is a new couple attempting to establish a brand new
home. They did not have any old equipment, and thus were unable to use the trade-in scheme.
7.3.2.3. Second-hand markets and selling on-line
The second-hand market and on-line trade are two forms of second-hand trading. One is a
physical platform and the other is a virtual one. This section compares the two forms of
second-hand markets from the perspective of the households who use them. Figure 7-14 and
Figure 7-15 show the percentages of products disposed of through the second-hand markets
and on-line trade.
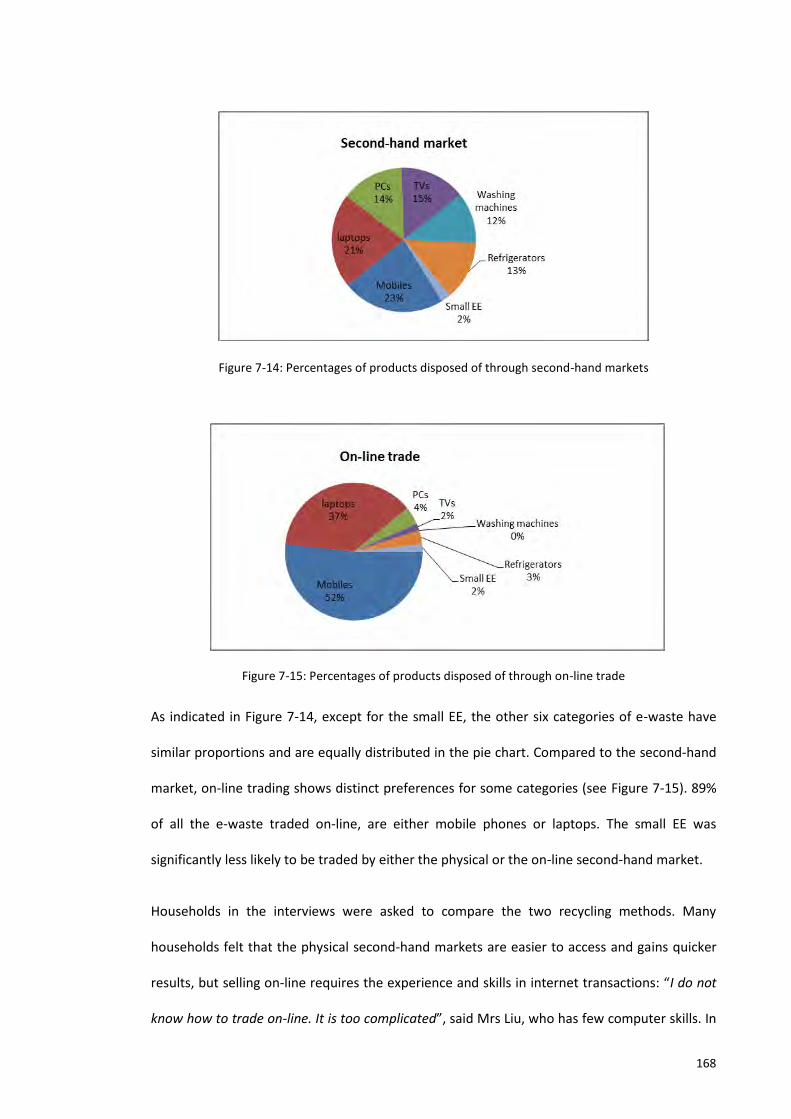
168
Figure 7-14: Percentages of products disposed of through second-hand markets
Figure 7-15: Percentages of products disposed of through on-line trade
As indicated in Figure 7-14, except for the small EE, the other six categories of e-waste have
similar proportions and are equally distributed in the pie chart. Compared to the second-hand
market, on-line trading shows distinct preferences for some categories (see Figure 7-15). 89%
of all the e-waste traded on-line, are either mobile phones or laptops. The small EE was
significantly less likely to be traded by either the physical or the on-line second-hand market.
Households in the interviews were asked to compare the two recycling methods. Many
households felt that the physical second-hand markets are easier to access and gains quicker
results, but selling on-line requires the experience and skills in internet transactions: “I do not
know how to trade on-line. It is too complicated”, said Mrs Liu, who has few computer skills. In
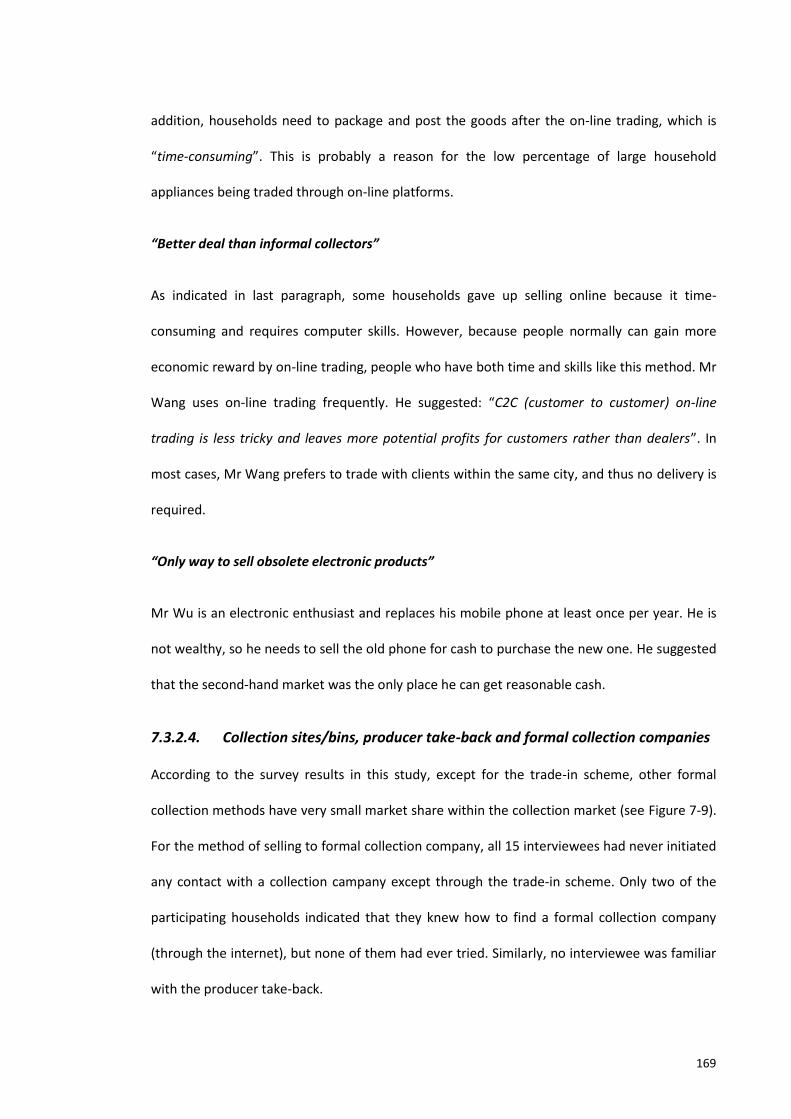
169
addition, households need to package and post the goods after the on-line trading, which is
“time-consuming”. This is probably a reason for the low percentage of large household
appliances being traded through on-line platforms.
“Better deal than informal collectors”
As indicated in last paragraph, some households gave up selling online because it time-
consuming and requires computer skills. However, because people normally can gain more
economic reward by on-line trading, people who have both time and skills like this method. Mr
Wang uses on-line trading frequently. He suggested: “C2C (customer to customer) on-line
trading is less tricky and leaves more potential profits for customers rather than dealers”. In
most cases, Mr Wang prefers to trade with clients within the same city, and thus no delivery is
required.
“Only way to sell obsolete electronic products”
Mr Wu is an electronic enthusiast and replaces his mobile phone at least once per year. He is
not wealthy, so he needs to sell the old phone for cash to purchase the new one. He suggested
that the second-hand market was the only place he can get reasonable cash.
7.3.2.4. Collection sites/bins, producer take-back and formal collection companies
According to the survey results in this study, except for the trade-in scheme, other formal
collection methods have very small market share within the collection market (see Figure 7-9).
For the method of selling to formal collection company, all 15 interviewees had never initiated
any contact with a collection campany except through the trade-in scheme. Only two of the
participating households indicated that they knew how to find a formal collection company
(through the internet), but none of them had ever tried. Similarly, no interviewee was familiar
with the producer take-back.
170
Of all the participants in the interviews, only the households from Shanghai and Beijing could
access the e-waste collection sites. The householders from Tianjin and Xi’an had no access to
the collection sites or hazardous waste collection bins because they do not exist in these cities.
From observation, the WEEE recycling infrastructure in the four case study cities is relatively
well developed in Shanghai. Municipal waste in Shanghai is sorted into four categories: glass,
recyclable waste (papers, plastics, metals and clothes), hazardous waste (includes old battery,
flurescent lamps, painting cans, out of date drugs etc) and other waste (kitchen garbage,
diapers, and soil). The category of the “hazardous waste" can be used to dispose of a range of
items that are harmful to the environment. Figure 7-16 illustrates the four categories of waste
sorting in Shanghai.
Figure 7-16: Waste recycling categories in Shanghai’s communities
Mr Wu, a householder from Shanghai, suggested that in order to encourage the adoption of
the newly launched segregated rubbish project, municipal departments had freely distributed
sorting bins to the families in his community. Figure 7-17 shows the garbage bins for collecting
glass (green), recyclables (blue) and hazardous waste (red) in a community in Shanghai. The
second photograph shows hazardous waste deposited in the appropriate bin. As can be seen in
the photo, most e-waste items collected in the hazardous waste bin are batteries and lamps,
most of which cannot be sold to informal collectors. Other than household batteries, it was
difficult to see any other e-waste in the bins, not to mention valuable materials.
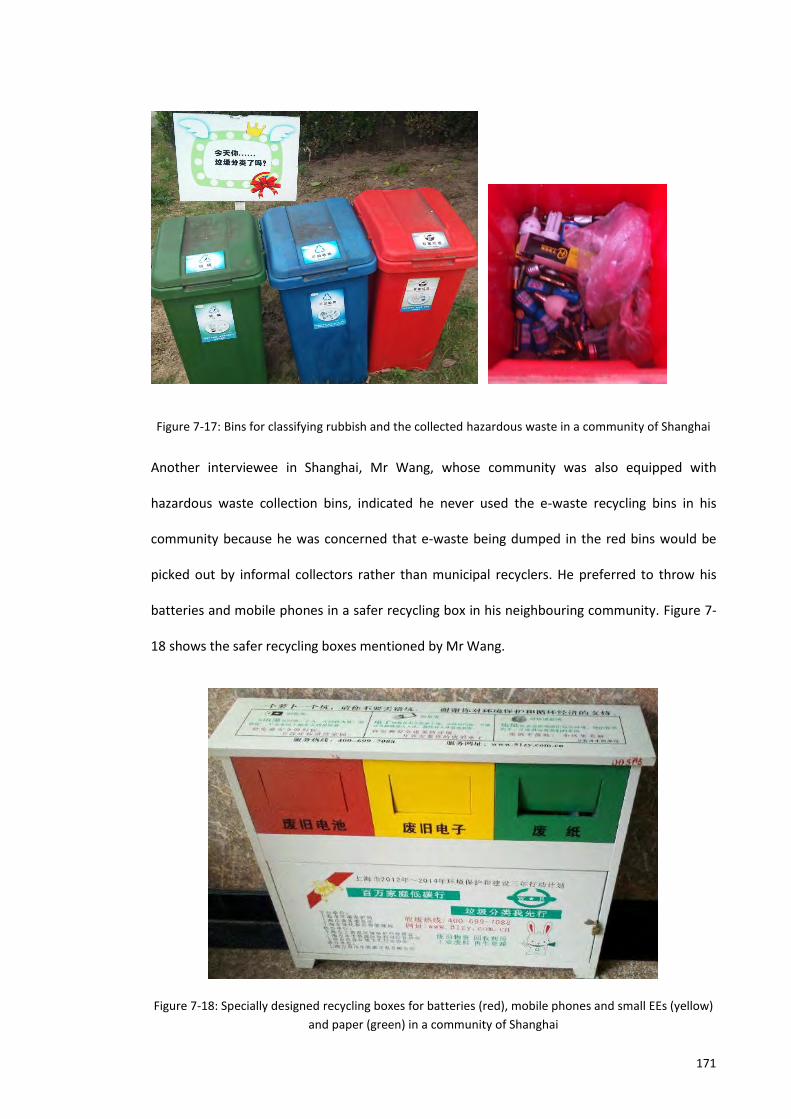
171
Figure 7-17: Bins for classifying rubbish and the collected hazardous waste in a community of Shanghai
Another interviewee in Shanghai, Mr Wang, whose community was also equipped with
hazardous waste collection bins, indicated he never used the e-waste recycling bins in his
community because he was concerned that e-waste being dumped in the red bins would be
picked out by informal collectors rather than municipal recyclers. He preferred to throw his
batteries and mobile phones in a safer recycling box in his neighbouring community. Figure 7-
18 shows the safer recycling boxes mentioned by Mr Wang.
Figure 7-18: Specially designed recycling boxes for batteries (red), mobile phones and small EEs (yellow)
and paper (green) in a community of Shanghai
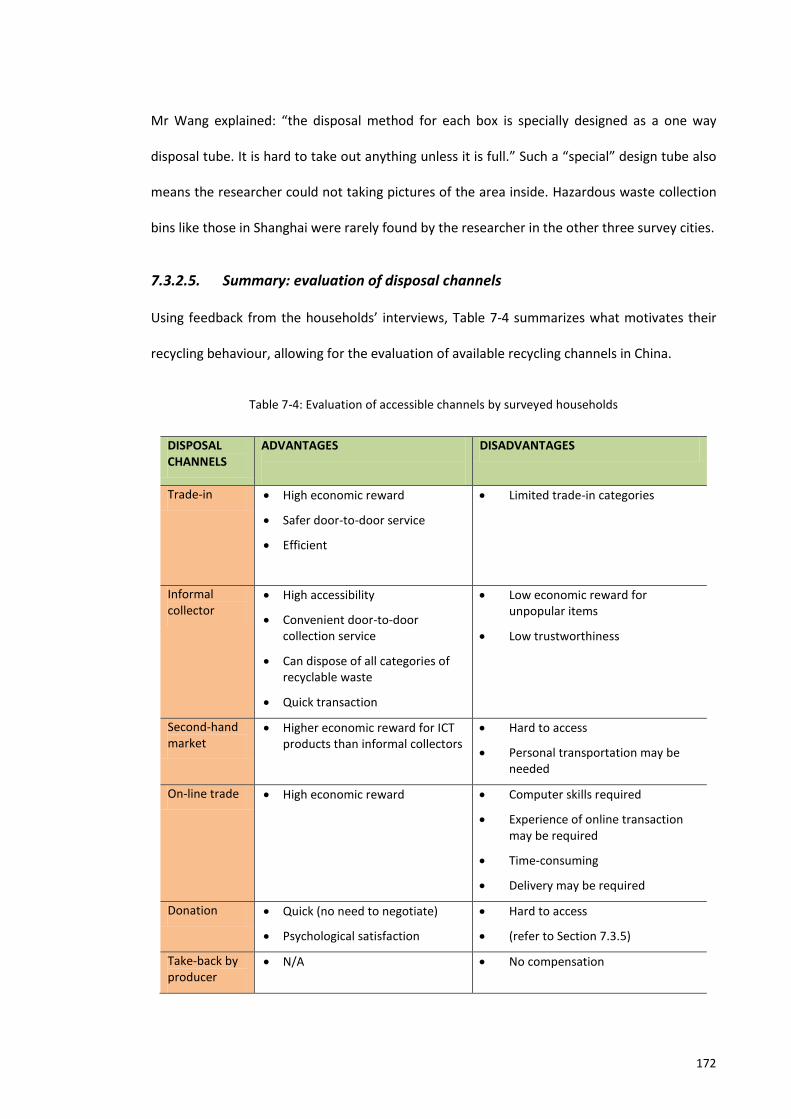
172
Mr Wang explained: “the disposal method for each box is specially designed as a one way
disposal tube. It is hard to take out anything unless it is full.” Such a “special” design tube also
means the researcher could not taking pictures of the area inside. Hazardous waste collection
bins like those in Shanghai were rarely found by the researcher in the other three survey cities.
7.3.2.5. Summary: evaluation of disposal channels
Using feedback from the households’ interviews, Table 7-4 summarizes what motivates their
recycling behaviour, allowing for the evaluation of available recycling channels in China.
Table 7-4: Evaluation of accessible channels by surveyed households
DISPOSAL CHANNELS
ADVANTAGES
DISADVANTAGES
Trade-in High economic reward
Safer door-to-door service
Efficient
Limited trade-in categories
Informal collector
High accessibility
Convenient door-to-door collection service
Can dispose of all categories of recyclable waste
Quick transaction
Low economic reward for unpopular items
Low trustworthiness
Second-hand market
Higher economic reward for ICT products than informal collectors
Hard to access
Personal transportation may be needed
On-line trade High economic reward Computer skills required
Experience of online transaction may be required
Time-consuming
Delivery may be required
Donation Quick (no need to negotiate)
Psychological satisfaction
Hard to access
(refer to Section 7.3.5)
Take-back by producer
N/A No compensation
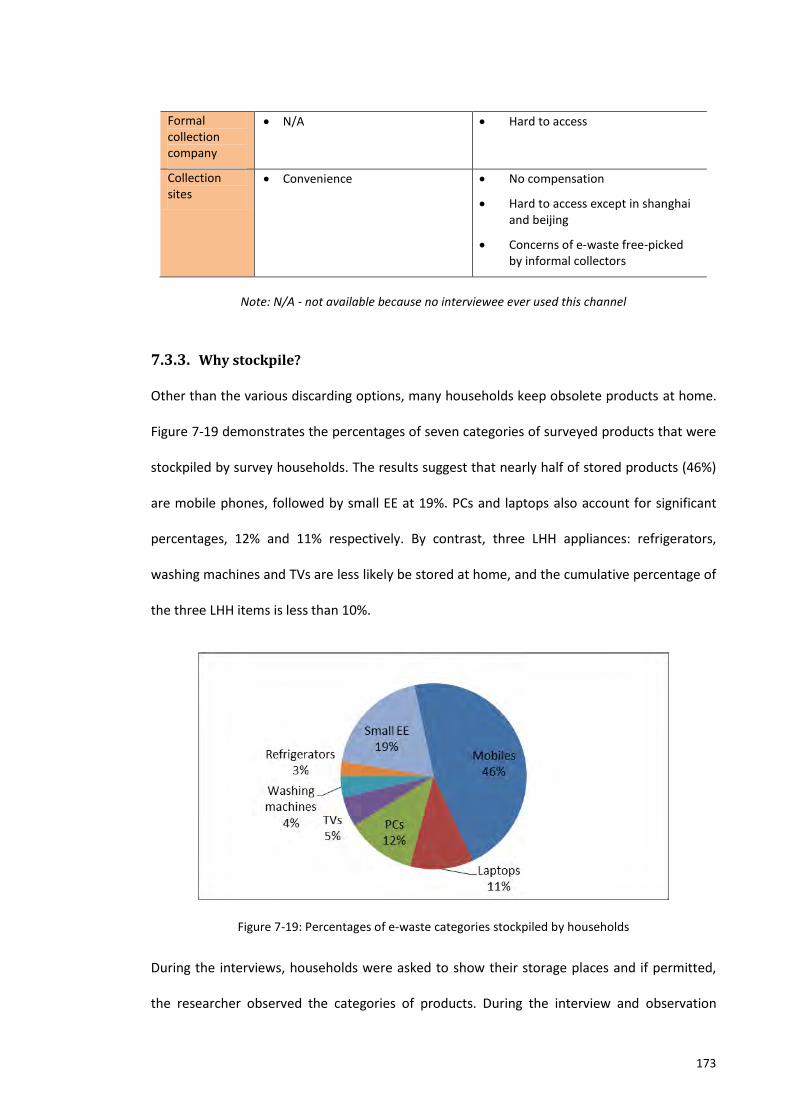
173
Formal collection company
N/A Hard to access
Collection sites
Convenience No compensation
Hard to access except in shanghai and beijing
Concerns of e-waste free-picked by informal collectors
Note: N/A - not available because no interviewee ever used this channel
7.3.3. Why stockpile?
Other than the various discarding options, many households keep obsolete products at home.
Figure 7-19 demonstrates the percentages of seven categories of surveyed products that were
stockpiled by survey households. The results suggest that nearly half of stored products (46%)
are mobile phones, followed by small EE at 19%. PCs and laptops also account for significant
percentages, 12% and 11% respectively. By contrast, three LHH appliances: refrigerators,
washing machines and TVs are less likely be stored at home, and the cumulative percentage of
the three LHH items is less than 10%.
Figure 7-19: Percentages of e-waste categories stockpiled by households
During the interviews, households were asked to show their storage places and if permitted,
the researcher observed the categories of products. During the interview and observation
174
process, reasons for stockpiling were also examined. From the results of the interviews and the
researcher’s observations, it is also apparent that a wide range of other products are kept at
home, including portable electronics (e.g. Walkman, beepers, CD players and radios), electrical
toys, leisure/sport equipment (e.g. foot spas), and cabling/accessories for e-products.
These products were placed everywhere around the household since most Chinese families do
not have a purpose-designed storage space in a spare room. The location for keeping these
obsolete products mainly depended on the size of the products. For example, smaller products
such as radios, mobile phones, CD players, and all kinds of power accessories are normally kept
in closets, drawers or cabinets. Small-medium size appliances such as cooking equipment,
leisure equipment, and toys are located in unobvious areas, such as on top of furniture, under
bedsteads, or behind sofas. The storage areas for large appliances do not seem to follow a
pattern. Figure 7-20 illustrates various categories of e-waste kept by interviewed households.
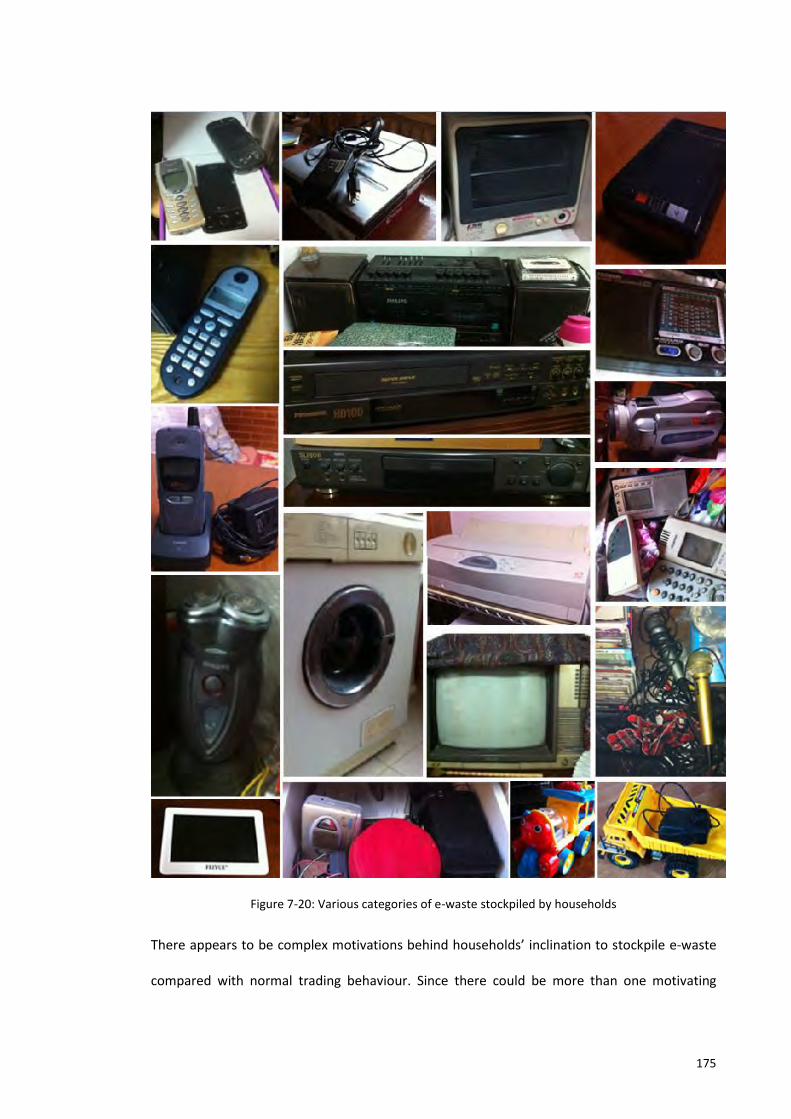
175
Figure 7-20: Various categories of e-waste stockpiled by households
There appears to be complex motivations behind households’ inclination to stockpile e-waste
compared with normal trading behaviour. Since there could be more than one motivating
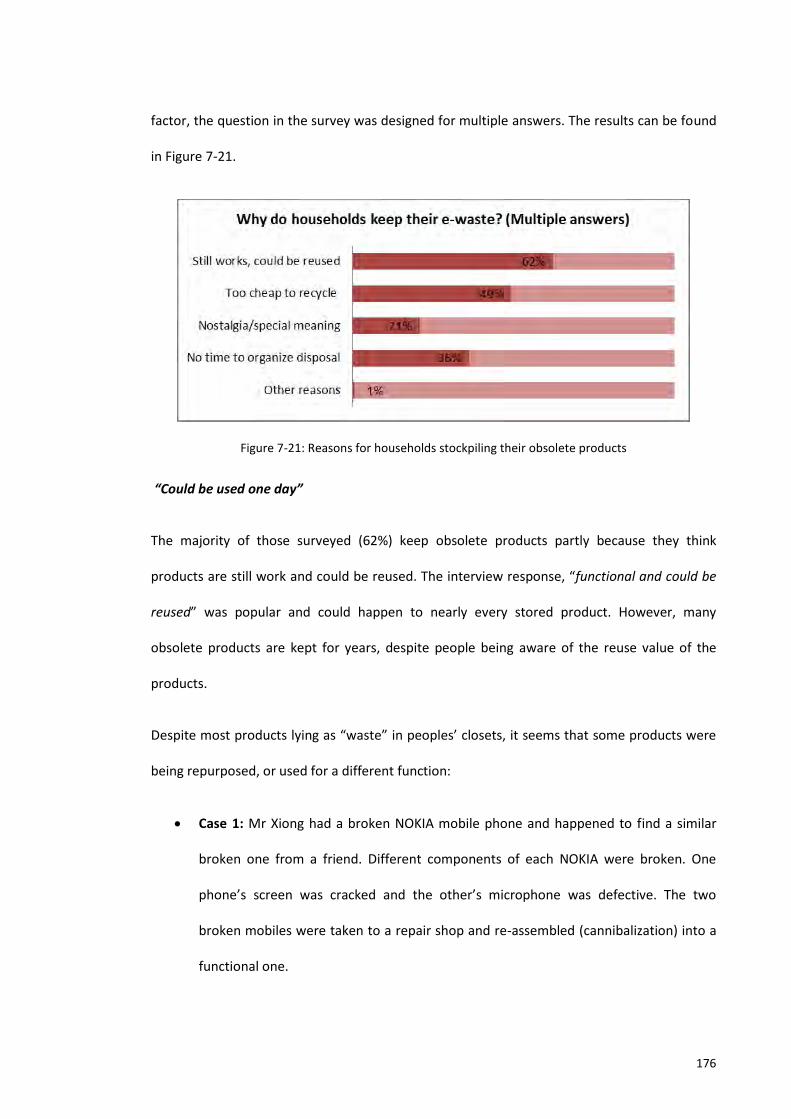
176
factor, the question in the survey was designed for multiple answers. The results can be found
in Figure 7-21.
Figure 7-21: Reasons for households stockpiling their obsolete products
“Could be used one day”
The majority of those surveyed (62%) keep obsolete products partly because they think
products are still work and could be reused. The interview response, “functional and could be
reused” was popular and could happen to nearly every stored product. However, many
obsolete products are kept for years, despite people being aware of the reuse value of the
products.
Despite most products lying as “waste” in peoples’ closets, it seems that some products were
being repurposed, or used for a different function:
Case 1: Mr Xiong had a broken NOKIA mobile phone and happened to find a similar
broken one from a friend. Different components of each NOKIA were broken. One
phone’s screen was cracked and the other’s microphone was defective. The two
broken mobiles were taken to a repair shop and re-assembled (cannibalization) into a
functional one.
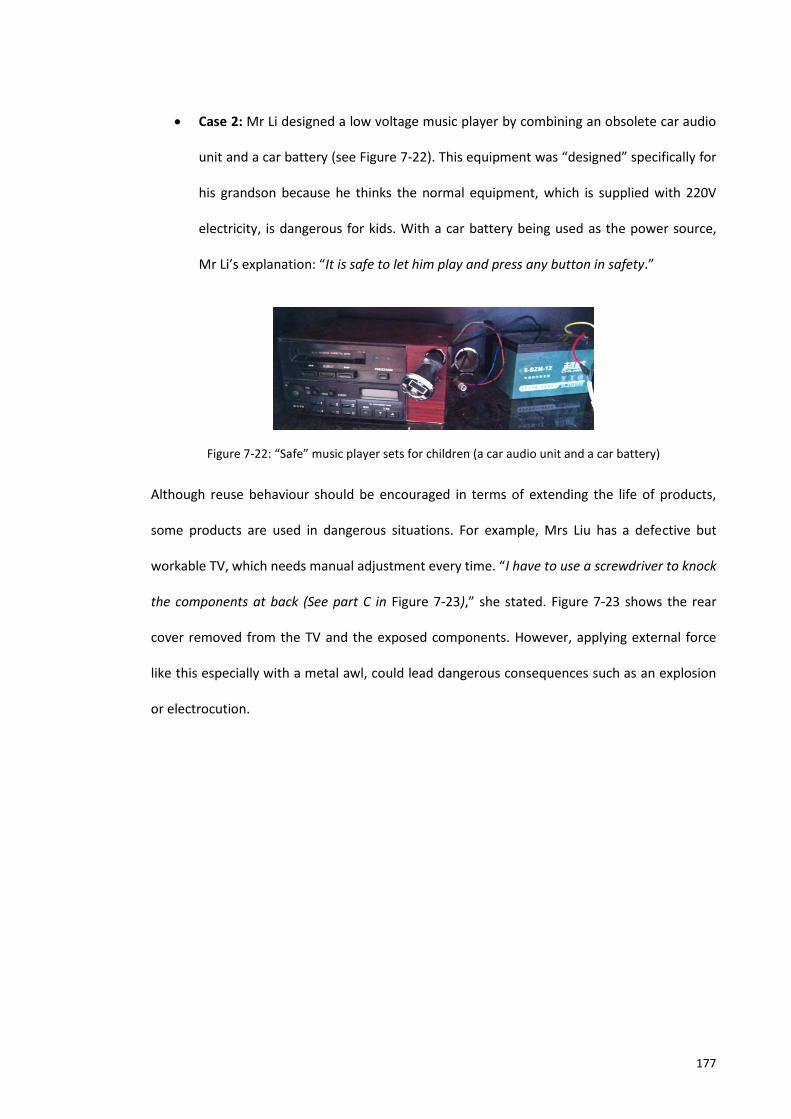
177
Case 2: Mr Li designed a low voltage music player by combining an obsolete car audio
unit and a car battery (see Figure 7-22). This equipment was “designed” specifically for
his grandson because he thinks the normal equipment, which is supplied with 220V
electricity, is dangerous for kids. With a car battery being used as the power source,
Mr Li’s explanation: “It is safe to let him play and press any button in safety.”
Figure 7-22: “Safe” music player sets for children (a car audio unit and a car battery)
Although reuse behaviour should be encouraged in terms of extending the life of products,
some products are used in dangerous situations. For example, Mrs Liu has a defective but
workable TV, which needs manual adjustment every time. “I have to use a screwdriver to knock
the components at back (See part C in Figure 7-23),” she stated. Figure 7-23 shows the rear
cover removed from the TV and the exposed components. However, applying external force
like this especially with a metal awl, could lead dangerous consequences such as an explosion
or electrocution.

178
Figure 7-23: A TV used in a dangerous condition
“Collectors offer too low price for unpopular items”
Responses to the questionnaire indicate that 49% of participants attribute their stockpiling
behaviour to low economic reward from current available trading methods. From the
interviews with households, the “low price” obtained mainly refers to disposing of those
unpopular items such as portable electronics and small EE. “They offer too low a price”, said
Mrs Xu, “two mobile phones for only 3 RMB (1USD=6.5 RMB).” However, because informal
collectors are the only group of collectors accepting the small EE, households do not have
many options. Due to low market demand, many households prefer to keep the e-waste if it is
convenient to store. Figure 7-24 illustrates a selection of small EE stockpiled in several
households. Most of them were small enough to keep in drawers.
A: A screwdriver for knocking
B: Detached TV
C: Electrical components
exposed in the air
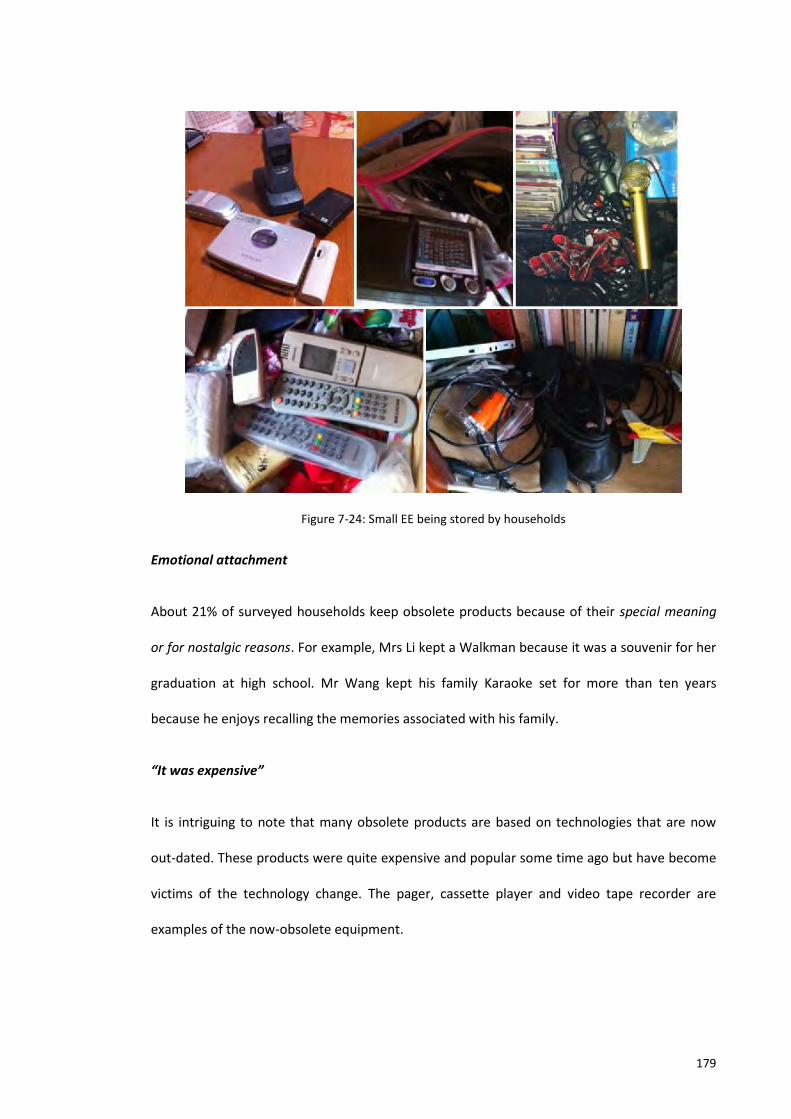
179
Figure 7-24: Small EE being stored by households
Emotional attachment
About 21% of surveyed households keep obsolete products because of their special meaning
or for nostalgic reasons. For example, Mrs Li kept a Walkman because it was a souvenir for her
graduation at high school. Mr Wang kept his family Karaoke set for more than ten years
because he enjoys recalling the memories associated with his family.
“It was expensive”
It is intriguing to note that many obsolete products are based on technologies that are now
out-dated. These products were quite expensive and popular some time ago but have become
victims of the technology change. The pager, cassette player and video tape recorder are
examples of the now-obsolete equipment.
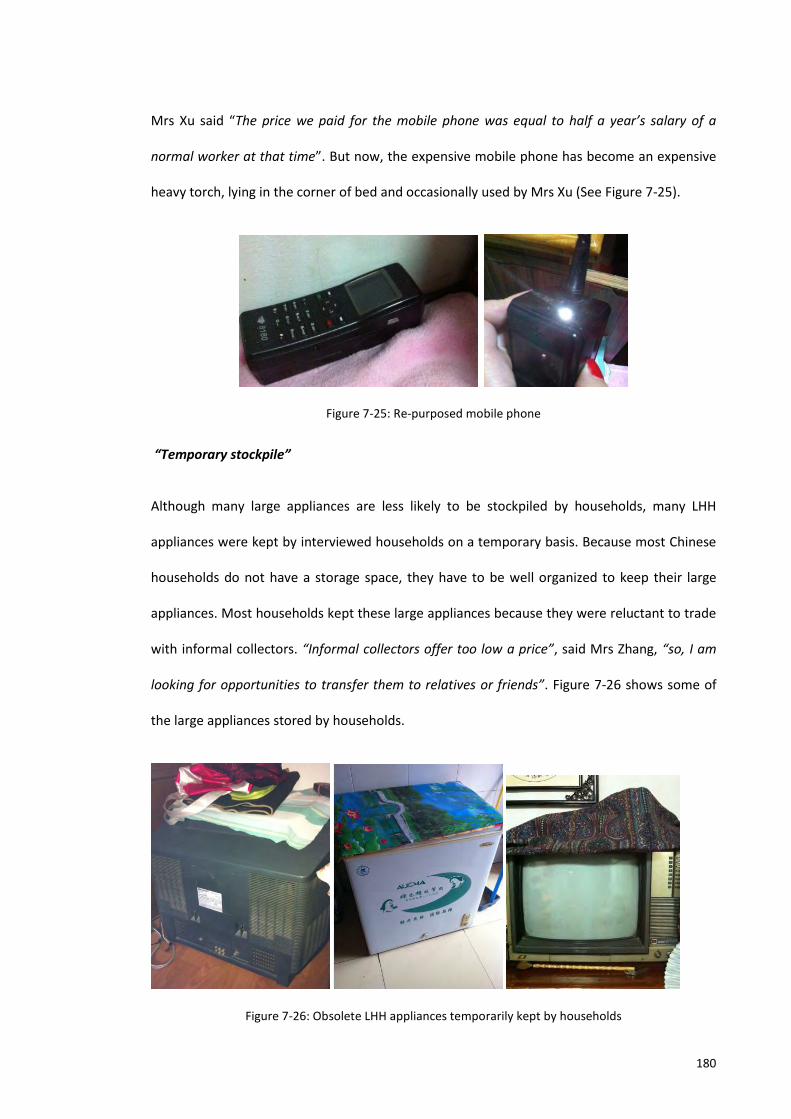
180
Mrs Xu said “The price we paid for the mobile phone was equal to half a year’s salary of a
normal worker at that time”. But now, the expensive mobile phone has become an expensive
heavy torch, lying in the corner of bed and occasionally used by Mrs Xu (See Figure 7-25).
Figure 7-25: Re-purposed mobile phone
“Temporary stockpile”
Although many large appliances are less likely to be stockpiled by households, many LHH
appliances were kept by interviewed households on a temporary basis. Because most Chinese
households do not have a storage space, they have to be well organized to keep their large
appliances. Most households kept these large appliances because they were reluctant to trade
with informal collectors. “Informal collectors offer too low a price”, said Mrs Zhang, “so, I am
looking for opportunities to transfer them to relatives or friends”. Figure 7-26 shows some of
the large appliances stored by households.
Figure 7-26: Obsolete LHH appliances temporarily kept by households
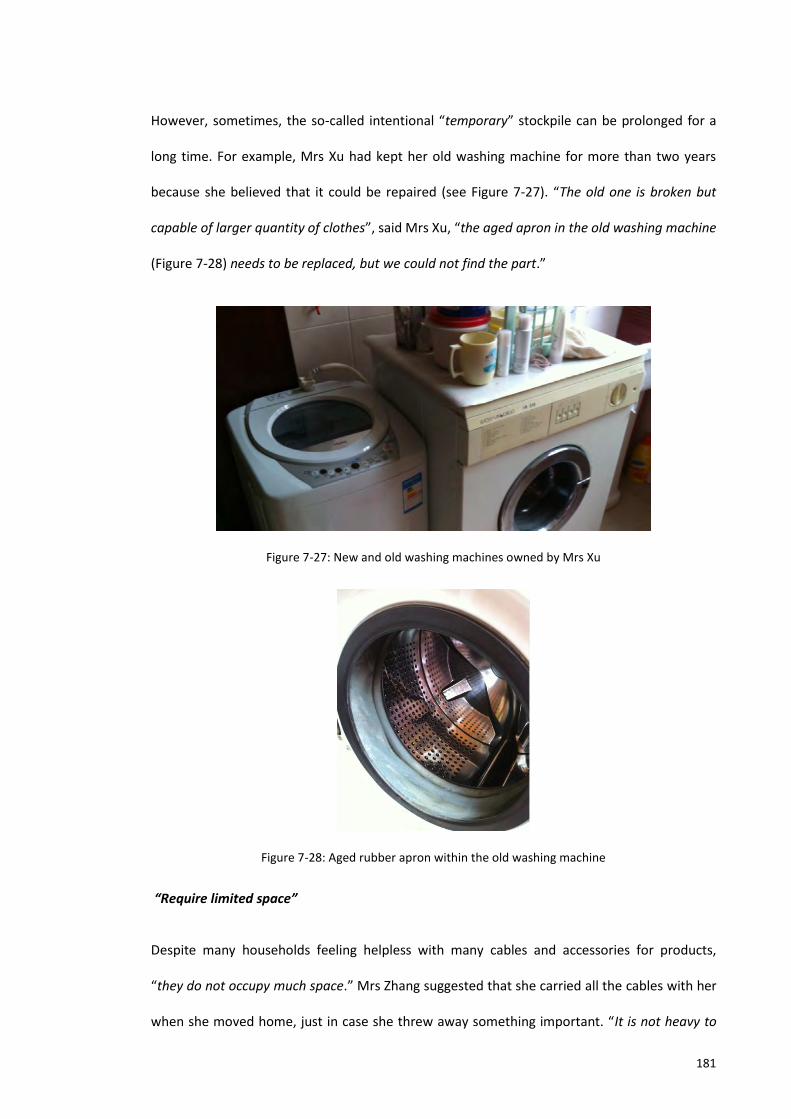
181
However, sometimes, the so-called intentional “temporary” stockpile can be prolonged for a
long time. For example, Mrs Xu had kept her old washing machine for more than two years
because she believed that it could be repaired (see Figure 7-27). “The old one is broken but
capable of larger quantity of clothes”, said Mrs Xu, “the aged apron in the old washing machine
(Figure 7-28) needs to be replaced, but we could not find the part.”
Figure 7-27: New and old washing machines owned by Mrs Xu
Figure 7-28: Aged rubber apron within the old washing machine
“Require limited space”
Despite many households feeling helpless with many cables and accessories for products,
“they do not occupy much space.” Mrs Zhang suggested that she carried all the cables with her
when she moved home, just in case she threw away something important. “It is not heavy to
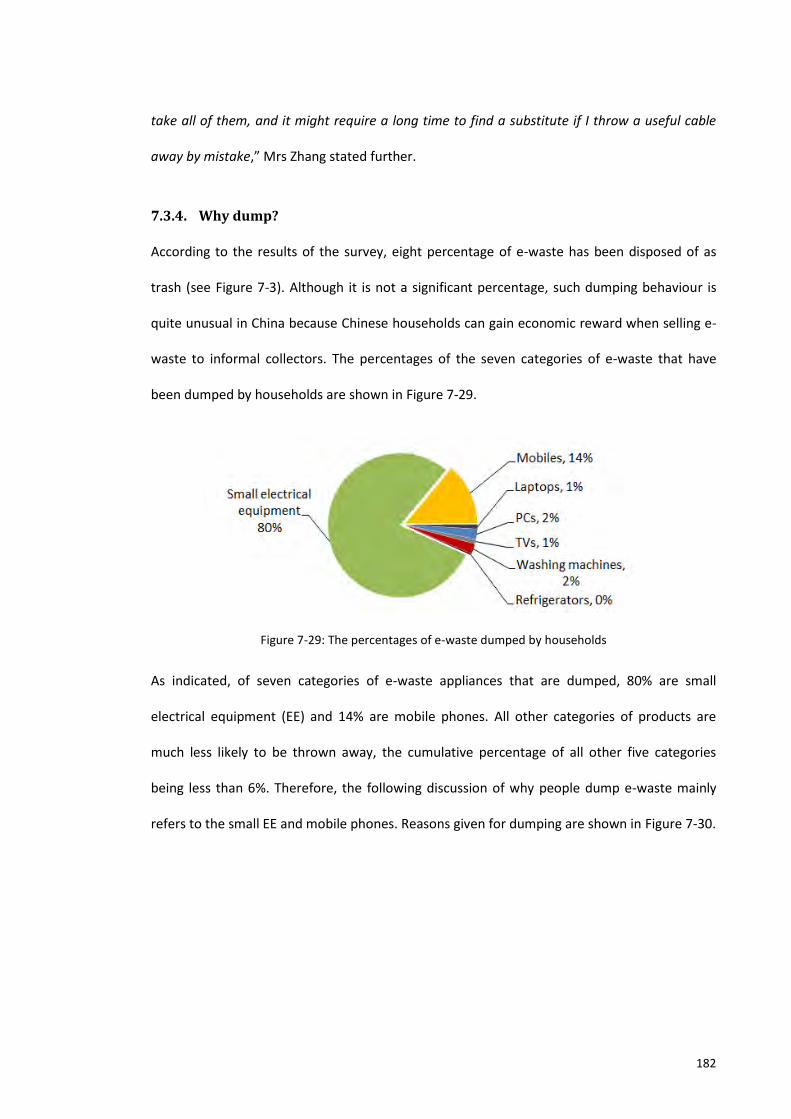
182
take all of them, and it might require a long time to find a substitute if I throw a useful cable
away by mistake,” Mrs Zhang stated further.
7.3.4. Why dump?
According to the results of the survey, eight percentage of e-waste has been disposed of as
trash (see Figure 7-3). Although it is not a significant percentage, such dumping behaviour is
quite unusual in China because Chinese households can gain economic reward when selling e-
waste to informal collectors. The percentages of the seven categories of e-waste that have
been dumped by households are shown in Figure 7-29.
Figure 7-29: The percentages of e-waste dumped by households
As indicated, of seven categories of e-waste appliances that are dumped, 80% are small
electrical equipment (EE) and 14% are mobile phones. All other categories of products are
much less likely to be thrown away, the cumulative percentage of all other five categories
being less than 6%. Therefore, the following discussion of why people dump e-waste mainly
refers to the small EE and mobile phones. Reasons given for dumping are shown in Figure 7-30.
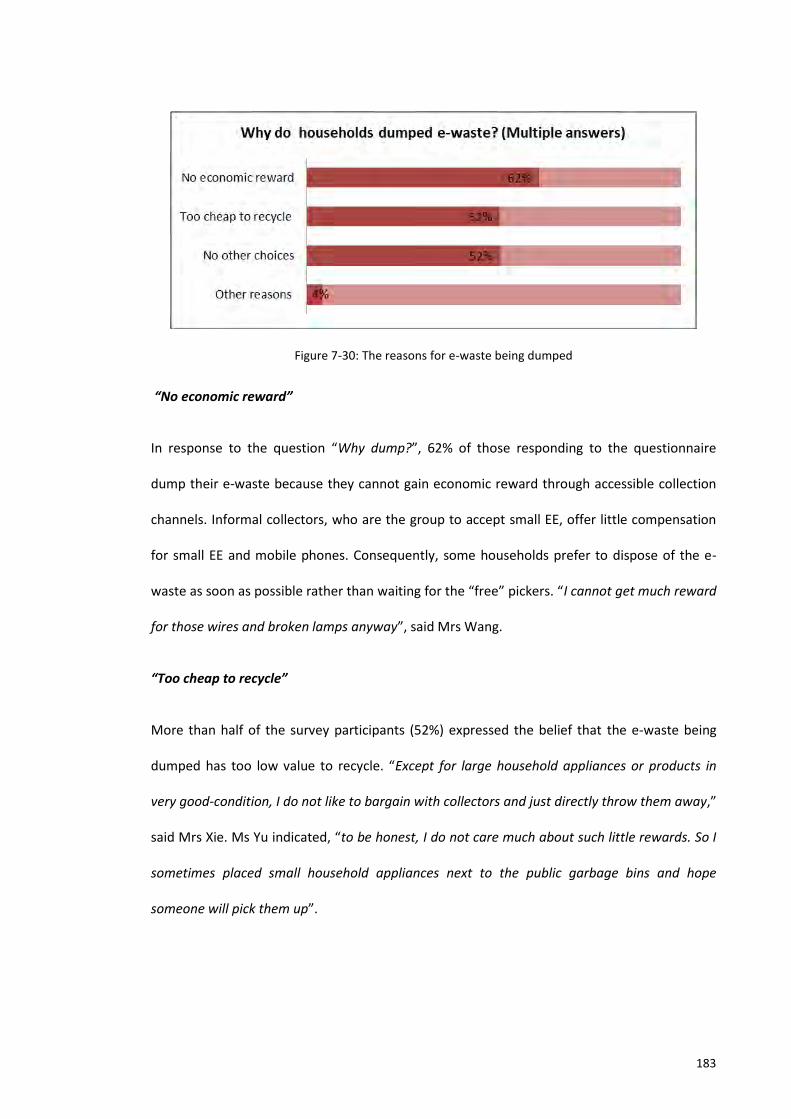
183
Figure 7-30: The reasons for e-waste being dumped
“No economic reward”
In response to the question “Why dump?”, 62% of those responding to the questionnaire
dump their e-waste because they cannot gain economic reward through accessible collection
channels. Informal collectors, who are the group to accept small EE, offer little compensation
for small EE and mobile phones. Consequently, some households prefer to dispose of the e-
waste as soon as possible rather than waiting for the “free” pickers. “I cannot get much reward
for those wires and broken lamps anyway”, said Mrs Wang.
“Too cheap to recycle”
More than half of the survey participants (52%) expressed the belief that the e-waste being
dumped has too low value to recycle. “Except for large household appliances or products in
very good-condition, I do not like to bargain with collectors and just directly throw them away,”
said Mrs Xie. Ms Yu indicated, “to be honest, I do not care much about such little rewards. So I
sometimes placed small household appliances next to the public garbage bins and hope
someone will pick them up”.
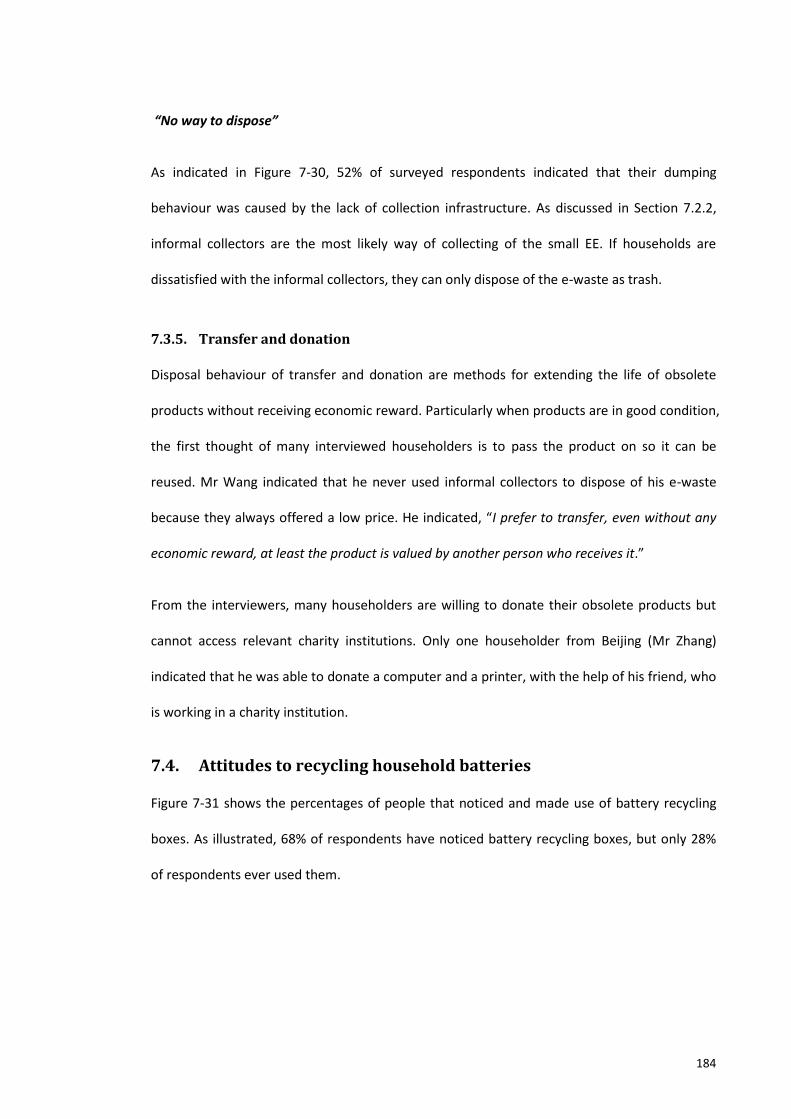
184
“No way to dispose”
As indicated in Figure 7-30, 52% of surveyed respondents indicated that their dumping
behaviour was caused by the lack of collection infrastructure. As discussed in Section 7.2.2,
informal collectors are the most likely way of collecting of the small EE. If households are
dissatisfied with the informal collectors, they can only dispose of the e-waste as trash.
7.3.5. Transfer and donation
Disposal behaviour of transfer and donation are methods for extending the life of obsolete
products without receiving economic reward. Particularly when products are in good condition,
the first thought of many interviewed householders is to pass the product on so it can be
reused. Mr Wang indicated that he never used informal collectors to dispose of his e-waste
because they always offered a low price. He indicated, “I prefer to transfer, even without any
economic reward, at least the product is valued by another person who receives it.”
From the interviewers, many householders are willing to donate their obsolete products but
cannot access relevant charity institutions. Only one householder from Beijing (Mr Zhang)
indicated that he was able to donate a computer and a printer, with the help of his friend, who
is working in a charity institution.
7.4. Attitudes to recycling household batteries
Figure 7-31 shows the percentages of people that noticed and made use of battery recycling
boxes. As illustrated, 68% of respondents have noticed battery recycling boxes, but only 28%
of respondents ever used them.
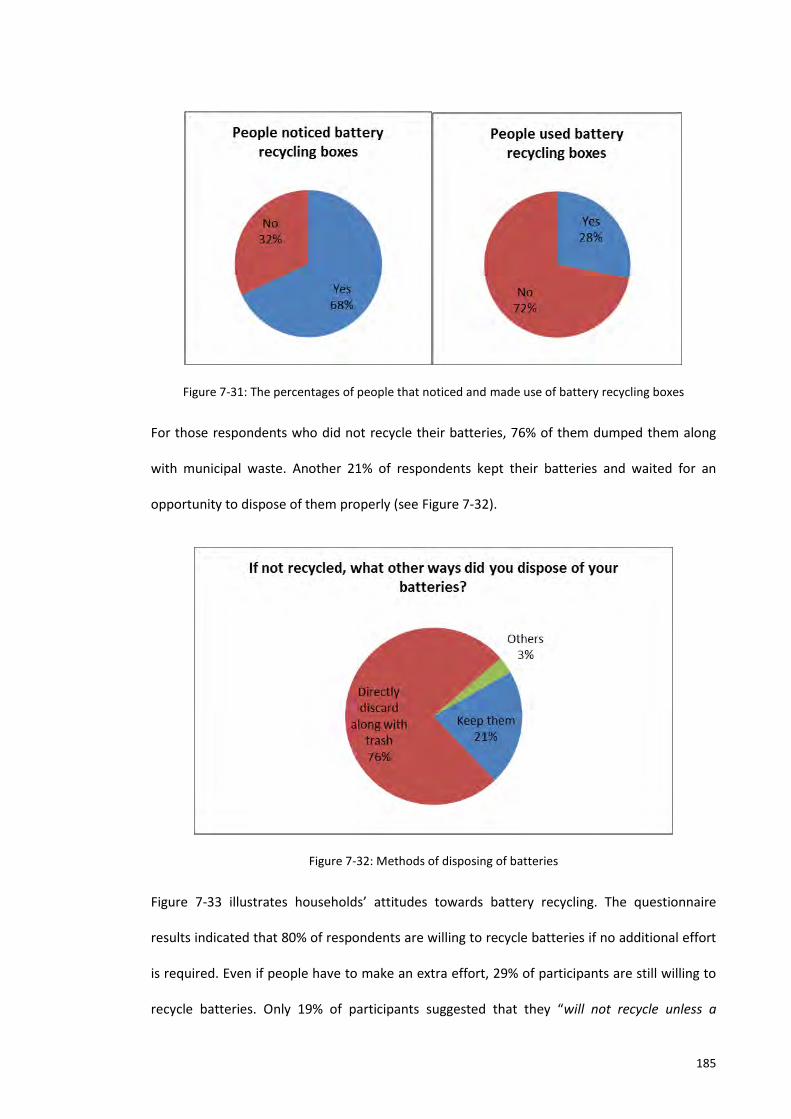
185
Figure 7-31: The percentages of people that noticed and made use of battery recycling boxes
For those respondents who did not recycle their batteries, 76% of them dumped them along
with municipal waste. Another 21% of respondents kept their batteries and waited for an
opportunity to dispose of them properly (see Figure 7-32).
Figure 7-32: Methods of disposing of batteries
Figure 7-33 illustrates households’ attitudes towards battery recycling. The questionnaire
results indicated that 80% of respondents are willing to recycle batteries if no additional effort
is required. Even if people have to make an extra effort, 29% of participants are still willing to
recycle batteries. Only 19% of participants suggested that they “will not recycle unless a
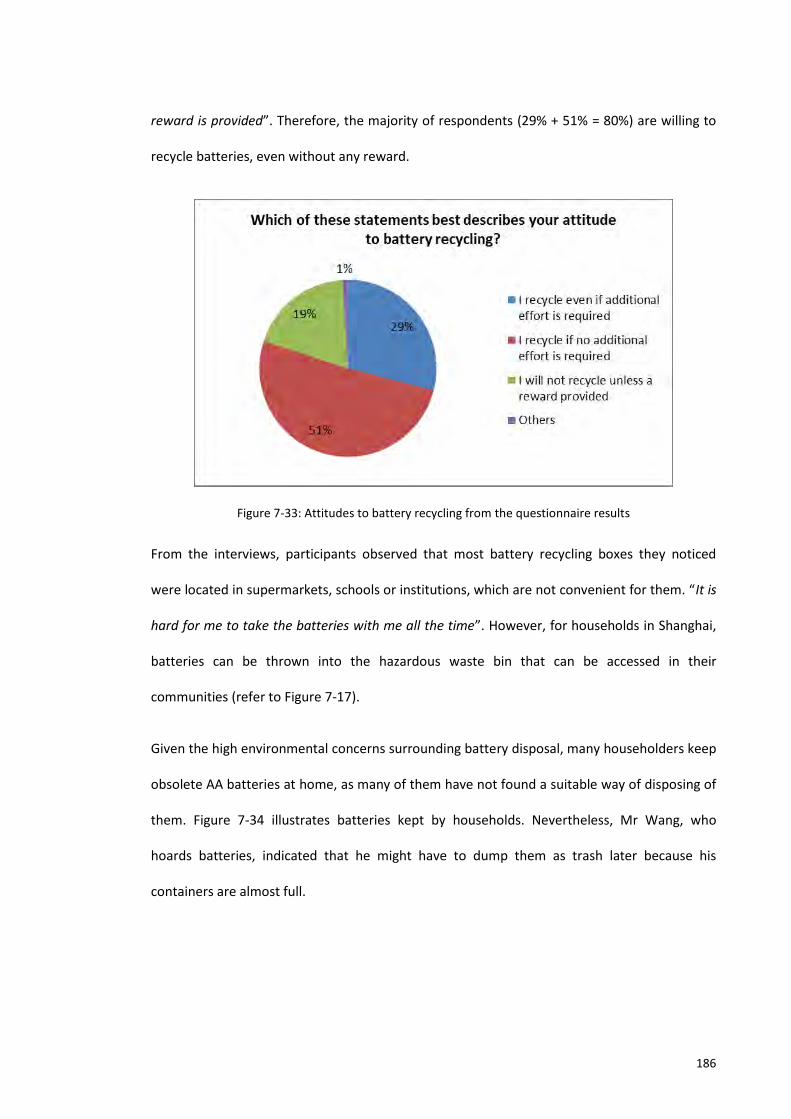
186
reward is provided”. Therefore, the majority of respondents (29% + 51% = 80%) are willing to
recycle batteries, even without any reward.
Figure 7-33: Attitudes to battery recycling from the questionnaire results
From the interviews, participants observed that most battery recycling boxes they noticed
were located in supermarkets, schools or institutions, which are not convenient for them. “It is
hard for me to take the batteries with me all the time”. However, for households in Shanghai,
batteries can be thrown into the hazardous waste bin that can be accessed in their
communities (refer to Figure 7-17).
Given the high environmental concerns surrounding battery disposal, many householders keep
obsolete AA batteries at home, as many of them have not found a suitable way of disposing of
them. Figure 7-34 illustrates batteries kept by households. Nevertheless, Mr Wang, who
hoards batteries, indicated that he might have to dump them as trash later because his
containers are almost full.
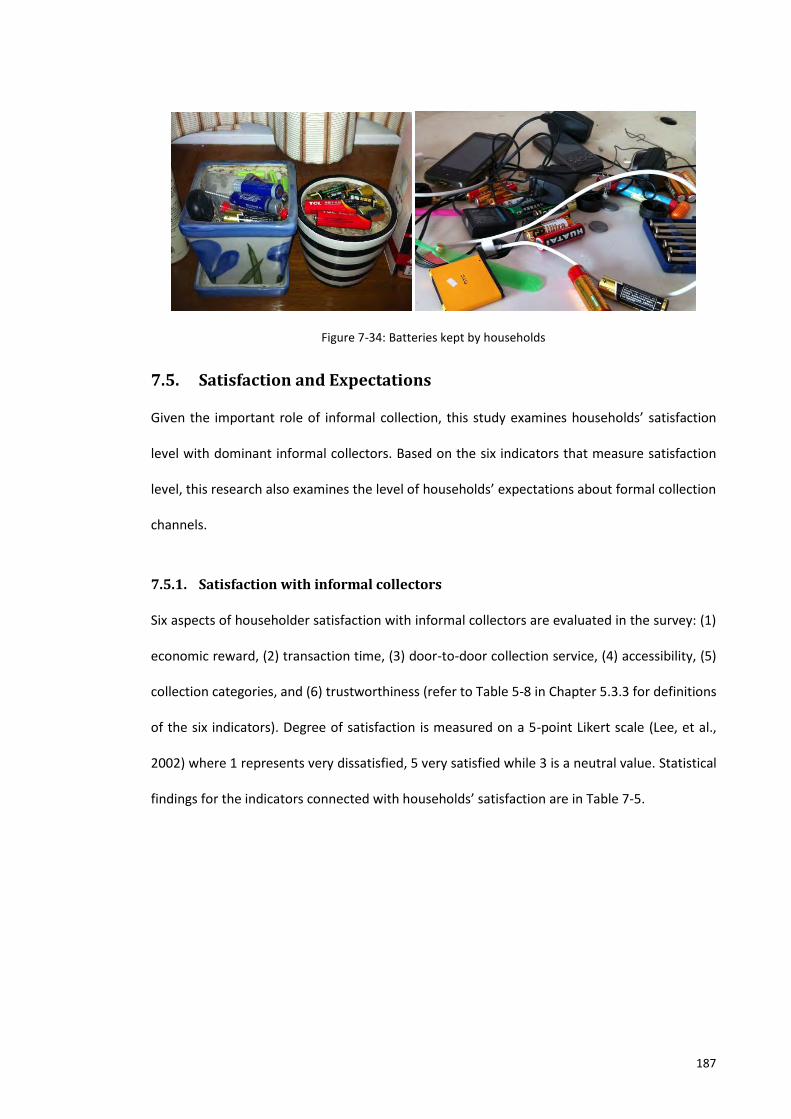
187
Figure 7-34: Batteries kept by households
7.5. Satisfaction and Expectations
Given the important role of informal collection, this study examines households’ satisfaction
level with dominant informal collectors. Based on the six indicators that measure satisfaction
level, this research also examines the level of households’ expectations about formal collection
channels.
7.5.1. Satisfaction with informal collectors
Six aspects of householder satisfaction with informal collectors are evaluated in the survey: (1)
economic reward, (2) transaction time, (3) door-to-door collection service, (4) accessibility, (5)
collection categories, and (6) trustworthiness (refer to Table 5-8 in Chapter 5.3.3 for definitions
of the six indicators). Degree of satisfaction is measured on a 5-point Likert scale (Lee, et al.,
2002) where 1 represents very dissatisfied, 5 very satisfied while 3 is a neutral value. Statistical
findings for the indicators connected with households’ satisfaction are in Table 7-5.
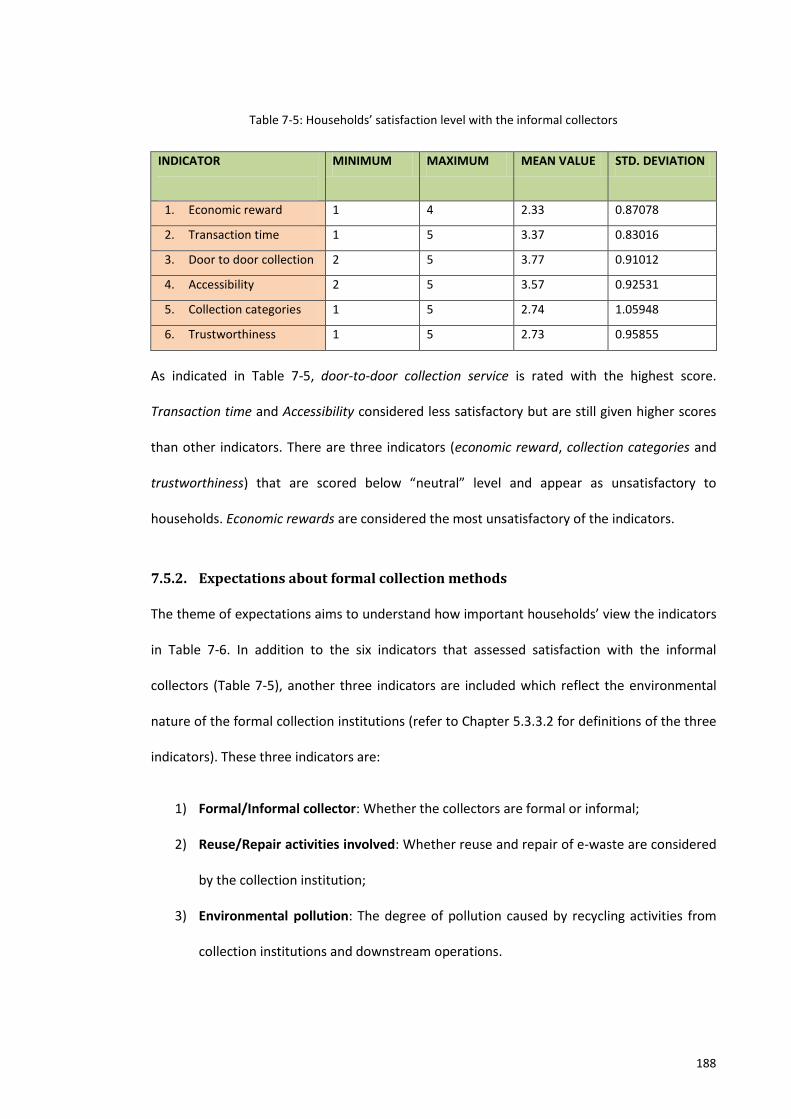
188
Table 7-5: Households’ satisfaction level with the informal collectors
INDICATOR
MINIMUM MAXIMUM MEAN VALUE STD. DEVIATION
1. Economic reward 1 4 2.33 0.87078
2. Transaction time 1 5 3.37 0.83016
3. Door to door collection 2 5 3.77 0.91012
4. Accessibility 2 5 3.57 0.92531
5. Collection categories 1 5 2.74 1.05948
6. Trustworthiness 1 5 2.73 0.95855
As indicated in Table 7-5, door-to-door collection service is rated with the highest score.
Transaction time and Accessibility considered less satisfactory but are still given higher scores
than other indicators. There are three indicators (economic reward, collection categories and
trustworthiness) that are scored below “neutral” level and appear as unsatisfactory to
households. Economic rewards are considered the most unsatisfactory of the indicators.
7.5.2. Expectations about formal collection methods
The theme of expectations aims to understand how important households’ view the indicators
in Table 7-6. In addition to the six indicators that assessed satisfaction with the informal
collectors (Table 7-5), another three indicators are included which reflect the environmental
nature of the formal collection institutions (refer to Chapter 5.3.3.2 for definitions of the three
indicators). These three indicators are:
1) Formal/Informal collector: Whether the collectors are formal or informal;
2) Reuse/Repair activities involved: Whether reuse and repair of e-waste are considered
by the collection institution;
3) Environmental pollution: The degree of pollution caused by recycling activities from
collection institutions and downstream operations.
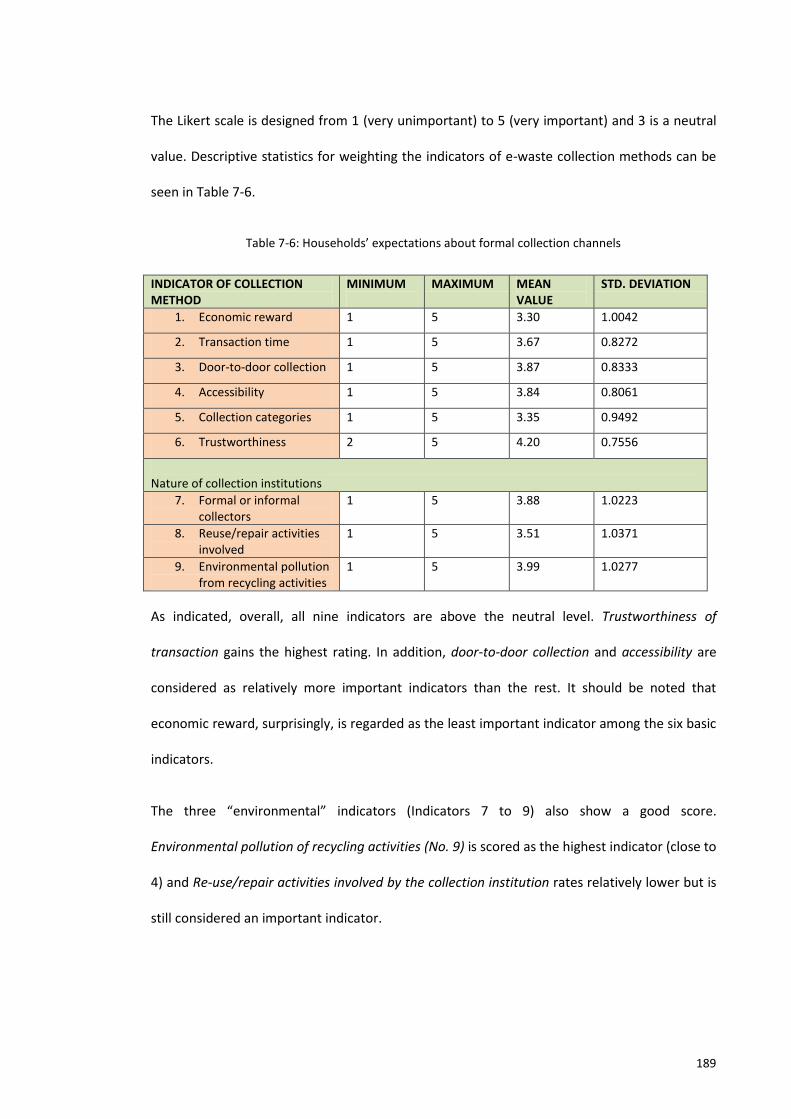
189
The Likert scale is designed from 1 (very unimportant) to 5 (very important) and 3 is a neutral
value. Descriptive statistics for weighting the indicators of e-waste collection methods can be
seen in Table 7-6.
Table 7-6: Households’ expectations about formal collection channels
INDICATOR OF COLLECTION METHOD
MINIMUM
MAXIMUM MEAN VALUE
STD. DEVIATION
1. Economic reward 1 5 3.30 1.0042
2. Transaction time 1 5 3.67 0.8272
3. Door-to-door collection 1 5 3.87 0.8333
4. Accessibility 1 5 3.84 0.8061
5. Collection categories 1 5 3.35 0.9492
6. Trustworthiness 2 5 4.20 0.7556
Nature of collection institutions
7. Formal or informal collectors
1 5 3.88 1.0223
8. Reuse/repair activities involved
1 5 3.51 1.0371
9. Environmental pollution from recycling activities
1 5 3.99 1.0277
As indicated, overall, all nine indicators are above the neutral level. Trustworthiness of
transaction gains the highest rating. In addition, door-to-door collection and accessibility are
considered as relatively more important indicators than the rest. It should be noted that
economic reward, surprisingly, is regarded as the least important indicator among the six basic
indicators.
The three “environmental” indicators (Indicators 7 to 9) also show a good score.
Environmental pollution of recycling activities (No. 9) is scored as the highest indicator (close to
4) and Re-use/repair activities involved by the collection institution rates relatively lower but is
still considered an important indicator.
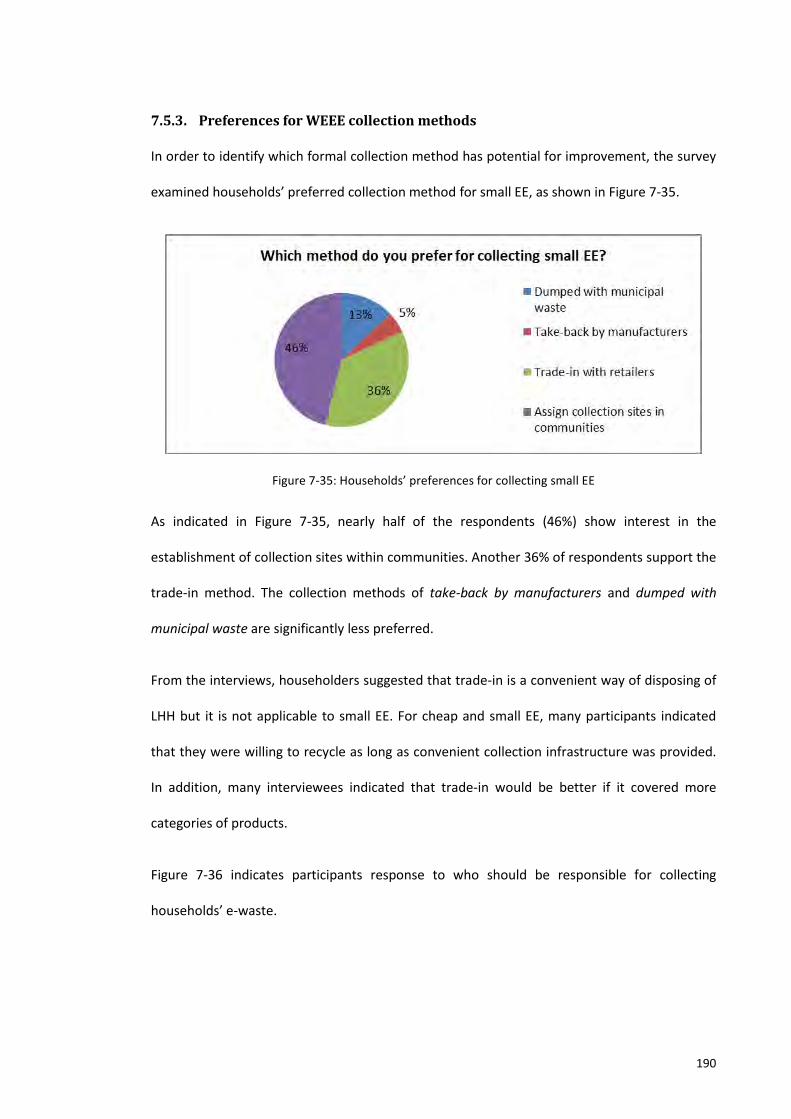
190
7.5.3. Preferences for WEEE collection methods
In order to identify which formal collection method has potential for improvement, the survey
examined households’ preferred collection method for small EE, as shown in Figure 7-35.
Figure 7-35: Households’ preferences for collecting small EE
As indicated in Figure 7-35, nearly half of the respondents (46%) show interest in the
establishment of collection sites within communities. Another 36% of respondents support the
trade-in method. The collection methods of take-back by manufacturers and dumped with
municipal waste are significantly less preferred.
From the interviews, householders suggested that trade-in is a convenient way of disposing of
LHH but it is not applicable to small EE. For cheap and small EE, many participants indicated
that they were willing to recycle as long as convenient collection infrastructure was provided.
In addition, many interviewees indicated that trade-in would be better if it covered more
categories of products.
Figure 7-36 indicates participants response to who should be responsible for collecting
households’ e-waste.
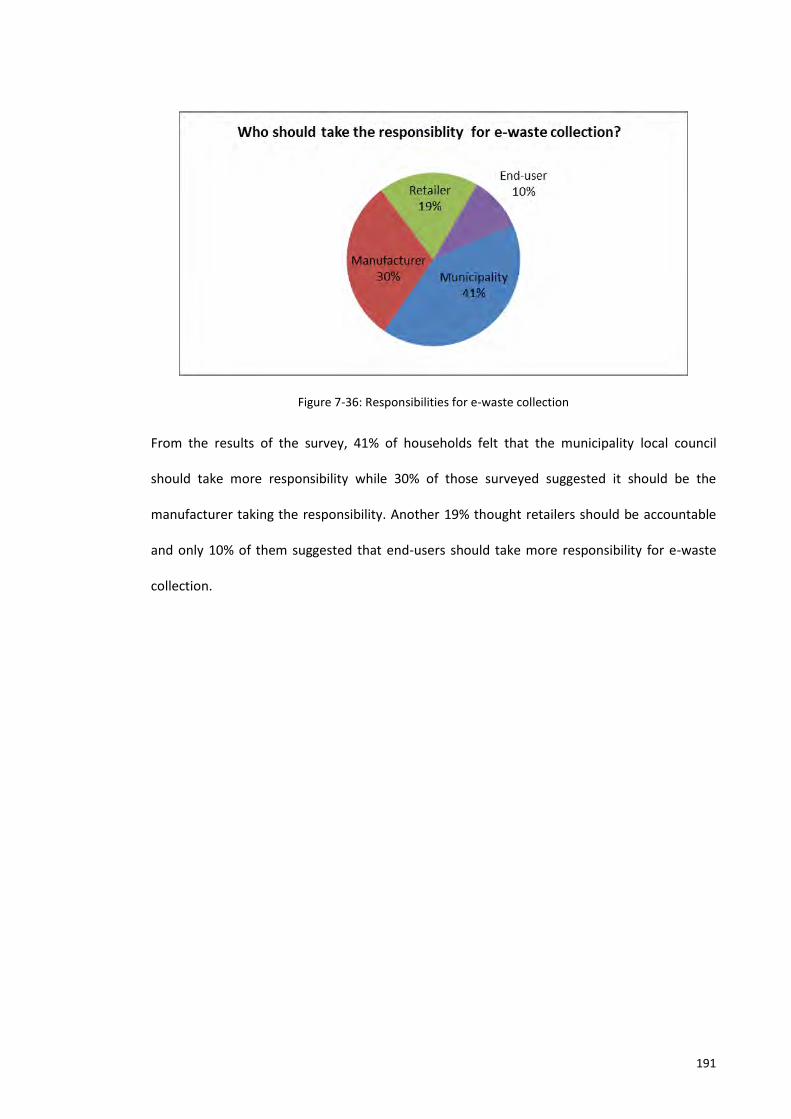
191
Figure 7-36: Responsibilities for e-waste collection
From the results of the survey, 41% of households felt that the municipality local council
should take more responsibility while 30% of those surveyed suggested it should be the
manufacturer taking the responsibility. Another 19% thought retailers should be accountable
and only 10% of them suggested that end-users should take more responsibility for e-waste
collection.
192
CHAPTER 8: ANALYSIS AND DISCUSSION
This section analyses the results from the two field studies in terms of households’ preferences
for informal collection, as well as the advantages of the informal recycling sector. It also
discusses other findings noted in the review of the literature.
8.1. Households’ preference for informal collection services
Informal collection is the most common collection method in China (European Communities,
2006; Wu & Yenming J, 2007). However, when a new trade-in scheme was launched in 2009, it
offered an alternative collection scheme for households, as pointed out in Chapter 4.1. The
results from Field Study B identified the market share of seven categories of e-waste and not
only corroborated the dominant position of informal collection, but also highlighted the
potential of the trade-in scheme.
The survey results indicate that informal collectors (43%) and the trade-in scheme (34%) are
the two most significant collection channels for the seven surveyed e-waste categories (refer
to Figure 7-5 for survey results). This data is specific to e-waste items being discarded through
the available e-waste collection channels and does not include the items being transferred,
dumped or stockpiled by households. Other than these two major collection methods, direct
selling to second-hand markets accounted for another 20% of total collection from households.
This research also identified the market share of other available but non-popular collection
methods. The cumulative percentage of other available collection channels is only 3%. This
includes take-back by OEMs, selling to formal collection companies and returns to e-waste
collection sites/bins (refer to Table 5-7 for explanation of collection channels). It is noticeable
that other formal collection channels gained limited e-waste items from households, except
for the trade-in scheme.
193
Given the dominant role of informal collection, this research evaluates households’ satisfaction
with informal collectors, as well as households’ expectations about the service provided by
formal collection channels. Households are direct users of both informal and formal e-waste
collection channels. Therefore, households’ feedback about available collection channels and
their recycling behaviour are essential if the formal collection channels are to be improved.
Among the six indicators to measure satisfaction of informal collectors service, this research
identified that three of these indicators are rated higher by households. They are: door-to-door
collection service, accessibility and transaction time (refer to Table 7-6 for survey results).
These three aspects were discussed as advantages of the informal collection system in Chapter
4 (refer to Table 4-4). Door-to-door collection service was scored as providing the highest level
of satisfaction. However, another three indicators/characteristics of informal collection
showed lower rating (under mean value in Table 7-6). The three less satisfactory
characteristics are economic reward, collection categories and trustworthiness. Economic
reward was indicated as the least satisfactory indicator.
The six criteria that measured satisfaction with informal collectors were also used to examine
households’ expectations about formal collection channels. The results of the analyses of
satisfaction and expectations (refer to Table 7-5 and Table 7-6) show similar scores. Two sets
of data with satisfaction and expectation levels recorded by the survey results are placed in
the same chart, as illustrated in Figure 8-1.
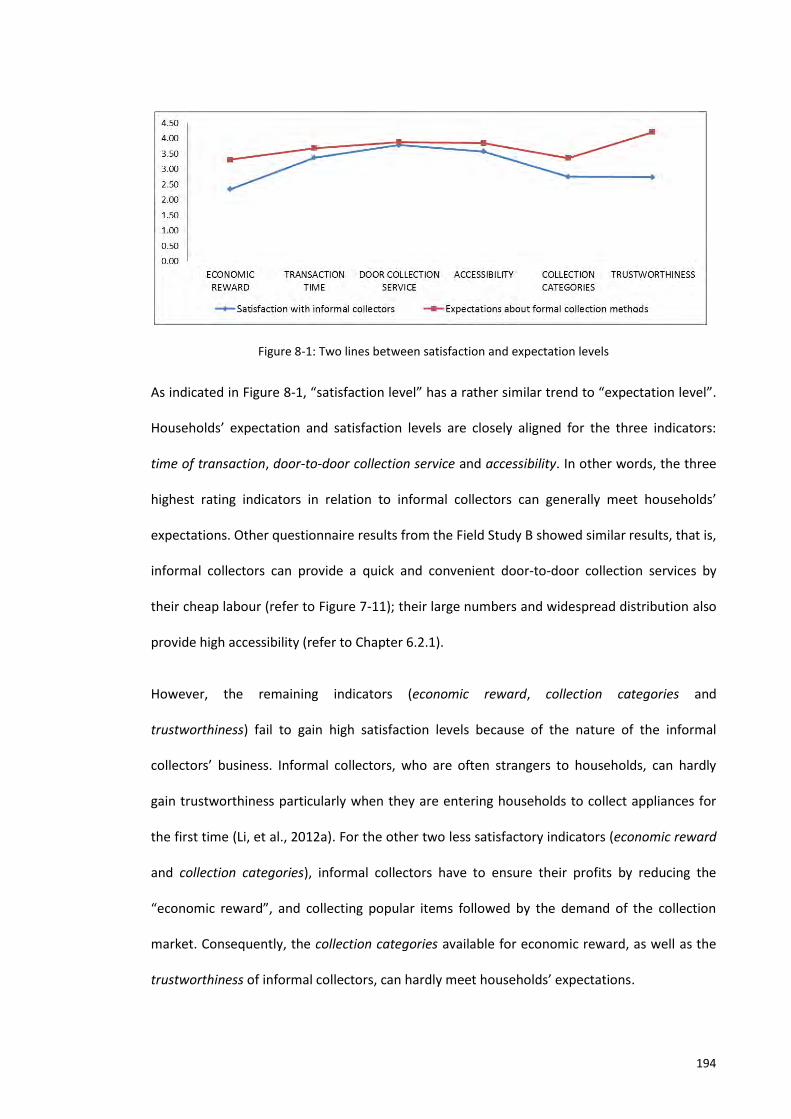
194
Figure 8-1: Two lines between satisfaction and expectation levels
As indicated in Figure 8-1, “satisfaction level” has a rather similar trend to “expectation level”.
Households’ expectation and satisfaction levels are closely aligned for the three indicators:
time of transaction, door-to-door collection service and accessibility. In other words, the three
highest rating indicators in relation to informal collectors can generally meet households’
expectations. Other questionnaire results from the Field Study B showed similar results, that is,
informal collectors can provide a quick and convenient door-to-door collection services by
their cheap labour (refer to Figure 7-11); their large numbers and widespread distribution also
provide high accessibility (refer to Chapter 6.2.1).
However, the remaining indicators (economic reward, collection categories and
trustworthiness) fail to gain high satisfaction levels because of the nature of the informal
collectors’ business. Informal collectors, who are often strangers to households, can hardly
gain trustworthiness particularly when they are entering households to collect appliances for
the first time (Li, et al., 2012a). For the other two less satisfactory indicators (economic reward
and collection categories), informal collectors have to ensure their profits by reducing the
“economic reward”, and collecting popular items followed by the demand of the collection
market. Consequently, the collection categories available for economic reward, as well as the
trustworthiness of informal collectors, can hardly meet households’ expectations.
195
Nevertheless, this research suggests that informal collectors are flexible in meeting
households’ expectations particularly for the most significant requirements - time of
transaction, door-to-door collection service and accessibility. The informal e-waste
stakeholders are flexible so that they can change their collection preferences according to the
nature of the market at any point in time. For instance, informal collectors have much more
choice than the formal collection channels regarding which collection categories they focus on.
Informal collectors are able to collect not only the electrical products, but can also accept a
wider range of recyclable products or materials such as bottles, cans and even furniture (refer
to Chapter 6.2.1). Moreover, the price offered by the informal collectors varies depending on
the value of the products (refer to Chapter 6.2). It may be more difficult for the
formal/government operated recycling systems to become so market-driven and flexible. For
example, the most attractive formal collection channel – the trade-in scheme, offered similar
financial compensation for TVs regardless of whether they were new or old.
This study confirms the results from the literature that informal collectors provide convenient
door-to-door collection service to attract households (European Communities, 2006; Wu &
Yenming J, 2007). In addition, informal collectors are readily accessed due to their large
numbers and their wide distribution (Li, et al., 2012a). Moreover, the results from this research
indicated that it is hard for formal collectors to compete with the informal collectors with their
advantages of door-to-door collection, high accessibility and low collection cost. However,
households’ satisfaction with informal collectors was rated against certain
indicators/characteristics of collection channels including economic reward, collection
categories and trustworthiness. Gaps exist between households’ satisfaction and expectation
levels for these three indicators (see Figure 8-1), which present opportunities by which the
formal collection systems may be able to enhance their own performance.
196
8.2. Recycling large and small e-waste items
There have been several studies that identify how Chinese households dispose of their e-waste
(Liu., et al., 2006; Martin & Geering, 2010; Wang, et al., 2011; Yang, et al., 2008; Yao, et al.,
2009; Zeng, et al., 2010). However, these studies were conducted with different research aims
and research instruments, thus the survey results from existing studies vary greatly (refer to
Chapter 4.1 for discussions).
By discussing the major reasons that contribute to the varying results, this research identified
household disposal behaviour for specific seven categories of e-waste. It appears that
households display varying behaviour towards the disposal of different categories of e-waste.
Overall, three large household (LHH) appliances (TVs, washing machines and refrigerators) and
PCs tend to be disposed of through informal collectors and the trade-in schemes. These large
appliances were key targets for trial trade-in schemes and are also popular with informal
collectors. Compared to LHH appliances and PCs, mobile phones and laptops were less likely
being disposed of through informal collectors or the trade-in scheme, but show a greater
tendency to be stored at home or transferred to friends and relatives, or sold privately at
second-hand markets. Small electrical equipment (EE) (e.g. rice cookers, coffee machines, desk
lamps and computer loud speakers) had limited resale potential and usually end up being
stockpiled or dumped directly. Field Study B suggested that among all the e-waste devices that
had been dumped by households, more than 80% were in the category of small EE and mobile
phones. Additionally, as observed along the follow-up interviews in Field Study B, many
portable personal electronic devices were stockpiled by households.
This research found that such different disposal methods for large and small e-waste items by
households are connected with the demand of the collection market. Field Study A
investigated the market for e-products by interviewing informal e-waste stakeholders. The
interviewed informal stakeholders that work with reuse or recycled products tend to have
197
collection preferences. The second-hand markets that trade used goods include physical repair
shops and second-hand stores tend to focus on ICT products and LHH appliances.
Field Study A is the first study that defined another group of e-waste collectors - ICT street
traders, who purchase the electronic devices that have reuse value specifically for the second-
hand market. For the ICT street traders, PCs and mobile phones are the most sought after
appliances in the second-hand markets. By contrast, door-to-door collectors accept any
category of e-waste product, but the price offered for ‘unpopular’ items was very low because
such items were generally only sold afterwards by weight as cheap scrap.
However, even the door-to-door collectors have collection preferences; they prefer LHH
appliances, for which there is a good demand in second-hand markets. Even if some broken
and defective appliances cannot be sold in second-hand markets, LHH appliances can access
components and materials in dismantling centres. Field Study A suggested that the informal
dismantling centres within the urban area of Tianjin mainly disassemble large appliances. PCs
and large appliances are the most popular items in dismantling centres and most small EE and
portable electronics are ultimately sent to less developed regions for end-processing (refer to
Chapter 6.3).
By way of conclusion, households’ disposal preferences to some extent are influenced by the
collection preferences of the second-hand and recycling markets. Since LHH appliances are
popular to both second-hand markets and dismantling centres, few LHH appliances were
stockpiled by surveyed households. ICT products and portable electronics are only popular
with the second-hand markets or infrequently recycled within urban areas, which leads to
considerable amounts of small ICT products being stockpiled. Small EE can difficult to reuse or
recycle due to lack of demand in the market and thus end up being dumped by many
households.
198
8.3. Advantages of informal sector collection and processing
Previous studies regarding the informal sector focused upon the environmental impacts arising
from their negative impacts in terms of environment, health and ethics (such as child labour)
(Fu, et al., 2012; Gërxhani, 2004; Huo, 2007; Li, et al., 2012a; Li, et al., 2008; Schneider & Enste,
2003; Xing, et al., 2009; Xu, et al., 2006). However, some literature suggest that contributions
from the informal waste recycling sector are undervalued (Medina, 2000; Moreno-Sanchez &
Maldonado, 2006). This research offers an opportunity to investigate the operations of the
informal recycling sectors. From the results of the Field Study A, informal recycling operations
have several advantages that are discussed below.
8.3.1. Vitality of the second-hand markets
The informal recycling activities in developing countries are mainly based on a high level of
repair and reuse operations which are market-driven and profitable (Ongondo, et al., 2011d).
Reuse of e-waste, either directly or after repair, is a promising way to reduce waste generation
and extend the life of often perfectly serviceable products (Pocock et al., 2011). This research
identifies the advantages of the thriving second-hand markets in China, which should be
protected for the following reasons:
Convenient and flexible repair service: From the Transect Walk in Field Study A,
second-hand markets not only provide various categories of used products, many
repair shops also offer a convenient repair service for the customers. Compared to the
expensive repair service in many affluent countries (Pocock, et al., 2011), the price of
repair services at informal repair shops are acceptable due to cheap components and
the low-cost of technicians’ labour. In addition, technicians offer flexible services so
that they are prepared to repair in-store or offer a visiting repair service. As observed
in Field Study A, such a flexible service attracts a large number of households (refer to
199
Chapter 6.2.2). In Field Study B, surveyed households have high rates of repair, in
particular, of the three surveyed LHH appliances and three ICT products (refer to
Figure 7-9). For example, 60% of surveyed households have repaired their mobile
phones.
Abundant resources and large market: Although Yang, et al. (2008) indicated that only
small quantities of e-waste in second-hand markets come directly from households,
the results of this research suggest that the second-hand markets for obsolete e-
products is large in China. Among all seven surveyed categories of e-waste discarded
through the collection channels, 20% was directly traded in second-hand markets
(refer to Figure 7-9). Additionally, Field Study A suggested that the majority of e-waste
collected by informal collectors also flowed back to the second-hand markets.
Furthermore, even the used appliances that were collected by the formal retailers
were often transferred back into second-hand markets (refer to Chapter 6.2.2). In
other words, there are e-waste streams between formal and informal recycling sectors.
Therefore, the material flows and redistribution between formal and informal
stakeholders, which was identified from the literature review in Chapter 4, is updated.
Figure 8-2 illustrates the updated material flows following the Field Study A.
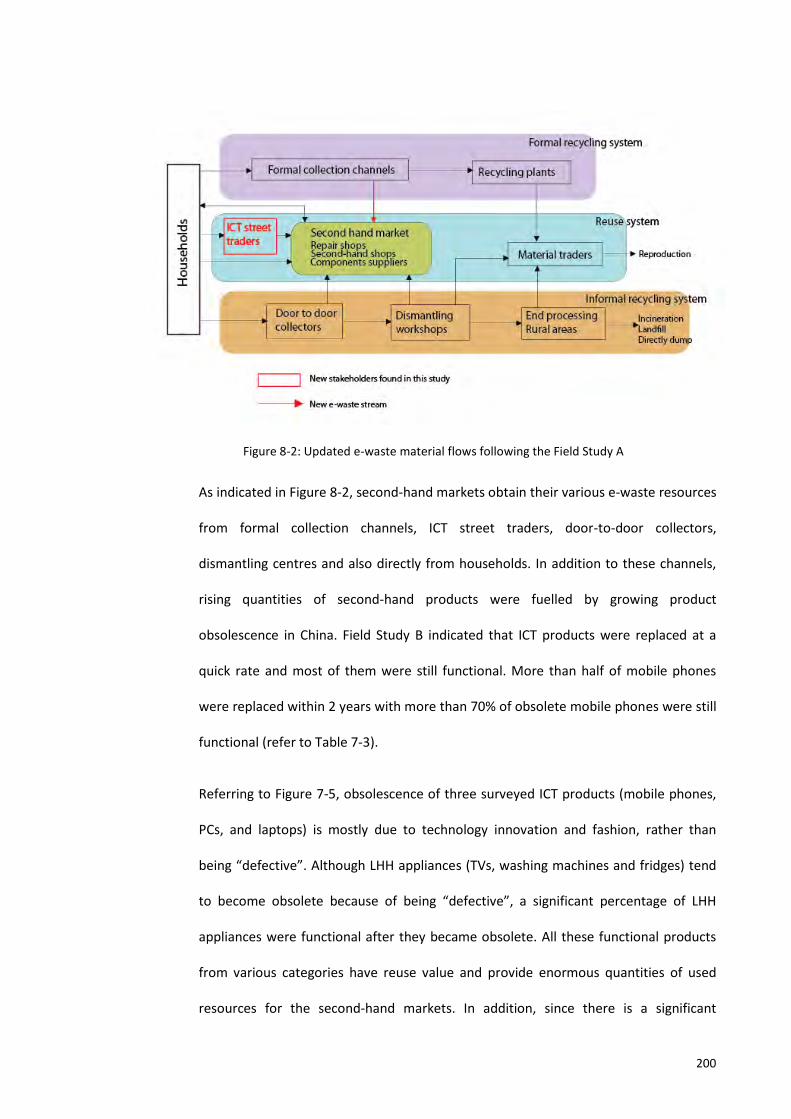
200
Figure 8-2: Updated e-waste material flows following the Field Study A
As indicated in Figure 8-2, second-hand markets obtain their various e-waste resources
from formal collection channels, ICT street traders, door-to-door collectors,
dismantling centres and also directly from households. In addition to these channels,
rising quantities of second-hand products were fuelled by growing product
obsolescence in China. Field Study B indicated that ICT products were replaced at a
quick rate and most of them were still functional. More than half of mobile phones
were replaced within 2 years with more than 70% of obsolete mobile phones were still
functional (refer to Table 7-3).
Referring to Figure 7-5, obsolescence of three surveyed ICT products (mobile phones,
PCs, and laptops) is mostly due to technology innovation and fashion, rather than
being “defective”. Although LHH appliances (TVs, washing machines and fridges) tend
to become obsolete because of being “defective”, a significant percentage of LHH
appliances were functional after they became obsolete. All these functional products
from various categories have reuse value and provide enormous quantities of used
resources for the second-hand markets. In addition, since there is a significant
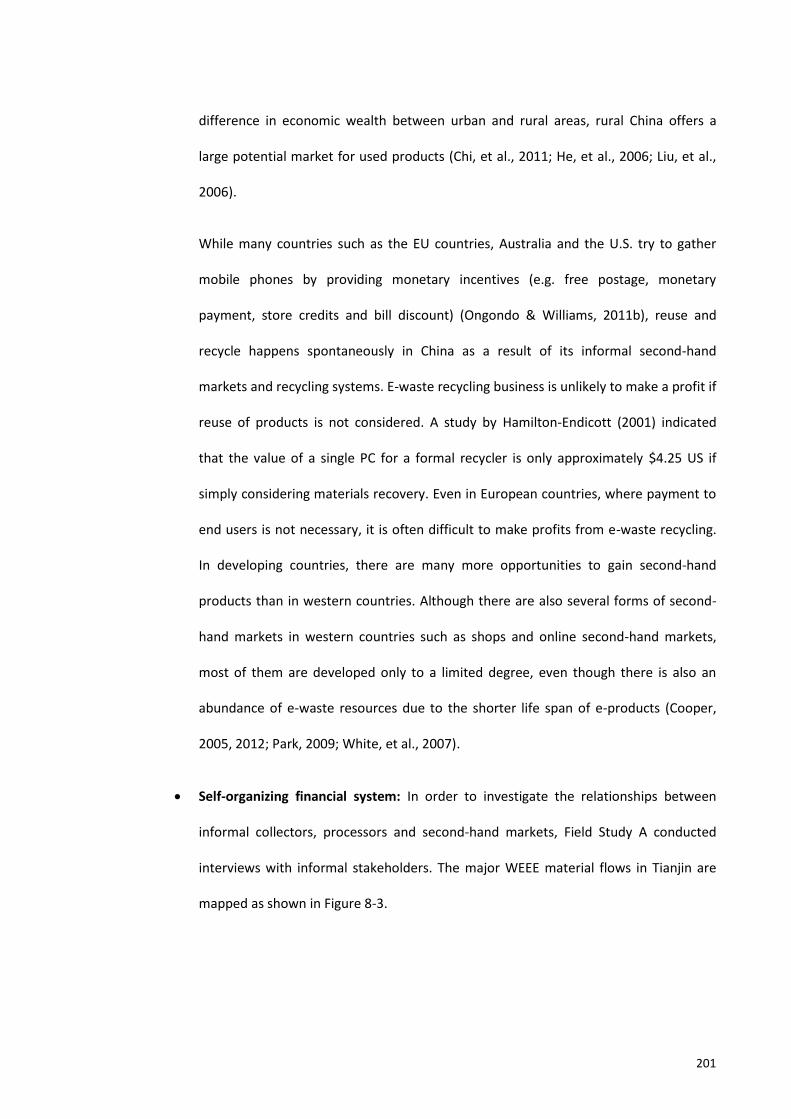
201
difference in economic wealth between urban and rural areas, rural China offers a
large potential market for used products (Chi, et al., 2011; He, et al., 2006; Liu, et al.,
2006).
While many countries such as the EU countries, Australia and the U.S. try to gather
mobile phones by providing monetary incentives (e.g. free postage, monetary
payment, store credits and bill discount) (Ongondo & Williams, 2011b), reuse and
recycle happens spontaneously in China as a result of its informal second-hand
markets and recycling systems. E-waste recycling business is unlikely to make a profit if
reuse of products is not considered. A study by Hamilton-Endicott (2001) indicated
that the value of a single PC for a formal recycler is only approximately $4.25 US if
simply considering materials recovery. Even in European countries, where payment to
end users is not necessary, it is often difficult to make profits from e-waste recycling.
In developing countries, there are many more opportunities to gain second-hand
products than in western countries. Although there are also several forms of second-
hand markets in western countries such as shops and online second-hand markets,
most of them are developed only to a limited degree, even though there is also an
abundance of e-waste resources due to the shorter life span of e-products (Cooper,
2005, 2012; Park, 2009; White, et al., 2007).
Self-organizing financial system: In order to investigate the relationships between
informal collectors, processors and second-hand markets, Field Study A conducted
interviews with informal stakeholders. The major WEEE material flows in Tianjin are
mapped as shown in Figure 8-3.
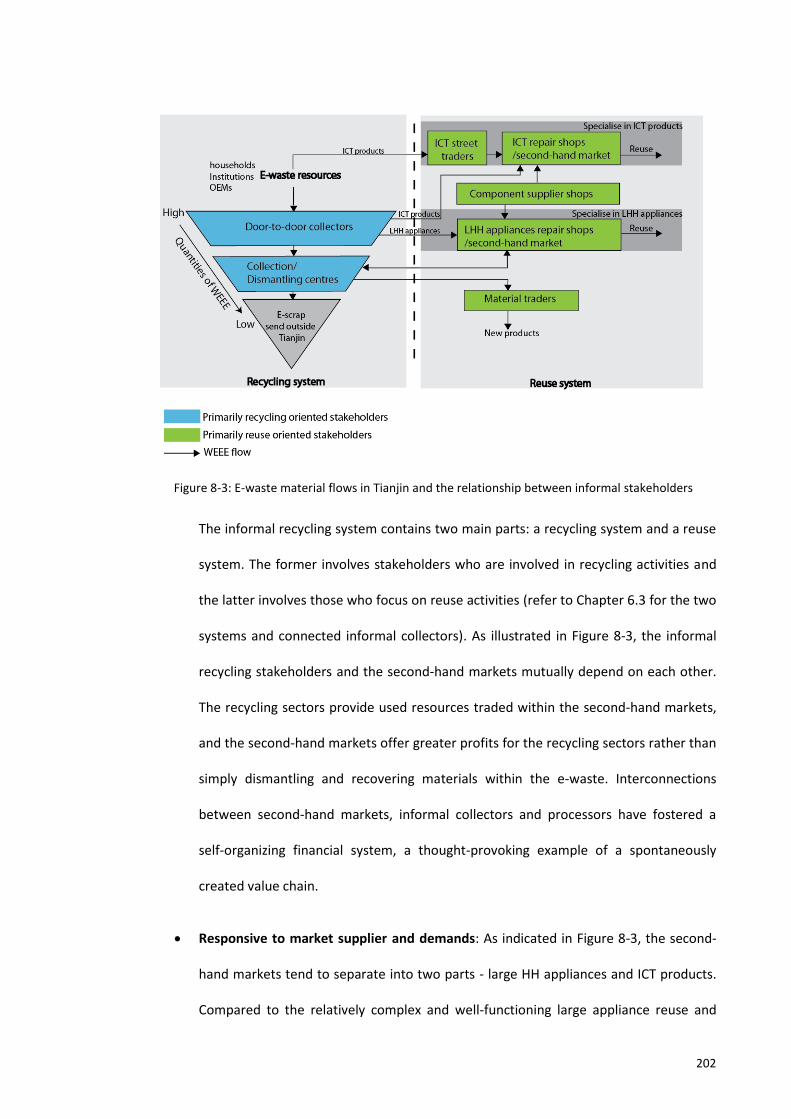
202
Figure 8-3: E-waste material flows in Tianjin and the relationship between informal stakeholders
The informal recycling system contains two main parts: a recycling system and a reuse
system. The former involves stakeholders who are involved in recycling activities and
the latter involves those who focus on reuse activities (refer to Chapter 6.3 for the two
systems and connected informal collectors). As illustrated in Figure 8-3, the informal
recycling stakeholders and the second-hand markets mutually depend on each other.
The recycling sectors provide used resources traded within the second-hand markets,
and the second-hand markets offer greater profits for the recycling sectors rather than
simply dismantling and recovering materials within the e-waste. Interconnections
between second-hand markets, informal collectors and processors have fostered a
self-organizing financial system, a thought-provoking example of a spontaneously
created value chain.
Responsive to market supplier and demands: As indicated in Figure 8-3, the second-
hand markets tend to separate into two parts - large HH appliances and ICT products.
Compared to the relatively complex and well-functioning large appliance reuse and
203
recycling systems, reuse and recycling of ICT products seem much less complicated
because most ICT products and small electrical items are not preferable and treated as
e-scrap and send outside of Tianjin. Such e-waste preference in the second-hand
markets is also responsive to the collection preferences and supply/demand forces of
the market (As noted in Section 8.2).
Potentially reduce pollution: As indicated in Figure 8-3, the second-hand market filters
out valuable products and components and reduces the quantities of e-waste flowing
into the highly polluting end-processing recycling workshops in rural areas. In addition,
the high reuse rates extend products’ life and reduce production of new products.
Therefore, second-hand markets also have environmental benefits in terms of
reducing emissions of CO2 and slowing resource depletion. Given the advantages of
second-hand markets discussed above, the second-hand markets should be
encouraged in order to pursue long-term sustainability goals in China. A potential
method to encourage the second hand markets while increasing the effective control
and elimination of the dangerous processing methods will be explained later in the
report in Chapter 9.4.1.
8.3.2. Cleaner collection and dismantling processes within urban areas
Despite the significant amount of evidence of the negative environmental impacts resulting
from informal WEEE recycling activities (Li, et al., 2008; Sepúlveda, et al., 2010; Xing, et al.,
2009), the literature also pointed out that there were environmental benefits to be derived
from the informal recycling sectors. Moreno-Sanchez and Maldonado (2006) argue that many
valuable materials would be lost in landfills and dumpsites without the effort from scavengers
(waste pickers from dumps). Other authors have also indicated that the effective work of
collection and classification by the informal recyclers provides considerable amounts of
secondary resources which reduce the exploitation of raw materials (Hicks, et al., 2005;
204
Streicher-Porte, 2005; Streicher-porte & Yang, 2007). It is reported that during the
manufacturing of e-products, up to 90% of greenhouse gas emissions can be avoided by
recovering materials from e-waste rather than using virgin resources (Clean up, 2009).
Moreover, manual recycling activities by the informal sector generate similar or even higher
recycling rates compared to those achieved by the formal recycling sectors (Chi, et al., 2011;
ETBC, 2010).
In addition to discussing the literature regarding the environmental benefits gained from the
informal sector, this research conducted a Transect Walk in Tianjin to identify and observe the
operation of informal recycling sector. Important evidence from Field Study A supports the
viewpoint that the informal sector enjoys environmental advantages that could be adopted by
formal collection channels.
Field Study A suggested that informal e-waste operations within the urban areas of Tianjin
mostly focus on e-waste collection, refurbishment and dismantling. The deep-processing
recycling activities that release large quantities of toxic substances through acid leaching and
open burning, have not been found in this study. After removal of valuable products and
components for despatch to the second-hand market, most residual e-scrap is transferred out
of Tianjin for further processing. Therefore, e-waste recycling activities within the Tianjin urban
area are far more environmentally acceptable than the deep-processing activities that were
noted in Guiyu (refers to Chapter 1.1). Field Study A revealed the “clean” urban e-waste
operations have the following characteristics:
i. Low-emission transportation: Along the e-waste recycling chain, transportation is
responsible for the majority of CO2 emissions in the collection stage (Hischier, et al.,
2005). From the Transact Walk, informal collectors often use bicycles or small
motorized vehicles such as tricycles and electric vehicles. Such simple transportation
lower the expenses of e-waste collection and also potentially lowers the emission of
205
CO2. In addition, informal collectors travel across communities with their cost-
effective small vehicles and can be very flexible in the size vehicle they need to use
depending on whether they are transferring a large or smaller number of items.
ii. High collection rates and quantities: Informal collectors contribute to a high collection
rate by their door-to-door collection services. Field Study A indicated that the
collection of e-waste resources is mainly based on the collection service provided by
two groups of informal collectors: door-to-door collectors and ICT street traders (refer
to Chapter 6.3). In order to gain large quantities of e-waste resources, these two
groups of informal collectors densely distributed around shopping centres and across
communities in large numbers. Field Study B suggested that informal collectors still
dominated the collection market in Tianjin, even after the implementation of the
trade-in scheme (refer to Section 8.1). In addition, informal collectors are capable of
accessing wider ranges of e-waste categories, which may not be covered by the formal
collection channels. Such a wide range of collection categories also contributes to the
high quantities of e-waste collection.
iii. High reuse rates: Field Study A indicated that all informal stakeholders maximize reuse
opportunities by various methods including direct reuse, repair, refurbishment,
remanufacturing (refer to Chapter 6.2.5) and canibalization (refer to Chapter 7.3.3).
Such strategies lead to a high reuse rate by means of informal recycling operators.
8.3.3. Other contributions by informal recycling
Other than the environmental benefits, informal recycling sectors offer other contributions
that could be considered by the Chinese Government when trying to formalize or eliminate the
informal recycling sector in China.
206
i. Economic contribution: The informal sector makes a significant contribution to the
local economy since most workers’ incomes earned in the informal economy are
immediately spent in the formal economy, which stimulates its development overall
(Adam & Ginsburgh, 1985; Schneider, 1998; Wilson, et al., 2006). In addition, the
informal sectors are self-organized, so government resources for organizing e-waste
collection and recycling are not necessary; it potentially reduces the official financial
budget for waste management.
ii. Social contribution: Apart from the economic contribution, informal recycling offer
social benefits, such as providing job opportunities and making an economic
contribution to local communities (Wu & Yenming J, 2007). Because of the low level of
capital investment and low level of required skill, informal recycling business attracts
socially marginalised people in developing countries. For example, it is reported that
2% of the population in Asian and Latin American cities relies on waste picking and
scavenging for income (Medina, 2000). In China, there are approximately 690,000
employees involved in the informal recycling systems (Manhart, 2007).
Nevertheless, it is undeniable that downstream waste recycling activities, particular the metal
recovery by informal operators, cause negative environmental impacts, which may match or
even exceed the benefits. Along the e-waste recycling chain, metal recovery is regarded as the
most polluting activity that requires much higher standards of environmental control (Hischier,
et al., 2005). Effective interventions to safeguard the environment are necessary to control the
pollution resulting from downstream informal recyclers.
The original purpose behind formalizing or eliminating the informal recycling sectors was
chiefly because of the severity of environmental impacts arising from their polluting processing
activities (Yang, et al., 2008). Judging by the discussions of the effectiveness of official WEEE
management strategies in Chapter 3, it is difficult for the Government to regulate or compete
207
with the informal recycling sector. In addition, given the large number of job opportunities
provided by informal e-waste businesses, many side effects have to be considered such as
direct unemployment as well as a possible deflationary effect on the local economy.
Given the advantages enjoyed by informal recyclers, as well as the difficulties for formal
recyclers in competing with them (refer to Chapter 3.2), there is a consensus among many
researchers that the informal collectors should be brought into a formalized framework rather
than be eliminated or competed with (Chi, et al., 2011; Nzeadibe, 2009; Wilson, et al., 2006;
Yang, et al., 2008). Field Study A suggested that the informal e-waste operations that take
place within urban areas for e-waste collection, reuse, and dismantling have fewer
environmental impacts compared with downstream metal recovery. It is more ‘cost-effective’
and socially responsible to guide informal collectors, particularly when the formal recycling
system under-developed and has potential for growth.
8.4. Factors that influence households’ disposal behaviour
Other than the phenomenon of households’ recycling behaviour, Field Study B identified
“WHY” households stockpile, trade, transfer to reuse and dump the products they have
previously bought. There are a number of reasons for different e-waste disposal behaviour.
Table 8-1 lists the motivation derived from the work carried out in Field Study B.
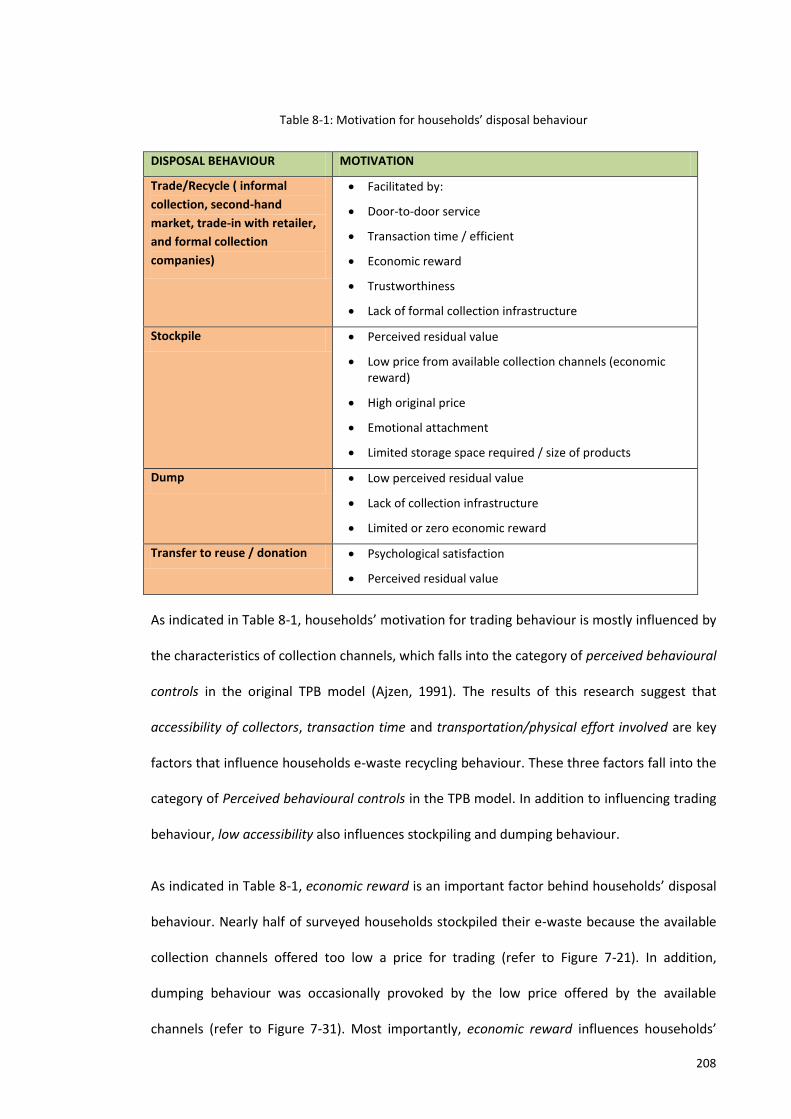
208
Table 8-1: Motivation for households’ disposal behaviour
DISPOSAL BEHAVIOUR MOTIVATION
Trade/Recycle ( informal
collection, second-hand
market, trade-in with retailer,
and formal collection
companies)
Facilitated by:
Door-to-door service
Transaction time / efficient
Economic reward
Trustworthiness
Lack of formal collection infrastructure
Stockpile Perceived residual value
Low price from available collection channels (economic reward)
High original price
Emotional attachment
Limited storage space required / size of products
Dump Low perceived residual value
Lack of collection infrastructure
Limited or zero economic reward
Transfer to reuse / donation Psychological satisfaction
Perceived residual value
As indicated in Table 8-1, households’ motivation for trading behaviour is mostly influenced by
the characteristics of collection channels, which falls into the category of perceived behavioural
controls in the original TPB model (Ajzen, 1991). The results of this research suggest that
accessibility of collectors, transaction time and transportation/physical effort involved are key
factors that influence households e-waste recycling behaviour. These three factors fall into the
category of Perceived behavioural controls in the TPB model. In addition to influencing trading
behaviour, low accessibility also influences stockpiling and dumping behaviour.
As indicated in Table 8-1, economic reward is an important factor behind households’ disposal
behaviour. Nearly half of surveyed households stockpiled their e-waste because the available
collection channels offered too low a price for trading (refer to Figure 7-21). In addition,
dumping behaviour was occasionally provoked by the low price offered by the available
channels (refer to Figure 7-31). Most importantly, economic reward influences households’
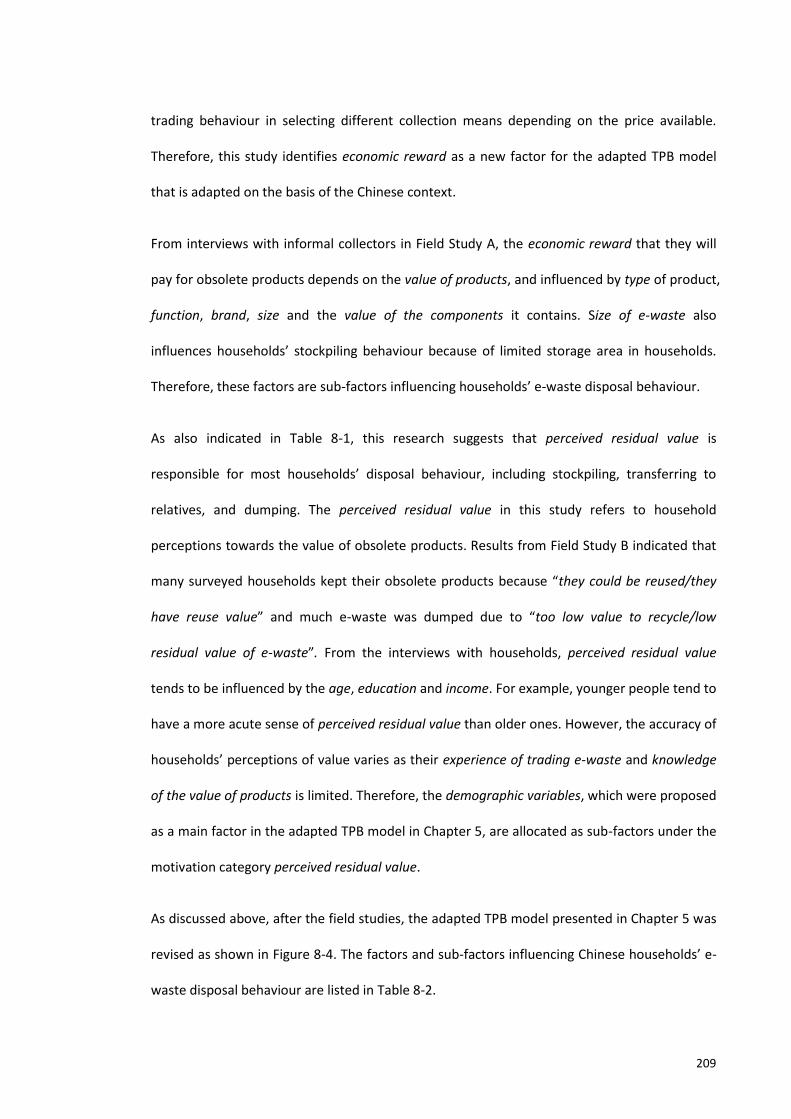
209
trading behaviour in selecting different collection means depending on the price available.
Therefore, this study identifies economic reward as a new factor for the adapted TPB model
that is adapted on the basis of the Chinese context.
From interviews with informal collectors in Field Study A, the economic reward that they will
pay for obsolete products depends on the value of products, and influenced by type of product,
function, brand, size and the value of the components it contains. Size of e-waste also
influences households’ stockpiling behaviour because of limited storage area in households.
Therefore, these factors are sub-factors influencing households’ e-waste disposal behaviour.
As also indicated in Table 8-1, this research suggests that perceived residual value is
responsible for most households’ disposal behaviour, including stockpiling, transferring to
relatives, and dumping. The perceived residual value in this study refers to household
perceptions towards the value of obsolete products. Results from Field Study B indicated that
many surveyed households kept their obsolete products because “they could be reused/they
have reuse value” and much e-waste was dumped due to “too low value to recycle/low
residual value of e-waste”. From the interviews with households, perceived residual value
tends to be influenced by the age, education and income. For example, younger people tend to
have a more acute sense of perceived residual value than older ones. However, the accuracy of
households’ perceptions of value varies as their experience of trading e-waste and knowledge
of the value of products is limited. Therefore, the demographic variables, which were proposed
as a main factor in the adapted TPB model in Chapter 5, are allocated as sub-factors under the
motivation category perceived residual value.
As discussed above, after the field studies, the adapted TPB model presented in Chapter 5 was
revised as shown in Figure 8-4. The factors and sub-factors influencing Chinese households’ e-
waste disposal behaviour are listed in Table 8-2.
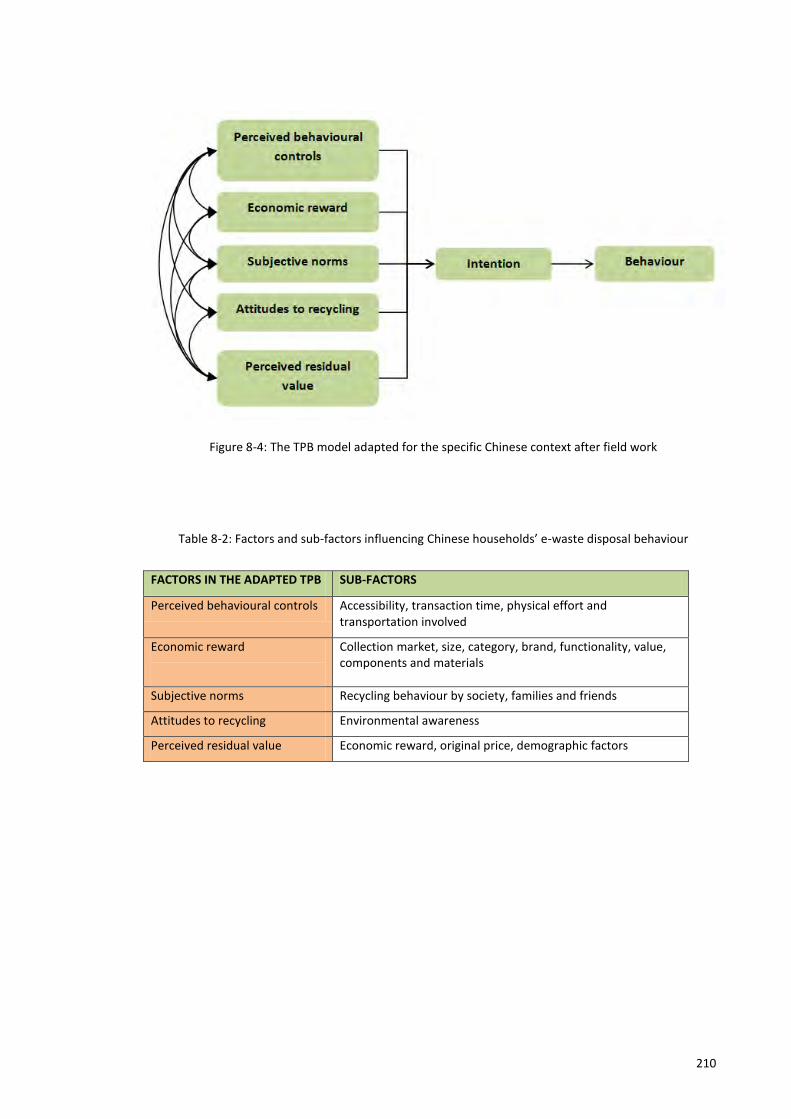
210
Figure 8-4: The TPB model adapted for the specific Chinese context after field work
Table 8-2: Factors and sub-factors influencing Chinese households’ e-waste disposal behaviour
FACTORS IN THE ADAPTED TPB SUB-FACTORS
Perceived behavioural controls Accessibility, transaction time, physical effort and transportation involved
Economic reward
Collection market, size, category, brand, functionality, value, components and materials
Subjective norms Recycling behaviour by society, families and friends
Attitudes to recycling Environmental awareness
Perceived residual value Economic reward, original price, demographic factors
211
CHAPTER 9: CONCLUSIONS AND RECOMMENDATIONS
The final chapter summarizes the findings in regard to the research questions presented in
Chapter 1. It then describes the contribution of this study to the field, research shortcomings
and further research recommendations. Proposed strategies to mitigate e-waste associated
issues in China are also discussed.
9.1. How the research questions have been addressed
The research was conducted with the overall goal of understanding informal e-waste recycling
in China. It seeks opportunities to improve the current e-waste recycling systems in China. This
has been undertaken through a mixed research methodology comprising of a literature review
and two field studies. The literature review in part one of this thesis established the context,
terminologies, and key research knowledge in the field. This research addressed three research
questions (refer to Chapter 1.2):
RQ 1: What e-waste recycling systems exist in China and how do they compare
internationally?
In regard to question 1, it can be concluded from the literature that e-waste collection
and recycling in China is characterized by informal recycling activities and is very
different to recycling systems in developed countries. China has raised considerable
attention due to serious pollution problems resulting from informal recycling activities.
However, Chapter 3 indicated that WEEE management in China is still in its infancy in
terms of its poor implementation of EPR and WEEE regulations, undeveloped formal
collection channels and competition from low-cost informal recycling activities. Trying
to duplicate successful WEEE regulatory framework from developed countries has
achieved limited success. The formal recycling systems find them difficult to make
212
profits and a number of updated recycling plants cannot maintain normal operations
because of insufficient e-waste resources. Effective formal collection channels and
proactive WEEE management strategies are urgently needed but must be premised
upon the existing informal recycling systems.
RQ2: What are the advantages and limitations of various e-waste recycling systems
in China?
Informal recycling sectors play a crucial role from which to create effective e-waste
recycling systems and WEEE legislative framework in China. RQ2 asks about the
characteristics of the informal recycling from the literature and field studies. The
significance of the informal recycling sector in this research is identified in terms of the
operations of e-waste recycling, households’ preferences, e-waste collection market
share, and volume of repair/refurbished products.
In regard to RQ2 this research found that the informal recycling sector have several
advantages that would be very useful in applying to formal recycling sectors.
Advantages include high collection rates, relative cleaner transportation, and an
efficient collection, repairing and dismantling operations. In addition, informal
collectors are attractive to households due to their high accessibility and rapid and
flexible door-to-door collection services. Judging by the survey results and the
literature review in this research, informal collection accounted for the largest
collection market even after the appearance of a competitive trade-in scheme.
Moreover, Field Study B suggested that a trade-in scheme is a promising formal
collection method to compete with informal collectors.
RQ3: Does the disposal behaviour of households offer opportunities to improve
current collection systems?
213
To answer question 3, a field study involving a questionnaire and interviews was
conducted. This research detailed households’ disposal behaviour for seven specific
categories of e-waste. Households’ disposal preferences were linked to RQ2 because
households’ behaviour was influenced by the demands of the informal recycling
markets. Furthermore, reasons behind households’ stockpiling, trading, transferring
and dumping were identified to understand the factors that influence households’
disposal behaviour. It found that economic reward and perceived behavioural controls
(people’s perception of their ability to perform a given behaviour) are important
factors that lead to such e-waste recycling behaviour in China. In addition, dumping
and stockpiling behaviour occurs mainly because of the perceived residual value and
insufficiencies in the collection infrastructure.
This section of the work also compared the trade-in scheme and informal collection
system, by means of a literature review and two field studies (refer to Chapter 4 and
Chapter 7). Surveys of households’ satisfaction indicated the advantages and
disadvantages of the informal collection from the households’ perspective.
Households’ expectations about the formal collection channels addressed several
aspects of their service that could be strengthened to compete with informal
collectors, such as economic reward, trustworthiness, and environmental concerns.
In addition to answering the three RQs, the research was also able to throw light on a number
of other issues, which are addressed in the next section.
9.2. Contributions to knowledge
This research is an explorative study that systematically identifies the limitations and
opportunities of e-waste management in China. It contributes to the field through the analysis
of the both informal and formal recycling systems that exist in China. It also offers useful
214
information for those developing policy on the management of e-waste and decision makers.
Significant contributions of the research are as follow:
1. It analyses the effectiveness and limitations of official WEEE management strategies in
China, which provide lessons for the ongoing development of effective interventions
and WEEE legislation.
2. It identifies the effectiveness of the governmental trade-in scheme in terms of
household preferences. It compares two competitive collection methods (formal
trade-in scheme and informal collectors) from households’ perspective. It examines
the features of what appears to be the most promising formal e-waste collection
channel and provides useful information such as to enable formal collection systems to
be improved.
3. The research identified the advantages of informal recycling operations and suggested
the benefits of guiding and integrating the informal recycling sectors into a
comprehensive e-waste recycling strategy for China.
4. The research updated the e-waste material flows within the informal recycling systems
and relationships between e-waste stakeholders by means of a Transect Walk. This
study identifies and describes a new sub-group of ICT street traders, which is essential
bridging e-waste resources from customers and the second-hand markets. The
Transect Walk helped to understand the transaction structures of e-waste recycling in
China and identified a new e-waste flow between formal and informal sectors.
5. The research applied the TPB model in the Chinese e-waste recycling context, and
identified the factors and sub-factors that influence households’ e-waste disposal
behaviour.
215
6. The research addresses the importance of specifying the categories of e-waste when
studying households’ disposal/recycling behaviour, rather than investigating disposal
behaviour in a general ‘e-waste’ term because disposal behaviour varied markedly
depending on the type of e-waste being discussed.
9.3. Limitations of the research
The limitations in this research concern the sample size and geographical region of field studies.
This study mapped new e-waste material flows and identified new stakeholders and their
relationship within the informal recycling systems. Given the large numbers of stakeholders
involved, as well as the often secretive and informal nature of their work, the research was not
able to comprehensively cover all stakeholders for the interviews. During the Transect Walk,
there were 20 informal recyclers/processors involved in the interviews yet only a small number
of people in each stakeholder group were interviewed. For example, only two people from
dismantling centres were participated in the interview study (refer to Table 5-2 in Chapter
5.1.4 for the numbers of participants in two field studies). Consequently, some of the
information from the interviews such as relationships or e-waste material flows between
stakeholders, distribution of e-waste may not be accurate enough due to the sample size.
Some hidden recycling activities such as end-processing of e-waste may exist but could not be
identified in the limited scale of the Transect Walk.
Additionally, due to the variety of cultures and economic development levels in different areas
of China, expectations of informal stakeholders may vary greatly. Therefore, informal recycling
stakeholders and their operations from Field Study A do not represent the whole of China.
Similarly, since the formal collection infrastructure and pilot collection schemes vary in cities,
the type of collection channels provided for households are different. Therefore, the survey
results in this research do not represent the whole population of China considering the fact
that questionnaires were only distributed regionally (within two districts in Tianjin). However,
216
the results of field studies are indicative of the situation generally prevailing across China since
the dominant informal collection exist in all cities in China and Tianjin’s socio-economic level
parallels many other large cities in China including Beijing and Shanghai.
When conducting the survey, it was found that the formal trade-in scheme and informal door-
to-door collection were two major collection channels in Tianjin. However, during the
conclusion of the research, the trade-in scheme had been suspended without any official
explanation. Consequently, the recommendations proposed about the trade-in scheme in next
section are only offered with the assumption that the trade-in scheme would eventually
continue to be developed in China.
There are also potential improvements that could be made to the questionnaire design. The
questionnaire was designed in the form of a matrix to gain detailed information regarding
various categories of e-waste. The matrix questions provided accurate and extensive
information regarding complex questions such as e-waste recycling behaviour regarding seven
categories of e-waste. However, matrix questions could make it more difficult for participants
to understand the questions because it seems complex at first sight. This might be one reason
why some participants did not finish all the questions in the questionnaire. Moreover,
although school-distribution of questionnaires showed quick and numerically acceptable
responses (refer to Chapter 5.3.3 for the distribution method), the majority of survey
participants were in a similar age group. There were 74% of survey households (N=469) in an
age group ranging from 36-45 years in Field Study B.
This research adopted the TPB model for investigating the factors that influence households’
recycling behaviour. The main factors were concluded from the fieldwork and were based on
469 effective questionnaires. However, the sub-factors (refer to Table 8-2) were mainly
derived from a small number of open-ended interviews. More sub-factors that influence
households’ recycling behaviour could exist but have not been identified from such a limited
217
sample size. In addition, the factors that influence households’ behaviour may yield different
results if other behavioural models and research methods were applied (Chapter 5.3.1
discusses other behavioural models).
9.4. Recommendations
Clearly, current knowledge of many aspects of WEEE management in China is inadequate. The
formal recycling system in China is still in its early stage and the informal recycling sector may
need to be encouraged in the short term until the formal system develops. Since the
government is concerned with the seriousness of environmental impacts, more and more
formal e-waste collection infrastructure and recycling plants have been established and
encouraged to be used. Due to the developing collection infrastructure and increasing
household environment awareness, there is a trend for households to dispose of their e-waste
and recyclable waste through other collection channels rather than the traditional informal
collectors.
This research brings greater understanding to the field and proposes the strategy of
formalizing and guiding the informal sectors by providing valuable empirical support from the
results of the field studies. From this research, as a way to mitigate the negative impacts
resulting from informal recycling, there are two basic strategies to improve the e-waste
recycling systems. These are formalizing informal recycling sectors and strengthening the
formal recycling sectors. First, the informal sector offers many advantages in the collection and
recycling of e-waste in China. Recommendations arising from this research include creating
greater integration between the efficiency of informal collection and recycling operations and
the cleaner downstream processing of the formal recycling plants. Second, in addition to
formalizing existing informal recycling sectors, gradually reinforcing the strength of the formal
recycling sectors is still necessary if a comprehensive WEEE recycling system is to develop in
218
China. Followed by these two basic strategies, recommendations for e-waste management in
China address the following aspects:
9.4.1. Use of informal recycling sectors
Due to the rudimentary nature of the informal recycling activities and their polluting influence,
many of their advantages have been undervalued. This study has identified the advantages of
informal collection, dismantling and reuse operations within the urban area of Tianjin. Field
study A indicated that environmental impacts resulting from informal recycling sectors are not
such a problem in cities and far more serious in the end-processing workshops in rural areas.
After removal of valuable products and components for local second-hand market, residual e-
scrap was sent out of Tianjin for end processing. In order to mitigate pollution resulting from
end-processing recycling activities in the rural areas, a strategy based on the results of the
research is proposed. There are two aspects to the strategy:
1) Preserving the activities operated by informal collectors, second-hand markets and
informal dismantling centres;
2) Encouraging cooperation between informal dismantling centres and formal recycling
plants.
Figure 9-5 shows a possible intervention point that could divert the e-scrap from informal
dismantling centres into formal recycling plants.
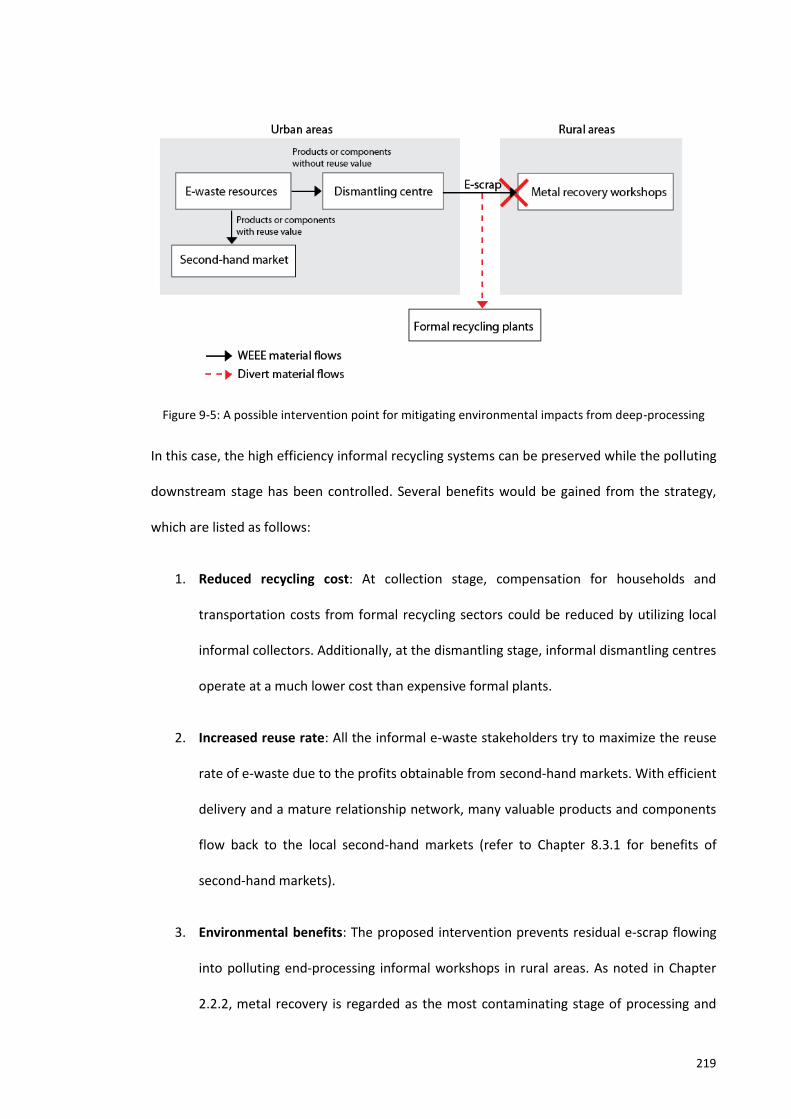
219
Figure 9-5: A possible intervention point for mitigating environmental impacts from deep-processing
In this case, the high efficiency informal recycling systems can be preserved while the polluting
downstream stage has been controlled. Several benefits would be gained from the strategy,
which are listed as follows:
1. Reduced recycling cost: At collection stage, compensation for households and
transportation costs from formal recycling sectors could be reduced by utilizing local
informal collectors. Additionally, at the dismantling stage, informal dismantling centres
operate at a much lower cost than expensive formal plants.
2. Increased reuse rate: All the informal e-waste stakeholders try to maximize the reuse
rate of e-waste due to the profits obtainable from second-hand markets. With efficient
delivery and a mature relationship network, many valuable products and components
flow back to the local second-hand markets (refer to Chapter 8.3.1 for benefits of
second-hand markets).
3. Environmental benefits: The proposed intervention prevents residual e-scrap flowing
into polluting end-processing informal workshops in rural areas. As noted in Chapter
2.2.2, metal recovery is regarded as the most contaminating stage of processing and
220
responsible for 70% of environmental impacts along the e-waste recycling chain
(Hischier, et al., 2005). The formal recycling plants are equipped with suitable
environmental control facilities and are thus capable of safe recycling (Chapter 3.1.3
discusses the technologies applied by formal recycling plants in China). This stage of
end-processing would be far more safely operated by formal recycling plants than end-
processing recycling workshops from the informal sector, who extract precious metals
without any environmental control facilities (Puckett, et al., 2002).
9.4.2. Improving trade-in scheme
Although formalizing the informal collection system could be a strategy for accessing e-waste
resources from households, it is still necessary to build up the formal collection channels for
the long run. There are three suggestions for improving the formal collection channels from
this study: improving trade-in scheme, establishing hazardous waste collection bins in
communities and examining new collection channels.
The newly launched Government running trade-in scheme in 2009 showed promising results
for formal collection channels in terms of a significant market share. From the survey results,
one third of the collection market was claimed by the formal collection channels since the
implementation of the trade-in scheme. Although this scheme was suspended from January
2012, without an official explanation (refer to Chapter 4.3), the instrument and measures for
attracting households to return their obsolete products are essential to enlighten the formal
collection channels.
Survey households in this study suggested that “higher economic reward than informal
collectors” and “safer door-to-door collection services” were two significant reasons that were
responsible for the relatively high market share of e-waste collection gained by the trade-in
scheme. Several limitations of the scheme were also identified such as the limited trading
221
items, inflexible recycling compensations for households and limited responsibilities taken by
producers. If well-developed second-hand markets can complement the inflexible recycling
compensation, the promising trade-in scheme should be continued and improved by bringing
more products into the trading list.
This study suggested that the huge financial investments of the Chinese Government might be
an important reason for the suspension of trade-in scheme because retailers and collection
companies have to be compensated (refer to Chapter 4.3 for procedures of scheme). Such a
financial burden results from the insufficient responsibility taken by stakeholders and the
limited financial incentives for the whole formal recycling systems. Therefore, in order to
operate the trade-in scheme over the longer term, it is necessary to strengthen the EPR
mechanism and extend responsibilities to other stakeholders to provide a robust financial
scheme.
9.4.3. Establishing collection facilities for portable electronic products and
hazardous waste
Despite the limitations with the trade-in scheme when in operation, it was identified as an
effective collection method by householders for collecting large HH appliances. However, Field
Study B indicated that there is a lack of collection channels for small EE and portable electronic
devices, either by formal or informal collection channels in China. The survey from Field Study
B indicated that among all the dumped e-waste, 80% was mobile phones and small EE.
Additionally, as observed in Field Study B, many portable personal electronic devices were
stockpiled by households.
Many studies have indicated that recycling electronic products, particularly mobile phones are
profitable due to the large quantities of valuable metals inside (Bhuie, et al., 2004; Hagelüken
et al., 2005; Sakultung et al., 2007). Since portable electronics are unpopular with informal
222
collectors in China, an opportunity arises for the formal collection channels to establish
effective methods for their collection.
The results from interviews with households indicated that the safe disposal of e-waste should
be an important concern when designing recycling facilities for small EE and portable
electronic products. From the interviews in Shanghai, some households were concerned that
the existence of hazardous waste collection bins in communities is no guarantee that WEEE
will be collected or recycled properly. Similarly, the e-waste discarded in collection bins was
likely to be selectively picked over by informal collectors or scavengers. Given such concerns,
the recycling boxes in Shanghai which are one-way disposal bins (refer to Chapter 7.3.2.4 for
details) are a good example of ensuring safety in disposing of e-waste. Therefore, even for the
cities that have launched hazardous waste collection bins in communities, it is necessary to
improve the design of the bins according to the requirements from households.
Besides the collection facilities for portable electronics, collection infrastructure for hazardous
waste is important for households. For the cities that having e-waste collection bins, from the
researcher’s observations in Shanghai and Beijing, e-waste collection depending on collection
bins in communities was not attracting much recycling activity from households. Other than
household batteries, it was difficult to see any other e-waste in the bins, not to mention
valuable materials. However, it is undeniable that hazardous waste recycling bins and boxes in
Beijing and Shanghai have collected batteries and some other hazardous materials such as
fluorescent tubes, which could lead to heavy metal pollution if landfilled.
Due to a lack of e-waste collection infrastructure, surveyed households in Tianjin had to
dispose their batteries along with municipal solid waste. Field Study B suggested that 76% of
surveyed households directly dumped batteries as trash. However, 80% of surveyed
households are willing to recycle batteries as long as there is convenient collection
infrastructure available. Meanwhile, 46% of surveyed households in Tianjin supported to
223
assign hazardous waste collection bins in communities. It seems that it would be very useful to
assign e-waste collection bins to communities in Tianjin.
9.4.4. Exploring new collection channels
In addition to improving the existing formal collection channels, it is necessary to explore other
effective collection methods, which could learn from, but not duplicate the successful
collection schemes operated in other countries. For example, a new collection scheme has
been launched in some regions of Australia, which offers households with credit points
assessed by the weight of their recyclable bins (Morland, 2012). This collection strategy may
have promise for extension to e-waste collection schemes in China.
When establishing the formal collection channels, it is also necessary to consider the
advantages offered by informal collectors that include door-to-door collection service,
accessibility and transaction time. Formal collection channels could compete with informal
collectors by overcoming the disadvantages of the latter, including economic reward, collection
categories; meanwhile, enhancing the advantages of formal collection channels such as
trustworthiness and environmental pollution of recycling activities. For example, by raising
economic rewards for accepting obsolete products from households, or providing high levels
of trustworthiness; these two strategies have been supported by the fact of promising market
share from trade-in scheme (refer to survey results in Table 7-14).
Additionally, although economic reward recorded the lowest expectation level among the nine
survey indicators, it was shown as an important factor in influencing Chinese households’
recycling behaviour in this study. For example, low economic reward was a reason for
households stockpiling, trading and dumping (refer to Table 8-1). The importance of economic
reward also arose from interviewees’ complaints towards informal collectors in Field Study B.
Another case study from Wang, et al. (2011) also suggested that economic reward is an
224
important factor influencing households’ recycling behaviour in a Beijing survey. Reward for e-
waste recycling is still a necessary part of Chinese households’ recycling habits and cannot be
changed quickly. Even in many developed countries, monetary incentives are an important
reason for a user to return their mobile phones (Ongondo & Williams, 2011b). Therefore, no
reward e-waste recycling is unacceptable for many households in China and providing proper
incentives will be necessary if a reasonable level of obsolete products to be obtained from
households.
9.4.5. Raising environmental awareness
More work needs to be done in raising environmental awareness in China – of producers,
legislators, designers, retailers and end-users/households. As the end-users of e-products,
households have an essential role for e-waste recycling in China because they determine
whether e-waste flows into formal or informal collection channels. Bearing in mind the
competition from informal collectors, raising households’ environmental awareness could
assist the development of the formal collection channels. Environmental pollution of recycling
activities was the second highest rated among the nine indicators from survey results. In other
words, surveyed households have high expectations about environmental indicators than
many other perceived behavioural controls (Indicators from NO.1 – No.5) (refer to Table 7-7 for
survey results).
Such high levels of expectations about the environmental concern offer opportunities for
formal collection channels to attract households by popularizing the hazardous recycling
activities operated by informal recyclers. Although households’ environmental concerns were
high according to the survey results, such “environmental concern” is only perceived in a very
general sense. The negative impacts that result from deep-recycling activities in rural areas are
unlikely to be known by households living in urban areas. What they see of the informal
sectors is convenient informal collectors and the emotionally attractive title of “recyclers”. No
225
matter how e-waste is recycled after transactions are completed and how many toxic
substances are released from recycling treatments, households living in urban areas are
unlikely to be aware of that. Therefore, educating people about the existence of toxic
substances within e-waste items and the hazardous nature of informal collectors’ recycling
operations could be an effective method for influencing household Recycling attitudes and
recycling behaviour.
9.4.6. Strengthen WEEE legislation and EPR in China
In general, effective collection channels cannot be provided without an effective EPR and
legislation. Although the embryonic WEEE legislation and EPR in China seems to have covered
the majority of WEEE issues, the dominant informal recycling sector has been largely ignored.
Even for the formal recycling sector, without a robust EPR, it is difficult to maintain high levels
of e-waste collection for long such as the trade-in scheme. As discussed in Chapter 4, the
Chinese Government took the major share of financial responsibility for the trade-in scheme
and only limited responsibilities were accepted by the producers. In order to operate both
formal and informal recycling systems, it is necessary to provide a robust financial scheme and
extend responsibilities to other stakeholders.
Responsibilities for each stakeholder should not only be listed in the WEEE legislation,
enforcement should be ensured by a well-defined infringement and penalty system. A logistics
network and financial support for the formal recycling systems should be established and be
incorporated into better EPR principals designed specifically for the Chinese situation.
Improved WEEE legislation and EPR must be updated whilst at the same time keeping the
productive existing informal recycling sectors in mind. As the collection channels develop, the
relevant WEEE directives for stakeholders should also be updated correspondingly.
226
9.5. Further research
This study proposes two strategies, which retain the cost-effective nature of the operations
and at the same time reduce opportunities for e-waste being deep-processed by informal
sectors. However, it is still a challenge to forge the cooperation between the formal and
informal sector. In addition to the economic incentives that were concerned in this study,
informal sectors might have other concerns. For example, the strategy of bridging dismantling
centres to formal recycling plants (refer to Section 9.4.1) might not be acceptable in a heavy
deep-processing area such as Guiyu, where the majority of residents live on the informal
recycling business. Strategies applied in different regions must adapt to the local context since
expectations of stakeholders may vary in different areas across China. Effective incentives for
informal stakeholders need to be investigated by undertaking further studies, preferably by
testing them in advance in a pilot study.
Before proposing new WEEE management strategies, fieldwork is necessary to understand the
demographics of informal stakeholders and their different functions, as well as e-waste
material flows locally. Given the small sample size in Field Study A, further field studies with
better sampling of interviewees in each stakeholder group over a wider geographical range,
would gain much more comprehensive information.
Households have an essential role for e-waste recycling in China. It is worth noting that when
considering strategies likes assigning hazardous waste collection bins or other new formal
collection channels, households’ reaction and their preferences are particularly crucial.
Therefore, investigating the households’ recycling behaviour and their feedback about trial
collection schemes is necessary in further studies. Besides, households’ consumption habits
are responsible for e-waste generation. Therefore, their consumption behaviour provides e-
waste resources for the informal recycling systems, and also fuels the negative environmental
impacts consequences resulting from end-processing informal e-waste processing. Therefore,
227
for further studies, the methods to prolong the products’ lifespan and ways to guide
households to dispose of e-waste through formal collection channels rather than informal
ones are essential areas to explore.
Although this study identified factors that influence households’ recycling behaviour based
upon a modified TPB model, the means by which the model was upgraded was by qualitative
methods (refer to Section 8.4). As a result, it is hard to evaluate the relative importance of the
factors influencing households’ recycling behaviour. Further studies could apply by other
research methods and behavioural models (refer to Chapter 5.3.1 for other behavioural
models) to explore the relation between the dependent variables and independent variables
based on the adapted TPB model which this study used.
228
References
Adam, M. C., & Ginsburgh, V. (1985). The effects of irregular markets on macroeconomic policy: some estimates for Belgium. European Economic Review 29 (1), 15-33.
Adeola, F. O., & Francis, O. A. (2011). Hazardous wastes, industrial disasters, and environmental health risks : local and global environmental struggles. New York, NY: New York, NY : Palgrave Macmillan.
Adler, P. A., & Adler, P. (1994). Observational Techniques: Thousand Oaks, CA: Sage Publications.
Ajzen, I. (1991). The theory of planned behavior. Organizational Behavior and Human Decision Processes, 50(2), 179-211. doi: 10.1016/0749-5978(91)90020-t. http://www.sciencedirect.com/science/article/pii/074959789190020T
Ajzen, I. (2006). The theory of planned behavior. Organizational Behavior and Human Decision Processes Retrieved 2, 50, from http://people.umass.edu/aizen/tpb.diag.html#null-link
Australia Government, Department of Sustainability, Environment, Water, Population and Communities. (2011). Product Stewardship (Televisions and Computers) Regulations, from http://www.environment.gov.au/settlements/waste/ewaste/regulations/index.html
Backstrom, C. H., & Charles Herbert, B. (1963). Survey research. Chicago: Chicago Northwestern University Press.
Baike. (2011a). The scheme of trade-in in China, from http://www.hudong.com/wiki/%E5%AE%B6%E7%94%B5%E4%BB%A5%E6%97%A7%E6%8D%A2%E6%96%B0
Baike. (2011b). Extend the Trade-in policy to the whole China, from http://baike.baidu.com/view/3729685.htm?fromTaglist
BAN, Basel Action Network. (2002). Exporting harm: the high-tech trashing of Asia. The Basel Action Network (BAN), The Silicon Valley Toxics Coalition (SVTC), Toxics Link India, SCOPE (Pakistan), Greenpeace China. Seattle, WA, and San Jose, CA
Bhuie, A. K., Ogunseitan, O. A., Saphores, J.-D. M., et al. (2004). Environmental and economic trade-offs in consumer electronic products recycling: a case study of cell phones and computers. Paper presented at the IEEE Computer Society Washington, DC, USA.
BiBo, & Yamamoto, K. (2010). Characteristics of E-waste recycling systems in Japan and China. World Academy of Science, Engineering and Technology.
Biswas, A., Licata, J. W., McKee, D., et al. (2000). The Recycling Cycle: An Empirical Examination of Consumer Waste Recycling and Recycling Shopping Behaviors. Journal of Public
229
Policy & Marketing, 19(1), 93-105. doi: 10.2307/30000490. http://www.jstor.org/stable/30000490
BJCOC, Beijing Municipal Commission of Commerce. (2010, Sep, 2010). Measures of trial trade-in scheme Retrieved 27th, Sep, 2012, from http://www.bjmbc.gov.cn/web2/fcsArticleDetail.jsp?article_id=12839278440001&column_id=12499735050001
Blackman, A. (2000). Informal sector pollution control: what policy options do we have? Resources for the future. Washington, D.C.USA., 2000
Boeni, H., Silva, U., & Ott, D. (2006). E-Waste Recycling in Latin America: Overview, Challenges and Potential. Empa, Swiss Federal Laboratories for Material Testing and Research. Switzerland
Bourque, L. B., & Fielder, E. P. (1995). Overview of Self-Administered Questionnaires. How to Conduct Self-Administered and Mail Surveys. SAGE Publications, Inc. Thousand Oaks, USA: SAGE Publications, Inc.
Briassoulis, H. (1999). Sustainable development and the informal sector: an uneasy relationship? Journal of Environment and Development, 8(3), 213-237.
Brigden, K., Labunska, I., Santillo, D., et al. (2005). Recycling of Electronic Wastes in China and India: Workplace & Environmental Contamination. Greenpeace International Retrieved 16th, Dec,2009, from http://www.greenpeace.org/raw/content/india/press/reports/recycling-of-electronic-wastes.pdf
Brigden K, L. I., Santillo D, Johnston P. (2008). Chemical contamination at e-waste recycling and disposal sites in Accra and Korforidua, Ghana. Greenpeace International, Amsterdam, The Netherlands. Greenpeace Research Laboratories Technical Note, from http://www.greenpeace.org/raw/content/international/press/reports/chemical-contamination-at-e-wa.pdf
Buckingham, A., & Alan, B. (2004). The survey methods workbook : from design to analysis. Cambridge, U.K. Malden, Ma.: Cambridge, U.K. Malden, Ma. : Polity.
Burn, S. M., & Oskamp, S. (1986). Increasing Community Recycling with Persuasive Communication and Public Commitment. Journal of Applied Social Psychology, 16(1), 29-41. doi: 10.1111/j.1559-1816.1986.tb02276.x. http://dx.doi.org/10.1111/j.1559-1816.1986.tb02276.x
CCID. (2010). Mobile phones users in China in 2010, from http://comm.ccidnet.com/art/1537/20090630/1812911_1.html
CEC, Commission of the European Communities. (2008). Commission staff working paper accompanying the proposal for a directive of the European Parliament and of the Council on waste electrical and electronic equipment (WEEE) (recast). Summary of the impact assessment, SEC 2934. Commission of the European Communities (CEC), Brussels, Belgium., from http://eurlex.europa.eu/Notice.do?val=484253:cs&lang=en&list=506087:cs,505637:cs,504254:cs,504814:cs,499467:cs,499047:cs,488044:cs,484207:cs,484236:cs,484253:cs,&pos=10&page=1&nbl=48&pgs=10&hwords=> [Last accessed 12 January 2012].
http://www.bjmbc.gov.cn/web2/fcsArticleDetail.jsp?article_id=12839278440001&column_id=12499735050001
http://www.bjmbc.gov.cn/web2/fcsArticleDetail.jsp?article_id=12839278440001&column_id=12499735050001
http://www.greenpeace.org/raw/content/international/press/reports/chemical-contamination-at-e-wa.pdf
230
Chi, X., Porte, M. S., Wang, M. Y. L., et al. (2011). Informal electronic waste recycling: A sector review with special focus on China. Waste Management, 31, 731-742.
China Environmental Law. (2009). China: WEEE finally did it Retrieved 26 May 2009, 2009, from http://www.chinaenvironmentallaw.com/2009/03/06/china-weee-finally-did-it/
Chong, J., Mason, L., Pillora, S., et al. (2009). Product stewardship schemes in asia: China, south korea, japan, and taiwan. Institute for Sustainable Futures, University of Technology, Sydney, Sydney.
Chung, S.-S., & Zhang, C. (2011). An evaluation of legislative measures on electrical and electronic waste in the peoples republic of China. Waste Management 31 2638-2646.
Chung, S.-W., & Murakami-Suzuki, R. (2008). A comparative study of e-waste recycling systems in Japan, South Korea and Taiwan from the EPR perspective: implications for developing countries. Promoting 3Rs in developing countries: lessons from the Japanese experience, Chiba, IDE-JETRO
Chung, S. s., Lau, K. y., & Zhang, C. (2010). Generation of and control measures for e-waste in Hong Kong. Waste Management, 31, 544-554.
Clean up. (2009). Mobile phones fact sheet. Clean up. Australia, from http://www.cleanup.org.au/PDF/au/cleanupaustralia_mobilephone_factsheet.pdf
Cooper, T. (2004). Inadequate life? Evidence of consumer attitudes to product obsolescence. Journal of Consumer Policy, 27(4), 421-449.
Cooper, T. (2005). Slower Consumption- Reflections on product life spans and the "Throwaway Society". Journal of Industrial Ecology, 9(1-2), 51-67.
Cooper, T. (2012). Longer lasting products: alternatives to the throwaway society: Gower Publishing, Ltd.
Creswell, J. W. (2009). Research design : qualitative, quantitative, and mixed methods approaches. Thousand Oaks, Calif.: Thousand Oaks, Calif. : Sage Publications.
Creswell, J. W., & John, W. C. (2007). Designing and conducting mixed methods research. Thousand Oaks, Calif.: Thousand Oaks, Calif. : SAGE.
Creswell, J. W., Plano Clark, V. L., Gutmann, M. L., & Hanson, W. E. (2003). Advanced mixed methods research designs. In I. A. T. C. Teddlie (Ed.), Handbook of mixed methods in social and behavioral research (pp. 209-240): Thousand Oaks, CA: Sage.
Crotty, M. (1998). The foundations of social research: meaning and perspective in the research progress: St Leonards, NSW : Allen & Unwin
Cui, J., & Forssberg, E. (2003). Mechanical recycling of waste electric and electronic equipment: a review. Journal of Hazardous Materials, 99(3), 243–263.
Curlee, T. R. (1986). The economic feasibility of recycling: A case study of plastic wastes.
231
Dalrymple, I., Wright, N., Kellner, R., Bains, N., Geraghty, K., Goosey, M. & Lightfoot, L. (2007). An integrated approach to electronic waste (WEEE) recycling. Circuit World, 33(2), 52-58.
Darby, L., & Obara, L. (2005). Household recycling behaviour and attitudes towards the disposal of small electrical and electronic equipment. Resources, Conservation and Recycling, 44(1), 17-35. doi: 10.1016/j.resconrec.2004.09.002. http://www.sciencedirect.com/science/article/pii/S0921344904001491
Davis, G., & Herat, S. (2008). Electronic waste: The local government perspective in Queensland, Australia. Resources, Conservation and Recycling, 52(8), 1031-1039.
Davis, G., & Herat, S. (2010). Opportunities and constraints for developing a sustainable E-waste management system at local government level in Australia. Waste Management & Research, 28(8), 705-713.
Davis, G., & Morgan, A. (2008). Using the Theory of Planned Behaviour to determine recycling and waste minimisation behaviours: A case study of Bristol City, UK. The Australian Community Psychologist, 20(1), 105-117.
De Young, R. (1986). Some Psychological Aspects of Recycling. Environment and Behavior, 18(4), 435-449. doi: 10.1177/0013916586184001. http://eab.sagepub.com/content/18/4/435.abstract
Dempsey, M., & Mcintyre, K. (2009). The role of Collective versus Individual Producer Responsibility in e-waste Management: Key learnings from around the world Electronic Waste Management, (pp. P212-P235): The Royal Society of Chemistry.
Deng, W. J., Zheng, J. S., Bi, X. H., et al. (2007). Distribution of PBDEs in air particles from an electronic waste recycling site compared with Guangzhou and Hong Kong, South China. Environment International, 33, 1063-1069.
Derijcke, E., & Uitzinger, J. (2006). Residential behavior in sustainable houses. In Verbeek and A. Slob (eds.) (Ed.), User Behavior and Technology Development: Shaping Sustainable Relations Between Consumers and Technologies (pp. 119-126).
Dhaka. (2010). National 3R Strategy For Waste Management. Department of Environment, Ministry of Environment and Forest, Government of the People's Republic of Bangladesh, from http://www.wasteconcern.org/Publication/National_3r_Strategy.pdf
Dillman, D. A., & Don, A. D. (2007). Mail and Internet Surveys : The Tailored Design Method, 2007 Update. Hoboken: Hoboken John Wiley & Sons, Inc.
Duana, H., Eugsterb, M., Hischierb, R., et al. (2009). Life cycle assessment study of a Chinese desktop personal computer. Science of the total enviroment, 4 0 7, 1 7 5 5 - 1 7 6 4.
El-Haggar, S. M. (2007a). Sustainable Development and Industrial Ecology Sustainable Industrial Design and Waste Management: Cradle-to-cradle for sustainable development (pp. P86).
El-Haggar, S. M. (2007b). Zero pollution and 7Rs rule Sustainable Industrial Design and Waste Management: Cradle-to-cradle for sustainable development (pp. P12).
232
Equalization, S. B. o. (2012). Electronic Waste Recycling Fee Retrieved 12nd, Dec, 2012, from http://www.boe.ca.gov/pdf/pub95.pdf
ETBC, Electronic Take Back Coalition. (2010). Facts and figures on e-waste and recycling, from http://www.electronicstakeback.com/wp-content/uploads/Facts_and_Figures_on_EWaste_and_Recycling.pdf
EU. (2002). Directive 2002/96/EC of the European parliament and of the council of 27 January 2003 on waste electrical and electronic equipment (WEEE) — joint declaration of the European parliament, the council and the commission relating to article 9. Official Journal L037:0024-39 [13/02/2003; 2002a http://europa.eu.int/eur-lex/en/].
EU. (2012). DIRECTIVE 2012/19/EU OF THE EUROPEAN PARLIAMENT AND OF THE COUNCIL of 4 July 2012 on waste electrical and electronic equipment (WEEE). http://eur-lex.europa.eu/LexUriServ/LexUriServ.do?uri=OJ:L:2012:197:0038:0071:en:PDF
EU., European Parliament and The Council. (2003). Directive 2002/96/EC of 27 January 2003 on waste electrical and electronic equipment (WEEE). Official Journal of the European Union, 13.2.2003(L37), 24-38.
European Communities. (2006). Implementation of the Waste Electric and Electronic Equipment Directive in the EU. technical report series. European Commission,Directorate-General Joint Research Centre,institute for prospective technological studies
Evans, J. R., & Mathur, A. (2005). The value of online surveys. Internet Research, 15(2), 195 - 219.
EzineMark, Net,. (2011). Open Guiyu Electronics Recycling Industry Waste Status - Used Household Appliances, Washing Machines, from http://business.ezinemark.com/open-guiyu-electronics-recycling-industry-waste-status-used-household-appliances-washing-machines-31ea4399096.html
Feng, H., Zhang, J., & Lu, M. (2007). Organization and Operation Status in Waste Material Recycling Market. Environment and Sustainability, 4.
Finlay, A., & Liechti, D. (2008). e-waste assessment South Africa. E-waste Association of South Africa (eWASA)
Fiske, S. T., & Taylor, S. E. (1991). Social Cognition. New York: McGraw-Hill.
Folkes, V. S. (1988). Recent Attribution Research in Consumer Behavior: A Review and New Directions. Journal of Consumer Research, 14(4), 548-565. http://www.jstor.org/stable/2489160
Fu, J., Wang, Y., Zhou, L., et al. (2012). Pollution of hazardous substances in the WEEE recycling centre, Guiyu, in Chinese. Humanities and Social Sciences. http://wen.org.cn/modules/article/view.article.php/3249
Fu mao, Y., Xian ming, D., & Liang, H. j. (2011). An empirical research on recycling behavior of waste electrical and electronic equipment and its influence factor. China Environmental Science, 31(12), 2083-2090.
233
Gaidajis, G., Angelakoglou, K., & Aktsoglou, D. (2010). E-waste: Environmental problems and current management. Journal of Engineering Science and Technology Review, 3(1), 193-199.
GAO. (2008). Electronic Waste, Harmful US Exports Flow Virtually Unrestricted Because of Minimal EPA Enforcement and Narrow Regulation. General Accountability Office, Washington, DC, US.
Geiselman, B. (2002, Feb. 1, 2002). Electronics Recyclers Use of Prison Labor Makes Waves, from http://www.wastenews.com.
Gërxhani, K. (2004). The Informal Sector in Developed and Less Developed Countries: A Literature Survey. Springer 120 ( ), 267-300.
Gold, R. L. (1958). Roles in Sociological Field Observations. Social Forces, 36(3), 217-223.
Goodman., L. A. (1961). Snowball sampling Annals of Mathematical Statistics (Vol. 32: 148-170).
Goosey, M. (2004). End-of-life electronics legislation - an industry perspective. . Circuit World, 30(2), 41-45.
Graham, P. (2003). Building ecology: first principles for a sustainable built environment. Oxford : Blackwell Science.
Gray, D. E. (2004). Doing research in the real world. London: Sage Publications.
Guagnano, G. A., Stern, P. C., & Dietz, T. (1995). Influences on Attitude-Behavior Relationships. Environment and Behavior, 27(5), 699-718. doi: 10.1177/0013916595275005. http://eab.sagepub.com/content/27/5/699.abstract
Guba, E. G., & Lincoln, Y. S. (1994). Competing paradigm in qualitative research: Thousand Oaks: Sage Publications.
Guerin, D., Crete, J., & Mercier, J. (2001). A Multi-level Analysis of the Determinants of Recycling Behavior in the European Countries. Social Science Research, 30(2), 195-218. doi: 10.1006/ssre.2000.0694. http://www.sciencedirect.com/science/article/pii/S0049089X0090694X
Guha-Khasnobis, B., Kanbur, R., & Elinor, O. (2006). Beyond formality and informality Linking the Formal and Informal Economy: Concepts and Policies. (pp. 1-4). New York: WIDER Angle.
Guo, Q. M. (2011). The ideas of the development of a circular economy in the "Twdlfth Five-Year" Plan of China, from http://www.uncrd.or.jp/env/spc/docs/3rd_3r/PS5-2_NDRC-China_Guo%20and%20Li-new.pdf
Hagelüken, C., Refining, U. P. M., & Greinerstraat, A. (2005). Recycling of electronic scrap at Umicore's integrated metals smelter and refinery. Paper presented at the Proceedings of EMC.
234
Hamilton-Endicott, A. (2001). How Do You Junk Your Computer? TIME MAGAZINE.
Hansmann, R., Bernasconi, P., Smieszek, T., et al. (2006). Justifications and self-organization as determinants of recycling behavior: The case of used batteries. Resources, Conservation and Recycling, 47(2), 133-159. doi: 10.1016/j.resconrec.2005.10.006. http://www.sciencedirect.com/science/article/pii/S0921344905001552
Hart, K. (1973). Informal Income Opportunities and Urban Employment Planning. Journal of Modern African Studies, 11(1), 61-89.
He, W. Z., Li, G. M., Ma, X. F., et al. (2006). WEEE recovery strategies and the WEEE treatment status in China. Journal of Hazardous Materials, 136(3), 502-512.
Herat, S. (2007). Sustainable Management of Electronic Waste (e‐Waste). Clean–Soil, Air, Water, 35(4), 305-310.
Hester, R. E., & Harrison, R. M. (2009). Legislative influences on electronic recycling Electronic Waste Management- Design, Analysis and Application (pp. P003-P009): The Royal Society of Chemistry.
Hewson, C. (2006). MIXED METHODS RESEARCH London, UK: SAGE Publications, Ltd.
Hicks, C., Dietmar, R., & Eugster, M. (2005). The recycling and disposal of electrical and electronic waste in China-legislative and market responses. Environmental Impact Assessment Review, 25, 459-471.
Hischier, R., Wa g̈er, P., & Gauglhofer, J. (2005). Does WEEE recycling make sense from an environmental perspective?The environmental impacts of the Swiss take-back and recycling systems for waste electrical and electronic equipment (WEEE). Environmental Impact Assessment Review, 25, 525-539.
Hornik, J., Cherian, J., Madansky, M., et al. (1995). Determinants of recycling behavior: A synthesis of research results. Journal of Socio-Economics, 24(1), 105-127. doi: 10.1016/1053-5357(95)90032-2. http://www.sciencedirect.com/science/article/pii/1053535795900322
Hosoda, E. (2007). International aspects of recycling of electrical and electronic equipment: material circulation in the East Asian region. Journal of Material Cycles and Waste Management, 9(2), 140-150.
Hu, X., & Pan, L. (2009). Issues proposed by households regarding the new trade-in scheme Retrieved 27th, Sep, 2012, from http://xinmin.news365.com.cn/jd/200906/t20090611_2353713.htm
Huang, P., Zhang, X., & Deng, X. (2006). Survey and analysis of public environmental awareness and performance in Ningbo, China: a case study on household electrical and electronic equipment. Journal of Cleaner Production, 14, 1635-1643.
Huaxin green spring. (2006). Where does e-waste going in Nanning, from http://www.hxepd.com/showlist.asp?id=194
235
Huisman J, M. F., Kuehr R, Maurer C, Ogilvie S, Poll J, Delgado C, Artim E, Szlezak J, Stevels A. (2008). 2008 Review of Directive 2002/96 on Waste Electrical and Electronic Equipment (WEEE), Final Report. Bonn: United Nations University, 2007
Huo, X., Peng, L., Xu, X.J., Zheng, L.K., Qiu, B., Qi, Z.L., Zhang, B., Han, D., Piao, Z.X.,. (2007). Elevated blood lead levels of children in Guiyu, an electronic waste recycling town in China. Environmental Health Perspectives, 115(7), 1113-1117.
Hurlimann, A., Dolnicar, S., & Meyer, P. (2009). Understanding behaviour to inform water supply management in developed nations – A review of literature, conceptual model and research agenda. Journal of Environmental Management 91, 47-56.
IBM. (2010). IBM SPSS Statistics 19 Core System User's Guide. from http://www.sussex.ac.uk/its/pdfs/SPSS_Core_System_User_Guide.pdf
Ifeng. (2012a, 12nd, March, 2012). End of the trade-in policy affects the sales performance of household appliances Retrieved 4th, April, 2012, from http://house.ifeng.com/home/roll/detail_2012_03/12/13128296_0.shtml
Ifeng. (2012b, 12nd, April, 2012). The profits from the e-waste recycling industry Retrieved 16th, June, 2012, from http://tech.ifeng.com/it/detail_2012_05/10/14431304_0.shtml
International Copper Study Group. (2003). International Copper Study Group. ICSG Information CircularWaste Electric and Electronic Equipment (WEEE); http://www.icsg.org/News/Infocirculars/ICSGICSGTrendsinDynamic.pdf.
IT Times. (2009, Oct, 2009). Feedback of the trade-in practice from domestic households Retrieved 26th, June, 2012, from http://homea.people.com.cn/GB/10153289.html
Jinglei, Y., Meiting, J., & Williams, E. (2009, 18-20 May 2009). Waste electrical and electronic equipment recycling in China: Practices and strategies. Paper presented at the Sustainable Systems and Technology, 2009. ISSST '09. IEEE International Symposium on Sustainable Systems and Technology, Tempe,Arizona, USA, May 18-20.
Jofre, S., Morioka, T. (2005). Waste management of electrical and electronic equipment: comparative analysis of end-of-life strategies. Journal of Material Cycles and Waste Management, 7(1), 24-32.
Jupp, V. (2006). The Sage dictionary of social research methods: Sage Publications, inc.
Kang, H., & M.Schoenung, J. (2005). Electronic waste recycling: A review of U.S. infrastructure and technology options. Resource, Conservation and Recycling(45), 368-400.
Ke, Q. (2009). The different consumption between rural and urban areas in China. Växjö University Sweden.
Kejing, Z., & Shanshan, W. (2009). improving Chinese WEEE recycling system based on recycling system of other countries. China population, Resources and Environment, 19(2).
236
Ketai, H., Li, L., & Wenying, D. (2008, 3-5 June 2008). Research on recovery logistics network of Waste Electronic and Electrical Equipment in China. Paper presented at the Industrial Electronics and Applications, 2008. ICIEA 2008. 3rd IEEE Conference on.
Lee, J.-c., Song, H. T., & Yoo, J.-M. (2007). Present status of the recycling of waste electrical and electronic equipment in Korea. Resources, Conservation and Recycling, 50(4), 380-397. doi: http://dx.doi.org/10.1016/j.resconrec.2007.01.010. http://www.sciencedirect.com/science/article/pii/S0921344907000250
Lee, J. W., Jones, P. S., Mineyama, Y., et al. (2002). Cultural differences in responses to a likert scale. Research in Nursing & Health, 25(4), 295-306. doi: 10.1002/nur.10041. http://dx.doi.org/10.1002/nur.10041
Lee, S.-c., & Na, S.-i. (2010). E-Waste Recycling Systems and Sound Circulative Economies in East Asia: A Comparative Analysis of Systems in Japan, South Korea, China and Taiwan. Sustainability, 2(2071-1050), 1632-1644. doi: 10.3390/su2061632.
Lehman, Lee, & Xu. (2009). Overview of the new China WEEE regulations Retrieved 26 May 2009, from http://www.lehmanlaw.com/press-room/china-law-news/china-news/china-news-single-display-llx/article/5/overview-of.html
LEWIS, H. A., & Gertsakis, J. (2001). Design + Environment: A Global Guide to Designing Greener Goods: Greenleaf Pub.
Li, J., Tian, B., Liu, T., et al. (2006). Status quo of e-waste management in mainland China. Springer-verlag, 8, 13-20.
Li, L., Yuqiang, L., Xuemei, Z., et al. (2008). Electrical and electronic waste in China. E-waste management, 39-43.
Li, X., Park, M., & Demirbilek, O. (2012a). Comparision of informal and regulated WEEE collection methods in China Paper presented at the International Conference On Environmental Engineering and Applications, ICEEA, 2012, Dubai, UAE.
Li, X., Park, M., & Demirbilek, O. (2012b). Informal WEEE Recycling in China: A field Study of Stakeholders in Tianjin. Paper presented at the International Conference on Environment, Chemistry and Biology
Li, Y., Xu, X., Wu, K., et al. (2008). Monitoring of lead load and its effect on neonatal behavioral neurological assessment scores in Guiyu, an electronic waste recycling town in China. J Environ Monit, 10(10), 1233-1238.
Li, Z. (2010). Trade-in from retailer in China, from http://gcontent.oeeee.com/2/d9/2d969e2cee8cfa07/Blog/74d/b9b8cc.html
Lilley, D. (2009). Design for sustainable behaviour: strategies and perceptions. Design Studies, 30(6), 704-720. doi: http://dx.doi.org/10.1016/j.destud.2009.05.001. http://www.sciencedirect.com/science/article/pii/S0142694X09000301
237
Lindquist, T. (2000). Extended Producer Responsibility in Cleaner Production: Plicy principle to promote environmental improvements of product systems. Doctoral Dissertation, Lund University, Sweden.
Liu, X., Tanaka, M., & Matsui, Y. (2006). Electric and Electronic Waste management in China: progress and the barriers to overcome. Waste Management & Research, 24(1), 92-101.
Liu., X., Tanaka., M., & Matsui., Y. (2006). Generation amount prediction and material flow analysis of electronic waste: case study in Beijing. Waste management & research, 24(434).
Lu, R. (2008). The problem of E-waste China Today Retrieved 18th, Apr, 2011, from http://www.china.org.cn/english/China/238544.htm
MacArthur, E. (2012). Towards the Circular Economy: an economic and business rationale for an accelerated transition. Ellen MacArthur Foundation, Mckinsey & Company, from http://www.ellenmacarthurfoundation.org/business/reports/ce2012#
Manhart, A. (2007). Key social impacts of electronics production and WEEE-Recycling in China. . Ö ko-Institut e.V, Freiburg.
Mannetti, L., Pierro, A., & Livi, S. (2004). Recycling: Planned and self-expressive behaviour. Journal of Environmental Psychology, 24(2), 227-236. doi: 10.1016/j.jenvp.2004.01.002. http://www.sciencedirect.com/science/article/pii/S0272494404000209
Manomaivibool, P., a, T. L., & Tojo, N. (2008). EPR in a non-OECD context: an introduction to research projects on the management of WEEE. Paper presented at the 8th Asia Pacific Roundtable for Sustainable Consumption and Production.
Mansur, M. (1997). Prices for recyclables continue to drop.(Originated from Knight-Ridder Newspapers). Retrieved Retrieved September 25, 2012 from HighBeam Research http://www.highbeam.com/doc/1G1-19641918.html
Martin, S.-p., & Geering, A.-C. (2010). Opportunities and threats of current E-waste collection system in China: A case study from taizhou with a focus on refrigerators, washing machines, and televisions. ENVIRONMENTAL ENGINEERING SCIENCE, 27(1).
McDonough, W., & Braungart, M. (2002). Cradle to cradle: remaking the way we make things. New York.
McKenzie-Mohr, D. (2000). Fostering sustainable behavior through community-based social marketing. American Psychologist, 55(5), 531-537. doi: 10.1037/0003-066X.55.5.531.
Medina, M. (2000). Scavenger cooperatives in Asia and Latin America. Resources, Conservation and Recycling. 31, 1, 51-69.
Meinhardt. (2006). Computer & peripherals material project. Infrastructure & Environment Pty Ltd 2001, from http://www.deh.gov.au/settlements/publications/waste/electricals/computerreport/index.html
238
MIIT, Ministry of Industry and Information Technology of the People's Republic of China. (2012). PC users has reached 1 billion in China, from http://finance.qq.com/a/20120330/007435.htm
Miller, T. R., Gregory, J., Duan, H., et al. (2012). Characterizing Transboundary Flows of Used Electronics: Summary Report: Massachusetts Institute of Technology, Material Systems Laboratory.
Millward, S. (2012). HP, Samsung, Panasonic Found Dumping New But Defective Gadgets in China Landfill Retrieved 10th, May, 2012, from http://www.techinasia.com/hp-samsung-panasonic-amd-dumping-at-china-guiyu-landfill/
Mo, H., ZongguoWen, & Chen, J. (2009). China's recyclable resources recycling system and policy: A case study in Suzhou. Resources, Conservation and Recycling, 53, 409-419.
MOF, Chinese Ministry of Finance. (2009). Trade-in measures for the implementation of Waste of household appliances Chinese National Ministry of Finance, Commerce Departement of Chinese Government, National Development and Reform Commission,Ministry of Information Industry. Beijing
MOFCOM, Ministry of Commerce of the People's Republic of China. (2011). Collection from Retailer supported by Chinese Government, from http://www.mofcom.gov.cn/
Mont, O. (2004). Product-service systems: Panacea or myth? Doctoral Dissertation, IIIEE, Lund University, Sweden.
Moreno-Sanchez, R. D. P., & Maldonado, J. H. (2006). Surviving from garbage: the role of informal waste-pickers in a dynamic model of solid-waste management in developing countries. Environmental and Development Economics, 11, 371-391.
Moreno, M. A., Lilley, D., & Lofthouse, V. A. (2011). Utilising a consumer-focused approach to influence sustainable consumption. Paper presented at the 'State of the Art' in Sustainable Innovation and Design, 16th International Conference, , Farnham, UK.
Morland. (2012). Green waste collection Retrieved Jan, 2013, from http://www.moreland.vic.gov.au/environment-and-waste/garbage-collection/green-waste-collection.html
Morse, J. M. (1991). Approaches to Qualitative-Quantitative Methodological Triangulation. Nursing Research, 40(2), 120-123.
National Bureau of Statistics of China. (2010). China statistical yearbook. BeiJing: State Bureau of Statistics Retrieved from http://www.stats.gov.cn/tjsj/ndsj/2011/indexeh.htm.
National Bureau of Statistics of China. (2011). China statistical yearbook. BeiJing: State Bureau of Statistics Retrieved from http://www.stats.gov.cn/tjsj/ndsj/2011/indexeh.htm.
National Bureau of Statistics of China. (2012). China statistical yearbook. BeiJing: State Bureau of Statistics Retrieved from http://www.stats.gov.cn/tjsj/ndsj/2011/indexeh.htm.
Nawangpalupi, C. B. (2010). Scenario development in product service systems: a collaborative design process to support sustainable consumption. In O. B. E. F. o. B. E. U. Demirbilek & B. E. F. o. B. E. U. Ramirez (Eds.): Thesis (Ph.D) - University of New South Wales.
239
Neuman, W. L., & William Lawrence, N. (2003). Social research methods : qualitative and quantitative approaches. Boston, London: Boston, London : Allyn and Bacon.
Ni, H.-G., & Zeng, E. Y. (2009). Law Enforcement and Global Collaboration are the Keys to Containing E-Waste Tsunami in China. Environmental Science & Technology, 43(11), 3991-3994. doi: 10.1021/es802725m. http://dx.doi.org/10.1021/es802725m
Nolan, I. T. U. P. L. (2004). Electrical and electronic products infrastructure facilitation [electronic resource] / prepared by Nolan-ITU Pty Ltd. in association with Centre for Design at RMIT and Product Ecology Pty Ltd. Canberra :: Dept. of the Environment and Heritage.
Noll, K. E., Haas, C. N., Schmidt, C., et al. (1985). Recovery, recycle and reuse of industrial wastes.
Nordbrand, S. (2009). Out of control: e-waste trade flows from the EU to developing countries. SwedWatch, from http://www.fairtradecenter.se/sites/default/files/Out%20of%20control.pdf
Nzeadibe, T. C. (2009). Solid waste reforms and informal recycling in Enugu urban area, Nigeria. Habitat International, 33(1), 93-99.
OECD, Organisation for Economic Co-operation and Development (2001). Extended producer responsibility: a guidance manual for governments. OECD,Organisation for Economic Co-operation and Development Paris
Ongondo, F. O., & Williams, I. D. (2011a). Are WEEE in Control? Rethinking Strategies for Managing Waste Electrical and Electronic Equipment. In M. S. Kumar (Ed.), Integrated Waste Management - Volume II.
Ongondo, F. O., & Williams, I. D. (2011b). Mobile phone collection, reuse and recycling in the UK. Waste Management, 31(6), 1307-1315. http://www.sciencedirect.com/science/article/pii/S0956053X11000675
Ongondo, F. O., & Williams, I. D. (2011c). Greening academia: Use and disposal of mobile phones among university students. Waste Management, 31(7), 1617-1634. doi: 10.1016/j.wasman.2011.01.031. http://www.sciencedirect.com/science/article/pii/S0956053X11000663
Ongondo, F. O., Williams, I. D., & Cherrett, T. J. (2011d). How are WEEE doing? A global review of the management of electrical and electronic wastes. Waste Management, 31(2011), 714-730.
Ongondo, F. O., Williams, I. D., & Keynes, S. (2011e). Estimating the impact of the “digital switchover” on disposal of WEEE at household waste recycling centres in England. Waste Management, 31(4), 743-753. doi: 10.1016/j.wasman.2010.11.005. http://www.sciencedirect.com/science/article/pii/S0956053X10005684
Osibanjo, O., & Nnorom, I. C. (2007). The challenge of electronic waste (e-waste) management in developing countries. Waste Management and Research, 25(6), 489-501.
240
http://www.scopus.com/inward/record.url?eid=2-s2.0-36949012496&partnerID=40&md5=d86bfe6ddf93f9da7bcd654b081416fd
Park, M. B. (2009). Product Life: Designing for longer lifespans. Doctor of Philosophy (PhD) dissertation, Kingston University London.
Perrin, D., & Barton, J. (2001). Issues associated with transforming household attitudes and opinions into materials recovery: a review of two kerbside recycling schemes. Resources, Conservation and Recycling, 33, 61-74.
PHA Consulting Associates. (2006). ELECTRONIC WASTE RECOVERY STUDY. Resource Recovery Fund Board
Phellas, C. N., Bloch, A., & Seale, C. (1998). Structured methods: Interviews, questionnaires and observation. In C. Seale (Ed.), Researching society and culture (pp. 182-205). London, Thousand Oaks, Calif.: London, Thousand Oaks, Calif. : Sage Publications.
Pieters, R., Bijmolt, T., Raaij, F. v., et al. (1998). Consumers' Attributions of Proenvironmental Behavior, Motivation, and Ability to Self and Others. Journal of Public Policy & Marketing, 17(2), 215-225. http://www.jstor.org/stable/30000772
Pocock, R., Clive, H., Coss, D., et al. (2011). Realising the reuse value of household WEEE. Working together for a world without waste, from http://www.wrap.org.uk/sites/files/wrap/WRAP%20WEEE%20HWRC%20summary%20report.pdf
Porter, B. E., Leeming, F. C., & Dwyer, W. O. (1995). Solid Waste Recovery. Environment and Behavior, 27(2), 122-152. doi: 10.1177/0013916595272002. http://eab.sagepub.com/content/27/2/122.abstract
Puckett, J. (2005). The Digital Dump. Exporting Re-use and Abuse to Africa. BAN,The Basel Action Network, . Seattle, WA, from http://www.ban.org/Library/TheDigitalDump.pdf
Puckett, J., Byster, L., Westervelt S, et al. (2002). Exporting Harm-The high-tech Trashing of Asia. BAN (The Basel Action Network) & SVTC(Silicon Valley Toxicity)
Puckett, J., Byster, L, Westervelt, S, Gutierrez, R, Davis, S, Hussain, A & Dutta, M. (2002). Exporting harm: the high-tech trashing of Asia. Basel Action Network, from <http://www.ban.org/E-waste/technotrashfinalcomp.pdf>
Rahman, F., Langford, K. H., Scrimshaw, M. D., et al. (2001). Polybrominated diphenyl ether (PBDE) flame retardants. Science of The Total Environment, 275(1–3), 1-17. doi: 10.1016/S0048-9697(01)00852-X. http://www.sciencedirect.com/science/article/pii/S004896970100852X
Ranjit, K. (2005). Constructing an instrument for data collection Research methodology : a step-by-step guide for beginners. London Thousand Oaks, Calif. : Sage
Robinson, B. H. (2009). E-waste: An assessment of global production and environmental impacts. SCIENCE OF THE TOTAL ENVIRONMENT 408(2), 183-191.
241
Rose, R. L., Bearden, W. O., & Teel, J. E. (1992). An Attributional Analysis of Resistance to Group Pressure Regarding Illicit Drug and Alcohol Consumption. Journal of Consumer Research, 19(1), 1-13. http://www.jstor.org/stable/2489183
Rossem, C. V., Tojo, N., & Lindhqvist, T. (2006). Lost in Transposition: A Study of the Implementation of Individual Producer Responsibility in the WEEE Directive, Greenpeace International, Friends of the Earth Europe and The European Environmental Bureau.
Rotter, V. S., Chancerel, P., & Schill, W. P. (2009, 18-20 May 2009). Implementing individual producer responsibility (IPR) under the European WEEE directive - Experiences in Germany. Paper presented at the Sustainable Systems and Technology, 2009. ISSST '09. IEEE International Symposium on.
Rubin, A., & Babbie, R. (2011). Research Methods for Social Work: Brooks/Cole.
Saarisalo, E. (2009). Undesirable and forbidden materials New Legislation & under discussion. Ministry of Agriculture and Forestry, from http://www.mast.is/Uploads/document/fraedsluefni/FeedControl0810Undesirableforbiddenmaterials.pdf
Sahajwalla, V., Hong, L., & Saha-Chaudhury, N. (2006). Waste Plastics-A Resource for EAF Steelmaking. Iron & steel technology, 3(4), 91-96.
SAKANO, T. (2007). Study of informal recycling business in Bandung, West Java, Indonesia.
Sakultung, S., Pruksathorn, K., & Hunsom, M. (2007). Simultaneous recovery of valuable metals from spent mobile phone battery by an acid leaching process. Korean Journal of Chemical Engineering, 24(2), 272-277.
Saphores, J.-D. M., Nixon, H., Ogunseitan, O. A., et al. (2006). HOUSEHOLD WILLINGNESS TO RECYCLE ELECTRONIC WASTE - An Application to California: Sage.
Sax, L. J., Gilmartin, S. K., & Bryant, A. N. (2003). Assessing Response Rates and Nonresponse Bias in Web and Paper Surveys. Research in Higher Education, 44(4), 409-432. http://www.ingentaconnect.com/content/klu/rihe/2003/00000044/00000004/00464933
Schluep, M., Hagelueken, C., Kueh, R., et al. (2009). Recycling from e-waste to resources- Sustainable innovation and technology transfer industrial sector studies. United Nations Environmental Programme, United Nations Univeersity
Schneider, F. (1998). Further empirical results of the size of the shadow economy of 17 OECD countries over time. Discussion Paper. Department of Economics, University of Linz, Linz, Austria.
Schneider, F., & Enste, D. H. (2003). The Shadow Economy: An International Survey. Cambridge University Press, Cambridge, UK.
242
Schwandt, T. A. (1997). Qualitative inquirey: A dictionary of terms: Sage Publications.
SEPA, P.R.C. State Environmental Protection Administration. (2004). Notice on the environmental management situation of waste electric and electronic products Retrieved October 25th, 2004, from http://www.crra.com.cn/hykx(36).htm
SEPA, Scottish Environmental Protection Agency. (2002). Guidance on the Recovery and Disposal of Controlled Substances Contained in Refrigerators and Freezers. Bristol
Sepúlveda, A., Schluep, M., Renaud, F. G., et al. (2010). A review of the environmental fate and effects of hazardous substances released from electrical and electronic equipments during recycling: Examples from China and India. Environmental Impact Assessment Review, 30, 28-41.
Seyfang, G. (2006). Ecological citizenship and sustainable consumption: Examining local organic food networks. Journal of rural studies, 22(4), 383-395.
Shinkuma, T., & Huong, N. T. M. (2009). The flow of E-waste material in the Asian region and a reconsideration of international trade policies on E-waste. Environmental Impact Assessment Review, 29(1), 25-31.
Sinha-Khetriwal, D., Kraeuchi, P., & Schwaninger, M. (2005). A comparison of electronic waste recycling in Switzerland and in India. Environmental Impact Assessment Review, 25, 492-504.
Soderstrom.U. (2004). Boliden "Alte Handys und PCs sind wertvolle Kupferminen", from http://www.neuematerialien.de/alle_fachbereiche/nachrichten/
SOHU. (2011). Retailers in Guomei cheating for the subsidy in Trade-in policy, from http://it.sohu.com/20110316/n279855260.shtml
Song, Q., Wang, Z., & Li, J. (2012). Residents' behaviors, attitudes, and willingness to pay for recycling e-waste in Macau. Journal of Environmental Management, 106(0), 8-16. doi: 10.1016/j.jenvman.2012.03.036. http://www.sciencedirect.com/science/article/pii/S0301479712001557
Streicher-Porte, M., R.Widmer, A. Jain, H-P. Bader, R. Scheidegger, S. Kytzia. (2005). Key drivers of the e-waste recycling system: Assessing and modelling e-waste processing in the informal sector in Delhi. Environmental Impact assessment Review, 25, 472-491.
Streicher-porte, M., & Yang, J. (2007). WEEE recycling in China- Present situation and main obstacles for improvement. Paper presented at the IEEE International Symposium on Electronics and Environment, Orlando.
tec, S. (2010). The e-waste flows in China - million tons of e-waste flow back to the market, from http://tech.sina.com.cn/it/2010-07-20/06164447246.shtml
Terazono, A., Murakami, S., Abe, N., et al. (2006). Current status and research on E-waste issues in Asia. J Mater Cycles Waste Manag ( 8), 1-12.
Terazono, A., Yoshida, A., Yang, J., et al. (2004). Material cycles in Asia: especially the recycling loop between Japan and China. Material cycles and waste management in Asia, 6, 82-96. doi: 10.1007/s10163-004-0115-0.
243
The Natural Edge project. (2006). E-Waste Curriculum development project, Phase1: literature review. The Natural Edge project, from http://www.naturaledgeproject.net/Documents/E-Waste%20Literature%20Review%20-%20FINAL.pdf
Thiery, M., Salomon, M., Nunen, J. V., et al. (1995). Strategic Issues in Product Recovery Management. California Management Review, 37(2), 114-135.
Thøgersen, J. (1996). Recycling and Morality. Environment and Behavior, 28(4), 536-558. doi: 10.1177/0013916596284006. http://eab.sagepub.com/content/28/4/536.abstract
Tonglet, M., Phillips, P. S., & Read, A. D. (2004a). Using the Theory of Planned Behaviour to investigate the determinants of recycling behaviour: a case study from Brixworth, UK. Resources, Conservation and Recycling, 41, 191-214.
Tonglet, M., Phillips, P. S., & Read, A. D. (2004b). Using the Theory of Planned Behaviour to investigate the determinants of recycling behaviour: a case study from Brixworth, UK. Resources, Conservation and Recycling, 41(3), 191-214. doi: 10.1016/j.resconrec.2003.11.001. http://www.sciencedirect.com/science/article/pii/S0921344903001629
Tucker, P., Murney, G., & Lamont, J. (1998). Predicting recycling scheme performance: a process simulation approach. Journal of Environmental Management, 53(1), 31-48. doi: 10.1006/jema.1998.0185. http://www.sciencedirect.com/science/article/pii/S0301479798901852
UNEP, United Nations Environment Programme. (2007a). E-waste Volume I: Inventory Assessment Manual. Industry and Economics International Environmental Technology Centre, I
UNEP, United Nations Environment Programme. (2007b). E-waste Volume II: E-waste Management Manual. United Nations Environmental Programme, Industry and Economics International Environmental Technology Centre, II
UNEP, United Nations Environment Programme. (2011). Manual 3: WEEE/E-waste "Take Back System"-Draft. United Nations Environmental Programme, Industry and Economics International Environmental Technology Centre
USEPA. (2000). Electronic reuse and recycling infrastructure development in Massachusetts. United States Environmental Protection Agency
Van Beukering, P. J. H., & Van den Bergh, J. C. J. M. (2006). Modelling and analysis of international recycling between developed and developing countries. Resources, Conservation and Recycling, 46(1), 1-26. doi: 10.1016/j.resconrec.2005.06.002. http://www.sciencedirect.com/science/article/pii/S0921344905000789
van Hinte, E. (1997). Eternally Yours: Visions on Product Endurance: 010 Publishers.
Wagner, T. P. (2009). Shared responsibility for managing electronic waste: A case study of Maine, USA. Waste Management, 29(12), 3014-3021. doi: 10.1016/j.wasman.2009.06.015. http://www.sciencedirect.com/science/article/pii/S0956053X09002256
244
Wang, F., & Huisman, J. (2010). Formalisation of e-waste collection and recycling in china. United Nations University, Institute for Sustainability and Peace, Bonn, Germany, from http://www.transwaste.eu/file/001440.pdf
Wang, Y., Ru, Y., Veenstra, A., et al. (2010). Recent developments in waste electrical and electronics equipment legislation in China. The International Journal of Advanced Manufacturing Technology, 47(5), 437-448. doi: 10.1007/s00170-009-2339-6. http://dx.doi.org/10.1007/s00170-009-2339-6
Wang, Z., Zhang, B., Yin, J., et al. (2011). Willingness and behavior towards e-waste recycling for residents in Beijing city, China. Journal of cleaner production, 19, 977-987.
Wen, X. F., Li, J.H., Hao, L., Yin, F.F., Hu, L.X., Liu, H.P., Liu, Z.Y.,. (2006). An agenda to move forward e-waste recycling and challenges in China. Paper presented at the Proceedings of the 2006 IEEE International Symposium on Electronics and the Environment, May 2006.
Wever, R., van Kuijk, J., & Boks, C. (2008). User‐centred design for sustainable behaviour. International Journal of Sustainable Engineering, 1(1), 9-20. doi: 10.1080/19397030802166205. http://dx.doi.org/10.1080/19397030802166205
White, P., Pierre, L. S., & Belletire, S. (2007). Okala ecological design. The Ecodesign Section of the Industrial Designers Society of America (IDSA). America, from http://www.cbe.wwu.edu/dunn/rprnts.OkalaSupport.pdf
Widmer, R., Oswald-Krapf, H., Sinha-Khetriwalb, D., et al. (2005). Global perspectives on e-waste. Environmental Impact Assessment Review, 25, 436-458.
Williams, E., Kahhat, R., Allenby, B., et al. (2008). Environmental, Social, and Economic Implications of Global Reuse and Recycling of Personal Computers. Environmental Science & Technology, 42(17), 6446-6454. doi: 10.1021/es702255z. http://dx.doi.org/10.1021/es702255z
Williams, E., Kahhat, R., Allenby, B., Kavazanjian, E., Kim, J., Xu, M.,. (2008). Environmental, social, and economic implications of global reuse and recycling of personal computers. Environmental Science and Technology, 42(17), 6446-6454.
Wilson, D. C., Velis, C., & Cheeseman, C. (2006). Role of informal sector recycling in waste management in developing countries. Habitat International, 30, 797-808.
Wilson, D. e. a. (2001). Strategic Planning Guide for Municipal Solid Waste Management. World Bank. Washington, DC, <http://www.worldbank.org/urban/solid_wm/erm/start_up.pdf>, from <http://www.worldbank.org/urban/solid_wm/erm/start_up.pdf>
Wong, M. H., Wu, S.C., Deng, W.J., Yu, X.Z., Luo, Q., Leung, A.O.W., Wong, C.S.C.,, & Luksemburg, W. J., Wong, A.S.,. (2007). Export of toxic chemicals – a review of the case of uncontrolled electronic-waste recycling. . Environmental Pollution, 149(2), 131-140.
Wong, X., Yen, D. C., & Fang, X. (2004). E-commerce development in China and its implication for business. Asia Pacific Journal of Marketing and Logistics, 16(3), 68-83.
245
World Bank. (2004). E-waste, the hidden side of IT equipment's manufacturing and use. World Bank,Environment Alert Bulletin
Worldwatch Institute. (2005). When your computer becomes toxic trash, viewed 15 May 2006, from <http://www.worldwatch.org/pubs/goodstuff/computers>
Wu, T., & Yenming J, C. (2007). Understanding population dynamics of WEEE recycling system in the developing countries: A SIR Model.
Xin hua, Net,. (2005). E-waste from developed countries flooding towards Guiyu, from http://news.xinhuanet.com/fortune/2005-09/03/content_3437772.htm (in Chinese)
Xin Kuai. (2009, 17th, Sep, 2009). How to make wise investment from the new trade-in scheme Retrieved 25th, June, 2012, from http://homea.people.com.cn/GB/10069426.html
Xing, G. H., Chan, J. K. Y., Leung, A. O. W., et al. (2009). Environmental impact and human exposure to PCBs in Guiyu, an electronic waste recycling site in China. Environment International, 35, 76-82.
Xinhua. (2011). Status of e-waste classification in China, from http://env.people.com.cn/GB/13892614.html
Xu, X., Peng, L., Li, W., et al. (2006). Lead level in the blood conducted in the e-waste disassembling area-Guiyu. Environment and Health, 23(1).
Yang, J., Lu, B., & Xu, C. (2008). WEEE flow and mitigating measures in China. Waste Management, 28(9), 1589-1597.
Yao, C., Tian, Q., Chen, X., et al. (2009). Current situation of e-waste recycling system in China- A case study in Tianjin, China. Resource and Science, 5(20).
Yu, J., Hills, P., & Welford, R. (2008). Extended Producer Responsibility and Eco-Design Changes: Perspectives from China. Corporate Social Responsibility and Environmental Management, 15, 111-124.
Zeng, Y., Luo, J. a., & Lai, Y. (2010, 05 June, 2010). Dismantling Industrial Chain of Electronics Waste-Study report of industrial chain of electronics waste recycling and disposal and public survey in Guangzhou. Green E-waste. Guangzhou
Zhang, K., & Wei, S. (2009). Comparison of overseas E-waste recycling systems and their enlightment to China. China Population Resources and Environment, 19(2).
Zoeteman, B., Krikke, H., & Venselaar, J. (2010). Handling WEEE waste flows: on the effectiveness of producer responsibility in a globalizing world. The International Journal of Advanced Manufacturing Technology 47(5), 415-436. doi: 10.1007/s00170-009-2358-3. http://dx.doi.org/10.1007/s00170-009-2358-3
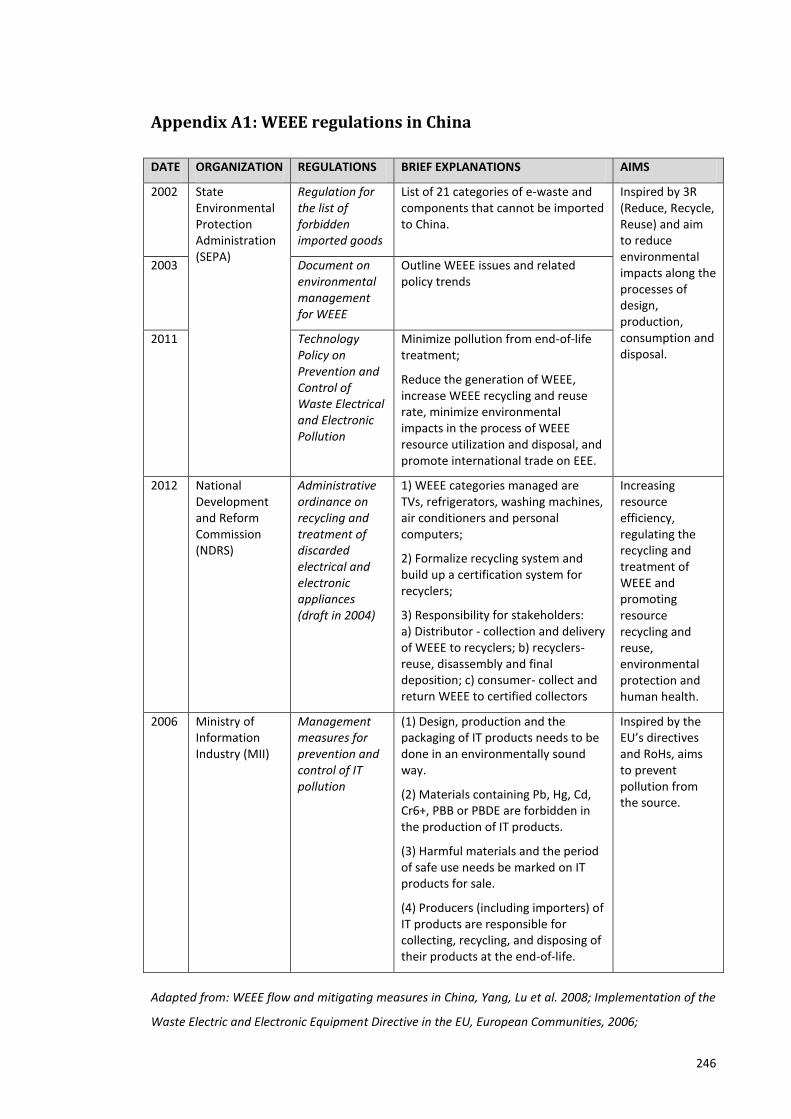
246
Appendix A1: WEEE regulations in China
DATE ORGANIZATION REGULATIONS BRIEF EXPLANATIONS AIMS
2002 State Environmental Protection Administration (SEPA)
Regulation for the list of forbidden imported goods
List of 21 categories of e-waste and components that cannot be imported to China.
Inspired by 3R (Reduce, Recycle, Reuse) and aim to reduce environmental impacts along the processes of design, production, consumption and disposal.
2003 Document on environmental management for WEEE
Outline WEEE issues and related policy trends
2011 Technology Policy on Prevention and Control of Waste Electrical and Electronic Pollution
Minimize pollution from end-of-life treatment;
Reduce the generation of WEEE, increase WEEE recycling and reuse rate, minimize environmental impacts in the process of WEEE resource utilization and disposal, and promote international trade on EEE.
2012 National Development and Reform Commission (NDRS)
Administrative ordinance on recycling and treatment of discarded electrical and electronic appliances (draft in 2004)
1) WEEE categories managed are TVs, refrigerators, washing machines, air conditioners and personal computers;
2) Formalize recycling system and build up a certification system for recyclers;
3) Responsibility for stakeholders: a) Distributor - collection and delivery of WEEE to recyclers; b) recyclers- reuse, disassembly and final deposition; c) consumer- collect and return WEEE to certified collectors
Increasing resource efficiency, regulating the recycling and treatment of WEEE and promoting resource recycling and reuse, environmental protection and human health.
2006 Ministry of Information Industry (MII)
Management measures for prevention and control of IT pollution
(1) Design, production and the packaging of IT products needs to be done in an environmentally sound way.
(2) Materials containing Pb, Hg, Cd, Cr6+, PBB or PBDE are forbidden in the production of IT products.
(3) Harmful materials and the period of safe use needs be marked on IT products for sale.
(4) Producers (including importers) of IT products are responsible for collecting, recycling, and disposing of their products at the end-of-life.
Inspired by the EU’s directives and RoHs, aims to prevent pollution from the source.
Adapted from: WEEE flow and mitigating measures in China, Yang, Lu et al. 2008; Implementation of the
Waste Electric and Electronic Equipment Directive in the EU, European Communities, 2006;
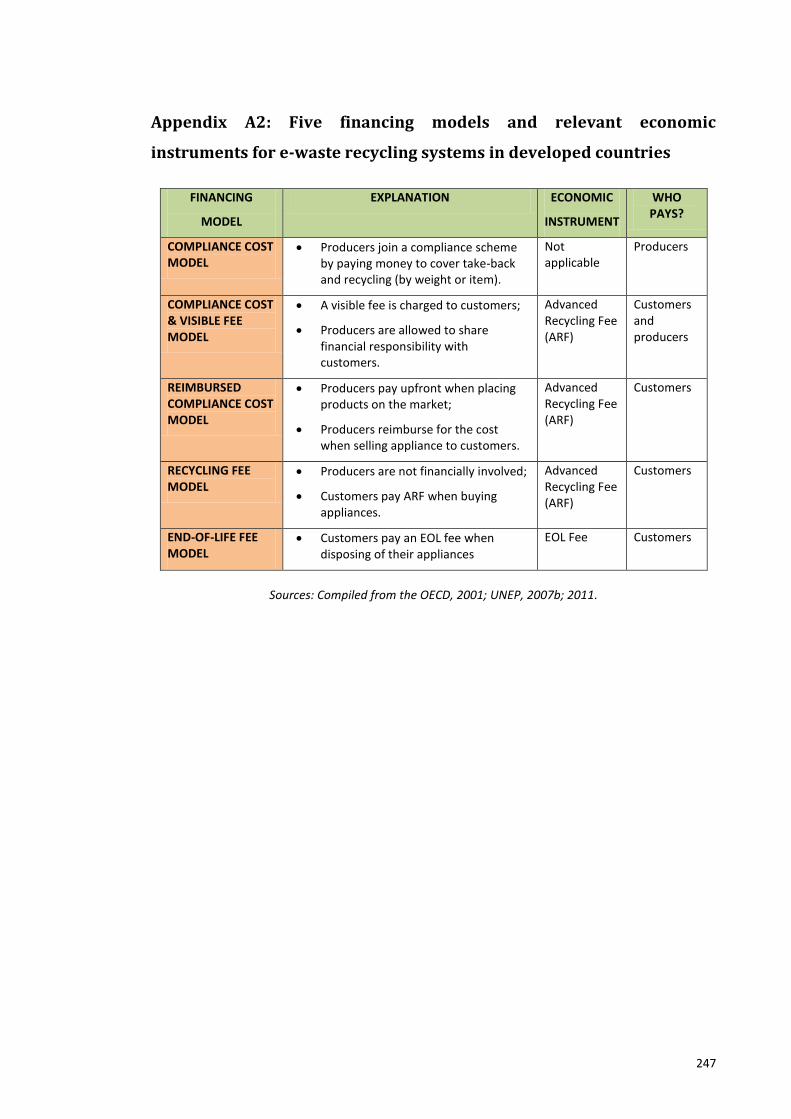
247
Appendix A2: Five financing models and relevant economic
instruments for e-waste recycling systems in developed countries
FINANCING
MODEL
EXPLANATION ECONOMIC
INSTRUMENT
WHO PAYS?
COMPLIANCE COST MODEL
Producers join a compliance scheme by paying money to cover take-back and recycling (by weight or item).
Not applicable
Producers
COMPLIANCE COST & VISIBLE FEE MODEL
A visible fee is charged to customers;
Producers are allowed to share financial responsibility with customers.
Advanced Recycling Fee (ARF)
Customers and producers
REIMBURSED COMPLIANCE COST MODEL
Producers pay upfront when placing products on the market;
Producers reimburse for the cost when selling appliance to customers.
Advanced Recycling Fee (ARF)
Customers
RECYCLING FEE MODEL
Producers are not financially involved;
Customers pay ARF when buying appliances.
Advanced Recycling Fee (ARF)
Customers
END-OF-LIFE FEE MODEL
Customers pay an EOL fee when disposing of their appliances
EOL Fee Customers
Sources: Compiled from the OECD, 2001; UNEP, 2007b; 2011.
248
Appendix A3: Questionnaire of E-waste recycling behaviour for
household (English version)
This survey is conducted by a PhD candidate-Xian Li, from the Faculty of the Built Environment, University of New South Wales, Australia. It is a part of a research project regarding improving E-waste recycling in China, using Tianjin as a case study area. This project aims to explore E-waste recycling behaviours and preferences. You are selected as a possible participant in this study because you are an experienced household on e-waste recycling. Your answers and cooperation is very important for my research. This survey is conducted under UNSW’s research code of conduct and the Statistics Law of the People’s Republic of China. The survey is anonymous; the answers you provide will be coded and only used for statistical analysis, there is no identification of the participants. If you have any question, please feel free to ask Xian Li: 00612-9385 5661 (email: [email protected]).If you have any additional question later, Associate Professor Oya Demirbilek: 00612-9385-4742 (email: [email protected]) or Senior Lecturer Miles Park: 00612-9385-4853 (email: [email protected]) will be happy to answer them. Complaints may be directed to the Ethics Secretariat (phone 9385 4234, email: [email protected]).
Thank you for your participation.
Xian Li
PART A: KNOWLEDGE (MULTI-ANSWERS) (please tick “√” before the answers)
A1: From the list below, please indicate which category (ies) is/are e-waste after obsolescence
(Please tick as many as possible)
1. TV, PC or mobile phone
2. Plastic toys
3. Electrical toys
4. Household refuses
5. Organic pollutants
A2: What kinds of e-waste do you have? (Please tick as many as possible)
1. Obsoleted small household appliances (such as table lamp, stereo, hair dryer)
2. Obsoleted big household appliances (such as refrigerator, washing machine, TV)
3. Obsoleted PC and peripheral products
4. Obsoleted mobile phones
5. MP3, MP4
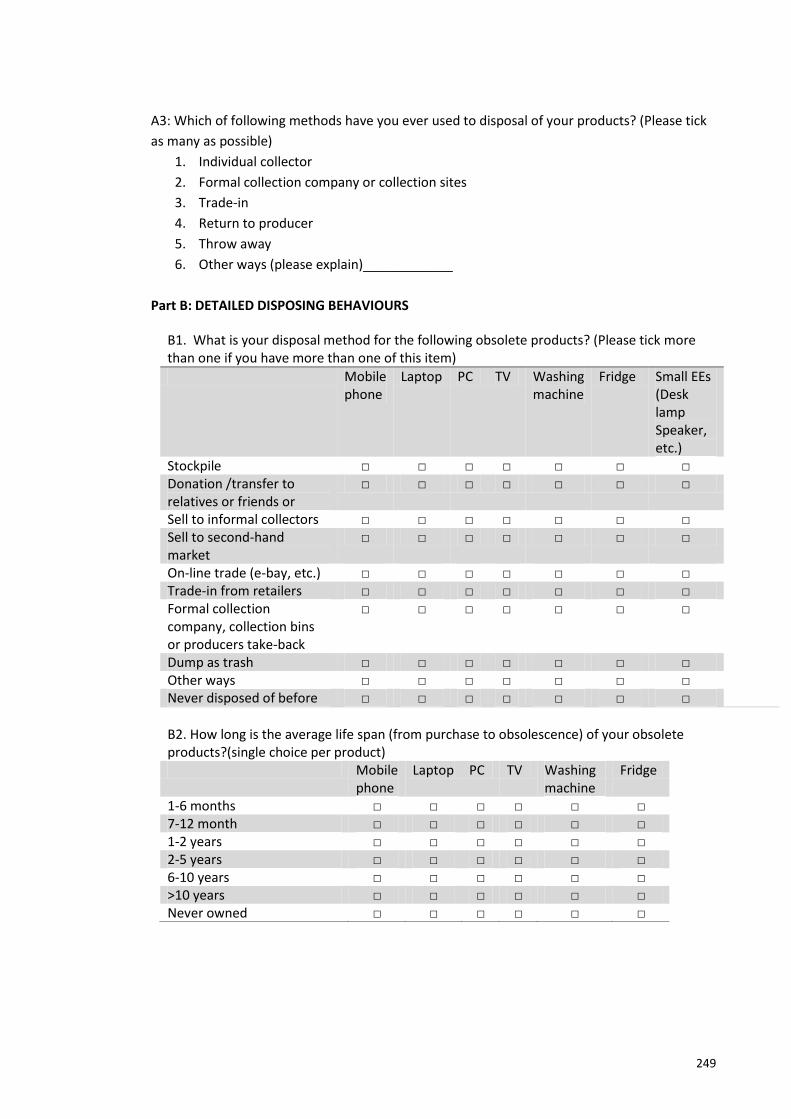
249
A3: Which of following methods have you ever used to disposal of your products? (Please tick
as many as possible)
1. Individual collector
2. Formal collection company or collection sites
3. Trade-in
4. Return to producer
5. Throw away
6. Other ways (please explain)___________
Part B: DETAILED DISPOSING BEHAVIOURS
B1. What is your disposal method for the following obsolete products? (Please tick more than one if you have more than one of this item)
Mobile phone
Laptop PC TV Washing machine
Fridge Small EEs (Desk lamp Speaker, etc.)
Stockpile □ □ □ □ □ □ □ Donation /transfer to relatives or friends or
□ □ □ □ □ □ □
Sell to informal collectors □ □ □ □ □ □ □ Sell to second-hand market
□ □ □ □ □ □ □
On-line trade (e-bay, etc.) □ □ □ □ □ □ □ Trade-in from retailers □ □ □ □ □ □ □ Formal collection company, collection bins or producers take-back
□ □ □ □ □ □ □
Dump as trash □ □ □ □ □ □ □ Other ways □ □ □ □ □ □ □ Never disposed of before □ □ □ □ □ □ □
B2. How long is the average life span (from purchase to obsolescence) of your obsolete products?(single choice per product)
Mobile phone
Laptop PC TV Washing machine
Fridge
1-6 months □ □ □ □ □ □ 7-12 month □ □ □ □ □ □ 1-2 years □ □ □ □ □ □ 2-5 years □ □ □ □ □ □ 6-10 years □ □ □ □ □ □ >10 years □ □ □ □ □ □ Never owned □ □ □ □ □ □
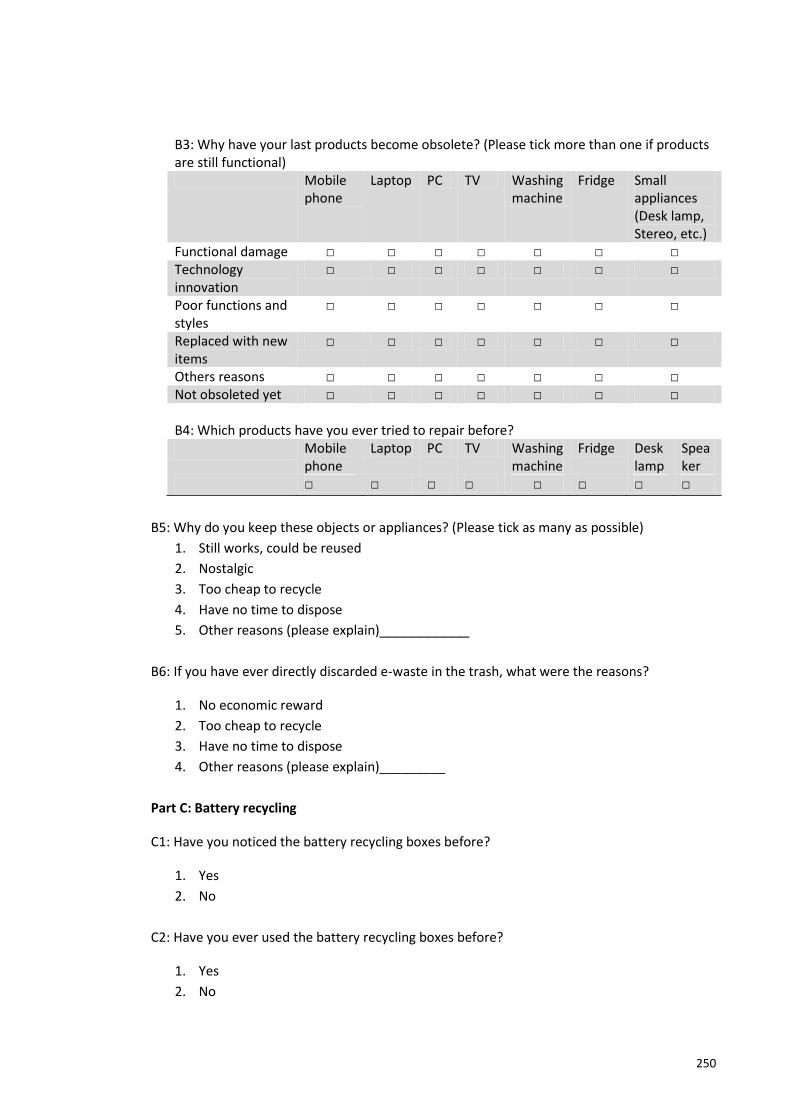
250
B5: Why do you keep these objects or appliances? (Please tick as many as possible)
1. Still works, could be reused
2. Nostalgic
3. Too cheap to recycle
4. Have no time to dispose
5. Other reasons (please explain)___________
B6: If you have ever directly discarded e-waste in the trash, what were the reasons?
1. No economic reward
2. Too cheap to recycle
3. Have no time to dispose
4. Other reasons (please explain)_________
Part C: Battery recycling
C1: Have you noticed the battery recycling boxes before?
1. Yes
2. No
C2: Have you ever used the battery recycling boxes before?
1. Yes
2. No
B3: Why have your last products become obsolete? (Please tick more than one if products are still functional) Mobile
phone Laptop PC TV Washing
machine Fridge Small
appliances (Desk lamp, Stereo, etc.)
Functional damage □ □ □ □ □ □ □ Technology innovation
□ □ □ □ □ □ □
Poor functions and styles
□ □ □ □ □ □ □
Replaced with new items
□ □ □ □ □ □ □
Others reasons □ □ □ □ □ □ □ Not obsoleted yet □ □ □ □ □ □ □ B4: Which products have you ever tried to repair before? Mobile
phone Laptop PC TV Washing
machine Fridge Desk
lamp Speaker
□ □ □ □ □ □ □ □
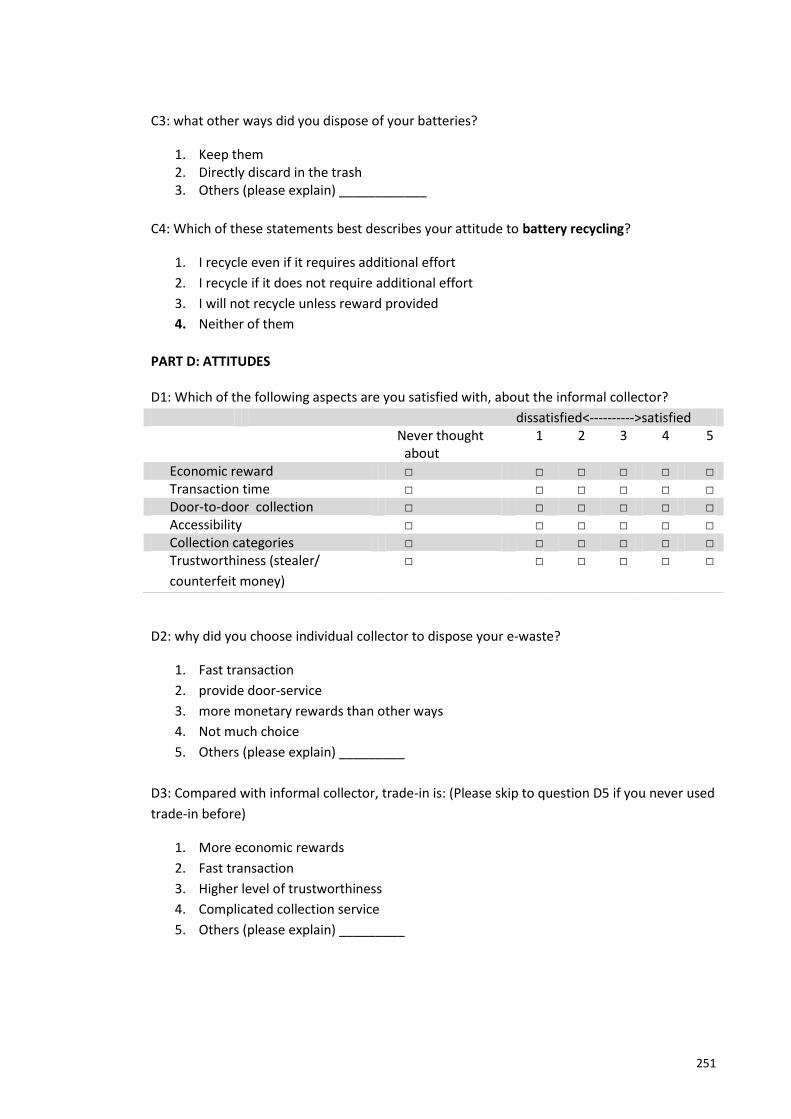
251
C3: what other ways did you dispose of your batteries?
1. Keep them 2. Directly discard in the trash 3. Others (please explain) ____________
C4: Which of these statements best describes your attitude to battery recycling?
1. I recycle even if it requires additional effort
2. I recycle if it does not require additional effort
3. I will not recycle unless reward provided
4. Neither of them
PART D: ATTITUDES D1: Which of the following aspects are you satisfied with, about the informal collector?
dissatisfied<---------->satisfied Never thought
about 1 2 3 4 5
Economic reward □ □ □ □ □ □ Transaction time □ □ □ □ □ □ Door-to-door collection □ □ □ □ □ □ Accessibility □ □ □ □ □ □ Collection categories □ □ □ □ □ □ Trustworthiness (stealer/
counterfeit money)
□ □ □ □ □ □
D2: why did you choose individual collector to dispose your e-waste?
1. Fast transaction
2. provide door-service
3. more monetary rewards than other ways
4. Not much choice
5. Others (please explain) _________
D3: Compared with informal collector, trade-in is: (Please skip to question D5 if you never used
trade-in before)
1. More economic rewards
2. Fast transaction
3. Higher level of trustworthiness
4. Complicated collection service
5. Others (please explain) _________
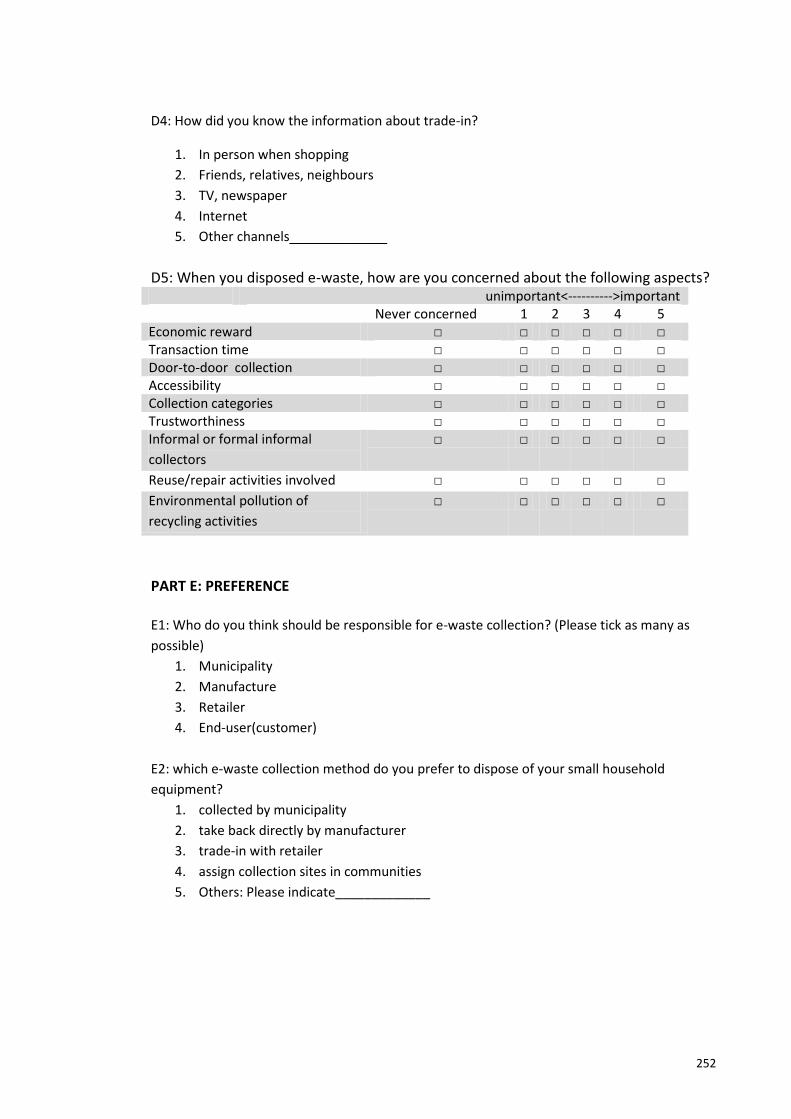
252
D4: How did you know the information about trade-in?
1. In person when shopping
2. Friends, relatives, neighbours
3. TV, newspaper
4. Internet
5. Other channels____________
D5: When you disposed e-waste, how are you concerned about the following aspects? unimportant<---------->important Never concerned 1 2 3 4 5 Economic reward □ □ □ □ □ □ Transaction time □ □ □ □ □ □ Door-to-door collection □ □ □ □ □ □ Accessibility □ □ □ □ □ □ Collection categories □ □ □ □ □ □ Trustworthiness □ □ □ □ □ □ Informal or formal informal
collectors
□ □ □ □ □ □
Reuse/repair activities involved □ □ □ □ □ □
Environmental pollution of
recycling activities
□ □ □ □ □ □
PART E: PREFERENCE
E1: Who do you think should be responsible for e-waste collection? (Please tick as many as
possible)
1. Municipality
2. Manufacture
3. Retailer
4. End-user(customer)
E2: which e-waste collection method do you prefer to dispose of your small household
equipment?
1. collected by municipality
2. take back directly by manufacturer
3. trade-in with retailer
4. assign collection sites in communities
5. Others: Please indicate_____________

253
Part F: Personal information F1: How many people in family and share the living place? ________ F2: Your gender: Male Female F3: Your age? 1. 26-35
2. 36-45
3. 46-55
4. 56-65
5. >65F4:
F4: Your education level
1. Lower than primary 2. Primary school
3. High school
4. Bachelor
5. Master and above
F5: The income for your household/per month (RMB)
1. <2000
2. 2000-5000
3. 5001-8000
4. 8000-10000
5. >10000
Thanks again for your participation in this survey. If you would like to discuss or participate in
my follow-up interview to further discuss the e-waste recycling issues, please give me your
contact number or e-mail address below.
Mobile number: ________
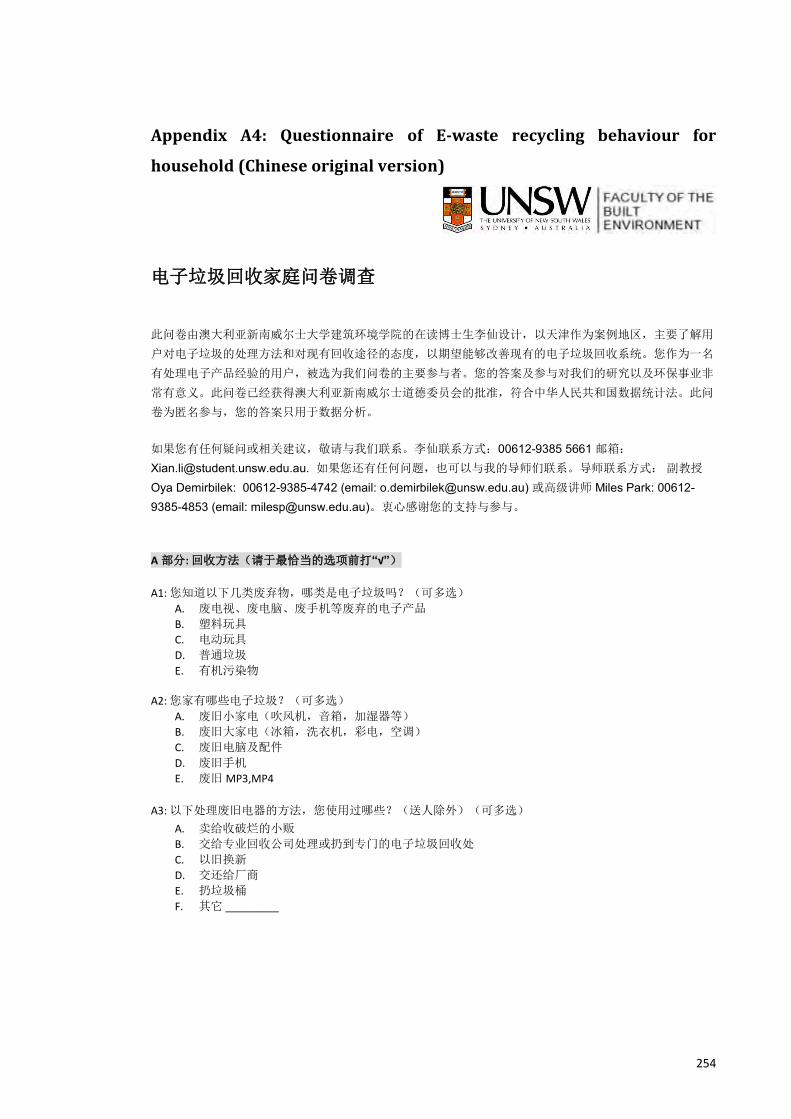
254
Appendix A4: Questionnaire of E-waste recycling behaviour for
household (Chinese original version)
电子垃圾回收家庭问卷调查 此问卷由澳大利亚新南威尔士大学建筑环境学院的在读博士生李仙设计,以天津作为案例地区,主要了解用
户对电子垃圾的处理方法和对现有回收途径的态度,以期望能够改善现有的电子垃圾回收系统。您作为一名
有处理电子产品经验的用户,被选为我们问卷的主要参与者。您的答案及参与对我们的研究以及环保事业非
常有意义。此问卷已经获得澳大利亚新南威尔士道德委员会的批准,符合中华人民共和国数据统计法。此问
卷为匿名参与,您的答案只用于数据分析。 如果您有任何疑问或相关建议,敬请与我们联系。李仙联系方式:00612-9385 5661 邮箱: [email protected]. 如果您还有任何问题,也可以与我的导师们联系。导师联系方式: 副教授
Oya Demirbilek: 00612-9385-4742 (email: [email protected]) 或高级讲师 Miles Park: 00612-9385-4853 (email: [email protected])。衷心感谢您的支持与参与。
A 部分: 回收方法(请于最恰当的选项前打“√”)
A1: 您知道以下几类废弃物,哪类是电子垃圾吗?(可多选)
A. 废电视、废电脑、废手机等废弃的电子产品
B. 塑料玩具
C. 电动玩具
D. 普通垃圾
E. 有机污染物
A2: 您家有哪些电子垃圾?(可多选)
A. 废旧小家电(吹风机,音箱,加湿器等)
B. 废旧大家电(冰箱,洗衣机,彩电,空调)
C. 废旧电脑及配件
D. 废旧手机
E. 废旧 MP3,MP4
A3: 以下处理废旧电器的方法,您使用过哪些?(送人除外)(可多选)
A. 卖给收破烂的小贩
B. 交给专业回收公司处理或扔到专门的电子垃圾回收处
C. 以旧换新
D. 交还给厂商
E. 扔垃圾桶
F. 其它 _________
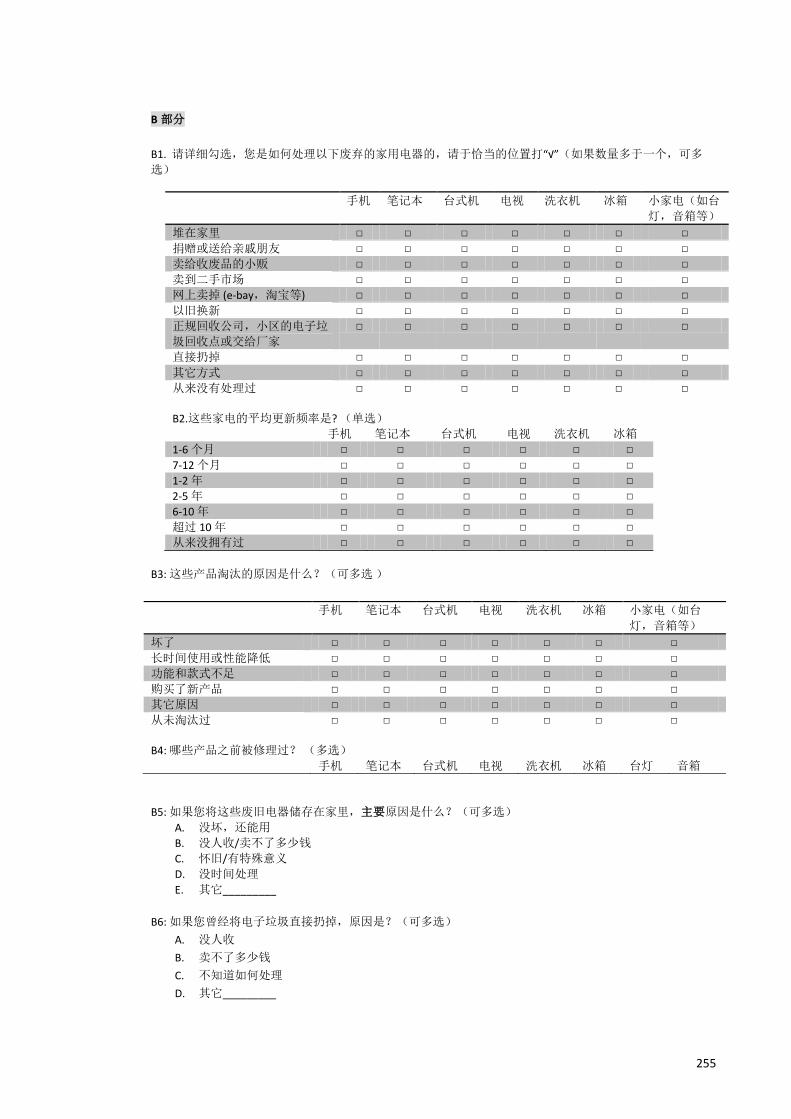
255
B 部分
B1. 请详细勾选,您是如何处理以下废弃的家用电器的,请于恰当的位置打“√”(如果数量多于一个,可多
选)
B3: 这些产品淘汰的原因是什么?(可多选 )
B5: 如果您将这些废旧电器储存在家里,主要原因是什么?(可多选)
A. 没坏,还能用
B. 没人收/卖不了多少钱
C. 怀旧/有特殊意义
D. 没时间处理
E. 其它_________
B6: 如果您曾经将电子垃圾直接扔掉,原因是?(可多选)
A. 没人收
B. 卖不了多少钱
C. 不知道如何处理
D. 其它_________
手机 笔记本 台式机 电视 洗衣机 冰箱 小家电(如台
灯,音箱等)
堆在家里 □ □ □ □ □ □ □
捐赠或送给亲戚朋友 □ □ □ □ □ □ □
卖给收废品的小贩 □ □ □ □ □ □ □
卖到二手市场 □ □ □ □ □ □ □
网上卖掉 (e-bay,淘宝等) □ □ □ □ □ □ □
以旧换新 □ □ □ □ □ □ □
正规回收公司,小区的电子垃
圾回收点或交给厂家
□ □ □ □ □ □ □
直接扔掉 □ □ □ □ □ □ □
其它方式 □ □ □ □ □ □ □
从来没有处理过 □ □ □ □ □ □ □
B2.这些家电的平均更新频率是? (单选) 手机 笔记本 台式机 电视 洗衣机 冰箱
1-6 个月 □ □ □ □ □ □
7-12 个月 □ □ □ □ □ □
1-2 年 □ □ □ □ □ □
2-5 年 □ □ □ □ □ □
6-10 年 □ □ □ □ □ □
超过 10 年 □ □ □ □ □ □
从来没拥有过 □ □ □ □ □ □
手机 笔记本 台式机 电视 洗衣机 冰箱 小家电(如台
灯,音箱等)
坏了 □ □ □ □ □ □ □
长时间使用或性能降低 □ □ □ □ □ □ □
功能和款式不足 □ □ □ □ □ □ □
购买了新产品 □ □ □ □ □ □ □
其它原因 □ □ □ □ □ □ □
从未淘汰过 □ □ □ □ □ □ □
B4: 哪些产品之前被修理过? (多选)
手机 笔记本 台式机 电视 洗衣机 冰箱 台灯 音箱
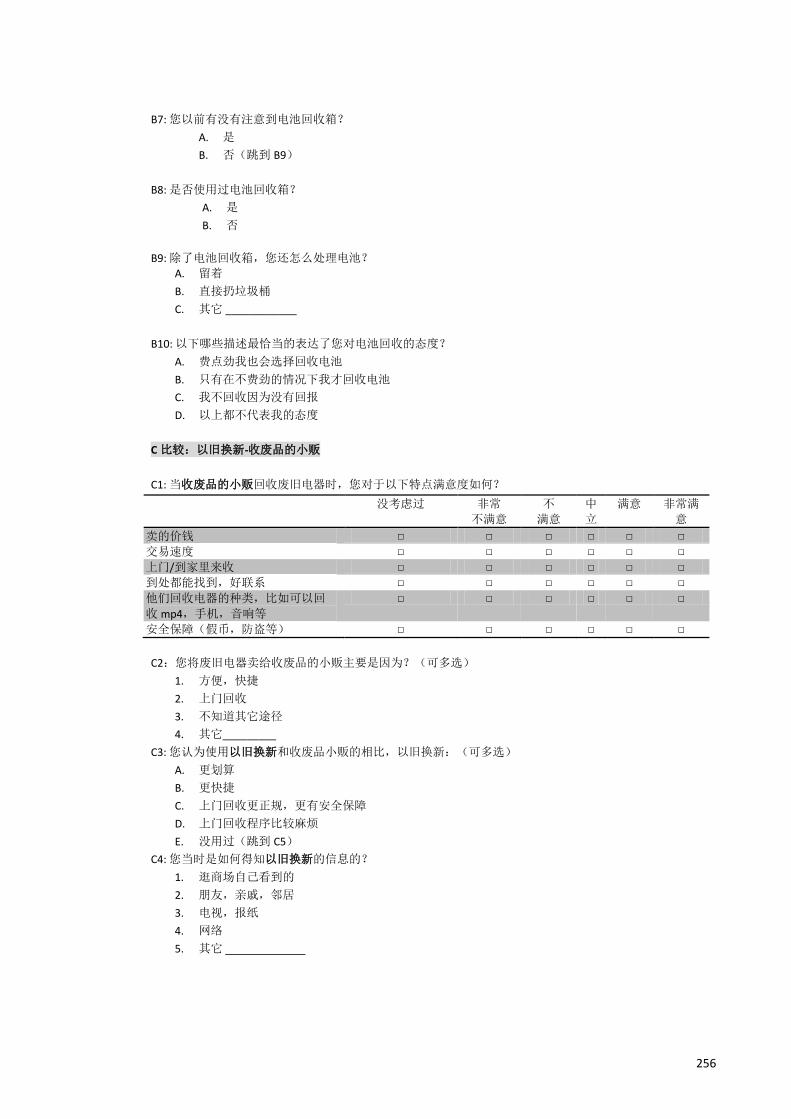
256
B7: 您以前有没有注意到电池回收箱?
A. 是
B. 否(跳到 B9)
B8: 是否使用过电池回收箱?
A. 是
B. 否
B9: 除了电池回收箱,您还怎么处理电池?
A. 留着
B. 直接扔垃圾桶
C. 其它 ____________
B10: 以下哪些描述最恰当的表达了您对电池回收的态度?
A. 费点劲我也会选择回收电池
B. 只有在不费劲的情况下我才回收电池
C. 我不回收因为没有回报
D. 以上都不代表我的态度
C 比较:以旧换新-收废品的小贩
C1: 当收废品的小贩回收废旧电器时,您对于以下特点满意度如何?
没考虑过 非常
不满意
不
满意
中
立
满意 非常满
意
卖的价钱 □ □ □ □ □ □
交易速度 □ □ □ □ □ □
上门/到家里来收 □ □ □ □ □ □
到处都能找到,好联系 □ □ □ □ □ □
他们回收电器的种类,比如可以回
收 mp4,手机,音响等
□ □ □ □ □ □
安全保障(假币,防盗等) □ □ □ □ □ □
C2:您将废旧电器卖给收废品的小贩主要是因为?(可多选)
1. 方便,快捷
2. 上门回收
3. 不知道其它途径
4. 其它_________
C3: 您认为使用以旧换新和收废品小贩的相比,以旧换新:(可多选)
A. 更划算
B. 更快捷
C. 上门回收更正规,更有安全保障
D. 上门回收程序比较麻烦
E. 没用过(跳到 C5)
C4: 您当时是如何得知以旧换新的信息的?
1. 逛商场自己看到的
2. 朋友,亲戚,邻居
3. 电视,报纸
4. 网络
5. 其它 ____________
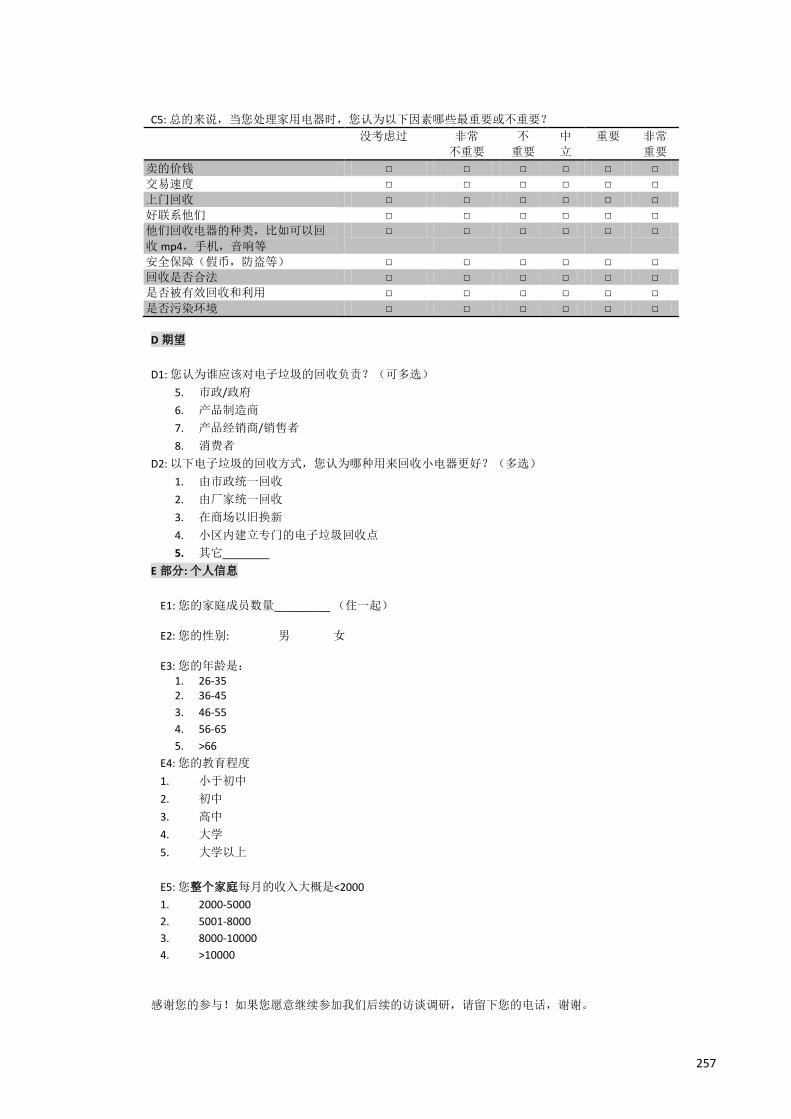
257
C5: 总的来说,当您处理家用电器时,您认为以下因素哪些最重要或不重要?
没考虑过 非常
不重要
不
重要
中
立
重要 非常
重要
卖的价钱 □ □ □ □ □ □
交易速度 □ □ □ □ □ □
上门回收 □ □ □ □ □ □
好联系他们 □ □ □ □ □ □
他们回收电器的种类,比如可以回
收 mp4,手机,音响等
□ □ □ □ □ □
安全保障(假币,防盗等) □ □ □ □ □ □
回收是否合法 □ □ □ □ □ □
是否被有效回收和利用 □ □ □ □ □ □
是否污染环境 □ □ □ □ □ □
D 期望
D1: 您认为谁应该对电子垃圾的回收负责?(可多选)
5. 市政/政府
6. 产品制造商
7. 产品经销商/销售者
8. 消费者
D2: 以下电子垃圾的回收方式,您认为哪种用来回收小电器更好?(多选)
1. 由市政统一回收
2. 由厂家统一回收
3. 在商场以旧换新
4. 小区内建立专门的电子垃圾回收点
5. 其它_______
E 部分: 个人信息
E1: 您的家庭成员数量 ________ (住一起)
E2: 您的性别: 男 女
E3: 您的年龄是: 1. 26-35 2. 36-45
3. 46-55
4. 56-65
5. >66
E4: 您的教育程度
1. 小于初中
2. 初中
3. 高中
4. 大学
5. 大学以上
E5: 您整个家庭每月的收入大概是<2000
1. 2000-5000
2. 5001-8000
3. 8000-10000
4. >10000
感谢您的参与!如果您愿意继续参加我们后续的访谈调研,请留下您的电话,谢谢。
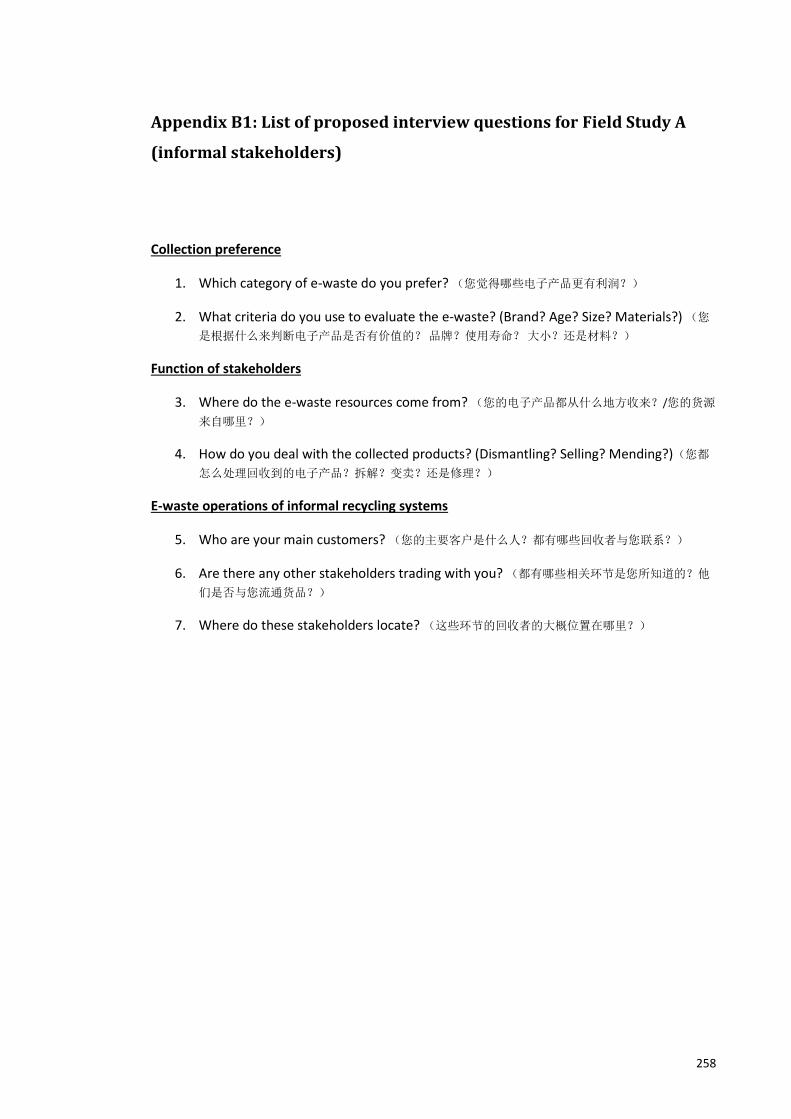
258
Appendix B1: List of proposed interview questions for Field Study A
(informal stakeholders)
Collection preference
1. Which category of e-waste do you prefer? (您觉得哪些电子产品更有利润?)
2. What criteria do you use to evaluate the e-waste? (Brand? Age? Size? Materials?) (您
是根据什么来判断电子产品是否有价值的? 品牌?使用寿命? 大小?还是材料?)
Function of stakeholders
3. Where do the e-waste resources come from? (您的电子产品都从什么地方收来?/您的货源
来自哪里?)
4. How do you deal with the collected products? (Dismantling? Selling? Mending?)(您都
怎么处理回收到的电子产品?拆解?变卖?还是修理?)
E-waste operations of informal recycling systems
5. Who are your main customers? (您的主要客户是什么人?都有哪些回收者与您联系?)
6. Are there any other stakeholders trading with you? (都有哪些相关环节是您所知道的?他
们是否与您流通货品?)
7. Where do these stakeholders locate? (这些环节的回收者的大概位置在哪里?)
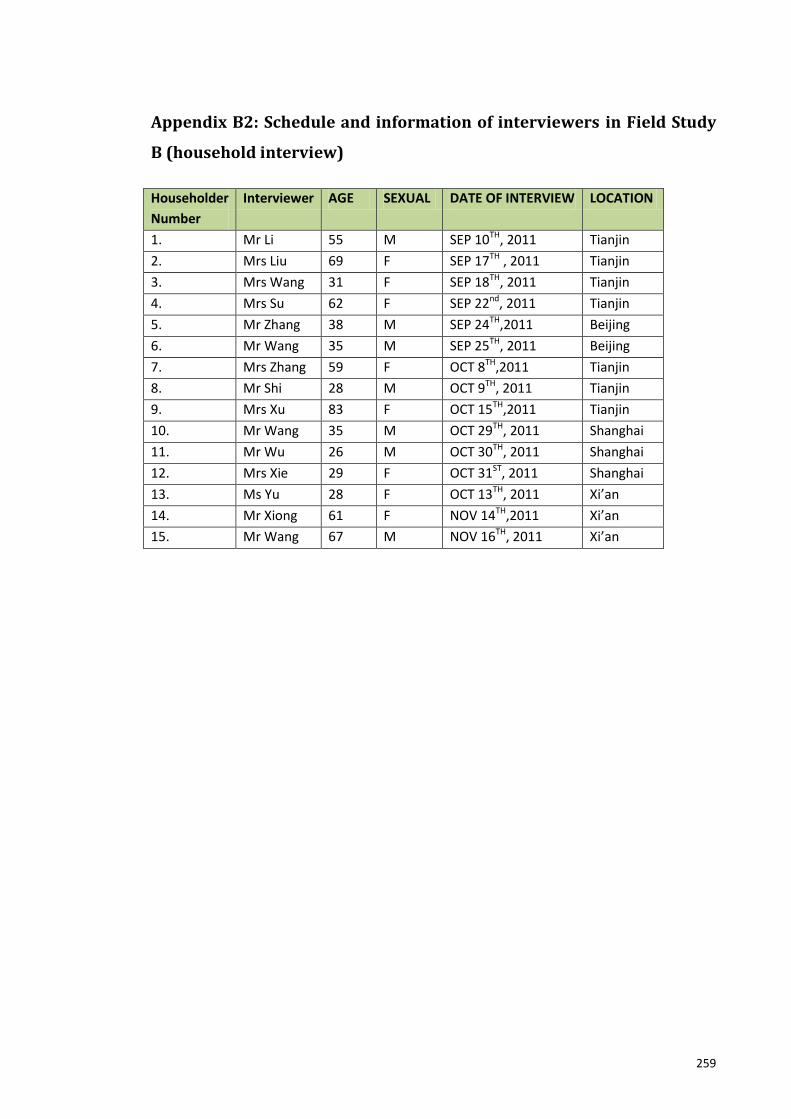
259
Appendix B2: Schedule and information of interviewers in Field Study
B (household interview)
Householder
Number
Interviewer AGE SEXUAL DATE OF INTERVIEW LOCATION
1. Mr Li 55 M SEP 10TH, 2011 Tianjin
2. Mrs Liu 69 F SEP 17TH , 2011 Tianjin
3. Mrs Wang 31 F SEP 18TH, 2011 Tianjin
4. Mrs Su 62 F SEP 22nd, 2011 Tianjin
5. Mr Zhang 38 M SEP 24TH,2011 Beijing
6. Mr Wang 35 M SEP 25TH, 2011 Beijing
7. Mrs Zhang 59 F OCT 8TH,2011 Tianjin
8. Mr Shi 28 M OCT 9TH, 2011 Tianjin
9. Mrs Xu 83 F OCT 15TH,2011 Tianjin
10. Mr Wang 35 M OCT 29TH, 2011 Shanghai
11. Mr Wu 26 M OCT 30TH, 2011 Shanghai
12. Mrs Xie 29 F OCT 31ST, 2011 Shanghai
13. Ms Yu 28 F OCT 13TH, 2011 Xi’an
14. Mr Xiong 61 F NOV 14TH,2011 Xi’an
15. Mr Wang 67 M NOV 16TH, 2011 Xi’an
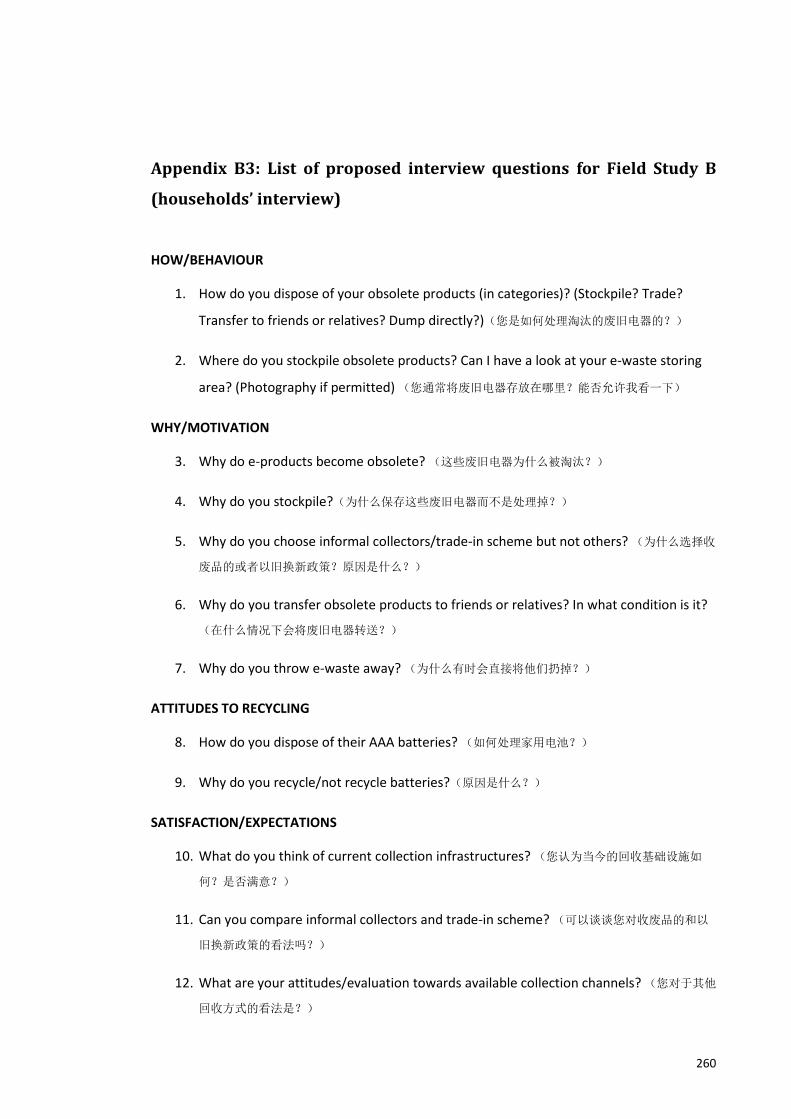
260
Appendix B3: List of proposed interview questions for Field Study B
(households’ interview)
HOW/BEHAVIOUR
1. How do you dispose of your obsolete products (in categories)? (Stockpile? Trade?
Transfer to friends or relatives? Dump directly?)(您是如何处理淘汰的废旧电器的?)
2. Where do you stockpile obsolete products? Can I have a look at your e-waste storing
area? (Photography if permitted) (您通常将废旧电器存放在哪里?能否允许我看一下)
WHY/MOTIVATION
3. Why do e-products become obsolete? (这些废旧电器为什么被淘汰?)
4. Why do you stockpile?(为什么保存这些废旧电器而不是处理掉?)
5. Why do you choose informal collectors/trade-in scheme but not others? (为什么选择收
废品的或者以旧换新政策?原因是什么?)
6. Why do you transfer obsolete products to friends or relatives? In what condition is it?
(在什么情况下会将废旧电器转送?)
7. Why do you throw e-waste away? (为什么有时会直接将他们扔掉?)
ATTITUDES TO RECYCLING
8. How do you dispose of their AAA batteries? (如何处理家用电池?)
9. Why do you recycle/not recycle batteries?(原因是什么?)
SATISFACTION/EXPECTATIONS
10. What do you think of current collection infrastructures? (您认为当今的回收基础设施如
何?是否满意?)
11. Can you compare informal collectors and trade-in scheme? (可以谈谈您对收废品的和以
旧换新政策的看法吗?)
12. What are your attitudes/evaluation towards available collection channels? (您对于其他
回收方式的看法是?)

261
13. Is there any aspect you think the current trade-in scheme can be improved? (对于以旧
换新政策,您有没有什么建议?)
14. Is there any suggestion or expectation for the current collection system? (对于中国的
回收系统,您有什么建议和期望吗?)
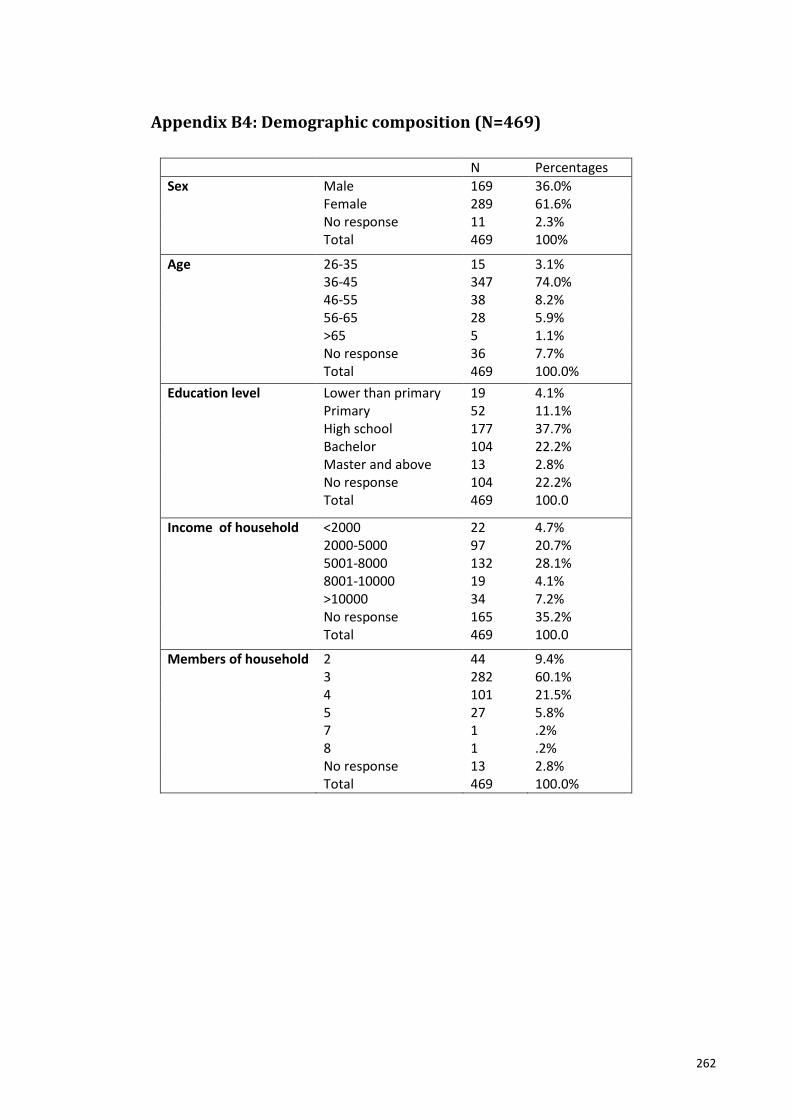
262
Appendix B4: Demographic composition (N=469)
N Percentages
Sex Male 169 36.0% Female 289 61.6% No response 11 2.3% Total 469 100%
Age 26-35 15 3.1% 36-45 347 74.0% 46-55 38 8.2% 56-65 28 5.9% >65 5 1.1% No response 36 7.7% Total 469 100.0%
Education level Lower than primary 19 4.1% Primary 52 11.1% High school 177 37.7% Bachelor 104 22.2% Master and above 13 2.8% No response 104 22.2% Total 469 100.0
Income of household <2000 22 4.7% 2000-5000 97 20.7% 5001-8000 132 28.1% 8001-10000 19 4.1% >10000 34 7.2% No response 165 35.2% Total 469 100.0
Members of household 2 44 9.4% 3 282 60.1% 4 101 21.5% 5 27 5.8% 7 1 .2% 8 1 .2% No response 13 2.8% Total 469 100.0%

263
Appendix C1: Approval of ethics application for Field Study A
FACULTY OF THE BUILT ENVIRONMENT
HUMAN RESEARCH
ETHICS ADVISORY PANEL
Built Environment Human Research Ethics Advisory Panel Date: 29 January 2013 Applicant Name: Xian Li Faculty of the Built Environment Re: Informail E-waste recycling in China Reference Number: 135001 Investigator: Xian Li At its meeting of 16/01/2013, the Built Environment Human Research Ethics Advisory Panel was satisfied that this project, is of minimal ethical impact and meets the requirements as set out in the National Statement on Ethical Conduct in Human Research*. Please see the accompanying minutes from the panels meeting for notes regarding your research. Having taken into account the advice of the Panel, the Deputy Vice-Chancellor (Research) has approved the project to proceed. Your Head of School/Unit/Centre will be informed of this decision. This approval is valid for 12 months from the date of the meeting. Yours sincerely
Russell Lowe Panel Convenor Built Environment Human Research Ethics Advisory Panel Cc: Head, School of the Built Environment * http:/www.nhmrc.gov.au
FACULTY OF THE BUILT ENVIRONMENT
HUMAN RESEARCH ETHICS
ADVISORY PANEL
Built Environment Human Research Ethics Advisory Panel Date: 14/09/2011 Applicant Name: Xian Li Faculty of the Built Environment Re: Informal E waste recycling in China Reference Number: 115107 Investigator: Xian Li At its meeting of 12/09/2011 the Built Environment Human Research Ethics Advisory Panel was satisfied that this project, is of minimal ethical impact and meets the requirements as set out in the National Statement on Ethical Conduct in Human Research*. Please see the accompanying minutes from the panels meeting for notes regarding your research. Having taken into account the advice of the Panel, the Deputy Vice-Chancellor (Research) has approved the project to proceed. Your Head of School/Unit/Centre will be informed of this decision. This approval is valid for 12 months from the date of the meeting. Yours sincerely
Russell Lowe Panel Convenor Built Environment Human Research Ethics Advisory Panel


264
Appendix C2: Approval of ethics application for Field Study B
Related Documents