Influences of Cement Source and Sample of Cement Source on Compressive Strength Variability of Gravel Aggregate Concrete State Study No 239 Project No. 106002 161000 Prepared for Mississippi Department of Transportation Prepared by Robert L. Varner, P.E. June, 2013 GEOTECHNICAL AND MATERIALS ENGINEERING CONSULTANTS BURNS COOLEY DENNIS, INC.

Welcome message from author
This document is posted to help you gain knowledge. Please leave a comment to let me know what you think about it! Share it to your friends and learn new things together.
Transcript

Influences of Cement Source and Sample of Cement Source on Compressive Strength Variability of Gravel Aggregate Concrete
State Study No 239
Project No. 106002 161000
Prepared for
Mississippi Department of Transportation
Prepared by Robert L. Varner, P.E.
June, 2013
Burns Cooley Dennis, Inc.GEOTECHNICAL AND MATERIALS ENGINEERING CONSULTANTS
BURNS COOLEY DENNIS, INC.
i
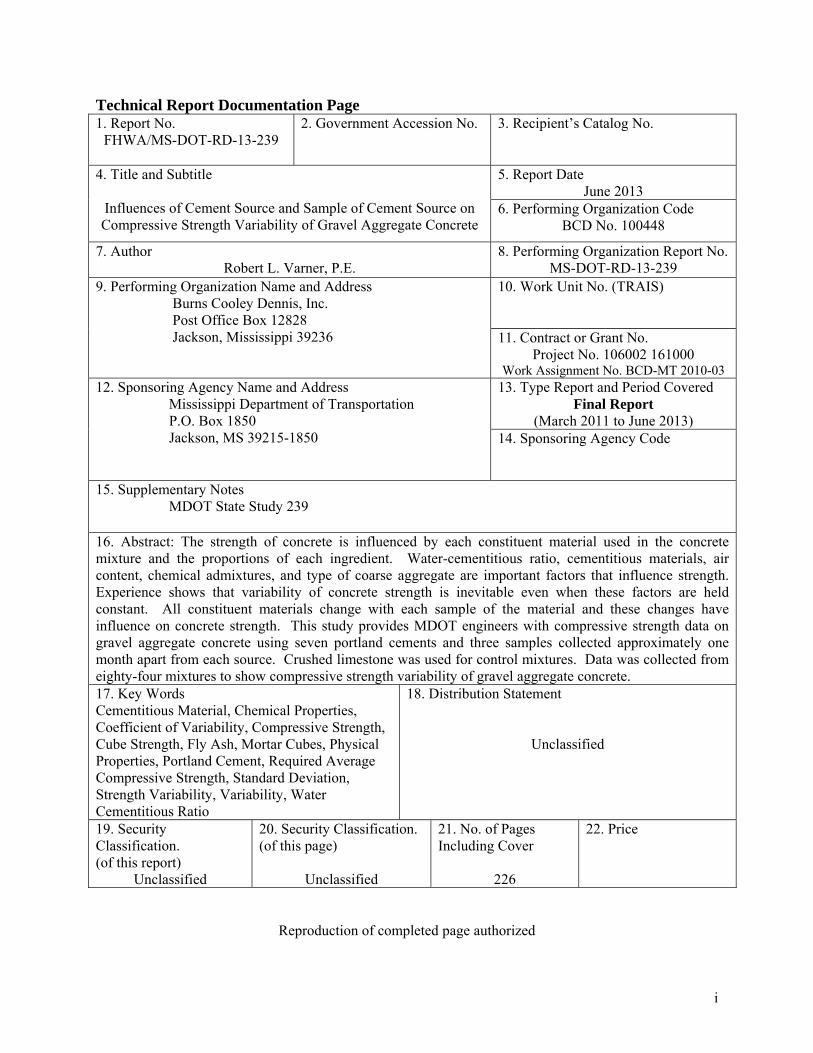
Technical Report Documentation Page 1. Report No.
FHWA/MS-DOT-RD-13-239 2. Government Accession No.
3. Recipient’s Catalog No.
4. Title and Subtitle
Influences of Cement Source and Sample of Cement Source on Compressive Strength Variability of Gravel Aggregate Concrete
5. Report Date June 2013
6. Performing Organization Code BCD No. 100448
7. Author Robert L. Varner, P.E.
8. Performing Organization Report No. MS-DOT-RD-13-239
9. Performing Organization Name and Address Burns Cooley Dennis, Inc. Post Office Box 12828 Jackson, Mississippi 39236
10. Work Unit No. (TRAIS) 11. Contract or Grant No.
Project No. 106002 161000 Work Assignment No. BCD-MT 2010-03
12. Sponsoring Agency Name and Address Mississippi Department of Transportation P.O. Box 1850 Jackson, MS 39215-1850
13. Type Report and Period Covered Final Report
(March 2011 to June 2013) 14. Sponsoring Agency Code
15. Supplementary Notes MDOT State Study 239
16. Abstract: The strength of concrete is influenced by each constituent material used in the concrete mixture and the proportions of each ingredient. Water-cementitious ratio, cementitious materials, air content, chemical admixtures, and type of coarse aggregate are important factors that influence strength. Experience shows that variability of concrete strength is inevitable even when these factors are held constant. All constituent materials change with each sample of the material and these changes have influence on concrete strength. This study provides MDOT engineers with compressive strength data on gravel aggregate concrete using seven portland cements and three samples collected approximately one month apart from each source. Crushed limestone was used for control mixtures. Data was collected from eighty-four mixtures to show compressive strength variability of gravel aggregate concrete. 17. Key Words Cementitious Material, Chemical Properties, Coefficient of Variability, Compressive Strength, Cube Strength, Fly Ash, Mortar Cubes, Physical Properties, Portland Cement, Required Average Compressive Strength, Standard Deviation, Strength Variability, Variability, Water Cementitious Ratio
18. Distribution Statement
Unclassified
19. Security Classification. (of this report)
Unclassified
20. Security Classification. (of this page)
Unclassified
21. No. of Pages Including Cover
226
22. Price
Reproduction of completed page authorized
ii
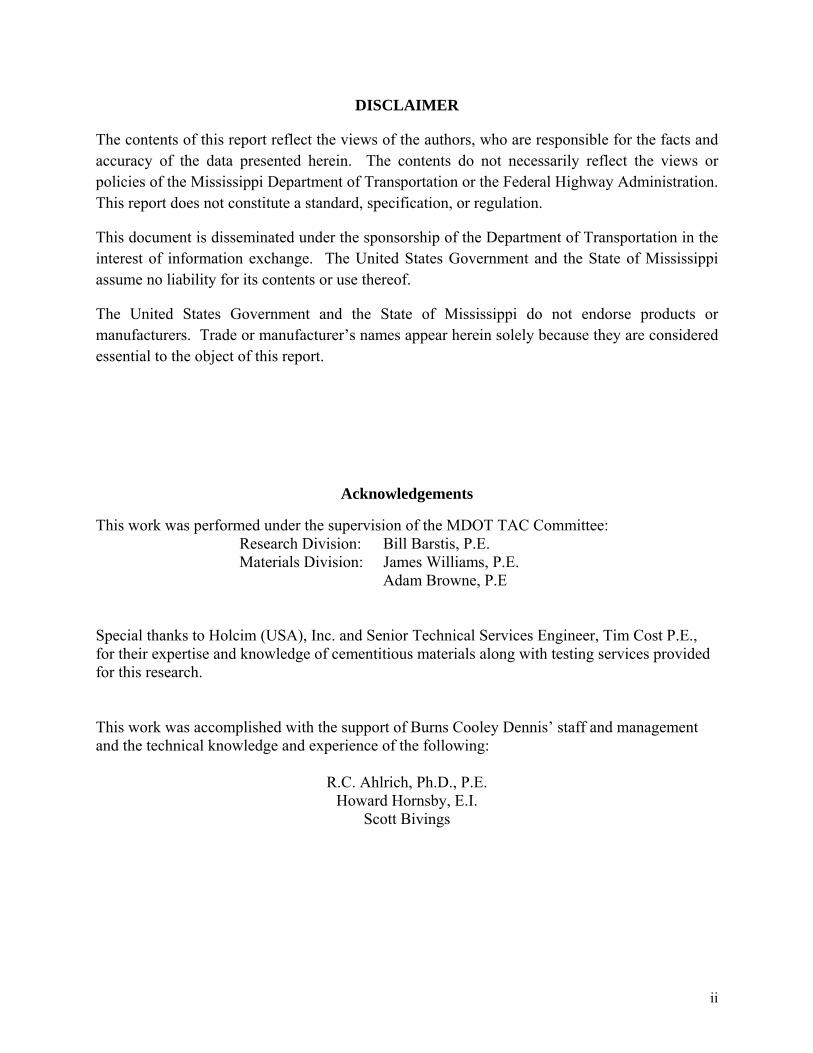
DISCLAIMER
The contents of this report reflect the views of the authors, who are responsible for the facts and accuracy of the data presented herein. The contents do not necessarily reflect the views or policies of the Mississippi Department of Transportation or the Federal Highway Administration. This report does not constitute a standard, specification, or regulation.
This document is disseminated under the sponsorship of the Department of Transportation in the interest of information exchange. The United States Government and the State of Mississippi assume no liability for its contents or use thereof.
The United States Government and the State of Mississippi do not endorse products or manufacturers. Trade or manufacturer’s names appear herein solely because they are considered essential to the object of this report.
Acknowledgements
This work was performed under the supervision of the MDOT TAC Committee: Research Division: Bill Barstis, P.E. Materials Division: James Williams, P.E.
Adam Browne, P.E Special thanks to Holcim (USA), Inc. and Senior Technical Services Engineer, Tim Cost P.E., for their expertise and knowledge of cementitious materials along with testing services provided for this research. This work was accomplished with the support of Burns Cooley Dennis’ staff and management and the technical knowledge and experience of the following:
R.C. Ahlrich, Ph.D., P.E.
Howard Hornsby, E.I. Scott Bivings

iii
Abstract
Compressive strength of concrete is influenced by all aspects of the concrete mixture
including each constituent material and proportions of each ingredient. Water-cementitious
ratio, cementitious materials, air content, chemical admixtures, and coarse aggregate properties
all influence compressive strength. Experience shows that variability of concrete strength is
inevitable even when afore mentioned factors are held constant. Each constituent material has
variability which influences concrete strength.
The primary cementing material in concrete is portland cement. When portland cement is
combined with water, a chemical reaction called hydration occurs that causes concrete to set and
gain strength. While strict quality control measures are in place at portland cement plants, the
chemical composition of each sample of portland cement varies due to variations in raw
materials and the manufacturing process. If the primary cementing material has variability in its
chemical composition, the compressive strength of the concrete made with the portland cement
may also have variability.
Mortar cubes are used as one quality control measure at portland cement plants. This
strength testing is performed using strict control of the aggregates and water. Cement companies
also test competitors’ cements in their market areas to understand performance of similar
cements in the area. However, little testing is performed on multiple samples from the same
source and various sources of cement to determine the extent of variability in compressive
strength of concrete.
If there is high variability in compressive strengths of concrete among portland cement
concrete suppliers in a given region, the required average compressive strength (overdesign) of
the concrete mixtures will need to reflect the magnitude of this variability. Required average
compressive strength (f’cr) is the overdesign used for concrete mixtures to provide additional
strength to account for strength variability that occurs because of changes the concrete materials
and testing.

iv
The Mississippi Department of Transportation (MDOT) currently allows Contractors to
change sources of cement, fly ash and slag cement without supporting compressive strength data
on the concrete made from the new source of cement. This study provides MDOT engineers
with compressive strength data on gravel aggregate concrete using seven typical Mississippi
portland cement sources using three samples collected approximately one month apart from each
source. Crushed limestone was used to develop control mixtures. Data was collected from
eighty-four mixtures to show compressive strength variability of gravel aggregate concrete.

v
Table of Contents
Abstract ........................................................................................................................................................ iii
Table of Contents .......................................................................................................................................... v
List of Tables ............................................................................................................................................. viii
List of Figures .............................................................................................................................................. xi
Chapter 1 – Introduction ............................................................................................................................... 1
Background ............................................................................................................................................... 1
Factors that Influence Compressive Strength Variability ......................................................................... 2
Water Cementitious Ratio ..................................................................................................................... 3
Paste-Aggregate Interface ..................................................................................................................... 3
Supplemental Cementitious Materials (Class C and Class F Fly Ash) ................................................. 4
Air Content ........................................................................................................................................... 4
Aggregate Shape ................................................................................................................................... 5
Water-Reducing Admixtures ................................................................................................................ 5
Quality Control Testing ........................................................................................................................ 5
Required Average Compressive Strength ................................................................................................. 6
Field Experience ................................................................................................................................... 6
Laboratory Trial Mixture ...................................................................................................................... 7
Objective ................................................................................................................................................... 7
Approach ................................................................................................................................................... 7
Chapter 2 - Materials .................................................................................................................................. 10
Hydraulic Cement ................................................................................................................................... 10
Type I and Type II .............................................................................................................................. 10
Type IL ............................................................................................................................................... 10
Supplementary Cementitious Materials (SCMs) .................................................................................... 18
Fly Ash ................................................................................................................................................ 18
Aggregates .............................................................................................................................................. 20
Water Reducer......................................................................................................................................... 21
Chapter 3 – Concrete Mixtures ................................................................................................................... 22
Mixture Development ............................................................................................................................. 22
Coarse Aggregate Content ...................................................................................................................... 22
Typical Mixtures ..................................................................................................................................... 23
vi
Mix Designations .................................................................................................................................... 25
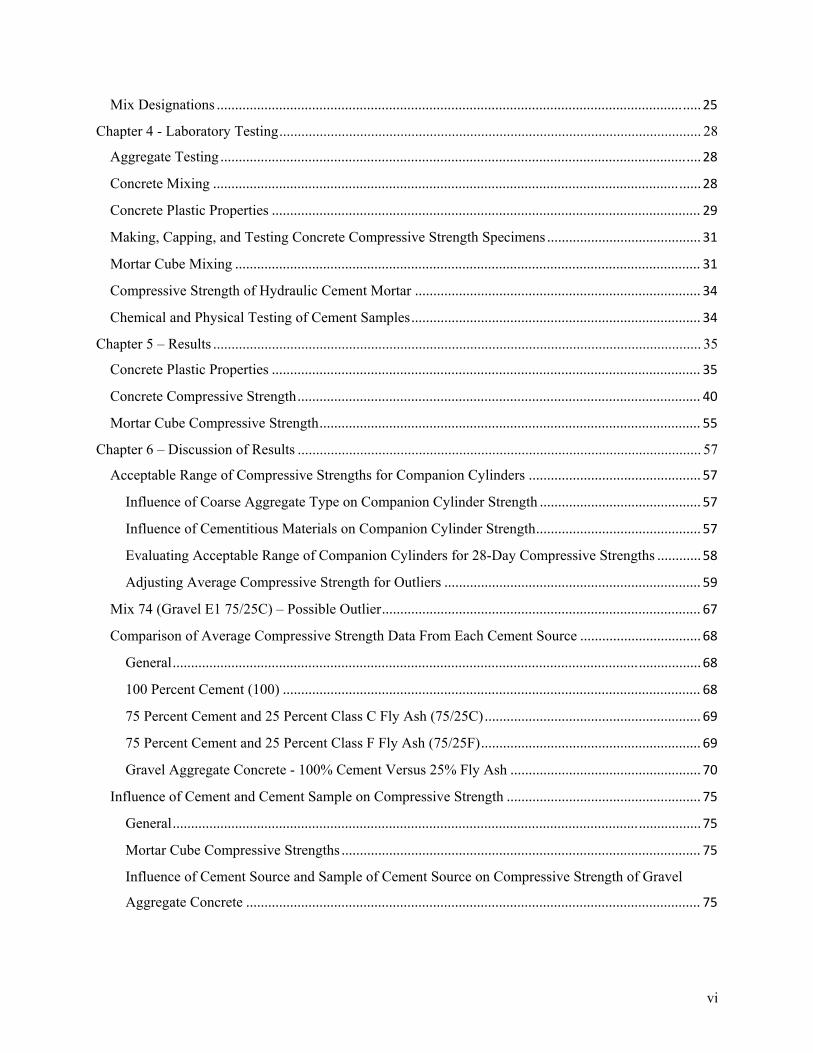
Chapter 4 - Laboratory Testing ................................................................................................................... 28
Aggregate Testing ................................................................................................................................... 28
Concrete Mixing ..................................................................................................................................... 28
Concrete Plastic Properties ..................................................................................................................... 29
Making, Capping, and Testing Concrete Compressive Strength Specimens .......................................... 31
Mortar Cube Mixing ............................................................................................................................... 31
Compressive Strength of Hydraulic Cement Mortar .............................................................................. 34
Chemical and Physical Testing of Cement Samples ............................................................................... 34
Chapter 5 – Results ..................................................................................................................................... 35
Concrete Plastic Properties ..................................................................................................................... 35
Concrete Compressive Strength .............................................................................................................. 40
Mortar Cube Compressive Strength ........................................................................................................ 55
Chapter 6 – Discussion of Results .............................................................................................................. 57
Acceptable Range of Compressive Strengths for Companion Cylinders ............................................... 57
Influence of Coarse Aggregate Type on Companion Cylinder Strength ............................................ 57
Influence of Cementitious Materials on Companion Cylinder Strength ............................................. 57
Evaluating Acceptable Range of Companion Cylinders for 28-Day Compressive Strengths ............ 58
Adjusting Average Compressive Strength for Outliers ...................................................................... 59
Mix 74 (Gravel E1 75/25C) – Possible Outlier ....................................................................................... 67
Comparison of Average Compressive Strength Data From Each Cement Source ................................. 68
General ................................................................................................................................................ 68
100 Percent Cement (100) .................................................................................................................. 68
75 Percent Cement and 25 Percent Class C Fly Ash (75/25C) ........................................................... 69
75 Percent Cement and 25 Percent Class F Fly Ash (75/25F) ............................................................ 69
Gravel Aggregate Concrete - 100% Cement Versus 25% Fly Ash .................................................... 70
Influence of Cement and Cement Sample on Compressive Strength ..................................................... 75
General ................................................................................................................................................ 75
Mortar Cube Compressive Strengths .................................................................................................. 75
Influence of Cement Source and Sample of Cement Source on Compressive Strength of Gravel
Aggregate Concrete ............................................................................................................................ 75

vii
Influence of Cement Source and Sample of Cement Source on Compressive Strength of Gravel
Aggregate Concrete ............................................................................................................................ 76
Influence of Cement Source on Compressive Strength of Crushed Limestone Aggregate Concrete . 76
Influence of Cementitious Materials and Coarse Aggregate Type ..................................................... 77
Influence of Cement Source and Cement Sample on Slump .................................................................. 86
General ................................................................................................................................................ 86
Gravel Aggregate Concrete and Slump .............................................................................................. 87
Crushed Limestone Aggregate Concrete and Slump .......................................................................... 88
Chapter 7 – Analysis of Results .................................................................................................................. 97
General .................................................................................................................................................... 97
Statistical Data for Gravel Aggregate Concrete ...................................................................................... 97
Relationship Between Fresh Properties and 28-Day Concrete Strength ................................................. 98
Relationship Between 28-Day Mortar Cube Strength and 28-Day Concrete Strength ......................... 103
Relationship Between Chemical and Physical Properties of Cement and 28-Day Concrete Strength . 106
Influence of Age on Concrete Compressive Strength ........................................................................... 114
Chapter 8 - Conclusions and Recommendations ...................................................................................... 118
General .................................................................................................................................................. 118
Conclusions ........................................................................................................................................... 118
Influence of Testing on Compressive Strength ................................................................................. 119
Influence of Aggregate Type on Compressive Strength ................................................................... 120
Influence of Class C and Class F Fly Ash on Compressive Strength ............................................... 120
Influence of Changing Cement Source and Sample of Cement Sources on 28-Day Compressive
Strength ............................................................................................................................................. 121
Influence of Cement Sample on Compressive Strength ................................................................... 122
Recommendations ................................................................................................................................. 123
Number of 4 in. X 8 in. Companion Cylinders ..................................................................................... 123
Cement Source Change ......................................................................................................................... 123
Cement Type ......................................................................................................................................... 124
Mixtures Based on Field Experience .................................................................................................... 124
Research Opportunities ............................................................................................................................. 125
References ................................................................................................................................................. 126
Appendix A ............................................................................................................................................... 127

viii
List of Tables
Table 1 – Experimental Mixtures.................................................................................................................. 9
Table 2 - Chemical and Physical Properties of Cement A .......................................................................... 11
Table 3 - Chemical and Physical Properties of Cement B .......................................................................... 12
Table 4 - Chemical and Physical Properties of Cement C .......................................................................... 13
Table 5 - Chemical and Physical Properties of Cement D .......................................................................... 14
Table 6 - Chemical and Physical Properties of Cement E .......................................................................... 15
Table 7 - Chemical and Physical Properties of Cement F .......................................................................... 16
Table 8 - Chemical and Physical Properties of Cement G .......................................................................... 17
Table 9: Class C Fly Ash - Chemical and Physical Properties ................................................................... 19
Table 10: Class F Fly Ash - Chemical and Physical Properties .................................................................. 19
Table 11 - Average Aggregate Properties ................................................................................................... 20
Table 12 – Typical Mixture Proportions: Gravel Aggregates – (100) ........................................................ 24
Table 13 – Typical Mixture Proportions: Gravel Aggregates – (75/25C) ................................................. 24
Table 14 – Typical Mixture Proportions: Gravel Aggregates – (75/25F) .................................................. 24
Table 15 – Typical Mixture Proportions: Crushed Limestone Aggregates – (100) .................................... 24
Table 16 – Typical Mixture Proportions: Crushed Limestone Aggregates – (75/25C) ............................. 25
Table 17 – Typical Mixture Proportions: Crushed Limestone Aggregates – (75/25F).............................. 25
Table 18 - Mix Descriptions ....................................................................................................................... 26
Table 19 – Mixture Proportions for 2-inch Mortar Cubes .......................................................................... 32
Table 20 - Plastic Properties: Gravel Aggregate, (100) .............................................................................. 36
Table 21 - Plastic Properties: Gravel Aggregate, (75/25C) ........................................................................ 37
Table 22 - Plastic Properties: Gravel Aggregate, (75/25F) ......................................................................... 38
Table 23 - Plastic Properties: Crushed Limestone Aggregate, (100) .......................................................... 39
Table 24 - Plastic Properties: Crushed Limestone Aggregate, (75/25C) .................................................... 39
ix
Table 25 - Plastic Properties: Crushed Limestone Aggregate, (75/25F) ..................................................... 39
Table 26 - Average Compressive Strength: Gravel Aggregate, (100) ........................................................ 41
Table 27 - Average Compressive Strength: Gravel Aggregate, (75/25C) .................................................. 42
Table 28 - Average Compressive Strength: Gravel Aggregate, (75/25F) ................................................... 43
Table 29 - Average Compressive Strength: Crushed Limestone Aggregate, (100) .................................... 44
Table 30 - Average Compressive Strength: Crushed Limestone Aggregate, (75/25C) .............................. 44
Table 31 - Average Compressive Strength: Crushed Limestone Aggregate, (75/25F) ............................... 44
Table 32 - Average Compressive Strength for Mortar Cubes ..................................................................... 56
Table 33 - Summary of Outliers Removed ................................................................................................. 60
Table 34 – Maximum Percent Change in Average Compressive Strength of Gravel Aggregate Concrete When Changing Cement Samples ............................................................................................................... 85
Table 35 - Maximum Percent Change in Average Compressive Strength of Gravel Aggregate Concrete Based on Changing Both Cement Source and Sample of Cement Source ................................................. 86
Table 36 - Maximum Percent Change in Average Compressive Strength of Gravel Aggregate Concrete based on Changing Cement Source ............................................................................................................ 86
Table 37 – Maximum Percent Change in Average Compressive Strength of Crushed Limestone When Changing Cement Source ........................................................................................................................... 86
Table 38 - Statistical Data for 28-Day Compressive Strength of Gravel Aggregate Concrete Cement Sample ........................................................................................................................................................ 98
Table 39 - Influence of Cement Chemical and Physical Properties on Compressive Strength of Gravel Aggregate Concrete: 100 .......................................................................................................................... 107
Table 40 - Influence of Cement Chemical and Physical Properties on Compressive Strength of Gravel Aggregate Concrete: 75/25C ..................................................................................................................... 108
Table 41 - Influence of Cement Chemical and Physical Properties on Compressive Strength of Gravel Aggregate Concrete: 75/25F ..................................................................................................................... 109
Table 42 - Influence of Cement Chemical and Physical Properties on Compressive Strength of Crushed Limestone Aggregate Concrete: 100 ......................................................................................................... 110
Table 43 - Influence of Cement Chemical and Physical Properties on Compressive Strength of Crushed Limestone Aggregate Concrete: 75/25C ................................................................................................... 111

x
Table 44 - Influence of Cement Chemical and Physical Properties on Compressive Strength of Crushed Limestone Aggregate Concrete: 75/25F ................................................................................................... 112
Table 45 - Influence of Cement Chemical and Physical Properties on 28-Day Compressive Strength – Ranked ...................................................................................................................................................... 113
xi
List of Figures Figure 1 - Unit Weight Testing ................................................................................................................... 29
Figure 2 - Slump Testing ............................................................................................................................ 30
Figure 3 - Air Content Testing .................................................................................................................... 30
Figure 4 - Flow Table ................................................................................................................................. 32
Figure 5 - Mechanical Mortar Mixer .......................................................................................................... 33
Figure 6 - Mortar Cubes .............................................................................................................................. 33
Figure 7 - Compressive Strength vs Age: Cement A 100 ........................................................................... 45
Figure 8 - Compressive Strength vs Age: Cement A 75/25C ..................................................................... 45
Figure 9 - Compressive Strength vs Age: Cement A 75/25F ...................................................................... 46
Figure 10 - Compressive Strength vs Age: Cement B 100 ......................................................................... 46
Figure 11 - Compressive Strength vs Age: Cement B 75/25C ................................................................... 47
Figure 12 - Compressive Strength vs Age: Cement B 75/25F .................................................................... 47
Figure 13 - Compressive Strength vs Age: Cement C 100 ......................................................................... 48
Figure 14 - Compressive Strength vs Age: Cement C 75/25C ................................................................... 48
Figure 15 - Compressive Strength vs Age: Cement C 75/25F .................................................................... 49
Figure 16 - Compressive Strength vs Age: Cement D 100 ......................................................................... 49
Figure 17 - Compressive Strength vs Age: Cement D 75/25C ................................................................... 50
Figure 18 - Compressive Strength vs Age: Cement D 75/25F .................................................................... 50
Figure 19 - Compressive Strength vs Age: Cement E 100 ......................................................................... 51
Figure 20 - Compressive Strength vs Age: Cement E 75/25C .................................................................... 51
Figure 21 - Compressive Strength vs Age: Cement E 75/25F .................................................................... 52
Figure 22 - Compressive Strength vs Age: Cement F 100 .......................................................................... 52
Figure 23 - Compressive Strength vs Age: Cement F 75/25C .................................................................... 53
Figure 24 - Compressive Strength vs Age: Cement F 75/25F .................................................................... 53

xii
Figure 25 - Compressive Strength vs Age: Cement G 100 ......................................................................... 54
Figure 26 - Compressive Strength vs Age: Cement G 75/25C ................................................................... 54
Figure 27 - Compressive Strength vs Age: Cement G 75/25F .................................................................... 55
Figure 28 – 28-Day Companion Cylinder Strength Ranges for All Mixes ................................................. 62
Figure 29 - 28-Day Companion Cylinder Strength Ranges for All Crushed Limestone Mixes Before Removing Outliers ...................................................................................................................................... 63
Figure 30 - 28-Day Companion Cylinder Strength Ranges for Gravel Aggregate Concrete Mixes (100) Before Removing Outliers .......................................................................................................................... 64
Figure 31 - 28-Day Companion Cylinder Strength Ranges for Gravel Aggregate Concrete Mixes (75/25C) Before Removing Outliers .......................................................................................................................... 65
Figure 32 - 28-Day Companion Cylinder Strength Ranges for Gravel Aggregate Concrete Mixes (75/25F) Before Removing Outliers .......................................................................................................................... 66
Figure 33 – 28-Day Companion Cylinder Strength Range After Removing Outliers ................................ 67
Figure 34 - Average Compressive Strength vs Age: 100 ............................................................................ 71
Figure 35 - Average Compressive Strength vs Age: 75/25C ...................................................................... 72
Figure 36 - Average Compressive Strength vs Age: 75/25F ...................................................................... 73
Figure 37 - Average Compressive Strength vs Age: Gravel Aggregate ..................................................... 74
Figure 38 - Average Compressive Strength vs Cement Sample: Gravel Aggregate, 100........................... 77
Figure 39 - Average Compressive Strength vs Cement Source: Gravel Aggregate, 75/25C ...................... 78
Figure 40 - Average Compressive Strength vs Cement Sample: Gravel Aggregates, 75/25F .................... 79
Figure 41 - Average Compressive Strength vs Cement Sample: Gravel Aggregates, All Mixes ............... 80
Figure 42 - Compressive Strength vs Cement Sample: Crushed Limestone Aggregates, 100 ................... 81
Figure 43 - Compressive Strength vs Cement Sample: Crushed Limestone Aggregates, 75/25C ............. 82
Figure 44 - Compressive Strength vs Cement Sample: Crushed Limestone Aggregates, 75/25F .............. 83
Figure 45 - Compressive Strength vs Cement Sample: Crushed Limestone Aggregates, All Mixes ......... 84
Figure 46 – Influence of Cement Source on Slump of Gravel Aggregate Concrete: 100 ........................... 89
Figure 47 – Influence of Cement Source on Slump of Gravel Aggregate Concrete: 75/25C ..................... 90

xiii
Figure 48 - Influence of Cement Source on Slump of Gravel Aggregate Concrete: 75/25F ...................... 91
Figure 49 - Influence of Cement Source on Slump of Gravel Aggregate Concrete: All Mixes ................. 92
Figure 50 - Influence of Cement Source on Slump of Crushed Limestone Aggregate Concrete: 100 ....... 93
Figure 51 - Influence of Cement Source on Slump of Crushed Limestone Aggregate Concrete: 75/25C . 94
Figure 52 - Influence of Cement Source on Slump of Crushed Limestone Aggregate Concrete: 100/25F 95
Figure 53 – Influence of Cement Source on Slump of Crushed Limestone Aggregate Concrete: All Mixes .................................................................................................................................................................... 96
Figure 54 - 28-Day Compressive Strength vs Slump: Gravel Aggregate, 100 ........................................... 99
Figure 55 – 28-Day Compressive Strength vs Entrapped Air: Gravel Aggregate, 100 .............................. 99
Figure 56 – 28-Day Compressive Strength vs Unit Weight: Gravel Aggregate, 100 ............................... 100
Figure 57 – 28-Day Compressive Strength vs Slump: Gravel Aggregate, 75/25C ................................... 100
Figure 58 – 28-Day Compressive Strength vs Entrapped Air: Gravel Aggregate, 75/25C ...................... 101
Figure 59 – 28-Day Compressive Strength vs Unit Weight: Gravel Aggregate, 75/25C ......................... 101
Figure 60 – 28-Day Compressive Strength vs Slump: Gravel Aggregate, 75/25F ................................... 102
Figure 61 – 28-Day Compressive Strength vs Entrapped Air: Gravel Aggregate, 75/25F ....................... 102
Figure 62 – 28-Day Compressive Strength vs Unit Weight: Gravel Aggregate 75/25F ........................... 103
Figure 63 – 28-Day Compressive Strength vs 28-Day Cube Strength: Gravel Aggregate, 100 ............... 104
Figure 64 – 28-Day Compressive Strength vs 28-Day Cube Strength: Gravel Aggregate, 75/25C ......... 105
Figure 65 – 28-Day Compressive Strength vs Cube Strength: Gravel Aggregates, 75/25F ..................... 105
Figure 66 - Percent of 28-Day Compressive Strength vs Age of Gravel Aggregate Concrete: 100 ......... 114
Figure 67 - Percent of 28-Day Compressive Strength vs Age of Gravel Aggregate Concrete: 75/25C ... 115
Figure 68 - Percent of 28-Day Compressive Strength vs Age of Gravel Aggregate Concrete: 75/25F ... 115
Figure 69 - Percent of 28-Day Compressive Strength vs Age of Crushed Limestone Aggregate Concrete: 100 ............................................................................................................................................................ 116
Figure 70 - Percent of 28-Day Compressive Strength vs Age of Crushed Limestone Aggregate Concrete: 75/25C ....................................................................................................................................................... 116

xiv
Figure 71 - Percent of 28-Day Compressive Strength vs Age of Crushed Limestone Aggregate Concrete: 75/25F ....................................................................................................................................................... 117
1
Chapter 1 – Introduction Background
While low concrete strength is rarely encountered on construction projects for the
Mississippi Department of Transportation, there have been isolated incidences where low
compressive strength has be reported. Mix design submittals and supporting data usually
provide no indications of potential issues on such projects. These experiences can drive
construction trends that have potentially negative implications for both project quality and costs.
Variability and occasional experiences with lower-than-expected strength lead concrete suppliers
to design mixes with increased overdesign margins, higher cementitious content, less beneficial
re-use of byproduct pozzolans, selection of higher cost aggregates, and higher dosages of
chemical admixtures. An unexpected trend observed in concrete projects since MDOT’s
implementation of QC/QA specifications is that Contractors and concrete suppliers are rarely
taking advantage of opportunities to economize mix designs and reduce cementitious content in
ongoing projects using project strength records and standard deviations. Since this becomes a
missed profit opportunity, concrete suppliers must have concerns about the effects of possible
strength variability that outweigh the potential for cost savings. All of these factors can drive the
unit cost of concrete higher and related undesirable performance trends may include higher
hydration heat, greater shrinkage and cracking, and more permeable, less durable concrete.
Concrete strength variability influences MDOT mix submittal requirements and criteria
for screening proposed concrete mixtures and preventing low concrete strength, to the extent
possible. A better understanding of strength variability in common concrete mixtures and the
key influences of specific materials and proportions was needed to facilitate evaluation of these
criteria.
Antidotal evidence suggests that problematic concrete strength variability may be linked
to uncrushed gravel coarse aggregates and the use of fly ash replacement of cement near
practical or specification limits. In some cases it has been evident that the cement source may be
part of the influences, and strength performance has improved dramatically with the same mix
design after a change of cement. In such cases, though, there has rarely been any indication of
significantly different cement strength potential (comparing the two sources) as evidenced by
2
routine cement mortar cube strength testing. Concrete producers and Contractors have also
learned that such problematic strengths can often be quickly remedied by discontinuing the use
of fly ash to replace portland cement. Yet the same combination of materials used with a
different cement source may produce strengths in excess of a similar mixture proportioned with
100% portland cement indicating that cement variation may have considerable influence on
compressive strength variability of concrete made with local materials.
MDOT currently allows the Contractor to change the cement source of an approved
mixture upon written request and subsequent approval by representatives of MDOT’s Materials
Division (MDOT Concrete Field Manual, Section 5.7) (1). This source change is typically
allowed without compressive strength data documenting the impact of the change in cement.
Changing cement sources on a project when proposed by the Contractor is common and the
potential influence of cement variation has been documented as having little impact to
compressive strength variability contributing only 260 psi to standard deviation of compressive
strength of concrete (2).
Variability of concrete compressive strength is influenced by all aspects of the concrete
mixture including each constituent material and proportions of each ingredient. Each constituent
concrete material should meet the criteria established by the American Association of State
Highway and Transportation Officials (AASHTO) or the American Society for Testing and
Materials (ASTM). These components must be proportioned to produce concrete that meets the
required performance characteristics specified for the applicable concrete item being constructed.
The performance characteristic that is required for all of MDOT’s road or bridge construction is
compressive strength. For this reason, both MDOT Engineers and concrete mixture designers
need to understand factors that influence concrete strength variability and if characteristics exist
within local materials that increase strength variability.
Factors that Influence Compressive Strength Variability
Concrete has a coefficient of variation of 20 percent which is relatively high compared to
other construction materials such as steel bars having a coefficient of variation ranging from 6 to
10 percent (2). This high coefficient of variation should be expected due to all of the factors that

3
influence concrete compressive strength. Cement, water, fine and coarse aggregates,
temperature, mixture properties, batching, water measurement, mixing, handling and sampling,
compaction, size and shape of test specimens, curing, and testing all contribute to variability of
concrete compressive strength (2). A brief discussion is provided below of generally accepted
factors that have influence on concrete compressive strength including: 1) water-cementitious
materials ratio (w/cm); 2) paste-aggregate interface; 3) supplemental cementitious materials; 4)
air content; 5) aggregate shape; 6) water reducing admixtures; and 7) quality control testing.
Water Cementitious Ratio
The primary factor that influences the strength of concrete is water cement (w/c) or
water-cementitious (w/cm) ratio. The relationship between concrete strength and w/cm ratio has
been accepted for nearly 100 years following the studies of Duff A. Abrams in 1918 and is
frequently referred to as the Abrams’ water-cement ratio law (3). Based on extensive research
and experience on this topic, as long as the aggregates and air content remain constant, the lower
the w/cm ratio of the mixture, the higher the concrete’s compressive strength will be.
Paste-Aggregate Interface
The paste-aggregate interface is considered the weakest region of concrete and could be
the controlling factor of concrete compressive strength (4). Most of the known concrete failure
mechanisms can be attributed to the performance of the paste-aggregate bond and its
performance in the concrete matrix. Since this is the weakest part of the matrix, and is the part
of the matrix that precedes failure in almost every case, it is critical that the variation in
compressive strength that can be attributed to other factors be controlled to as high of a degree
as possible. In general, bond failure occurs before failure of either the paste or the aggregate.
This region is weak because cracks exist in this part of the concrete matrix prior to the
application of any applied stresses due to bleeding, segregation, and volume changes of the paste
during hydration (4).
There are no standard test methods for measuring the bond strength of aggregates in
concrete, but the bond strength depends on many factors common to concrete failure. Bond
strength, as does concrete strength, increases as w/cm ratio decreases. The bond strength also
4
depends on the cement source as does the compressive strength of the concrete. Air entrainment
can reduce the bond strength, since air voids can reduce the contact area between the paste and
the aggregates (4). The absorption of the aggregates can affect the bonding of the paste to the
aggregate (process of absorption can improve contact between the paste and the aggregate) (4).
Paste-aggregate bond failures do not typically occur between the paste and the fine aggregates,
and seems to increase in likelihood as the maximum aggregate particle size increases (4).
Finally, the smoother the texture of the coarse aggregate the lower the bond strength tends to be.
Aggregates with relatively rough texture, like crushed aggregates, typically have a higher surface
area available for bonding. (4).
Supplemental Cementitious Materials (Class C and Class F Fly Ash)
Economics and sulfate conditions influence the use of supplementary cementitious
materials (SCM’s) in MDOT concrete projects. Fly ash is the most common SCM used in
MDOT concrete. The two classes of fly ash commonly used are Class C and Class F. The
amount of cement replacement with SCM’s is generally limited by specifications and is
dependent on the sulfate conditions for MDOT concrete. MDOT specifications allow portland
cement to be replaced with up to 25 percent fly ash for all classes of concrete. Fly ash
replacement can increase the setting time of concrete and reduce early age strength. Mixtures
proportioned with fly ash generally develop strength over a longer period of time and frequently
result in higher strength mixes than mixtures with portland cement alone (5). Some Class C fly
ashes combined with certain cements can result in little to no change in setting time and early
age strength and can even cause flash setting in certain conditions (6).
Air Content
Entrapped air is present in all concrete. This air is created during mixing, handling, and
placing the concrete. Entrapped air voids are relatively large when compared to intentionally
entrained air voids. Entrained air voids are purposefully put in the cement-paste portion of the
concrete to provide a system of voids to accommodate water when freezing and expansion
occurs. Intentionally entrained air voids are extremely small ranging in size from 10 to 1000 μm
in diameter (3). Entrained air is necessary in most concrete exposed to freezing and thawing
cycles to protect the concrete from surface scaling. Both entrapped air and entrained air cause

5
voids in the cement-paste which decrease the strength of the cement-paste and the paste-
aggregate bond which reduces concrete strength. It has been noted that for every percentage of
entrained air, flexural strengths can be expected to decrease 2 to 3 percent, while compressive
strengths can be expected to reduce 3 to 4 percent (7).
Aggregate Shape
Aggregate shape can influence the strength of concrete mixtures due to the effect
aggregate shape has on water demand. Well-graded cubical and spherical particles tend to pack
better decreasing the amount of water necessary to maintain workability, thereby reducing w/c
ratio and increasing strength. Conversely, flat and elongated aggregates can increase the water
necessary to maintain workability, thereby increasing w/c ratio and decreasing strength (8).
According to Shilstone, rounded gravels or cubical crushed stones are desirable because they
lead to mixtures that have improved workability, better pumpability and finishability, produce
consistent high strengths, and lower shrinkage (9).
Water-Reducing Admixtures
Water reducing admixtures are used to improve the quality of concrete and to obtain
specified strength at lower cement contents. The basic role of water reducing admixtures is to
deflocculate the cement particles agglomerated together and release the water tied up in these
agglomerations, producing more fluid paste at lower water contents. Normal water reducers
typically reduce the required water content for a concrete mixture by 5 to 10 percent, whereas
high-range water reducers can reduce water content by 12 to 40 percent (3). Based on the
decrease in water needed to reach the desired slump, concrete strengths can be increased by the
addition of water reducers because a lower w/cm can be used while maintaining a consistent
slump.
Quality Control Testing
It has long been accepted that proper quality control testing is needed to produce
consistent, acceptable construction materials test results. This is especially important in concrete
construction. Numerous variables can affect the outcome of compressive strength test results
including; sampling, testing, handling, initial curing, final curing, and compressive strength
6
testing. AASHTO T 22 / ASTM C 39 “Standard Test Method for Compressive Strength of
Cylindrical Concrete Specimens” provides an acceptable range for companion cylinders of 10.6
percent when three 4 in. X 8 in.-cylinders are tested in laboratory conditions. This acceptable
range is only applicable for compressive strengths ranging from 2,500 psi to 4,700 psi and when
specimens are sampled, tested, handled, and cured in accordance with all AASHTO /ASTM test
methods associated with testing concrete cylinders for compressive strength. When any part of
the testing and handling of the specimens breaks down, the measured compressive strength of the
concrete will be influenced. None of the breakdowns that can occur during testing and handling
(aside from possibly initial curing temperatures and loading rate of cylinders during the
compressive strength test) influence the compressive strength in a positive way. Instead, the
effects of improper handling and testing of concrete generally decrease the expected compressive
strength of concrete. The standard deviation obtainable when testing identical specimens under
laboratory conditions is 150 psi (2).
Required Average Compressive Strength
Some overdesign or safety factor is included in mixture proportioning to compensate for
variability in concrete strength as described in the previous paragraphs. This overdesign is
addressed with the use Required Average Compressive Strength (f’cr). MDOT specifications
require concrete mixtures to be designed based on either previous field experience or laboratory
trial mixtures. If results from field experience or laboratory test show that the average
compressive strength determined from either field experience of laboratory trial mixtures equals
or exceeds the required average strength (f’cr), the mixture proportion can then be submitted to
MDOT engineers for approval.
Field Experience
When using field experience, MDOT specifications require that at least 10 consecutive
sets of 28-day compressive strength tests be used to calculate the standard deviation of the
concrete strengths. Provided that the average compressive strength of the field tests is greater
than the specified compressive strength for the given class of concrete plus 1.43 times the
standard deviation, the concrete proportions may be accepted by MDOT engineers.

7
Based on Burns Cooley Dennis’ (BCD) experience on MDOT projects, the standard
deviation for 10 consecutive sets of 28-day compressive strengths used on MDOT projects can
range from as low as 147 psi to 713 psi, with an average of approximately 307 psi. Based on
these standard deviations, the overdesign could range from as little as 210 psi to 1,020 psi over
the specified compressive strength for the given class of concrete.
Laboratory Trial Mixture
When the laboratory trial mixture option is selected for proportioning concrete mixtures,
the required average compressive strength must be 1,200 psi over the specified compressive
strength for classes of concrete requiring less than 5,000 psi and 1,400 psi over the specified
strength for classes of concrete requiring 5,000 psi or more. The average of three compressive
strength specimens tested at 28-days must meet or exceed the required average compressive
strength for the particular class of concrete.
Objective
The objective of this research was to investigate concrete strength variability of gravel
aggregate concrete as influenced by cementitious materials. This research documents concrete
strength variability using different cement sources and different samples of each cement source.
Approach
Eighty-four concrete mixtures were used in this research to investigate the influence of
cement source, sample, and type on compressive strength of concrete. Seven different cements
from six sources were used in this research. One plant produced two types of cement. Each of
the seven cements is noted herein as a unique cement using letters A through G. Samples of the
seven cements were collected on three separate occasions (Sample No. 1, Sample No. 2, and
Sample No. 3) that were at least one month apart. Each of the seven cements was used to
produce twelve mixtures. These mixtures were proportioned with gravel aggregates using 100%
cement, 75% cement with 25% Class C fly ash, and 75% cement with 25% Class F fly ash. Each
of these mixtures was repeated two additional times with additional samples providing a total of
sixty-four mixtures for this research. Crushed limestone coarse aggregate was used in
combinations with these same cementitious materials to provide control mixtures for cement
8
sample No. 1 providing twenty-one control mixtures. Table 1 presents a description of
experimental mixtures. Compressive strengths were determined for each concrete mixture and
compressive strengths of mortar cubes were determined for each cement sample. In addition,
Holcim (US), Inc. conducted chemical and physical analysis of each sample of cement. Blind
samples were sent to Holcim (US), Inc. by BCD in sample containers with the same
identification used in this research so the source was not revealed.

9
Table 1 – Experimental Mixtures
Mix Number
Cement Source
Cement Type
Sample No.
Aggregate Type
Percent Cement
Percent Class C Fly Ash
Percent Class F Fly Ash
1 - 9
A II
1,2,3 Gravel 100 75 25 75 25
10 - 12 1 Stone 100 75 25 75 25
13 - 21
B II
1,2,3 Gravel 100 75 25 75 25
22 - 24 1 Stone 100 75 25 75 25
25 - 33
C I
1,2,3 Gravel 100 75 25 75 25
34 - 36 1 Stone 100 75 25 75 25
37 – 45
D II
1,2,3 Gravel 100 75 25 75 25
46 - 48 1 Stone 100 75 25 75 25
49 - 57
F II
1,2,3 Gravel 100 75 25 75 25
58 - 60 1 Stone 100 75 25 75 25
61 - 69
G II
1,2,3 Gravel 100 75 25 75 25
70 -72 1 Stone 100 75 25 75 25
73 - 81
E 1L
1,2,3 Gravel 100 75 25 75 25
82 - 84 1 Stone 100 75 25 75 25
10
Chapter 2 - Materials
Hydraulic Cement
Both ordinary portland cement (OPC) and blended cement were used in this study. These
are hydraulic cements and provide the primary cementing material in the mixtures. Type I and
Type II portland cements meeting requirements of AASHTO M 85 / ASTM C 150 “Standard
Specification for Portland Cement” and a Type IL cement meeting requirements of AASHTO
240 / ASTM C 595 “Standard Specification for Blended Hydraulic Cements” were used.
Hydraulic cements react with water and produce calcium silicate hydrate and other cementing
compounds that cause concrete to set and gain strength. A byproduct of this reaction is calcium
hydroxide which remains suspended in the concrete matrix and may be available to react with
pozzolans such as Class C or Class F fly ash to create more cementing compounds. Chemical
and physical properties of each cement sample used in this research were tested by Holcim (US),
Inc. and results are presented in Tables 2 through 8.
Type I and Type II
Type I or Type II portland cement meeting requirements of ASTM C 150 / AASHTO M
85 are hydraulic cements made to conform to specific chemical and physical property limits
according to these specifications. One source of Type I cement and five sources of Type II
cement were used in this research.
Type IL
Type IL cement meeting requirements of AASHTO M240 / ASTM C595 was also used
in this study. This blended cement specification now provides for limestone as one of the
permitted blended or interground materials in this cement that was formerly limited to pozzolans,
or slag, or some combinations of these materials. The addition of limestone and Type IL to
AASHTO M240 / ASTM C595 occurred in 2012. Type IL cement can contain from 5 to 15
percent limestone (10). This type of cement is also hydraulic cement and usually performs
similarly to Type I or Type II portland cement. Type IL used in this research is ordinary
portland cement except that the interground limestone content was approximately 10 percent.
While MDOT does not currently included Type IL cement in their specifications for portland

11
cement used in concrete, this cement was included in this research so MDOT engineers can
evaluate it for future use. Only one source of Type IL cement was used in this study.
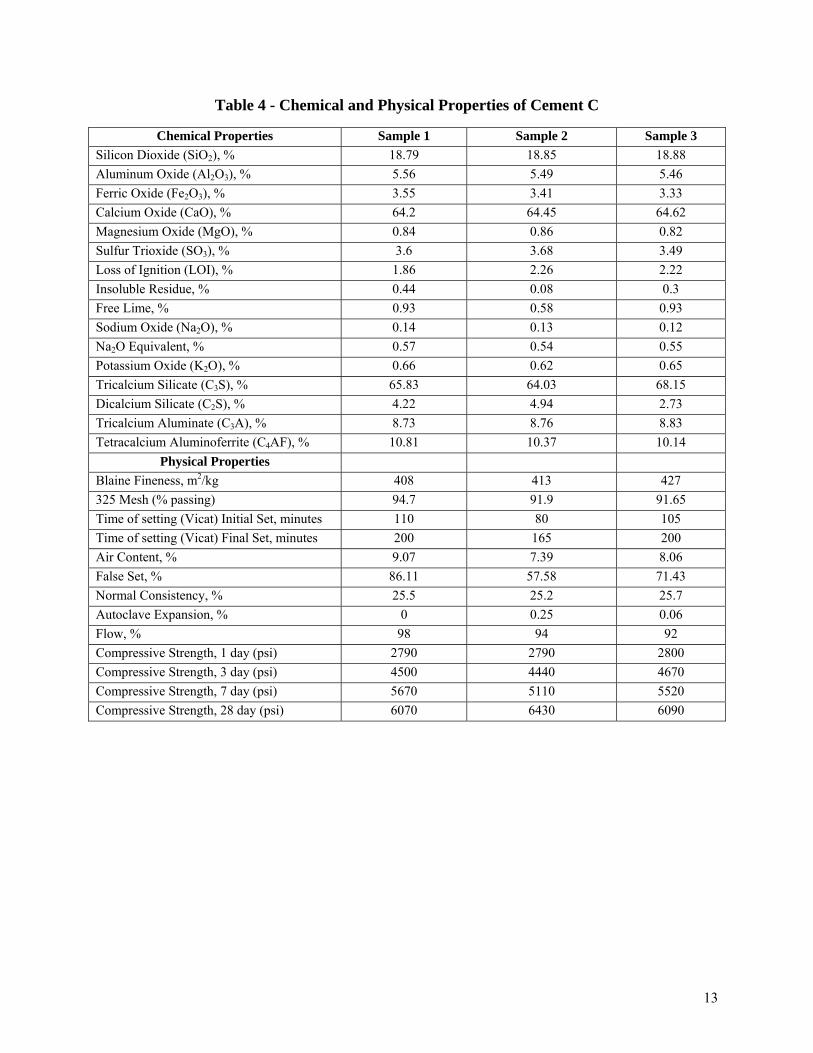
Table 2 - Chemical and Physical Properties of Cement A
Chemical Properties Sample 1 Sample 2 Sample 3 Silicon Dioxide (SiO2), % 19.93 20.32 20.12 Aluminum Oxide (Al2O3), % 4.36 4.4 4.44 Ferric Oxide (Fe2O3), % 2.87 2.9 2.89 Calcium Oxide (CaO), % 64.25 64.18 64 Magnesium Oxide (MgO), % 2.19 2.19 2.2 Sulfur Trioxide (SO3), % 2.84 2.84 2.81 Loss of Ignition (LOI), % 2.1 2.3 2.01 Insoluble Residue, % 0.39 0.26 0.43 Free Lime, % 0.73 0.14 0.15 Sodium Oxide (Na2O), % 0.16 0.15 0.16 Na2O Equivalent, % 0.54 0.54 0.53 Potassium Oxide (K2O), % 0.59 0.58 0.57 Tricalcium Silicate (C3S), % 68.58 60.69 65.66 Dicalcium Silicate (C2S), % 5.42 11.23 8.15 Tricalcium Aluminate (C3A), % 6.69 6.74 6.87 Tetracalcium Aluminoferrite (C4AF), % 8.74 8.81 8.8
Physical Properties Blaine Fineness, m2/kg 388 404 411 325 Mesh (% passing) 94.3 93.4 93.56 Time of setting (Vicat) Initial Set, minutes 155 165 130 Time of setting (Vicat) Final Set, minutes 250 315 230 Air Content, % 9.17 8.4 8.94 False Set, % 28.6 50 60 Normal Consistency, % 25.5 25.5 25.2 Autoclave Expansion, % -0.02 -0.03 -0.02 Flow, % 94 104 104 Compressive Strength, 1 day (psi) 2370 2120 2330 Compressive Strength, 3 day (psi) 4340 4310 4070 Compressive Strength, 7 day (psi) 5140 5570 5050 Compressive Strength, 28 day (psi) 6600 6530 7400

12
Table 3 - Chemical and Physical Properties of Cement B
Chemical Properties Sample 1 Sample 2 Sample 3 Silicon Dioxide (SiO2), % 19.69 19.72 19.66 Aluminum Oxide (Al2O3), % 4.36 4.46 4.4 Ferric Oxide (Fe2O3), % 3.35 3.29 3.28 Calcium Oxide (CaO), % 63.8 63.79 63.73 Magnesium Oxide (MgO), % 2.86 2.98 2.96 Sulfur Trioxide (SO3), % 2.62 2.68 2.68 Loss of Ignition (LOI), % 2.73 2.25 2.95 Insoluble Residue, % 0.4 0.22 0.04 Free Lime, % 0.27 0.18 0.2 Sodium Oxide (Na2O), % 0.15 0.15 0.15 Na2O Equivalent, % 0.53 0.52 0.53 Potassium Oxide (K2O), % 0.58 0.56 0.57 Tricalcium Silicate (C3S), % 68.55 64.72 68.15 Dicalcium Silicate (C2S), % 4.73 6.9 4.94 Tricalcium Aluminate (C3A), % 5.89 6.24 6.11 Tetracalcium Aluminoferrite (C4AF), % 10.19 9.99 9.99
Physical Properties Blaine Fineness, m2/kg 430 382 423 325 Mesh (% passing) 97.1 95.39 95.59 Time of setting (Vicat) Initial Set, minutes 175 137 150 Time of setting (Vicat) Final Set, minutes 260 252 250 Air Content, % 10.4 8.95 9.06 False Set, % 72.2 83.87 71.43 Normal Consistency, % 26.5 25.2 25.2 Autoclave Expansion, % 0.02 0.01 0.01 Flow, % 105 110 116 Compressive Strength, 1 day (psi) 2320 2470 2190 Compressive Strength, 3 day (psi) 3990 4020 3920 Compressive Strength, 7 day (psi) 5010 5090 4910 Compressive Strength, 28 day (psi) 5990 6300 6400
13
Table 4 - Chemical and Physical Properties of Cement C
Chemical Properties Sample 1 Sample 2 Sample 3 Silicon Dioxide (SiO2), % 18.79 18.85 18.88 Aluminum Oxide (Al2O3), % 5.56 5.49 5.46 Ferric Oxide (Fe2O3), % 3.55 3.41 3.33 Calcium Oxide (CaO), % 64.2 64.45 64.62 Magnesium Oxide (MgO), % 0.84 0.86 0.82 Sulfur Trioxide (SO3), % 3.6 3.68 3.49 Loss of Ignition (LOI), % 1.86 2.26 2.22 Insoluble Residue, % 0.44 0.08 0.3 Free Lime, % 0.93 0.58 0.93 Sodium Oxide (Na2O), % 0.14 0.13 0.12 Na2O Equivalent, % 0.57 0.54 0.55 Potassium Oxide (K2O), % 0.66 0.62 0.65 Tricalcium Silicate (C3S), % 65.83 64.03 68.15 Dicalcium Silicate (C2S), % 4.22 4.94 2.73 Tricalcium Aluminate (C3A), % 8.73 8.76 8.83 Tetracalcium Aluminoferrite (C4AF), % 10.81 10.37 10.14
Physical Properties Blaine Fineness, m2/kg 408 413 427 325 Mesh (% passing) 94.7 91.9 91.65 Time of setting (Vicat) Initial Set, minutes 110 80 105 Time of setting (Vicat) Final Set, minutes 200 165 200 Air Content, % 9.07 7.39 8.06 False Set, % 86.11 57.58 71.43 Normal Consistency, % 25.5 25.2 25.7 Autoclave Expansion, % 0 0.25 0.06 Flow, % 98 94 92 Compressive Strength, 1 day (psi) 2790 2790 2800 Compressive Strength, 3 day (psi) 4500 4440 4670 Compressive Strength, 7 day (psi) 5670 5110 5520 Compressive Strength, 28 day (psi) 6070 6430 6090

14
Table 5 - Chemical and Physical Properties of Cement D
Chemical Properties Sample 1 Sample 2 Sample 3 Silicon Dioxide (SiO2), % 19.17 20.1 20.03 Aluminum Oxide (Al2O3), % 4.9 4.61 4.92 Ferric Oxide (Fe2O3), % 3.6 3.32 3.46 Calcium Oxide (CaO), % 64.27 64.2 63.83 Magnesium Oxide (MgO), % 1.17 1.55 1.35 Sulfur Trioxide (SO3), % 3.73 3.64 3.63 Loss of Ignition (LOI), % 1.68 1.26 1.28 Insoluble Residue, % 0.35 0.11 0.02 Free Lime, % 0.51 1.02 0.73 Sodium Oxide (Na2O), % 0.25 0.23 0.21 Na2O Equivalent, % 0.51 0.48 0.49 Potassium Oxide (K2O), % 0.39 0.38 0.43 Tricalcium Silicate (C3S), % 67.21 62.04 59.29 Dicalcium Silicate (C2S), % 4.26 10.68 12.68 Tricalcium Aluminate (C3A), % 6.89 6.6 7.18 Tetracalcium Aluminoferrite (C4AF), % 10.97 10.11 10.53
Physical Properties Blaine Fineness, m2/kg 390 423 429 325 Mesh (% passing) 96.1 97.31 96.45 Time of setting (Vicat) Initial Set, minutes 130 90 100 Time of setting (Vicat) Final Set, minutes 200 165 190 Air Content, % 8.96 6.61 6.5 False Set, % 72.41 67.86 87.5 Normal Consistency, % 26.5 26.8 26.5 Autoclave Expansion, % 0.03 0.03 0 Flow, % 103 112 100 Compressive Strength, 1 day (psi) 2550 2440 2530 Compressive Strength, 3 day (psi) 4480 4400 4080 Compressive Strength, 7 day (psi) 5480 4890 4560 Compressive Strength, 28 day (psi) 6400 6440 6400

15
Table 6 - Chemical and Physical Properties of Cement E
Chemical Properties Sample 1 Sample 2 Sample 3 Silicon Dioxide (SiO2), % 18.59 18.72 18.68 Aluminum Oxide (Al2O3), % 4.34 4.03 4.25 Ferric Oxide (Fe2O3), % 3.19 3.17 3.15 Calcium Oxide (CaO), % 64.63 64.55 64.17 Magnesium Oxide (MgO), % 1.33 1.54 1.5 Sulfur Trioxide (SO3), % 3.06 3.54 3.64 Loss of Ignition (LOI), % 4.72 4.71 4.55 Insoluble Residue, % 1.13 0.37 0.41 Free Lime, % 0.45 0.55 0.44 Sodium Oxide (Na2O), % 0.21 0.21 0.21 Na2O Equivalent, % 0.47 0.45 0.44 Potassium Oxide (K2O), % 0.39 0.36 0.35 Tricalcium Silicate (C3S), % 66.92 68.29 61.44 Dicalcium Silicate (C2S), % 0.31 0 5.07 Tricalcium Aluminate (C3A), % 6.06 5.27 5.93 Tetracalcium Aluminoferrite (C4AF), % 9.65 9.59 9.59
Physical Properties Blaine Fineness, m2/kg 491 518 560 325 Mesh (% passing) 97.6 98.51 98.42 Time of setting (Vicat) Initial Set, minutes 130 125 115 Time of setting (Vicat) Final Set, minutes 215 200 180 Air Content, % 7.44 5.76 5.59 False Set, % 70 81.82 80.65 Normal Consistency, % 27.4 26.8 26.8 Autoclave Expansion, % -0.01 -0.03 NR Flow, % 100 110 100 Compressive Strength, 1 day (psi) 2250 2670 2850 Compressive Strength, 3 day (psi) 4350 4590 4710 Compressive Strength, 7 day (psi) 5000 5270 5390 Compressive Strength, 28 day (psi) 6740 7160 7120

16
Table 7 - Chemical and Physical Properties of Cement F
Chemical Properties Sample 1 Sample 2 Sample 3 Silicon Dioxide (SiO2), % 19.05 19.24 19.57 Aluminum Oxide (Al2O3), % 4.83 4.67 4.45 Ferric Oxide (Fe2O3), % 3.25 3.18 3.42 Calcium Oxide (CaO), % 62.88 63.26 64.03 Magnesium Oxide (MgO), % 3.45 3.35 2.38 Sulfur Trioxide (SO3), % 3.35 3.28 3.16 Loss of Ignition (LOI), % 2.54 2.55 2.52 Insoluble Residue, % 0.35 0.02 0.46 Free Lime, % 0.83 0.53 0.12 Sodium Oxide (Na2O), % 0.1 0.1 0.07 Na2O Equivalent, % 0.41 0.41 0.52 Potassium Oxide (K2O), % 0.48 0.47 0.68 Tricalcium Silicate (C3S), % 64.55 61.52 68.15 Dicalcium Silicate (C2S), % 5.92 7.46 4.7 Tricalcium Aluminate (C3A), % 7.3 6.98 6 Tetracalcium Aluminoferrite (C4AF), % 9.89 9.66 10.4
Physical Properties Blaine Fineness, m2/kg 413 388 409 325 Mesh (% passing) 96.7 96.79 96.25 Time of setting (Vicat) Initial Set, minutes 110 110 100 Time of setting (Vicat) Final Set, minutes 210 180 170 Air Content, % 7.5 6.96 8.39 False Set, % 90.32 91.43 84.38 Normal Consistency, % 26.5 26.5 25.8 Autoclave Expansion, % 0.07 0.06 0.05 Flow, % 101 104 112 Compressive Strength, 1 day (psi) 2280 2370 2300 Compressive Strength, 3 day (psi) 3720 3890 3750 Compressive Strength, 7 day (psi) 5390 4820 4700 Compressive Strength, 28 day (psi) 6430 5940 6460

17
Table 8 - Chemical and Physical Properties of Cement G
Chemical Properties Sample 1 Sample 2 Sample 3 Silicon Dioxide (SiO2), % 19.57 20.05 19.33 Aluminum Oxide (Al2O3), % 4.33 4.24 4.63 Ferric Oxide (Fe2O3), % 3.81 3.6 3.13 Calcium Oxide (CaO), % 63.56 63.69 63.1 Magnesium Oxide (MgO), % 2.59 2.8 3.31 Sulfur Trioxide (SO3), % 3.05 3.1 3.29 Loss of Ignition (LOI), % 1.84 1.59 2.05 Insoluble Residue, % 0.29 0.09 0.39 Free Lime, % 0.14 0.17 0.57 Sodium Oxide (Na2O), % 0.07 0.08 0.07 Na2O Equivalent, % 0.52 0.56 0.38 Potassium Oxide (K2O), % 0.68 0.73 0.47 Tricalcium Silicate (C3S), % 66.78 62.22 65.01 Dicalcium Silicate (C2S), % 5.72 9.91 6.37 Tricalcium Aluminate (C3A), % 5.03 5.14 6.97 Tetracalcium Aluminoferrite (C4AF), % 11.59 10.95 9.53
Physical Properties Blaine Fineness, m2/kg 406 394 441 325 Mesh (% passing) 96.8 95.24 97.32 Time of setting (Vicat) Initial Set, minutes 190 155 115 Time of setting (Vicat) Final Set, minutes 250 245 190 Air Content, % 8.28 7.51 7.39 False Set, % 86.21 95.24 86.11 Normal Consistency, % 26.6 25.8 25.8 Autoclave Expansion, % 0.03 0.03 0.02 Flow, % 111 113 120 Compressive Strength, 1 day (psi) 2030 2050 2450 Compressive Strength, 3 day (psi) 3840 4000 4300 Compressive Strength, 7 day (psi) 4630 4610 4920 Compressive Strength, 28 day (psi) 5730 5550 6020

18
Supplementary Cementitious Materials (SCMs)
Supplementary Cementitious Materials (SCMs) are included in concrete mixtures as part
of the overall cementitious system. Most concrete produced in Mississippi incorporates SCMs in
the mixture, particularly Class C and Class F fly ash. SCMs are often added to concrete in order
to improve some plastic or hardened properties of the concrete. SCMs included in this research
are from a single sample of Class C fly ash and Class F fly ash. SCMs have both hydraulic and
pozzolanic value in concrete. Pozzolans are materials that have little cementing value by
themselves, but will react with calcium hydroxide to provide more cementing compounds.
Fly Ash
Fly ash is finely divided residue of burned ground coal, captured from the flue gases of a
coal combustion device, usually at a coal-burning electric power plant. The combustion
byproduct is usually harvested with electrostatic precipitators, conveyed to storage and shipping,
and is commonly used as a cementitious component of concrete without further processing.
However, some fly ash is enhanced by separation of particle sizes and chemical treatment of
carbon residue in the ash. Class C and Class F fly ash conform to the provisions of AASHTO M
295 / ASTM C 618 “Standard Specification for Coal Fly Ash and Calcined Natural Pozzolan for
Use in Concrete.” The distinction between the two classes is usually related to the type of coal
burned in production of the ash. Class C fly ash can contain a total calcium content (expressed
as CaO) higher than 10 percent, but MDOT specifications require a CaO content of Class C fly
ash greater than or equal to 8.0 percent. MDOT specifications require a CaO content of less than
or equal to 8.0 percent for Class F fly ash. Both classes of fly ash are predominately pozzolanic.
Functionally, a Class F fly ash is typically more nearly pure pozzolan than a Class C fly ash. A
Class C fly ash may have slight hydraulic cementitious reactivity and other reactive chemical
components. It is possible for a fly ash source to conform to both Class C and Class F fly ash
designations; however, MDOT requires that fly ash be classified as either Class C or Class F.
MDOT concrete specifications allow Class C and Class F fly ash to be used to replace up to 25
percent of the portland cement for all classes of concrete. Chemical and physical properties of
the Class C and Class F fly ash used in this research were provided by the supplier and are
presented in Table 9 and 10, respectively.

19
Table 9: Class C Fly Ash - Chemical and Physical Properties
Chemical Properties Results Silicon Dioxide (SiO2), % 35.76 Aluminum Oxide (Al2O3), % 19.18 Iron Oxide (Fe2O3), % 6.39 Sum of Constituents, % 61.33 Sulfur Trioxide (SO3), % 2.09 Calcium Oxide (CaO), % 24.35 Moisture Content, % 0.07 Loss on Ignition, % 0.40 Available Alkalies, as Na2O, % 1.4
Physical Properties Results Fineness, % retained on No. 325 18.87 Strength Activity Index 7 day, % of control 100.0 Strength Activity Index 28 day, % of control 97.0 Water Requirement, % control 95.0 Autoclave Soundness, % 0.05 True Particle Density 2.60
Table 10: Class F Fly Ash - Chemical and Physical Properties
Chemical Properties Results Total Silica, Aluminum, Iron, % 89.2 Silicon Dioxide (SiO2), % 54.1 Aluminum Oxide (Al2O3), % 27.7 Iron Oxide (Fe2O3), % 7.6 Sulfur Trioxide (SO3), % 0.1 Calcium Oxide (CaO), % 1.4 Moisture Content, % 0.1 Loss on Ignition, % 2.9 Available Alkalies, as Na2O, % 0.7 Sodium Oxide, % 0.15 Potassium Oxide, % 0.80
Physical Properties Results Fineness, % retained on No. 325 18.0 Strength Activity Index 7 day, % of control 76.6 Strength Activity Index 28 day, % of control 86.6 Water Requirement, % control 96.3 Autoclave Soundness -0.05 Drying Shrinkage, Increase at 28 day, % 0.00 Density Mg/m3 2.20
20
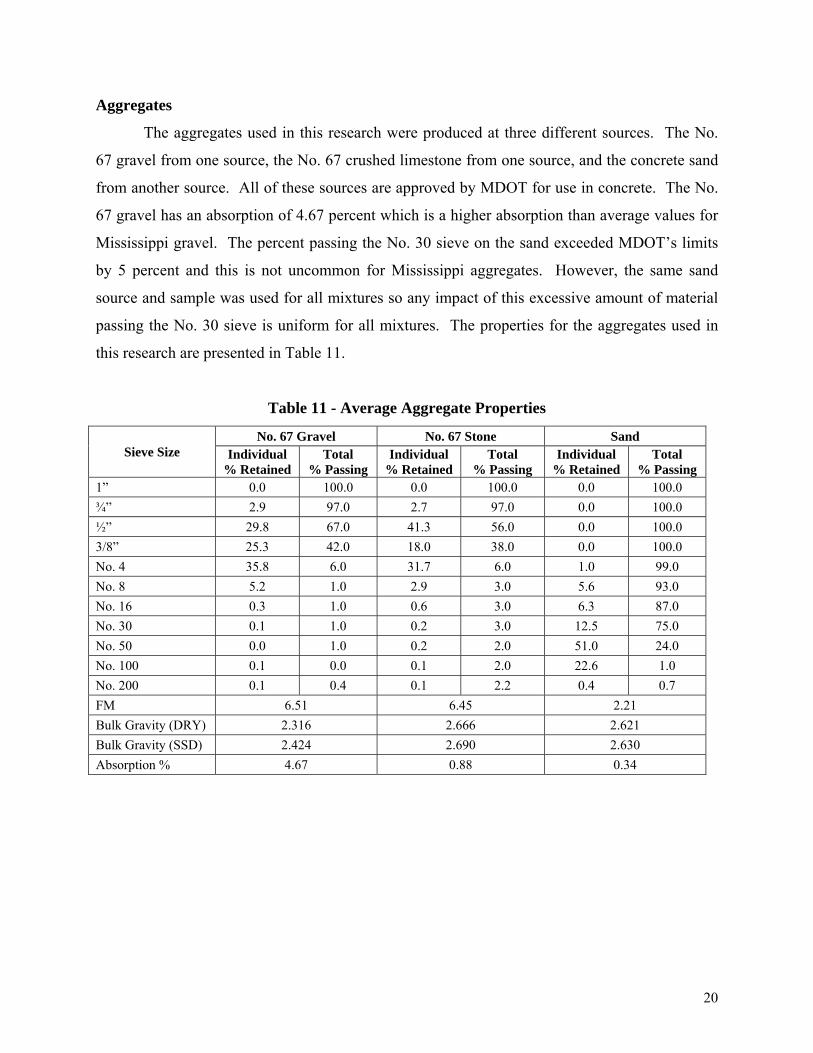
Aggregates
The aggregates used in this research were produced at three different sources. The No.
67 gravel from one source, the No. 67 crushed limestone from one source, and the concrete sand
from another source. All of these sources are approved by MDOT for use in concrete. The No.
67 gravel has an absorption of 4.67 percent which is a higher absorption than average values for
Mississippi gravel. The percent passing the No. 30 sieve on the sand exceeded MDOT’s limits
by 5 percent and this is not uncommon for Mississippi aggregates. However, the same sand
source and sample was used for all mixtures so any impact of this excessive amount of material
passing the No. 30 sieve is uniform for all mixtures. The properties for the aggregates used in
this research are presented in Table 11.
Table 11 - Average Aggregate Properties
Sieve Size No. 67 Gravel No. 67 Stone Sand
Individual % Retained
Total % Passing
Individual % Retained
Total % Passing
Individual % Retained
Total % Passing
1” 0.0 100.0 0.0 100.0 0.0 100.0 ¾” 2.9 97.0 2.7 97.0 0.0 100.0 ½” 29.8 67.0 41.3 56.0 0.0 100.0 3/8” 25.3 42.0 18.0 38.0 0.0 100.0 No. 4 35.8 6.0 31.7 6.0 1.0 99.0 No. 8 5.2 1.0 2.9 3.0 5.6 93.0 No. 16 0.3 1.0 0.6 3.0 6.3 87.0 No. 30 0.1 1.0 0.2 3.0 12.5 75.0 No. 50 0.0 1.0 0.2 2.0 51.0 24.0 No. 100 0.1 0.0 0.1 2.0 22.6 1.0 No. 200 0.1 0.4 0.1 2.2 0.4 0.7 FM 6.51 6.45 2.21 Bulk Gravity (DRY) 2.316 2.666 2.621 Bulk Gravity (SSD) 2.424 2.690 2.630 Absorption % 4.67 0.88 0.34
21
Water Reducer
A type A water-reducing admixture meeting requirements of AASHTO M 194 / ASTM C
494 “Standard Specifications for Chemical Admixtures for Concrete” was used in each of the
concrete mixtures in this research. Water reducers can be used to provide a higher slump
without increasing the water-cementitious ratio or lower water-cementitious ratio without
reducing slump. In addition, higher strengths can be achieved due to increased dispersion of the
cementitious particles leading to increased hydration. The dosage rate for all mixtures is 3.05
ounces per 100 pounds of cementitious materials in the mixture, i.e., 16.1 ounces per cubic yard
of concrete. No other chemical admixture was used in this research.

22
Chapter 3 – Concrete Mixtures
Mixture Development
The influence of cement source, supplemental cementitious materials, and aggregate type
on concrete compressive strength variability is described herein based on laboratory test results
and experience gained during production of eighty-four laboratory mixtures. The mixture
proportions used in this research were based on initial trial batches. These trial batches, using
100% cement and one cement source, established the required total cementitious materials,
water, and admixture dosage required to produce a 3 in. slump using oven dry aggregates. Trial
and error batches were conducted until the water and cement content were determined to meet
this criteria. The weight of cement determined from the trail batches was 526.40 pounds per
cubic yard (pcy) with a corresponding weight of water of 236.88 pcy, i.e., 28.4 gallons pcy. This
cement and water content provided a w/cm ratio of 0.450 that was used for all of the mixes in
this research. The dosage rate selected for the Type A water reducer was 3.05 ounces per 100
pounds of cementitious material. This total cement, water content, and admixture dosage was
then used for all mixtures of this research with no subsequent requirement for slump,
temperature, air content, or unit weight.
Coarse Aggregate Content
The weight of coarse aggregate was calculated based on MDOT’s requirement for
minimum coarse aggregate content for concrete paving. Section 501 “Portland Cement Concrete
Pavement” of the MDOT’s Specifications for Road and Bridge Construction requires a minimum
coarse aggregate content of 72 percent of the volume of a cubic yard of concrete. The minimum
dry weight of coarse aggregate per cubic yard (pcy) of concrete is then calculated using Equation
1.
DRUWxxWCA 2772.0= (1)
Where:
WCA = Weight of Coarse Aggregate
DRUW = Dry Rodded Unit Weight

23
Typical Mixtures
The average dry rodded unit weight of the No. 67 gravel used in this study was 92 pounds
per cubic foot (pcf). Using this weight in Equation 1 gives a dry coarse aggregate weight of
1790 pounds. This coarse aggregate weight was used for all gravel aggregate mixtures. The
absolute volume of cement, water, coarse aggregate, and entrapped air was then calculated and
subtracted from a total of 27 cubic feet to determine the volume of sand needed for proper yield.
See Table 12 for typical mixture proportions using 100% cement (100) along with gravel
aggregates.
This typical mixture was then adjusted to incorporate Class C or Class F fly ash. The
526.4 pounds of cement was replaced pound for pound with Class C or Class F fly ash at a
replacement rate of 25 percent. This provided additional typical mixtures with 394.80 pcy of
cement and 131.60 pcy of either Class C or Class F fly ash. See Tables 13 and 14 for typical
mixture proportions using gravel aggregate along with 75% cement and 25% Class C fly ash
(75/25C) and 75% cement and 25% Class F fly ash (75/25F), respectively.
Typical mixtures described in the previous paragraphs were adjusted for use with crushed
limestone coarse aggregate. In order to make these adjustments, the same absolute volume of
coarse aggregate that was used in the typically gravel aggregate mixtures was maintained for the
crushed limestone mixtures. This absolute volume was 12.39 cubic feet. The weight of crushed
limestone needed for 12.39 cubic feet was 2061 pounds. See Tables 15 through 17 for typically
mixtures proportions using crushed limestone coarse aggregate.
These typical mixture proportions were then used in combination with all seven cements.
The only exception was Cement E. Cement E was Type IL cement and its specific gravity was
3.10 in lieu of 3.15 that was used in volume calculations for all other cements. Therefore,
adjustments were made to the sand weight for mixes 73 through 84 to compensate for the
additional volume provided by the Type IL cement.

24
Table 12 – Typical Mixture Proportions: Gravel Aggregates – (100)
Material Dry Weights (pcy) Absolute Volume (ft3) Cement 526.40 2.68
Total Cementitious 526.40 2.68 Coarse Aggregate 1790 12.39 Fine Aggregate 1265 7.73
Water 236.88 3.80 Entrapped Air 0 0.41
w/cm 0.45
Table 13 – Typical Mixture Proportions: Gravel Aggregates – (75/25C)
Material Dry Weights (pcy) Absolute Volume (ft3) Cement 394.80 2.01
Class C Fly Ash 131.60 0.81 Total Cementitious 526.40 2.82 Coarse Aggregate 1790 12.39 Fine Aggregate 1242 7.59
Water 236.88 3.80 Entrapped Air 0 0.41
w/cm 0.45
Table 14 – Typical Mixture Proportions: Gravel Aggregates – (75/25F)
Material Dry Weights (pcy) Absolute Volume (ft3) Cement 394.80 2.01
Class F Fly Ash 131.60 0.96 Total Cementitious 526.40 2.97 Coarse Aggregate 1790 12.39 Fine Aggregate 1218 7.45
Water 236.88 3.80 Entrapped Air 0 0.41
w/cm 0.45
Table 15 – Typical Mixture Proportions: Crushed Limestone Aggregates – (100)
Material Dry Weights Per Cubic Yard (lbs.) Absolute Volume (ft3) Cement 526.40 2.68
Total Cementitious 526.40 2.68 Coarse Aggregate 2061 12.39 Fine Aggregate 1265 7.73
Water 236.88 3.80 Entrapped Air 0 0.41
w/cm 0.45

25
Table 16 – Typical Mixture Proportions: Crushed Limestone Aggregates – (75/25C)
Material Dry Weights (pcy) Absolute Volume (ft3) Cement 394.80 2.01
Class C Fly Ash 131.60 0.81 Total Cementitious 526.40 2.82 Coarse Aggregate 2061 12.39 Fine Aggregate 1242 7.59
Water 236.88 3.80 Entrapped Air 0 0.41
w/cm 0.45
Table 17 – Typical Mixture Proportions: Crushed Limestone Aggregates – (75/25F)
Material Dry Weights (pcy) Absolute Volume (ft3) Cement 394.80 2.01
Class F Fly Ash 131.60 0.96 Total Cementitious 526.40 2.97 Coarse Aggregate 2061 12.39 Fine Aggregate 1217 7.44
Water 236.88 3.80 Entrapped Air 0 0.41
w/cm 0.45
Mix Designations
Two designations were assigned to each mixture include; 1) mixture number and 2)
mixture name. Mixes were numbered in sequential order 1 through 84 and this number was used
for laboratory documentation and to identify cylinders for specific mixes. A mixture name was
also given to each mix to easily identify important information that was specific for each
mixture. For example, Mix 2 has a mix name of Gravel A1 75/25C. The first word identifies the
type of coarse aggregate used in the mixture, either gravel or crushed limestone. The next letter
identifies the cement and in this example the cement is Cement A. The number following the
cement number represents the sample number of the cement. The next number is the percent
cement followed by the percent fly ash. The last letter is the type of fly ash used in the mixture.
In addition, all cement samples were given a unique number to identify the cement. For example,
CS-A-1 represents Cement A and sample 1. See Table 18 for a detailed description of each
mixture.
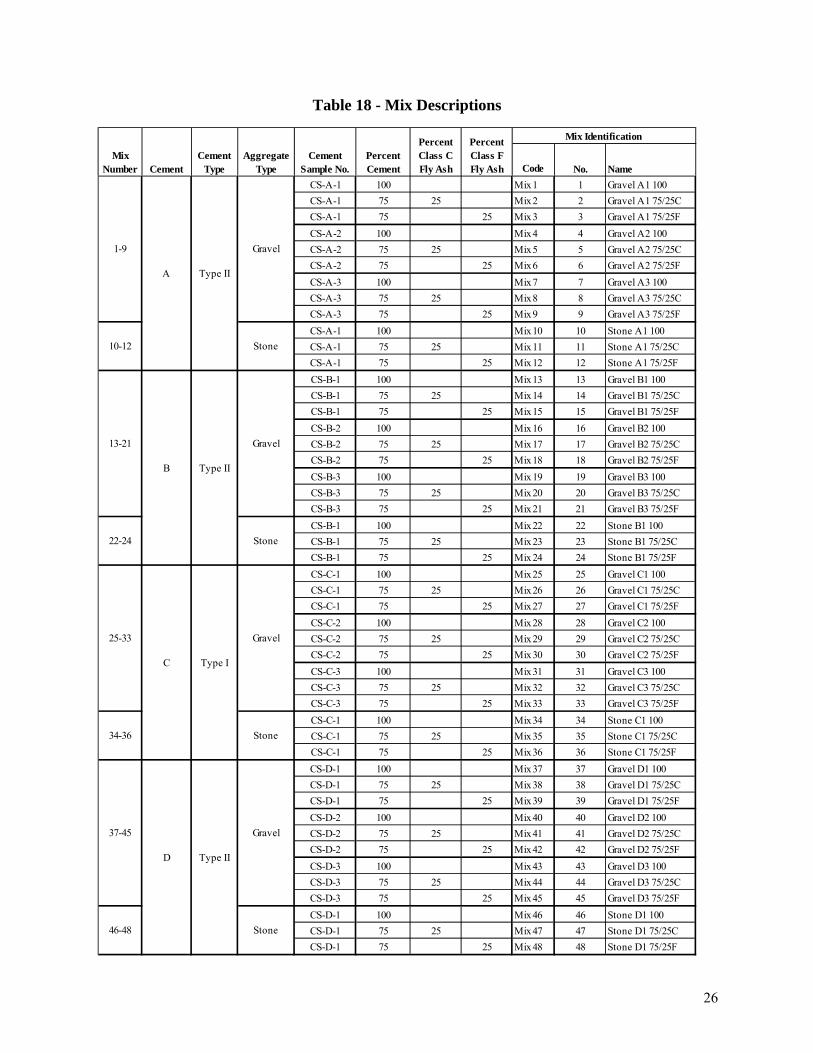
26
Table 18 - Mix Descriptions
Code No. NameCS-A-1 100 Mix 1 1 Gravel A1 100CS-A-1 75 25 Mix 2 2 Gravel A1 75/25CCS-A-1 75 25 Mix 3 3 Gravel A1 75/25FCS-A-2 100 Mix 4 4 Gravel A2 100CS-A-2 75 25 Mix 5 5 Gravel A2 75/25CCS-A-2 75 25 Mix 6 6 Gravel A2 75/25FCS-A-3 100 Mix 7 7 Gravel A3 100CS-A-3 75 25 Mix 8 8 Gravel A3 75/25CCS-A-3 75 25 Mix 9 9 Gravel A3 75/25FCS-A-1 100 Mix 10 10 Stone A1 100CS-A-1 75 25 Mix 11 11 Stone A1 75/25CCS-A-1 75 25 Mix 12 12 Stone A1 75/25FCS-B-1 100 Mix 13 13 Gravel B1 100CS-B-1 75 25 Mix 14 14 Gravel B1 75/25CCS-B-1 75 25 Mix 15 15 Gravel B1 75/25FCS-B-2 100 Mix 16 16 Gravel B2 100CS-B-2 75 25 Mix 17 17 Gravel B2 75/25CCS-B-2 75 25 Mix 18 18 Gravel B2 75/25FCS-B-3 100 Mix 19 19 Gravel B3 100CS-B-3 75 25 Mix 20 20 Gravel B3 75/25CCS-B-3 75 25 Mix 21 21 Gravel B3 75/25FCS-B-1 100 Mix 22 22 Stone B1 100CS-B-1 75 25 Mix 23 23 Stone B1 75/25CCS-B-1 75 25 Mix 24 24 Stone B1 75/25FCS-C-1 100 Mix 25 25 Gravel C1 100CS-C-1 75 25 Mix 26 26 Gravel C1 75/25CCS-C-1 75 25 Mix 27 27 Gravel C1 75/25FCS-C-2 100 Mix 28 28 Gravel C2 100CS-C-2 75 25 Mix 29 29 Gravel C2 75/25CCS-C-2 75 25 Mix 30 30 Gravel C2 75/25FCS-C-3 100 Mix 31 31 Gravel C3 100CS-C-3 75 25 Mix 32 32 Gravel C3 75/25CCS-C-3 75 25 Mix 33 33 Gravel C3 75/25FCS-C-1 100 Mix 34 34 Stone C1 100CS-C-1 75 25 Mix 35 35 Stone C1 75/25CCS-C-1 75 25 Mix 36 36 Stone C1 75/25FCS-D-1 100 Mix 37 37 Gravel D1 100CS-D-1 75 25 Mix 38 38 Gravel D1 75/25CCS-D-1 75 25 Mix 39 39 Gravel D1 75/25FCS-D-2 100 Mix 40 40 Gravel D2 100CS-D-2 75 25 Mix 41 41 Gravel D2 75/25CCS-D-2 75 25 Mix 42 42 Gravel D2 75/25FCS-D-3 100 Mix 43 43 Gravel D3 100CS-D-3 75 25 Mix 44 44 Gravel D3 75/25CCS-D-3 75 25 Mix 45 45 Gravel D3 75/25FCS-D-1 100 Mix 46 46 Stone D1 100CS-D-1 75 25 Mix 47 47 Stone D1 75/25CCS-D-1 75 25 Mix 48 48 Stone D1 75/25F
Mix IdentificationPercent Class F Fly Ash
1-9
10-12
Mix Number Cement
Cement Type
Aggregate Type
Cement Sample No.
25-33
Percent Cement
Percent Class C Fly Ash
Stone
Gravel
Stone
Gravel
Stone
Gravel
Stone
Gravel
A
B
C
D
34-36
37-45
46-48
13-21
22-24
Type II
Type II
Type I
Type II
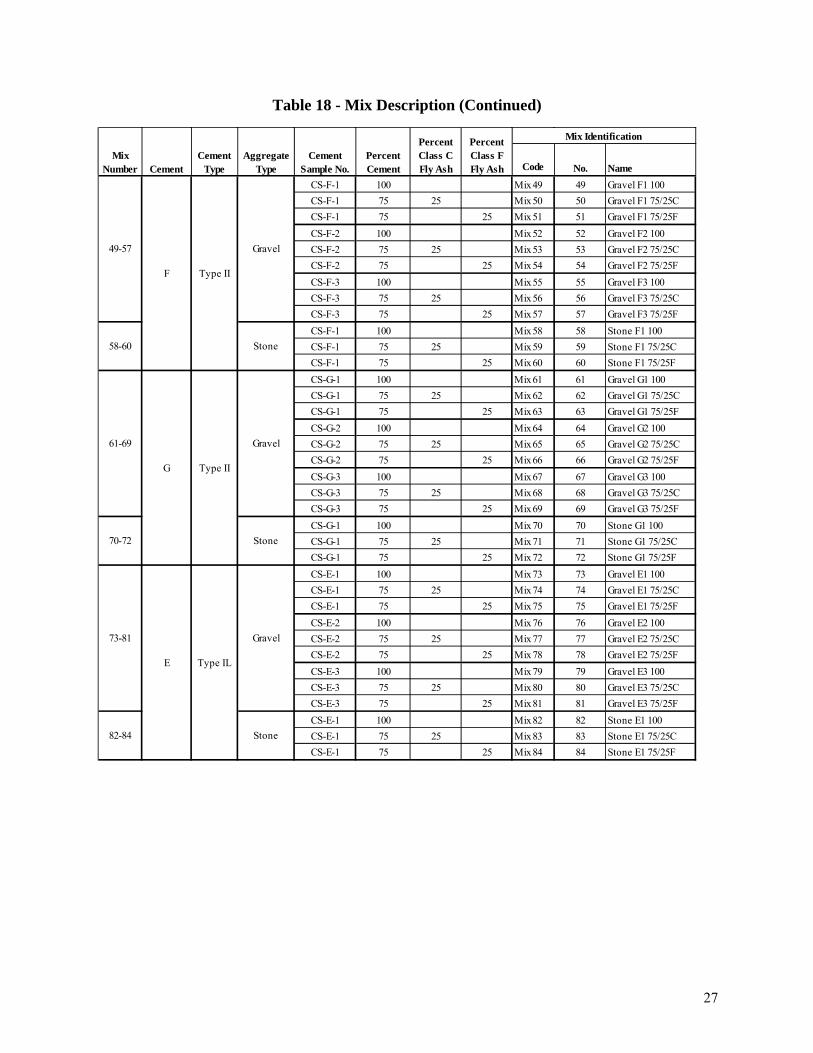
27
Table 18 - Mix Description (Continued)
Code No. NameCS-F-1 100 Mix 49 49 Gravel F1 100CS-F-1 75 25 Mix 50 50 Gravel F1 75/25CCS-F-1 75 25 Mix 51 51 Gravel F1 75/25FCS-F-2 100 Mix 52 52 Gravel F2 100CS-F-2 75 25 Mix 53 53 Gravel F2 75/25CCS-F-2 75 25 Mix 54 54 Gravel F2 75/25FCS-F-3 100 Mix 55 55 Gravel F3 100CS-F-3 75 25 Mix 56 56 Gravel F3 75/25CCS-F-3 75 25 Mix 57 57 Gravel F3 75/25FCS-F-1 100 Mix 58 58 Stone F1 100CS-F-1 75 25 Mix 59 59 Stone F1 75/25CCS-F-1 75 25 Mix 60 60 Stone F1 75/25FCS-G-1 100 Mix 61 61 Gravel G1 100CS-G-1 75 25 Mix 62 62 Gravel G1 75/25CCS-G-1 75 25 Mix 63 63 Gravel G1 75/25FCS-G-2 100 Mix 64 64 Gravel G2 100CS-G-2 75 25 Mix 65 65 Gravel G2 75/25CCS-G-2 75 25 Mix 66 66 Gravel G2 75/25FCS-G-3 100 Mix 67 67 Gravel G3 100CS-G-3 75 25 Mix 68 68 Gravel G3 75/25CCS-G-3 75 25 Mix 69 69 Gravel G3 75/25FCS-G-1 100 Mix 70 70 Stone G1 100CS-G-1 75 25 Mix 71 71 Stone G1 75/25CCS-G-1 75 25 Mix 72 72 Stone G1 75/25FCS-E-1 100 Mix 73 73 Gravel E1 100CS-E-1 75 25 Mix 74 74 Gravel E1 75/25CCS-E-1 75 25 Mix 75 75 Gravel E1 75/25FCS-E-2 100 Mix 76 76 Gravel E2 100CS-E-2 75 25 Mix 77 77 Gravel E2 75/25CCS-E-2 75 25 Mix 78 78 Gravel E2 75/25FCS-E-3 100 Mix 79 79 Gravel E3 100CS-E-3 75 25 Mix 80 80 Gravel E3 75/25CCS-E-3 75 25 Mix 81 81 Gravel E3 75/25FCS-E-1 100 Mix 82 82 Stone E1 100CS-E-1 75 25 Mix 83 83 Stone E1 75/25CCS-E-1 75 25 Mix 84 84 Stone E1 75/25F
Mix Identification
Aggregate Type
Cement Sample No.
Percent Cement
Percent Class C Fly Ash
Percent Class F Fly Ash
61-69
70-72
Gravel
Mix Number Cement
73-81
82-84
F
G
E
49-57
58-60
Type IL
Type II
Type II
Cement Type
Stone
Gravel
Stone
Gravel
Stone
28
Chapter 4 - Laboratory Testing Aggregate Testing
Typical aggregate testing was conducted on the aggregate samples for use in the concrete
mixtures. These tests include; (1) AASHTO T 85 / ASTM C 127 “Specific Gravity and
Absorption of Coarse Aggregate”, (2) AASHTO T 84 / ASTM C 128 “Specific Gravity and
Absorption of Fine Aggregate”, (3) AASHTO T 27 / ASTM C 136 “Sieve Analysis of Fine and
Coarse Aggregates”, and (4) AASHTO T 19 / ASTM C 29 “Bulk Density (“Unit Weight”) and
Voids in Aggregate.”
Concrete Mixing
Laboratory mixing was conducted in 1.25 cubic feet batch quantities using a revolving
drum mixer in accordance with ASTM C 192 “Standard Practice for Making and Curing
Concrete Test Specimens in the Laboratory.” Dry specific gravity and absorption values were
used to adjust laboratory mixture designs based on aggregates in an oven-dry condition.
In accordance with ASTM C 192, the inside of the revolving-drum mixer received a thin
layer of fresh mortar to prevent loss of mortar from the concrete batch. To add consistency to
our process, a masonry brush was used to spread the fresh layer of mortar uniformly around the
drum. The drum was inverted for a two minute waiting period to allow any free water to fall out
before continuing. The mixer was then charged with the coarse and fine oven-dry aggregates
along with approximately half of the mixing water. After minimal revolutions of the drum to
mix up the aggregates and water, the mixer was stopped and covered to guard against moisture
loss. A two minute rest period was introduced to our procedure to accommodate some degree of
water absorption by the oven-dry aggregates. After this two minute rest, the remaining materials
were added to a mixer. A three minute mixing, three minute rest, two minute final mixing
pattern was performed taking steps to guard against moisture loss during the rest period and
segregation when discharging to a wheel barrow.

29
Concrete Plastic Properties
The fresh concrete was tested for density, slump, air content, and temperature. Fresh
properties were recorded for each mixture. All testing was performed using ACI Certified
Technicians according to the following applicable standards:
• Density and Yield – AASHTO T 121 / ASTM C 138 “Standard Test Method for Density
(Unit Weight), Yield, and Air Content (Gravimetric) of Concrete” (Figure 1)
• Slump – AASHTO T 119 / ASTM C 143 “Standard Test Method for Slump of
Hydraulic-Cement Concrete” (Figure 2)
• Air Content – AASHTO T 196 / ASTM C 173 “Standard Test Method for Air Content
of Freshly Mixed Concrete by the Volumetric Method” (Figure 3)
• Temperature – ASTM C 1064 “ Standard Test Method For Temperature of Freshly
Mixed Hydraulic-Cement Concrete”
Figure 1 - Unit Weight Testing

30
Figure 2 - Slump Testing
Figure 3 - Air Content Testing
31
Making, Capping, and Testing Concrete Compressive Strength Specimens
A total of fifteen 4 in. X 8 in. compressive strength specimens were cast immediately
following testing of plastic properties. ACI certified technicians made the 4 in. X 8 in.
specimens using a vibrating table for consolidation. The same vibrating table was used to
consolidate all compressive strength specimens. The specimens were consolidated in two lifts
using amplitude on the vibrating element of 15 percent and duration of 20 seconds. Upon
completion of consolidation and strike-off finishing of the top surfaces, specimens were stored in
a temperature controlled moisture room until time of testing. The only time the specimens were
not in the moisture room was during capping operations.
All compressive strength specimens were capped in accordance with AASHTO T 231 /
ASTM C 617 “Standard Practice for Capping Cylindrical Concrete Specimens” with sulfur
mortar. Bonded capping was used in order to reduce variability in testing that may be introduced
with vertical alignment of the specimen with the center of thrust of the testing machine
associated with unbounded caps.
Specimens were tested by ACI certified strength technicians in accordance with
AASHTO T 22 / ASTM C 39 “Standard Test method for Compressive Strength of Cylindrical
Concrete Specimens.” Fifteen specimens were tested for each mixture as follows: 3 at 1 day, 3
at 7 days, 3 at 14 days, 3 at 28 days, and 3 at 56 days.
Mortar Cube Mixing
The mixture proportion for mortar cubes made with Type I or Type II cement is found in
Table 2 of AASHTO T 106 / ASTM C 109 “Standard Method of Test for Compressive Strength
of Hydraulic Cement Mortar.” According to these standards, water content for mortar cubes
made with other cements such as Type IL cement has to be adjusted for the mixture to produce a
flow of 110 ± 5 in 25 drops of the flow table shown in Figure 4. The amount of water needed for
the mortar cube mixes for Type IL cement used in this study was 375 ml. The water cement
ratio of the mortar cube mixtures for Type I and Type II cements used in the study was 0.458 and
the water cement ratio for the Type IL cement was 0.507. Mixture proportions for the mortar
cube mixtures are presented in Table 19.
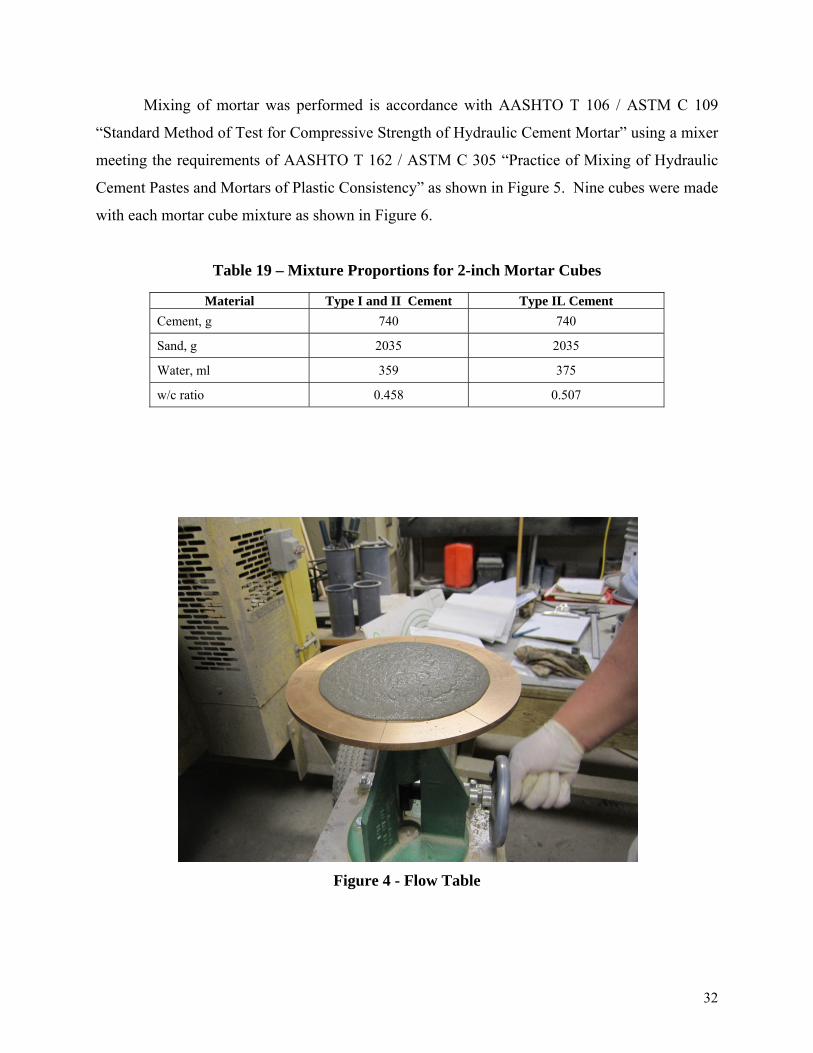
32
Mixing of mortar was performed is accordance with AASHTO T 106 / ASTM C 109
“Standard Method of Test for Compressive Strength of Hydraulic Cement Mortar” using a mixer
meeting the requirements of AASHTO T 162 / ASTM C 305 “Practice of Mixing of Hydraulic
Cement Pastes and Mortars of Plastic Consistency” as shown in Figure 5. Nine cubes were made
with each mortar cube mixture as shown in Figure 6.
Table 19 – Mixture Proportions for 2-inch Mortar Cubes
Material Type I and II Cement Type IL Cement Cement, g 740 740
Sand, g 2035 2035
Water, ml 359 375
w/c ratio 0.458 0.507
Figure 4 - Flow Table

33
Figure 5 - Mechanical Mortar Mixer
Figure 6 - Mortar Cubes

34
Compressive Strength of Hydraulic Cement Mortar
Compressive strength of hydraulic cement mortar was performed on 2 in. cube specimens
in accordance with AASHTO T 106 / ASTM C 109 “Standard Method of Test for Compressive
Strength of Hydraulic Cement Mortar.” Nine specimens were tested for each sample of cement
as follows: 2 at 1 day, 2 at 3 days, 3 at 7 days, and 2 at 28 days.
Chemical and Physical Testing of Cement Samples
Samples of cement were provided directly to BCD to be tested and used in the research
mixtures. BCD technicians provided a blind sample of each cement sample to Holcim (US), Inc.
for chemical and physical testing.

35
Chapter 5 – Results Concrete Plastic Properties
Plastic properties of each concrete mixture are presented in Tables 20 through 25.
Multiple tables were used to present results in order to divide these data into categories
containing similar mixtures.
The two major categories of mixtures are based on the coarse aggregate type, gravel or
crushed limestone. Test results from the gravel mixtures are presented in Tables 20 through 22.
Tables 23 through 25 present fresh properties for mixtures made with crushed limestone coarse
aggregate.
Additionally, test results are separated by type of cementitious materials. Tables 20 and
23 present mixes with 100% cement (100), Tables 21 and 24 present mixes with 25% Class C fly
ash (75/25C) and Tables 22 and 25 contain mixtures with 25% Class F fly ash (75/25F). Mixes
are sorted by cement and sample of cement in order to group results in alpha and numerical order
of cement, not mix number.

36
Table 20 - Plastic Properties: Gravel Aggregate, (100)
Mix No. Cement Sample Slump (in.) Air (%) Temp (ºF) Unit Weight
(lbs/ft3)
Mix 1 CS-A-1 2.50 3.50 70.2 141.9
Mix 4 CS-A-2 5.50 3.25 71.1 141.9
Mix 7 CS-A-3 2.75 3.75 71.0 141.6
Mix 13 CS-B-1 5.25 4.00 64.8 140.7
Mix 16 CS-B-2 4.50 4.00 70.2 141.5
Mix 19 CS-B-3 5.50 4.75 68.7 140.6
Mix 25 CS-C-1 3.00 3.75 70.8 141.6
Mix 28 CS-C-2 3.50 3.00 75.7 141.8
Mix 31 CS-C-3 3.00 3.50 74.8 141.4
Mix 37 CS-D-1 3.00 2.75 75.6 142.4
Mix 40 CS-D-2 3.50 3.00 73.4 142.1
Mix 43 CS-D-3 2.75 3.50 70.7 142.4
Mix 73 CS-E-1 3.25 3.75 70.1 141.6
Mix 76 CS-E-2 3.00 3.00 69.3 142.3
Mix 79 CS-E-3 2.75 2.75 73.3 143.2
Mix 49 CS-F-1 3.00 3.50 66.8 142.0
Mix 52 CS-F-2 3.25 3.50 69.8 142.1
Mix 55 CS-F-3 3.00 3.50 69.6 141.7
Mix 61 CS-G-1 4.50 3.75 68.8 141.1
Mix 64 CS-G-2 4.25 3.00 72.5 142.0
Mix 67 CS-G-3 3.50 3.25 72.7 143.3

37
Table 21 - Plastic Properties: Gravel Aggregate, (75/25C)
Mix No. Cement Sample Slump (in.) Air (%) Temp (ºF) Unit Weight
(lbs/ft3)
Mix 2 CS-A-1 6.50 2.00 70.5 143.2
Mix 5 CS-A-2 6.75 2.25 70.0 143.2
Mix 8 CS-A-3 6.75 2.50 70.5 142.4
Mix 14 CS-B-1 8.25 1.601 66.2 143.7
Mix 17 CS-B-2 7.50 2.75 68.0 142.3
Mix 20 CS-B-3 7.50 2.75 67.1 142.1
Mix 26 CS-C-1 5.75 2.50 68.2 142.5
Mix 29 CS-C-2 5.75 2.50 72.2 142.6
Mix 32 CS-C-3 4.50 2.50 70.7 142.8
Mix 38 CS-D-1 6.00 2.25 72.5 143.2
Mix 41 CS-D-2 4.75 2.00 72.7 142.7
Mix 44 CS-D-3 4.50 2.50 71.2 143.7
Mix 74 CS-E-1 5.25 2.50 70.2 143.6
Mix 77 CS-E-2 6.25 2.00 69.0 143.0
Mix 80 CS-E-3 3.75 2.50 69.2 143.4
Mix 50 CS-F-1 6.50 2.00 66.8 143.0
Mix 53 CS-F-2 5.75 2.00 68.5 143.8
Mix 56 CS-F-3 6.00 2.50 69.6 142.4
Mix 62 CS-G-1 7.50 2.50 68.1 142.5
Mix 65 CS-G-2 7.50 2.00 70.7 142.8
Mix 68 CS-G-3 6.25 2.75 72.3 142.9 Table 21 Notes:
1. This number represents the calculated theoretical air content based on unit weight. This calculation
had to be made due to a leak in the air meter.
38
Table 22 - Plastic Properties: Gravel Aggregate, (75/25F)
Mix No. Cement Sample Slump (in.) Air (%) Temp (ºF) Unit Weight
(lbs/ft3)
Mix 3 CS-A-1 4.25 2.00 69.1 142.2
Mix 6 CS-A-2 8.00 1.75 68.3 142.4
Mix 9 CS-A-3 5.00 2.50 70.0 141.5
Mix 15 CS-B-1 6.50 1.75 67.9 141.8
Mix 18 CS-B-2 6.00 2.25 67.3 142.0
Mix 21 CS-B-3 7.25 2.75 66.0 141.9
Mix 27 CS-C-1 4.75 2.00 71.9 141.9
Mix 30 CS-C-2 4.50 2.00 72.2 142.3
Mix 33 CS-C-3 4.25 2.25 69.8 141.6
Mix 39 CS-D-1 4.50 2.25 70.8 142.2
Mix 42 CS-D-2 5.50 2.00 71.5 142.3
Mix 45 CS-D-3 4.75 2.00 71.9 142.9
Mix 75 CS-E-1 4.75 2.00 73.2 142.0
Mix 78 CS-E-2 4.75 2.00 68.5 141.9
Mix 81 CS-E-3 3.50 2.00 70.8 141.9
Mix 51 CS-F-1 5.50 2.00 68.4 142.5
Mix 54 CS-F-2 5.50 2.00 68.4 142.5
Mix 57 CS-F-3 4.25 2.25 69.9 141.9
Mix 63 CS-G-1 6.75 2.25 71.1 142.3
Mix 66 CS-G-2 6.50 2.00 69.8 142.2
Mix 69 CS-G-3 5.25 2.25 74.1 142.0

39
Table 23 - Plastic Properties: Crushed Limestone Aggregate, (100)
Mix No. Cement Sample Slump (in.) Air (%) Temp (ºF) Unit Weight
(lbs/ft3)
Mix 10 CS-A-1 2.50 3.75 68.9 150.2
Mix 22 CS-B-1 3.00 3.75 68.4 150.2
Mix 34 CS-C-1 1.75 3.50 72.5 150.2
Mix 46 CS-D-1 2.50 3.50 70.5 151.0
Mix 82 CS-E-1 1.75 3.50 70.7 150.6
Mix 58 CS-F-1 1.75 3.00 72.2 150.5
Mix 70 CS-G-1 2.25 3.50 68.4 150.4
Table 24 - Plastic Properties: Crushed Limestone Aggregate, (75/25C)
Mix No. Cement Sample Slump (in.) Air (%) Temp (ºF) Unit Weight
(lbs/ft3)
Mix 11 CS‐A‐1 4.25 2.50 68.3 150.8
Mix 23 CS‐B‐1 5.50 2.75 67.8 150.7
Mix 35 CS‐C‐1 3.00 2.25 71.5 151.6
Mix 47 CS‐D‐1 4.25 3.50 70.5 151.3
Mix 83 CS‐E‐1 3.50 2.25 69.8 151.2
Mix 59 CS‐F‐1 3.00 2.25 72.1 151.2
Mix 71 CS‐G‐1 3.50 2.50 68.0 150.9
Table 25 - Plastic Properties: Crushed Limestone Aggregate, (75/25F)
Mix No. Cement Sample Slump (in.) Air (%) Temp (ºF) Unit Weight
(lbs/ft3)
Mix 12 CS-A-1 3.50 2.25 69.1 150.9
Mix 24 CS-B-1 4.00 2.25 68.6 151.3
Mix 36 CS-C-1 3.25 2.25 70.8 150.7
Mix 48 CS-D-1 3.00 3.25 71.5 150.6
Mix 84 CS-E-1 2.50 1.75 69.7 150.8
Mix 60 CS-F-1 2.50 2.00 72.4 150.8
Mix 72 CS-G-1 3.50 2.50 67.1 150.3

40
Concrete Compressive Strength Results from testing fifteen compressive strength specimens for each mix are given in
this section. These specimens were tested as follows; 3 at 1 day, 3 at 7 days, 3 at 14 days, 3 at 28
days, and 3 at 56 days. Results shown in this report are calculated as the average of specimens
tested for each age. Compressive strength results of each specimen were rounded to the nearest
10 psi. These individual tests at each test age were averaged and rounded to the nearest 1 psi for
reporting. Individual companion cylinder test results that exceeded the acceptable range of
10.6% as noted in AASHTO T 22 / ASTM C 39 were evaluated and either included in the
average or omitted from the average based on the opinion of the author. A detailed evaluation of
companion cylinder strengths is presented in Chapter 6 “Discussion of Results.”
Tables 26 through 31 present average compressive strength results. The two major
categories of mixtures are based on the coarse aggregate type, gravel or crushed limestone. Test
results from the gravel mixtures are presented in Tables 26 through 28. Tables 29 through 31
present average compressive strengths for mixtures made with crushed limestone coarse
aggregate.
Additionally, average compressive strength test results are separated by type of
cementitious materials used in the mixtures. Tables 26 and 29 present mixes with 100% cement
(100), Tables 27 and 30 present mixes with 25% Class C Fly Ash (75/25C), and Tables 28 and
31 present mixtures with 25% Class F fly ash (75/25F). Mixes are sorted by cement and sample
of cement in order to group results in alpha and numerical order of cement, not mix number.
These tables also include a ranking. A ranking of 1 indicates the highest compressive
strength for the table and the highest ranking indicates the lowest average compressive strength
for that category of mixes.
Figures 7 through 27 present average compressive strength versus age for all mixes.
These figures are specific for cement and type of cementitious materials used. Both crushed
limestone and gravel aggregates are included in these figures. The difference between the

41
highest and lowest 28-day compressive strength for the gravel aggregate concrete mixes, i.e.,
range is also noted in each of these figures.
Table 26 - Average Compressive Strength: Gravel Aggregate, (100)
Mix No.
Cement Sample
1 Day 7 Day 14 Day 28 Day 56 Day Avg. (psi) Rank
Avg. (psi) Rank
Avg. (psi) Rank
Avg. (psi) Rank
Avg. (psi) Rank
Mix 1 CS-A-1 1477 20 3730 16 3867 20 4467 16 4807 16 Mix 4 CS-A-2 1647 19 3470 19 4160 16 4303 20 4977 11 Mix 7 CS-A-3 1720 17 3743 15 3900 18 4483 15 5430 4
Mix 13 CS-B-1 1673 18 3747 14 4163 15 4727 8 4927 14 Mix 16 CS-B-2 1883 13 4340 3 4505 6 4867 4 5493 3 Mix 19 CS-B-3 1267 21 3840 11 4305 8 4750 7 4803 17 Mix 25 CS-C-1 2170 6 3693 17 4113 17 4373 18 4790 18 Mix 28 CS-C-2 2233 3 4267 4 4557 4 4667 9 4917 15 Mix 31 CS-C-3 1930 10 3965 6 4183 14 4413 17 4940 13 Mix 37 CS-D-1 1923 11 3780 13 4283 9 4560 14 4960 12 Mix 40 CS-D-2 2063 7 4113 5 4743 1 5333 1 5370 5 Mix 43 CS-D-3 2213 5 3803 12 4507 5 4777 6 5253 6 Mix 73 CS-E-1 2217 4 4350 1 4730 2 4665 10 5167 8 Mix 76 CS-E-2 2280 1 4343 2 4270 10 4950 3 5603 2 Mix 79 CS-E-3 2253 2 3925 7 4633 3 4637 11 5735 1 Mix 49 CS-F-1 1783 15 3907 8 4347 7 4990 2 5217 7 Mix 52 CS-F-2 1793 14 3897 9 4205 12 4615 13 5060 10 Mix 55 CS-F-3 1990 9 3875 10 4203 13 4625 12 5135 9 Mix 61 CS-G-1 1893 12 3213 21 3380 21 4125 21 4303 21 Mix 64 CS-G-2 1733 16 3463 20 4220 11 4370 19 4457 20 Mix 67 CS-G-3 2007 8 3607 18 3870 19 4810 5 4777 19

42
Table 27 - Average Compressive Strength: Gravel Aggregate, (75/25C)
Mix No.
Cement Sample
1 Day 7 Day 14 Day 28 Day 56 Day Avg. (psi) Rank
Avg. (psi) Rank
Avg. (psi) Rank
Avg. (psi) Rank
Avg. (psi) Rank
Mix 2 CS-A-1 883 20 3190 8 3497 13 3803 17 3867 19 Mix 5 CS-A-2 863 21 2873 18 3195 19 3383 21 3695 21 Mix 8 CS-A-3 970 19 3130 9 3243 17 4010 12 4415 10
Mix 14 CS-B-1 1023 18 3380 4 3677 6 4120 9 4355 12 Mix 17 CS-B-2 1137 17 3320 6 3625 7 4333 6 4407 11 Mix 20 CS-B-3 1287 11 3335 5 3540 8 4073 10 4340 13 Mix 26 CS-C-1 1373 5 3093 10 3510 10 3815 16 4150 16 Mix 29 CS-C-2 1360 7 3595 1 3720 5 4130 7 4453 9 Mix 32 CS-C-3 1280 12 3013 11 4457 1 4863 1 4720 7 Mix 38 CS-D-1 1437 2 2877 17 3507 11 3740 18 3890 18 Mix 41 CS-D-2 1343 9 2947 15 3465 14 3935 14 4205 14 Mix 44 CS-D-3 1420 4 2965 13 3227 18 3860 15 4180 15 Mix 74 CS-E-1 1350 8 3463 3 4160 2 3940 13 5053 4 Mix 77 CS-E-2 1707 1 3593 2 3917 4 4830 2 5330 1 Mix 80 CS-E-3 1373 5 2890 16 3503 12 4580 3 5300 2 Mix 50 CS-F-1 1263 13 2965 13 4067 3 4545 4 4850 6 Mix 53 CS-F-2 1197 14 3255 7 3360 16 4530 5 4885 5 Mix 56 CS-F-3 1317 10 2515 21 3453 15 4130 7 5155 3 Mix 62 CS-G-1 1177 15 2765 19 2937 21 3740 18 3830 20 Mix 65 CS-G-2 1170 16 2745 20 2940 20 3473 20 4043 17 Mix 68 CS-G-3 1437 2 3000 12 3530 9 4073 10 4607 8

43
Table 28 - Average Compressive Strength: Gravel Aggregate, (75/25F)
Mix No.
Cement Sample
1 Day 7 Day 14 Day 28 Day 56 Day Avg. (psi) Rank
Avg. (psi) Rank
Avg. (psi) Rank
Avg. (psi) Rank
Avg. (psi) Rank
Mix 3 CS-A-1 910 20 3140 1 3715 2 3910 11 4700 7 Mix 6 CS-A-2 890 21 2657 15 2985 19 3360 21 4107 20 Mix 9 CS-A-3 967 19 2557 17 3040 17 3530 19 4133 19
Mix 15 CS-B-1 1130 16 2970 6 3563 5 4295 4 4387 13 Mix 18 CS-B-2 1283 11 3015 5 3503 6 4103 7 4160 17 Mix 21 CS-B-3 1820 1 2940 7 3190 15 3800 14 4375 14 Mix 27 CS-C-1 1330 9 3053 4 3390 10 3880 12 4323 15 Mix 30 CS-C-2 1353 8 3100 2 3427 8 4020 9 4430 11 Mix 33 CS-C-3 1283 11 2880 10 4400 1 4930 1 4777 3 Mix 39 CS-D-1 1407 6 2703 11 3327 12 3635 17 4440 10 Mix 42 CS-D-2 1327 10 2690 12 3450 7 4000 10 4580 9 Mix 45 CS-D-3 1487 4 2430 19 3125 16 3760 15 4390 12 Mix 75 CS-E-1 1357 7 2883 9 3367 11 3850 13 4765 5 Mix 78 CS-E-2 1500 3 3063 3 3397 9 4375 3 4897 1 Mix 81 CS-E-3 1560 2 2680 13 3625 3 4050 8 4777 3 Mix 51 CS-F-1 1113 18 2677 14 3580 4 4473 2 4783 2 Mix 54 CS-F-2 1123 17 2657 15 3323 13 4160 6 4587 8 Mix 57 CS-F-3 1243 14 2365 21 3210 14 3747 16 4717 6 Mix 63 CS-G-1 1270 13 2393 20 2640 21 3573 18 4003 21 Mix 66 CS-G-2 1133 15 2510 18 2880 20 3513 20 4210 16 Mix 69 CS-G-3 1460 5 2885 8 3017 18 4235 5 4157 18

44
Table 29 - Average Compressive Strength: Crushed Limestone Aggregate, (100)
Mix No.
Cement Sample
1 Day 7 Day 14 Day 28 Day 56 Day Avg. (psi) Rank
Avg. (psi) Rank
Avg. (psi) Rank
Avg. (psi) Rank
Avg. (psi) Rank
Mix 10 CS-A-1 2637 7 5833 3 6787 2 7237 2 7593 3 Mix 22 CS-B-1 2740 6 6170 1 6463 3 7023 3 7623 2 Mix 34 CS-C-1 3320 1 5693 4 6153 7 6577 7 7110 6 Mix 46 CS-D-1 3267 2 5657 5 6430 4 6910 4 7147 5 Mix 82 CS-E-1 2890 4 5907 2 6953 1 7300 1 7870 1 Mix 58 CS-F-1 2913 3 5573 6 6350 5 6603 6 7257 4 Mix 70 CS-G-1 2790 5 5373 7 6210 6 6740 5 6833 7
Table 30 - Average Compressive Strength: Crushed Limestone Aggregate, (75/25C)
Mix No.
Cement Sample
1 Day 7 Day 14 Day 28 Day 56 Day Avg. (psi) Rank
Avg. (psi) Rank
Avg. (psi) Rank
Avg. (psi) Rank
Avg. (psi) Rank
Mix 11 CS-A-1 1467 6 5340 6 6660 3 7920 1 8570 1 Mix 23 CS-B-1 1413 7 5647 4 6550 6 7277 5 8067 3 Mix 35 CS-C-1 2295 2 5997 1 6590 5 7657 3 7993 4 Mix 47 CS-D-1 2313 1 5780 3 6780 1 7133 7 7553 7 Mix 83 CS-E-1 1943 4 5573 5 6730 2 7470 4 7943 5 Mix 59 CS-F-1 2043 3 5330 7 6530 7 7737 2 8327 2 Mix 71 CS-G-1 1750 5 5957 2 6657 4 7210 6 7850 6
Table 31 - Average Compressive Strength: Crushed Limestone Aggregate, (75/25F)
Mix No.
Cement Sample
1 Day 7 Day 14 Day 28 Day 56 Day Avg. (psi) Rank
Avg. (psi) Rank
Avg. (psi) Rank
Avg. (psi) Rank
Avg. (psi) Rank
Mix 12 CS-A-1 1567 7 4720 4 5513 2 6573 1 7313 3 Mix 24 CS-B-1 1700 6 4730 2 5323 5 6023 5 7357 2 Mix 36 CS-C-1 2210 1 4810 1 5243 7 5783 7 6720 7 Mix 48 CS-D-1 2203 2 4727 3 5610 1 6350 3 7243 4 Mix 84 CS-E-1 1877 5 4557 5 5420 4 6103 4 7150 5 Mix 60 CS-F-1 1887 4 4533 6 5437 3 6387 2 7860 1 Mix 72 CS-G-1 1920 3 4380 7 5287 6 5933 6 7137 6
45
Figure 7 - Compressive Strength vs Age: Cement A 100
Figure 8 - Compressive Strength vs Age: Cement A 75/25C
0
1,000
2,000
3,000
4,000
5,000
6,000
7,000
8,000
9,000
0 7 14 21 28 35 42 49 56
Com
pres
sive
Stre
ngth
(psi
)
Age (days)
Gravel A1 100Gravel A2 100Gravel A3 100Stone A1 100
28 Day Range = 180 psi
0
1,000
2,000
3,000
4,000
5,000
6,000
7,000
8,000
9,000
0 7 14 21 28 35 42 49 56
Com
pres
sive
Stre
ngth
(psi
)
Age (days)
Gravel A1 75/25CGravel A2 75/25CGravel A3 75/25CStone A1 75/25C
28 Day Range = 627 psi
46
Figure 9 - Compressive Strength vs Age: Cement A 75/25F
Figure 10 - Compressive Strength vs Age: Cement B 100
0
1,000
2,000
3,000
4,000
5,000
6,000
7,000
8,000
9,000
0 7 14 21 28 35 42 49 56
Com
pres
sive
Stre
ngth
(psi
)
Age (days)
Gravel A1 75/25FGravel A2 75/25FGravel A3 75/25FStone A1 75/25F
28 Day Range = 550 psi
0
1,000
2,000
3,000
4,000
5,000
6,000
7,000
8,000
9,000
0 7 14 21 28 35 42 49 56
Com
pres
sive
Stre
ngth
(psi
)
Age (days)
Gravel B1 100Gravel B2 100Gravel B3 100Stone B1 100
28 Day Range = 140 psi

47
Figure 11 - Compressive Strength vs Age: Cement B 75/25C
Figure 12 - Compressive Strength vs Age: Cement B 75/25F
0
1,000
2,000
3,000
4,000
5,000
6,000
7,000
8,000
9,000
0 7 14 21 28 35 42 49 56
Com
pres
sive
Stre
ngth
(psi
)
Age (days)
Gravel B1 75/25CGravel B2 75/25CGravel B3 75/25CStone B1 75/25C
28 Day Range = 260 psi
0
1,000
2,000
3,000
4,000
5,000
6,000
7,000
8,000
9,000
0 7 14 21 28 35 42 49 56
Com
pres
sive
Stre
ngth
(psi
)
Age (days)
Gravel B1 75/25FGravel B2 75/25FGravel B3 75/25FStone B1 75/25F
28 Day Range = 495 psi

48
Figure 13 - Compressive Strength vs Age: Cement C 100
Figure 14 - Compressive Strength vs Age: Cement C 75/25C
0
1,000
2,000
3,000
4,000
5,000
6,000
7,000
8,000
9,000
0 7 14 21 28 35 42 49 56
Com
pres
sive
Stre
ngth
(psi
)
Age (days)
Gravel C1 100Gravel C2 100Gravel C3 100Stone C1 100
28 Day Range = 293 psi
0
1,000
2,000
3,000
4,000
5,000
6,000
7,000
8,000
9,000
0 7 14 21 28 35 42 49 56
Com
pres
sive
Str
engt
h (p
si)
Age (days)
Gravel C1 75/25CGravel C2 75/25CGravel C3 75/25CStone C1 75/25C
28 Day Range = 1,048 psi

49
Figure 15 - Compressive Strength vs Age: Cement C 75/25F
Figure 16 - Compressive Strength vs Age: Cement D 100
0
1,000
2,000
3,000
4,000
5,000
6,000
7,000
8,000
9,000
0 7 14 21 28 35 42 49 56
Com
pres
sive
Str
engt
h (p
si)
Age (days)
Gravel C1 75/25FGravel C2 75/25FGravel C3 75/25FStone C1 75/25F
28 Day Range = 1,050 psi
0
1,000
2,000
3,000
4,000
5,000
6,000
7,000
8,000
9,000
0 7 14 21 28 35 42 49 56
Com
pres
sive
Stre
ngth
(psi
)
Age (days)
Gravel D1 100Gravel D2 100Gravel D3 100Stone D1 100
28 Day Range = 773 psi

50
Figure 17 - Compressive Strength vs Age: Cement D 75/25C
Figure 18 - Compressive Strength vs Age: Cement D 75/25F
0
1,000
2,000
3,000
4,000
5,000
6,000
7,000
8,000
9,000
0 7 14 21 28 35 42 49 56
Com
pres
sive
Str
engt
h (p
si)
Age (days)
Gravel D1 75/25CGravel D2 75/25CGravel D3 75/25CStone D1 75/25C
28 Day Range = 195 psi
0
1,000
2,000
3,000
4,000
5,000
6,000
7,000
8,000
9,000
0 7 14 21 28 35 42 49 56
Com
pres
sive
Str
engt
h (p
si)
Age (days)
Gravel D1 75/25FGravel D2 75/25FGravel D3 75/25FStone D1 75/25F
28 Day Range = 365 psi
51
Figure 19 - Compressive Strength vs Age: Cement E 100
Figure 20 - Compressive Strength vs Age: Cement E 75/25C
0
1,000
2,000
3,000
4,000
5,000
6,000
7,000
8,000
9,000
0 7 14 21 28 35 42 49 56
Com
pres
sive
Stre
ngth
(psi
)
Age (days)
Gravel E1 100Gravel E2 100Gravel E3 100Stone E1 100
28 Day Range = 313 psi
0
1,000
2,000
3,000
4,000
5,000
6,000
7,000
8,000
9,000
0 7 14 21 28 35 42 49 56
Com
pres
sive
Stre
ngth
(psi
)
Age (days)
Gravel E1 75/25CGravel E2 75/25CGravel E3 75/25CStone E1 75/25C
Possible Outlier
28 Day Range = 890 psi
52
Figure 21 - Compressive Strength vs Age: Cement E 75/25F
Figure 22 - Compressive Strength vs Age: Cement F 100
0
1,000
2,000
3,000
4,000
5,000
6,000
7,000
8,000
9,000
0 7 14 21 28 35 42 49 56
Com
pres
sive
Stre
ngth
(psi
)
Age (days)
Gravel E1 75/25FGravel E2 75/25FGravel E3 75/25FStone E1 75/25F
28 Day Range = 525 psi
0
1,000
2,000
3,000
4,000
5,000
6,000
7,000
8,000
9,000
0 7 14 21 28 35 42 49 56
Com
pres
sive
Stre
ngth
(psi
)
Age (days)
Gravel F1 100Gravel F2 100Gravel F3 100Stone F1 100
28 Day Range = 375 psi
53
Figure 23 - Compressive Strength vs Age: Cement F 75/25C
Figure 24 - Compressive Strength vs Age: Cement F 75/25F
0
1,000
2,000
3,000
4,000
5,000
6,000
7,000
8,000
9,000
0 7 14 21 28 35 42 49 56
Com
pres
sive
Stre
ngth
(psi
)
Age (days)
Gravel F1 75/25CGravel F2 75/25CGravel F3 75/25CStone F1 75/25C
28 Day Range = 415 psi
0
1,000
2,000
3,000
4,000
5,000
6,000
7,000
8,000
9,000
0 7 14 21 28 35 42 49 56
Com
pres
sive
Stre
ngth
(psi
)
Age (days)
Gravel F1 75/25FGravel F2 75/25FGravel F3 75/25FStone F1 75/25F
28 Day Range = 727 psi

54
Figure 25 - Compressive Strength vs Age: Cement G 100
Figure 26 - Compressive Strength vs Age: Cement G 75/25C
0
1,000
2,000
3,000
4,000
5,000
6,000
7,000
8,000
9,000
0 7 14 21 28 35 42 49 56
Com
pres
sive
Stre
ngth
(psi
)
Age (days)
Gravel G1 100Gravel G2 100Gravel G3 100Stone G1 100
28 Day Range = 685 psi
0
1,000
2,000
3,000
4,000
5,000
6,000
7,000
8,000
9,000
0 7 14 21 28 35 42 49 56
Com
pres
sive
Stre
ngth
(psi
)
Age (days)
Gravel G1 75/25CGravel G2 75/25CGravel G3 75/25CStone G1 75/25C
28 Day Range = 600 psi

55
Figure 27 - Compressive Strength vs Age: Cement G 75/25F
Mortar Cube Compressive Strength
Results from BCD’s testing of nine compressive strength specimens per cement sample
are given in this section. These specimens were tested as follows; 2 at 1 day, 2 at 3 days (except
for cement samples CS-A-2, CS-B-2, and CS-C-2 tested at 5 days), 3 at 7 days and 2 at 28 days.
Results shown in this report are calculated as the average of specimens tested at each age.
Compressive strength results of each specimen were rounded to the nearest 1 psi. These
individual tests at each test age were then averaged and the average was rounded to the nearest
10 psi for reporting. The results from testing mortar cube specimens for compressive strength
are presented in Table 32. This table also includes ranking. A ranking of 1 indicates the highest
compressive strength for the table and a ranking of 21 indicates the lowest average compressive
strength for the mortar cubes.
0
1,000
2,000
3,000
4,000
5,000
6,000
7,000
8,000
9,000
0 7 14 21 28 35 42 49 56
Com
pres
sive
Stre
ngth
(psi
)
Age (days)
Gravel G1 75/25FGravel G2 75/25FGravel G3 75/25FStone G1 75/25F
28 Day Range = 722 psi
56
Table 32 - Average Compressive Strength for Mortar Cubes
Cement Sample
1 Day 3 Day 7 Day 28 Day Avg. (psi) Rank
Avg. (psi) Rank
Avg. (psi) Rank
Avg. (psi) Rank
CS-A-1 2140 19 3740 7 4790 4 6020 1 CS-A-2 1970 21 32101 18 4950 1 5470 11 CS-A-3 2280 15 3950 4 4510 7 5800 4 CS-B-1 2030 20 3620 10 4220 16 5720 6 CS-B-2 2260 16 27101 21 4540 6 5260 16 CS-B-3 2290 14 3800 6 4300 15 5540 9 CS-C-1 2340 12 3840 5 4330 13 5370 13 CS-C-2 2390 11 30301 19 4470 9 5290 15 CS-C-3 3030 2 3620 10 4190 17 4760 20 CS-D-1 2540 8 3680 8 4360 12 5390 12 CS-D-2 2560 7 3590 12 4320 14 5540 9 CS-D-3 2770 4 4060 3 4400 10 5360 14 CS-E-1 2770 4 4190 2 4920 2 5670 8 CS-E-2 3140 1 4380 1 4850 3 5890 3 CS-E-3 2780 3 3470 14 4740 5 5940 2 CS-F-1 2180 18 3460 15 4110 19 5700 7 CS-F-2 2330 13 3440 16 4140 18 5750 5 CS-F-3 2470 10 3290 17 4080 20 5090 19 CS-G-1 2680 6 3640 9 4370 11 5240 17 CS-G-2 2250 17 2770 20 3940 21 4760 20 CS-G-3 2480 9 3580 13 4490 8 5170 18
Notes for Table 32:
1. This compressive strength is at 5 days in lieu of 3 days. Therefore, the 3 day ranking for mortar cubes may not be valid.

57
Chapter 6 – Discussion of Results
Acceptable Range of Compressive Strengths for Companion Cylinders
Properly fabricated and tested companion cylinders almost always produce different
compressive strength results creating a range in the individual test results. The range of
companion specimen results for this research was as low as 10 psi and as high as 1,100 psi for
three specimens tested at an age of 7 days, 14 days, 28 days, or 56 days. AASHTO T 22 /
ASTM C 39 provides an acceptable range for companion cylinders of 10.6 percent when three 4
in. X 8 in. cylinders are tested in laboratory conditions. According to AASHTO T 22 / ASTM C
39, this acceptable range in companion cylinder strength is applicable for compressive strengths
ranging between 2,500 psi and 4,700 psi. Since the majority of the mixes in this research had
one day compressive strengths less than 2,500 psi, one day compressive strengths were not
evaluated based on acceptable range.
Influence of Coarse Aggregate Type on Companion Cylinder Strength
A total of 336 sets of cylinders were evaluated for acceptable range in this research
including 84 sets made with crushed limestone coarse aggregate and 252 sets made with gravel
aggregate. There were only two sets of companion cylinders out of 84 sets of specimens made
with crushed limestone that exceeded the 10.6 percent range. That is 2.4 percent of companion
cylinder sets made from mixes proportioned with crushed limestone coarse aggregate exceeded
the acceptable range. There were 84 sets of companion cylinders out of 252 sets made from
mixtures proportioned with gravel aggregate concrete that exceeded the acceptable range for
companion cylinders. Therefore, 33.3 percent of gravel aggregate concrete companion cylinders
exceeded the acceptable range. It is apparent that the acceptable range provided in AASHTO T
22 / ASTM C 39 may not be applicable for gravel aggregate concrete because 66.7 percent of the
companion cylinders made with gravel aggregates were within the acceptable range versus 97.6
percent for the crushed limestone.
Influence of Cementitious Materials on Companion Cylinder Strength
Cementitious materials were also evaluated for their influence on acceptable range of
compressive strength for companion cylinders. There were 112 sets of companion cylinders

58
made with 100, 112 sets made with 72/25C, and 112 sets made with 75/25F. There were 21 out
of 112 sets (or 18.8 percent) of companion cylinders made from mixtures with 100% cement that
exceeded the acceptable range. There were 32 out of 112 sets ( or 28.6 percent) of companion
cylinders made from mixtures with 75/25C that exceeded the acceptable range. There were 33
out of 112 sets (or 29.5 percent) of companion cylinders made from mixtures with 75/25F that
exceeded the acceptable range. Mixtures proportioned with 75% cement and either 25% Class C
or 25% Class F fly ash introduce more variability in concrete compressive strength than mixtures
proportioned with 100% cement.
Evaluating Acceptable Range of Companion Cylinders for 28-Day Compressive
Strengths
Figures 28 through 33 present average 28-day compressive strength versus strength range
of companion cylinders. These figures also show acceptable range limits provided in AASHTO
T 22 / ASTM C 39 for two and three companion cylinders of 9.0 percent and 10.6 percent,
respectfully. Each point to the left of the limit indicates that the set is within the acceptable
range. Each point to the right of the acceptable limit indicates that the set is outside the
acceptable range.
Figure 28 presents all 28-day compressive strength data before removing individual test
results that exceeded the acceptable range for three 4 in. X 8 in. cylindrical specimens. There
were 21 out of 84 of the 28-day companion cylinder sets that exceeded the acceptable range
before removing outliers. Individual compressive test results that exceeded the acceptable range
were considered to be outliers. Figures 29 through 32 show these 28-day strength data divided
into four categories including; 1) all crushed limestone mixes (Figure 29), 2) all 100% cement
gravel aggregate mixes (Figure 30), 3) all 75/25C gravel aggregate mixes (Figure 31), and 4) all
75/25F gravel aggregate mixes (Figure 32). These figures show that mixtures made with crushed
limestone aggregate produce 4.8 percent of companion sets of cylinders that exceed the
acceptable range. The percentage companion cylinders made with gravel aggregate and 100%
cement or 75/25C that exceeded the acceptable range is 23.8 percent and 28.6 percent,
respectfully. Gravel aggregate mixture proportioned with 75/25F had 47.6 percent of their

59
companion sets of 28-day cylinders that exceed the acceptable range for three companion
cylinders.
Figure 33 presents ranges of companion cylinders for 28-day compressive strengths after
removing individual test results that exceeded the acceptable range for three 4 in. X 8 in.
cylindrical specimens. Only one set of companion cylinders exceeded the acceptable limit for
three 4 in. X 8 in. cylindrical specimens after removing the outlier test.
The acceptable ranges of AASHTO T 22 / ASTM C 39 have been challenged by a recent
National Cooperative Research Program (NCHRP) Project 9-26A (11). The NCHRP research
found that the acceptable range of two test results for 4 in. X 8 in. cylinders is 12.1 percent for
single-operator precision. This 12.1 percent limit is also shown in Figures 28 through 33 for
reference.
Adjusting Average Compressive Strength for Outliers
Data in this research show that ranges in individual compressive strength test results of
companion cylinders is influenced by aggregate type and cementitious materials. Ranges of
individual compressive strength results of companion specimens of all 7, 14, 28, and 56 day
cylinder sets were evaluated. Individual cylinder test results of sets of companion cylinders that
caused the range between the minimum and maximum strengths to exceed the acceptable range
were considered outliers and removed. In these cases, the average compressive strength of the
set is the average of two cylinders in lieu of three cylinders. A summary of these companion
cylinder outliers is presented in Table 33. These outliers were removed and not included in the
average calculation for the set of cylinders unless noted in the next paragraph.
There were 6 sets of companion cylinders that exceeded the acceptable range, but were
not removed from the average for the set. These are noted in Table 33 with an “X”. These
individual tests remain in the average for the set because taking these out would cause the
strength versus age curve of the data set to be erratic. For example, taking an individual test out
of the set may cause the 14 day strength to be higher than the 28-day for the mix. Therefore,
engineering judgment was used in these cases to determine whether or not an individual test was

60
used in the average for the strength results. Table 33 also provides the revised calculation of
range percent if applicable.
Table 33 - Summary of Outliers Removed
A B CStrength Discarded
Range (% ) A B C
Strength Discarded
Range (% ) A B C
Strength Discarded
Range (% ) A B C
Strength Discarded
Range (% )
Mix 1Mix 2Mix 3 3080 3200 2850 3.8 3670 3760 3360 2.4 4090 3730 3520 8.8Mix 4 4230 4090 3760 3.3Mix 5 3100 3290 2850 5.8 3510 3880 4340 9.5Mix 6 2950 3020 2640 2.3 3420 3300 3890 3.5Mix 7 5300 5560 4780 4.7Mix 8 3340 2810 3240 X 15.9 3840 4180 3310 8.1 4350 4480 3620 2.9Mix 9 3030 3050 3450 0.7 3600 3460 3220 3.9Mix 10Mix 11Mix 12Mix 13Mix 14 4300 4410 3930 2.5Mix 15 4370 4220 3860 3.4 4350 4160 4650 X 10.5Mix 16 4410 4270 3720 3.2 4330 4680 3950 7.5Mix 17 3580 3670 3120 2.5Mix 18 3090 2940 3280 4.9 4360 3960 3690 9.2Mix 19 4120 4490 3670 8.2Mix 20 3330 3340 2970 0.3 3530 3550 3140 0.6 4320 4360 3720 0.9Mix 21 4570 4180 3720 8.5Mix 22Mix 23Mix 24Mix 25Mix 26 3570 3450 3190 3.4 3830 3800 4380 0.8 4020 4280 3630 6.1Mix 27 4000 3760 3400 6.0Mix 28Mix 29 3570 3620 3170 1.4Mix 30Mix 31 4010 3920 3530 2.2Mix 32 4380 5060 4150 13.4Mix 33Mix 34Mix 35Mix 36 4670 4950 4400 5.7Mix 37 4690 4430 4960 5.5Mix 38Mix 39 3530 3740 4080 5.6 4260 4620 3870 7.8Mix 40Mix 41 3570 3360 3050 5.9 3740 4130 4840 9.4 4260 4150 4750 2.6Mix 42 2820 2560 2300 9.2 4690 4470 5090 4.7Mix 43Mix 44 2870 3060 2630 6.2 3980 3740 3460 6.0 4230 4130 4910 2.4Mix 45 2380 2480 2770 4.0 3130 3120 2750 0.3 4240 4540 3790 6.6Mix 46Mix 47Mix 48 6380 6320 7250 0.9
Mix No.
7 Day 14 Day 28 Day 56 Day

61
Table 33 - Summary of Outliers Removed (Continued)
A B CStrength Discarded
Range (% ) A B C
Strength Discarded
Range (% ) A B C
Strength Discarded
Range (% ) A B C
Strength Discarded
Range (% )
Mix 49Mix 50 3080 2850 2690 7.5 4600 4490 4040 2.4Mix 51 3570 3590 3970 0.6Mix 52 4490 3920 4850 12.7 4500 4730 5110 4.9Mix 53 3220 3290 2940 2.1 3370 3350 3860 0.6 5170 4600 4370 11.0Mix 54Mix 55 4040 3710 3360 8.2 4610 4640 5340 0.6 5040 5230 6110 3.6Mix 56 2570 2460 2890 4.3 5150 5160 4630 0.2Mix 57 2350 2380 2660 1.3Mix 58Mix 59Mix 60Mix 61 4160 4090 4570 1.7Mix 62 2760 2770 3490 0.4Mix 63Mix 64 4310 4130 3800 4.2 4510 4700 3900 X 17.0Mix 65 2740 2750 3200 0.4 2820 3060 3480 7.8Mix 66 4060 4360 3870 6.9Mix 67 3930 3810 4240 3.1Mix 68 3000 3000 3410 0.0Mix 69 2840 2930 2620 3.1 3290 2940 2820 X 14.3 4310 4160 3750 3.5Mix 70Mix 71Mix 72Mix 73 4380 4320 3720 1.4 4420 4910 4360 10.0Mix 74 4150 3930 4400 X 10.7Mix 75 3810 3890 4250 2.1 4750 4780 4280 0.6Mix 76Mix 77Mix 78 4460 4290 3920 3.8Mix 79 3860 3990 3520 3.3 4350 4670 4880 X 10.9 5700 5770 4970 1.2Mix 80Mix 81 2640 2720 2950 2.9 3550 3700 3310 4.1Mix 82Mix 83Mix 84
Mix No.
7 Day 14 Day 28 Day 56 Day
62
Figure 28 – 28-Day Companion Cylinder Strength Ranges for All Mixes
Before Removing Outliers
3,000
3,500
4,000
4,500
5,000
5,500
6,000
6,500
7,000
7,500
8,000
0 100 200 300 400 500 600 700 800 900 1000 1100 1200
28 D
ay C
ompr
essi
ve S
treng
th (p
si)
Range of Companion Cylinder Compressive Strengths (psi)
NCHRP Project 9-26A Maximum Acceptable Range For 2 Specimens
AASHTO T22Maximum Acceptable Range For 3 Specimens
AASHTO T22Maximum AcceptableRange for 2 Specimens

63
Figure 29 - 28-Day Companion Cylinder Strength Ranges for All Crushed Limestone
Mixes Before Removing Outliers
3,000
3,500
4,000
4,500
5,000
5,500
6,000
6,500
7,000
7,500
8,000
0 100 200 300 400 500 600 700 800 900 1000 1100 1200
28 D
ay C
ompr
essi
ve S
treng
th (p
si)
Range of Companion Cylinder Compressive Strengths (psi)
NCHRP Project 9-26A Maximum Acceptable Range For 2 Specimens
AASHTO T22Maximum Acceptable Range For 3 Specimens
AASHTO T22Maximum AcceptableRange for 2 Specimens

64
Figure 30 - 28-Day Companion Cylinder Strength Ranges for Gravel Aggregate Concrete
Mixes (100) Before Removing Outliers
3,000
3,500
4,000
4,500
5,000
5,500
6,000
6,500
7,000
7,500
8,000
0 100 200 300 400 500 600 700 800 900 1000 1100 1200
28 D
ay C
ompr
essi
ve S
treng
th (p
si)
Range of Companion Cylinder Compressive Strengths (psi)
NCHRP Project 9-26A Maximum Acceptable Range For 2 Specimens
AASHTO T22Maximum Acceptable Range For 3 Specimens
AASHTO T22Maximum AcceptableRange for 2 Specimens

65
Figure 31 - 28-Day Companion Cylinder Strength Ranges for Gravel Aggregate Concrete
Mixes (75/25C) Before Removing Outliers
3,000
3,500
4,000
4,500
5,000
5,500
6,000
6,500
7,000
7,500
8,000
0 100 200 300 400 500 600 700 800 900 1000 1100 1200
28 D
ay C
ompr
essi
ve S
treng
th (p
si)
Range of Companion Cylinder Compressive Strengths (psi)
NCHRP Project 9-26A Maximum Acceptable Range For 2 Specimens
AASHTO T22Maximum Acceptable Range For 3 Specimens
AASHTO T22Maximum AcceptableRange for 2 Specimens

66
Figure 32 - 28-Day Companion Cylinder Strength Ranges for Gravel Aggregate Concrete
Mixes (75/25F) Before Removing Outliers
3,000
3,500
4,000
4,500
5,000
5,500
6,000
6,500
7,000
7,500
8,000
0 100 200 300 400 500 600 700 800 900 1000 1100 1200
28 D
ay C
ompr
essi
ve S
treng
th (p
si)
Range of Companion Cylinder Compressive Strengths (psi)
NCHRP Project 9-26A Maximum Acceptable Range For 2 Specimens
AASHTO T22Maximum Acceptable Range For 3 Specimens
AASHTO T22Maximum AcceptableRange for 2 Specimens
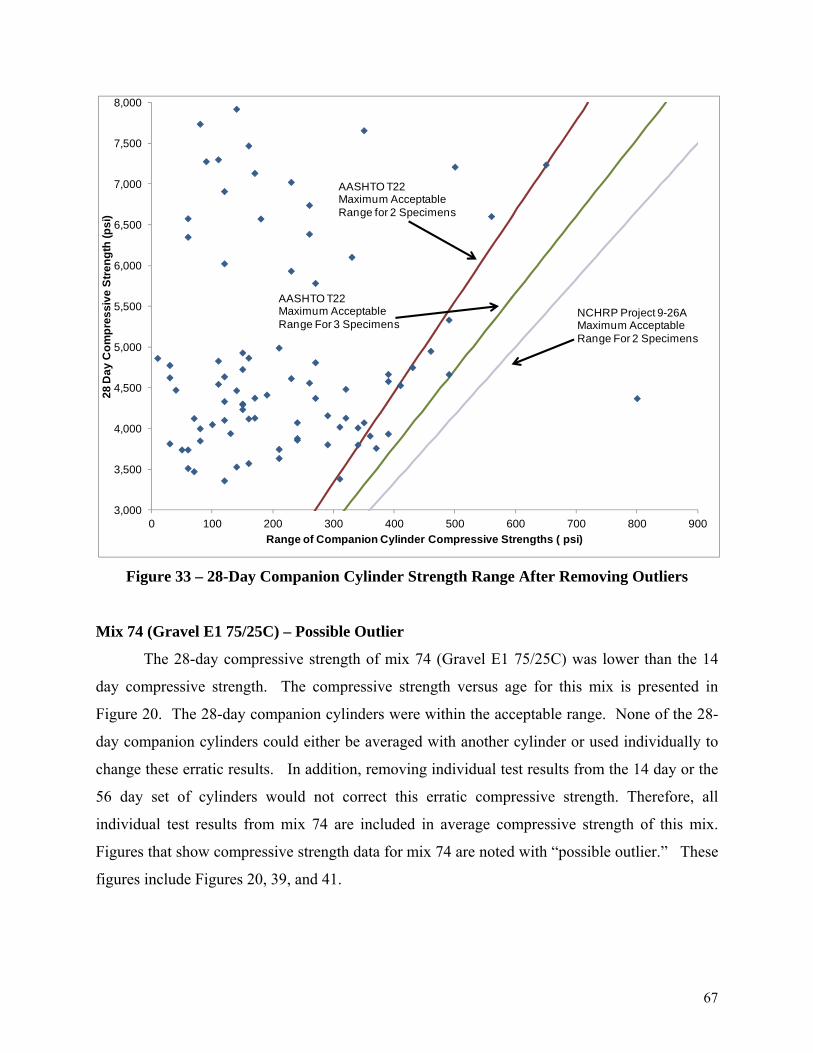
67
Figure 33 – 28-Day Companion Cylinder Strength Range After Removing Outliers
Mix 74 (Gravel E1 75/25C) – Possible Outlier
The 28-day compressive strength of mix 74 (Gravel E1 75/25C) was lower than the 14
day compressive strength. The compressive strength versus age for this mix is presented in
Figure 20. The 28-day companion cylinders were within the acceptable range. None of the 28-
day companion cylinders could either be averaged with another cylinder or used individually to
change these erratic results. In addition, removing individual test results from the 14 day or the
56 day set of cylinders would not correct this erratic compressive strength. Therefore, all
individual test results from mix 74 are included in average compressive strength of this mix.
Figures that show compressive strength data for mix 74 are noted with “possible outlier.” These
figures include Figures 20, 39, and 41.
3,000
3,500
4,000
4,500
5,000
5,500
6,000
6,500
7,000
7,500
8,000
0 100 200 300 400 500 600 700 800 900
28 D
ay C
ompr
essi
ve S
treng
th (p
si)
Range of Companion Cylinder Compressive Strengths ( psi)
NCHRP Project 9-26A Maximum Acceptable Range For 2 Specimens
AASHTO T22Maximum Acceptable Range For 3 Specimens
AASHTO T22Maximum AcceptableRange for 2 Specimens

68
Comparison of Average Compressive Strength Data From Each Cement Source
General
Compressive strengths from mixes made with each of the three samples of cement that
were taken approximately one month apart were compiled and the average compressive strength
was determined for each mix category, i.e., 100% Cement (100), 75% Cement and 25% Class C
fly ash (75/25C), and 75% Cement and 25% Class F fly ash (75/25F). There were seven cements
used in this study including three types; Type I, II, and IL. Average compressive strength verses
age graphs were then developed to show the performance of each of the seven cements with
respect to compressive strength. These data are presented in Figures 34 through 36. Crushed
limestone mixes shown in these tables were established as control mixes, but were proportioned
with only the first month’s sample of each cement. The crushed limestone data represents
average compressive strength results from each of the seven cements.
100 Percent Cement (100)
Average compressive strength results for all mixes that were proportioned with 100%
cement are presented in Figure 34. The highest average 28-day compressive strength made with
gravel aggregates was 4,890 psi and this mix used Cement D (Type II). The lowest average 28-
day compressive made with gravel aggregates was 4,418 psi and this mix used Cement A (Type
II). The highest average gravel aggregate 28-day compressive strength in this category of mixes
was 70.7 percent of the average crushed limestone control mixes. The lowest average gravel
aggregate 28-day compressive strength in this category of mixes was 69.9 percent of the control
mixes. The range between the highest and lowest 28-day compressive strength of gravel
aggregate concrete is 472 psi. This range is 10.2 percent of the average 28-day compressive
strength of all mixes made with gravel aggregates and 100 percent cement. Therefore, a cement
source change can change the 28-day compressive strength by 10.2 percent when using 100%
cement. Cement E (Type IL) had the highest average 56 day compressive strength.
69
75 Percent Cement and 25 Percent Class C Fly Ash (75/25C)
Average compressive strength results versus age of all mixes that were proportioned with
75% cement and 25% Class C fly ash are presented in Figure 35. The highest average 28-day
compressive strength made with gravel aggregates was 4,450 psi and this mix used Cement E
(Type IL). The lowest average 28-day compressive strength made with gravel aggregates was
3,732 psi and this mix used Cement A (Type II). The highest average gravel aggregate 28
compressive strength in this category of mixes was 59.4 percent of the average crushed
limestone control mixes. The lowest average gravel aggregate 28-day compressive strength in
this category of mixes was 49.9 percent of the control mixes. The compressive strength range
between the highest and lowest gravel aggregate concrete mix in this category was 718 psi. This
range is 17.6 percent of the average 28-day compressive strength of all mixes made with gravel
aggregates and 75% cement and 25% Class C fly ash. Therefore, a cement source change can
change the 28-day compressive strength by 17.6 percent when using 75% cement and 25% Class
C fly ash. Cement E (Type IL) was the best performer with respect to compressive strength of
these mixes proportioned with 25% Class C fly ash. Cement E (Type IL) had the highest
average 56 day strength in this category.
75 Percent Cement and 25 Percent Class F Fly Ash (75/25F)
Average compressive strength results versus age of all mixes that were proportioned with
75% cement and 25% Class F fly ash are presented in Figure 36. The highest average 28-day
compressive strength made with gravel aggregates was 4,277 psi and this mix used Cement C
(Type I). The lowest average 28-day compressive strength made with gravel aggregates was
3,600 psi and this mix used Cement A (Type II). The highest average gravel aggregate 28
compressive strength in this category of mixes was 69.4 percent of the average crushed
limestone control mixes. The lowest average gravel aggregate 28-day compressive strength in
this category of mixes was 58.4 percent of the control mixes. The compressive strength range
between the highest and lowest gravel aggregate concrete mixture in this category was 677 psi.
This range is 17.1 percent of the average 28-day compressive strength of all mixes made with
gravel aggregates and 75% cement and 25% Class F fly ash. Therefore, a cement source change
can change the 28-day compressive strength by 17.1 percent when using 75% cement and 25%
Class F fly ash. Cement E (Type IL) had the highest average 56 day strength.

70
Gravel Aggregate Concrete - 100% Cement Versus 25% Fly Ash Average compressive strength results versus age of all gravel aggregate mixes are
presented in Figure 37. In all cases, gravel aggregate mixes proportioned with either 25% Class
C or Class F fly ash produce less compressive strength than gravel aggregate mixes proportioned
with 100% cement. The average 28-day compressive strength results for mixes with 25% Class
C were 88.1 percent of the average 28-day compressive strength of mixes proportioned with
100% cement. The average 28-day compressive strength results for mixes with 25% Class F
were 85.3 percent of the average 28-day compressive strength of mixes proportioned with 100%
cement.
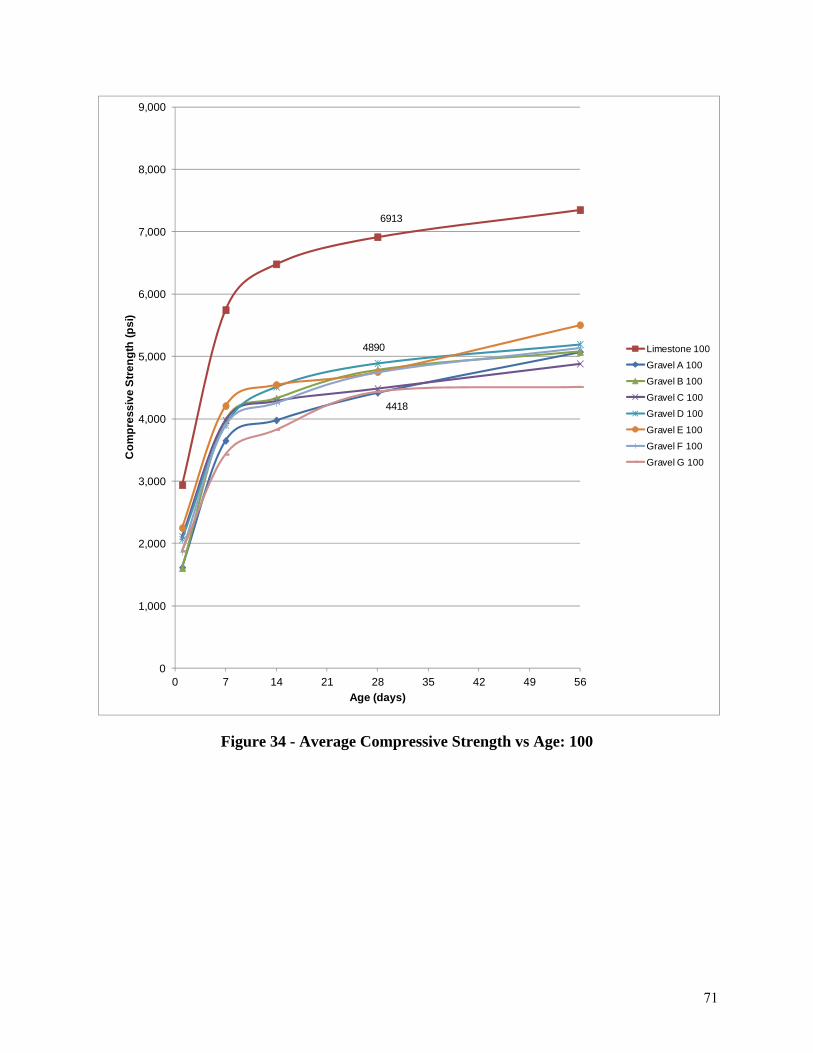
71
Figure 34 - Average Compressive Strength vs Age: 100
6913
4418
4890
0
1,000
2,000
3,000
4,000
5,000
6,000
7,000
8,000
9,000
0 7 14 21 28 35 42 49 56
Com
pres
sive
Stre
ngth
(psi
)
Age (days)
Limestone 100
Gravel A 100
Gravel B 100
Gravel C 100
Gravel D 100
Gravel E 100
Gravel F 100
Gravel G 100
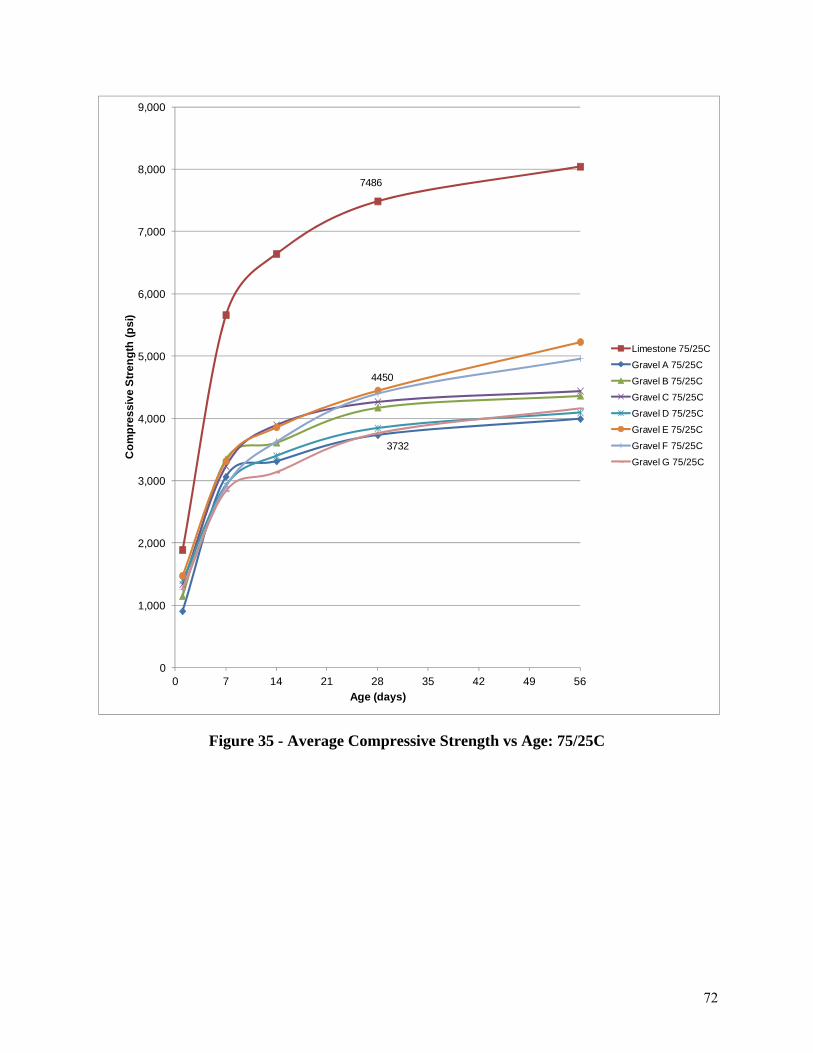
72
Figure 35 - Average Compressive Strength vs Age: 75/25C
7486
3732
4450
0
1,000
2,000
3,000
4,000
5,000
6,000
7,000
8,000
9,000
0 7 14 21 28 35 42 49 56
Com
pres
sive
Stre
ngth
(psi
)
Age (days)
Limestone 75/25C
Gravel A 75/25C
Gravel B 75/25C
Gravel C 75/25C
Gravel D 75/25C
Gravel E 75/25C
Gravel F 75/25C
Gravel G 75/25C

73
Figure 36 - Average Compressive Strength vs Age: 75/25F
6165
3600
4277
0
1,000
2,000
3,000
4,000
5,000
6,000
7,000
8,000
9,000
0 7 14 21 28 35 42 49 56
Com
pres
sive
Stre
ngth
(psi
)
Age (days)
Limestone 75/25F
Gravel A 75/25F
Gravel B 75/25F
Gravel C 75/25F
Gravel D 75/25F
Gravel E 75/25F
Gravel F 75/25F
Gravel G 75/25F

74
Figure 37 - Average Compressive Strength vs Age: Gravel Aggregate
1913
3861
4245
4643
5053
1256
3091
3549
4091
4463
1283
2774
3,341
3962
4462
0
1,000
2,000
3,000
4,000
5,000
6,000
0 7 14 21 28 35 42 49 56
Com
pres
sive
Stre
ngth
(psi
)
Age (days)
100% Cement
75% Cement and 25% Class C Fly Ash
75% Cement and 25% Class F Fly Ash

75
Influence of Cement and Cement Sample on Compressive Strength
General
Figures 38 through 45 present 28-day compressive strength data for each mixture
category as a function of cement and cement sample. These figures were developed to show
compressive strength variability that can be attributed to cement source and cement sample.
Each of these figures, except for Figures 41 and 45, also present 28-day mortar cube strength
data developed from BCD’s laboratory.
Mortar Cube Compressive Strengths
Figures 38, 39, 40, 42, 43, and 44 show that compressive strengths of mortar cubes do not
always indicate concrete compressive strength tends. For example, Figures 39 and 40 show cube
strength decreasing by approximately 10 percent from sample CS-C-2 to CS-C-3. The concrete
strengths for these samples increased by 17.8 percent for the mixes with 75/25C and increased by
22.6 percent for mixes with 75/25 F.
Influence of Cement Source and Sample of Cement Source on Compressive
Strength of Gravel Aggregate Concrete
One of the most interesting points of Figures 38 through 45 is that these figures show the
extent of concrete strength variability when making concrete from the same cement, i.e., same
source and same Type, but different samples. The greatest percent change in concrete
compressive strength that can be attributed to different samples of the same cement was 21.6
percent. The percent change was calculated by taking the lowest compressive strength for each
cement sample, subtracting the highest compressive strength for each cement sample, and then
dividing by the highest compressive strength for the cement sample. This highest percent change
occurred with Cement C in mixes made with 75/25C. This can be seen in Figure 39. A percent
change of 21.3 was calculated for that same cement with 75/25F mixes. This can be seen in
Figure 40. Similar percent change calculations were made for all test ages and all seven cements
used in this research using three samples of each cement taken approximately one month apart.
These percent changes are shown in Table 34. The overall average percent change for all 28-day
compressive strengths of gravel aggregate concrete was 11.8 percent. Therefore, on average, one
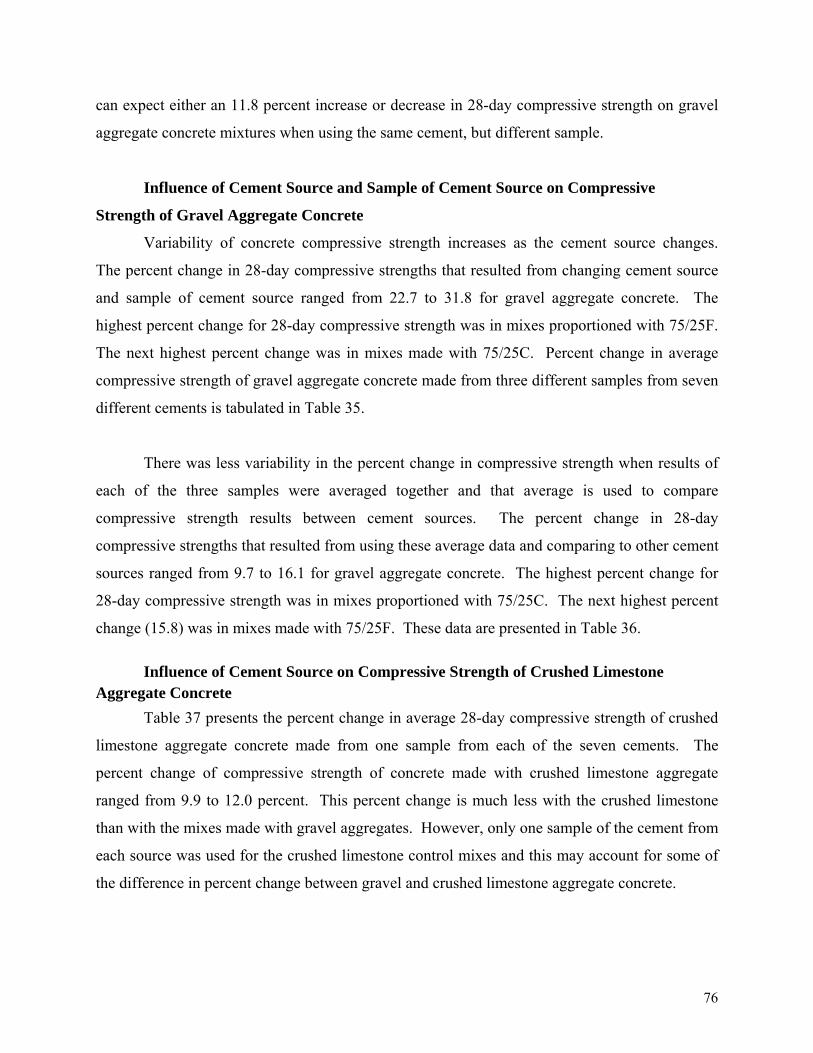
76
can expect either an 11.8 percent increase or decrease in 28-day compressive strength on gravel
aggregate concrete mixtures when using the same cement, but different sample.
Influence of Cement Source and Sample of Cement Source on Compressive
Strength of Gravel Aggregate Concrete
Variability of concrete compressive strength increases as the cement source changes.
The percent change in 28-day compressive strengths that resulted from changing cement source
and sample of cement source ranged from 22.7 to 31.8 for gravel aggregate concrete. The
highest percent change for 28-day compressive strength was in mixes proportioned with 75/25F.
The next highest percent change was in mixes made with 75/25C. Percent change in average
compressive strength of gravel aggregate concrete made from three different samples from seven
different cements is tabulated in Table 35.
There was less variability in the percent change in compressive strength when results of
each of the three samples were averaged together and that average is used to compare
compressive strength results between cement sources. The percent change in 28-day
compressive strengths that resulted from using these average data and comparing to other cement
sources ranged from 9.7 to 16.1 for gravel aggregate concrete. The highest percent change for
28-day compressive strength was in mixes proportioned with 75/25C. The next highest percent
change (15.8) was in mixes made with 75/25F. These data are presented in Table 36.
Influence of Cement Source on Compressive Strength of Crushed Limestone Aggregate Concrete
Table 37 presents the percent change in average 28-day compressive strength of crushed
limestone aggregate concrete made from one sample from each of the seven cements. The
percent change of compressive strength of concrete made with crushed limestone aggregate
ranged from 9.9 to 12.0 percent. This percent change is much less with the crushed limestone
than with the mixes made with gravel aggregates. However, only one sample of the cement from
each source was used for the crushed limestone control mixes and this may account for some of
the difference in percent change between gravel and crushed limestone aggregate concrete.
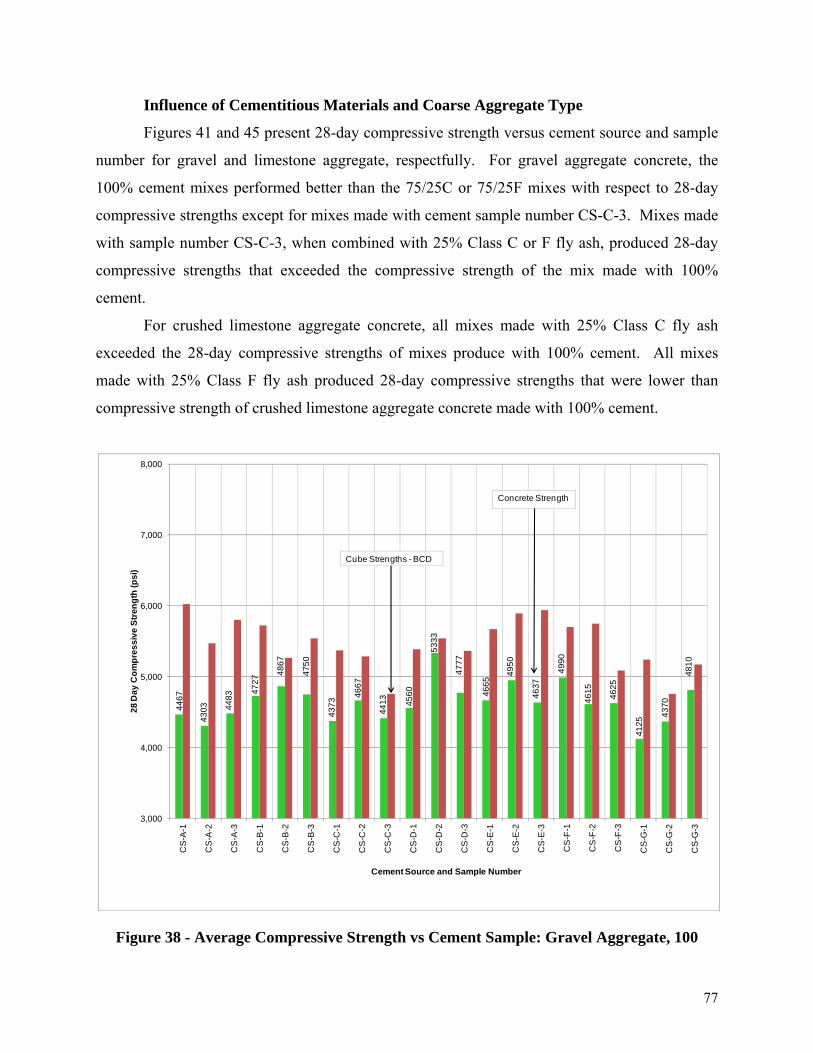
77
Influence of Cementitious Materials and Coarse Aggregate Type
Figures 41 and 45 present 28-day compressive strength versus cement source and sample
number for gravel and limestone aggregate, respectfully. For gravel aggregate concrete, the
100% cement mixes performed better than the 75/25C or 75/25F mixes with respect to 28-day
compressive strengths except for mixes made with cement sample number CS-C-3. Mixes made
with sample number CS-C-3, when combined with 25% Class C or F fly ash, produced 28-day
compressive strengths that exceeded the compressive strength of the mix made with 100%
cement.
For crushed limestone aggregate concrete, all mixes made with 25% Class C fly ash
exceeded the 28-day compressive strengths of mixes produce with 100% cement. All mixes
made with 25% Class F fly ash produced 28-day compressive strengths that were lower than
compressive strength of crushed limestone aggregate concrete made with 100% cement.
Figure 38 - Average Compressive Strength vs Cement Sample: Gravel Aggregate, 100
4467
4303 44
83
4727
4867
4750
4373
4667
4413 45
60
5333
4777
4665
4950
4637
4990
4615 4625
4125
4370
4810
3,000
4,000
5,000
6,000
7,000
8,000
CS
-A-1
CS
-A-2
CS
-A-3
CS
-B-1
CS
-B-2
CS
-B-3
CS
-C-1
CS
-C-2
CS
-C-3
CS
-D-1
CS
-D-2
CS
-D-3
CS
-E-1
CS
-E-2
CS
-E-3
CS
-F-1
CS
-F-2
CS
-F-3
CS
-G-1
CS
-G-2
CS
-G-3
28 D
ay C
ompr
essi
ve S
treng
th (p
si)
Cement Source and Sample Number
Cube Strengths - BCD
Concrete Strength
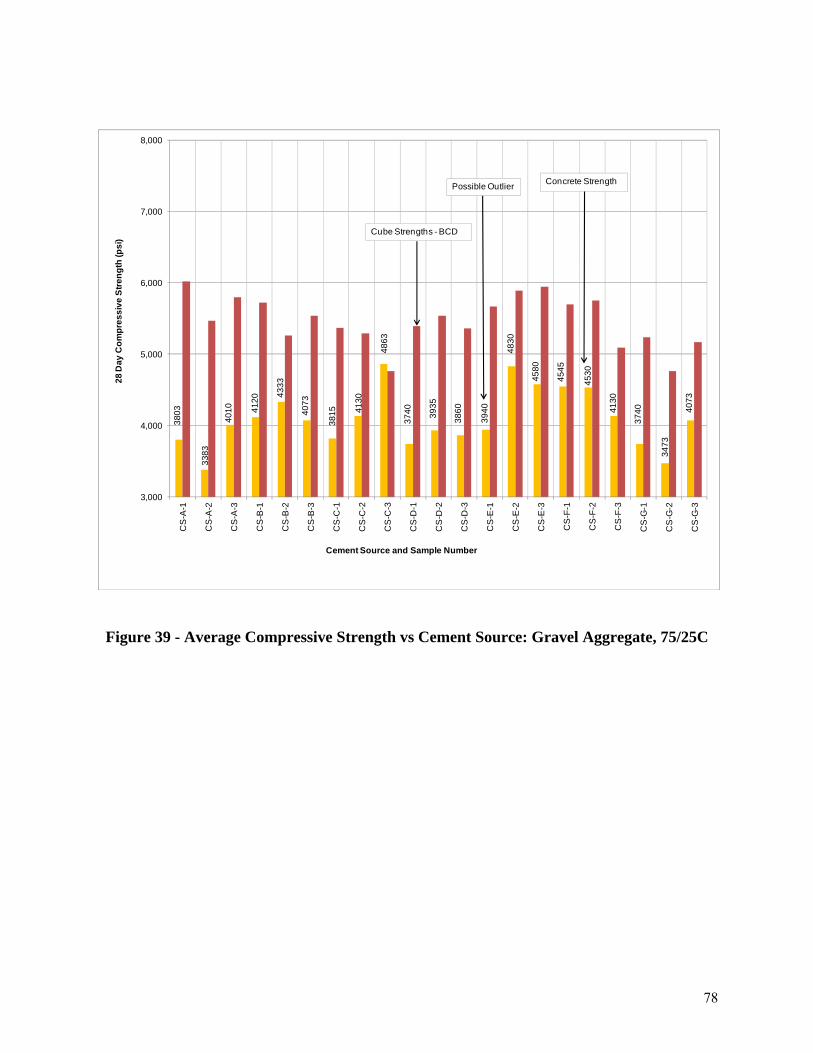
78
Figure 39 - Average Compressive Strength vs Cement Source: Gravel Aggregate, 75/25C
3803
3383
4010 41
20 4333
4073
3815 41
30
4863
3740 39
35
3860
3940
4830
4580
4545
4530
4130
3740
3473
4073
3,000
4,000
5,000
6,000
7,000
8,000
CS
-A-1
CS
-A-2
CS
-A-3
CS
-B-1
CS
-B-2
CS
-B-3
CS
-C-1
CS
-C-2
CS
-C-3
CS
-D-1
CS
-D-2
CS
-D-3
CS
-E-1
CS
-E-2
CS
-E-3
CS
-F-1
CS
-F-2
CS
-F-3
CS
-G-1
CS
-G-2
CS
-G-3
28 D
ay C
ompr
essi
ve S
treng
th (p
si)
Cement Source and Sample Number
Cube Strengths - BCD
Concrete StrengthPossible Outlier

79
Figure 40 - Average Compressive Strength vs Cement Sample: Gravel Aggregates, 75/25F
3910
3360 35
30
4295
4103
3800
3880
4020
4930
3635
4000
3760
3850
4375
4050
4473
4160
3747
3573
3513
4235
3,000
4,000
5,000
6,000
7,000
8,000
CS
-A-1
CS
-A-2
CS
-A-3
CS
-B-1
CS
-B-2
CS
-B-3
CS
-C-1
CS
-C-2
CS
-C-3
CS
-D-1
CS
-D-2
CS
-D-3
CS
-E-1
CS
-E-2
CS
-E-3
CS
-F-1
CS
-F-2
CS
-F-3
CS
-G-1
CS
-G-2
CS
-G-3
28 D
ay C
ompr
essi
ve S
treng
th (p
si)
Cement Source and Sample Number
Cube Strengths - BCD Concrete Strength

80
Figure 41 - Average Compressive Strength vs Cement Sample: Gravel Aggregates, All Mixes
3,000
4,000
5,000
6,000
7,000
8,000
CS-
A-1
CS-
A-2
CS-
A-3
CS-
B-1
CS-
B-2
CS-
B-3
CS
-C-1
CS
-C-2
CS
-C-3
CS
-D-1
CS
-D-2
CS
-D-3
CS-
E-1
CS-
E-2
CS-
E-3
CS
-F-1
CS
-F-2
CS
-F-3
CS
-G-1
CS
-G-2
CS
-G-3
28 D
ay C
ompr
essi
ve S
treng
th (p
si)
Cement Source and Sample Number
100% Cement Possible Outlier
75% Cement 25% Class C Fly Ash
75% Cement 25% Class F Fly Ash

81
Figure 42 - Compressive Strength vs Cement Sample: Crushed Limestone Aggregates, 100
7237
7023
6577
6910
7300
66036740
3,000
4,000
5,000
6,000
7,000
8,000
CS
-A-1
CS
-B-1
CS
-C-1
CS
-D-1
CS
-E-1
CS
-F-1
CS
-G-1
28 D
ay C
ompr
essi
ve S
treng
th (p
si)
Cement Source and Sample Number
Cube Strengths - BCD Concrete Strengths

82
Figure 43 - Compressive Strength vs Cement Sample: Crushed Limestone Aggregates, 75/25C
7920
7277
7657
7133
7470
7737
7210
3,000
4,000
5,000
6,000
7,000
8,000
CS
-A-1
CS
-B-1
CS
-C-1
CS
-D-1
CS
-E-1
CS
-F-1
CS
-G-1
28 D
ay C
ompr
essi
ve S
treng
th (p
si)
Cement Source and Sample Number
Cube Strengths - BCDConcrete Strengths
83
Figure 44 - Compressive Strength vs Cement Sample: Crushed Limestone Aggregates, 75/25F
6573
6023
5783
6350
6103
6387
5933
3,000
4,000
5,000
6,000
7,000
8,000
CS
-A-1
CS
-B-1
CS
-C-1
CS
-D-1
CS
-E-1
CS
-F-1
CS
-G-1
28 D
ay C
ompr
essi
ve S
treng
th (p
si)
Cement Source and Sample Number
Cube Strengths - BCD Concrete Strengths
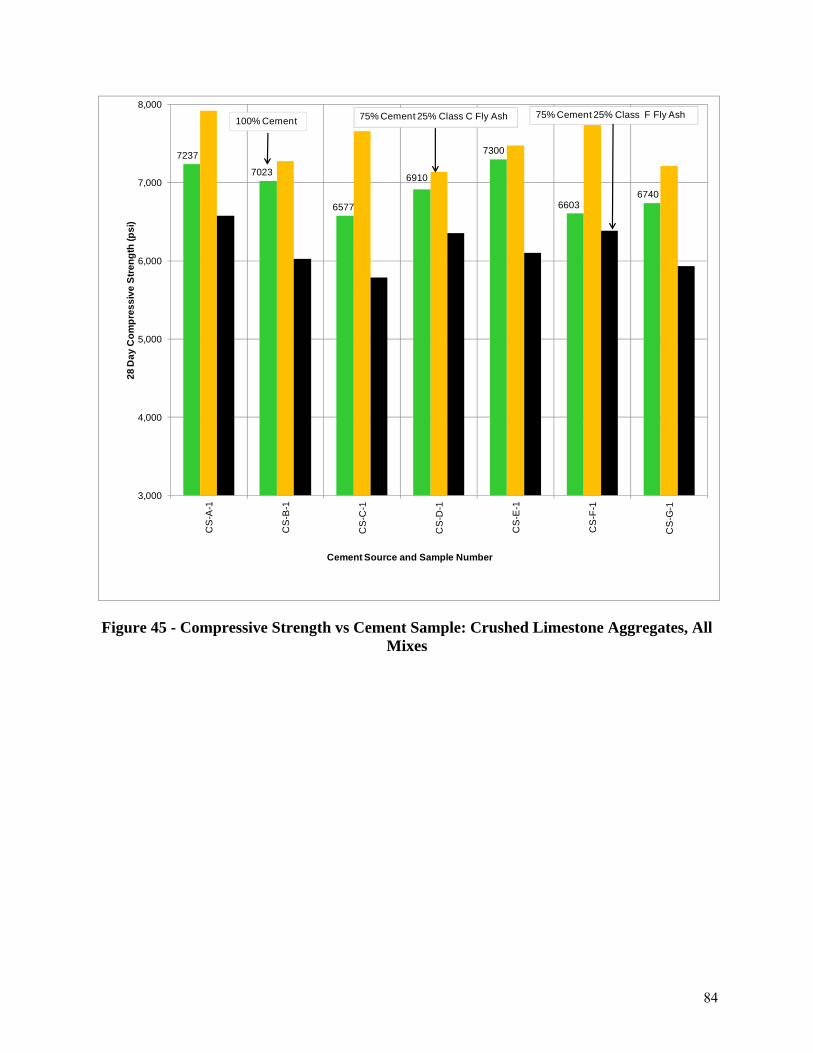
84
Figure 45 - Compressive Strength vs Cement Sample: Crushed Limestone Aggregates, All Mixes
7237
7023
6577
6910
7300
66036740
3,000
4,000
5,000
6,000
7,000
8,000
CS
-A-1
CS
-B-1
CS
-C-1
CS
-D-1
CS
-E-1
CS
-F-1
CS
-G-1
28 D
ay C
ompr
essi
ve S
treng
th (p
si)
Cement Source and Sample Number
100% Cement 75% Cement 25% Class C Fly Ash 75% Cement 25% Class F Fly Ash

85
Table 34 – Maximum Percent Change in Average Compressive Strength of Gravel Aggregate Concrete When Changing Cement Samples
Cement
Percent Cement
Percent Class C Fly Ash
Percent Class F Fly Ash
1 Day 7 Day 14 Day 28 Day 56 Day
A
100 -14.1 -7.3 -7.1 -4.0 -11.5
75 25 -11.0 -9.9 -8.6 -15.6 -16.3
75 25 -7.9 -18.6 -19.7 -14.1 -12.6
B
100 -32.7 -13.7 -7.6 -2.9 -12.6
75 25 -20.5 -1.8 -3.7 -6.0 -1.5
75 25 -37.9 -2.5 -10.5 -11.5 -5.2
C
100 -13.6 -13.4 -9.7 -6.3 -3.0
75 25 -6.8 -16.2 -21.2 -21.6 -12.1
75 25 -5.2 -7.1 -23.0 -21.3 -9.5
D
100 -13.1 -8.1 -9.7 -14.5 -7.6
75 25 -6.5 -3.0 -8.0 -5.0 -7.5
75 25 -10.8 -10.1 -9.4 -9.1 -4.1
E
100 -2.8 -9.8 -9.7 -6.3 -9.9
75 25 -20.9 -19.6 -15.8 -18.4 -5.2
75 25 -13.0 -12.5 -7.1 -12.0 -2.7
F
100 -10.4 -0.8 -3.3 -7.5 -3.0
75 25 -9.1 -22.7 -17.4 -9.1 -5.9
75 25 -10.5 -11.6 -10.3 -16.2 -4.1
G
100 -13.6 -10.9 -19.9 -14.2 -9.9
75 25 -18.6 -8.5 -16.8 -14.7 -16.9
75 25 -22.4 -17.0 -12.5 -17.0 -4.9
Average -14.3 -10.7 -12.0 -11.8 -7.9

86
Table 35 - Maximum Percent Change in Average Compressive Strength of Gravel Aggregate Concrete Based on Changing Both Cement Source and Sample of Cement
Source
Percent Cement
Percent Class C Fly Ash
Percent Class F Fly Ash
1 Day 7 Day 14 Day 28 Day 56 Day
100 -44.4 -26.1 -28.7 -22.7 -25.0
75 25 -49.4 -30.0 -34.1 -30.4 -30.7
75 25 -51.1 -24.7 -40.0 -31.8 -18.2
Table 36 - Maximum Percent Change in Average Compressive Strength of Gravel Aggregate Concrete based on Changing Cement Source
Percent Cement
Percent Class C Fly Ash
Percent Class F Fly Ash
1 Day 7 Day 14 Day 28 Day 56 Day
100 -28.5 -18.5 -15.9 -9.7 -18.0
75 25 -38.7 -15.2 -19.5 -16.1 -23.6
75 25 -37.4 -14.8 -23.9 -15.8 -14.3
Table 37 – Maximum Percent Change in Average Compressive Strength of Crushed Limestone When Changing Cement Source
Percent Cement
Percent Class C Fly Ash
Percent Class F Fly Ash
1 Day 7 Day 14 Day 28 Day 56 Day
100 -20.6 -12.9 -11.5 -9.9 -13.2
75 25 -38.9 -11.1 -3.7 -9.9 -11.9
75 25 -29.1 -8.9 -6.5 -12.0 -14.5
Influence of Cement Source and Cement Sample on Slump
General
The amount of water used in the research mixtures included herein was held constant at
236.88 pcy. This water content was that amount needed to produce a 3 in. slump in the trial
batches used to establish mixture proportions as described in Chapter 3 “Concrete Mixtures.”
Measured slump ranged from a minimum of 1 ¾ to a maximum of 8 ¼ in. The magnitude of the

87
slump was influenced by coarse aggregate type, cement sample, and type of cementitious
materials used in the mixture. Because slump varied with changes in cement source and sample,
this indicates that water demand also changes with cement source and sample.
Gravel Aggregate Concrete and Slump
Figure 46 presents the influence of cement source and sample on slump of gravel
aggregate concrete made with 100% cement. In general, slump changed between a range of ½
in. and 1 in. due to changes in cement samples. The greatest change in slump that can be
attributed to changing cement sample for gravel aggregate concrete proportioned with 100%
cement occurred when changing from sample CS-A-1 to sample CS-A-2. This slump change
was 3 in. The maximum change in slump that can be attributed to changing cement source for
gravel aggregate concrete proportioned with 100% cement was 3 in.
Figure 47 presents the influence of cement source and sample on slump of gravel
aggregate concrete made with 75/25C. In general, slump changed between ¼ in. to 1 ½ in. due
to a change in cement sample. The greatest change in slump that can be attributed to changing
cement samples for gravel aggregate concrete proportioned with 75/25C occurred when
changing from sample CS-E-2 to sample CS-E-3. This slump change was 2 ½ in. The
maximum change in slump that can be attributed to changing cement source for gravel aggregate
concrete proportioned with 75/25C was 4 ½ in.
Figure 48 presents the influence of cement source and sample on slump of gravel
aggregate concrete made with 75/25F. In general, slump changed between ½ in. to 1 ½ in. due to
a change in cement sample. The greatest change in slump that can be attributed to changing
cement samples for gravel aggregate concrete proportioned with 75/25F occurred when changing
from sample CS-A-1 to sample CS-A-2. This slump change was 3 ¾ in. The maximum change
in slump that can be attributed to changing cement source for gravel aggregate concrete
proportioned with 75/25F was 4 ½ in.
Figure 49 presents the influence of cement sample on all gravel aggregate concrete mixes
of this research. In all cases, the slump of these mixtures increased when either Class C of Class

88
F fly ash was used to replace 25 percent of the cement. On average, replacing cement with 25
percent Class C fly ash increased the slump by 2 ½ in. while replacing cement with 25 percent
Class F fly ash increased the slump by 1 ¾ in.
Crushed Limestone Aggregate Concrete and Slump
Only one sample of each of the seven cements was used to proportion the crushed
limestone aggregate control mixtures. Figures 50 through 53 present the influence of cement
source on slump of crushed limestone aggregate concrete. The greatest change in slump that can
be attributed to changing cement source for crushed limestone aggregate concrete proportioned
with 100% cement was 1 ¼ in. The greatest change in slump that can be attributed to changing
cement source for crushed limestone aggregate concrete proportioned with 75/25C was 2 ½ in.
The greatest change in slump that can be attributed to changing cement samples for crushed
limestone aggregate concrete proportioned with 75/25F was 1 ½ in.
Figure 53 presents the influence of cement source on slump for all crushed limestone
aggregate concrete mixes of this research. In all cases, the slump of these mixtures increased
when either Class C of Class F fly ash was used to replace 25 percent of the cement. On
average, replacing cement with 25 percent Class C fly ash increased the slump by 1 ¾ in. while
replacing cement with 25 percent Class F fly ash increased the slump by 1 in.

89
Figure 46 – Influence of Cement Source on Slump of Gravel Aggregate Concrete: 100
2.50
5.50
2.75
5.25
4.50
5.50
3.00
3.50
3.00 3.00
3.50
2.75
3.253.00
2.753.00
3.253.00
4.504.25
3.50
0
1
2
3
4
5
6
7
8
9
CS
-A-1
CS
-A-2
CS
-A-3
CS
-B-1
CS
-B-2
CS
-B-3
CS
-C-1
CS
-C-2
CS
-C-3
CS
-D-1
CS
-D-2
CS
-D-3
CS
-E-1
CS
-E-2
CS
-E-3
CS
-F-1
CS
-F-2
CS
-F-3
CS
-G-1
CS
-G-2
CS
-G-3
Slum
p (in
.)
Cement Source and Sample Number
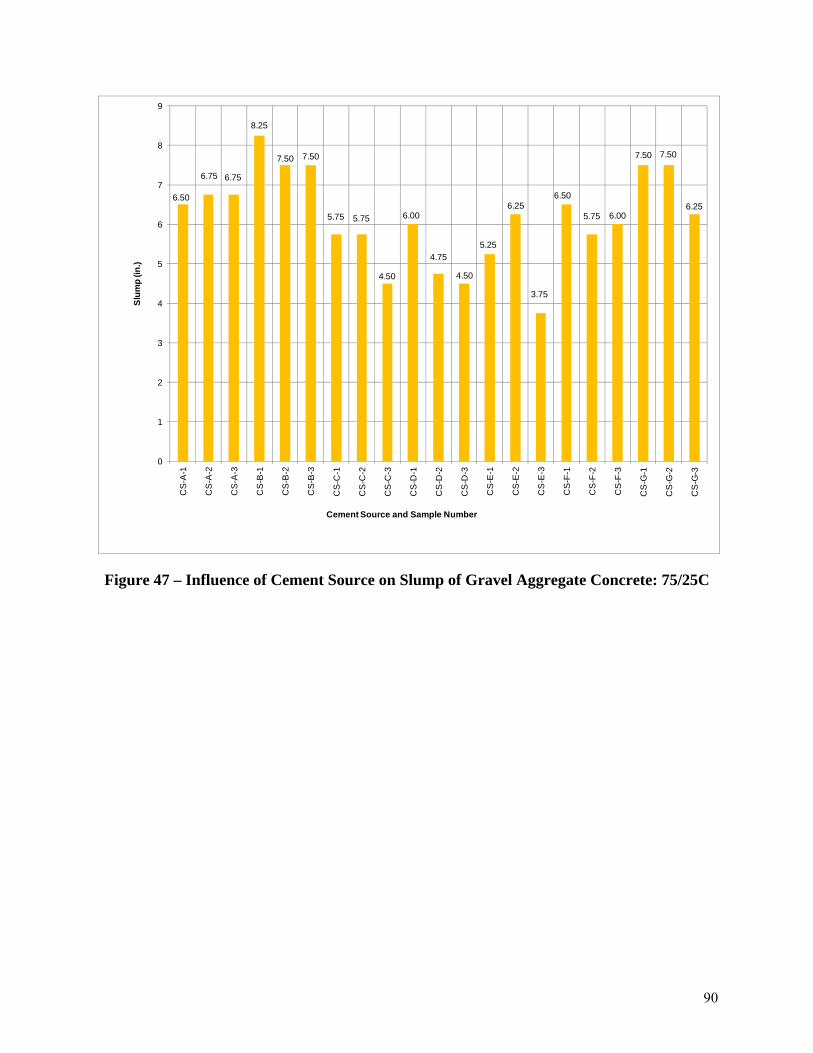
90
Figure 47 – Influence of Cement Source on Slump of Gravel Aggregate Concrete: 75/25C
6.50
6.75 6.75
8.25
7.50 7.50
5.75 5.75
4.50
6.00
4.75
4.50
5.25
6.25
3.75
6.50
5.75 6.00
7.50 7.50
6.25
0
1
2
3
4
5
6
7
8
9
CS
-A-1
CS
-A-2
CS
-A-3
CS
-B-1
CS
-B-2
CS
-B-3
CS
-C-1
CS
-C-2
CS
-C-3
CS
-D-1
CS
-D-2
CS
-D-3
CS
-E-1
CS
-E-2
CS
-E-3
CS
-F-1
CS
-F-2
CS
-F-3
CS
-G-1
CS
-G-2
CS
-G-3
Slu
mp
(in.)
Cement Source and Sample Number
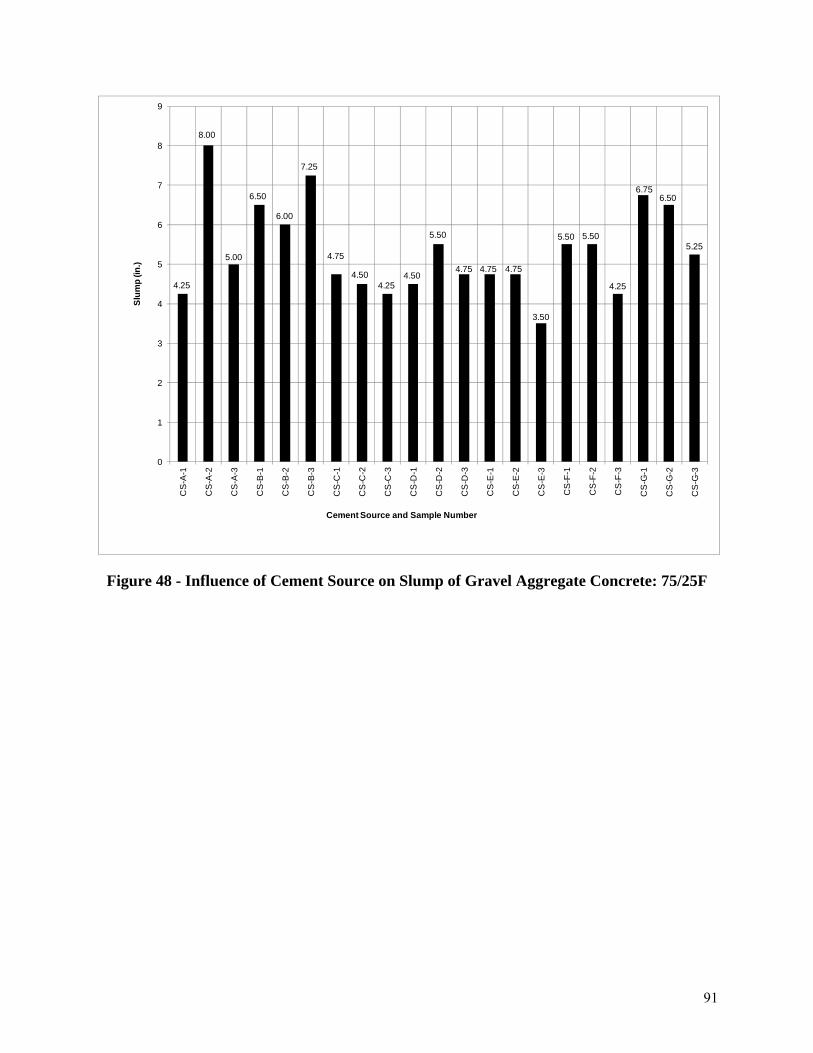
91
Figure 48 - Influence of Cement Source on Slump of Gravel Aggregate Concrete: 75/25F
4.25
8.00
5.00
6.50
6.00
7.25
4.75
4.504.25
4.50
5.50
4.75 4.75 4.75
3.50
5.50 5.50
4.25
6.756.50
5.25
0
1
2
3
4
5
6
7
8
9
CS
-A-1
CS
-A-2
CS
-A-3
CS
-B-1
CS
-B-2
CS
-B-3
CS
-C-1
CS
-C-2
CS
-C-3
CS
-D-1
CS
-D-2
CS
-D-3
CS
-E-1
CS
-E-2
CS
-E-3
CS
-F-1
CS
-F-2
CS
-F-3
CS
-G-1
CS
-G-2
CS
-G-3
Slum
p (in
.)
Cement Source and Sample Number
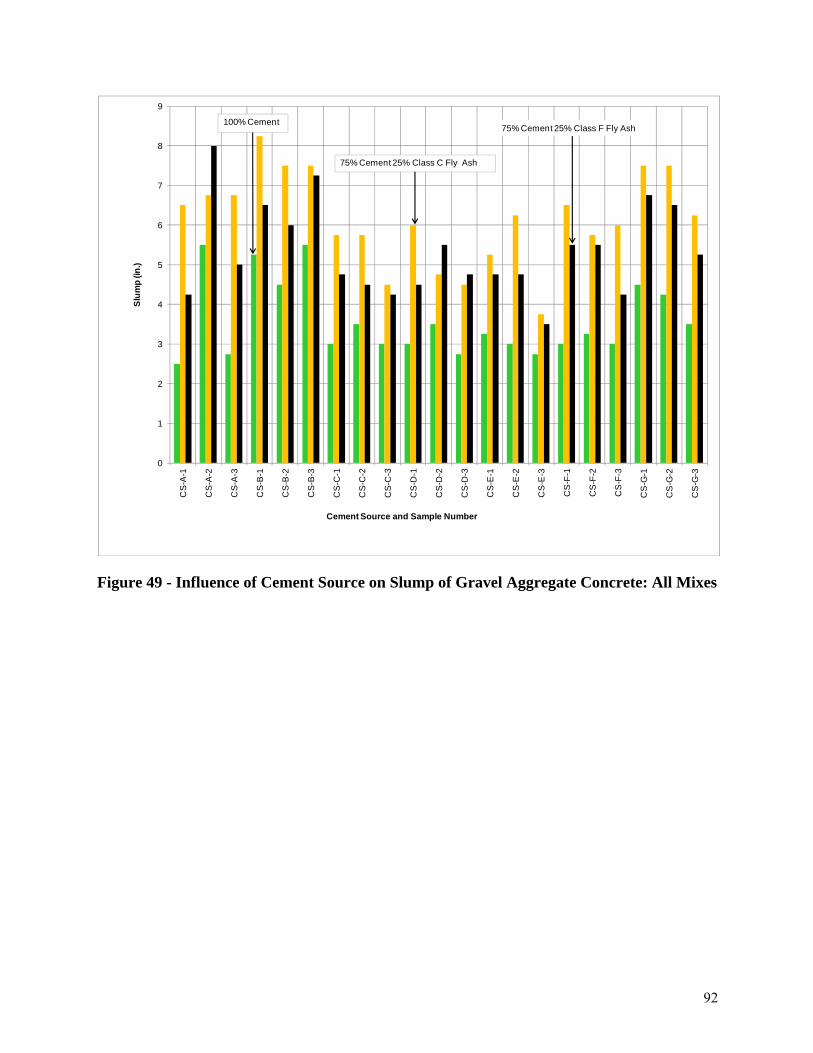
92
Figure 49 - Influence of Cement Source on Slump of Gravel Aggregate Concrete: All Mixes
0
1
2
3
4
5
6
7
8
9
CS
-A-1
CS
-A-2
CS
-A-3
CS
-B-1
CS
-B-2
CS
-B-3
CS
-C-1
CS
-C-2
CS
-C-3
CS
-D-1
CS
-D-2
CS
-D-3
CS
-E-1
CS
-E-2
CS
-E-3
CS
-F-1
CS
-F-2
CS
-F-3
CS
-G-1
CS
-G-2
CS
-G-3
Slu
mp
(in.)
Cement Source and Sample Number
75% Cement 25% Class F Fly Ash100% Cement
75% Cement 25% Class C Fly Ash

93
Figure 50 - Influence of Cement Source on Slump of Crushed Limestone Aggregate Concrete: 100
2.50
3.00
1.75
2.50
1.75 1.752.25
0
1
2
3
4
5
6
7
8
9
CS
-A-1
CS
-B-1
CS
-C-1
CS
-D-1
CS
-E-1
CS
-F-1
CS
-G-1
Slum
p (in
.)
Cement Source and Sample Number
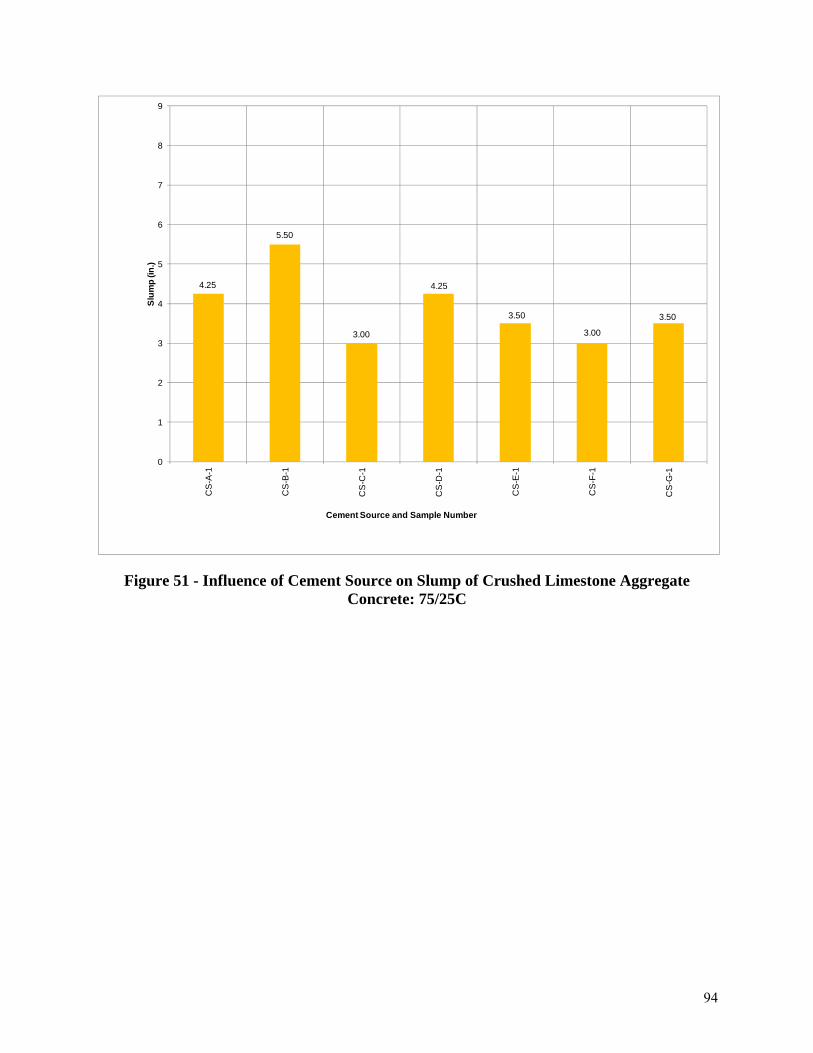
94
Figure 51 - Influence of Cement Source on Slump of Crushed Limestone Aggregate Concrete: 75/25C
4.25
5.50
3.00
4.25
3.50
3.00
3.50
0
1
2
3
4
5
6
7
8
9
CS
-A-1
CS
-B-1
CS
-C-1
CS
-D-1
CS
-E-1
CS
-F-1
CS
-G-1
Slum
p (in
.)
Cement Source and Sample Number

95
Figure 52 - Influence of Cement Source on Slump of Crushed Limestone Aggregate Concrete: 100/25F
3.50
4.00
3.253.00
2.50 2.50
3.50
0
1
2
3
4
5
6
7
8
9
CS
-A-1
CS
-B-1
CS
-C-1
CS
-D-1
CS
-E-1
CS
-F-1
CS
-G-1
Slum
p (in
.)
Cement Source and Sample Number
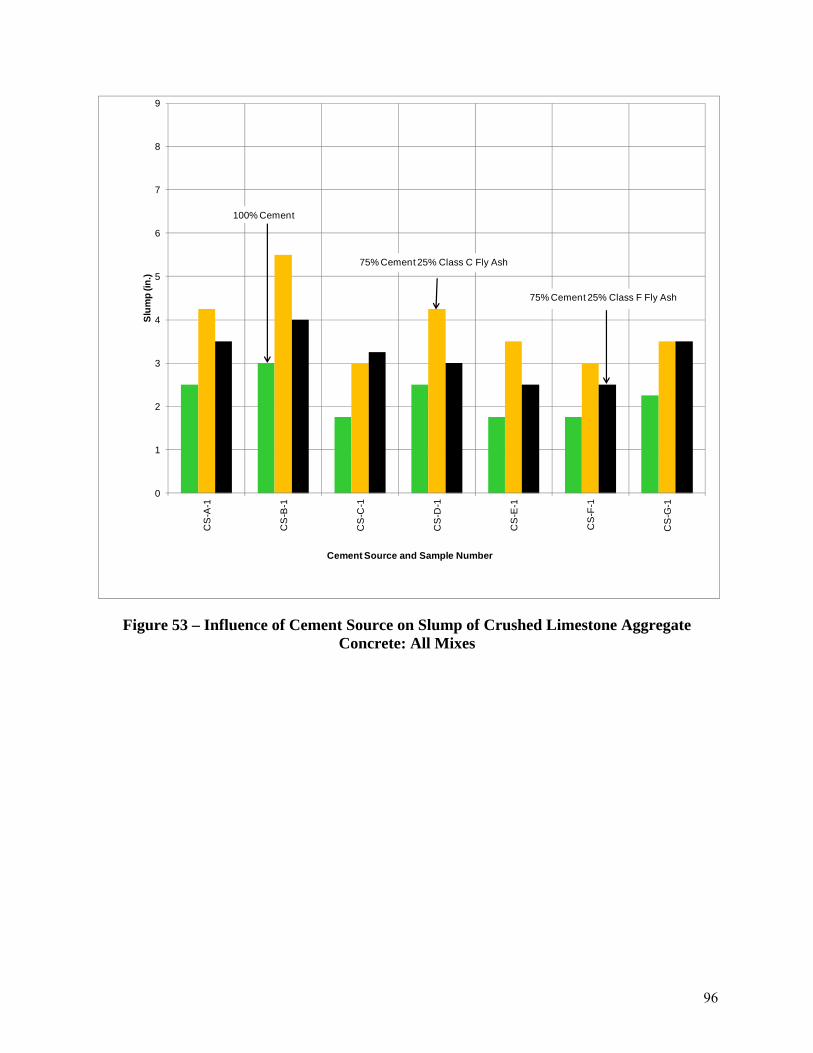
96
Figure 53 – Influence of Cement Source on Slump of Crushed Limestone Aggregate Concrete: All Mixes
0
1
2
3
4
5
6
7
8
9
CS
-A-1
CS
-B-1
CS
-C-1
CS
-D-1
CS
-E-1
CS
-F-1
CS
-G-1
Slum
p (in
.)
Cement Source and Sample Number
100% Cement
75% Cement 25% Class C Fly Ash
75% Cement 25% Class F Fly Ash

97
Chapter 7 – Analysis of Results
General
Analysis of results was performed on mixes separated into categories by aggregate type
including; Mississippi gravel and crushed limestone. These categories were further divided into
three sub-categories related to the cementitious materials including; 100% cement (100), 75%
cement and 25% Class C fly ash (75/25C), and 75% cement and 25% Class F fly ash (75/25F).
These categories were established due to the wide range of compressive strengths obtained from
mixes with identical w/cm ratios and similar mixture proportions.
The compressive strength data of this research shows that gravel aggregate produces
compressive strengths that are lower than similar mixtures with crushed limestone aggregate.
When comparing results of average 28-day compressive strengths from all cement samples,
mixtures proportioned with 100% cement and gravel aggregate had compressive strengths of
67.2 percent of the crushed limestone mixes. Similar results occurred for the 75/25C and 75/25F
gravel aggregate mixes of 54.6 percent and 63.3, respectfully.
Statistical Data for Gravel Aggregate Concrete
Table 38 presents a summary of descriptive statistical data for each category of gravel
aggregate mixes based on all 21 cement samples. The standard deviation for all gravel aggregate
concrete proportioned with 100% cement is 270 psi. The standard deviation increased for
mixtures proportioned with 75/25C and 75/25F to 402 psi and 372 psi, respectfully. These data
show the standard deviation that can be attributed to changing cements and cement samples. In
addition, some of the standard deviation can also be attributed to testing under ideal laboratory
conditions. The author did not attempt to distinguish between these two. However, standard
deviation attributed to testing was minimized in this study because of laboratory procedures
implemented for this research and by evaluating acceptable range of companion cylinder tests as
described in Chapter 6 “Discussion of Results.” These data also show that standard deviation
increases when using fly ash to replace cement.
Coefficient of variability (Cv) is calculated and provided in Table 38 for each category of
gravel aggregate mixture. Cv represents the ratio of the standard deviation to the mean and is
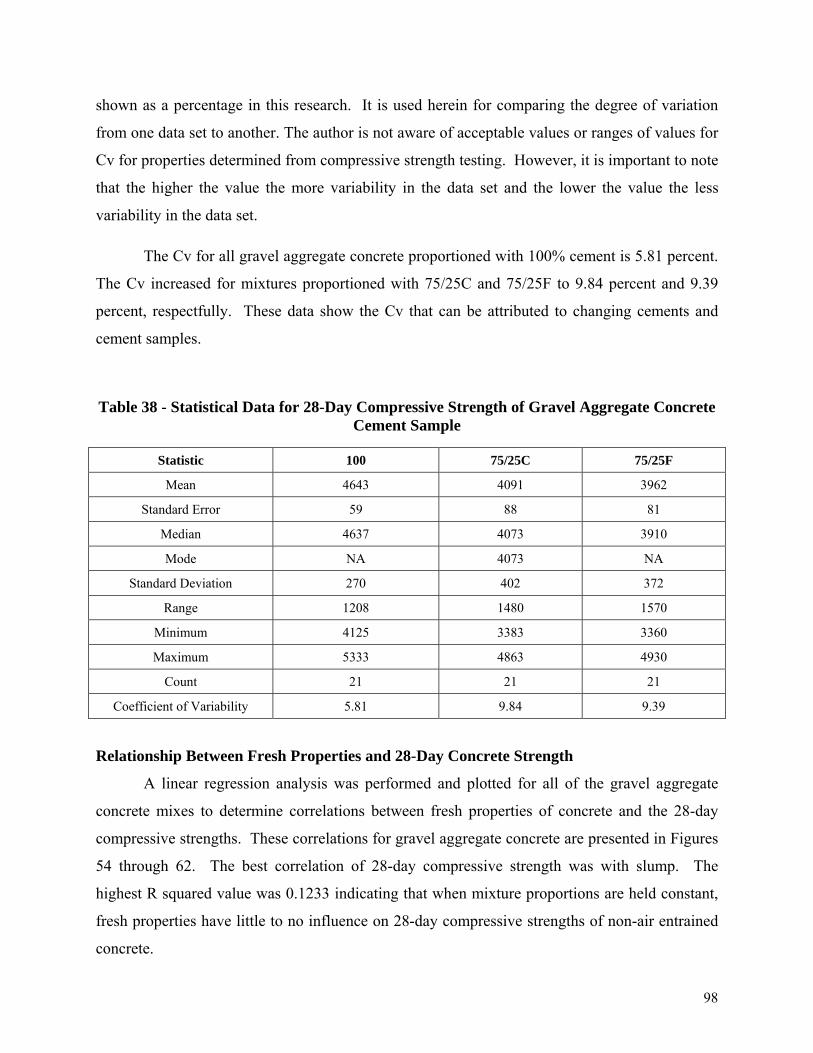
98
shown as a percentage in this research. It is used herein for comparing the degree of variation
from one data set to another. The author is not aware of acceptable values or ranges of values for
Cv for properties determined from compressive strength testing. However, it is important to note
that the higher the value the more variability in the data set and the lower the value the less
variability in the data set.
The Cv for all gravel aggregate concrete proportioned with 100% cement is 5.81 percent.
The Cv increased for mixtures proportioned with 75/25C and 75/25F to 9.84 percent and 9.39
percent, respectfully. These data show the Cv that can be attributed to changing cements and
cement samples.
Table 38 - Statistical Data for 28-Day Compressive Strength of Gravel Aggregate Concrete Cement Sample
Statistic 100 75/25C 75/25F
Mean 4643 4091 3962
Standard Error 59 88 81
Median 4637 4073 3910
Mode NA 4073 NA
Standard Deviation 270 402 372
Range 1208 1480 1570
Minimum 4125 3383 3360
Maximum 5333 4863 4930
Count 21 21 21
Coefficient of Variability 5.81 9.84 9.39
Relationship Between Fresh Properties and 28-Day Concrete Strength A linear regression analysis was performed and plotted for all of the gravel aggregate
concrete mixes to determine correlations between fresh properties of concrete and the 28-day
compressive strengths. These correlations for gravel aggregate concrete are presented in Figures
54 through 62. The best correlation of 28-day compressive strength was with slump. The
highest R squared value was 0.1233 indicating that when mixture proportions are held constant,
fresh properties have little to no influence on 28-day compressive strengths of non-air entrained
concrete.
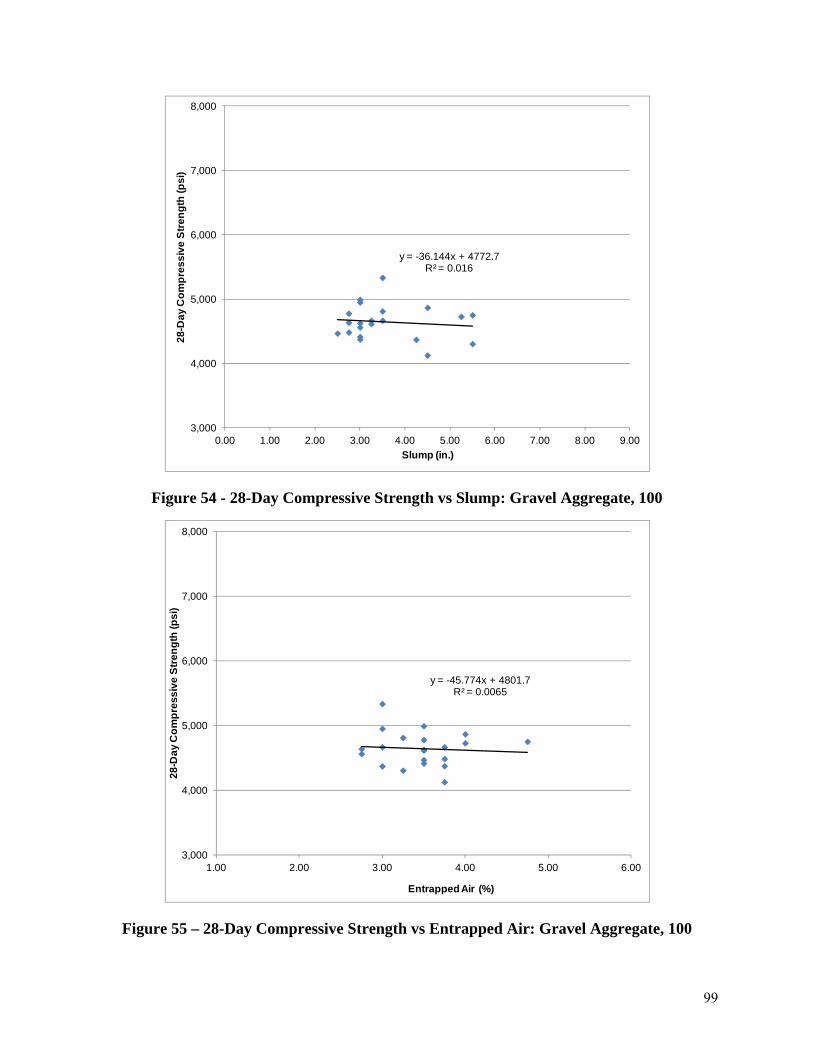
99
Figure 54 - 28-Day Compressive Strength vs Slump: Gravel Aggregate, 100
Figure 55 – 28-Day Compressive Strength vs Entrapped Air: Gravel Aggregate, 100
y = -36.144x + 4772.7R² = 0.016
3,000
4,000
5,000
6,000
7,000
8,000
0.00 1.00 2.00 3.00 4.00 5.00 6.00 7.00 8.00 9.00
28-D
ay C
ompr
essi
ve S
tren
gth
(psi
)
Slump (in.)
y = -45.774x + 4801.7R² = 0.0065
3,000
4,000
5,000
6,000
7,000
8,000
1.00 2.00 3.00 4.00 5.00 6.00
28-D
ay C
ompr
essi
ve S
tren
gth
(psi
)
Entrapped Air (%)

100
Figure 56 – 28-Day Compressive Strength vs Unit Weight: Gravel Aggregate, 100
Figure 57 – 28-Day Compressive Strength vs Slump: Gravel Aggregate, 75/25C
y = 90.487x - 8193.3R² = 0.0498
3,000
4,000
5,000
6,000
7,000
8,000
140.0 142.0 144.0 146.0 148.0 150.0 152.0
28-D
ay C
ompr
essi
ve S
treng
th (p
si)
Unit Weight (pcf)
y = -111.56x + 4777.5R² = 0.1045
3,000
4,000
5,000
6,000
7,000
8,000
0.00 1.00 2.00 3.00 4.00 5.00 6.00 7.00 8.00 9.00
28-D
ay C
ompr
essi
ve S
treng
th (p
si)
Slump (in.)

101
Figure 58 – 28-Day Compressive Strength vs Entrapped Air: Gravel Aggregate, 75/25C
Figure 59 – 28-Day Compressive Strength vs Unit Weight: Gravel Aggregate, 75/25C
y = 2.2735x + 4085.6R² = 3E-06
3,000
4,000
5,000
6,000
7,000
8,000
1.00 2.00 3.00 4.00 5.00 6.00
28-D
ay C
ompr
essi
ve S
treng
th (p
si)
Entrapped Air (%)
y = 50.684x - 3153.7R² = 0.004
3,000
4,000
5,000
6,000
7,000
8,000
140.0 142.0 144.0 146.0 148.0 150.0 152.0
28-D
ay C
ompr
essi
ve S
treng
th (p
si)
Unit Weight (pcf)

102
Figure 60 – 28-Day Compressive Strength vs Slump: Gravel Aggregate, 75/25F
Figure 61 – 28-Day Compressive Strength vs Entrapped Air: Gravel Aggregate, 75/25F
y = -115.06x + 4575.5R² = 0.1233
3,000
4,000
5,000
6,000
7,000
8,000
0.00 1.00 2.00 3.00 4.00 5.00 6.00 7.00 8.00 9.00
28-D
ay C
ompr
essi
ve S
treng
th (p
si)
Slump (in.)
y = -146.72x + 4271.1R² = 0.0083
3,000
4,000
5,000
6,000
7,000
8,000
1.00 2.00 3.00 4.00 5.00 6.00
28-D
ay C
ompr
essi
ve S
treng
th (p
si)
Entrapped Air (%)

103
Figure 62 – 28-Day Compressive Strength vs Unit Weight: Gravel Aggregate 75/25F
Relationship Between 28-Day Mortar Cube Strength and 28-Day Concrete Strength A linear regression analysis was performed and plotted for all of the gravel aggregate
concrete mixes to determined correlations between 28-day mortar cube strength and the 28-day
compressive strengths. These correlations for gravel aggregate concrete are presented in Figures
63 through 65. These data indicate that 28-day mortar cube strengths have little to no correlation
with 28-day compressive strengths of gravel aggregate concrete.
y = -250.2x + 39514R² = 0.0489
3,000
4,000
5,000
6,000
7,000
8,000
140.0 142.0 144.0 146.0 148.0 150.0 152.0
28-D
ay C
ompr
essi
ve S
tren
gth
Unit Weight (pcf)

104
Figure 63 – 28-Day Compressive Strength vs 28-Day Cube Strength: Gravel Aggregate, 100
y = 0.2161x + 3462.5R² = 0.0787
3,000
4,000
5,000
6,000
7,000
8,000
4,500 5,000 5,500 6,000 6,500
28-D
ay C
ompr
essi
ve S
treng
th (p
si)
28-Day Cube Strength (psi)

105
Figure 64 – 28-Day Compressive Strength vs 28-Day Cube Strength: Gravel Aggregate, 75/25C
Figure 65 – 28-Day Compressive Strength vs Cube Strength: Gravel Aggregates, 75/25F
y = 0.217x + 2905.3R² = 0.0357
3,000
4,000
5,000
6,000
7,000
8,000
4,500 5,000 5,500 6,000 6,500 7,000
28-D
ay C
ompr
essi
ve S
treng
th (p
si)
28-Day Cube Strength (psi)
y = 0.0024x + 3948.7R² = 5E-06
3,000
4,000
5,000
6,000
7,000
8,000
4,500 5,000 5,500 6,000 6,500 7,000
28-D
ay C
ompr
essi
ve S
treng
th (p
si)
28-Day Cube Strength (psi)
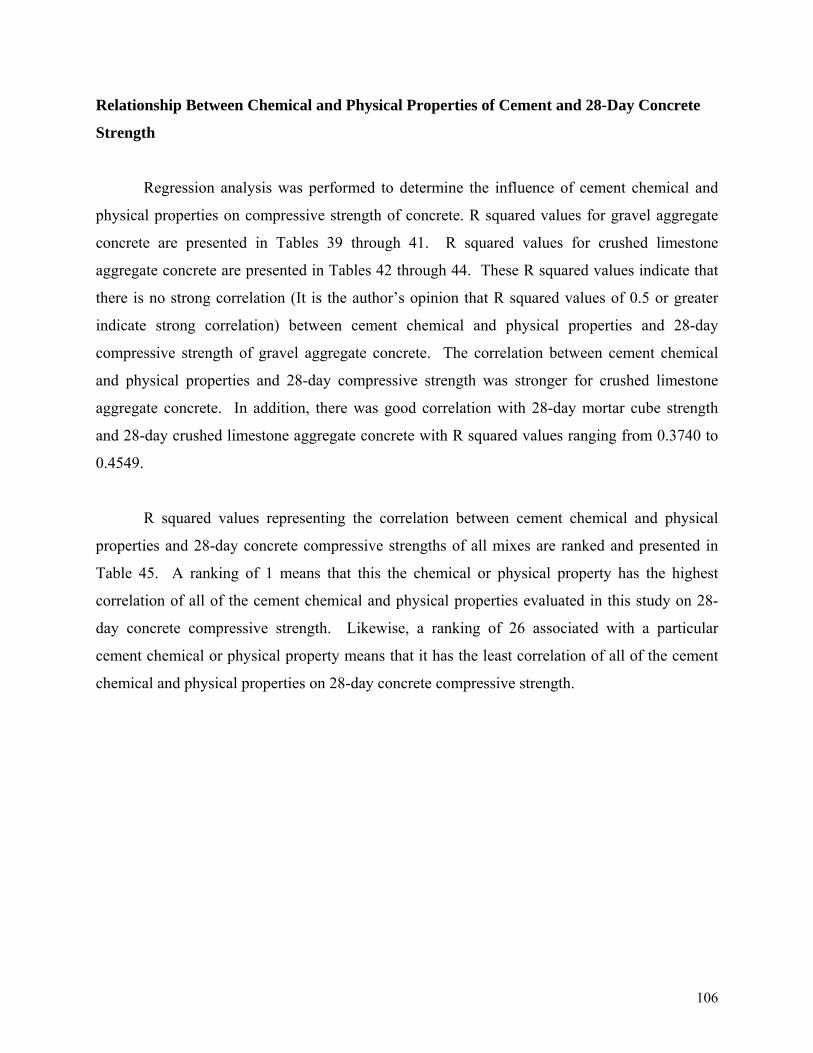
106
Relationship Between Chemical and Physical Properties of Cement and 28-Day Concrete
Strength
Regression analysis was performed to determine the influence of cement chemical and
physical properties on compressive strength of concrete. R squared values for gravel aggregate
concrete are presented in Tables 39 through 41. R squared values for crushed limestone
aggregate concrete are presented in Tables 42 through 44. These R squared values indicate that
there is no strong correlation (It is the author’s opinion that R squared values of 0.5 or greater
indicate strong correlation) between cement chemical and physical properties and 28-day
compressive strength of gravel aggregate concrete. The correlation between cement chemical
and physical properties and 28-day compressive strength was stronger for crushed limestone
aggregate concrete. In addition, there was good correlation with 28-day mortar cube strength
and 28-day crushed limestone aggregate concrete with R squared values ranging from 0.3740 to
0.4549.
R squared values representing the correlation between cement chemical and physical
properties and 28-day concrete compressive strengths of all mixes are ranked and presented in
Table 45. A ranking of 1 means that this the chemical or physical property has the highest
correlation of all of the cement chemical and physical properties evaluated in this study on 28-
day concrete compressive strength. Likewise, a ranking of 26 associated with a particular
cement chemical or physical property means that it has the least correlation of all of the cement
chemical and physical properties on 28-day concrete compressive strength.
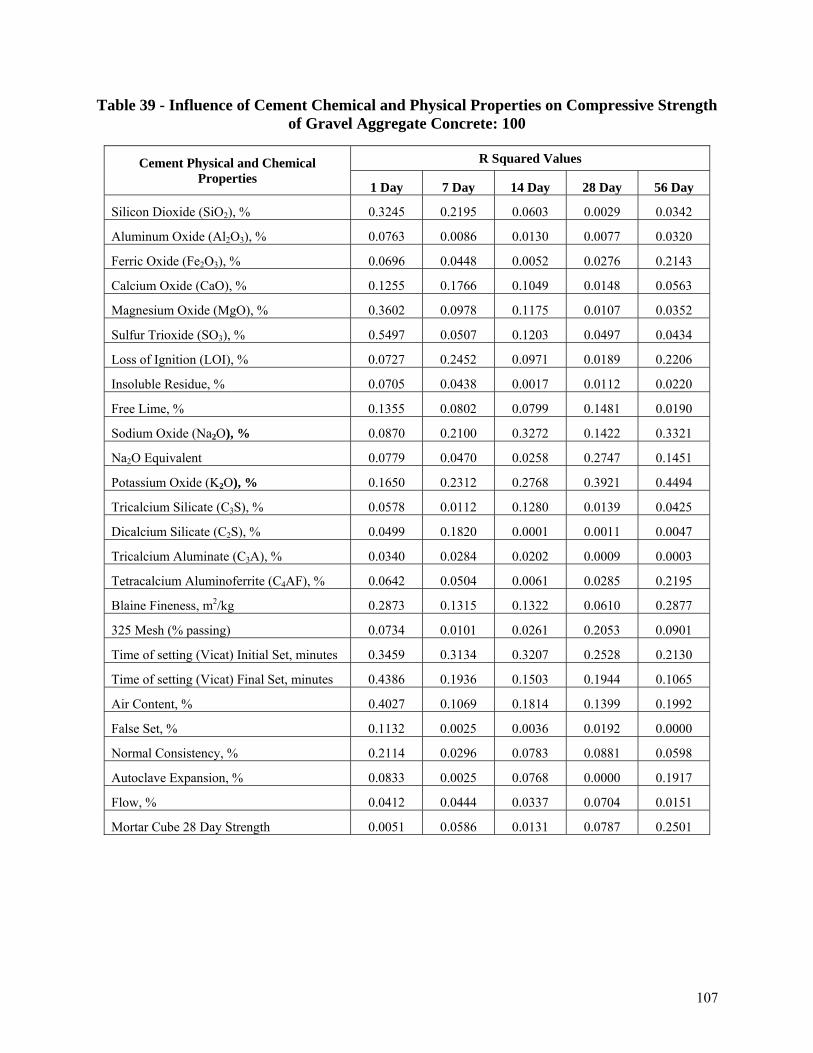
107
Table 39 - Influence of Cement Chemical and Physical Properties on Compressive Strength of Gravel Aggregate Concrete: 100
Cement Physical and Chemical Properties
R Squared Values
1 Day 7 Day 14 Day 28 Day 56 Day
Silicon Dioxide (SiO2), % 0.3245 0.2195 0.0603 0.0029 0.0342
Aluminum Oxide (Al2O3), % 0.0763 0.0086 0.0130 0.0077 0.0320
Ferric Oxide (Fe2O3), % 0.0696 0.0448 0.0052 0.0276 0.2143
Calcium Oxide (CaO), % 0.1255 0.1766 0.1049 0.0148 0.0563
Magnesium Oxide (MgO), % 0.3602 0.0978 0.1175 0.0107 0.0352
Sulfur Trioxide (SO3), % 0.5497 0.0507 0.1203 0.0497 0.0434
Loss of Ignition (LOI), % 0.0727 0.2452 0.0971 0.0189 0.2206
Insoluble Residue, % 0.0705 0.0438 0.0017 0.0112 0.0220
Free Lime, % 0.1355 0.0802 0.0799 0.1481 0.0190
Sodium Oxide (Na2O), % 0.0870 0.2100 0.3272 0.1422 0.3321
Na2O Equivalent 0.0779 0.0470 0.0258 0.2747 0.1451
Potassium Oxide (K2O), % 0.1650 0.2312 0.2768 0.3921 0.4494
Tricalcium Silicate (C3S), % 0.0578 0.0112 0.1280 0.0139 0.0425
Dicalcium Silicate (C2S), % 0.0499 0.1820 0.0001 0.0011 0.0047
Tricalcium Aluminate (C3A), % 0.0340 0.0284 0.0202 0.0009 0.0003
Tetracalcium Aluminoferrite (C4AF), % 0.0642 0.0504 0.0061 0.0285 0.2195
Blaine Fineness, m2/kg 0.2873 0.1315 0.1322 0.0610 0.2877
325 Mesh (% passing) 0.0734 0.0101 0.0261 0.2053 0.0901
Time of setting (Vicat) Initial Set, minutes 0.3459 0.3134 0.3207 0.2528 0.2130
Time of setting (Vicat) Final Set, minutes 0.4386 0.1936 0.1503 0.1944 0.1065
Air Content, % 0.4027 0.1069 0.1814 0.1399 0.1992
False Set, % 0.1132 0.0025 0.0036 0.0192 0.0000
Normal Consistency, % 0.2114 0.0296 0.0783 0.0881 0.0598
Autoclave Expansion, % 0.0833 0.0025 0.0768 0.0000 0.1917
Flow, % 0.0412 0.0444 0.0337 0.0704 0.0151
Mortar Cube 28 Day Strength 0.0051 0.0586 0.0131 0.0787 0.2501

108
Table 40 - Influence of Cement Chemical and Physical Properties on Compressive Strength of Gravel Aggregate Concrete: 75/25C
Cement Physical and Chemical Properties
R Squared Values
1 Day 7 Day 14 Day 28 Day 56 Day
Silicon Dioxide (SiO2), % 0.4052 0.1272 0.4302 0.3523 0.4089
Aluminum Oxide (Al2O3), % 0.0381 0.0019 0.1025 0.0093 0.0197
Ferric Oxide (Fe2O3), % 0.1497 0.0884 0.0375 0.0292 0.0403
Calcium Oxide (CaO), % 0.0217 0.0723 0.1037 0.0000 0.0030
Magnesium Oxide (MgO), % 0.1380 0.0150 0.0810 0.0000 0.0000
Sulfur Trioxide (SO3), % 0.5271 0.0163 0.0353 0.0596 0.0553
Loss of Ignition (LOI), % 0.0992 0.2015 0.2228 0.2525 0.5462
Insoluble Residue, % 0.0024 0.1272 0.4302 0.3523 0.4089
Free Lime, % 0.1418 0.0143 0.2275 0.0887 0.0059
Sodium Oxide (Na2O), % 0.0711 0.0902 0.0340 0.0001 0.0001
Na2O Equivalent 0.1737 0.0043 0.0381 0.2082 0.3151
Potassium Oxide (K2O), % 0.2385 0.0674 0.0716 0.1012 0.1574
Tricalcium Silicate (C3S), % 0.0017 0.0604 0.1873 0.0449 0.0160
Dicalcium Silicate (C2S), % 0.1627 0.1967 0.4497 0.2515 0.2867
Tricalcium Aluminate (C3A), % 0.0029 0.0226 0.1618 0.0261 0.0059
Tetracalcium Aluminoferrite (C4AF), % 0.1435 0.0954 0.0402 0.0310 0.0449
Blaine Fineness, m2/kg 0.2647 0.0491 0.1139 0.2016 0.4498
325 Mesh (% passing) 0.1968 0.0018 0.0056 0.0270 0.1708
Time of setting (Vicat) Initial Set, minutes 0.3093 0.0031 0.1440 0.1792 0.2269
Time of setting (Vicat) Final Set, minutes 0.5001 0.0001 0.0716 0.2055 0.3013
Air Content, % 0.3642 0.0001 0.0054 0.1381 0.2730
False Set, % 0.2707 0.0673 0.0071 0.0677 0.1293
Normal Consistency, % 0.1788 0.0005 0.0307 0.0334 0.1331
Autoclave Expansion, % 0.0180 0.0257 0.0008 0.0779 0.1528
Flow, % 0.0252 0.0500 0.1674 0.0273 0.0000
Mortar Cube 28 Day Strength 0.0118 0.1879 0.0050 0.0357 0.0491

109
Table 41 - Influence of Cement Chemical and Physical Properties on Compressive Strength of Gravel Aggregate Concrete: 75/25F
Cement Physical and Chemical Properties
R Squared Values
1 Day 7 Day 14 Day 28 Day 56 Day
Silicon Dioxide (SiO2), % 0.1875 0.1523 0.1865 0.2846 0.3173
Aluminum Oxide (Al2O3), % 0.0051 0.0463 0.1568 0.0943 0.0003
Ferric Oxide (Fe2O3), % 0.1239 0.0869 0.0485 0.0084 0.0408
Calcium Oxide (CaO), % 0.0072 0.1104 0.1466 0.0008 0.1128
Magnesium Oxide (MgO), % 0.0487 0.0386 0.1270 0.0004 0.0856
Sulfur Trioxide (SO3), % 0.1332 0.0048 0.0480 0.0590 0.1573
Loss of Ignition (LOI), % 0.0946 0.0881 0.0478 0.0683 0.3195
Insoluble Residue, % 0.0082 0.0227 0.0148 0.0005 0.0874
Free Lime, % 0.0125 0.1058 0.3393 0.3084 0.2390
Sodium Oxide (Na2O), % 0.0797 0.0443 0.0582 0.0054 0.0978
Na2O Equivalent 0.0526 0.0083 0.0008 0.1336 0.1064
Potassium Oxide (K2O), % 0.1417 0.0068 0.0202 0.0371 0.1951
Tricalcium Silicate (C3S), % 0.0060 0.1702 0.0776 0.0703 0.0522
Dicalcium Silicate (C2S), % 0.0903 0.2655 0.1686 0.2013 0.2762
Tricalcium Aluminate (C3A), % 0.0035 0.1099 0.2453 0.1251 0.0078
Tetracalcium Aluminoferrite (C4AF), % 0.1225 0.0891 0.0473 0.0087 0.0435
Blaine Fineness, m2/kg 0.2375 0.0142 0.0337 0.0701 0.2519
325 Mesh (% passing) 0.1418 0.0360 0.0593 0.0015 0.0652
Time of setting (Vicat) Initial Set, minutes 0.0780 0.0022 0.1415 0.1401 0.2159
Time of setting (Vicat) Final Set, minutes 0.1750 0.0035 0.0678 0.1335 0.2546
Air Content, % 0.1224 0.0416 0.0000 0.0369 0.1824
False Set, % 0.1462 0.1612 0.0568 0.0284 0.0024
Normal Consistency, % 0.0368 0.0612 0.0003 0.0239 0.2146
Autoclave Expansion, % 0.0798 0.0078 0.0327 0.0030 0.0713
Flow, % 0.0847 0.0748 0.3699 0.0578 0.1485
Mortar Cube 28 Day Strength 0.0072 0.0728 0.0079 0.0000 0.1192

110
Table 42 - Influence of Cement Chemical and Physical Properties on Compressive Strength of Crushed Limestone Aggregate Concrete: 100
Cement Physical and Chemical Properties
R Squared Values
1 Day 7 Day 14 Day 28 Day 56 Day
Silicon Dioxide (SiO2), % 0.4293 0.0132 0.0004 0.0416 0.0053
Aluminum Oxide (Al2O3), % 0.4293 0.0640 0.0004 0.0416 0.0053
Ferric Oxide (Fe2O3), % 0.2560 0.2859 0.5687 0.3828 0.6185
Calcium Oxide (CaO), % 0.0440 0.1622 0.3009 0.4198 0.1990
Magnesium Oxide (MgO), % 0.4601 0.0016 0.0136 0.0238 0.0008
Sulfur Trioxide (SO3), % 0.8363 0.3016 0.1838 0.3128 0.2800
Loss of Ignition (LOI), % 0.0740 0.2239 0.5268 0.3428 0.6090
Insoluble Residue, % 0.0011 0.1441 0.5180 0.3513 0.4900
Free Lime, % 0.1753 0.0048 0.0047 0.0923 0.0008
Sodium Oxide (Na2O), % 0.1426 0.1862 0.2870 0.3034 0.2170
Na2O Equivalent 0.0242 0.0347 0.0440 0.0036 0.0260
Potassium Oxide (K2O), % 0.0418 0.0414 0.3108 0.1572 0.2131
Tricalcium Silicate (C3S), % 0.2252 0.3651 0.2145 0.5440 0.1887
Dicalcium Silicate (C2S), % 0.0306 0.1562 0.3943 0.3095 0.3773
Tricalcium Aluminate (C3A), % 0.4676 0.0009 0.0813 0.2005 0.0117
Tetracalcium Aluminoferrite (C4AF), % 0.2596 0.2903 0.5863 0.3949 0.6357
Blaine Fineness, m2/kg 0.0209 0.1746 0.2958 0.1932 0.4100
325 Mesh (% passing) 0.0382 0.0131 0.0231 0.0159 0.0397
Time of setting (Vicat) Initial Set, minutes 0.4345 0.0056 0.0000 0.0818 0.0072
Time of setting (Vicat) Final Set, minutes 0.7454 0.0949 0.0234 0.1398 0.0321
Air Content, % 0.0037 0.3027 0.0353 0.0089 0.0024
False Set, % 0.2419 0.1707 0.4642 0.5773 0.2833
Normal Consistency, % 0.0179 0.0047 0.1256 0.0872 0.0809
Autoclave Expansion, % 0.0181 0.1942 0.3070 0.4390 0.2439
Flow, % 0.0050 0.1148 0.2228 0.0973 0.2610
Mortar Cube 28 Day Strength 0.3832 0.3586 0.4870 0.3740 0.5917

111
Table 43 - Influence of Cement Chemical and Physical Properties on Compressive Strength of Crushed Limestone Aggregate Concrete: 75/25C
Cement Physical and Chemical Properties
R Squared Values
1 Day 7 Day 14 Day 28 Day 56 Day
Silicon Dioxide (SiO2), % 0.5941 0.0457 0.0290 0.0008 0.1519
Aluminum Oxide (Al2O3), % 0.6114 0.1668 0.0289 0.0292 0.0404
Ferric Oxide (Fe2O3), % 0.1989 0.7529 0.0126 0.5610 0.6341
Calcium Oxide (CaO), % 0.0072 0.0484 0.4843 0.0060 0.0731
Magnesium Oxide (MgO), % 0.3223 0.2642 0.4051 0.0146 0.2443
Sulfur Trioxide (SO3), % 0.9415 0.1362 0.0934 0.0103 0.2515
Loss of Ignition (LOI), % 0.0205 0.1203 0.0157 0.0038 0.0049
Insoluble Residue, % 0.0053 0.0215 0.1335 0.0026 0.0072
Free Lime, % 0.2049 0.0830 0.0688 0.5957 0.1992
Sodium Oxide (Na2O), % 0.0927 0.0050 0.5082 0.0488 0.1570
Na2O Equivalent 0.0215 0.3445 0.0138 0.0076 0.0158
Potassium Oxide (K2O), % 0.1226 0.1707 0.2635 0.0276 0.0768
Tricalcium Silicate (C3S), % 0.4681 0.0039 0.0916 0.0334 0.0041
Dicalcium Silicate (C2S), % 0.0454 0.0028 0.2530 0.0195 0.1023
Tricalcium Aluminate (C3A), % 0.3775 0.0019 0.0548 0.2591 0.0211
Tetracalcium Aluminoferrite (C4AF), % 0.1990 0.7504 0.0113 0.5527 0.6246
Blaine Fineness, m2/kg 0.0029 0.0094 0.0087 0.0107 0.0123
325 Mesh (% passing) 0.0058 0.0002 0.0011 0.3462 0.1570
Time of setting (Vicat) Initial Set, minutes 0.5665 0.0318 0.0006 0.1796 0.0011
Time of setting (Vicat) Final Set, minutes 0.9183 0.0252 0.0685 0.0028 0.1439
Air Content, % 0.1710 0.0466 0.0390 0.0348 0.0000
False Set, % 0.2965 0.2542 0.0913 0.1838 0.2622
Normal Consistency, % 0.0013 0.0036 0.0969 0.2974 0.1979
Autoclave Expansion, % 0.0712 0.0056 0.1441 0.0678 0.0264
Flow, % 0.0042 0.2617 0.0000 0.6670 0.3443
Mortar Cube 28 Day Strength 0.3523 0.7886 0.0431 0.4392 0.6596
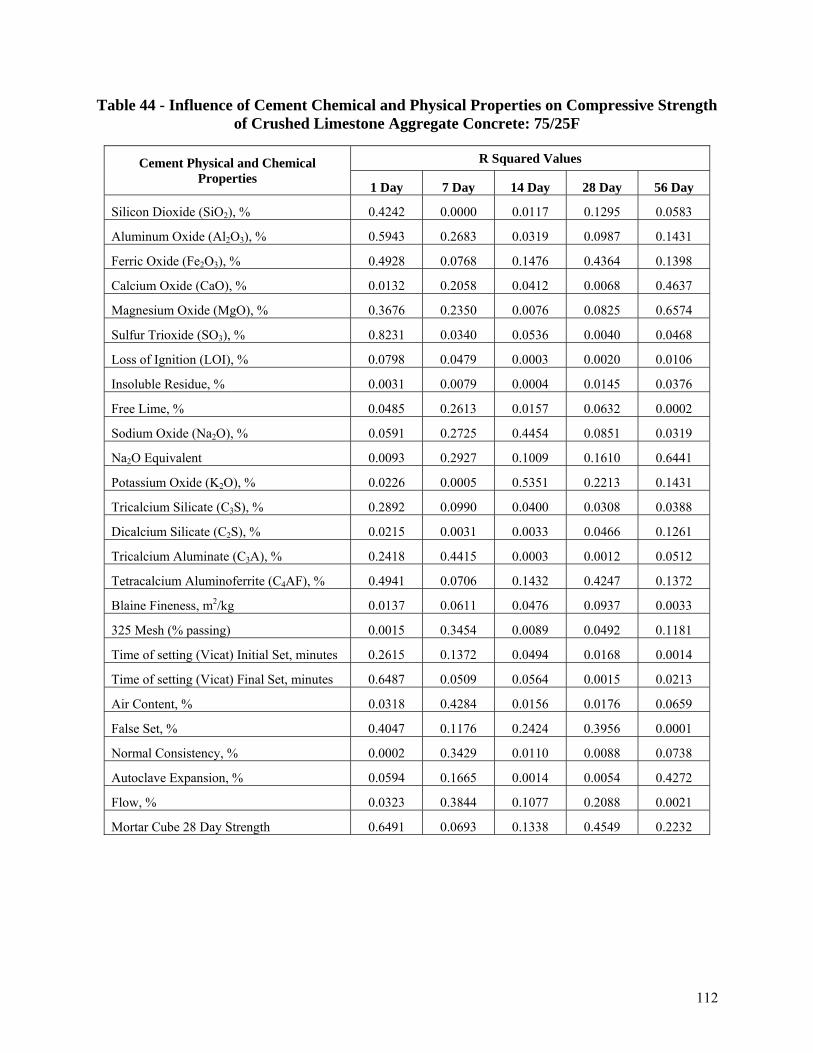
112
Table 44 - Influence of Cement Chemical and Physical Properties on Compressive Strength of Crushed Limestone Aggregate Concrete: 75/25F
Cement Physical and Chemical Properties
R Squared Values
1 Day 7 Day 14 Day 28 Day 56 Day
Silicon Dioxide (SiO2), % 0.4242 0.0000 0.0117 0.1295 0.0583
Aluminum Oxide (Al2O3), % 0.5943 0.2683 0.0319 0.0987 0.1431
Ferric Oxide (Fe2O3), % 0.4928 0.0768 0.1476 0.4364 0.1398
Calcium Oxide (CaO), % 0.0132 0.2058 0.0412 0.0068 0.4637
Magnesium Oxide (MgO), % 0.3676 0.2350 0.0076 0.0825 0.6574
Sulfur Trioxide (SO3), % 0.8231 0.0340 0.0536 0.0040 0.0468
Loss of Ignition (LOI), % 0.0798 0.0479 0.0003 0.0020 0.0106
Insoluble Residue, % 0.0031 0.0079 0.0004 0.0145 0.0376
Free Lime, % 0.0485 0.2613 0.0157 0.0632 0.0002
Sodium Oxide (Na2O), % 0.0591 0.2725 0.4454 0.0851 0.0319
Na2O Equivalent 0.0093 0.2927 0.1009 0.1610 0.6441
Potassium Oxide (K2O), % 0.0226 0.0005 0.5351 0.2213 0.1431
Tricalcium Silicate (C3S), % 0.2892 0.0990 0.0400 0.0308 0.0388
Dicalcium Silicate (C2S), % 0.0215 0.0031 0.0033 0.0466 0.1261
Tricalcium Aluminate (C3A), % 0.2418 0.4415 0.0003 0.0012 0.0512
Tetracalcium Aluminoferrite (C4AF), % 0.4941 0.0706 0.1432 0.4247 0.1372
Blaine Fineness, m2/kg 0.0137 0.0611 0.0476 0.0937 0.0033
325 Mesh (% passing) 0.0015 0.3454 0.0089 0.0492 0.1181
Time of setting (Vicat) Initial Set, minutes 0.2615 0.1372 0.0494 0.0168 0.0014
Time of setting (Vicat) Final Set, minutes 0.6487 0.0509 0.0564 0.0015 0.0213
Air Content, % 0.0318 0.4284 0.0156 0.0176 0.0659
False Set, % 0.4047 0.1176 0.2424 0.3956 0.0001
Normal Consistency, % 0.0002 0.3429 0.0110 0.0088 0.0738
Autoclave Expansion, % 0.0594 0.1665 0.0014 0.0054 0.4272
Flow, % 0.0323 0.3844 0.1077 0.2088 0.0021
Mortar Cube 28 Day Strength 0.6491 0.0693 0.1338 0.4549 0.2232
113
Table 45 - Influence of Cement Chemical and Physical Properties on 28-Day Compressive Strength – Ranked
Cement Physical and Chemical Properties
Gravel Aggregate Mixes Crushed Limestone Mixes
100 75/25C 75/25F 100 75/25C 75/25F
Silicon Dioxide (SiO2), % 23 1 2 21 26 8
Aluminum Oxide (Al2O3), % 22 23 8 22 15 9
Ferric Oxide (Fe2O3), % 15 19 19 6 3 2
Calcium Oxide (CaO), % 18 25 23 4 22 21
Magnesium Oxide (MgO), % 21 26 25 23 18 12
Sulfur Trioxide (SO3), % 13 14 12 10 20 23
Loss of Ignition (LOI), % 17 3 11 9 23 24
Insoluble Residue, % 20 2 24 8 25 19
Free Lime, % 6 11 1 18 2 13
Sodium Oxide (Na2O), % 7 24 20 12 12 11
Na2O Equivalent 2 5 5 26 21 7
Potassium Oxide (K2O), % 1 10 14 15 16 5
Tricalcium Silicate (C3S), % 19 15 9 2 14 16
Dicalcium Silicate (C2S), % 24 4 3 11 17 15
Tricalcium Aluminate (C3A), % 25 22 7 13 8 26
Tetracalcium Aluminoferrite (C4AF), % 14 18 18 5 4 3
Blaine Fineness, m2/kg 12 7 10 14 19 10
325 Mesh (% passing) 4 21 22 24 6 14
Time of setting (Vicat) Initial Set, minutes 3 8 4 20 10 18
Time of setting (Vicat) Final Set, minutes 5 6 6 16 24 25
Air Content, % 8 9 15 25 13 17
False Set, % 16 13 16 1 9 4
Normal Consistency, % 9 17 17 19 7 20
Autoclave Expansion, % 26 12 21 3 11 22
Flow, % 11 20 13 17 1 6
Mortar Cube 28 Day Strength 10 16 26 7 5 1

114
Influence of Age on Concrete Compressive Strength
Concrete gains strength with age and continues to gain strength as long as there is
favorable moisture conditions and temperatures, and there is cementitious materials and room for
hydration products. Strength was measured at ages 1day, 7 days, 14 days, 28-days, and 56 days
in this research. Figures 66 through 71 present scatter plots of percent of 28-day strengths verses
age along with a regression line and the equation of the line. These natural log equations provide
a method of estimating compressive strength at any age between 1 day and 56 days for mixes
with similar proportions. When using these equations, the 7 day compressive strengths for all
mixes in this research are within a range of 70 to 80 percent of the 28-day strengths.
Figure 66 - Percent of 28-Day Compressive Strength vs Age of Gravel Aggregate Concrete: 100
y = 16.8115ln(x) + 44.8048R² = 0.9353
0
10
20
30
40
50
60
70
80
90
100
110
120
130
0 7 14 21 28 35 42 49 56
Perc
ent o
f 28
Day
Com
pres
sive
Stre
ngth
(%)
Age (days)

115
Figure 67 - Percent of 28-Day Compressive Strength vs Age of Gravel Aggregate Concrete:
75/25C
Figure 68 - Percent of 28-Day Compressive Strength vs Age of Gravel Aggregate Concrete: 75/25F
y = 19.6961ln(x) + 33.5475R² = 0.9437
0
10
20
30
40
50
60
70
80
90
100
110
120
130
0 7 14 21 28 35 42 49 56
Perc
ent o
f 28
Day
Com
pres
sive
Stre
ngth
(%)
Age (days)
y = 20.1316ln(x) + 32.0031R² = 0.9573
0
10
20
30
40
50
60
70
80
90
100
110
120
130
0 7 14 21 28 35 42 49 56
Perc
ent o
f 28
Day
Com
pres
sive
Stre
ngth
(%)
Age (days)

116
Figure 69 - Percent of 28-Day Compressive Strength vs Age of Crushed Limestone Aggregate Concrete: 100
Figure 70 - Percent of 28-Day Compressive Strength vs Age of Crushed Limestone Aggregate Concrete: 75/25C
y = 16.0764ln(x) + 46.7528R² = 0.9497
0
10
20
30
40
50
60
70
80
90
100
110
120
130
0 7 14 21 28 35 42 49 56
Perc
ent o
f 28
Day
Com
pres
sive
Str
engt
h (%
)
Age (days)
y = 20.8289ln(x) + 29.7291R² = 0.9593
0
10
20
30
40
50
60
70
80
90
100
110
120
130
0 7 14 21 28 35 42 49 56
Perc
ent o
f 28
Day
Com
pres
sive
Stre
ngth
(%)
Age (days)
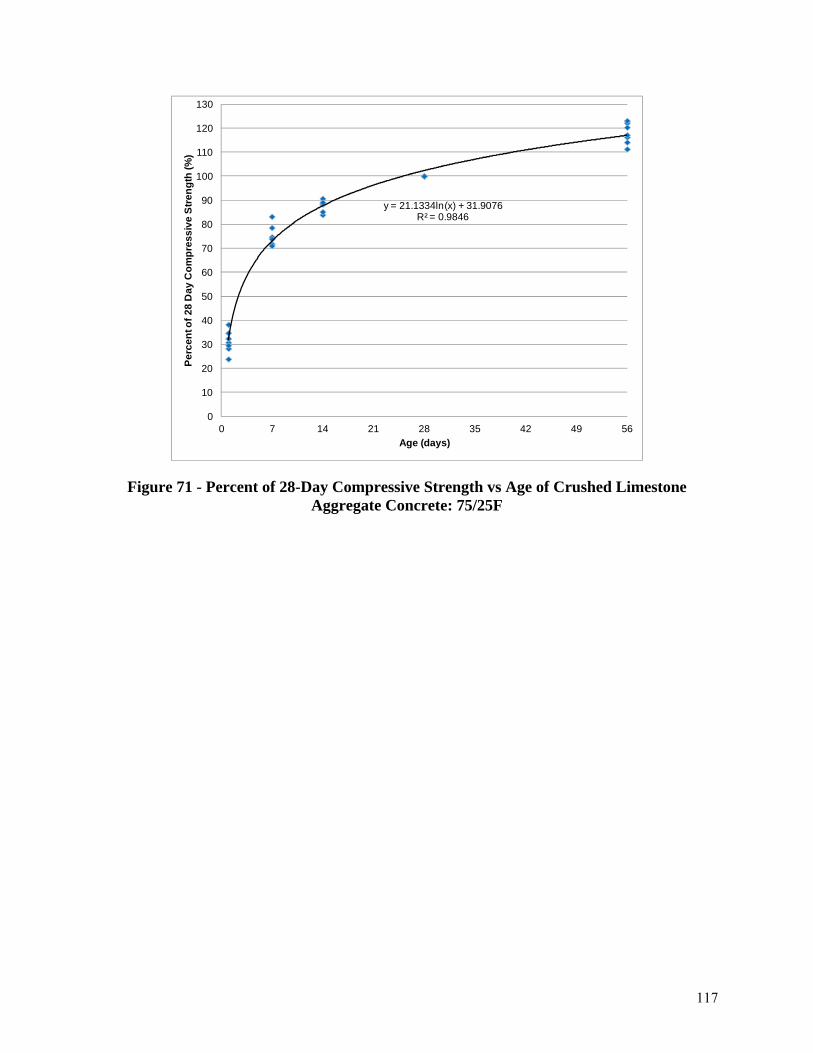
117
Figure 71 - Percent of 28-Day Compressive Strength vs Age of Crushed Limestone Aggregate Concrete: 75/25F
y = 21.1334ln(x) + 31.9076R² = 0.9846
0
10
20
30
40
50
60
70
80
90
100
110
120
130
0 7 14 21 28 35 42 49 56
Perc
ent o
f 28
Day
Com
pres
sive
Stre
ngth
(%)
Age (days)

118
Chapter 8 - Conclusions and Recommendations General
Conclusions and recommendations are based on data generated from mixture proportions
and materials used in this research. These data represent results from mixtures that used six
cement plant sources. One of these sources produced both a Type II and Type IL cement, one
source produce a Type I cement, and all other sources produced Type II cement. Therefore,
there were a total of seven cements used in this study. Both the Class C and Class F fly ash came
from separate sources and only one sample was used from each source. The No. 67 gravel, No.
67 crushed limestone, and the sand came from different sources. Gravel aggregate mixtures
were proportioned from three samples of each of the seven cements. Crushed limestone control
mixtures were proportioned from the first sample from each of the seven cements. Each sample
of cement was taken approximately one month apart. A Type A water reducing admixture was
supplied by one manufacturer and it was the only chemical admixture used in the mixtures. A
dosage rate of 3.05 ounces per 100 pounds of cementitious materials was used for all mixtures.
Mixtures were proportioned based on the water cementitious ratio required to produce a 3
in. slump as discussed in Chapter 3 “Concrete Mixtures.” The conclusions and
recommendations included herein do not consider the influence of adjusting water and/or
chemical admixtures to produce similar slumps and the impact this would have on compressive
strength.
Conclusions and recommendations may not be applicable for mixtures made with any
other sources of materials or other mixture proportions than those used in this research.
Conclusions
A list of conclusions is provided below. Additional details are provided in the paragraphs
that follow this list.
• A higher percentage of companion sets of cylinders made with gravel aggregate exceeded
the acceptable range of individual cylinder strengths than specimens made with crushed
limestone aggregate. The use of fly ash increased the number of companion cylinders
exceeding the acceptable range.

119
• A change in cement sample from the same cement source can change the 28-day
compressive strength by up to 21.6 percent. A change in cement source can change 28-
day compressive strength by up to 31.8 percent when comparing all samples from each
cement source. This percent change was reduced from 31.8 percent to 16.1 percent for
28-day compressive strength results when the results from the three samples were
averaged and compared with results from other cement sources.
• Percent change in 28-day strengths due to changes in cement or cement sample increases
when 25% fly ash is included in the mixture.
• Cement E (Type IL) produced the highest 56-day compressive strengths when results
from all three cement samples were averaged.
• Gravel aggregate mixes proportioned with either 25% Class C or Class F fly ash
produced less compressive strength than mixes proportioned with 100% cement.
• Compressive strengths of gravel aggregate mixtures are on average 63 percent of similar
crushed limestone mixes.
• Crushed limestone mixtures proportioned with 25% Class C fly ash produced strengths
that exceed mixtures proportioned with 100% cement. Mixtures proportioned with 25%
Class F fly ash produced less strength than mixtures proportioned with 100% cement.
• Trends in mortar cube strengths do not always reflect trends in concrete strengths.
• The slump increased with the use of 25% fly ash. Class C fly ash had more influence on
slump than Class F fly ash.
• Cement source and cement sample has influence on slump.
• The standard deviation of compressive strengths for gravel aggregate concrete increases
when 25% fly ash is used in the mixture.
• When mixture proportions are held constant, fresh properties have little to no influence
on 28-day compressive strengths of non-air entrained concrete.
Influence of Testing on Compressive Strength
The range of individual compressive strengths associated with companion cylinders of a
set is influenced by the type of coarse aggregate and the type of cementitious materials used in
the mix. The acceptable range of 10.6 percent is provided in AASHTO T 22 / ASTM C 39 for
three 4 in. X 8 in. companion specimens that are made under laboratory conditions. Crushed

120
limestone aggregate concrete produced the least number of sets of companion cylinders outside
this acceptable range. The percentage of cylinder sets of crushed limestone aggregate mixes that
exceed the maximum range was only 2.4 percent.
Gravel aggregate mixes had 33.3 percent of the sets of companion cylinders that
exceeded the acceptable range. 18.8 percent of the sets of companion cylinders of gravel
aggregate concrete made with 100% cement exceeded the acceptable range. There were 32 out
of 112 sets of companion cylinders made from mixtures with 75% cement and 25% Class C fly
ash that exceeded the acceptable range or 28.6 percent. There were 33 out of 112 sets of
companion cylinders made from mixtures with 75% cement and 25% Class F fly ash that
exceeded the acceptable range or 29.5 percent. There were considerably more sets of companion
cylinders that exceeded the acceptable range when using gravel aggregate when compared to
crushed limestone aggregate and this trend increased with the use of fly ash to replace cement.
Influence of Aggregate Type on Compressive Strength
The compressive strength data of this research shows that gravel aggregate produces
compressive strengths that are lower than mixtures with identical paste contents (by weight) and
w/cm’s made with crushed limestone aggregate. When comparing results of average 28-day
compressive strengths from all cement samples, mixtures proportioned with 100% cement and
gravel aggregate had compressive strengths of 67.2 percent of similar mixes made with crushed
limestone. Mixtures proportioned with 75% cement and 25% Class C fly ash and gravel
aggregate had compressive strengths of 54.6 percent of similar mixes with crushed limestone.
Mixtures proportioned with 75% cement and 25% Class F fly ash and gravel aggregate had
compressive strengths of 64.3 percent of similar mixes with crushed limestone.
Influence of Class C and Class F Fly Ash on Compressive Strength
Average test results for 28-day compressive strengths in this research show that mixtures
proportioned with gravel aggregates and 25% Class C fly ash produce 88.1 percent of the
compressive strength as similar mixtures with 100% cement. Average data generated in this
research show that mixtures proportioned with gravel aggregates and 25% Class F fly ash
produce 85.3 percent of the compressive as similar mixtures with 100% cement. The trend for

121
this research was that when either Class C or Class F fly ash was used to replace cement,
compressive strengths were less than similar mixes proportioned with 100% cement. The only
exception was when 25% Class C fly ash and 25% Class F fly ash with Cement C, sample 3 (CS-
C-3). This cement sample produced 28-day compressive strengths that exceeded the 28-day
compressive strengths of gravel aggregate concrete proportioned with 100% cement.
The trend was not consistent for mixes made with crushed limestone aggregate. When
cement was replaced with 25% Class C fly ash, all of the mixtures made with crushed limestone
produced compressive strengths that were greater than similar mixes with 100% cement. When
cement was replaced with 25% Class F fly ash, all of the mixtures made with crushed limestone
produced compressive strengths that were less than similar mixes with 100% cement.
Influence of Changing Cement Source and Sample of Cement Sources on 28-Day
Compressive Strength
Making a change in the cement, whether changing source, sample, or type, has significant
influence on 28-day compressive strength. The greatest change in 28-day compressive strength
of gravel aggregate mixes proportioned with 100% cement occurred between using Cement D,
sample 2 (CS-D-2) and Cement G, sample 1(CS-G-1). The 28-day compressive strengths for
CS-D-2 and CS-G-1 were 5,333 psi and 4,125 psi, respectfully. This 1,208 psi difference in
compressive strength represents a percent change of 22.7 based on the higher compressive
strength. Cement D and Cement G are both Type II cements.
Changing cements has an ever greater influence on compressive strength when fly ash is
included in the mixture. The greatest change in 28-day gravel aggregate concrete compressive
strength proportioned with 75% cement and 25% Class C fly ash (75/25C) that was attributed to
changing cement was between using Cement C, sample 3 (CS-C-3) and Cement A, sample 2
(CS-A-2). The 28-day compressive strengths for CS-C-3 and CS-A-2 were 4,863 psi and 3,383
psi, respectfully. This 1,480 psi difference in compressive strength represents a percent change
of 30.4 percent based on the higher compressive strength. Cement C is a Type I cement and
Cement A is a Type II cement.

122
The greatest change in 28-day gravel aggregate compressive strength that can be attribute
to changing cements occurred with mixes proportioned with 75% cement and 25% Class F fly
ash (75/25F). This changed occurred when using Cement C, sample 3 (CS-C-3) and Cement A,
sample 2 (CS-A-2). The 28-day compressive strengths for CS-C-3 and CS-A-2 were 4,930 psi
and 3,360 psi, respectfully. This 1,570 psi difference in compressive strength represents a
percent change of 31.8 percent based on the higher compressive strength. Cement C is a Type I
cement and Cement A is a Type II cement.
Changing cement for mixtures proportioned with crushed limestone did not have as much
influence on 28-day compressive strength as mixtures proportioned with gravel aggregates.
Changing cement can change the 28-day compressive strength of crushed limestone mixes by 9.9
percent for mixtures proportioned with 100% cement (100) or 75% cement and 25% Class C fly
ash (75/25C). Mixtures made with crushed limestone aggregate and 75% cement and 25% Class
F fly ash showed a percent change of 12.0 percent. Changing cements has a greater influence on
28-day compressive strengths of gravel aggregate concrete than crushed limestone aggregate
concrete.
The Type IL cement used in this research performed similarly to the Type I and Type II
cements. When evaluating average data of all samples for particular cement, Type IL cement
was the best performer with respect to 28-day compressive strengths for mixes proportioned with
75% cement and 25% Class C fly ash (75/25C). Using these same average data, Type IL cement
provided the highest 56 day compressive strengths for all categories of gravel aggregate concrete
mixtures.
Influence of Cement Sample on Compressive Strength Cement samples from the same source also have influence on 28-day compressive
strength. The greatest change in 28-day compressive strength of gravel aggregate mixes with
100% cement (100) occurred when using Cement D, sample 2 (CS-D-2) and Cement D, sample
1 (CS-D-1). The 28-day compressive strengths for CS-D-2 and CS-D-1 were 5,333 psi and
4,560 psi, respectfully. This 773 psi represents a percent change of 14.5 percent based on the
higher compressive strength. Cement D was Type II cement.
123
Using different cement samples from the same source has an ever greater influence on
compressive strength when fly ash is added to the mixture. The greatest change in 28-day gravel
aggregate compressive strength on mixes 75% cement and 25% Class C fly ash (75/25C)
occurred when using Cement C, sample 3 (CS-C-3) and Cement C, sample 1 (CS-C-1). The 28-
day compressive strengths for CS-C-3 and CS-C-1 were 4,863 psi and 3,815 psi, respectfully.
This 1,048 psi represents a percent change of 21.6 percent based on the higher compressive
strength. Cement C is a Type I cement.
The greatest change in 28-day gravel aggregate compressive strength on mixes 75%
cement and 25% Class F fly ash (75/25F) occurred when using Cement C, sample 3 (CS-C-3)
and Cement C, sample 1 (CS-C-1). The 28-day compressive strengths for CS-C-3 and CS-C-1
were 4,930 psi and 3,880 psi, respectfully. This 1,050 psi represents a percent change of 21.3
percent based on the higher compressive strength.
Recommendations
Number of 4 in. X 8 in. Companion Cylinders We recommend that MDOT engineers increase the number of 28-day cylinders required
for a compressive strength test from two to three when using gravel aggregate concrete. This
increase in number of individual tests is needed because of high variability associated with
testing gravel aggregate concrete. This high variability was demonstrated in this study by the
number of companion cylinder sets that exceeded the recommended range of 10.6 provided in
AASHTO T 22 / ASTM C 39. Three individual results per test would allow the Department to
evaluate and discard an individual result that exceeded the recommend range. This
recommendation applies only to 4 in. X 8 in. cylinders. No other specimen size was evaluated in
this research.
Cement Source Change
We recommend that MDOT engineers require Contractors to provide compressive
strength data using the proposed cement source before allowing a cement source change. Data in
this study show potential strength loss or gain with cement source changes and the Contractor
124
should ensure that the new cement source will produce concrete with strengths that meet or
exceed project requirements.
Cement Type
We recommend that MDOT engineers allow the use of Type IL cement in all classes of
concrete. This recommendation is because of its performance with respect to compressive
strength when used with Class C fly ash and 56 day compressive strengths.
Mixtures Based on Field Experience
Mixtures proportioned for MDOT projects on the basis of field experience currently use
standard deviation that is calculated from 10 consecutive strength test results produced within the
past 12 months. Since there are no other requirements for these 10 consecutive tests, standard
deviation could potentially be calculated on strength test results from one sample of cement.
Average compressive strength data from the seven cement sources of this research show that a
16.1 percent change in compressive strength can be expected when changing cement sources.
We recommend that MDOT engineers modify requirements for proportioning mixtures based on
field experience to include a minimum overdesign of 16 percent. Equation 3 should be added to
section 804.02.10.1.1 with a requirement that the required average compressive strength has to
be the greater of Equation 2 or 3.
sff ccr 43.1'' += (2)
cccr fff '*16.0'' += (3)

125
Research Opportunities
1. A research project should be conducted to validate data of this study on concrete mixtures
that meet MDOT’s criteria for chemical admixtures, strength, and fresh properties using
various sources of gravel aggregate.
2. A research project should be conducted to determine the influence of source of fly ash on
compressive strength of concrete.
3. A research project should be conducted to determine the influence of source of gravel
aggregate on companion cylinder compressive strengths.

126
References 1. Mississippi Department of Transportation Concrete Field Manual. Jackson: Mississippi
Department of Transportation, 2011.
2. Fulton, Frederick Sandrok, Concrete Technology – A South African Handbook (Portland
Cement Institute, 1977) 309-316. 3. Kosmatka, Steven H., Beatrix Kerkhoff, and William C. Panarese. Design and Control of
Concrete Mixtures. 15th ed. Skokie: Portland Cement Association, 2002.
4. Mindess, Sidney, and J. Francis Young. Concrete. (Englwood Cliffs: Prentice-Hall, Inc.,
1981) 344-348.
5. Concrete in Practice: What, why & how? CIP 30 – Supplementary Cementitious
Materials (National Ready Mixed Concrete Association, Silver Springs, MD, 2000)
6. Edson, Fowler, Juenger, Suh, and Moon Won. Effects of Supplementary Cementing
Materials and Early Strength of Concrete. Center for Transportation Research at The
University of Texas at Austin , 2007, Rev. 2008.
7. Air Entrainment and Concrete: (The Aberdeen Group, 1976)
8. Fowler, David W. and Pedro N. Quiroga. The Effects of Aggregates Characteristics on
the Performance of Portland Cement Concrete. (Austin: The University of Texas at
Austin, 2003) 17.
9. Shilstone, Jim, “Concrete Mixture Optimization” Concrete International, June 1990: 39
10. “ASTM C595 acknowledges 15% Limestone Threshold,” Cement Americas, August 23,
2012.
11. National Cooperative Highway Research Program, Research Results Digest 324:
Recommended Precision Statements for AASHTO Standard Methods of Test T 22, T
104, T 105, T 154, T 186, and T 242 (Transportation Research Board, 2010) 3.
127
Appendix A Raw Data:
Concrete Mixtures

128
Project: Lab #: BCDName: Set #: 1
5/2/2011 1 f'c: 4,000 psi 1.25 Factor: 0.05
Vol. (c.f.)
2.68 526.40 24.37 24.37 24.37 3.150.00 0.00 0.00 0.00 1.000.00 0.00 0.00 0.00 1.000.00 0.00 0.00 0.00 1.007.73 1265.03 58.57 58.57 58.57 2.621 0.34% 2.2112.39 1790.00 82.87 82.87 82.87 2.316 4.67% 6.510.00 0.00 0.00 0.000.00 0.00 0.00 0.000.00 0.00 0.00 0.00
Air: 1.50% 0.41 0.00 0.00 0.00Water: 3.80 236.88 10.97 15.04 15.04 1.00
"+-Air: 1.00% AGE psi Avg. psiDate
27.00 3818.31 176.77 180.84 1 day 1440143.57 143.57 146.88 1 day 1440
1 day 15507 day 3870
oz /cwt oz /cy ml /cy batch ml actual ml Sand: -0.34% -0.20 7 day 37703.05 16.1 474.8 22.0 22.0 CA 1 -4.67% -3.87 7 day 3550
CA 2 0.00% 0.00 14 day 3710CA 3 0.00% 0.00 14 day 4040CA 4 0.00% 0.00 14 day 3850
28 day 4400+/- h2o Added W/held 28 day 4460
28 day 45408:40 AM 3.50 56 day 49608:49 AM 141.88 7.82 56 day 4740
2.50 1.27 0.25 56 day 472070.2 NA 43.2973.0 1.020
MIX NUMBER Mix 1 Gravel A1 100Date: Mix Code: Size(c.f.):
State Study No. 239 - Influences on Strength Variability of Gravel Aggregate Concrete Comments / Notes / ObservationsCustomer: MDOT
Cement 1: CS-A-1Cement 2:
Dry Specific Gravity
Agg. absorption
Agg. FMMaterial
MIX DESIGN INFO Dry mix 1 cu. yd. Wt. (lbs.)
Dry mix lab batch Wt. (lbs.)
Adjusted lab batch Wt. (lbs.)
Actual lab batch Wt.
(lbs.)Material Code
Sand 1: FA-1Coarse Aggregate 1: CA-1
Fly Ash:GGBFS:
Coarse Aggregate 4:
Water Strength Test Results
Coarse Aggregate 2: Coarse Aggregate 3:
4x8 CYLINDERSTotal:
05/03/11 1477UW w/o Air: Aggregate Moistures
05/16/11 3867
Free H2O Content
Batch free H2O (lbs.)ADMIX INFORMATION
05/09/11 3730Type Brand / NameWR Type A Water Reducer
Water Added/Withheld5/30/2011 4467
PLASTIC TEST RESULTS OTHER INFO
4807Sample Time Unit Weight (pcf) Act. w/c 0.450 Bucket Weight
Slump, in. Yield Des.Un.Wt. 141.42
Batch Time % Air Des. w/c 0.450 Unit Weight6/27/2011
Bucket Volume
Air Temp. Relative Yield Bag Factor 5.60 Mix Temp. Initial set, min. Fine/Coarse by Vol 0.624 Bucket Full Technician who
conducted tests:

129
Project: Lab #: BCDName: Set #: 1
5/2/2011 2 f'c: 4,000 psi 1.25 Factor: 0.05
Vol. (c.f.)
2.01 394.80 18.28 18.28 18.28 3.150.00 0.00 0.00 0.00 1.000.81 131.60 6.09 6.09 6.09 2.600.00 0.00 0.00 0.00 1.007.59 1241.87 57.49 57.49 57.49 2.621 0.34% 2.2112.39 1790.00 82.87 82.87 82.87 2.316 4.67% 6.510.00 0.00 0.00 0.000.00 0.00 0.00 0.000.00 0.00 0.00 0.00
Air: 1.50% 0.41 0.00 0.00 0.00Water: 3.80 236.88 10.97 15.03 15.03 1.00
"+-Air: 1.00% AGE psi Avg. psiDate
27.00 3795.15 175.70 179.77 1 day 830142.70 142.70 146.00 1 day 910
1 day 9107 day 3000
oz /cwt oz /cy ml /cy batch ml actual ml Sand: -0.34% -0.20 7 day 32603.05 16.1 474.8 22.0 22.0 CA 1 -4.67% -3.87 7 day 3310
CA 2 0.00% 0.00 14 day 3380CA 3 0.00% 0.00 14 day 3390CA 4 0.00% 0.00 14 day 3720
28 day 3840+/- h2o Added W/held 28 day 3640
28 day 39309:22 AM 2.00 56 day 39409:31 AM 143.16 7.82 56 day 3870
6.50 1.26 0.25 56 day 379070.5 NA 43.6172.9 1.010
MIX NUMBER Mix 2 Gravel A1 75/25CDate: Mix Code: Size(c.f.):
State Study No. 239 - Influences on Strength Variability of Gravel Aggregate Concrete Comments / Notes / ObservationsCustomer: MDOT
Cement 1: CS-A-1Cement 2:
Dry Specific Gravity
Agg. absorption
Agg. FMMaterial
MIX DESIGN INFODry mix 1 cu. yd. Wt. (lbs.)
Dry mix lab batch Wt. (lbs.)
Adjusted lab batch Wt. (lbs.)
Actual lab batch Wt.
(lbs.)Material Code
Sand 1: FA-1Coarse Aggregate 1: CA-1
Fly Ash: SCM-1 (Class C Fly Ash)GGBFS:
Coarse Aggregate 4:
Water Strength Test Results
Coarse Aggregate 2: Coarse Aggregate 3:
4x8 CYLINDERSTotal:
05/03/11 883UW w/o Air: Aggregate Moistures
05/16/11 3497
Free H2O Content
Batch free H2O (lbs.)ADMIX INFORMATION
05/09/11 3190Type Brand / NameWR Type A Water Reducer
Water Added/Withheld5/30/2011 3803
PLASTIC TEST RESULTS OTHER INFO
3867Sample Time Unit Weight (pcf) Act. w/c 0.450 Bucket Weight
Slump, in. Yield Des.Un.Wt. 140.56
Batch Time % Air Des. w/c 0.450 Unit Weight6/27/2011
Bucket Volume
Air Temp. Relative Yield Bag Factor 5.60 Mix Temp. Initial set, min. Fine/Coarse by Vol 0.613 Bucket Full Technician who
conducted tests:

130
Project: Lab #: BCDName: Set #: 1
5/2/2011 3 f'c: 4,000 psi 1.25 Factor: 0.05
Vol. (c.f.)
2.01 394.80 18.28 18.28 18.28 3.150.00 0.00 0.00 0.00 1.000.96 131.60 6.09 6.09 6.09 2.200.00 0.00 0.00 0.00 1.007.45 1217.75 56.38 56.38 56.38 2.621 0.34% 2.2112.39 1790.00 82.87 82.87 82.87 2.316 4.67% 6.510.00 0.00 0.00 0.000.00 0.00 0.00 0.000.00 0.00 0.00 0.00
Air: 1.50% 0.41 0.00 0.00 0.00Water: 3.80 236.88 10.97 15.03 15.03 1.00
"+-Air: 1.00% AGE psi Avg. psiDate
27.00 3771.03 174.58 178.65 1 day 940141.79 141.79 145.09 1 day 840
1 day 9507 day "2850"
oz /cwt oz /cy ml /cy batch ml actual ml Sand: -0.34% -0.19 7 day 30803.05 16.1 474.8 22.0 22.0 CA 1 -4.67% -3.87 7 day 3200
CA 2 0.00% 0.00 14 day 3670CA 3 0.00% 0.00 14 day 3760CA 4 0.00% 0.00 14 day "3360"
28 day 4090+/- h2o Added W/held 28 day 3730
28 day "3520"10:05 AM 2.00 56 day 493010:14 AM 142.24 7.82 56 day 4560
4.25 1.26 0.25 56 day 461069.1 NA 43.3872.9 1.010
MIX NUMBER Mix 3 Gravel A1 75/25FDate: Mix Code: Size(c.f.):
State Study No. 239 - Influences on Strength Variability of Gravel Aggregate Concrete Comments / Notes / ObservationsCustomer: MDOT
Cement 1: CS-A-1Cement 2:
Dry Specific Gravity
Agg. absorption
Agg. FMMaterial
MIX DESIGN INFODry mix 1 cu. yd. Wt. (lbs.)
Dry mix lab batch Wt. (lbs.)
Adjusted lab batch Wt. (lbs.)
Actual lab batch Wt.
(lbs.)Material Code
Sand 1: FA-1Coarse Aggregate 1: CA-1
Fly Ash: SCM-2 (Class F Fly Ash)GGBFS:
Coarse Aggregate 4:
Water Strength Test Results
Coarse Aggregate 2: Coarse Aggregate 3:
4x8 CYLINDERSTotal:
05/03/11 910UW w/o Air: Aggregate Moistures
05/16/11 3715
Free H2O Content
Batch free H2O (lbs.)ADMIX INFORMATION
05/09/11 3140Type Brand / NameWR Type A Water Reducer
Water Added/Withheld5/30/2011 3910
PLASTIC TEST RESULTS OTHER INFO
4700Sample Time Unit Weight (pcf) Act. w/c 0.450 Bucket Weight
Slump, in. Yield Des.Un.Wt. 139.67
Batch Time % Air Des. w/c 0.450 Unit Weight6/27/2011
Bucket Volume
Air Temp. Relative Yield Bag Factor 5.60 Mix Temp. Initial set, min. Fine/Coarse by Vol 0.601 Bucket Full Technician who
conducted tests:

131
Project: Lab #: BCDName: Set #: 1
6/8/2011 4 f'c: 4,000 psi 1.25 Factor: 0.05
Vol. (c.f.)
2.68 526.40 24.37 24.37 24.37 3.150.00 0.00 0.00 0.00 1.000.00 0.00 0.00 0.00 1.000.00 0.00 0.00 0.00 1.007.73 1265.03 58.57 58.57 58.57 2.621 0.34% 2.2112.39 1790.00 82.87 82.87 82.87 2.316 4.67% 6.510.00 0.00 0.00 0.000.00 0.00 0.00 0.000.00 0.00 0.00 0.00
Air: 1.50% 0.41 0.00 0.00 0.00Water: 3.80 236.88 10.97 15.04 15.04 1.00
"+-Air: 1.00% AGE psi Avg. psiDate
27.00 3818.31 176.77 180.84 1 day 1600143.57 143.57 146.88 1 day 1720
1 day 16207 day 3530
oz /cwt oz /cy ml /cy batch ml actual ml Sand: -0.34% -0.20 7 day 35003.05 16.1 474.8 22.0 22.0 CA 1 -4.67% -3.87 7 day 3380
CA 2 0.00% 0.00 14 day 4230CA 3 0.00% 0.00 14 day "3760"CA 4 0.00% 0.00 14 day 4090
28 day 4250+/- h2o Added W/held 28 day 4400
28 day 42601:11 PM 3.25 56 day 48801:20 PM 141.92 7.83 56 day 4850
5.50 1.27 0.25 56 day 520071.1 NA 43.3177.4 1.020
MIX NUMBER Mix 4 Gravel A2 100Date: Mix Code: Size(c.f.):
State Study No. 239 - Influences on Strength Variability of Gravel Aggregate Concrete Comments / Notes / ObservationsCustomer: MDOT
Cement 1: CS-A-2Cement 2:
Dry Specific Gravity
Agg. absorption
Agg. FMMaterial
MIX DESIGN INFODry mix 1 cu. yd. Wt. (lbs.)
Dry mix lab batch Wt. (lbs.)
Adjusted lab batch Wt. (lbs.)
Actual lab batch Wt.
(lbs.)Material Code
Sand 1: FA-1Coarse Aggregate 1: CA-1
Fly Ash:GGBFS:
Coarse Aggregate 4:
Water Strength Test Results
Coarse Aggregate 2: Coarse Aggregate 3:
4x8 CYLINDERSTotal:
06/09/11 1647UW w/o Air: Aggregate Moistures
06/22/11 4160
Free H2O Content
Batch free H2O (lbs.)ADMIX INFORMATION
06/15/11 3470Type Brand / NameWR Type A Water Reducer
Water Added/Withheld7/6/2011 4303
PLASTIC TEST RESULTS OTHER INFO
4977Sample Time Unit Weight (pcf) Act. w/c 0.450 Bucket Weight
Slump, in. Yield Des.Un.Wt. 141.42
Batch Time % Air Des. w/c 0.450 Unit Weight8/3/2011
Bucket Volume
Air Temp. Relative Yield Bag Factor 5.60 Mix Temp. Initial set, min. Fine/Coarse by Vol 0.624 Bucket Full Technician who
conducted tests:

132
Project: Lab #: BCDName: Set #: 1
6/8/2011 5 f'c: 4,000 psi 1.25 Factor: 0.05
Vol. (c.f.)
2.01 394.80 18.28 18.28 18.28 3.150.00 0.00 0.00 0.00 1.000.81 131.60 6.09 6.09 6.09 2.600.00 0.00 0.00 0.00 1.007.59 1241.87 57.49 57.49 57.49 2.621 0.34% 2.2112.39 1790.00 82.87 82.87 82.87 2.316 4.67% 6.510.00 0.00 0.00 0.000.00 0.00 0.00 0.000.00 0.00 0.00 0.00
Air: 1.50% 0.41 0.00 0.00 0.00Water: 3.80 236.88 10.97 15.03 15.03 1.00
"+-Air: 1.00% AGE psi Avg. psiDate
27.00 3795.15 175.70 179.77 1 day 830142.70 142.70 146.00 1 day 870
1 day 8907 day 2840
oz /cwt oz /cy ml /cy batch ml actual ml Sand: -0.34% -0.20 7 day 29903.05 16.1 474.8 22.0 22.0 CA 1 -4.67% -3.87 7 day 2790
CA 2 0.00% 0.00 14 day 3100CA 3 0.00% 0.00 14 day "2850"CA 4 0.00% 0.00 14 day 3290
28 day 3420+/- h2o Added W/held 28 day 3520
28 day 32101:43 PM 2.25 56 day 35101:52 PM 143.16 7.83 56 day "4340"
6.75 1.26 0.25 56 day 388070.0 NA 43.6277.8 1.010
MIX NUMBER Mix 5 Gravel A2 75/25CDate: Mix Code: Size(c.f.):
State Study No. 239 - Influences on Strength Variability of Gravel Aggregate Concrete Comments / Notes / ObservationsCustomer: MDOT
Cement 1: CS-A-2Cement 2:
Dry Specific Gravity
Agg. absorption
Agg. FMMaterial
MIX DESIGN INFODry mix 1 cu. yd. Wt. (lbs.)
Dry mix lab batch Wt. (lbs.)
Adjusted lab batch Wt. (lbs.)
Actual lab batch Wt.
(lbs.)Material Code
Sand 1: FA-1Coarse Aggregate 1: CA-1
Fly Ash: SCM-1 (Class C Fly Ash)GGBFS:
Coarse Aggregate 4:
Water Strength Test Results
Coarse Aggregate 2: Coarse Aggregate 3:
4x8 CYLINDERSTotal:
06/09/11 863UW w/o Air: Aggregate Moistures
06/22/11 3195
Free H2O Content
Batch free H2O (lbs.)ADMIX INFORMATION
06/15/11 2873Type Brand / NameWR Type A Water Reducer
Water Added/Withheld7/6/2011 3383
PLASTIC TEST RESULTS OTHER INFO
3695Sample Time Unit Weight (pcf) Act. w/c 0.450 Bucket Weight
Slump, in. Yield Des.Un.Wt. 140.56
Batch Time % Air Des. w/c 0.450 Unit Weight8/3/2011
Bucket Volume
Air Temp. Relative Yield Bag Factor 5.60 Mix Temp. Initial set, min. Fine/Coarse by Vol 0.613 Bucket Full Technician who
conducted tests:

133
Project: Lab #: BCDName: Set #: 1
6/8/2011 6 f'c: 4,000 psi 1.25 Factor: 0.05
Vol. (c.f.)
2.01 394.80 18.28 18.28 18.28 3.150.00 0.00 0.00 0.00 1.000.96 131.60 6.09 6.09 6.09 2.200.00 0.00 0.00 0.00 1.007.45 1217.75 56.38 56.38 56.38 2.621 0.34% 2.2112.39 1790.00 82.87 82.87 82.87 2.316 4.67% 6.510.00 0.00 0.00 0.000.00 0.00 0.00 0.000.00 0.00 0.00 0.00
Air: 1.50% 0.41 0.00 0.00 0.00Water: 3.80 236.88 10.97 15.03 15.03 1.00
"+-Air: 1.00% AGE psi Avg. psiDate
27.00 3771.03 174.58 178.65 1 day 880141.79 141.79 145.09 1 day 870
1 day 9207 day 2520
oz /cwt oz /cy ml /cy batch ml actual ml Sand: -0.34% -0.19 7 day 27103.05 16.1 474.8 22.0 22.0 CA 1 -4.67% -3.87 7 day 2740
CA 2 0.00% 0.00 14 day "2640"CA 3 0.00% 0.00 14 day 2950CA 4 0.00% 0.00 14 day 3020
28 day 3420+/- h2o Added W/held 28 day 3300
28 day "3890"2:22 PM 1.75 56 day 43102:31 PM 142.36 7.83 56 day 3930
8.00 1.25 0.25 56 day 408068.3 NA 43.4278.5 1.000
MIX NUMBER Mix 6 Gravel A2 75/25FDate: Mix Code: Size(c.f.):
State Study No. 239 - Influences on Strength Variability of Gravel Aggregate Concrete Comments / Notes / ObservationsCustomer: MDOT
Cement 1: CS-A-2Cement 2:
Dry Specific Gravity
Agg. absorption
Agg. FMMaterial
MIX DESIGN INFODry mix 1 cu. yd. Wt. (lbs.)
Dry mix lab batch Wt. (lbs.)
Adjusted lab batch Wt. (lbs.)
Actual lab batch Wt.
(lbs.)Material Code
Sand 1: FA-1Coarse Aggregate 1: CA-1
Fly Ash: SCM-2 (Class F Fly Ash)GGBFS:
Coarse Aggregate 4:
Water Strength Test Results
Coarse Aggregate 2: Coarse Aggregate 3:
4x8 CYLINDERSTotal:
06/09/11 890UW w/o Air: Aggregate Moistures
06/22/11 2985
Free H2O Content
Batch free H2O (lbs.)ADMIX INFORMATION
06/15/11 2657Type Brand / NameWR Type A Water Reducer
Water Added/Withheld7/6/2011 3360
PLASTIC TEST RESULTS OTHER INFO
4107Sample Time Unit Weight (pcf) Act. w/c 0.450 Bucket Weight
Slump, in. Yield Des.Un.Wt. 139.67
Batch Time % Air Des. w/c 0.450 Unit Weight8/3/2011
Bucket Volume
Air Temp. Relative Yield Bag Factor 5.60 Mix Temp. Initial set, min. Fine/Coarse by Vol 0.601 Bucket Full Technician who
conducted tests:

134
Project: Lab #: BCDName: Set #: 1
7/20/2011 7 f'c: 4,000 psi 1.25 Factor: 0.05
Vol. (c.f.)
2.68 526.40 24.37 24.37 24.37 3.150.00 0.00 0.00 0.00 1.000.00 0.00 0.00 0.00 1.000.00 0.00 0.00 0.00 1.007.73 1265.03 58.57 58.57 58.57 2.621 0.34% 2.2112.39 1790.00 82.87 82.87 82.87 2.316 4.67% 6.510.00 0.00 0.00 0.000.00 0.00 0.00 0.000.00 0.00 0.00 0.00
Air: 1.50% 0.41 0.00 0.00 0.00Water: 3.80 236.88 10.97 15.04 15.04 1.00
"+-Air: 1.00% AGE psi Avg. psiDate
27.00 3818.31 176.77 180.84 1 day 1690143.57 143.57 146.88 1 day 1780
1 day 16907 day 3790
oz /cwt oz /cy ml /cy batch ml actual ml Sand: -0.34% -0.20 7 day 38703.05 16.1 474.8 22.0 22.0 CA 1 -4.67% -3.87 7 day 3570
CA 2 0.00% 0.00 14 day 3950CA 3 0.00% 0.00 14 day 3780CA 4 0.00% 0.00 14 day 3970
28 day 4300+/- h2o Added W/held 28 day 4530
28 day 46209:04 AM 3.75 56 day "4780"9:13 AM 141.60 7.86 56 day 5300
2.75 1.28 0.25 56 day 556071.0 NA 43.2672.7 1.020
MIX NUMBER Mix 7 Gravel A3 100Date: Mix Code: Size(c.f.):
State Study No. 239 - Influences on Strength Variability of Gravel Aggregate Concrete Comments / Notes / ObservationsCustomer: MDOT
Cement 1: CS-A-3Cement 2:
Dry Specific Gravity
Agg. absorption
Agg. FMMaterial
MIX DESIGN INFODry mix 1 cu. yd. Wt. (lbs.)
Dry mix lab batch Wt. (lbs.)
Adjusted lab batch Wt. (lbs.)
Actual lab batch Wt.
(lbs.)Material Code
Sand 1: FA-1Coarse Aggregate 1: CA-1
Fly Ash:GGBFS:
Coarse Aggregate 4:
Water Strength Test Results
Coarse Aggregate 2: Coarse Aggregate 3:
4x8 CYLINDERSTotal:
07/21/11 1720UW w/o Air: Aggregate Moistures
08/03/11 3900
Free H2O Content
Batch free H2O (lbs.)ADMIX INFORMATION
07/27/11 3743Type Brand / NameWR Type A Water Reducer
Water Added/Withheld8/17/2011 4483
PLASTIC TEST RESULTS OTHER INFO
5430Sample Time Unit Weight (pcf) Act. w/c 0.450 Bucket Weight
Slump, in. Yield Des.Un.Wt. 141.42
Batch Time % Air Des. w/c 0.450 Unit Weight9/14/2011
Bucket Volume
Air Temp. Relative Yield Bag Factor 5.60 Mix Temp. Initial set, min. Fine/Coarse by Vol 0.624 Bucket Full Technician who
conducted tests:

135
Project: Lab #: BCDName: Set #: 1
7/20/2011 8 f'c: 4,000 psi 1.25 Factor: 0.05
Vol. (c.f.)
2.01 394.80 18.28 18.28 18.28 3.150.00 0.00 0.00 0.00 1.000.81 131.60 6.09 6.09 6.09 2.600.00 0.00 0.00 0.00 1.007.59 1241.87 57.49 57.49 57.49 2.621 0.34% 2.2112.39 1790.00 82.87 82.87 82.87 2.316 4.67% 6.510.00 0.00 0.00 0.000.00 0.00 0.00 0.000.00 0.00 0.00 0.00
Air: 1.50% 0.41 0.00 0.00 0.00Water: 3.80 236.88 10.97 15.03 15.03 1.00
"+-Air: 1.00% AGE psi Avg. psiDate
27.00 3795.15 175.70 179.77 1 day 1000142.70 142.70 146.00 1 day 980
1 day 9307 day 3340
oz /cwt oz /cy ml /cy batch ml actual ml Sand: -0.34% -0.20 7 day 28103.05 16.1 474.8 22.0 22.0 CA 1 -4.67% -3.87 7 day 3240
CA 2 0.00% 0.00 14 day 3170CA 3 0.00% 0.00 14 day 3370CA 4 0.00% 0.00 14 day 3190
28 day "3310"+/- h2o Added W/held 28 day 3840
28 day 41809:44 AM 2.50 56 day "3620"9:53 AM 142.40 7.86 56 day 4350
6.75 1.26 0.25 56 day 448070.5 NA 43.4673.8 1.010
MIX NUMBER Mix 8 Gravel A3 75/25CDate: Mix Code: Size(c.f.):
State Study No. 239 - Influences on Strength Variability of Gravel Aggregate Concrete Comments / Notes / ObservationsCustomer: MDOT
Cement 1: CS-A-3Cement 2:
Dry Specific Gravity
Agg. absorption
Agg. FMMaterial
MIX DESIGN INFODry mix 1 cu. yd. Wt. (lbs.)
Dry mix lab batch Wt. (lbs.)
Adjusted lab batch Wt. (lbs.)
Actual lab batch Wt.
(lbs.)Material Code
Sand 1: FA-1Coarse Aggregate 1: CA-1
Fly Ash: SCM-1 (Class C Fly Ash)GGBFS:
Coarse Aggregate 4:
Water Strength Test Results
Coarse Aggregate 2: Coarse Aggregate 3:
4x8 CYLINDERSTotal:
07/21/11 970UW w/o Air: Aggregate Moistures
08/03/11 3243
Free H2O Content
Batch free H2O (lbs.)ADMIX INFORMATION
07/27/11 3130Type Brand / NameWR Type A Water Reducer
Water Added/Withheld8/17/2011 4010
PLASTIC TEST RESULTS OTHER INFO
4415Sample Time Unit Weight (pcf) Act. w/c 0.450 Bucket Weight
Slump, in. Yield Des.Un.Wt. 140.56
Batch Time % Air Des. w/c 0.450 Unit Weight9/14/2011
Bucket Volume
Air Temp. Relative Yield Bag Factor 5.60 Mix Temp. Initial set, min. Fine/Coarse by Vol 0.613 Bucket Full Technician who
conducted tests:

136
Project: Lab #: BCDName: Set #: 1
7/20/2011 9 f'c: 4,000 psi 1.25 Factor: 0.05
Vol. (c.f.)
2.01 394.80 18.28 18.28 18.28 3.150.00 0.00 0.00 0.00 1.000.96 131.60 6.09 6.09 6.09 2.200.00 0.00 0.00 0.00 1.007.45 1217.75 56.38 56.38 56.38 2.621 0.34% 2.2112.39 1790.00 82.87 82.87 82.87 2.316 4.67% 6.510.00 0.00 0.00 0.000.00 0.00 0.00 0.000.00 0.00 0.00 0.00
Air: 1.50% 0.41 0.00 0.00 0.00Water: 3.80 236.88 10.97 15.03 15.03 1.00
"+-Air: 1.00% AGE psi Avg. psiDate
27.00 3771.03 174.58 178.65 1 day 990141.79 141.79 145.09 1 day 1010
1 day 9007 day 2590
oz /cwt oz /cy ml /cy batch ml actual ml Sand: -0.34% -0.19 7 day 25903.05 16.1 474.8 22.0 22.0 CA 1 -4.67% -3.87 7 day 2490
CA 2 0.00% 0.00 14 day "3450"CA 3 0.00% 0.00 14 day 3030CA 4 0.00% 0.00 14 day 3050
28 day 3600+/- h2o Added W/held 28 day 3460
28 day "3220"10:20 AM 2.50 56 day 419010:29 AM 141.48 7.86 56 day 4090
5.00 1.26 0.25 56 day 412070.0 NA 43.2375.2 1.010
MIX NUMBER Mix 9 Gravel A3 75/25FDate: Mix Code: Size(c.f.):
State Study No. 239 - Influences on Strength Variability of Gravel Aggregate Concrete Comments / Notes / ObservationsCustomer: MDOT
Cement 1: CS-A-3Cement 2:
Dry Specific Gravity
Agg. absorption
Agg. FMMaterial
MIX DESIGN INFODry mix 1 cu. yd. Wt. (lbs.)
Dry mix lab batch Wt. (lbs.)
Adjusted lab batch Wt. (lbs.)
Actual lab batch Wt.
(lbs.)Material Code
Sand 1: FA-1Coarse Aggregate 1: CA-1
Fly Ash: SCM-2 (Class F Fly Ash)GGBFS:
Coarse Aggregate 4:
Water Strength Test Results
Coarse Aggregate 2: Coarse Aggregate 3:
4x8 CYLINDERSTotal:
07/21/11 967UW w/o Air: Aggregate Moistures
08/03/11 3040
Free H2O Content
Batch free H2O (lbs.)ADMIX INFORMATION
07/27/11 2557Type Brand / NameWR Type A Water Reducer
Water Added/Withheld8/17/2011 3530
PLASTIC TEST RESULTS OTHER INFO
4133Sample Time Unit Weight (pcf) Act. w/c 0.450 Bucket Weight
Slump, in. Yield Des.Un.Wt. 139.67
Batch Time % Air Des. w/c 0.450 Unit Weight9/14/2011
Bucket Volume
Air Temp. Relative Yield Bag Factor 5.60 Mix Temp. Initial set, min. Fine/Coarse by Vol 0.601 Bucket Full Technician who
conducted tests:

137
Project: Lab #: BCDName: Set #: 1
5/3/2011 10 f'c: 4,000 psi 1.25 Factor: 0.05
Vol. (c.f.)
2.68 526.40 24.37 24.37 24.37 3.150.00 0.00 0.00 0.00 1.000.00 0.00 0.00 0.00 1.000.00 0.00 0.00 0.00 1.007.73 1264.55 58.54 58.54 58.54 2.621 0.34% 2.2112.39 2061.00 95.42 95.42 95.42 2.666 0.88% 6.450.00 0.00 0.00 0.000.00 0.00 0.00 0.000.00 0.00 0.00 0.00
Air: 1.50% 0.41 0.00 0.00 0.00Water: 3.80 236.88 10.97 12.01 12.01 1.00
"+-Air: 1.00% AGE psi Avg. psiDate
27.00 4088.83 189.30 190.34 1 day 2660153.74 153.74 154.59 1 day 2580
1 day 26707 day 6110
oz /cwt oz /cy ml /cy batch ml actual ml Sand: -0.34% -0.20 7 day 55803.05 16.1 474.8 22.0 22.0 CA 1 -0.88% -0.84 7 day 5810
CA 2 0.00% 0.00 14 day 6420CA 3 0.00% 0.00 14 day 6880CA 4 0.00% 0.00 14 day 7060
28 day 6920+/- h2o Added W/held 28 day 7570
28 day 72208:18 AM 3.75 56 day 76308:27 AM 150.24 7.82 56 day 7510
2.50 1.27 0.25 56 day 764068.9 NA 45.3872.0 1.020
MIX NUMBER Mix 10 Stone A1 100Date: Mix Code: Size(c.f.):
State Study No. 239 - Influences on Strength Variability of Gravel Aggregate Concrete Comments / Notes / ObservationsCustomer: MDOT
Cement 1: CS-A-1Cement 2:
Dry Specific Gravity
Agg. absorption
Agg. FMMaterial
MIX DESIGN INFODry mix 1 cu. yd. Wt. (lbs.)
Dry mix lab batch Wt. (lbs.)
Adjusted lab batch Wt. (lbs.)
Actual lab batch Wt.
(lbs.)Material Code
Sand 1: FA-1Coarse Aggregate 1: CA-2
Fly Ash:GGBFS:
Coarse Aggregate 4:
Water Strength Test Results
Coarse Aggregate 2: Coarse Aggregate 3:
4x8 CYLINDERSTotal:
05/04/11 2637UW w/o Air: Aggregate Moistures
05/17/11 6787
Free H2O Content
Batch free H2O (lbs.)ADMIX INFORMATION
05/10/11 5833Type Brand / NameWR Type A Water Reducer
Water Added/Withheld5/31/2011 7237
PLASTIC TEST RESULTS OTHER INFO
7593Sample Time Unit Weight (pcf) Act. w/c 0.450 Bucket Weight
Slump, in. Yield Des.Un.Wt. 151.44
Batch Time % Air Des. w/c 0.450 Unit Weight6/28/2011
Bucket Volume
Air Temp. Relative Yield Bag Factor 5.60 Mix Temp. Initial set, min. Fine/Coarse by Vol 0.624 Bucket Full Technician who
conducted tests:

138
Project: Lab #: BCDName: Set #: 1
5/3/2011 11 f'c: 4,000 psi 1.25 Factor: 0.05
Vol. (c.f.)
2.01 394.80 18.28 18.28 18.28 3.150.00 0.00 0.00 0.00 1.000.81 131.60 6.09 6.09 6.09 2.600.00 0.00 0.00 0.00 1.007.59 1241.39 57.47 57.47 57.47 2.621 0.34% 2.2112.39 2061.00 95.42 95.42 95.42 2.666 0.88% 6.450.00 0.00 0.00 0.000.00 0.00 0.00 0.000.00 0.00 0.00 0.00
Air: 1.50% 0.41 0.00 0.00 0.00Water: 3.80 236.88 10.97 12.00 12.00 1.00
"+-Air: 1.00% AGE psi Avg. psiDate
27.00 4065.67 188.23 189.26 1 day 1460152.87 152.87 153.71 1 day 1460
1 day 14807 day 5450
oz /cwt oz /cy ml /cy batch ml actual ml Sand: -0.34% -0.20 7 day 52203.05 16.1 474.8 22.0 22.0 CA 1 -0.88% -0.84 7 day 5350
CA 2 0.00% 0.00 14 day 6500CA 3 0.00% 0.00 14 day 7030CA 4 0.00% 0.00 14 day 6450
28 day 7850+/- h2o Added W/held 28 day 7920
28 day 79909:05 AM 2.50 56 day 85709:14 AM 150.84 7.82 56 day 8520
4.25 1.25 0.25 56 day 862068.3 NA 45.5371.1 1.000
MIX NUMBER Mix 11 Stone A1 75/25CDate: Mix Code: Size(c.f.):
State Study No. 239 - Influences on Strength Variability of Gravel Aggregate Concrete Comments / Notes / ObservationsCustomer: MDOT
Cement 1: CS-A-1Cement 2:
Dry Specific Gravity
Agg. absorption
Agg. FMMaterial
MIX DESIGN INFODry mix 1 cu. yd. Wt. (lbs.)
Dry mix lab batch Wt. (lbs.)
Adjusted lab batch Wt. (lbs.)
Actual lab batch Wt.
(lbs.)Material Code
Sand 1: FA-1Coarse Aggregate 1: CA-2
Fly Ash: SCM-1 (Class C Fly Ash)GGBFS:
Coarse Aggregate 4:
Water Strength Test Results
Coarse Aggregate 2: Coarse Aggregate 3:
4x8 CYLINDERSTotal:
05/04/11 1467UW w/o Air: Aggregate Moistures
05/17/11 6660
Free H2O Content
Batch free H2O (lbs.)ADMIX INFORMATION
05/10/11 5340Type Brand / NameWR Type A Water Reducer
Water Added/Withheld5/31/2011 7920
PLASTIC TEST RESULTS OTHER INFO
8570Sample Time Unit Weight (pcf) Act. w/c 0.450 Bucket Weight
Slump, in. Yield Des.Un.Wt. 150.58
Batch Time % Air Des. w/c 0.450 Unit Weight6/28/2011
Bucket Volume
Air Temp. Relative Yield Bag Factor 5.60 Mix Temp. Initial set, min. Fine/Coarse by Vol 0.613 Bucket Full Technician who
conducted tests:

139
Project: Lab #: BCDName: Set #: 1
5/3/2011 12 f'c: 4,000 psi 1.25 Factor: 0.05
Vol. (c.f.)
2.01 394.80 18.28 18.28 18.28 3.150.00 0.00 0.00 0.00 1.000.96 131.60 6.09 6.09 6.09 2.200.00 0.00 0.00 0.00 1.007.44 1217.27 56.35 56.35 56.35 2.621 0.34% 2.2112.39 2061.00 95.42 95.42 95.42 2.666 0.88% 6.450.00 0.00 0.00 0.000.00 0.00 0.00 0.000.00 0.00 0.00 0.00
Air: 1.50% 0.41 0.00 0.00 0.00Water: 3.80 236.88 10.97 12.00 12.00 1.00
"+-Air: 1.00% AGE psi Avg. psiDate
27.00 4041.55 187.11 188.14 1 day 1560151.97 151.97 152.80 1 day 1610
1 day 15307 day 4560
oz /cwt oz /cy ml /cy batch ml actual ml Sand: -0.34% -0.19 7 day 48603.05 16.1 474.8 22.0 22.0 CA 1 -0.88% -0.84 7 day 4740
CA 2 0.00% 0.00 14 day 5520CA 3 0.00% 0.00 14 day 5480CA 4 0.00% 0.00 14 day 5540
28 day 6650+/- h2o Added W/held 28 day 6470
28 day 66009:47 AM 2.25 56 day 76409:56 AM 150.88 7.82 56 day 7310
3.50 1.25 0.25 56 day 699069.1 NA 45.5471.8 1.000
MIX NUMBER Mix 12 Stone A1 75/25FDate: Mix Code: Size(c.f.):
State Study No. 239 - Influences on Strength Variability of Gravel Aggregate Concrete Comments / Notes / ObservationsCustomer: MDOT
Cement 1: CS-A-1Cement 2:
Dry Specific Gravity
Agg. absorption
Agg. FMMaterial
MIX DESIGN INFODry mix 1 cu. yd. Wt. (lbs.)
Dry mix lab batch Wt. (lbs.)
Adjusted lab batch Wt. (lbs.)
Actual lab batch Wt.
(lbs.)Material Code
Sand 1: FA-1Coarse Aggregate 1: CA-2
Fly Ash: SCM-2 (Class F Fly Ash)GGBFS:
Coarse Aggregate 4:
Water Strength Test Results
Coarse Aggregate 2: Coarse Aggregate 3:
4x8 CYLINDERSTotal:
05/04/11 1567UW w/o Air: Aggregate Moistures
05/17/11 5513
Free H2O Content
Batch free H2O (lbs.)ADMIX INFORMATION
05/10/11 4720Type Brand / NameWR Type A Water Reducer
Water Added/Withheld5/31/2011 6573
PLASTIC TEST RESULTS OTHER INFO
7313Sample Time Unit Weight (pcf) Act. w/c 0.450 Bucket Weight
Slump, in. Yield Des.Un.Wt. 149.69
Batch Time % Air Des. w/c 0.450 Unit Weight6/28/2011
Bucket Volume
Air Temp. Relative Yield Bag Factor 5.60 Mix Temp. Initial set, min. Fine/Coarse by Vol 0.601 Bucket Full Technician who
conducted tests:

140
Project: Lab #: BCDName: Set #: 1
5/4/2011 13 f'c: 4,000 psi 1.25 Factor: 0.05
Vol. (c.f.)
2.68 526.40 24.37 24.37 24.37 3.150.00 0.00 0.00 0.00 1.000.00 0.00 0.00 0.00 1.000.00 0.00 0.00 0.00 1.007.73 1265.03 58.57 58.57 58.57 2.621 0.34% 2.2112.39 1790.00 82.87 82.87 82.87 2.316 4.67% 6.510.00 0.00 0.00 0.000.00 0.00 0.00 0.000.00 0.00 0.00 0.00
Air: 1.50% 0.41 0.00 0.00 0.00Water: 3.80 236.88 10.97 15.04 15.04 1.00
"+-Air: 1.00% AGE psi Avg. psiDate
27.00 3818.31 176.77 180.84 1 day 1580143.57 143.57 146.88 1 day 1640
1 day 18007 day 3850
oz /cwt oz /cy ml /cy batch ml actual ml Sand: -0.34% -0.20 7 day 37403.05 16.1 474.8 22.0 22.0 CA 1 -4.67% -3.87 7 day 3650
CA 2 0.00% 0.00 14 day 4180CA 3 0.00% 0.00 14 day 4060CA 4 0.00% 0.00 14 day 4250
28 day 4730+/- h2o Added W/held 28 day 4800
28 day 46508:14 AM 4.00 56 day 49908:23 AM 140.72 7.82 56 day 4790
5.25 1.29 0.25 56 day 500064.8 NA 43.0070.4 1.030
MIX NUMBER Mix 13 Gravel B1 100Date: Mix Code: Size(c.f.):
State Study No. 239 - Influences on Strength Variability of Gravel Aggregate Concrete Comments / Notes / ObservationsCustomer: MDOT
Cement 1: CS-B-1Cement 2:
Dry Specific Gravity
Agg. absorption
Agg. FMMaterial
MIX DESIGN INFODry mix 1 cu. yd. Wt. (lbs.)
Dry mix lab batch Wt. (lbs.)
Adjusted lab batch Wt. (lbs.)
Actual lab batch Wt.
(lbs.)Material Code
Sand 1: FA-1Coarse Aggregate 1: CA-1
Fly Ash:GGBFS:
Coarse Aggregate 4:
Water Strength Test Results
Coarse Aggregate 2: Coarse Aggregate 3:
4x8 CYLINDERSTotal:
05/05/11 1673UW w/o Air: Aggregate Moistures
05/18/11 4163
Free H2O Content
Batch free H2O (lbs.)ADMIX INFORMATION
05/11/11 3747Type Brand / NameWR Type A Water Reducer
Water Added/Withheld6/1/2011 4727
PLASTIC TEST RESULTS OTHER INFO
4927Sample Time Unit Weight (pcf) Act. w/c 0.450 Bucket Weight
Slump, in. Yield Des.Un.Wt. 141.42
Batch Time % Air Des. w/c 0.450 Unit Weight6/29/2011
Bucket Volume
Air Temp. Relative Yield Bag Factor 5.60 Mix Temp. Initial set, min. Fine/Coarse by Vol 0.624 Bucket Full Technician who
conducted tests:

141
Project: Lab #: BCDName: Set #: 1
5/4/2011 14 f'c: 4,000 psi 1.25 Factor: 0.05
Vol. (c.f.)
2.01 394.80 18.28 18.28 18.28 3.150.00 0.00 0.00 0.00 1.000.81 131.60 6.09 6.09 6.09 2.600.00 0.00 0.00 0.00 1.007.59 1241.87 57.49 57.49 57.49 2.621 0.34% 2.2112.39 1790.00 82.87 82.87 82.87 2.316 4.67% 6.510.00 0.00 0.00 0.000.00 0.00 0.00 0.000.00 0.00 0.00 0.00
Air: 1.50% 0.41 0.00 0.00 0.00Water: 3.80 236.88 10.97 15.03 15.03 1.00
"+-Air: 1.00% AGE psi Avg. psiDate
27.00 3795.15 175.70 179.77 1 day 1040142.70 142.70 146.00 1 day 990
1 day 10407 day 3390
oz /cwt oz /cy ml /cy batch ml actual ml Sand: -0.34% -0.20 7 day 34703.05 16.1 474.8 22.0 22.0 CA 1 -4.67% -3.87 7 day 3280
CA 2 0.00% 0.00 14 day 3660CA 3 0.00% 0.00 14 day 3730CA 4 0.00% 0.00 14 day 3640
28 day 4040+/- h2o Added W/held 28 day 4200
28 day 41209:01 AM 1.60 56 day "3930"9:10 AM 143.72 7.82 56 day 4300
8.25 1.25 0.25 56 day 441066.2 NA 43.7572.0 1.000
MIX NUMBER Mix 14 Gravel B1 75/25C Volumetric Air Meter leak - air not tested.
Date: Mix Code: Size(c.f.): Calculated air content by unit weight
State Study No. 239 - Influences on Strength Variability of Gravel Aggregate Concrete Comments / Notes / ObservationsCustomer: MDOT
Cement 1: CS-B-1Cement 2:
Dry Specific Gravity
Agg. absorption
Agg. FMMaterial
MIX DESIGN INFODry mix 1 cu. yd. Wt. (lbs.)
Dry mix lab batch Wt. (lbs.)
Adjusted lab batch Wt. (lbs.)
Actual lab batch Wt.
(lbs.)Material Code
Sand 1: FA-1Coarse Aggregate 1: CA-1
Fly Ash: SCM-1 (Class C Fly Ash)GGBFS:
Coarse Aggregate 4:
Water Strength Test Results
Coarse Aggregate 2: Coarse Aggregate 3:
4x8 CYLINDERSTotal:
05/05/11 1023UW w/o Air: Aggregate Moistures
05/18/11 3677
Free H2O Content
Batch free H2O (lbs.)ADMIX INFORMATION
05/11/11 3380Type Brand / NameWR Type A Water Reducer
Water Added/Withheld6/1/2011 4120
PLASTIC TEST RESULTS OTHER INFO
4355Sample Time Unit Weight (pcf) Act. w/c 0.450 Bucket Weight
Slump, in. Yield Des.Un.Wt. 140.56
Batch Time % Air Des. w/c 0.450 Unit Weight6/29/2011
Bucket Volume
Air Temp. Relative Yield Bag Factor 5.60 Mix Temp. Initial set, min. Fine/Coarse by Vol 0.613 Bucket Full Technician who
conducted tests:

142
Project: Lab #: BCDName: Set #: 1
5/4/2011 15 f'c: 4,000 psi 1.25 Factor: 0.05
Vol. (c.f.)
2.01 394.80 18.28 18.28 18.28 3.150.00 0.00 0.00 0.00 1.000.96 131.60 6.09 6.09 6.09 2.200.00 0.00 0.00 0.00 1.007.45 1217.75 56.38 56.38 56.38 2.621 0.34% 2.2112.39 1790.00 82.87 82.87 82.87 2.316 4.67% 6.510.00 0.00 0.00 0.000.00 0.00 0.00 0.000.00 0.00 0.00 0.00
Air: 1.50% 0.41 0.00 0.00 0.00Water: 3.80 236.88 10.97 15.03 15.03 1.00
"+-Air: 1.00% AGE psi Avg. psiDate
27.00 3771.03 174.58 178.65 1 day 1130141.79 141.79 145.09 1 day 1170
1 day 10907 day 2870
oz /cwt oz /cy ml /cy batch ml actual ml Sand: -0.34% -0.19 7 day 31103.05 16.1 474.8 22.0 22.0 CA 1 -4.67% -3.87 7 day 2930
CA 2 0.00% 0.00 14 day 3500CA 3 0.00% 0.00 14 day 3610CA 4 0.00% 0.00 14 day 3580
28 day "3860"+/- h2o Added W/held 28 day 4370
28 day 422010:15 AM 1.75 56 day 435010:24 AM 141.84 7.82 56 day 4160
6.50 1.26 0.25 56 day 465067.9 NA 43.2872.2 1.010
MIX NUMBER Mix 15 Gravel B1 75/25FDate: Mix Code: Size(c.f.):
State Study No. 239 - Influences on Strength Variability of Gravel Aggregate Concrete Comments / Notes / ObservationsCustomer: MDOT
Cement 1: CS-B-1Cement 2:
Dry Specific Gravity
Agg. absorption
Agg. FMMaterial
MIX DESIGN INFODry mix 1 cu. yd. Wt. (lbs.)
Dry mix lab batch Wt. (lbs.)
Adjusted lab batch Wt. (lbs.)
Actual lab batch Wt.
(lbs.)Material Code
Sand 1: FA-1Coarse Aggregate 1: CA-1
Fly Ash: SCM-2 (Class F Fly Ash)GGBFS:
Coarse Aggregate 4:
Water Strength Test Results
Coarse Aggregate 2: Coarse Aggregate 3:
4x8 CYLINDERSTotal:
05/05/11 1130UW w/o Air: Aggregate Moistures
05/18/11 3563
Free H2O Content
Batch free H2O (lbs.)ADMIX INFORMATION
05/11/11 2970Type Brand / NameWR Type A Water Reducer
Water Added/Withheld6/1/2011 4295
PLASTIC TEST RESULTS OTHER INFO
4387Sample Time Unit Weight (pcf) Act. w/c 0.450 Bucket Weight
Slump, in. Yield Des.Un.Wt. 139.67
Batch Time % Air Des. w/c 0.450 Unit Weight6/29/2011
Bucket Volume
Air Temp. Relative Yield Bag Factor 5.60 Mix Temp. Initial set, min. Fine/Coarse by Vol 0.601 Bucket Full Technician who
conducted tests:

143
Project: Lab #: BCDName: Set #: 1
6/9/2011 16 f'c: 4,000 psi 1.25 Factor: 0.05
Vol. (c.f.)
2.68 526.40 24.37 24.37 24.37 3.150.00 0.00 0.00 0.00 1.000.00 0.00 0.00 0.00 1.000.00 0.00 0.00 0.00 1.007.73 1265.03 58.57 58.57 58.57 2.621 0.34% 2.2112.39 1790.00 82.87 82.87 82.87 2.316 4.67% 6.510.00 0.00 0.00 0.000.00 0.00 0.00 0.000.00 0.00 0.00 0.00
Air: 1.50% 0.41 0.00 0.00 0.00Water: 3.80 236.88 10.97 15.04 15.04 1.00
"+-Air: 1.00% AGE psi Avg. psiDate
27.00 3818.31 176.77 180.84 1 day 1870143.57 143.57 146.88 1 day 1950
1 day 18307 day "3720"
oz /cwt oz /cy ml /cy batch ml actual ml Sand: -0.34% -0.20 7 day 44103.05 16.1 474.8 22.0 22.0 CA 1 -4.67% -3.87 7 day 4270
CA 2 0.00% 0.00 14 day "3950"CA 3 0.00% 0.00 14 day 4330CA 4 0.00% 0.00 14 day 4680
28 day 4790+/- h2o Added W/held 28 day 4860
28 day 49509:06 AM 4.00 56 day 54809:15 AM 141.48 7.83 56 day 5410
4.50 1.28 0.25 56 day 559070.2 NA 43.2072.9 1.020
MIX NUMBER Mix 16 Gravel B2 100Date: Mix Code: Size(c.f.):
State Study No. 239 - Influences oo Strength Variability of Gravel Aggregate Concrete Comments / Notes / ObservationsCustomer: MDOT
Cement 1: CS-B-2Cement 2:
Dry Specific Gravity
Agg. absorption
Agg. FMMaterial
MIX DESIGN INFODry mix 1 cu. yd. Wt. (lbs.)
Dry mix lab batch Wt. (lbs.)
Adjusted lab batch Wt. (lbs.)
Actual lab batch Wt.
(lbs.)Material Code
Sand 1: FA-1Coarse Aggregate 1: CA-1
Fly Ash:GGBFS:
Coarse Aggregate 4:
Water Strength Test Results
Coarse Aggregate 2: Coarse Aggregate 3:
4x8 CYLINDERSTotal:
06/10/11 1883UW w/o Air: Aggregate Moistures
06/23/11 4505
Free H2O Content
Batch free H2O (lbs.)ADMIX INFORMATION
06/16/11 4340Type Brand / NameWR Type A Water Reducer
Water Added/Withheld7/7/2011 4867
PLASTIC TEST RESULTS OTHER INFO
5493Sample Time Unit Weight (pcf) Act. w/c 0.450 Bucket Weight
Slump, in. Yield Des.Un.Wt. 141.42
Batch Time % Air Des. w/c 0.450 Unit Weight8/4/2011
Bucket Volume
Air Temp. Relative Yield Bag Factor 5.60 Mix Temp. Initial set, min. Fine/Coarse by Vol 0.624 Bucket Full Technician who
conducted tests:

144
Project: Lab #: BCDName: Set #: 1
6/9/2011 17 f'c: 4,000 psi 1.25 Factor: 0.05
Vol. (c.f.)
2.01 394.80 18.28 18.28 18.28 3.150.00 0.00 0.00 0.00 1.000.81 131.60 6.09 6.09 6.09 2.600.00 0.00 0.00 0.00 1.007.59 1241.87 57.49 57.49 57.49 2.621 0.34% 2.2112.39 1790.00 82.87 82.87 82.87 2.316 4.67% 6.510.00 0.00 0.00 0.000.00 0.00 0.00 0.000.00 0.00 0.00 0.00
Air: 1.50% 0.41 0.00 0.00 0.00Water: 3.80 236.88 10.97 15.03 15.03 1.00
"+-Air: 1.00% AGE psi Avg. psiDate
27.00 3795.15 175.70 179.77 1 day 1100142.70 142.70 146.00 1 day 1090
1 day 12207 day 3440
oz /cwt oz /cy ml /cy batch ml actual ml Sand: -0.34% -0.20 7 day 31503.05 16.1 474.8 22.0 22.0 CA 1 -4.67% -3.87 7 day 3370
CA 2 0.00% 0.00 14 day 3580CA 3 0.00% 0.00 14 day 3670CA 4 0.00% 0.00 14 day "3120"
28 day 4380+/- h2o Added W/held 28 day 4260
28 day 43609:42 AM 2.75 56 day 44009:51 AM 142.32 7.83 56 day 4330
7.50 1.26 0.25 56 day 449068.0 NA 43.4174.0 1.010
MIX NUMBER Mix 17 Gravel B2 75/25CDate: Mix Code: Size(c.f.):
State Study No. 239 - Influences on Strength Variability of Gravel Aggregate Concrete Comments / Notes / ObservationsCustomer: MDOT
Cement 1: CS-B-2Cement 2:
Dry Specific Gravity
Agg. absorption
Agg. FMMaterial
MIX DESIGN INFODry mix 1 cu. yd. Wt. (lbs.)
Dry mix lab batch Wt. (lbs.)
Adjusted lab batch Wt. (lbs.)
Actual lab batch Wt.
(lbs.)Material Code
Sand 1: FA-1Coarse Aggregate 1: CA-1
Fly Ash: SCM-1 (Class C Fly Ash)GGBFS:
Coarse Aggregate 4:
Water Strength Test Results
Coarse Aggregate 2: Coarse Aggregate 3:
4x8 CYLINDERSTotal:
06/10/11 1137UW w/o Air: Aggregate Moistures
06/23/11 3625
Free H2O Content
Batch free H2O (lbs.)ADMIX INFORMATION
06/16/11 3320Type Brand / NameWR Type A Water Reducer
Water Added/Withheld7/7/2011 4333
PLASTIC TEST RESULTS OTHER INFO
4407Sample Time Unit Weight (pcf) Act. w/c 0.450 Bucket Weight
Slump, in. Yield Des.Un.Wt. 140.56
Batch Time % Air Des. w/c 0.450 Unit Weight8/4/2011
Bucket Volume
Air Temp. Relative Yield Bag Factor 5.60 Mix Temp. Initial set, min. Fine/Coarse by Vol 0.613 Bucket Full Technician who
conducted tests:

145
Project: Lab #: BCDName: Set #: 1
6/9/2011 18 f'c: 4,000 psi 1.25 Factor: 0.05
Vol. (c.f.)
2.01 394.80 18.28 18.28 18.28 3.150.00 0.00 0.00 0.00 1.000.96 131.60 6.09 6.09 6.09 2.200.00 0.00 0.00 0.00 1.007.45 1217.75 56.38 56.38 56.38 2.621 0.34% 2.2112.39 1790.00 82.87 82.87 82.87 2.316 4.67% 6.510.00 0.00 0.00 0.000.00 0.00 0.00 0.000.00 0.00 0.00 0.00
Air: 1.50% 0.41 0.00 0.00 0.00Water: 3.80 236.88 10.97 15.03 15.03 1.00
"+-Air: 1.00% AGE psi Avg. psiDate
27.00 3771.03 174.58 178.65 1 day 1260141.79 141.79 145.09 1 day 1290
1 day 13007 day 3090
oz /cwt oz /cy ml /cy batch ml actual ml Sand: -0.34% -0.19 7 day "3280"3.05 16.1 474.8 22.0 22.0 CA 1 -4.67% -3.87 7 day 2940
CA 2 0.00% 0.00 14 day 3680CA 3 0.00% 0.00 14 day 3390CA 4 0.00% 0.00 14 day 3440
28 day 4170+/- h2o Added W/held 28 day 4050
28 day 409010:17 AM 2.25 56 day "3690"10:26 AM 141.96 7.83 56 day 4360
6.00 1.26 0.25 56 day 396067.3 NA 43.3274.3 1.010
MIX NUMBER Mix 18 Gravel B2 75/25FDate: Mix Code: Size(c.f.):
State Study No. 239 - Influences on Strength Variability of Gravel Aggregate Concrete Comments / Notes / ObservationsCustomer: MDOT
Cement 1: CS-B-2Cement 2:
Dry Specific Gravity
Agg. absorption
Agg. FMMaterial
MIX DESIGN INFODry mix 1 cu. yd. Wt. (lbs.)
Dry mix lab batch Wt. (lbs.)
Adjusted lab batch Wt. (lbs.)
Actual lab batch Wt.
(lbs.)Material Code
Sand 1: FA-1Coarse Aggregate 1: CA-1
Fly Ash: SCM-2 (Class F Fly Ash)GGBFS:
Coarse Aggregate 4:
Water Strength Test Results
Coarse Aggregate 2: Coarse Aggregate 3:
4x8 CYLINDERSTotal:
06/10/11 1283UW w/o Air: Aggregate Moistures
06/23/11 3503
Free H2O Content
Batch free H2O (lbs.)ADMIX INFORMATION
06/16/11 3015Type Brand / NameWR Type A Water Reducer
Water Added/Withheld7/7/2011 4103
PLASTIC TEST RESULTS OTHER INFO
4160Sample Time Unit Weight (pcf) Act. w/c 0.450 Bucket Weight
Slump, in. Yield Des.Un.Wt. 139.67
Batch Time % Air Des. w/c 0.450 Unit Weight8/4/2011
Bucket Volume
Air Temp. Relative Yield Bag Factor 5.60 Mix Temp. Initial set, min. Fine/Coarse by Vol 0.601 Bucket Full Technician who
conducted tests:

146
Project: Lab #: BCDName: Set #: 1
7/21/2011 19 f'c: 4,000 psi 1.25 Factor: 0.05
Vol. (c.f.)
2.68 526.40 24.37 24.37 24.37 3.150.00 0.00 0.00 0.00 1.000.00 0.00 0.00 0.00 1.000.00 0.00 0.00 0.00 1.007.73 1265.03 58.57 58.57 58.57 2.621 0.34% 2.2112.39 1790.00 82.87 82.87 82.87 2.316 4.67% 6.510.00 0.00 0.00 0.000.00 0.00 0.00 0.000.00 0.00 0.00 0.00
Air: 1.50% 0.41 0.00 0.00 0.00Water: 3.80 236.88 10.97 15.04 15.04 1.00
"+-Air: 1.00% AGE psi Avg. psiDate
27.00 3818.31 176.77 180.84 1 day 1220143.57 143.57 146.88 1 day 1300
1 day 12807 day 3850
oz /cwt oz /cy ml /cy batch ml actual ml Sand: -0.34% -0.20 7 day 38903.05 16.1 474.8 22.0 22.0 CA 1 -4.67% -3.87 7 day 3780
CA 2 0.00% 0.00 14 day "3670"CA 3 0.00% 0.00 14 day 4120CA 4 0.00% 0.00 14 day 4490
28 day 4570+/- h2o Added W/held 28 day 5000
28 day 46808:19 AM 4.75 56 day 48008:28 AM 140.56 7.86 56 day 4800
5.50 1.29 0.25 56 day 481068.7 NA 43.0072.0 1.030
Air Temp. Relative Yield Bag Factor 5.60 Mix Temp. Initial set, min. Fine/Coarse by Vol 0.624 Bucket Full Technician who
conducted tests:
4803Sample Time Unit Weight (pcf) Act. w/c 0.450 Bucket Weight
Slump, in. Yield Des.Un.Wt. 141.42
Batch Time % Air Des. w/c 0.450 Unit Weight9/15/2011
Bucket Volume
Water Added/Withheld8/18/2011 4750
PLASTIC TEST RESULTS OTHER INFO
08/04/11 4305
Free H2O Content
Batch free H2O (lbs.)ADMIX INFORMATION
07/28/11 3840Type Brand / NameWR Type A Water Reducer
4x8 CYLINDERSTotal:
07/22/11 1267UW w/o Air: Aggregate Moistures
Coarse Aggregate 4:
Water Strength Test Results
Coarse Aggregate 2: Coarse Aggregate 3:
Sand 1: FA-1Coarse Aggregate 1: CA-1
Fly Ash:GGBFS:
Cement 1: CS-B-3Cement 2:
Dry Specific Gravity
Agg. absorption
Agg. FMMaterial
MIX DESIGN INFODry mix 1 cu. yd. Wt. (lbs.)
Dry mix lab batch Wt. (lbs.)
Adjusted lab batch Wt. (lbs.)
Actual lab batch Wt.
(lbs.)Material Code
MIX NUMBER Mix 19 Gravel B3 100Date: Mix Code: Size(c.f.):
State Study No. 239 - Influences on Strength Variability of Gravel Aggregate Concrete Comments / Notes / ObservationsCustomer: MDOT

147
Project: Lab #: BCDName: Set #: 1
7/21/2011 20 f'c: 4,000 psi 1.25 Factor: 0.05
Vol. (c.f.)
2.01 394.80 18.28 18.28 18.28 3.150.00 0.00 0.00 0.00 1.000.81 131.60 6.09 6.09 6.09 2.600.00 0.00 0.00 0.00 1.007.59 1241.87 57.49 57.49 57.49 2.621 0.34% 2.2112.39 1790.00 82.87 82.87 82.87 2.316 4.67% 6.510.00 0.00 0.00 0.000.00 0.00 0.00 0.000.00 0.00 0.00 0.00
Air: 1.50% 0.41 0.00 0.00 0.00Water: 3.80 236.88 10.97 15.03 15.03 1.00
"+-Air: 1.00% AGE psi Avg. psiDate
27.00 3795.15 175.70 179.77 1 day 1310142.70 142.70 146.00 1 day 1340
1 day 12107 day 3330
oz /cwt oz /cy ml /cy batch ml actual ml Sand: -0.34% -0.20 7 day "2970"3.05 16.1 474.8 22.0 22.0 CA 1 -4.67% -3.87 7 day 3340
CA 2 0.00% 0.00 14 day 3530CA 3 0.00% 0.00 14 day 3550CA 4 0.00% 0.00 14 day "3140"
28 day 4200+/- h2o Added W/held 28 day 3960
28 day 40608:57 AM 2.75 56 day 43209:06 AM 142.12 7.86 56 day "3720"
7.50 1.26 0.25 56 day 436067.1 NA 43.3972.4 1.010
Air Temp. Relative Yield Bag Factor 5.60 Mix Temp. Initial set, min. Fine/Coarse by Vol 0.613 Bucket Full Technician who
conducted tests:
4340Sample Time Unit Weight (pcf) Act. w/c 0.450 Bucket Weight
Slump, in. Yield Des.Un.Wt. 140.56
Batch Time % Air Des. w/c 0.450 Unit Weight9/15/2011
Bucket Volume
Water Added/Withheld8/18/2011 4073
PLASTIC TEST RESULTS OTHER INFO
08/04/11 3540
Free H2O Content
Batch free H2O (lbs.)ADMIX INFORMATION
07/28/11 3335Type Brand / NameWR Type A Water Reducer
4x8 CYLINDERSTotal:
07/22/11 1287UW w/o Air: Aggregate Moistures
Coarse Aggregate 4:
Water Strength Test Results
Coarse Aggregate 2: Coarse Aggregate 3:
Sand 1: FA-1Coarse Aggregate 1: CA-1
Fly Ash: SCM-1 (Class C Fly Ash)GGBFS:
Cement 1: CS-B-3Cement 2:
Dry Specific Gravity
Agg. absorption
Agg. FMMaterial
MIX DESIGN INFODry mix 1 cu. yd. Wt. (lbs.)
Dry mix lab batch Wt. (lbs.)
Adjusted lab batch Wt. (lbs.)
Actual lab batch Wt.
(lbs.)Material Code
MIX NUMBER Mix 20 Gravel B3 75/25CDate: Mix Code: Size(c.f.):
State Study No. 239 - Influences on Strength Variability of Gravel Aggregate Concrete Comments / Notes / ObservationsCustomer: MDOT

148
Project: Lab #: BCDName: Set #: 1
7/21/2011 21 f'c: 4,000 psi 1.25 Factor: 0.05
Vol. (c.f.)
2.01 394.80 18.28 18.28 18.28 3.150.00 0.00 0.00 0.00 1.000.96 131.60 6.09 6.09 6.09 2.200.00 0.00 0.00 0.00 1.007.45 1217.75 56.38 56.38 56.38 2.621 0.34% 2.2112.39 1790.00 82.87 82.87 82.87 2.316 4.67% 6.510.00 0.00 0.00 0.000.00 0.00 0.00 0.000.00 0.00 0.00 0.00
Air: 1.50% 0.41 0.00 0.00 0.00Water: 3.80 236.88 10.97 15.03 15.03 1.00
"+-Air: 1.00% AGE psi Avg. psiDate
27.00 3771.03 174.58 178.65 1 day 1760141.79 141.79 145.09 1 day 1670
1 day 20307 day 2940
oz /cwt oz /cy ml /cy batch ml actual ml Sand: -0.34% -0.19 7 day 30503.05 16.1 474.8 22.0 22.0 CA 1 -4.67% -3.87 7 day 2830
CA 2 0.00% 0.00 14 day 3060CA 3 0.00% 0.00 14 day 3380CA 4 0.00% 0.00 14 day 3130
28 day 4020+/- h2o Added W/held 28 day 3680
28 day 37009:35 AM 2.75 56 day 45709:44 AM 141.88 7.86 56 day "3720"
7.25 1.26 0.25 56 day 418066.0 NA 43.3372.0 1.010
Air Temp. Relative Yield Bag Factor 5.60 Mix Temp. Initial set, min. Fine/Coarse by Vol 0.601 Bucket Full Technician who
conducted tests:
4375Sample Time Unit Weight (pcf) Act. w/c 0.450 Bucket Weight
Slump, in. Yield Des.Un.Wt. 139.67
Batch Time % Air Des. w/c 0.450 Unit Weight9/15/2011
Bucket Volume
Water Added/Withheld8/18/2011 3800
PLASTIC TEST RESULTS OTHER INFO
08/04/11 3190
Free H2O Content
Batch free H2O (lbs.)ADMIX INFORMATION
07/28/11 2940Type Brand / NameWR Type A Water Reducer
4x8 CYLINDERSTotal:
07/22/11 1820UW w/o Air: Aggregate Moistures
Coarse Aggregate 4:
Water Strength Test Results
Coarse Aggregate 2: Coarse Aggregate 3:
Sand 1: FA-1Coarse Aggregate 1: CA-1
Fly Ash: SCM-2 (Class F Fly Ash)GGBFS:
Cement 1: CS-B-3Cement 2:
Dry Specific Gravity
Agg. absorption
Agg. FMMaterial
MIX DESIGN INFODry mix 1 cu. yd. Wt. (lbs.)
Dry mix lab batch Wt. (lbs.)
Adjusted lab batch Wt. (lbs.)
Actual lab batch Wt.
(lbs.)Material Code
MIX NUMBER Mix 21 Gravel B3 75/25FDate: Mix Code: Size(c.f.):
State Study No. 239 - Influences on Strength Variability of Gravel Aggregate Concrete Comments / Notes / ObservationsCustomer: MDOT

149
Project: Lab #: BCDName: Set #: 1
5/5/2011 22 f'c: 4,000 psi 1.25 Factor: 0.05
Vol. (c.f.)
2.68 526.40 24.37 24.37 24.37 3.150.00 0.00 0.00 0.00 1.000.00 0.00 0.00 0.00 1.000.00 0.00 0.00 0.00 1.007.73 1264.55 58.54 58.54 58.54 2.621 0.34% 2.2112.39 2061.00 95.42 95.42 95.42 2.666 0.88% 6.450.00 0.00 0.00 0.000.00 0.00 0.00 0.000.00 0.00 0.00 0.00
Air: 1.50% 0.41 0.00 0.00 0.00Water: 3.80 236.88 10.97 12.01 12.01 1.00
"+-Air: 1.00% AGE psi Avg. psiDate
27.00 4088.83 189.30 190.34 1 day 2780153.74 153.74 154.59 1 day 2630
1 day 28107 day 6510
oz /cwt oz /cy ml /cy batch ml actual ml Sand: -0.34% -0.20 7 day 60103.05 16.1 474.8 22.0 22.0 CA 1 -0.88% -0.84 7 day 5990
CA 2 0.00% 0.00 14 day 6570CA 3 0.00% 0.00 14 day 6390CA 4 0.00% 0.00 14 day 6430
28 day 7110+/- h2o Added W/held 28 day 7080
28 day 68801:02 PM 3.75 56 day 76601:11 PM 150.20 7.82 56 day 7670
3.00 1.27 0.25 56 day 754068.4 NA 45.3773.4 1.020
MIX NUMBER Mix 22 Stone B1 100Date: Mix Code: Size(c.f.):
State Study No. 239 - Influences on Strength Variability of Gravel Aggregate Concrete Comments / Notes / ObservationsCustomer: MDOT
Cement 1: CS-B-1Cement 2:
Dry Specific Gravity
Agg. absorption
Agg. FMMaterial
MIX DESIGN INFODry mix 1 cu. yd. Wt. (lbs.)
Dry mix lab batch Wt. (lbs.)
Adjusted lab batch Wt. (lbs.)
Actual lab batch Wt.
(lbs.)Material Code
Sand 1: FA-1Coarse Aggregate 1: CA-2
Fly Ash:GGBFS:
Coarse Aggregate 4:
Water Strength Test Results
Coarse Aggregate 2: Coarse Aggregate 3:
4x8 CYLINDERSTotal:
05/06/11 2740UW w/o Air: Aggregate Moistures
05/19/11 6463
Free H2O Content
Batch free H2O (lbs.)ADMIX INFORMATION
05/12/11 6170Type Brand / NameWR Type A Water Reducer
Water Added/Withheld6/2/2011 7023
PLASTIC TEST RESULTS OTHER INFO
7623Sample Time Unit Weight (pcf) Act. w/c 0.450 Bucket Weight
Slump, in. Yield Des.Un.Wt. 151.44
Batch Time % Air Des. w/c 0.450 Unit Weight6/30/2011
Bucket Volume
Air Temp. Relative Yield Bag Factor 5.60 Mix Temp. Initial set, min. Fine/Coarse by Vol 0.624 Bucket Full Technician who
conducted tests:

150
Project: Lab #: BCDName: Set #: 1
5/5/2011 23 f'c: 4,000 psi 1.25 Factor: 0.05
Vol. (c.f.)
2.01 394.80 18.28 18.28 18.28 3.150.00 0.00 0.00 0.00 1.000.81 131.60 6.09 6.09 6.09 2.600.00 0.00 0.00 0.00 1.007.59 1241.39 57.47 57.47 57.47 2.621 0.34% 2.2112.39 2061.00 95.42 95.42 95.42 2.666 0.88% 6.450.00 0.00 0.00 0.000.00 0.00 0.00 0.000.00 0.00 0.00 0.00
Air: 1.50% 0.41 0.00 0.00 0.00Water: 3.80 236.88 10.97 12.00 12.00 1.00
"+-Air: 1.00% AGE psi Avg. psiDate
27.00 4065.67 188.23 189.26 1 day 1430152.87 152.87 153.71 1 day 1400
1 day 14107 day 5410
oz /cwt oz /cy ml /cy batch ml actual ml Sand: -0.34% -0.20 7 day 58103.05 16.1 474.8 22.0 22.0 CA 1 -0.88% -0.84 7 day 5720
CA 2 0.00% 0.00 14 day 6690CA 3 0.00% 0.00 14 day 6410CA 4 0.00% 0.00 14 day 6550
28 day 7320+/- h2o Added W/held 28 day 7280
28 day 72301:46 PM 2.75 56 day 77601:54 PM 150.72 7.82 56 day 8070
5.50 1.26 0.25 56 day 837067.8 NA 45.5073.3 1.010
MIX NUMBER Mix 23 Stone B1 75/25CDate: Mix Code: Size(c.f.):
State Study No. 239 - Influences on Strength Variability of Gravel Aggregate Concrete Comments / Notes / ObservationsCustomer: MDOT
Cement 1: CS-B-1Cement 2:
Dry Specific Gravity
Agg. absorption
Agg. FMMaterial
MIX DESIGN INFODry mix 1 cu. yd. Wt. (lbs.)
Dry mix lab batch Wt. (lbs.)
Adjusted lab batch Wt. (lbs.)
Actual lab batch Wt.
(lbs.)Material Code
Sand 1: FA-1Coarse Aggregate 1: CA-2
Fly Ash: SCM-1 (Class C Fly Ash)GGBFS:
Coarse Aggregate 4:
Water Strength Test Results
Coarse Aggregate 2: Coarse Aggregate 3:
4x8 CYLINDERSTotal:
05/06/11 1413UW w/o Air: Aggregate Moistures
05/19/11 6550
Free H2O Content
Batch free H2O (lbs.)ADMIX INFORMATION
05/12/11 5647Type Brand / NameWR Type A Water Reducer
Water Added/Withheld6/2/2011 7277
PLASTIC TEST RESULTS OTHER INFO
8067Sample Time Unit Weight (pcf) Act. w/c 0.450 Bucket Weight
Slump, in. Yield Des.Un.Wt. 150.58
Batch Time % Air Des. w/c 0.450 Unit Weight6/30/2011
Bucket Volume
Air Temp. Relative Yield Bag Factor 5.60 Mix Temp. Initial set, min. Fine/Coarse by Vol 0.613 Bucket Full Technician who
conducted tests:
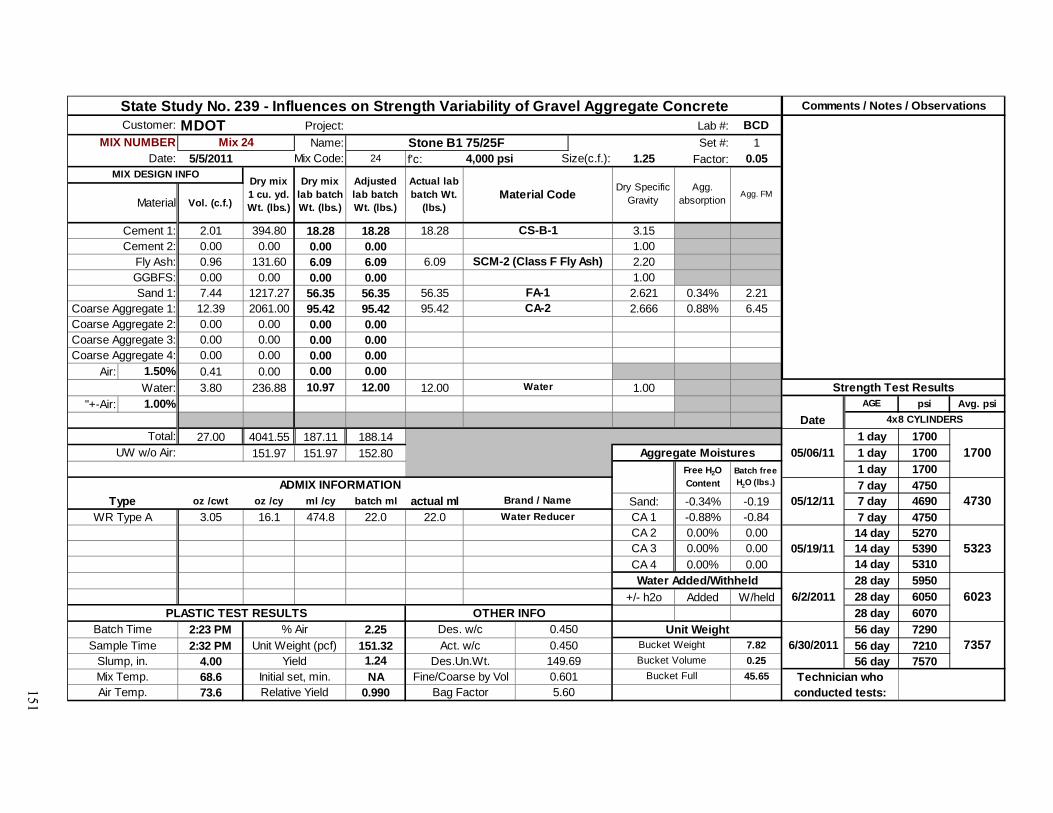
151
Project: Lab #: BCDName: Set #: 1
5/5/2011 24 f'c: 4,000 psi 1.25 Factor: 0.05
Vol. (c.f.)
2.01 394.80 18.28 18.28 18.28 3.150.00 0.00 0.00 0.00 1.000.96 131.60 6.09 6.09 6.09 2.200.00 0.00 0.00 0.00 1.007.44 1217.27 56.35 56.35 56.35 2.621 0.34% 2.2112.39 2061.00 95.42 95.42 95.42 2.666 0.88% 6.450.00 0.00 0.00 0.000.00 0.00 0.00 0.000.00 0.00 0.00 0.00
Air: 1.50% 0.41 0.00 0.00 0.00Water: 3.80 236.88 10.97 12.00 12.00 1.00
"+-Air: 1.00% AGE psi Avg. psiDate
27.00 4041.55 187.11 188.14 1 day 1700151.97 151.97 152.80 1 day 1700
1 day 17007 day 4750
oz /cwt oz /cy ml /cy batch ml actual ml Sand: -0.34% -0.19 7 day 46903.05 16.1 474.8 22.0 22.0 CA 1 -0.88% -0.84 7 day 4750
CA 2 0.00% 0.00 14 day 5270CA 3 0.00% 0.00 14 day 5390CA 4 0.00% 0.00 14 day 5310
28 day 5950+/- h2o Added W/held 28 day 6050
28 day 60702:23 PM 2.25 56 day 72902:32 PM 151.32 7.82 56 day 7210
4.00 1.24 0.25 56 day 757068.6 NA 45.6573.6 0.990
MIX NUMBER Mix 24 Stone B1 75/25FDate: Mix Code: Size(c.f.):
State Study No. 239 - Influences on Strength Variability of Gravel Aggregate Concrete Comments / Notes / ObservationsCustomer: MDOT
Cement 1: CS-B-1Cement 2:
Dry Specific Gravity
Agg. absorption
Agg. FMMaterial
MIX DESIGN INFODry mix 1 cu. yd. Wt. (lbs.)
Dry mix lab batch Wt. (lbs.)
Adjusted lab batch Wt. (lbs.)
Actual lab batch Wt.
(lbs.)Material Code
Sand 1: FA-1Coarse Aggregate 1: CA-2
Fly Ash: SCM-2 (Class F Fly Ash)GGBFS:
Coarse Aggregate 4:
Water Strength Test Results
Coarse Aggregate 2: Coarse Aggregate 3:
4x8 CYLINDERSTotal:
05/06/11 1700UW w/o Air: Aggregate Moistures
05/19/11 5323
Free H2O Content
Batch free H2O (lbs.)ADMIX INFORMATION
05/12/11 4730Type Brand / NameWR Type A Water Reducer
Water Added/Withheld6/2/2011 6023
PLASTIC TEST RESULTS OTHER INFO
7357Sample Time Unit Weight (pcf) Act. w/c 0.450 Bucket Weight
Slump, in. Yield Des.Un.Wt. 149.69
Batch Time % Air Des. w/c 0.450 Unit Weight6/30/2011
Bucket Volume
Air Temp. Relative Yield Bag Factor 5.60 Mix Temp. Initial set, min. Fine/Coarse by Vol 0.601 Bucket Full Technician who
conducted tests:

152
Project: Lab #: BCDName: Set #: 1
5/9/2011 25 f'c: 4,000 psi 1.25 Factor: 0.05
Vol. (c.f.)
2.68 526.40 24.37 24.37 24.37 3.150.00 0.00 0.00 0.00 1.000.00 0.00 0.00 0.00 1.000.00 0.00 0.00 0.00 1.007.73 1265.03 58.57 58.57 58.57 2.621 0.34% 2.2112.39 1790.00 82.87 82.87 82.87 2.316 4.67% 6.510.00 0.00 0.00 0.000.00 0.00 0.00 0.000.00 0.00 0.00 0.00
Air: 1.50% 0.41 0.00 0.00 0.00Water: 3.80 236.88 10.97 15.04 15.04 1.00
"+-Air: 1.00% AGE psi Avg. psiDate
27.00 3818.31 176.77 180.84 1 day 2070143.57 143.57 146.88 1 day 2310
1 day 21307 day 3610
oz /cwt oz /cy ml /cy batch ml actual ml Sand: -0.34% -0.20 7 day 37203.05 16.1 474.8 22.0 22.0 CA 1 -4.67% -3.87 7 day 3750
CA 2 0.00% 0.00 14 day 4030CA 3 0.00% 0.00 14 day 4260CA 4 0.00% 0.00 14 day 4050
28 day 4450+/- h2o Added W/held 28 day 4470
28 day 42009:13 AM 3.75 56 day 45209:22 AM 141.60 7.83 56 day 4990
3.00 1.28 0.25 56 day 486070.8 NA 43.2373.1 1.020
Air Temp. Relative Yield Bag Factor 5.60 Mix Temp. Initial set, min. Fine/Coarse by Vol 0.624 Bucket Full Technician who
conducted tests:
4790Sample Time Unit Weight (pcf) Act. w/c 0.450 Bucket Weight
Slump, in. Yield Des.Un.Wt. 141.42
Batch Time % Air Des. w/c 0.450 Unit Weight7/4/2011
Bucket Volume
Water Added/Withheld6/6/2011 4373
PLASTIC TEST RESULTS OTHER INFO
05/23/11 4113
Free H2O Content
Batch free H2O (lbs.)ADMIX INFORMATION
05/16/11 3693Type Brand / NameWR Type A Water Reducer
4x8 CYLINDERSTotal:
05/10/11 2170UW w/o Air: Aggregate Moistures
Coarse Aggregate 4:
Water Strength Test Results
Coarse Aggregate 2: Coarse Aggregate 3:
Sand 1: FA-1Coarse Aggregate 1: CA-1
Fly Ash:GGBFS:
Cement 1: CS-C-1Cement 2:
Dry Specific Gravity
Agg. absorption
Agg. FMMaterial
MIX DESIGN INFODry mix 1 cu. yd. Wt. (lbs.)
Dry mix lab batch Wt. (lbs.)
Adjusted lab batch Wt. (lbs.)
Actual lab batch Wt.
(lbs.)Material Code
MIX NUMBER Mix 25 Gravel C1 100Date: Mix Code: Size(c.f.):
State Study No. 239 - Influences on Strength Variability of Gravel Aggregate Concrete Comments / Notes / ObservationsCustomer: MDOT

153
Project: Lab #: BCDName: Set #: 1
5/9/2011 26 f'c: 4,000 psi 1.25 Factor: 0.05
Vol. (c.f.)
2.01 394.80 18.28 18.28 18.28 3.150.00 0.00 0.00 0.00 1.000.81 131.60 6.09 6.09 6.09 2.600.00 0.00 0.00 0.00 1.007.59 1241.87 57.49 57.49 57.49 2.621 0.34% 2.2112.39 1790.00 82.87 82.87 82.87 2.316 4.67% 6.510.00 0.00 0.00 0.000.00 0.00 0.00 0.000.00 0.00 0.00 0.00
Air: 1.50% 0.41 0.00 0.00 0.00Water: 3.80 236.88 10.97 15.03 15.03 1.00
"+-Air: 1.00% AGE psi Avg. psiDate
27.00 3795.15 175.70 179.77 1 day 1410142.70 142.70 146.00 1 day 1370
1 day 13407 day 3010
oz /cwt oz /cy ml /cy batch ml actual ml Sand: -0.34% -0.20 7 day 32103.05 16.1 474.8 22.0 22.0 CA 1 -4.67% -3.87 7 day 3060
CA 2 0.00% 0.00 14 day 3570CA 3 0.00% 0.00 14 day "3190"CA 4 0.00% 0.00 14 day 3450
28 day 3830+/- h2o Added W/held 28 day "4380"
28 day 38009:54 AM 2.50 56 day 402010:03 AM 142.52 7.83 56 day "3630"
5.75 1.26 0.25 56 day 428068.2 NA 43.4673.8 1.010
Air Temp. Relative Yield Bag Factor 5.60 Mix Temp. Initial set, min. Fine/Coarse by Vol 0.613 Bucket Full Technician who
conducted tests:
4150Sample Time Unit Weight (pcf) Act. w/c 0.450 Bucket Weight
Slump, in. Yield Des.Un.Wt. 140.56
Batch Time % Air Des. w/c 0.450 Unit Weight7/4/2011
Bucket Volume
Water Added/Withheld6/6/2011 3815
PLASTIC TEST RESULTS OTHER INFO
05/23/11 3510
Free H2O Content
Batch free H2O (lbs.)ADMIX INFORMATION
05/16/11 3093Type Brand / NameWR Type A Water Reducer
4x8 CYLINDERSTotal:
05/10/11 1373UW w/o Air: Aggregate Moistures
Coarse Aggregate 4:
Water Strength Test Results
Coarse Aggregate 2: Coarse Aggregate 3:
Sand 1: FA-1Coarse Aggregate 1: CA-1
Fly Ash: SCM-1 (Class C Fly Ash)GGBFS:
Cement 1: CS-C-1Cement 2:
Dry Specific Gravity
Agg. absorption
Agg. FMMaterial
MIX DESIGN INFODry mix 1 cu. yd. Wt. (lbs.)
Dry mix lab batch Wt. (lbs.)
Adjusted lab batch Wt. (lbs.)
Actual lab batch Wt.
(lbs.)Material Code
MIX NUMBER Mix 26 Gravel C1 75/25CDate: Mix Code: Size(c.f.):
State Study No. 239 - Influences on Strength Variability of Gravel Aggregate Concrete Comments / Notes / ObservationsCustomer: MDOT
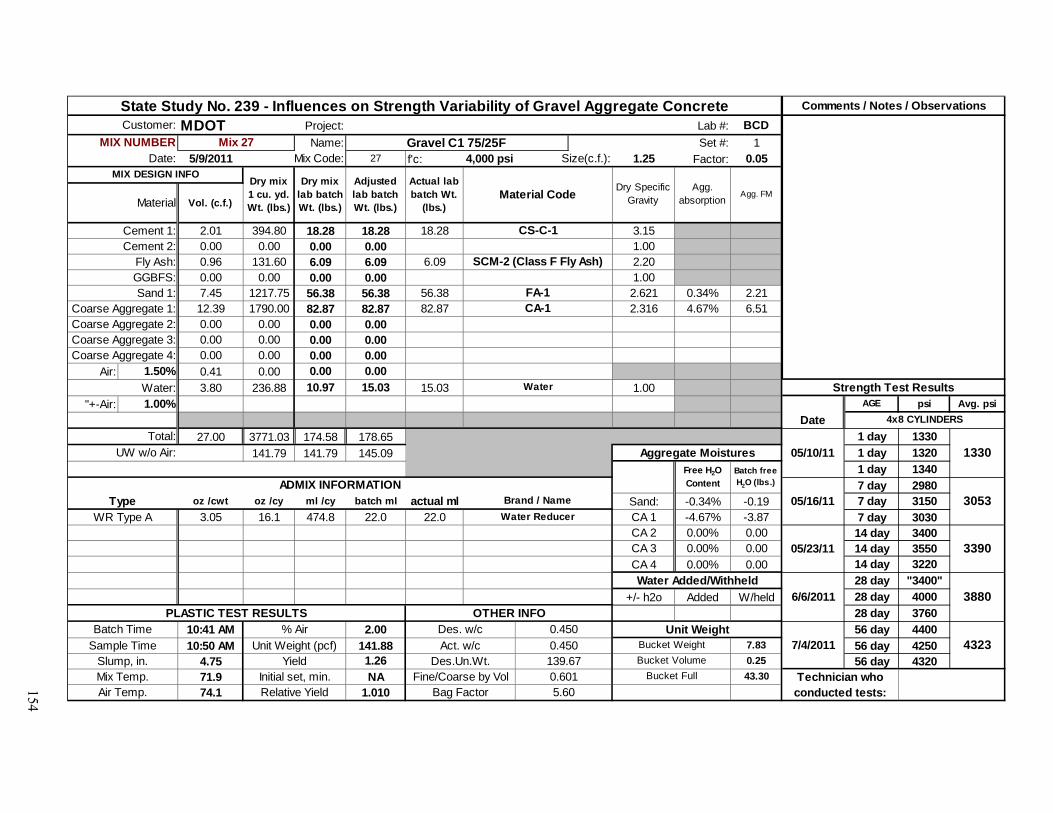
154
Project: Lab #: BCDName: Set #: 1
5/9/2011 27 f'c: 4,000 psi 1.25 Factor: 0.05
Vol. (c.f.)
2.01 394.80 18.28 18.28 18.28 3.150.00 0.00 0.00 0.00 1.000.96 131.60 6.09 6.09 6.09 2.200.00 0.00 0.00 0.00 1.007.45 1217.75 56.38 56.38 56.38 2.621 0.34% 2.2112.39 1790.00 82.87 82.87 82.87 2.316 4.67% 6.510.00 0.00 0.00 0.000.00 0.00 0.00 0.000.00 0.00 0.00 0.00
Air: 1.50% 0.41 0.00 0.00 0.00Water: 3.80 236.88 10.97 15.03 15.03 1.00
"+-Air: 1.00% AGE psi Avg. psiDate
27.00 3771.03 174.58 178.65 1 day 1330141.79 141.79 145.09 1 day 1320
1 day 13407 day 2980
oz /cwt oz /cy ml /cy batch ml actual ml Sand: -0.34% -0.19 7 day 31503.05 16.1 474.8 22.0 22.0 CA 1 -4.67% -3.87 7 day 3030
CA 2 0.00% 0.00 14 day 3400CA 3 0.00% 0.00 14 day 3550CA 4 0.00% 0.00 14 day 3220
28 day "3400"+/- h2o Added W/held 28 day 4000
28 day 376010:41 AM 2.00 56 day 440010:50 AM 141.88 7.83 56 day 4250
4.75 1.26 0.25 56 day 432071.9 NA 43.3074.1 1.010
Air Temp. Relative Yield Bag Factor 5.60 Mix Temp. Initial set, min. Fine/Coarse by Vol 0.601 Bucket Full Technician who
conducted tests:
4323Sample Time Unit Weight (pcf) Act. w/c 0.450 Bucket Weight
Slump, in. Yield Des.Un.Wt. 139.67
Batch Time % Air Des. w/c 0.450 Unit Weight7/4/2011
Bucket Volume
Water Added/Withheld6/6/2011 3880
PLASTIC TEST RESULTS OTHER INFO
05/23/11 3390
Free H2O Content
Batch free H2O (lbs.)ADMIX INFORMATION
05/16/11 3053Type Brand / NameWR Type A Water Reducer
4x8 CYLINDERSTotal:
05/10/11 1330UW w/o Air: Aggregate Moistures
Coarse Aggregate 4:
Water Strength Test Results
Coarse Aggregate 2: Coarse Aggregate 3:
Sand 1: FA-1Coarse Aggregate 1: CA-1
Fly Ash: SCM-2 (Class F Fly Ash)GGBFS:
Cement 1: CS-C-1Cement 2:
Dry Specific Gravity
Agg. absorption
Agg. FMMaterial
MIX DESIGN INFODry mix 1 cu. yd. Wt. (lbs.)
Dry mix lab batch Wt. (lbs.)
Adjusted lab batch Wt. (lbs.)
Actual lab batch Wt.
(lbs.)Material Code
MIX NUMBER Mix 27 Gravel C1 75/25FDate: Mix Code: Size(c.f.):
State Study No. 239 - Influences on Strength Variability of Gravel Aggregate Concrete Comments / Notes / ObservationsCustomer: MDOT

155
Project: Lab #: BCDName: Set #: 1
6/13/2011 28 f'c: 4,000 psi 1.25 Factor: 0.05
Vol. (c.f.)
2.68 526.40 24.37 24.37 24.37 3.150.00 0.00 0.00 0.00 1.000.00 0.00 0.00 0.00 1.000.00 0.00 0.00 0.00 1.007.73 1265.03 58.57 58.57 58.57 2.621 0.34% 2.2112.39 1790.00 82.87 82.87 82.87 2.316 4.67% 6.510.00 0.00 0.00 0.000.00 0.00 0.00 0.000.00 0.00 0.00 0.00
Air: 1.50% 0.41 0.00 0.00 0.00Water: 3.80 236.88 10.97 15.04 15.04 1.00
"+-Air: 1.00% AGE psi Avg. psiDate
27.00 3818.31 176.77 180.84 1 day 2360143.57 143.57 146.88 1 day 2280
1 day 20607 day 4290
oz /cwt oz /cy ml /cy batch ml actual ml Sand: -0.34% -0.20 7 day 42903.05 16.1 474.8 22.0 22.0 CA 1 -4.67% -3.87 7 day 4220
CA 2 0.00% 0.00 14 day 4560CA 3 0.00% 0.00 14 day 4530CA 4 0.00% 0.00 14 day 4580
28 day 4490+/- h2o Added W/held 28 day 4630
28 day 48801:37 PM 3.00 56 day 46701:46 PM 141.84 7.83 56 day 4970
3.50 1.28 0.25 56 day 511075.7 NA 43.2981.7 1.020
MIX NUMBER Mix 28 Gravel C2 100Date: Mix Code: Size(c.f.):
State Study No. 239 - Influences on Strength Variability of Gravel Aggregate Concrete Comments / Notes / ObservationsCustomer: MDOT
Cement 1: CS-C-2Cement 2:
Dry Specific Gravity
Agg. absorption
Agg. FMMaterial
MIX DESIGN INFODry mix 1 cu. yd. Wt. (lbs.)
Dry mix lab batch Wt. (lbs.)
Adjusted lab batch Wt. (lbs.)
Actual lab batch Wt.
(lbs.)Material Code
Sand 1: FA-1Coarse Aggregate 1: CA-1
Fly Ash:GGBFS:
Coarse Aggregate 4:
Water Strength Test Results
Coarse Aggregate 2: Coarse Aggregate 3:
4x8 CYLINDERSTotal:
06/14/11 2233UW w/o Air: Aggregate Moistures
06/27/11 4557
Free H2O Content
Batch free H2O (lbs.)ADMIX INFORMATION
06/20/11 4267Type Brand / NameWR Type A Water Reducer
Water Added/Withheld7/11/2011 4667
PLASTIC TEST RESULTS OTHER INFO
4917Sample Time Unit Weight (pcf) Act. w/c 0.450 Bucket Weight
Slump, in. Yield Des.Un.Wt. 141.42
Batch Time % Air Des. w/c 0.450 Unit Weight8/8/2011
Bucket Volume
Air Temp. Relative Yield Bag Factor 5.60 Mix Temp. Initial set, min. Fine/Coarse by Vol 0.624 Bucket Full Technician who
conducted tests:

156
Project: Lab #: BCDName: Set #: 1
6/13/2011 29 f'c: 4,000 psi 1.25 Factor: 0.05
Vol. (c.f.)
2.01 394.80 18.28 18.28 18.28 3.150.00 0.00 0.00 0.00 1.000.81 131.60 6.09 6.09 6.09 2.600.00 0.00 0.00 0.00 1.007.59 1241.87 57.49 57.49 57.49 2.621 0.34% 2.2112.39 1790.00 82.87 82.87 82.87 2.316 4.67% 6.510.00 0.00 0.00 0.000.00 0.00 0.00 0.000.00 0.00 0.00 0.00
Air: 1.50% 0.41 0.00 0.00 0.00Water: 3.80 236.88 10.97 15.03 15.03 1.00
"+-Air: 1.00% AGE psi Avg. psiDate
27.00 3795.15 175.70 179.77 1 day 1240142.70 142.70 146.00 1 day 1420
1 day 14207 day 3570
oz /cwt oz /cy ml /cy batch ml actual ml Sand: -0.34% -0.20 7 day 36203.05 16.1 474.8 22.0 22.0 CA 1 -4.67% -3.87 7 day "3170"
CA 2 0.00% 0.00 14 day 3540CA 3 0.00% 0.00 14 day 3760CA 4 0.00% 0.00 14 day 3860
28 day 4040+/- h2o Added W/held 28 day 4210
28 day 41402:11 AM 2.50 56 day 42102:20 AM 142.60 7.83 56 day 4640
5.75 1.26 0.25 56 day 451072.2 NA 43.4881.0 1.010
MIX NUMBER Mix 29 Gravel C2 75/25CDate: Mix Code: Size(c.f.):
State Study No. 239 - Influences on Strength Variability of Gravel Aggregate Concrete Comments / Notes / ObservationsCustomer: MDOT
Cement 1: CS-C-2Cement 2:
Dry Specific Gravity
Agg. absorption
Agg. FMMaterial
MIX DESIGN INFODry mix 1 cu. yd. Wt. (lbs.)
Dry mix lab batch Wt. (lbs.)
Adjusted lab batch Wt. (lbs.)
Actual lab batch Wt.
(lbs.)Material Code
Sand 1: FA-1Coarse Aggregate 1: CA-1
Fly Ash: SCM-1 (Class C Fly Ash)GGBFS:
Coarse Aggregate 4:
Water Strength Test Results
Coarse Aggregate 2: Coarse Aggregate 3:
4x8 CYLINDERSTotal:
06/14/11 1360UW w/o Air: Aggregate Moistures
06/27/11 3720
Free H2O Content
Batch free H2O (lbs.)ADMIX INFORMATION
06/20/11 3595Type Brand / NameWR Type A Water Reducer
Water Added/Withheld7/11/2011 4130
PLASTIC TEST RESULTS OTHER INFO
4453Sample Time Unit Weight (pcf) Act. w/c 0.450 Bucket Weight
Slump, in. Yield Des.Un.Wt. 140.56
Batch Time % Air Des. w/c 0.450 Unit Weight8/8/2011
Bucket Volume
Air Temp. Relative Yield Bag Factor 5.60 Mix Temp. Initial set, min. Fine/Coarse by Vol 0.613 Bucket Full Technician who
conducted tests:

157
Project: Lab #: BCDName: Set #: 1
6/13/2011 30 f'c: 4,000 psi 1.25 Factor: 0.05
Vol. (c.f.)
2.01 394.80 18.28 18.28 18.28 3.150.00 0.00 0.00 0.00 1.000.96 131.60 6.09 6.09 6.09 2.200.00 0.00 0.00 0.00 1.007.45 1217.75 56.38 56.38 56.38 2.621 0.34% 2.2112.39 1790.00 82.87 82.87 82.87 2.316 4.67% 6.510.00 0.00 0.00 0.000.00 0.00 0.00 0.000.00 0.00 0.00 0.00
Air: 1.50% 0.41 0.00 0.00 0.00Water: 3.80 236.88 10.97 15.03 15.03 1.00
"+-Air: 1.00% AGE psi Avg. psiDate
27.00 3771.03 174.58 178.65 1 day 1360141.79 141.79 145.09 1 day 1310
1 day 13907 day 3020
oz /cwt oz /cy ml /cy batch ml actual ml Sand: -0.34% -0.19 7 day 33003.05 16.1 474.8 22.0 22.0 CA 1 -4.67% -3.87 7 day 2980
CA 2 0.00% 0.00 14 day 3460CA 3 0.00% 0.00 14 day 3420CA 4 0.00% 0.00 14 day 3400
28 day 3900+/- h2o Added W/held 28 day 3950
28 day 42102:48 AM 2.00 56 day 42002:57 AM 142.28 7.83 56 day 4580
4.50 1.26 0.25 56 day 451072.2 NA 43.4080.6 1.010
MIX NUMBER Mix 30 Gravel C2 75/25FDate: Mix Code: Size(c.f.):
State Study No. 239 - Influences on Strength Variability of Gravel Aggregate Concrete Comments / Notes / ObservationsCustomer: MDOT
Cement 1: CS-C-2Cement 2:
Dry Specific Gravity
Agg. absorption
Agg. FMMaterial
MIX DESIGN INFODry mix 1 cu. yd. Wt. (lbs.)
Dry mix lab batch Wt. (lbs.)
Adjusted lab batch Wt. (lbs.)
Actual lab batch Wt.
(lbs.)Material Code
Sand 1: FA-1Coarse Aggregate 1: CA-1
Fly Ash: SCM-2 (Class F Fly Ash)GGBFS:
Coarse Aggregate 4:
Water Strength Test Results
Coarse Aggregate 2: Coarse Aggregate 3:
4x8 CYLINDERSTotal:
06/14/11 1353UW w/o Air: Aggregate Moistures
06/27/11 3427
Free H2O Content
Batch free H2O (lbs.)ADMIX INFORMATION
06/20/11 3100Type Brand / NameWR Type A Water Reducer
Water Added/Withheld7/11/2011 4020
PLASTIC TEST RESULTS OTHER INFO
4430Sample Time Unit Weight (pcf) Act. w/c 0.450 Bucket Weight
Slump, in. Yield Des.Un.Wt. 139.67
Batch Time % Air Des. w/c 0.450 Unit Weight8/8/2011
Bucket Volume
Air Temp. Relative Yield Bag Factor 5.60 Mix Temp. Initial set, min. Fine/Coarse by Vol 0.601 Bucket Full Technician who
conducted tests:

158
Project: Lab #: BCDName: Set #: 1
7/25/2011 31 f'c: 4,000 psi 1.25 Factor: 0.05
Vol. (c.f.)
2.68 526.40 24.37 24.37 24.37 3.150.00 0.00 0.00 0.00 1.000.00 0.00 0.00 0.00 1.000.00 0.00 0.00 0.00 1.007.73 1265.03 58.57 58.57 58.57 2.621 0.34% 2.2112.39 1790.00 82.87 82.87 82.87 2.316 4.67% 6.510.00 0.00 0.00 0.000.00 0.00 0.00 0.000.00 0.00 0.00 0.00
Air: 1.50% 0.41 0.00 0.00 0.00Water: 3.80 236.88 10.97 15.04 15.04 1.00
"+-Air: 1.00% AGE psi Avg. psiDate
27.00 3818.31 176.77 180.84 1 day 1900143.57 143.57 146.88 1 day 1920
1 day 19707 day "3530"
oz /cwt oz /cy ml /cy batch ml actual ml Sand: -0.34% -0.20 7 day 40103.05 16.1 474.8 22.0 22.0 CA 1 -4.67% -3.87 7 day 3920
CA 2 0.00% 0.00 14 day 4190CA 3 0.00% 0.00 14 day 4230CA 4 0.00% 0.00 14 day 4130
28 day 4470+/- h2o Added W/held 28 day 4480
28 day 429012:21 PM 3.50 56 day 493012:30 PM 141.36 7.86 56 day 4830
3.00 1.28 0.25 56 day 506074.8 NA 43.2075.1 1.020
MIX NUMBER Mix 31 Gravel C3 100Date: Mix Code: Size(c.f.):
State Study No. 239 - Influences on Strength Variability of Gravel Aggregate Concrete Comments / Notes / ObservationsCustomer: MDOT
Cement 1: CS-C-3Cement 2:
Dry Specific Gravity
Agg. absorption
Agg. FMMaterial
MIX DESIGN INFODry mix 1 cu. yd. Wt. (lbs.)
Dry mix lab batch Wt. (lbs.)
Adjusted lab batch Wt. (lbs.)
Actual lab batch Wt.
(lbs.)Material Code
Sand 1: FA-1Coarse Aggregate 1: CA-1
Fly Ash:GGBFS:
Coarse Aggregate 4:
Water Strength Test Results
Coarse Aggregate 2: Coarse Aggregate 3:
4x8 CYLINDERSTotal:
07/26/11 1930UW w/o Air: Aggregate Moistures
08/08/11 4183
Free H2O Content
Batch free H2O (lbs.)ADMIX INFORMATION
08/01/11 3965Type Brand / NameWR Type A Water Reducer
Water Added/Withheld8/22/2011 4413
PLASTIC TEST RESULTS OTHER INFO
4940Sample Time Unit Weight (pcf) Act. w/c 0.450 Bucket Weight
Slump, in. Yield Des.Un.Wt. 141.42
Batch Time % Air Des. w/c 0.450 Unit Weight9/19/2011
Bucket Volume
Air Temp. Relative Yield Bag Factor 5.60 Mix Temp. Initial set, min. Fine/Coarse by Vol 0.624 Bucket Full Technician who
conducted tests:

159
Project: Lab #: BCDName: Set #: 1
7/25/2011 32 f'c: 4,000 psi 1.25 Factor: 0.05
Vol. (c.f.)
2.01 394.80 18.28 18.28 18.28 3.150.00 0.00 0.00 0.00 1.000.81 131.60 6.09 6.09 6.09 2.600.00 0.00 0.00 0.00 1.007.59 1241.87 57.49 57.49 57.49 2.621 0.34% 2.2112.39 1790.00 82.87 82.87 82.87 2.316 4.67% 6.510.00 0.00 0.00 0.000.00 0.00 0.00 0.000.00 0.00 0.00 0.00
Air: 1.50% 0.41 0.00 0.00 0.00Water: 3.80 236.88 10.97 15.03 15.03 1.00
"+-Air: 1.00% AGE psi Avg. psiDate
27.00 3795.15 175.70 179.77 1 day 1320142.70 142.70 146.00 1 day 1250
1 day 12707 day 3000
oz /cwt oz /cy ml /cy batch ml actual ml Sand: -0.34% -0.20 7 day 31103.05 16.1 474.8 22.0 22.0 CA 1 -4.67% -3.87 7 day 2930
CA 2 0.00% 0.00 14 day 4410CA 3 0.00% 0.00 14 day 4530CA 4 0.00% 0.00 14 day 4430
28 day 4860+/- h2o Added W/held 28 day 4870
28 day 48601:04 PM 2.50 56 day 43801:13 PM 142.76 7.86 56 day 5060
4.50 1.26 0.25 56 day "4150"70.7 NA 43.5575.6 1.010
MIX NUMBER Mix 32 Gravel C3 75/25CDate: Mix Code: Size(c.f.):
State Study No. 239 - Influences on Strength Variability of Gravel Aggregate Concrete Comments / Notes / ObservationsCustomer: MDOT
Cement 1: CS-C-3Cement 2:
Dry Specific Gravity
Agg. absorption
Agg. FMMaterial
MIX DESIGN INFODry mix 1 cu. yd. Wt. (lbs.)
Dry mix lab batch Wt. (lbs.)
Adjusted lab batch Wt. (lbs.)
Actual lab batch Wt.
(lbs.)Material Code
Sand 1: FA-1Coarse Aggregate 1: CA-1
Fly Ash: SCM-1 (Class C Fly Ash)GGBFS:
Coarse Aggregate 4:
Water Strength Test Results
Coarse Aggregate 2: Coarse Aggregate 3:
4x8 CYLINDERSTotal:
07/26/11 1280UW w/o Air: Aggregate Moistures
08/08/11 4457
Free H2O Content
Batch free H2O (lbs.)ADMIX INFORMATION
08/01/11 3013Type Brand / NameWR Type A Water Reducer
Water Added/Withheld8/22/2011 4863
PLASTIC TEST RESULTS OTHER INFO
4720Sample Time Unit Weight (pcf) Act. w/c 0.450 Bucket Weight
Slump, in. Yield Des.Un.Wt. 140.56
Batch Time % Air Des. w/c 0.450 Unit Weight9/19/2011
Bucket Volume
Air Temp. Relative Yield Bag Factor 5.60 Mix Temp. Initial set, min. Fine/Coarse by Vol 0.613 Bucket Full Technician who
conducted tests:

160
Project: Lab #: BCDName: Set #: 1
7/25/2011 33 f'c: 4,000 psi 1.25 Factor: 0.05
Vol. (c.f.)
2.01 394.80 18.28 18.28 18.28 3.150.00 0.00 0.00 0.00 1.000.96 131.60 6.09 6.09 6.09 2.200.00 0.00 0.00 0.00 1.007.45 1217.75 56.38 56.38 56.38 2.621 0.34% 2.2112.39 1790.00 82.87 82.87 82.87 2.316 4.67% 6.510.00 0.00 0.00 0.000.00 0.00 0.00 0.000.00 0.00 0.00 0.00
Air: 1.50% 0.41 0.00 0.00 0.00Water: 3.80 236.88 10.97 15.03 15.03 1.00
"+-Air: 1.00% AGE psi Avg. psiDate
27.00 3771.03 174.58 178.65 1 day 1230141.79 141.79 145.09 1 day 1310
1 day 13107 day 2930
oz /cwt oz /cy ml /cy batch ml actual ml Sand: -0.34% -0.19 7 day 29003.05 16.1 474.8 22.0 22.0 CA 1 -4.67% -3.87 7 day 2810
CA 2 0.00% 0.00 14 day 4320CA 3 0.00% 0.00 14 day 4440CA 4 0.00% 0.00 14 day 4440
28 day 4860+/- h2o Added W/held 28 day 4920
28 day 50101:46 PM 2.25 56 day 48001:55 PM 141.56 7.86 56 day 4710
4.25 1.26 0.25 56 day 482069.8 NA 43.2575.2 1.010
MIX NUMBER Mix 33 Gravel C3 75/25FDate: Mix Code: Size(c.f.):
State Study No. 239 - Influences on Strength Variability of Gravel Aggregate Concrete Comments / Notes / ObservationsCustomer: MDOT
Cement 1: CS-C-3Cement 2:
Dry Specific Gravity
Agg. absorption
Agg. FMMaterial
MIX DESIGN INFODry mix 1 cu. yd. Wt. (lbs.)
Dry mix lab batch Wt. (lbs.)
Adjusted lab batch Wt. (lbs.)
Actual lab batch Wt.
(lbs.)Material Code
Sand 1: FA-1Coarse Aggregate 1: CA-1
Fly Ash: SCM-2 (Class F Fly Ash)GGBFS:
Coarse Aggregate 4:
Water Strength Test Results
Coarse Aggregate 2: Coarse Aggregate 3:
4x8 CYLINDERSTotal:
07/26/11 1283UW w/o Air: Aggregate Moistures
08/08/11 4400
Free H2O Content
Batch free H2O (lbs.)ADMIX INFORMATION
08/01/11 2880Type Brand / NameWR Type A Water Reducer
Water Added/Withheld8/22/2011 4930
PLASTIC TEST RESULTS OTHER INFO
4777Sample Time Unit Weight (pcf) Act. w/c 0.450 Bucket Weight
Slump, in. Yield Des.Un.Wt. 139.67
Batch Time % Air Des. w/c 0.450 Unit Weight9/19/2011
Bucket Volume
Air Temp. Relative Yield Bag Factor 5.60 Mix Temp. Initial set, min. Fine/Coarse by Vol 0.601 Bucket Full Technician who
conducted tests:

161
Project: Lab #: BCDName: Set #: 1
5/10/2011 34 f'c: 4,000 psi 1.25 Factor: 0.05
Vol. (c.f.)
2.68 526.40 24.37 24.37 24.37 3.150.00 0.00 0.00 0.00 1.000.00 0.00 0.00 0.00 1.000.00 0.00 0.00 0.00 1.007.73 1264.55 58.54 58.54 58.54 2.621 0.34% 2.2112.39 2061.00 95.42 95.42 95.42 2.666 0.88% 6.450.00 0.00 0.00 0.000.00 0.00 0.00 0.000.00 0.00 0.00 0.00
Air: 1.50% 0.41 0.00 0.00 0.00Water: 3.80 236.88 10.97 12.01 12.01 1.00
"+-Air: 1.00% AGE psi Avg. psiDate
27.00 4088.83 189.30 190.34 1 day 3360153.74 153.74 154.59 1 day 3280
1 day 33207 day 5590
oz /cwt oz /cy ml /cy batch ml actual ml Sand: -0.34% -0.20 7 day 56603.05 16.1 474.8 22.0 22.0 CA 1 -0.88% -0.84 7 day 5830
CA 2 0.00% 0.00 14 day 6050CA 3 0.00% 0.00 14 day 6260CA 4 0.00% 0.00 14 day 6150
28 day 6610+/- h2o Added W/held 28 day 6570
28 day 65502:09 PM 3.50 56 day 70402:18 PM 150.24 7.83 56 day 7260
1.75 1.27 0.25 56 day 703072.5 NA 45.3976.0 1.020
MIX NUMBER Mix 34 Stone C1 100Date: Mix Code: Size(c.f.):
State Study No. 239 - Influences on Strength Variability of Gravel Aggregate Concrete Comments / Notes / ObservationsCustomer: MDOT
Cement 1: CS-C-1Cement 2:
Dry Specific Gravity
Agg. absorption
Agg. FMMaterial
MIX DESIGN INFODry mix 1 cu. yd. Wt. (lbs.)
Dry mix lab batch Wt. (lbs.)
Adjusted lab batch Wt. (lbs.)
Actual lab batch Wt.
(lbs.)Material Code
Sand 1: FA-1Coarse Aggregate 1: CA-2
Fly Ash:GGBFS:
Coarse Aggregate 4:
Water Strength Test Results
Coarse Aggregate 2: Coarse Aggregate 3:
4x8 CYLINDERSTotal:
05/11/11 3320UW w/o Air: Aggregate Moistures
05/24/11 6153
Free H2O Content
Batch free H2O (lbs.)ADMIX INFORMATION
05/17/11 5693Type Brand / NameWR Type A Water Reducer
Water Added/Withheld6/7/2011 6577
PLASTIC TEST RESULTS OTHER INFO
7110Sample Time Unit Weight (pcf) Act. w/c 0.450 Bucket Weight
Slump, in. Yield Des.Un.Wt. 151.44
Batch Time % Air Des. w/c 0.450 Unit Weight7/5/2011
Bucket Volume
Air Temp. Relative Yield Bag Factor 5.60 Mix Temp. Initial set, min. Fine/Coarse by Vol 0.624 Bucket Full Technician who
conducted tests:

162
Project: Lab #: BCDName: Set #: 1
5/10/2011 35 f'c: 4,000 psi 1.25 Factor: 0.05
Vol. (c.f.)
2.01 394.80 18.28 18.28 18.28 3.150.00 0.00 0.00 0.00 1.000.81 131.60 6.09 6.09 6.09 2.600.00 0.00 0.00 0.00 1.007.59 1241.39 57.47 57.47 57.47 2.621 0.34% 2.2112.39 2061.00 95.42 95.42 95.42 2.666 0.88% 6.450.00 0.00 0.00 0.000.00 0.00 0.00 0.000.00 0.00 0.00 0.00
Air: 1.50% 0.41 0.00 0.00 0.00Water: 3.80 236.88 10.97 12.00 12.00 1.00
"+-Air: 1.00% AGE psi Avg. psiDate
27.00 4065.67 188.23 189.26 1 day 2320152.87 152.87 153.71 1 day 2270
1 day7 day 5950
oz /cwt oz /cy ml /cy batch ml actual ml Sand: -0.34% -0.20 7 day 59003.05 16.1 474.8 22.0 22.0 CA 1 -0.88% -0.84 7 day 6140
CA 2 0.00% 0.00 14 day 6570CA 3 0.00% 0.00 14 day 6520CA 4 0.00% 0.00 14 day 6680
28 day 7640+/- h2o Added W/held 28 day 7840
28 day 74902:46 PM 2.25 56 day 79802:55 PM 151.56 7.83 56 day 7940
3.00 1.25 0.25 56 day 806071.5 NA 45.7275.6 1.000
MIX NUMBER Mix 35 Stone C1 75/25CDate: Mix Code: Size(c.f.):
State Study No. 239 - Influences on Strength Variability of Gravel Aggregate Concrete Comments / Notes / ObservationsCustomer: MDOT
Cement 1: CS-C-1Cement 2:
Dry Specific Gravity
Agg. absorption
Agg. FMMaterial
MIX DESIGN INFODry mix 1 cu. yd. Wt. (lbs.)
Dry mix lab batch Wt. (lbs.)
Adjusted lab batch Wt. (lbs.)
Actual lab batch Wt.
(lbs.)Material Code
Sand 1: FA-1Coarse Aggregate 1: CA-2
Fly Ash: SCM-1 (Class C Fly Ash)GGBFS:
Coarse Aggregate 4:
Water Strength Test Results
Coarse Aggregate 2: Coarse Aggregate 3:
4x8 CYLINDERSTotal:
05/11/11 2295UW w/o Air: Aggregate Moistures
05/24/11 6590
Free H2O Content
Batch free H2O (lbs.)ADMIX INFORMATION
05/17/11 5997Type Brand / NameWR Type A Water Reducer
Water Added/Withheld6/7/2011 7657
PLASTIC TEST RESULTS OTHER INFO
7993Sample Time Unit Weight (pcf) Act. w/c 0.450 Bucket Weight
Slump, in. Yield Des.Un.Wt. 150.58
Batch Time % Air Des. w/c 0.450 Unit Weight7/5/2011
Bucket Volume
Air Temp. Relative Yield Bag Factor 5.60 Mix Temp. Initial set, min. Fine/Coarse by Vol 0.613 Bucket Full Technician who
conducted tests:

163
Project: Lab #: BCDName: Set #: 1
5/10/2011 36 f'c: 4,000 psi 1.25 Factor: 0.05
Vol. (c.f.)
2.01 394.80 18.28 18.28 18.28 3.150.00 0.00 0.00 0.00 1.000.96 131.60 6.09 6.09 6.09 2.200.00 0.00 0.00 0.00 1.007.44 1217.27 56.35 56.35 56.35 2.621 0.34% 2.2112.39 2061.00 95.42 95.42 95.42 2.666 0.88% 6.450.00 0.00 0.00 0.000.00 0.00 0.00 0.000.00 0.00 0.00 0.00
Air: 1.50% 0.41 0.00 0.00 0.00Water: 3.80 236.88 10.97 12.00 12.00 1.00
"+-Air: 1.00% AGE psi Avg. psiDate
27.00 4041.55 187.11 188.14 1 day 2300151.97 151.97 152.80 1 day 2190
1 day 21407 day 4670
oz /cwt oz /cy ml /cy batch ml actual ml Sand: -0.34% -0.19 7 day 49503.05 16.1 474.8 22.0 22.0 CA 1 -0.88% -0.84 7 day "4400"
CA 2 0.00% 0.00 14 day 5370CA 3 0.00% 0.00 14 day 5270CA 4 0.00% 0.00 14 day 5090
28 day 5660+/- h2o Added W/held 28 day 5930
28 day 57603:19 PM 2.25 56 day 66803:28 PM 150.68 7.83 56 day 6650
3.25 1.25 0.25 56 day 683070.8 NA 45.5075.8 1.000
MIX NUMBER Mix 36 Stone C1 75/25FDate: Mix Code: Size(c.f.):
State Study No. 239 - Influences on Strength Variability of Gravel Aggregate Concrete Comments / Notes / ObservationsCustomer: MDOT
Cement 1: CS-C-1Cement 2:
Dry Specific Gravity
Agg. absorption
Agg. FMMaterial
MIX DESIGN INFODry mix 1 cu. yd. Wt. (lbs.)
Dry mix lab batch Wt. (lbs.)
Adjusted lab batch Wt. (lbs.)
Actual lab batch Wt.
(lbs.)Material Code
Sand 1: FA-1Coarse Aggregate 1: CA-2
Fly Ash: SCM-2 (Class F Fly Ash)GGBFS:
Coarse Aggregate 4:
Water Strength Test Results
Coarse Aggregate 2: Coarse Aggregate 3:
4x8 CYLINDERSTotal:
05/11/11 2210UW w/o Air: Aggregate Moistures
05/24/11 5243
Free H2O Content
Batch free H2O (lbs.)ADMIX INFORMATION
05/17/11 4810Type Brand / NameWR Type A Water Reducer
Water Added/Withheld6/7/2011 5783
PLASTIC TEST RESULTS OTHER INFO
6720Sample Time Unit Weight (pcf) Act. w/c 0.450 Bucket Weight
Slump, in. Yield Des.Un.Wt. 149.69
Batch Time % Air Des. w/c 0.450 Unit Weight7/5/2011
Bucket Volume
Air Temp. Relative Yield Bag Factor 5.60 Mix Temp. Initial set, min. Fine/Coarse by Vol 0.601 Bucket Full Technician who
conducted tests:

164
Project: Lab #: BCDName: Set #: 1
4/18/2011 37 f'c: 4,000 psi 1.25 Factor: 0.05
Vol. (c.f.)
2.68 526.40 24.37 24.37 24.37 3.150.00 0.00 0.00 1.000.00 0.00 0.00 0.00 1.000.00 0.00 0.00 1.007.73 1265.03 58.57 58.57 58.57 2.621 0.34% 2.2112.39 1790.00 82.87 82.87 82.87 2.316 4.67% 6.510.00 0.00 0.000.00 0.00 0.000.00 0.00 0.00
Air: 1.50% 0.41 0.00 0.00 0.00Water: 3.80 236.88 10.97 15.04 15.04 1.00
"+-Air: 1.00% AGE psi Avg. psiDate
27.00 3818.31 176.77 180.84 1 day 1960143.57 143.57 146.88 1 day 1930
1 day 18807 day 3740
oz /cwt oz /cy ml /cy batch ml actual ml Sand: -0.34% -0.20 7 day 38603.05 16.1 474.8 22.0 22.0 CA 1 -4.67% -3.87 7 day 3740
CA 2 0.00% 0.00 14 day 4260CA 3 0.00% 0.00 14 day 4520CA 4 0.00% 0.00 14 day 4070
28 day 4690+/- h2o Added W/held 28 day "4960"
28 day 44301:45 PM 2.75 56 day 50201:54 PM 142.44 7.82 56 day 4820
3.00 1.27 0.25 56 day 504075.6 NA 43.4372.4 1.016
Comments / Notes / ObservationsCustomer: MDOT
MIX NUMBER Mix 37 Gravel D1 100Date: Mix Code: Size(c.f.):
MIX DESIGN INFO Dry mix 1 cu. yd. Wt. (lbs.)
Dry mix lab batch Wt. (lbs.)
Adjusted lab batch Wt. (lbs.)
Actual lab batch Wt.
(lbs.)Material Source
State Study No. 239 - Influences on Strength Variability of Gravel Aggregate Concrete
Cement 2:Fly Ash:GGBFS:
Dry Specific Gravity
Agg. absorption
Agg. FMMaterial
Cement 1: CS-D-1
Coarse Aggregate 3: Coarse Aggregate 4:
Sand 1: FA-1Coarse Aggregate 1: CA-1Coarse Aggregate 2:
Aggregate MoisturesFree H2O Content
Batch free H2O (lbs.)ADMIX INFORMATION
04/25/11
Strength Test Results
4x8 CYLINDERSTotal:
04/19/11 1923UW w/o Air:
3780Type Brand / NameWR Type A Water Reducer
05/02/11 4283
5/16/2011 4560PLASTIC TEST RESULTS OTHER INFO
Water Added/Withheld
4960Sample Time Unit Weight (pcf) Act. w/c 0.450 Bucket Weight
Slump, in. Yield Des.Un.Wt. 141.42
Batch Time % Air Des. w/c 0.450 Unit Weight6/13/2011
Bucket Volume
Air Temp. Relative Yield Bag Factor 5.6 Mix Temp. Initial set, min. Fine/Coarse by Vol 0.624 Bucket Full Technician who
conducted tests:
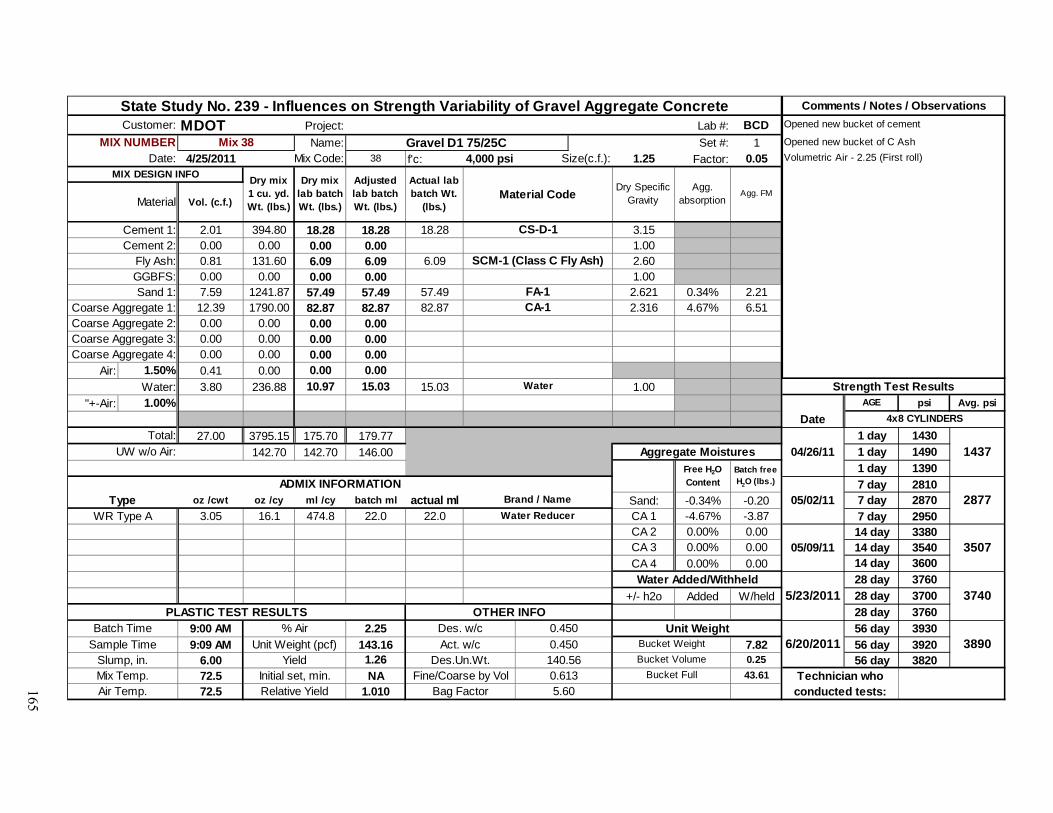
165
Project: Lab #: BCDName: Set #: 1
4/25/2011 38 f'c: 4,000 psi 1.25 Factor: 0.05
Vol. (c.f.)
2.01 394.80 18.28 18.28 18.28 3.150.00 0.00 0.00 0.00 1.000.81 131.60 6.09 6.09 6.09 2.600.00 0.00 0.00 0.00 1.007.59 1241.87 57.49 57.49 57.49 2.621 0.34% 2.2112.39 1790.00 82.87 82.87 82.87 2.316 4.67% 6.510.00 0.00 0.00 0.000.00 0.00 0.00 0.000.00 0.00 0.00 0.00
Air: 1.50% 0.41 0.00 0.00 0.00Water: 3.80 236.88 10.97 15.03 15.03 1.00
"+-Air: 1.00% AGE psi Avg. psiDate
27.00 3795.15 175.70 179.77 1 day 1430142.70 142.70 146.00 1 day 1490
1 day 13907 day 2810
oz /cwt oz /cy ml /cy batch ml actual ml Sand: -0.34% -0.20 7 day 28703.05 16.1 474.8 22.0 22.0 CA 1 -4.67% -3.87 7 day 2950
CA 2 0.00% 0.00 14 day 3380CA 3 0.00% 0.00 14 day 3540CA 4 0.00% 0.00 14 day 3600
28 day 3760+/- h2o Added W/held 28 day 3700
28 day 37609:00 AM 2.25 56 day 39309:09 AM 143.16 7.82 56 day 3920
6.00 1.26 0.25 56 day 382072.5 NA 43.6172.5 1.010
Air Temp. Relative Yield Bag Factor 5.60 Mix Temp. Initial set, min. Fine/Coarse by Vol 0.613 Bucket Full Technician who
conducted tests:
3890Sample Time Unit Weight (pcf) Act. w/c 0.450 Bucket Weight
Slump, in. Yield Des.Un.Wt. 140.56
Batch Time % Air Des. w/c 0.450 Unit Weight6/20/2011
Bucket Volume
05/09/11 3507
5/23/2011 3740PLASTIC TEST RESULTS OTHER INFO
Water Added/Withheld
Aggregate MoisturesFree H2O Content
Batch free H2O (lbs.)ADMIX INFORMATION
05/02/11
Strength Test Results
4x8 CYLINDERSTotal:
04/26/11 1437UW w/o Air:
2877Type Brand / NameWR Type A Water Reducer
Coarse Aggregate 3: Coarse Aggregate 4:
Water
Sand 1: FA-1Coarse Aggregate 1: CA-1Coarse Aggregate 2:
Fly Ash: SCM-1 (Class C Fly Ash)GGBFS:
Dry Specific Gravity
Agg. absorption
Agg. FMMaterial
Cement 1: CS-D-1
MIX DESIGN INFO Dry mix 1 cu. yd. Wt. (lbs.)
Dry mix lab batch Wt. (lbs.)
Adjusted lab batch Wt. (lbs.)
Actual lab batch Wt.
(lbs.)Material Code
State Study No. 239 - Influences on Strength Variability of Gravel Aggregate Concrete
Cement 2:
Comments / Notes / ObservationsCustomer: MDOT
MIX NUMBER Mix 38 Gravel D1 75/25CDate: Mix Code: Size(c.f.):
Opened new bucket of cement
Opened new bucket of C AshVolumetric Air - 2.25 (First roll)

166
Project: Lab #: BCDName: Set #: 1
4/25/2011 39 f'c: 4,000 psi 1.25 Factor: 0.05
Vol. (c.f.)
2.01 394.80 18.28 18.28 18.28 3.150.00 0.00 0.00 0.00 1.000.96 131.60 6.09 6.09 6.09 2.200.00 0.00 0.00 0.00 1.007.45 1217.75 56.38 56.38 56.38 2.621 0.34% 2.2112.39 1790.00 82.87 82.87 82.87 2.316 4.67% 6.510.00 0.00 0.00 0.000.00 0.00 0.00 0.000.00 0.00 0.00 0.00
Air: 1.50% 0.41 0.00 0.00 0.00Water: 3.80 236.88 10.97 15.03 15.03 1.00
"+-Air: 1.00% AGE psi Avg. psiDate
27.00 3771.03 174.58 178.65 1 day 1460141.79 141.79 145.09 1 day 1410
1 day 13507 day 2740
oz /cwt oz /cy ml /cy batch ml actual ml Sand: -0.34% -0.19 7 day 26303.05 16.1 474.8 22.0 22.0 CA 1 -4.67% -3.87 7 day 2740
CA 2 0.00% 0.00 14 day 3410CA 3 0.00% 0.00 14 day 3350CA 4 0.00% 0.00 14 day 3220
28 day "4080"+/- h2o Added W/held 28 day 3530
28 day 374010:10 AM 2.25 56 day "3870"10:19 AM 142.16 7.82 56 day 4260
4.50 1.26 0.25 56 day 462070.8 NA 43.3672.7 1.010
Air Temp. Relative Yield Bag Factor 5.60 Mix Temp. Initial set, min. Fine/Coarse by Vol 0.601 Bucket Full Technician who
conducted tests:
4440Sample Time Unit Weight (pcf) Act. w/c 0.450 Bucket Weight
Slump, in. Yield Des.Un.Wt. 139.67
Batch Time % Air Des. w/c 0.450 Unit Weight6/20/2011
Bucket Volume
05/09/11 3327
5/23/2011 3635PLASTIC TEST RESULTS OTHER INFO
Water Added/Withheld
Free H2O Content
Batch free H2O (lbs.)ADMIX INFORMATION
05/02/11
Strength Test Results
4x8 CYLINDERSTotal:
04/26/11 1407UW w/o Air:
2703Type Brand / NameWR Type A Water Reducer
Water
Sand 1: FA-1Coarse Aggregate 1: CA-1Coarse Aggregate 2:
Aggregate Moistures
Dry Specific Gravity
Agg. absorption
Agg. FMMaterial
Cement 1: CS-D-1
Coarse Aggregate 3: Coarse Aggregate 4:
Comments / Notes / ObservationsCustomer: MDOT
MIX NUMBER Mix 39 Gravel D1 75/25FDate: Mix Code: Size(c.f.):
MIX DESIGN INFO Dry mix 1 cu. yd. Wt. (lbs.)
Dry mix lab batch Wt. (lbs.)
Adjusted lab batch Wt. (lbs.)
Actual lab batch Wt.
(lbs.)Material Code
State Study No. 239 - Influences on Strength Variability of Gravel Aggregate Concrete
Cement 2:Fly Ash: SCM-2 (Class F Fly Ash)GGBFS:

167
Project: Lab #: BCDName: Set #: 1
6/6/2011 40 f'c: 4,000 psi 1.25 Factor: 0.05
Vol. (c.f.)
2.68 526.40 24.37 24.37 24.37 3.150.00 0.00 0.00 0.00 1.000.00 0.00 0.00 0.00 1.000.00 0.00 0.00 0.00 1.007.73 1265.03 58.57 58.57 58.57 2.621 0.34% 2.2112.39 1790.00 82.87 82.87 82.87 2.316 4.67% 6.510.00 0.00 0.00 0.000.00 0.00 0.00 0.000.00 0.00 0.00 0.00
Air: 1.50% 0.41 0.00 0.00 0.00Water: 3.80 236.88 10.97 15.04 15.04 1.00
"+-Air: 1.00% AGE psi Avg. psiDate
27.00 3818.31 176.77 180.84 1 day 2080143.57 143.57 146.88 1 day 2030
1 day 20807 day 4050
oz /cwt oz /cy ml /cy batch ml actual ml Sand: -0.34% -0.20 7 day 40803.05 16.1 474.8 22.0 22.0 CA 1 -4.67% -3.87 7 day 4210
CA 2 0.00% 0.00 14 day 4780CA 3 0.00% 0.00 14 day 4920CA 4 0.00% 0.00 14 day 4530
28 day 5090+/- h2o Added W/held 28 day 5580
28 day 533012:47 PM 3.00 56 day 513012:56 PM 142.08 7.83 56 day 5370
3.50 1.27 0.25 56 day 561073.4 NA 43.3578.8 1.020
MIX NUMBER Mix 40 Gravel D2 100Date: Mix Code: Size(c.f.):
State Study No. 239 - Influences on Strength Variability of Gravel Aggregate Concrete Comments / Notes / ObservationsCustomer: MDOT
Cement 1: CS-D-2Cement 2:
Dry Specific Gravity
Agg. absorption
Agg. FMMaterial
MIX DESIGN INFODry mix 1 cu. yd. Wt. (lbs.)
Dry mix lab batch Wt. (lbs.)
Adjusted lab batch Wt. (lbs.)
Actual lab batch Wt.
(lbs.)Material Code
Sand 1: FA-1Coarse Aggregate 1: CA-1
Fly Ash:GGBFS:
Coarse Aggregate 4:
Water Strength Test Results
Coarse Aggregate 2: Coarse Aggregate 3:
4x8 CYLINDERSTotal:
06/07/11 2063UW w/o Air: Aggregate Moistures
06/20/11 4743
Free H2O Content
Batch free H2O (lbs.)ADMIX INFORMATION
06/13/11 4113Type Brand / NameWR Type A Water Reducer
Water Added/Withheld7/4/2011 5333
PLASTIC TEST RESULTS OTHER INFO
5370Sample Time Unit Weight (pcf) Act. w/c 0.450 Bucket Weight
Slump, in. Yield Des.Un.Wt. 141.42
Batch Time % Air Des. w/c 0.450 Unit Weight8/1/2011
Bucket Volume
Air Temp. Relative Yield Bag Factor 5.60 Mix Temp. Initial set, min. Fine/Coarse by Vol 0.624 Bucket Full Technician who
conducted tests:

168
Project: Lab #: BCDName: Set #: 1
6/6/2011 41 f'c: 4,000 psi 1.25 Factor: 0.05
Vol. (c.f.)
2.01 394.80 18.28 18.28 18.28 3.150.00 0.00 0.00 0.00 1.000.81 131.60 6.09 6.09 6.09 2.600.00 0.00 0.00 0.00 1.007.59 1241.87 57.49 57.49 57.49 2.621 0.34% 2.2112.39 1790.00 82.87 82.87 82.87 2.316 4.67% 6.510.00 0.00 0.00 0.000.00 0.00 0.00 0.000.00 0.00 0.00 0.00
Air: 1.50% 0.41 0.00 0.00 0.00Water: 3.80 236.88 10.97 15.03 15.03 1.00
"+-Air: 1.00% AGE psi Avg. psiDate
27.00 3795.15 175.70 179.77 1 day 1270142.70 142.70 146.00 1 day 1350
1 day 14107 day 3040
oz /cwt oz /cy ml /cy batch ml actual ml Sand: -0.34% -0.20 7 day 29003.05 16.1 474.8 22.0 22.0 CA 1 -4.67% -3.87 7 day 2900
CA 2 0.00% 0.00 14 day 3570CA 3 0.00% 0.00 14 day 3360CA 4 0.00% 0.00 14 day "3050"
28 day 3740+/- h2o Added W/held 28 day "4840"
28 day 41301:19 PM 2.00 56 day "4750"1:28 PM 142.68 7.83 56 day 4260
4.75 1.26 0.25 56 day 415072.7 NA 43.5079.0 1.010
MIX NUMBER Mix 41 Gravel D2 75/25CDate: Mix Code: Size(c.f.):
State Study No. 239 - Influences on Strength Variability of Gravel Aggregate Concrete Comments / Notes / ObservationsCustomer: MDOT
Cement 1: CS-D-2Cement 2:
Dry Specific Gravity
Agg. absorption
Agg. FMMaterial
MIX DESIGN INFODry mix 1 cu. yd. Wt. (lbs.)
Dry mix lab batch Wt. (lbs.)
Adjusted lab batch Wt. (lbs.)
Actual lab batch Wt.
(lbs.)Material Code
Sand 1: FA-1Coarse Aggregate 1: CA-1
Fly Ash: SCM-1 (Class C Fly Ash)GGBFS:
Coarse Aggregate 4:
Water Strength Test Results
Coarse Aggregate 2: Coarse Aggregate 3:
4x8 CYLINDERSTotal:
06/07/11 1343UW w/o Air: Aggregate Moistures
06/20/11 3465
Free H2O Content
Batch free H2O (lbs.)ADMIX INFORMATION
06/13/11 2947Type Brand / NameWR Type A Water Reducer
Water Added/Withheld7/4/2011 3935
PLASTIC TEST RESULTS OTHER INFO
4205Sample Time Unit Weight (pcf) Act. w/c 0.450 Bucket Weight
Slump, in. Yield Des.Un.Wt. 140.56
Batch Time % Air Des. w/c 0.450 Unit Weight8/1/2011
Bucket Volume
Air Temp. Relative Yield Bag Factor 5.60 Mix Temp. Initial set, min. Fine/Coarse by Vol 0.613 Bucket Full Technician who
conducted tests:

169
Project: Lab #: BCDName: Set #: 1
6/6/2011 42 f'c: 4,000 psi 1.25 Factor: 0.05
Vol. (c.f.)
2.01 394.80 18.28 18.28 18.28 3.150.00 0.00 0.00 0.00 1.000.96 131.60 6.09 6.09 6.09 2.200.00 0.00 0.00 0.00 1.007.45 1217.75 56.38 56.38 56.38 2.621 0.34% 2.2112.39 1790.00 82.87 82.87 82.87 2.316 4.67% 6.510.00 0.00 0.00 0.000.00 0.00 0.00 0.000.00 0.00 0.00 0.00
Air: 1.50% 0.41 0.00 0.00 0.00Water: 3.80 236.88 10.97 15.03 15.03 1.00
"+-Air: 1.00% AGE psi Avg. psiDate
27.00 3771.03 174.58 178.65 1 day 1350141.79 141.79 145.09 1 day 1330
1 day 13007 day 2820
oz /cwt oz /cy ml /cy batch ml actual ml Sand: -0.34% -0.19 7 day 25603.05 16.1 474.8 22.0 22.0 CA 1 -4.67% -3.87 7 day "2300"
CA 2 0.00% 0.00 14 day 3380CA 3 0.00% 0.00 14 day 3440CA 4 0.00% 0.00 14 day 3530
28 day 4050+/- h2o Added W/held 28 day 3970
28 day 39801:53 PM 2.00 56 day "5090"2:02 PM 142.28 7.83 56 day 4690
5.50 1.26 0.25 56 day 447071.5 NA 43.4079.6 1.010
MIX NUMBER Mix 42 Gravel D2 75/25FDate: Mix Code: Size(c.f.):
State Study No. 239 - Influences on Strength Variability of Gravel Aggregate Concrete Comments / Notes / ObservationsCustomer: MDOT
Cement 1: CS-D-2Cement 2:
Dry Specific Gravity
Agg. absorption
Agg. FMMaterial
MIX DESIGN INFODry mix 1 cu. yd. Wt. (lbs.)
Dry mix lab batch Wt. (lbs.)
Adjusted lab batch Wt. (lbs.)
Actual lab batch Wt.
(lbs.)Material Code
Sand 1: FA-1Coarse Aggregate 1: CA-1
Fly Ash: SCM-2 (Class F Fly Ash)GGBFS:
Coarse Aggregate 4:
Water Strength Test Results
Coarse Aggregate 2: Coarse Aggregate 3:
4x8 CYLINDERSTotal:
06/07/11 1327UW w/o Air: Aggregate Moistures
06/20/11 3450
Free H2O Content
Batch free H2O (lbs.)ADMIX INFORMATION
06/13/11 2690Type Brand / NameWR Type A Water Reducer
Water Added/Withheld7/4/2011 4000
PLASTIC TEST RESULTS OTHER INFO
4580Sample Time Unit Weight (pcf) Act. w/c 0.450 Bucket Weight
Slump, in. Yield Des.Un.Wt. 139.67
Batch Time % Air Des. w/c 0.450 Unit Weight8/1/2011
Bucket Volume
Air Temp. Relative Yield Bag Factor 5.60 Mix Temp. Initial set, min. Fine/Coarse by Vol 0.601 Bucket Full Technician who
conducted tests:

170
Project: Lab #: BCDName: Set #: 1
7/6/2011 43 f'c: 4,000 psi 1.25 Factor: 0.05
Vol. (c.f.)
2.68 526.40 24.37 24.37 24.37 3.150.00 0.00 0.00 0.00 1.000.00 0.00 0.00 0.00 1.000.00 0.00 0.00 0.00 1.007.73 1265.03 58.57 58.57 58.57 2.621 0.34% 2.2112.39 1790.00 82.87 82.87 82.87 2.316 4.67% 6.510.00 0.00 0.00 0.000.00 0.00 0.00 0.000.00 0.00 0.00 0.00
Air: 1.50% 0.41 0.00 0.00 0.00Water: 3.80 236.88 10.97 15.04 15.04 1.00
"+-Air: 1.00% AGE psi Avg. psiDate
27.00 3818.31 176.77 180.84 1 day 2140143.57 143.57 146.88 1 day 2140
1 day 23607 day 3790
oz /cwt oz /cy ml /cy batch ml actual ml Sand: -0.34% -0.20 7 day 37503.05 16.1 474.8 22.0 22.0 CA 1 -4.67% -3.87 7 day 3870
CA 2 0.00% 0.00 14 day 4690CA 3 0.00% 0.00 14 day 4400CA 4 0.00% 0.00 14 day 4430
28 day 4780+/- h2o Added W/held 28 day 4790
28 day 47609:44 AM 3.50 56 day 50909:53 AM 142.36 7.85 56 day 5200
2.75 1.27 0.25 56 day 547070.7 NA 43.4472.5 1.020
MIX NUMBER Mix 43 Gravel D3 100Date: Mix Code: Size(c.f.):
State Study No. 239 - Influences on Strength Variability of Gravel Aggregate Concrete Comments / Notes / ObservationsCustomer: MDOT
Cement 1: CS-D-3Cement 2:
Dry Specific Gravity
Agg. absorption
Agg. FMMaterial
MIX DESIGN INFODry mix 1 cu. yd. Wt. (lbs.)
Dry mix lab batch Wt. (lbs.)
Adjusted lab batch Wt. (lbs.)
Actual lab batch Wt.
(lbs.)Material Code
Sand 1: FA-1Coarse Aggregate 1: CA-1
Fly Ash:GGBFS:
Coarse Aggregate 4:
Water Strength Test Results
Coarse Aggregate 2: Coarse Aggregate 3:
4x8 CYLINDERSTotal:
07/07/11 2213UW w/o Air: Aggregate Moistures
07/20/11 4507
Free H2O Content
Batch free H2O (lbs.)ADMIX INFORMATION
07/13/11 3803Type Brand / NameWR Type A Water Reducer
Water Added/Withheld8/3/2011 4777
PLASTIC TEST RESULTS OTHER INFO
5253Sample Time Unit Weight (pcf) Act. w/c 0.450 Bucket Weight
Slump, in. Yield Des.Un.Wt. 141.42
Batch Time % Air Des. w/c 0.450 Unit Weight8/31/2011
Bucket Volume
Air Temp. Relative Yield Bag Factor 5.60 Mix Temp. Initial set, min. Fine/Coarse by Vol 0.624 Bucket Full Technician who
conducted tests:

171
Project: Lab #: BCDName: Set #: 1
7/6/2011 44 f'c: 4,000 psi 1.25 Factor: 0.05
Vol. (c.f.)
2.01 394.80 18.28 18.28 18.28 3.150.00 0.00 0.00 0.00 1.000.81 131.60 6.09 6.09 6.09 2.600.00 0.00 0.00 0.00 1.007.59 1241.87 57.49 57.49 57.49 2.621 0.34% 2.2112.39 1790.00 82.87 82.87 82.87 2.316 4.67% 6.510.00 0.00 0.00 0.000.00 0.00 0.00 0.000.00 0.00 0.00 0.00
Air: 1.50% 0.41 0.00 0.00 0.00Water: 3.80 236.88 10.97 15.03 15.03 1.00
"+-Air: 1.00% AGE psi Avg. psiDate
27.00 3795.15 175.70 179.77 1 day 1370142.70 142.70 146.00 1 day 1440
1 day 14507 day "2630"
oz /cwt oz /cy ml /cy batch ml actual ml Sand: -0.34% -0.20 7 day 28703.05 16.1 474.8 22.0 22.0 CA 1 -4.67% -3.87 7 day 3060
CA 2 0.00% 0.00 14 day 3200CA 3 0.00% 0.00 14 day 3280CA 4 0.00% 0.00 14 day 3200
28 day "3460"+/- h2o Added W/held 28 day 3980
28 day 374010:09 AM 2.50 56 day 423010:18 AM 143.72 7.85 56 day "4910"
4.50 1.25 0.25 56 day 413071.2 NA 43.7873.1 1.000
MIX NUMBER Mix 44 Gravel D3 75/25CDate: Mix Code: Size(c.f.):
State Study No. 239 - Influences on Strength Variability of Gravel Aggregate Concrete Comments / Notes / ObservationsCustomer: MDOT
Cement 1: CS-D-3Cement 2:
Dry Specific Gravity
Agg. absorption
Agg. FMMaterial
MIX DESIGN INFODry mix 1 cu. yd. Wt. (lbs.)
Dry mix lab batch Wt. (lbs.)
Adjusted lab batch Wt. (lbs.)
Actual lab batch Wt.
(lbs.)Material Code
Sand 1: FA-1Coarse Aggregate 1: CA-1
Fly Ash: SCM-1 (Class C Fly Ash)GGBFS:
Coarse Aggregate 4:
Water Strength Test Results
Coarse Aggregate 2: Coarse Aggregate 3:
4x8 CYLINDERSTotal:
07/07/11 1420UW w/o Air: Aggregate Moistures
07/20/11 3227
Free H2O Content
Batch free H2O (lbs.)ADMIX INFORMATION
07/13/11 2965Type Brand / NameWR Type A Water Reducer
Water Added/Withheld8/3/2011 3860
PLASTIC TEST RESULTS OTHER INFO
4180Sample Time Unit Weight (pcf) Act. w/c 0.450 Bucket Weight
Slump, in. Yield Des.Un.Wt. 140.56
Batch Time % Air Des. w/c 0.450 Unit Weight8/31/2011
Bucket Volume
Air Temp. Relative Yield Bag Factor 5.60 Mix Temp. Initial set, min. Fine/Coarse by Vol 0.613 Bucket Full Technician who
conducted tests:

172
Project: Lab #: BCDName: Set #: 1
7/6/2011 45 f'c: 4,000 psi 1.25 Factor: 0.05
Vol. (c.f.)
2.01 394.80 18.28 18.28 18.28 3.150.00 0.00 0.00 0.00 1.000.96 131.60 6.09 6.09 6.09 2.200.00 0.00 0.00 0.00 1.007.45 1217.75 56.38 56.38 56.38 2.621 0.34% 2.2112.39 1790.00 82.87 82.87 82.87 2.316 4.67% 6.510.00 0.00 0.00 0.000.00 0.00 0.00 0.000.00 0.00 0.00 0.00
Air: 1.50% 0.41 0.00 0.00 0.00Water: 3.80 236.88 10.97 15.03 15.03 1.00
"+-Air: 1.00% AGE psi Avg. psiDate
27.00 3771.03 174.58 178.65 1 day 1560141.79 141.79 145.09 1 day 1450
1 day 14507 day "2770"
oz /cwt oz /cy ml /cy batch ml actual ml Sand: -0.34% -0.19 7 day 23803.05 16.1 474.8 22.0 22.0 CA 1 -4.67% -3.87 7 day 2480
CA 2 0.00% 0.00 14 day 3130CA 3 0.00% 0.00 14 day 3120CA 4 0.00% 0.00 14 day "2750"
28 day 3600+/- h2o Added W/held 28 day 3710
28 day 397010:38 AM 2.00 56 day 424010:46 AM 142.92 7.85 56 day 4540
4.75 1.25 0.25 56 day "3790"71.9 NA 43.5874.0 1.000
MIX NUMBER Mix 45 Gravel D3 75/25FDate: Mix Code: Size(c.f.):
State Study No. 239 - Influences on Strength Variability of Gravel Aggregate Concrete Comments / Notes / ObservationsCustomer: MDOT
Cement 1: CS-D-3Cement 2:
Dry Specific Gravity
Agg. absorption
Agg. FMMaterial
MIX DESIGN INFODry mix 1 cu. yd. Wt. (lbs.)
Dry mix lab batch Wt. (lbs.)
Adjusted lab batch Wt. (lbs.)
Actual lab batch Wt.
(lbs.)Material Code
Sand 1: FA-1Coarse Aggregate 1: CA-1
Fly Ash: SCM-2 (Class F Fly Ash)GGBFS:
Coarse Aggregate 4:
Water Strength Test Results
Coarse Aggregate 2: Coarse Aggregate 3:
4x8 CYLINDERSTotal:
07/07/11 1487UW w/o Air: Aggregate Moistures
07/20/11 3125
Free H2O Content
Batch free H2O (lbs.)ADMIX INFORMATION
07/13/11 2430Type Brand / NameWR Type A Water Reducer
Water Added/Withheld8/3/2011 3760
PLASTIC TEST RESULTS OTHER INFO
4390Sample Time Unit Weight (pcf) Act. w/c 0.450 Bucket Weight
Slump, in. Yield Des.Un.Wt. 139.67
Batch Time % Air Des. w/c 0.450 Unit Weight8/31/2011
Bucket Volume
Air Temp. Relative Yield Bag Factor 5.60 Mix Temp. Initial set, min. Fine/Coarse by Vol 0.601 Bucket Full Technician who
conducted tests:
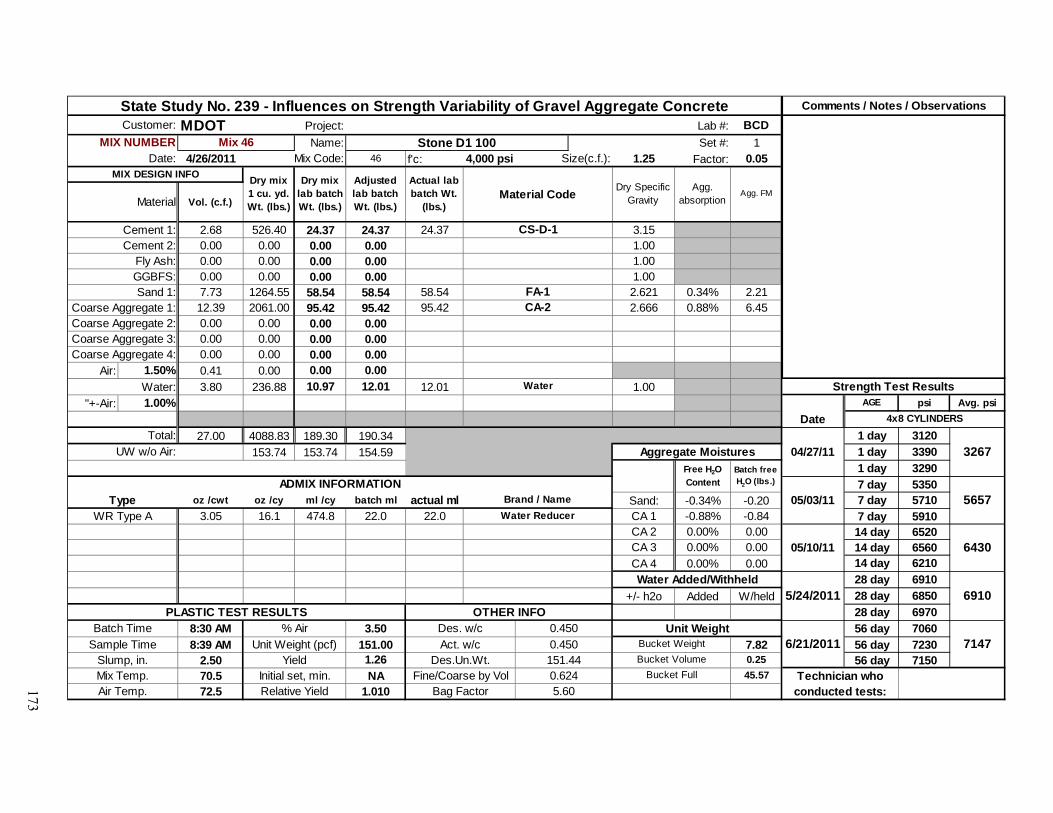
173
Project: Lab #: BCDName: Set #: 1
4/26/2011 46 f'c: 4,000 psi 1.25 Factor: 0.05
Vol. (c.f.)
2.68 526.40 24.37 24.37 24.37 3.150.00 0.00 0.00 0.00 1.000.00 0.00 0.00 0.00 1.000.00 0.00 0.00 0.00 1.007.73 1264.55 58.54 58.54 58.54 2.621 0.34% 2.2112.39 2061.00 95.42 95.42 95.42 2.666 0.88% 6.450.00 0.00 0.00 0.000.00 0.00 0.00 0.000.00 0.00 0.00 0.00
Air: 1.50% 0.41 0.00 0.00 0.00Water: 3.80 236.88 10.97 12.01 12.01 1.00
"+-Air: 1.00% AGE psi Avg. psiDate
27.00 4088.83 189.30 190.34 1 day 3120153.74 153.74 154.59 1 day 3390
1 day 32907 day 5350
oz /cwt oz /cy ml /cy batch ml actual ml Sand: -0.34% -0.20 7 day 57103.05 16.1 474.8 22.0 22.0 CA 1 -0.88% -0.84 7 day 5910
CA 2 0.00% 0.00 14 day 6520CA 3 0.00% 0.00 14 day 6560CA 4 0.00% 0.00 14 day 6210
28 day 6910+/- h2o Added W/held 28 day 6850
28 day 69708:30 AM 3.50 56 day 70608:39 AM 151.00 7.82 56 day 7230
2.50 1.26 0.25 56 day 715070.5 NA 45.5772.5 1.010
Air Temp. Relative Yield Bag Factor 5.60 Mix Temp. Initial set, min. Fine/Coarse by Vol 0.624 Bucket Full Technician who
conducted tests:
7147Sample Time Unit Weight (pcf) Act. w/c 0.450 Bucket Weight
Slump, in. Yield Des.Un.Wt. 151.44
Batch Time % Air Des. w/c 0.450 Unit Weight6/21/2011
Bucket Volume
05/10/11 6430
5/24/2011 6910PLASTIC TEST RESULTS OTHER INFO
Water Added/Withheld
Free H2O Content
Batch free H2O (lbs.)ADMIX INFORMATION
05/03/11
Strength Test Results
4x8 CYLINDERSTotal:
04/27/11 3267UW w/o Air:
5657Type Brand / NameWR Type A Water Reducer
Water
Sand 1: FA-1Coarse Aggregate 1: CA-2Coarse Aggregate 2:
Aggregate Moistures
Dry Specific Gravity
Agg. absorption
Agg. FMMaterial
Cement 1: CS-D-1
Coarse Aggregate 3: Coarse Aggregate 4:
Comments / Notes / ObservationsCustomer: MDOT
MIX NUMBER Mix 46 Stone D1 100Date: Mix Code: Size(c.f.):
MIX DESIGN INFO Dry mix 1 cu. yd. Wt. (lbs.)
Dry mix lab batch Wt. (lbs.)
Adjusted lab batch Wt. (lbs.)
Actual lab batch Wt.
(lbs.)Material Code
State Study No. 239 - Influences on Strength Variability of Gravel Aggregate Concrete
Cement 2:Fly Ash:GGBFS:

174
Project: Lab #: BCDName: Set #: 1
4/26/2011 47 f'c: 4,000 psi 1.25 Factor: 0.05
Vol. (c.f.)
2.01 394.80 18.28 18.28 18.28 3.150.00 0.00 0.00 0.00 1.000.81 131.60 6.09 6.09 6.09 2.600.00 0.00 0.00 0.00 1.007.59 1241.39 57.47 57.47 57.47 2.621 0.34% 2.2112.39 2061.00 95.42 95.42 95.42 2.666 0.88% 6.450.00 0.00 0.00 0.000.00 0.00 0.00 0.000.00 0.00 0.00 0.00
Air: 1.50% 0.41 0.00 0.00 0.00Water: 3.80 236.88 10.97 12.00 12.00 1.00
"+-Air: 1.00% AGE psi Avg. psiDate
27.00 4065.67 188.23 189.26 1 day 2310152.87 152.87 153.71 1 day 2330
1 day 23007 day 5780
oz /cwt oz /cy ml /cy batch ml actual ml Sand: -0.34% -0.20 7 day 57203.05 16.1 474.8 22.0 22.0 CA 1 -0.88% -0.84 7 day 5840
CA 2 0.00% 0.00 14 day 6670CA 3 0.00% 0.00 14 day 7010CA 4 0.00% 0.00 14 day 6660
28 day 7020+/- h2o Added W/held 28 day 7190
28 day 71909:17 AM 3.50 56 day 73509:26 AM 151.28 7.82 56 day 7360
4.25 1.25 0.25 56 day 795070.5 NA 45.6472.4 1.000
Air Temp. Relative Yield Bag Factor 5.60 Mix Temp. Initial set, min. Fine/Coarse by Vol 0.613 Bucket Full Technician who
conducted tests:
7553Sample Time Unit Weight (pcf) Act. w/c 0.450 Bucket Weight
Slump, in. Yield Des.Un.Wt. 150.58
Batch Time % Air Des. w/c 0.450 Unit Weight6/21/2011
Bucket Volume
05/10/11 6780
5/24/2011 7133PLASTIC TEST RESULTS OTHER INFO
Water Added/Withheld
Free H2O Content
Batch free H2O (lbs.)ADMIX INFORMATION
05/03/11
Strength Test Results
4x8 CYLINDERSTotal:
04/27/11 2313UW w/o Air:
5780Type Brand / NameWR Type A Water Reducer
Water
Sand 1: FA-1Coarse Aggregate 1: CA-2Coarse Aggregate 2:
Aggregate Moistures
Dry Specific Gravity
Agg. absorption
Agg. FMMaterial
Cement 1: CS-D-1
Coarse Aggregate 3: Coarse Aggregate 4:
Comments / Notes / ObservationsCustomer: MDOT
MIX NUMBER Mix 47 Stone D1 75/25CDate: Mix Code: Size(c.f.):
MIX DESIGN INFO Dry mix 1 cu. yd. Wt. (lbs.)
Dry mix lab batch Wt. (lbs.)
Adjusted lab batch Wt. (lbs.)
Actual lab batch Wt.
(lbs.)Material Code
State Study No. 239 - Influences on Strength Variability of Gravel Aggregate Concrete
Cement 2:Fly Ash: SCM-1 (Class C Fly Ash)GGBFS:

175
Project: Lab #: BCDName: Set #: 1
4/26/2011 48 f'c: 4,000 psi 1.25 Factor: 0.05
Vol. (c.f.)
2.01 394.80 18.28 18.28 18.28 3.150.00 0.00 0.00 0.00 1.000.96 131.60 6.09 6.09 6.09 2.200.00 0.00 0.00 0.00 1.007.44 1217.27 56.35 56.35 56.35 2.621 0.34% 2.2112.39 2061.00 95.42 95.42 95.42 2.666 0.88% 6.450.00 0.00 0.00 0.000.00 0.00 0.00 0.000.00 0.00 0.00 0.00
Air: 1.50% 0.41 0.00 0.00 0.00Water: 3.80 236.88 10.97 12.00 12.00 1.00
"+-Air: 1.00% AGE psi Avg. psiDate
27.00 4041.55 187.11 188.14 1 day 2170151.97 151.97 152.80 1 day 2220
1 day 22207 day 4890
oz /cwt oz /cy ml /cy batch ml actual ml Sand: -0.34% -0.19 7 day 45503.05 16.1 474.8 22.0 22.0 CA 1 -0.88% -0.84 7 day 4740
CA 2 0.00% 0.00 14 day 5310CA 3 0.00% 0.00 14 day 5630CA 4 0.00% 0.00 14 day 5890
28 day 6380+/- h2o Added W/held 28 day 6320
28 day "7250"10:06 AM 3.25 56 day 720010:15 AM 150.64 7.82 56 day 7080
3.00 1.25 0.25 56 day 745071.5 NA 45.4873.1 1.000
Air Temp. Relative Yield Bag Factor 5.60 Mix Temp. Initial set, min. Fine/Coarse by Vol 0.601 Bucket Full Technician who
conducted tests:
7243Sample Time Unit Weight (pcf) Act. w/c 0.450 Bucket Weight
Slump, in. Yield Des.Un.Wt. 149.69
Batch Time % Air Des. w/c 0.450 Unit Weight6/21/2011
Bucket Volume
05/10/11 5610
5/24/2011 6350PLASTIC TEST RESULTS OTHER INFO
Water Added/Withheld
Free H2O Content
Batch free H2O (lbs.)ADMIX INFORMATION
05/03/11
Strength Test Results
4x8 CYLINDERSTotal:
04/27/11 2203UW w/o Air:
4727Type Brand / NameWR Type A Water Reducer
Water
Sand 1: FA-1Coarse Aggregate 1: CA-2Coarse Aggregate 2:
Aggregate Moistures
Dry Specific Gravity
Agg. absorption
Agg. FMMaterial
Cement 1: CS-D-1
Coarse Aggregate 3: Coarse Aggregate 4:
Comments / Notes / ObservationsCustomer: MDOT
MIX NUMBER Mix 48 Stone D1 75/25FDate: Mix Code: Size(c.f.):
MIX DESIGN INFO Dry mix 1 cu. yd. Wt. (lbs.)
Dry mix lab batch Wt. (lbs.)
Adjusted lab batch Wt. (lbs.)
Actual lab batch Wt.
(lbs.)Material Code
State Study No. 239 - Influences on Strength Variability of Gravel Aggregate Concrete
Cement 2:Fly Ash: SCM-2 (Class F Fly Ash)GGBFS:
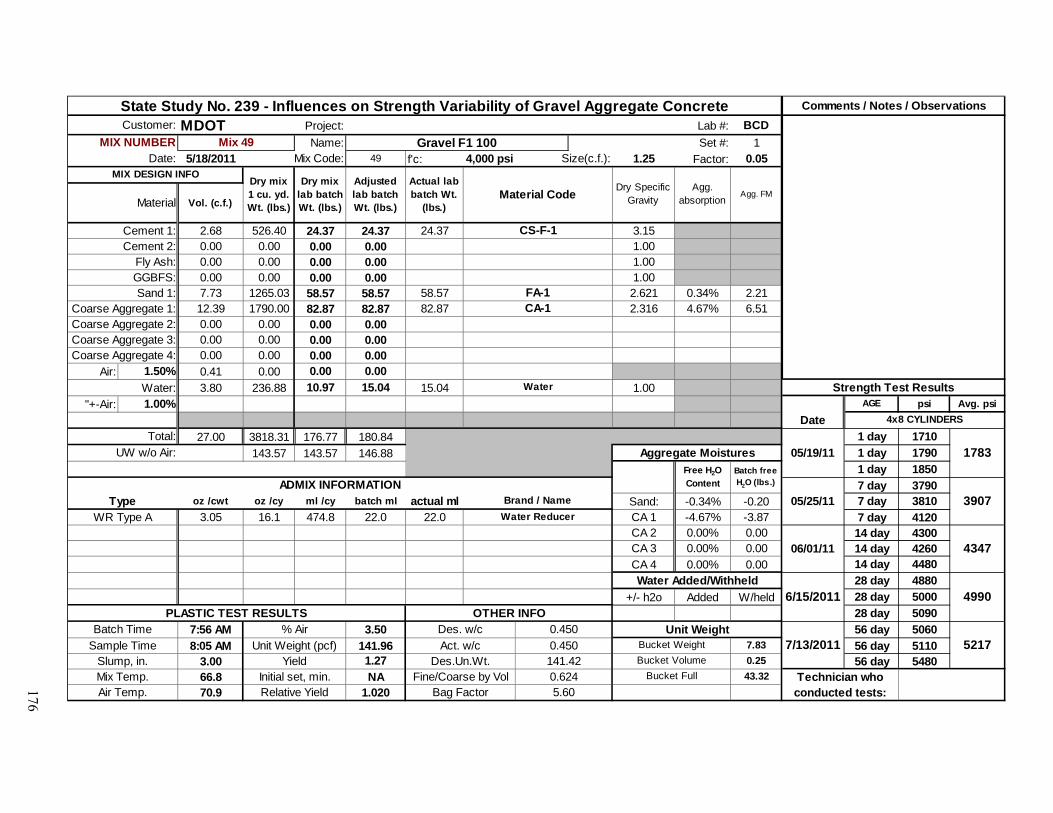
176
Project: Lab #: BCDName: Set #: 1
5/18/2011 49 f'c: 4,000 psi 1.25 Factor: 0.05
Vol. (c.f.)
2.68 526.40 24.37 24.37 24.37 3.150.00 0.00 0.00 0.00 1.000.00 0.00 0.00 0.00 1.000.00 0.00 0.00 0.00 1.007.73 1265.03 58.57 58.57 58.57 2.621 0.34% 2.2112.39 1790.00 82.87 82.87 82.87 2.316 4.67% 6.510.00 0.00 0.00 0.000.00 0.00 0.00 0.000.00 0.00 0.00 0.00
Air: 1.50% 0.41 0.00 0.00 0.00Water: 3.80 236.88 10.97 15.04 15.04 1.00
"+-Air: 1.00% AGE psi Avg. psiDate
27.00 3818.31 176.77 180.84 1 day 1710143.57 143.57 146.88 1 day 1790
1 day 18507 day 3790
oz /cwt oz /cy ml /cy batch ml actual ml Sand: -0.34% -0.20 7 day 38103.05 16.1 474.8 22.0 22.0 CA 1 -4.67% -3.87 7 day 4120
CA 2 0.00% 0.00 14 day 4300CA 3 0.00% 0.00 14 day 4260CA 4 0.00% 0.00 14 day 4480
28 day 4880+/- h2o Added W/held 28 day 5000
28 day 50907:56 AM 3.50 56 day 50608:05 AM 141.96 7.83 56 day 5110
3.00 1.27 0.25 56 day 548066.8 NA 43.3270.9 1.020
Air Temp. Relative Yield Bag Factor 5.60 Mix Temp. Initial set, min. Fine/Coarse by Vol 0.624 Bucket Full Technician who
conducted tests:
5217Sample Time Unit Weight (pcf) Act. w/c 0.450 Bucket Weight
Slump, in. Yield Des.Un.Wt. 141.42
Batch Time % Air Des. w/c 0.450 Unit Weight7/13/2011
Bucket Volume
Water Added/Withheld6/15/2011 4990
PLASTIC TEST RESULTS OTHER INFO
06/01/11 4347
Free H2O Content
Batch free H2O (lbs.)ADMIX INFORMATION
05/25/11 3907Type Brand / NameWR Type A Water Reducer
4x8 CYLINDERSTotal:
05/19/11 1783UW w/o Air: Aggregate Moistures
Coarse Aggregate 4:
Water Strength Test Results
Coarse Aggregate 2: Coarse Aggregate 3:
Sand 1: FA-1Coarse Aggregate 1: CA-1
Fly Ash:GGBFS:
Cement 1: CS-F-1Cement 2:
Dry Specific Gravity
Agg. absorption
Agg. FMMaterial
MIX DESIGN INFODry mix 1 cu. yd. Wt. (lbs.)
Dry mix lab batch Wt. (lbs.)
Adjusted lab batch Wt. (lbs.)
Actual lab batch Wt.
(lbs.)Material Code
MIX NUMBER Mix 49 Gravel F1 100Date: Mix Code: Size(c.f.):
State Study No. 239 - Influences on Strength Variability of Gravel Aggregate Concrete Comments / Notes / ObservationsCustomer: MDOT

177
Project: Lab #: BCDName: Set #: 1
5/18/2011 50 f'c: 4,000 psi 1.25 Factor: 0.05
Vol. (c.f.)
2.01 394.80 18.28 18.28 18.28 3.150.00 0.00 0.00 0.00 1.000.81 131.60 6.09 6.09 6.09 2.600.00 0.00 0.00 0.00 1.007.59 1241.87 57.49 57.49 57.49 2.621 0.34% 2.2112.39 1790.00 82.87 82.87 82.87 2.316 4.67% 6.510.00 0.00 0.00 0.000.00 0.00 0.00 0.000.00 0.00 0.00 0.00
Air: 1.50% 0.41 0.00 0.00 0.00Water: 3.80 236.88 10.97 15.03 15.03 1.00
"+-Air: 1.00% AGE psi Avg. psiDate
27.00 3795.15 175.70 179.77 1 day 1260142.70 142.70 146.00 1 day 1280
1 day 12507 day "2690"
oz /cwt oz /cy ml /cy batch ml actual ml Sand: -0.34% -0.20 7 day 30803.05 16.1 474.8 22.0 22.0 CA 1 -4.67% -3.87 7 day 2850
CA 2 0.00% 0.00 14 day 3840CA 3 0.00% 0.00 14 day 4130CA 4 0.00% 0.00 14 day 4230
28 day 4600+/- h2o Added W/held 28 day "4040"
28 day 44908:43 AM 2.00 56 day 47908:52 AM 142.96 7.83 56 day 4760
6.50 1.26 0.25 56 day 500066.8 NA 43.5770.7 1.010
Air Temp. Relative Yield Bag Factor 5.60 Mix Temp. Initial set, min. Fine/Coarse by Vol 0.613 Bucket Full Technician who
conducted tests:
4850Sample Time Unit Weight (pcf) Act. w/c 0.450 Bucket Weight
Slump, in. Yield Des.Un.Wt. 140.56
Batch Time % Air Des. w/c 0.450 Unit Weight7/13/2011
Bucket Volume
Water Added/Withheld6/15/2011 4545
PLASTIC TEST RESULTS OTHER INFO
06/01/11 4067
Free H2O Content
Batch free H2O (lbs.)ADMIX INFORMATION
05/25/11 2965Type Brand / NameWR Type A Water Reducer
4x8 CYLINDERSTotal:
05/19/11 1263UW w/o Air: Aggregate Moistures
Coarse Aggregate 4:
Water Strength Test Results
Coarse Aggregate 2: Coarse Aggregate 3:
Sand 1: FA-1Coarse Aggregate 1: CA-1
Fly Ash: SCM-1 (Class C Fly Ash)GGBFS:
Cement 1: CS-F-1Cement 2:
Dry Specific Gravity
Agg. absorption
Agg. FMMaterial
MIX DESIGN INFODry mix 1 cu. yd. Wt. (lbs.)
Dry mix lab batch Wt. (lbs.)
Adjusted lab batch Wt. (lbs.)
Actual lab batch Wt.
(lbs.)Material Code
MIX NUMBER Mix 50 Gravel F1 75/25CDate: Mix Code: Size(c.f.):
State Study No. 239 - Influences on Strength Variability of Gravel Aggregate Concrete Comments / Notes / ObservationsCustomer: MDOT

178
Project: Lab #: BCDName: Set #: 1
5/18/2011 51 f'c: 4,000 psi 1.25 Factor: 0.05
Vol. (c.f.)
2.01 394.80 18.28 18.28 18.28 3.150.00 0.00 0.00 0.00 1.000.96 131.60 6.09 6.09 6.09 2.200.00 0.00 0.00 0.00 1.007.45 1217.75 56.38 56.38 56.38 2.621 0.34% 2.2112.39 1790.00 82.87 82.87 82.87 2.316 4.67% 6.510.00 0.00 0.00 0.000.00 0.00 0.00 0.000.00 0.00 0.00 0.00
Air: 1.50% 0.41 0.00 0.00 0.00Water: 3.80 236.88 10.97 15.03 15.03 1.00
"+-Air: 1.00% AGE psi Avg. psiDate
27.00 3771.03 174.58 178.65 1 day 1070141.79 141.79 145.09 1 day 1130
1 day 11407 day 2540
oz /cwt oz /cy ml /cy batch ml actual ml Sand: -0.34% -0.19 7 day 28203.05 16.1 474.8 22.0 22.0 CA 1 -4.67% -3.87 7 day 2670
CA 2 0.00% 0.00 14 day "3970"CA 3 0.00% 0.00 14 day 3570CA 4 0.00% 0.00 14 day 3590
28 day 4450+/- h2o Added W/held 28 day 4490
28 day 44809:26 AM 2.00 56 day 48709:35 AM 142.48 7.83 56 day 4650
5.50 1.25 0.25 56 day 483068.4 NA 43.4571.6 1.000
Air Temp. Relative Yield Bag Factor 5.60 Mix Temp. Initial set, min. Fine/Coarse by Vol 0.601 Bucket Full Technician who
conducted tests:
4783Sample Time Unit Weight (pcf) Act. w/c 0.450 Bucket Weight
Slump, in. Yield Des.Un.Wt. 139.67
Batch Time % Air Des. w/c 0.450 Unit Weight7/13/2011
Bucket Volume
Water Added/Withheld6/15/2011 4473
PLASTIC TEST RESULTS OTHER INFO
06/01/11 3580
Free H2O Content
Batch free H2O (lbs.)ADMIX INFORMATION
05/25/11 2677Type Brand / NameWR Type A Water Reducer
4x8 CYLINDERSTotal:
05/19/11 1113UW w/o Air: Aggregate Moistures
Coarse Aggregate 4:
Water Strength Test Results
Coarse Aggregate 2: Coarse Aggregate 3:
Sand 1: FA-1Coarse Aggregate 1: CA-1
Fly Ash: SCM-2 (Class F Fly Ash)GGBFS:
Cement 1: CS-F-1Cement 2:
Dry Specific Gravity
Agg. absorption
Agg. FMMaterial
MIX DESIGN INFODry mix 1 cu. yd. Wt. (lbs.)
Dry mix lab batch Wt. (lbs.)
Adjusted lab batch Wt. (lbs.)
Actual lab batch Wt.
(lbs.)Material Code
MIX NUMBER Mix 51 Gravel F1 75/25FDate: Mix Code: Size(c.f.):
State Study No. 239 - Influences on Strength Variability of Gravel Aggregate Concrete Comments / Notes / ObservationsCustomer: MDOT

179
Project: Lab #: BCDName: Set #: 1
6/2/2011 52 f'c: 4,000 psi 1.25 Factor: 0.05
Vol. (c.f.)
2.68 526.40 24.37 24.37 24.37 3.150.00 0.00 0.00 0.00 1.000.00 0.00 0.00 0.00 1.000.00 0.00 0.00 0.00 1.007.73 1265.03 58.57 58.57 58.57 2.621 0.34% 2.2112.39 1790.00 82.87 82.87 82.87 2.316 4.67% 6.510.00 0.00 0.00 0.000.00 0.00 0.00 0.000.00 0.00 0.00 0.00
Air: 1.50% 0.41 0.00 0.00 0.00Water: 3.80 236.88 10.97 15.04 15.04 1.00
"+-Air: 1.00% AGE psi Avg. psiDate
27.00 3818.31 176.77 180.84 1 day 1840143.57 143.57 146.88 1 day 1700
1 day 18407 day 4010
oz /cwt oz /cy ml /cy batch ml actual ml Sand: -0.34% -0.20 7 day 38703.05 16.1 474.8 22.0 22.0 CA 1 -4.67% -3.87 7 day 3810
CA 2 0.00% 0.00 14 day "4850"CA 3 0.00% 0.00 14 day 4490CA 4 0.00% 0.00 14 day 3920
28 day "5110"+/- h2o Added W/held 28 day 4500
28 day 47308:59 AM 3.50 56 day 54009:08 AM 142.08 7.83 56 day 4880
3.25 1.27 0.25 56 day 490069.8 NA 43.3573.8 1.020
MIX NUMBER Mix 52 Gravel F2 100Date: Mix Code: Size(c.f.):
State Study No. 239 - Influences on Strength Variability of Gravel Aggregate Concrete Comments / Notes / ObservationsCustomer: MDOT
Cement 1: CS-F-2Cement 2:
Dry Specific Gravity
Agg. absorption
Agg. FMMaterial
MIX DESIGN INFODry mix 1 cu. yd. Wt. (lbs.)
Dry mix lab batch Wt. (lbs.)
Adjusted lab batch Wt. (lbs.)
Actual lab batch Wt.
(lbs.)Material Code
Sand 1: FA-1Coarse Aggregate 1: CA-1
Fly Ash:GGBFS:
Coarse Aggregate 4:
Water Strength Test Results
Coarse Aggregate 2: Coarse Aggregate 3:
4x8 CYLINDERSTotal:
06/03/11 1793UW w/o Air: Aggregate Moistures
06/16/11 4205
Free H2O Content
Batch free H2O (lbs.)ADMIX INFORMATION
06/09/11 3897Type Brand / NameWR Type A Water Reducer
Water Added/Withheld6/30/2011 4615
PLASTIC TEST RESULTS OTHER INFO
5060Sample Time Unit Weight (pcf) Act. w/c 0.450 Bucket Weight
Slump, in. Yield Des.Un.Wt. 141.42
Batch Time % Air Des. w/c 0.450 Unit Weight7/28/2011
Bucket Volume
Air Temp. Relative Yield Bag Factor 5.60 Mix Temp. Initial set, min. Fine/Coarse by Vol 0.624 Bucket Full Technician who
conducted tests:

180
Project: Lab #: BCDName: Set #: 1
6/2/2011 53 f'c: 4,000 psi 1.25 Factor: 0.05
Vol. (c.f.)
2.01 394.80 18.28 18.28 18.28 3.150.00 0.00 0.00 0.00 1.000.81 131.60 6.09 6.09 6.09 2.600.00 0.00 0.00 0.00 1.007.59 1241.87 57.49 57.49 57.49 2.621 0.34% 2.2112.39 1790.00 82.87 82.87 82.87 2.316 4.67% 6.510.00 0.00 0.00 0.000.00 0.00 0.00 0.000.00 0.00 0.00 0.00
Air: 1.50% 0.41 0.00 0.00 0.00Water: 3.80 236.88 10.97 15.03 15.03 1.00
"+-Air: 1.00% AGE psi Avg. psiDate
27.00 3795.15 175.70 179.77 1 day 1200142.70 142.70 146.00 1 day 1250
1 day 11407 day 3220
oz /cwt oz /cy ml /cy batch ml actual ml Sand: -0.34% -0.20 7 day 32903.05 16.1 474.8 22.0 22.0 CA 1 -4.67% -3.87 7 day "2940"
CA 2 0.00% 0.00 14 day 3370CA 3 0.00% 0.00 14 day 3350CA 4 0.00% 0.00 14 day "3860"
28 day 4770+/- h2o Added W/held 28 day 4360
28 day 44609:30 AM 2.00 56 day "4370"9:39 AM 143.80 7.83 56 day 5170
5.75 1.25 0.25 56 day 460068.5 NA 43.7874.2 1.000
MIX NUMBER Mix 53 Gravel F2 75/25CDate: Mix Code: Size(c.f.):
State Study No. 239 - Influences on Strength Variability of Gravel Aggregate Concrete Comments / Notes / ObservationsCustomer: MDOT
Cement 1: CS-F-2Cement 2:
Dry Specific Gravity
Agg. absorption
Agg. FMMaterial
MIX DESIGN INFODry mix 1 cu. yd. Wt. (lbs.)
Dry mix lab batch Wt. (lbs.)
Adjusted lab batch Wt. (lbs.)
Actual lab batch Wt.
(lbs.)Material Code
Sand 1: FA-1Coarse Aggregate 1: CA-1
Fly Ash: SCM-1 (Class C Fly Ash)GGBFS:
Coarse Aggregate 4:
Water Strength Test Results
Coarse Aggregate 2: Coarse Aggregate 3:
4x8 CYLINDERSTotal:
06/03/11 1197UW w/o Air: Aggregate Moistures
06/16/11 3360
Free H2O Content
Batch free H2O (lbs.)ADMIX INFORMATION
06/09/11 3255Type Brand / NameWR Type A Water Reducer
Water Added/Withheld6/30/2011 4530
PLASTIC TEST RESULTS OTHER INFO
4885Sample Time Unit Weight (pcf) Act. w/c 0.450 Bucket Weight
Slump, in. Yield Des.Un.Wt. 140.56
Batch Time % Air Des. w/c 0.450 Unit Weight7/28/2011
Bucket Volume
Air Temp. Relative Yield Bag Factor 5.60 Mix Temp. Initial set, min. Fine/Coarse by Vol 0.613 Bucket Full Technician who
conducted tests:

181
Project: Lab #: BCDName: Set #: 1
6/2/2011 54 f'c: 4,000 psi 1.25 Factor: 0.05
Vol. (c.f.)
2.01 394.80 18.28 18.28 18.28 3.150.00 0.00 0.00 0.00 1.000.96 131.60 6.09 6.09 6.09 2.200.00 0.00 0.00 0.00 1.007.45 1217.75 56.38 56.38 56.38 2.621 0.34% 2.2112.39 1790.00 82.87 82.87 82.87 2.316 4.67% 6.510.00 0.00 0.00 0.000.00 0.00 0.00 0.000.00 0.00 0.00 0.00
Air: 1.50% 0.41 0.00 0.00 0.00Water: 3.80 236.88 10.97 15.03 15.03 1.00
"+-Air: 1.00% AGE psi Avg. psiDate
27.00 3771.03 174.58 178.65 1 day 1080141.79 141.79 145.09 1 day 1170
1 day 11207 day 2600
oz /cwt oz /cy ml /cy batch ml actual ml Sand: -0.34% -0.19 7 day 26603.05 16.1 474.8 22.0 22.0 CA 1 -4.67% -3.87 7 day 2710
CA 2 0.00% 0.00 14 day 3270CA 3 0.00% 0.00 14 day 3250CA 4 0.00% 0.00 14 day 3450
28 day 4170+/- h2o Added W/held 28 day 4300
28 day 401010:02 AM 2.00 56 day 478010:11 AM 142.52 7.83 56 day 4570
5.50 1.25 0.25 56 day 441068.4 NA 43.4674.7 1.000
MIX NUMBER Mix 54 Gravel F2 75/25FDate: Mix Code: Size(c.f.):
State Study No. 239 - Influences on Strength Variability of Gravel Aggregate Concrete Comments / Notes / ObservationsCustomer: MDOT
Cement 1: CS-F-2Cement 2:
Dry Specific Gravity
Agg. absorption
Agg. FMMaterial
MIX DESIGN INFODry mix 1 cu. yd. Wt. (lbs.)
Dry mix lab batch Wt. (lbs.)
Adjusted lab batch Wt. (lbs.)
Actual lab batch Wt.
(lbs.)Material Code
Sand 1: FA-1Coarse Aggregate 1: CA-1
Fly Ash: SCM-2 (Class F Fly Ash)GGBFS:
Coarse Aggregate 4:
Water Strength Test Results
Coarse Aggregate 2: Coarse Aggregate 3:
4x8 CYLINDERSTotal:
06/03/11 1123UW w/o Air: Aggregate Moistures
06/16/11 3323
Free H2O Content
Batch free H2O (lbs.)ADMIX INFORMATION
06/09/11 2657Type Brand / NameWR Type A Water Reducer
Water Added/Withheld6/30/2011 4160
PLASTIC TEST RESULTS OTHER INFO
4587Sample Time Unit Weight (pcf) Act. w/c 0.450 Bucket Weight
Slump, in. Yield Des.Un.Wt. 139.67
Batch Time % Air Des. w/c 0.450 Unit Weight7/28/2011
Bucket Volume
Air Temp. Relative Yield Bag Factor 5.60 Mix Temp. Initial set, min. Fine/Coarse by Vol 0.601 Bucket Full Technician who
conducted tests:

182
Project: Lab #: BCDName: Set #: 1
7/14/2011 55 f'c: 4,000 psi 1.25 Factor: 0.05
Vol. (c.f.)
2.68 526.40 24.37 24.37 23.37 3.150.00 0.00 0.00 0.00 1.000.00 0.00 0.00 0.00 1.000.00 0.00 0.00 0.00 1.007.73 1265.03 58.57 58.57 58.57 2.621 0.34% 2.2112.39 1790.00 82.87 82.87 82.87 2.316 4.67% 6.510.00 0.00 0.00 0.000.00 0.00 0.00 0.000.00 0.00 0.00 0.00
Air: 1.50% 0.41 0.00 0.00 0.00Water: 3.80 236.88 10.97 15.04 15.04 1.00
"+-Air: 1.00% AGE psi Avg. psiDate
27.00 3818.31 176.77 180.84 1 day 2040143.57 143.57 146.88 1 day 1960
1 day 19707 day 4040
oz /cwt oz /cy ml /cy batch ml actual ml Sand: -0.34% -0.20 7 day "3360"3.05 16.1 474.8 22.0 22.0 CA 1 -4.67% -3.87 7 day 3710
CA 2 0.00% 0.00 14 day 4180CA 3 0.00% 0.00 14 day 4160CA 4 0.00% 0.00 14 day 4270
28 day "5340"+/- h2o Added W/held 28 day 4610
28 day 46409:41 AM 3.50 56 day 50409:50 AM 141.72 7.88 56 day 5230
3.00 1.27 0.25 56 day "6110"69.6 NA 43.3173.3 1.020
Air Temp. Relative Yield Bag Factor 5.60 Mix Temp. Initial set, min. Fine/Coarse by Vol 0.624 Bucket Full Technician who
conducted tests:
5135Sample Time Unit Weight (pcf) Act. w/c 0.469 Bucket Weight
Slump, in. Yield Des.Un.Wt. 141.42
Batch Time % Air Des. w/c 0.450 Unit Weight9/8/2011
Bucket Volume
Water Added/Withheld8/11/2011 4625
PLASTIC TEST RESULTS OTHER INFO
07/28/11 4203
Free H2O Content
Batch free H2O (lbs.)ADMIX INFORMATION
07/21/11 3875Type Brand / NameWR Type A Water Reducer
4x8 CYLINDERSTotal:
07/15/11 1990UW w/o Air: Aggregate Moistures
Coarse Aggregate 4:
Water Strength Test Results
Coarse Aggregate 2: Coarse Aggregate 3:
Sand 1: FA-1Coarse Aggregate 1: CA-1
Fly Ash:GGBFS:
Cement 1: CS-F-3Cement 2:
Dry Specific Gravity
Agg. absorption
Agg. FMMaterial
MIX DESIGN INFODry mix 1 cu. yd. Wt. (lbs.)
Dry mix lab batch Wt. (lbs.)
Adjusted lab batch Wt. (lbs.)
Actual lab batch Wt.
(lbs.)Material Code
MIX NUMBER Mix 55 Gravel F3 100Date: Mix Code: Size(c.f.):
State Study No. 239 - Influences on Strength Variability of Gravel Aggregate Concrete Comments / Notes / ObservationsCustomer: MDOT

183
Project: Lab #: BCDName: Set #: 1
7/14/2011 56 f'c: 4,000 psi 1.25 Factor: 0.05
Vol. (c.f.)
2.01 394.80 18.28 18.28 18.28 3.150.00 0.00 0.00 0.00 1.000.81 131.60 6.09 6.09 6.09 2.600.00 0.00 0.00 0.00 1.007.59 1241.87 57.49 57.49 57.49 2.621 0.34% 2.2112.39 1790.00 82.87 82.87 82.87 2.316 4.67% 6.510.00 0.00 0.00 0.000.00 0.00 0.00 0.000.00 0.00 0.00 0.00
Air: 1.50% 0.41 0.00 0.00 0.00Water: 3.80 236.88 10.97 15.03 15.03 1.00
"+-Air: 1.00% AGE psi Avg. psiDate
27.00 3795.15 175.70 179.77 1 day 1380142.70 142.70 146.00 1 day 1320
1 day 12507 day "2890"
oz /cwt oz /cy ml /cy batch ml actual ml Sand: -0.34% -0.20 7 day 25703.05 16.1 474.8 22.0 22.0 CA 1 -4.67% -3.87 7 day 2460
CA 2 0.00% 0.00 14 day 3430CA 3 0.00% 0.00 14 day 3570CA 4 0.00% 0.00 14 day 3360
28 day 4330+/- h2o Added W/held 28 day 4050
28 day 401010:04 AM 2.50 56 day 515010:15 AM 142.40 7.88 56 day "4630"
6.00 1.26 0.25 56 day 516069.6 NA 43.4873.6 1.010
Air Temp. Relative Yield Bag Factor 5.60 Mix Temp. Initial set, min. Fine/Coarse by Vol 0.613 Bucket Full Technician who
conducted tests:
5155Sample Time Unit Weight (pcf) Act. w/c 0.450 Bucket Weight
Slump, in. Yield Des.Un.Wt. 140.56
Batch Time % Air Des. w/c 0.450 Unit Weight9/8/2011
Bucket Volume
Water Added/Withheld8/11/2011 4130
PLASTIC TEST RESULTS OTHER INFO
07/28/11 3453
Free H2O Content
Batch free H2O (lbs.)ADMIX INFORMATION
07/21/11 2515Type Brand / NameWR Type A Water Reducer
4x8 CYLINDERSTotal:
07/15/11 1317UW w/o Air: Aggregate Moistures
Coarse Aggregate 4:
Water Strength Test Results
Coarse Aggregate 2: Coarse Aggregate 3:
Sand 1: FA-1Coarse Aggregate 1: CA-1
Fly Ash: SCM-1 (Class C Fly Ash)GGBFS:
Cement 1: CS-F-3Cement 2:
Dry Specific Gravity
Agg. absorption
Agg. FMMaterial
MIX DESIGN INFODry mix 1 cu. yd. Wt. (lbs.)
Dry mix lab batch Wt. (lbs.)
Adjusted lab batch Wt. (lbs.)
Actual lab batch Wt.
(lbs.)Material Code
MIX NUMBER Mix 56 Gravel F3 75/25CDate: Mix Code: Size(c.f.):
State Study No. 239 - Influences on Strength Variability of Gravel Aggregate Concrete Comments / Notes / ObservationsCustomer: MDOT

184
Project: Lab #: BCDName: Set #: 1
7/14/2011 57 f'c: 4,000 psi 1.25 Factor: 0.05
Vol. (c.f.)
2.01 394.80 18.28 18.28 18.28 3.150.00 0.00 0.00 0.00 1.000.96 131.60 6.09 6.09 6.09 2.200.00 0.00 0.00 0.00 1.007.45 1217.75 56.38 56.38 56.38 2.621 0.34% 2.2112.39 1790.00 82.87 82.87 82.87 2.316 4.67% 6.510.00 0.00 0.00 0.000.00 0.00 0.00 0.000.00 0.00 0.00 0.00
Air: 1.50% 0.41 0.00 0.00 0.00Water: 3.80 236.88 10.97 15.03 15.03 1.00
"+-Air: 1.00% AGE psi Avg. psiDate
27.00 3771.03 174.58 178.65 1 day 1250141.79 141.79 145.09 1 day 1240
1 day 12407 day "2660"
oz /cwt oz /cy ml /cy batch ml actual ml Sand: -0.34% -0.19 7 day 23503.05 16.1 474.8 22.0 22.0 CA 1 -4.67% -3.87 7 day 2380
CA 2 0.00% 0.00 14 day 3120CA 3 0.00% 0.00 14 day 3300CA 4 0.00% 0.00 14 day 3210
28 day 3660+/- h2o Added W/held 28 day 3870
28 day 371010:33 AM 2.25 56 day 471010:42 AM 141.92 7.88 56 day 4660
4.25 1.26 0.25 56 day 478069.9 NA 43.3674.0 1.010
Air Temp. Relative Yield Bag Factor 5.60 Mix Temp. Initial set, min. Fine/Coarse by Vol 0.601 Bucket Full Technician who
conducted tests:
4717Sample Time Unit Weight (pcf) Act. w/c 0.450 Bucket Weight
Slump, in. Yield Des.Un.Wt. 139.67
Batch Time % Air Des. w/c 0.450 Unit Weight9/8/2011
Bucket Volume
Water Added/Withheld8/11/2011 3747
PLASTIC TEST RESULTS OTHER INFO
07/28/11 3210
Free H2O Content
Batch free H2O (lbs.)ADMIX INFORMATION
07/21/11 2365Type Brand / NameWR Type A Water Reducer
4x8 CYLINDERSTotal:
07/15/11 1243UW w/o Air: Aggregate Moistures
Coarse Aggregate 4:
Water Strength Test Results
Coarse Aggregate 2: Coarse Aggregate 3:
Sand 1: FA-1Coarse Aggregate 1: CA-1
Fly Ash: SCM-2 (Class F Fly Ash)GGBFS:
Cement 1: CS-F-3Cement 2:
Dry Specific Gravity
Agg. absorption
Agg. FMMaterial
MIX DESIGN INFODry mix 1 cu. yd. Wt. (lbs.)
Dry mix lab batch Wt. (lbs.)
Adjusted lab batch Wt. (lbs.)
Actual lab batch Wt.
(lbs.)Material Code
MIX NUMBER Mix 57 Gravel F3 75/25FDate: Mix Code: Size(c.f.):
State Study No. 239 - Influences on Strength Variability of Gravel Aggregate Concrete Comments / Notes / ObservationsCustomer: MDOT
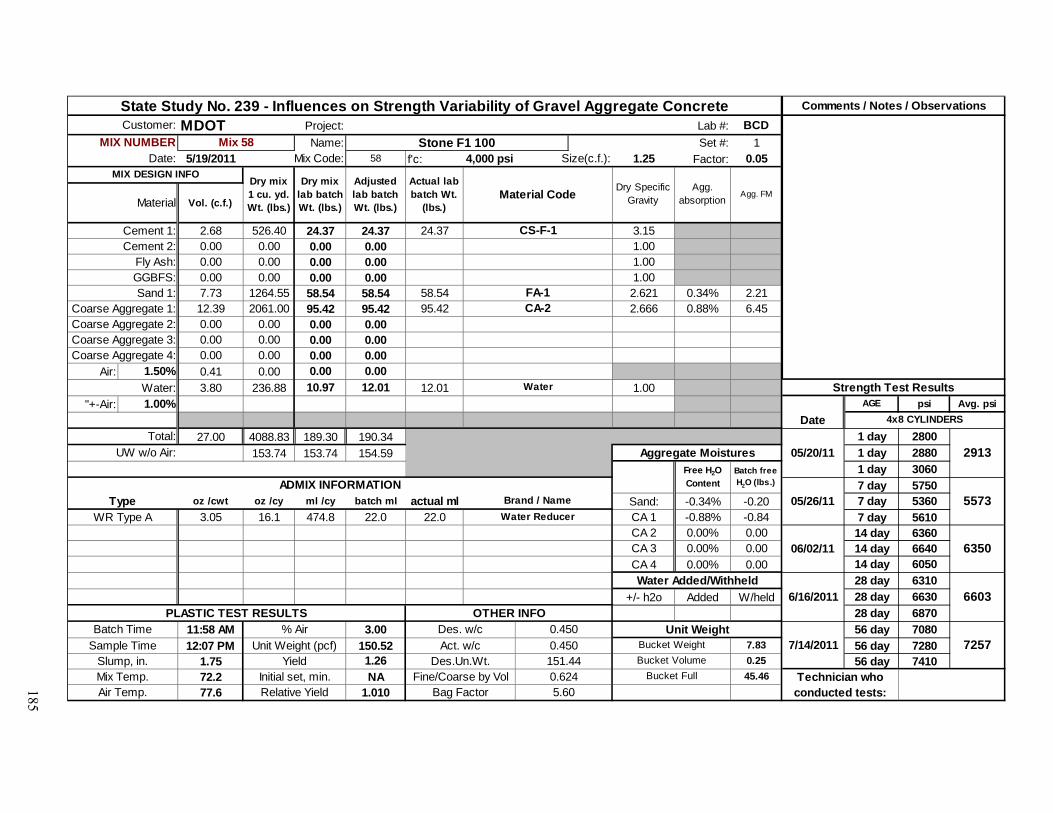
185
Project: Lab #: BCDName: Set #: 1
5/19/2011 58 f'c: 4,000 psi 1.25 Factor: 0.05
Vol. (c.f.)
2.68 526.40 24.37 24.37 24.37 3.150.00 0.00 0.00 0.00 1.000.00 0.00 0.00 0.00 1.000.00 0.00 0.00 0.00 1.007.73 1264.55 58.54 58.54 58.54 2.621 0.34% 2.2112.39 2061.00 95.42 95.42 95.42 2.666 0.88% 6.450.00 0.00 0.00 0.000.00 0.00 0.00 0.000.00 0.00 0.00 0.00
Air: 1.50% 0.41 0.00 0.00 0.00Water: 3.80 236.88 10.97 12.01 12.01 1.00
"+-Air: 1.00% AGE psi Avg. psiDate
27.00 4088.83 189.30 190.34 1 day 2800153.74 153.74 154.59 1 day 2880
1 day 30607 day 5750
oz /cwt oz /cy ml /cy batch ml actual ml Sand: -0.34% -0.20 7 day 53603.05 16.1 474.8 22.0 22.0 CA 1 -0.88% -0.84 7 day 5610
CA 2 0.00% 0.00 14 day 6360CA 3 0.00% 0.00 14 day 6640CA 4 0.00% 0.00 14 day 6050
28 day 6310+/- h2o Added W/held 28 day 6630
28 day 687011:58 AM 3.00 56 day 708012:07 PM 150.52 7.83 56 day 7280
1.75 1.26 0.25 56 day 741072.2 NA 45.4677.6 1.010
MIX NUMBER Mix 58 Stone F1 100Date: Mix Code: Size(c.f.):
State Study No. 239 - Influences on Strength Variability of Gravel Aggregate Concrete Comments / Notes / ObservationsCustomer: MDOT
Cement 1: CS-F-1Cement 2:
Dry Specific Gravity
Agg. absorption
Agg. FMMaterial
MIX DESIGN INFODry mix 1 cu. yd. Wt. (lbs.)
Dry mix lab batch Wt. (lbs.)
Adjusted lab batch Wt. (lbs.)
Actual lab batch Wt.
(lbs.)Material Code
Sand 1: FA-1Coarse Aggregate 1: CA-2
Fly Ash:GGBFS:
Coarse Aggregate 4:
Water Strength Test Results
Coarse Aggregate 2: Coarse Aggregate 3:
4x8 CYLINDERSTotal:
05/20/11 2913UW w/o Air: Aggregate Moistures
06/02/11 6350
Free H2O Content
Batch free H2O (lbs.)ADMIX INFORMATION
05/26/11 5573Type Brand / NameWR Type A Water Reducer
Water Added/Withheld6/16/2011 6603
PLASTIC TEST RESULTS OTHER INFO
7257Sample Time Unit Weight (pcf) Act. w/c 0.450 Bucket Weight
Slump, in. Yield Des.Un.Wt. 151.44
Batch Time % Air Des. w/c 0.450 Unit Weight7/14/2011
Bucket Volume
Air Temp. Relative Yield Bag Factor 5.60 Mix Temp. Initial set, min. Fine/Coarse by Vol 0.624 Bucket Full Technician who
conducted tests:

186
Project: Lab #: BCDName: Set #: 1
5/19/2011 59 f'c: 4,000 psi 1.25 Factor: 0.05
Vol. (c.f.)
2.01 394.80 18.28 18.28 18.28 3.150.00 0.00 0.00 0.00 1.000.81 131.60 6.09 6.09 6.09 2.600.00 0.00 0.00 0.00 1.007.59 1241.39 57.47 57.47 57.47 2.621 0.34% 2.2112.39 2061.00 95.42 95.42 95.42 2.666 0.88% 6.450.00 0.00 0.00 0.000.00 0.00 0.00 0.000.00 0.00 0.00 0.00
Air: 1.50% 0.41 0.00 0.00 0.00Water: 3.80 236.88 10.97 12.00 12.00 1.00
"+-Air: 1.00% AGE psi Avg. psiDate
27.00 4065.67 188.23 189.26 1 day 2030152.87 152.87 153.71 1 day 2090
1 day 20107 day 5480
oz /cwt oz /cy ml /cy batch ml actual ml Sand: -0.34% -0.20 7 day 54403.05 16.1 474.8 22.0 22.0 CA 1 -0.88% -0.84 7 day 5070
CA 2 0.00% 0.00 14 day 6580CA 3 0.00% 0.00 14 day 6530CA 4 0.00% 0.00 14 day 6480
28 day 7790+/- h2o Added W/held 28 day 7710
28 day 771012:40 PM 2.25 56 day 854012:49 PM 151.20 7.83 56 day 8220
3.00 1.25 0.25 56 day 822072.1 NA 45.6376.5 1.000
MIX NUMBER Mix 59 Stone F1 75/25CDate: Mix Code: Size(c.f.):
State Study No. 239 - Influences on Strength Variability of Gravel Aggregate Concrete Comments / Notes / ObservationsCustomer: MDOT
Cement 1: CS-F-1Cement 2:
Dry Specific Gravity
Agg. absorption
Agg. FMMaterial
MIX DESIGN INFODry mix 1 cu. yd. Wt. (lbs.)
Dry mix lab batch Wt. (lbs.)
Adjusted lab batch Wt. (lbs.)
Actual lab batch Wt.
(lbs.)Material Code
Sand 1: FA-1Coarse Aggregate 1: CA-2
Fly Ash: SCM-1 (Class C Fly Ash)GGBFS:
Coarse Aggregate 4:
Water Strength Test Results
Coarse Aggregate 2: Coarse Aggregate 3:
4x8 CYLINDERSTotal:
05/20/11 2043UW w/o Air: Aggregate Moistures
06/02/11 6530
Free H2O Content
Batch free H2O (lbs.)ADMIX INFORMATION
05/26/11 5330Type Brand / NameWR Type A Water Reducer
Water Added/Withheld6/16/2011 7737
PLASTIC TEST RESULTS OTHER INFO
8327Sample Time Unit Weight (pcf) Act. w/c 0.450 Bucket Weight
Slump, in. Yield Des.Un.Wt. 150.58
Batch Time % Air Des. w/c 0.450 Unit Weight7/14/2011
Bucket Volume
Air Temp. Relative Yield Bag Factor 5.60 Mix Temp. Initial set, min. Fine/Coarse by Vol 0.613 Bucket Full Technician who
conducted tests:

187
Project: Lab #: BCDName: Set #: 1
5/19/2011 60 f'c: 4,000 psi 1.25 Factor: 0.05
Vol. (c.f.)
2.01 394.80 18.28 18.28 18.28 3.150.00 0.00 0.00 0.00 1.000.96 131.60 6.09 6.09 6.09 2.200.00 0.00 0.00 0.00 1.007.44 1217.27 56.35 56.35 56.35 2.621 0.34% 2.2112.39 2061.00 95.42 95.42 95.42 2.666 0.88% 6.450.00 0.00 0.00 0.000.00 0.00 0.00 0.000.00 0.00 0.00 0.00
Air: 1.50% 0.41 0.00 0.00 0.00Water: 3.80 236.88 10.97 12.00 12.00 1.00
"+-Air: 1.00% AGE psi Avg. psiDate
27.00 4041.55 187.11 188.14 1 day 1890151.97 151.97 152.80 1 day 1920
1 day 18507 day 4490
oz /cwt oz /cy ml /cy batch ml actual ml Sand: -0.34% -0.19 7 day 45803.05 16.1 474.8 22.0 22.0 CA 1 -0.88% -0.84 7 day 4530
CA 2 0.00% 0.00 14 day 5430CA 3 0.00% 0.00 14 day 5510CA 4 0.00% 0.00 14 day 5370
28 day 6300+/- h2o Added W/held 28 day 6560
28 day 63001:14 PM 2.00 56 day 77301:24 PM 150.76 7.83 56 day 8060
2.50 1.25 0.25 56 day 779072.4 NA 45.5279.6 1.000
MIX NUMBER Mix 60 Stone F1 75/25FDate: Mix Code: Size(c.f.):
State Study No. 239 - Influences on Strength Variability of Gravel Aggregate Concrete Comments / Notes / ObservationsCustomer: MDOT
Cement 1: CS-F-1Cement 2:
Dry Specific Gravity
Agg. absorption
Agg. FMMaterial
MIX DESIGN INFODry mix 1 cu. yd. Wt. (lbs.)
Dry mix lab batch Wt. (lbs.)
Adjusted lab batch Wt. (lbs.)
Actual lab batch Wt.
(lbs.)Material Code
Sand 1: FA-1Coarse Aggregate 1: CA-2
Fly Ash: SCM-2 (Class F Fly Ash)GGBFS:
Coarse Aggregate 4:
Water Strength Test Results
Coarse Aggregate 2: Coarse Aggregate 3:
4x8 CYLINDERSTotal:
05/20/11 1887UW w/o Air: Aggregate Moistures
06/02/11 5437
Free H2O Content
Batch free H2O (lbs.)ADMIX INFORMATION
05/26/11 4533Type Brand / NameWR Type A Water Reducer
Water Added/Withheld6/16/2011 6387
PLASTIC TEST RESULTS OTHER INFO
7860Sample Time Unit Weight (pcf) Act. w/c 0.450 Bucket Weight
Slump, in. Yield Des.Un.Wt. 149.69
Batch Time % Air Des. w/c 0.450 Unit Weight7/14/2011
Bucket Volume
Air Temp. Relative Yield Bag Factor 5.60 Mix Temp. Initial set, min. Fine/Coarse by Vol 0.601 Bucket Full Technician who
conducted tests:

188
Project: Lab #: BCDName: Set #: 1
5/11/2011 61 f'c: 4,000 psi 1.25 Factor: 0.05
Vol. (c.f.)
2.68 526.40 24.37 24.37 24.37 3.150.00 0.00 0.00 0.00 1.000.00 0.00 0.00 0.00 1.000.00 0.00 0.00 0.00 1.007.73 1265.03 58.57 58.57 58.57 2.621 0.34% 2.2112.39 1790.00 82.87 82.87 82.87 2.316 4.67% 6.510.00 0.00 0.00 0.000.00 0.00 0.00 0.000.00 0.00 0.00 0.00
Air: 1.50% 0.41 0.00 0.00 0.00Water: 3.80 236.88 10.97 15.04 15.04 1.00
"+-Air: 1.00% AGE psi Avg. psiDate
27.00 3818.31 176.77 180.84 1 day 1960143.57 143.57 146.88 1 day 1850
1 day 18707 day 3050
oz /cwt oz /cy ml /cy batch ml actual ml Sand: -0.34% -0.20 7 day 33203.05 16.1 474.8 22.0 22.0 CA 1 -4.67% -3.87 7 day 3270
CA 2 0.00% 0.00 14 day 3520CA 3 0.00% 0.00 14 day 3450CA 4 0.00% 0.00 14 day 3170
28 day "4570"+/- h2o Added W/held 28 day 4160
28 day 409010:33 AM 3.75 56 day 432010:42 AM 141.12 7.83 56 day 4430
4.50 1.28 0.25 56 day 416068.8 NA 43.1172.4 1.020
MIX NUMBER Mix 61 Gravel G1 100Date: Mix Code: Size(c.f.):
State Study No. 239 - Influences on Strength Variability of Gravel Aggregate Concrete Comments / Notes / ObservationsCustomer: MDOT
Cement 1: CS-G-1Cement 2:
Dry Specific Gravity
Agg. absorption
Agg. FMMaterial
MIX DESIGN INFODry mix 1 cu. yd. Wt. (lbs.)
Dry mix lab batch Wt. (lbs.)
Adjusted lab batch Wt. (lbs.)
Actual lab batch Wt.
(lbs.)Material Code
Sand 1: FA-1Coarse Aggregate 1: CA-1
Fly Ash:GGBFS:
Coarse Aggregate 4:
Water Strength Test Results
Coarse Aggregate 2: Coarse Aggregate 3:
4x8 CYLINDERSTotal:
05/12/11 1893UW w/o Air: Aggregate Moistures
05/25/11 3380
Free H2O Content
Batch free H2O (lbs.)ADMIX INFORMATION
05/18/11 3213Type Brand / NameWR Type A Water Reducer
Water Added/Withheld6/8/2011 4125
PLASTIC TEST RESULTS OTHER INFO
4303Sample Time Unit Weight (pcf) Act. w/c 0.450 Bucket Weight
Slump, in. Yield Des.Un.Wt. 141.42
Batch Time % Air Des. w/c 0.450 Unit Weight7/6/2011
Bucket Volume
Air Temp. Relative Yield Bag Factor 5.60 Mix Temp. Initial set, min. Fine/Coarse by Vol 0.624 Bucket Full Technician who
conducted tests:

189
Project: Lab #: BCDName: Set #: 1
5/11/2011 62 f'c: 4,000 psi 1.25 Factor: 0.05
Vol. (c.f.)
2.01 394.80 18.28 18.28 18.28 3.150.00 0.00 0.00 0.00 1.000.81 131.60 6.09 6.09 6.09 2.600.00 0.00 0.00 0.00 1.007.59 1241.87 57.49 57.49 57.49 2.621 0.34% 2.2112.39 1790.00 82.87 82.87 82.87 2.316 4.67% 6.510.00 0.00 0.00 0.000.00 0.00 0.00 0.000.00 0.00 0.00 0.00
Air: 1.50% 0.41 0.00 0.00 0.00Water: 3.80 236.88 10.97 15.03 15.03 1.00
"+-Air: 1.00% AGE psi Avg. psiDate
27.00 3795.15 175.70 179.77 1 day 1130142.70 142.70 146.00 1 day 1220
1 day 11807 day 2760
oz /cwt oz /cy ml /cy batch ml actual ml Sand: -0.34% -0.20 7 day 27703.05 16.1 474.8 22.0 22.0 CA 1 -4.67% -3.87 7 day "3490"
CA 2 0.00% 0.00 14 day 3050CA 3 0.00% 0.00 14 day 2960CA 4 0.00% 0.00 14 day 2800
28 day 3710+/- h2o Added W/held 28 day 3750
28 day 37608:23 AM 2.50 56 day 38408:32 AM 142.52 7.83 56 day 3820
7.50 1.26 0.25 56 day 383068.1 NA 43.4672.7 1.010
MIX NUMBER Mix 62 Gravel G1 75/25CDate: Mix Code: Size(c.f.):
State Study No. 239 - Influences on Strength Variability of Gravel Aggregate Concrete Comments / Notes / ObservationsCustomer: MDOT
Cement 1: CS-G-1Cement 2:
Dry Specific Gravity
Agg. absorption
Agg. FMMaterial
MIX DESIGN INFODry mix 1 cu. yd. Wt. (lbs.)
Dry mix lab batch Wt. (lbs.)
Adjusted lab batch Wt. (lbs.)
Actual lab batch Wt.
(lbs.)Material Code
Sand 1: FA-1Coarse Aggregate 1: CA-1
Fly Ash: SCM-1 (Class C Fly Ash)GGBFS:
Coarse Aggregate 4:
Water Strength Test Results
Coarse Aggregate 2: Coarse Aggregate 3:
4x8 CYLINDERSTotal:
05/12/11 1177UW w/o Air: Aggregate Moistures
05/25/11 2937
Free H2O Content
Batch free H2O (lbs.)ADMIX INFORMATION
05/18/11 2765Type Brand / NameWR Type A Water Reducer
Water Added/Withheld6/8/2011 3740
PLASTIC TEST RESULTS OTHER INFO
3830Sample Time Unit Weight (pcf) Act. w/c 0.450 Bucket Weight
Slump, in. Yield Des.Un.Wt. 140.56
Batch Time % Air Des. w/c 0.450 Unit Weight7/6/2011
Bucket Volume
Air Temp. Relative Yield Bag Factor 5.60 Mix Temp. Initial set, min. Fine/Coarse by Vol 0.613 Bucket Full Technician who
conducted tests:

190
Project: Lab #: BCDName: Set #: 1
5/11/2011 63 f'c: 4,000 psi 1.25 Factor: 0.05
Vol. (c.f.)
2.01 394.80 18.28 18.28 18.28 3.150.00 0.00 0.00 0.00 1.000.96 131.60 6.09 6.09 6.09 2.200.00 0.00 0.00 0.00 1.007.45 1217.75 56.38 56.38 56.38 2.621 0.34% 2.2112.39 1790.00 82.87 82.87 82.87 2.316 4.67% 6.510.00 0.00 0.00 0.000.00 0.00 0.00 0.000.00 0.00 0.00 0.00
Air: 1.50% 0.41 0.00 0.00 0.00Water: 3.80 236.88 10.97 15.03 15.03 1.00
"+-Air: 1.00% AGE psi Avg. psiDate
27.00 3771.03 174.58 178.65 1 day 1230141.79 141.79 145.09 1 day 1270
1 day 13107 day 2420
oz /cwt oz /cy ml /cy batch ml actual ml Sand: -0.34% -0.19 7 day 24803.05 16.1 474.8 22.0 22.0 CA 1 -4.67% -3.87 7 day 2280
CA 2 0.00% 0.00 14 day 2570CA 3 0.00% 0.00 14 day 2620CA 4 0.00% 0.00 14 day 2730
28 day 3580+/- h2o Added W/held 28 day 3490
28 day 36509:10 AM 2.25 56 day 39109:19 AM 142.28 7.83 56 day 4100
6.75 1.26 0.25 56 day 400071.1 NA 43.4073.1 1.010
MIX NUMBER Mix 63 Gravel G1 75/25FDate: Mix Code: Size(c.f.):
State Study No. 239 - Influences on Strength Variability of Gravel Aggregate Concrete Comments / Notes / ObservationsCustomer: MDOT
Cement 1: CS-G-1Cement 2:
Dry Specific Gravity
Agg. absorption
Agg. FMMaterial
MIX DESIGN INFODry mix 1 cu. yd. Wt. (lbs.)
Dry mix lab batch Wt. (lbs.)
Adjusted lab batch Wt. (lbs.)
Actual lab batch Wt.
(lbs.)Material Code
Sand 1: FA-1Coarse Aggregate 1: CA-1
Fly Ash: SCM-2 (Class F Fly Ash)GGBFS:
Coarse Aggregate 4:
Water Strength Test Results
Coarse Aggregate 2: Coarse Aggregate 3:
4x8 CYLINDERSTotal:
05/12/11 1270UW w/o Air: Aggregate Moistures
05/25/11 2640
Free H2O Content
Batch free H2O (lbs.)ADMIX INFORMATION
05/18/11 2393Type Brand / NameWR Type A Water Reducer
Water Added/Withheld6/8/2011 3573
PLASTIC TEST RESULTS OTHER INFO
4003Sample Time Unit Weight (pcf) Act. w/c 0.450 Bucket Weight
Slump, in. Yield Des.Un.Wt. 139.67
Batch Time % Air Des. w/c 0.450 Unit Weight7/6/2011
Bucket Volume
Air Temp. Relative Yield Bag Factor 5.60 Mix Temp. Initial set, min. Fine/Coarse by Vol 0.601 Bucket Full Technician who
conducted tests:

191
Project: Lab #: BCDName: Set #: 1
6/1/2011 64 f'c: 4,000 psi 1.25 Factor: 0.05
Vol. (c.f.)
2.68 526.40 24.37 24.37 24.37 3.150.00 0.00 0.00 0.00 1.000.00 0.00 0.00 0.00 1.000.00 0.00 0.00 0.00 1.007.73 1265.03 58.57 58.57 58.57 2.621 0.34% 2.2112.39 1790.00 82.87 82.87 82.87 2.316 4.67% 6.510.00 0.00 0.00 0.000.00 0.00 0.00 0.000.00 0.00 0.00 0.00
Air: 1.50% 0.41 0.00 0.00 0.00Water: 3.80 236.88 10.97 15.04 15.04 1.00
"+-Air: 1.00% AGE psi Avg. psiDate
27.00 3818.31 176.77 180.84 1 day 1660143.57 143.57 146.88 1 day 1730
1 day 18107 day 3390
oz /cwt oz /cy ml /cy batch ml actual ml Sand: -0.34% -0.20 7 day 34803.05 16.1 474.8 22.0 22.0 CA 1 -4.67% -3.87 7 day 3520
CA 2 0.00% 0.00 14 day "3800"CA 3 0.00% 0.00 14 day 4310CA 4 0.00% 0.00 14 day 4130
28 day 4510+/- h2o Added W/held 28 day 4700
28 day 39001:11 PM 3.00 56 day 44001:20 PM 141.96 7.83 56 day 4610
4.25 1.27 0.25 56 day 436072.5 NA 43.3278.3 1.020
MIX NUMBER Mix 64 Gravel G2 100Date: Mix Code: Size(c.f.):
State Study No. 239 - Influences on Strength Variability of Gravel Aggregate Concrete Comments / Notes / ObservationsCustomer: MDOT
Cement 1: CS-G-2Cement 2:
Dry Specific Gravity
Agg. absorption
Agg. FMMaterial
MIX DESIGN INFODry mix 1 cu. yd. Wt. (lbs.)
Dry mix lab batch Wt. (lbs.)
Adjusted lab batch Wt. (lbs.)
Actual lab batch Wt.
(lbs.)Material Code
Sand 1: FA-1Coarse Aggregate 1: CA-1
Fly Ash:GGBFS:
Coarse Aggregate 4:
Water Strength Test Results
Coarse Aggregate 2: Coarse Aggregate 3:
4x8 CYLINDERSTotal:
06/02/11 1733UW w/o Air: Aggregate Moistures
06/15/11 4220
Free H2O Content
Batch free H2O (lbs.)ADMIX INFORMATION
06/08/11 3463Type Brand / NameWR Type A Water Reducer
Water Added/Withheld6/29/2011 4370
PLASTIC TEST RESULTS OTHER INFO
4457Sample Time Unit Weight (pcf) Act. w/c 0.450 Bucket Weight
Slump, in. Yield Des.Un.Wt. 141.42
Batch Time % Air Des. w/c 0.450 Unit Weight7/27/2011
Bucket Volume
Air Temp. Relative Yield Bag Factor 5.60 Mix Temp. Initial set, min. Fine/Coarse by Vol 0.624 Bucket Full Technician who
conducted tests:

192
Project: Lab #: BCDName: Set #: 1
6/1/2011 65 f'c: 4,000 psi 1.25 Factor: 0.05
Vol. (c.f.)
2.01 394.80 18.28 18.28 18.28 3.150.00 0.00 0.00 0.00 1.000.81 131.60 6.09 6.09 6.09 2.600.00 0.00 0.00 0.00 1.007.59 1241.87 57.49 57.49 57.49 2.621 0.34% 2.2112.39 1790.00 82.87 82.87 82.87 2.316 4.67% 6.510.00 0.00 0.00 0.000.00 0.00 0.00 0.000.00 0.00 0.00 0.00
Air: 1.50% 0.41 0.00 0.00 0.00Water: 3.80 236.88 10.97 15.03 15.03 1.00
"+-Air: 1.00% AGE psi Avg. psiDate
27.00 3795.15 175.70 179.77 1 day 1140142.70 142.70 146.00 1 day 1210
1 day 11607 day 2740
oz /cwt oz /cy ml /cy batch ml actual ml Sand: -0.34% -0.20 7 day 27503.05 16.1 474.8 22.0 22.0 CA 1 -4.67% -3.87 7 day "3200"
CA 2 0.00% 0.00 14 day 2820CA 3 0.00% 0.00 14 day "3480"CA 4 0.00% 0.00 14 day 3060
28 day 3500+/- h2o Added W/held 28 day 3490
28 day 34301:54 PM 2.00 56 day 40102:03 PM 142.76 7.83 56 day 4090
7.50 1.26 0.25 56 day 403070.7 NA 43.5278.5 1.010
MIX NUMBER Mix 65 Gravel G2 75/25CDate: Mix Code: Size(c.f.):
State Study No. 239 - Influences on Strength Variability of Gravel Aggregate Concrete Comments / Notes / ObservationsCustomer: MDOT
Cement 1: CS-G-2Cement 2:
Dry Specific Gravity
Agg. absorption
Agg. FMMaterial
MIX DESIGN INFODry mix 1 cu. yd. Wt. (lbs.)
Dry mix lab batch Wt. (lbs.)
Adjusted lab batch Wt. (lbs.)
Actual lab batch Wt.
(lbs.)Material Code
Sand 1: FA-1Coarse Aggregate 1: CA-1
Fly Ash: SCM-1 (Class C Fly Ash)GGBFS:
Coarse Aggregate 4:
Water Strength Test Results
Coarse Aggregate 2: Coarse Aggregate 3:
4x8 CYLINDERSTotal:
06/02/11 1170UW w/o Air: Aggregate Moistures
06/15/11 2940
Free H2O Content
Batch free H2O (lbs.)ADMIX INFORMATION
06/08/11 2745Type Brand / NameWR Type A Water Reducer
Water Added/Withheld6/29/2011 3473
PLASTIC TEST RESULTS OTHER INFO
4043Sample Time Unit Weight (pcf) Act. w/c 0.450 Bucket Weight
Slump, in. Yield Des.Un.Wt. 140.56
Batch Time % Air Des. w/c 0.450 Unit Weight7/27/2011
Bucket Volume
Air Temp. Relative Yield Bag Factor 5.60 Mix Temp. Initial set, min. Fine/Coarse by Vol 0.613 Bucket Full Technician who
conducted tests:

193
Project: Lab #: BCDName: Set #: 1
6/1/2011 66 f'c: 4,000 psi 1.25 Factor: 0.05
Vol. (c.f.)
2.01 394.80 18.28 18.28 18.28 3.150.00 0.00 0.00 0.00 1.000.96 131.60 6.09 6.09 6.09 2.200.00 0.00 0.00 0.00 1.007.45 1217.75 56.38 56.38 56.38 2.621 0.34% 2.2112.39 1790.00 82.87 82.87 82.87 2.316 4.67% 6.510.00 0.00 0.00 0.000.00 0.00 0.00 0.000.00 0.00 0.00 0.00
Air: 1.50% 0.41 0.00 0.00 0.00Water: 3.80 236.88 10.97 15.03 15.03 1.00
"+-Air: 1.00% AGE psi Avg. psiDate
27.00 3771.03 174.58 178.65 1 day 1130141.79 141.79 145.09 1 day 1090
1 day 11807 day 2580
oz /cwt oz /cy ml /cy batch ml actual ml Sand: -0.34% -0.19 7 day 24503.05 16.1 474.8 22.0 22.0 CA 1 -4.67% -3.87 7 day 2500
CA 2 0.00% 0.00 14 day 2970CA 3 0.00% 0.00 14 day 2890CA 4 0.00% 0.00 14 day 2780
28 day 3480+/- h2o Added W/held 28 day 3540
28 day 35202:35 PM 2.00 56 day "3870"2:44 PM 142.16 7.83 56 day 4060
6.50 1.26 0.25 56 day 436069.8 NA 43.3778.0 1.010
MIX NUMBER Mix 66 Gravel G2 75/25FDate: Mix Code: Size(c.f.):
State Study No. 239 - Influences on Strength Variability of Gravel Aggregate Concrete Comments / Notes / ObservationsCustomer: MDOT
Cement 1: CS-G-2Cement 2:
Dry Specific Gravity
Agg. absorption
Agg. FMMaterial
MIX DESIGN INFODry mix 1 cu. yd. Wt. (lbs.)
Dry mix lab batch Wt. (lbs.)
Adjusted lab batch Wt. (lbs.)
Actual lab batch Wt.
(lbs.)Material Code
Sand 1: FA-1Coarse Aggregate 1: CA-1
Fly Ash: SCM-2 (Class F Fly Ash)GGBFS:
Coarse Aggregate 4:
Water Strength Test Results
Coarse Aggregate 2: Coarse Aggregate 3:
4x8 CYLINDERSTotal:
06/02/11 1133UW w/o Air: Aggregate Moistures
06/15/11 2880
Free H2O Content
Batch free H2O (lbs.)ADMIX INFORMATION
06/08/11 2510Type Brand / NameWR Type A Water Reducer
Water Added/Withheld6/29/2011 3513
PLASTIC TEST RESULTS OTHER INFO
4210Sample Time Unit Weight (pcf) Act. w/c 0.450 Bucket Weight
Slump, in. Yield Des.Un.Wt. 139.67
Batch Time % Air Des. w/c 0.450 Unit Weight7/27/2011
Bucket Volume
Air Temp. Relative Yield Bag Factor 5.60 Mix Temp. Initial set, min. Fine/Coarse by Vol 0.601 Bucket Full Technician who
conducted tests:

194
Project: Lab #: BCDName: Set #: 1
7/5/2011 67 f'c: 4,000 psi 1.25 Factor: 0.05
Vol. (c.f.)
2.68 526.40 24.37 24.37 24.37 3.150.00 0.00 0.00 0.00 1.000.00 0.00 0.00 0.00 1.000.00 0.00 0.00 0.00 1.007.73 1265.03 58.57 58.57 58.57 2.621 0.34% 2.2112.39 1790.00 82.87 82.87 82.87 2.316 4.67% 6.510.00 0.00 0.00 0.000.00 0.00 0.00 0.000.00 0.00 0.00 0.00
Air: 1.50% 0.41 0.00 0.00 0.00Water: 3.80 236.88 10.97 15.04 15.04 1.00
"+-Air: 1.00% AGE psi Avg. psiDate
27.00 3818.31 176.77 180.84 1 day 2000143.57 143.57 146.88 1 day 2040
1 day 19807 day 3540
oz /cwt oz /cy ml /cy batch ml actual ml Sand: -0.34% -0.20 7 day 36803.05 16.1 474.8 22.0 22.0 CA 1 -4.67% -3.87 7 day 3600
CA 2 0.00% 0.00 14 day 3930CA 3 0.00% 0.00 14 day "4240"CA 4 0.00% 0.00 14 day 3810
28 day 4760+/- h2o Added W/held 28 day 4700
28 day 49709:51 AM 3.25 56 day 49209:59 AM 143.32 7.83 56 day 4630
3.50 1.26 0.25 56 day 478072.7 NA 43.6672.4 1.010
MIX NUMBER Mix 67 Gravel G3 100Date: Mix Code: Size(c.f.):
State Study No. 239 - Influences on Strength Variability of Gravel Aggregate Concrete Comments / Notes / ObservationsCustomer: MDOT
Cement 1: CS-G-3Cement 2:
Dry Specific Gravity
Agg. absorption
Agg. FMMaterial
MIX DESIGN INFODry mix 1 cu. yd. Wt. (lbs.)
Dry mix lab batch Wt. (lbs.)
Adjusted lab batch Wt. (lbs.)
Actual lab batch Wt.
(lbs.)Material Code
Sand 1: FA-1Coarse Aggregate 1: CA-1
Fly Ash:GGBFS:
Coarse Aggregate 4:
Water Strength Test Results
Coarse Aggregate 2: Coarse Aggregate 3:
4x8 CYLINDERSTotal:
07/06/11 2007UW w/o Air: Aggregate Moistures
07/19/11 3870
Free H2O Content
Batch free H2O (lbs.)ADMIX INFORMATION
07/12/11 3607Type Brand / NameWR Type A Water Reducer
Water Added/Withheld8/2/2011 4810
PLASTIC TEST RESULTS OTHER INFO
4777Sample Time Unit Weight (pcf) Act. w/c 0.450 Bucket Weight
Slump, in. Yield Des.Un.Wt. 141.42
Batch Time % Air Des. w/c 0.450 Unit Weight8/30/2011
Bucket Volume
Air Temp. Relative Yield Bag Factor 5.60 Mix Temp. Initial set, min. Fine/Coarse by Vol 0.624 Bucket Full Technician who
conducted tests:

195
Project: Lab #: BCDName: Set #: 1
7/5/2011 68 f'c: 4,000 psi 1.25 Factor: 0.05
Vol. (c.f.)
2.01 394.80 18.28 18.28 18.28 3.150.00 0.00 0.00 0.00 1.000.81 131.60 6.09 6.09 6.09 2.600.00 0.00 0.00 0.00 1.007.59 1241.87 57.49 57.49 57.49 2.621 0.34% 2.2112.39 1790.00 82.87 82.87 82.87 2.316 4.67% 6.510.00 0.00 0.00 0.000.00 0.00 0.00 0.000.00 0.00 0.00 0.00
Air: 1.50% 0.41 0.00 0.00 0.00Water: 3.80 236.88 10.97 15.03 15.03 1.00
"+-Air: 1.00% AGE psi Avg. psiDate
27.00 3795.15 175.70 179.77 1 day 1530142.70 142.70 146.00 1 day 1440
1 day 13407 day 3000
oz /cwt oz /cy ml /cy batch ml actual ml Sand: -0.34% -0.20 7 day "3410"3.05 16.1 474.8 22.0 22.0 CA 1 -4.67% -3.87 7 day 3000
CA 2 0.00% 0.00 14 day 3400CA 3 0.00% 0.00 14 day 3450CA 4 0.00% 0.00 14 day 3740
28 day 4010+/- h2o Added W/held 28 day 4280
28 day 393010:12 AM 2.75 56 day 449010:20 AM 142.88 7.83 56 day 4520
6.25 1.26 0.25 56 day 481072.3 NA 43.5572.7 1.010
MIX NUMBER Mix 68 Gravel G3 75/25CDate: Mix Code: Size(c.f.):
State Study No. 239 - Influences on Strength Variability of Gravel Aggregate Concrete Comments / Notes / ObservationsCustomer: MDOT
Cement 1: CS-G-3Cement 2:
Dry Specific Gravity
Agg. absorption
Agg. FMMaterial
MIX DESIGN INFODry mix 1 cu. yd. Wt. (lbs.)
Dry mix lab batch Wt. (lbs.)
Adjusted lab batch Wt. (lbs.)
Actual lab batch Wt.
(lbs.)Material Code
Sand 1: FA-1Coarse Aggregate 1: CA-1
Fly Ash: SCM-1 (Class C Fly Ash)GGBFS:
Coarse Aggregate 4:
Water Strength Test Results
Coarse Aggregate 2: Coarse Aggregate 3:
4x8 CYLINDERSTotal:
07/06/11 1437UW w/o Air: Aggregate Moistures
07/19/11 3530
Free H2O Content
Batch free H2O (lbs.)ADMIX INFORMATION
07/12/11 3000Type Brand / NameWR Type A Water Reducer
Water Added/Withheld8/2/2011 4073
PLASTIC TEST RESULTS OTHER INFO
4607Sample Time Unit Weight (pcf) Act. w/c 0.450 Bucket Weight
Slump, in. Yield Des.Un.Wt. 140.56
Batch Time % Air Des. w/c 0.450 Unit Weight8/30/2011
Bucket Volume
Air Temp. Relative Yield Bag Factor 5.60 Mix Temp. Initial set, min. Fine/Coarse by Vol 0.613 Bucket Full Technician who
conducted tests:

196
Project: Lab #: BCDName: Set #: 1
7/5/2011 69 f'c: 4,000 psi 1.25 Factor: 0.05
Vol. (c.f.)
2.01 394.80 18.28 18.28 18.28 3.150.00 0.00 0.00 0.00 1.000.96 131.60 6.09 6.09 6.09 2.200.00 0.00 0.00 0.00 1.007.45 1217.75 56.38 56.38 56.38 2.621 0.34% 2.2112.39 1790.00 82.87 82.87 82.87 2.316 4.67% 6.510.00 0.00 0.00 0.000.00 0.00 0.00 0.000.00 0.00 0.00 0.00
Air: 1.50% 0.41 0.00 0.00 0.00Water: 3.80 236.88 10.97 15.03 15.03 1.00
"+-Air: 1.00% AGE psi Avg. psiDate
27.00 3771.03 174.58 178.65 1 day 1490141.79 141.79 145.09 1 day 1430
1 day 14607 day 2840
oz /cwt oz /cy ml /cy batch ml actual ml Sand: -0.34% -0.19 7 day "2620"3.05 16.1 474.8 22.0 22.0 CA 1 -4.67% -3.87 7 day 2930
CA 2 0.00% 0.00 14 day 3290CA 3 0.00% 0.00 14 day 2940CA 4 0.00% 0.00 14 day 2820
28 day "3750"+/- h2o Added W/held 28 day 4310
28 day 416010:34 AM 2.25 56 day 404010:42 AM 141.96 7.83 56 day 4080
5.25 1.26 0.25 56 day 435074.1 NA 43.3273.1 1.010
MIX NUMBER Mix 69 Gravel G3 75/25FDate: Mix Code: Size(c.f.):
State Study No. 239 - Influences on Strength Variability of Gravel Aggregate Concrete Comments / Notes / ObservationsCustomer: MDOT
Cement 1: CS-G-3Cement 2:
Dry Specific Gravity
Agg. absorption
Agg. FMMaterial
MIX DESIGN INFODry mix 1 cu. yd. Wt. (lbs.)
Dry mix lab batch Wt. (lbs.)
Adjusted lab batch Wt. (lbs.)
Actual lab batch Wt.
(lbs.)Material Code
Sand 1: FA-1Coarse Aggregate 1: CA-1
Fly Ash: SCM-2 (Class F Fly Ash)GGBFS:
Coarse Aggregate 4:
Water Strength Test Results
Coarse Aggregate 2: Coarse Aggregate 3:
4x8 CYLINDERSTotal:
07/06/11 1460UW w/o Air: Aggregate Moistures
07/19/11 3017
Free H2O Content
Batch free H2O (lbs.)ADMIX INFORMATION
07/12/11 2885Type Brand / NameWR Type A Water Reducer
Water Added/Withheld8/2/2011 4235
PLASTIC TEST RESULTS OTHER INFO
4157Sample Time Unit Weight (pcf) Act. w/c 0.450 Bucket Weight
Slump, in. Yield Des.Un.Wt. 139.67
Batch Time % Air Des. w/c 0.450 Unit Weight8/30/2011
Bucket Volume
Air Temp. Relative Yield Bag Factor 5.60 Mix Temp. Initial set, min. Fine/Coarse by Vol 0.601 Bucket Full Technician who
conducted tests:

197
Project: Lab #: BCDName: Set #: 1
5/16/2011 70 f'c: 4,000 psi 1.25 Factor: 0.05
Vol. (c.f.)
2.68 526.40 24.37 24.37 24.37 3.150.00 0.00 0.00 0.00 1.000.00 0.00 0.00 0.00 1.000.00 0.00 0.00 0.00 1.007.73 1264.55 58.54 58.54 58.54 2.621 0.34% 2.2112.39 2061.00 95.42 95.42 95.42 2.666 0.88% 6.450.00 0.00 0.00 0.000.00 0.00 0.00 0.000.00 0.00 0.00 0.00
Air: 1.50% 0.41 0.00 0.00 0.00Water: 3.80 236.88 10.97 12.01 12.01 1.00
"+-Air: 1.00% AGE psi Avg. psiDate
27.00 4088.83 189.30 190.34 1 day 2740153.74 153.74 154.59 1 day 2810
1 day 28207 day 5330
oz /cwt oz /cy ml /cy batch ml actual ml Sand: -0.34% -0.20 7 day 54403.05 16.1 474.8 22.0 22.0 CA 1 -0.88% -0.84 7 day 5350
CA 2 0.00% 0.00 14 day 6030CA 3 0.00% 0.00 14 day 6330CA 4 0.00% 0.00 14 day 6270
28 day 6870+/- h2o Added W/held 28 day 6740
28 day 66101:52 PM 3.50 56 day 68301:40 PM 150.44 7.83 56 day 6740
2.25 1.27 0.25 56 day 693068.4 NA 45.4470.2 1.020
Air Temp. Relative Yield Bag Factor 5.60 Mix Temp. Initial set, min. Fine/Coarse by Vol 0.624 Bucket Full Technician who
conducted tests:
6833Sample Time Unit Weight (pcf) Act. w/c 0.450 Bucket Weight
Slump, in. Yield Des.Un.Wt. 151.44
Batch Time % Air Des. w/c 0.450 Unit Weight7/11/2011
Bucket Volume
Water Added/Withheld6/13/2011 6740
PLASTIC TEST RESULTS OTHER INFO
05/30/11 6210
Free H2O Content
Batch free H2O (lbs.)ADMIX INFORMATION
05/23/11 5373Type Brand / NameWR Type A Water Reducer
4x8 CYLINDERSTotal:
05/17/11 2790UW w/o Air: Aggregate Moistures
Coarse Aggregate 4:
Water Strength Test Results
Coarse Aggregate 2: Coarse Aggregate 3:
Sand 1: FA-1Coarse Aggregate 1: CA-2
Fly Ash:GGBFS:
Cement 1: CS-G-1Cement 2:
Dry Specific Gravity
Agg. absorption
Agg. FMMaterial
MIX DESIGN INFODry mix 1 cu. yd. Wt. (lbs.)
Dry mix lab batch Wt. (lbs.)
Adjusted lab batch Wt. (lbs.)
Actual lab batch Wt.
(lbs.)Material Code
MIX NUMBER Mix 70 Stone G1 100Date: Mix Code: Size(c.f.):
State Study No. 239 - Influences on Strength Variability of Gravel Aggregate Concrete Comments / Notes / ObservationsCustomer: MDOT

198
Project: Lab #: BCDName: Set #: 1
5/16/2011 71 f'c: 4,000 psi 1.25 Factor: 0.05
Vol. (c.f.)
2.01 394.80 18.28 18.28 18.28 3.150.00 0.00 0.00 0.00 1.000.81 131.60 6.09 6.09 6.09 2.600.00 0.00 0.00 0.00 1.007.59 1241.39 57.47 57.47 57.47 2.621 0.34% 2.2112.39 2061.00 95.42 95.42 95.42 2.666 0.88% 6.450.00 0.00 0.00 0.000.00 0.00 0.00 0.000.00 0.00 0.00 0.00
Air: 1.50% 0.41 0.00 0.00 0.00Water: 3.80 236.88 10.97 12.00 12.00 1.00
"+-Air: 1.00% AGE psi Avg. psiDate
27.00 4065.67 188.23 189.26 1 day 1710152.87 152.87 153.71 1 day 1790
1 day 17507 day 5840
oz /cwt oz /cy ml /cy batch ml actual ml Sand: -0.34% -0.20 7 day 61203.05 16.1 474.8 22.0 22.0 CA 1 -0.88% -0.84 7 day 5910
CA 2 0.00% 0.00 14 day 6860CA 3 0.00% 0.00 14 day 6600CA 4 0.00% 0.00 14 day 6510
28 day 7470+/- h2o Added W/held 28 day 6970
28 day 71902:28 PM 2.50 56 day 77702:37 PM 150.92 7.83 56 day 7850
3.50 1.25 0.25 56 day 793068.0 NA 45.5670.0 1.000
Air Temp. Relative Yield Bag Factor 5.60 Mix Temp. Initial set, min. Fine/Coarse by Vol 0.613 Bucket Full Technician who
conducted tests:
7850Sample Time Unit Weight (pcf) Act. w/c 0.450 Bucket Weight
Slump, in. Yield Des.Un.Wt. 150.58
Batch Time % Air Des. w/c 0.450 Unit Weight7/11/2011
Bucket Volume
Water Added/Withheld6/13/2011 7210
PLASTIC TEST RESULTS OTHER INFO
05/30/11 6657
Free H2O Content
Batch free H2O (lbs.)ADMIX INFORMATION
05/23/11 5957Type Brand / NameWR Type A Water Reducer
4x8 CYLINDERSTotal:
05/17/11 1750UW w/o Air: Aggregate Moistures
Coarse Aggregate 4:
Water Strength Test Results
Coarse Aggregate 2: Coarse Aggregate 3:
Sand 1: FA-1Coarse Aggregate 1: CA-2
Fly Ash: SCM-1 (Class C Fly Ash)GGBFS:
Cement 1: CS-G-1Cement 2:
Dry Specific Gravity
Agg. absorption
Agg. FMMaterial
MIX DESIGN INFODry mix 1 cu. yd. Wt. (lbs.)
Dry mix lab batch Wt. (lbs.)
Adjusted lab batch Wt. (lbs.)
Actual lab batch Wt.
(lbs.)Material Code
MIX NUMBER Mix 71 Stone G1 75/25CDate: Mix Code: Size(c.f.):
State Study No. 239 - Influences on Strength Variability of Gravel Aggregate Concrete Comments / Notes / ObservationsCustomer: MDOT

199
Project: Lab #: BCDName: Set #: 1
5/16/2011 72 f'c: 4,000 psi 1.25 Factor: 0.05
Vol. (c.f.)
2.01 394.80 18.28 18.28 18.28 3.150.00 0.00 0.00 0.00 1.000.96 131.60 6.09 6.09 6.09 2.200.00 0.00 0.00 0.00 1.007.44 1217.27 56.35 56.35 56.35 2.621 0.34% 2.2112.39 2061.00 95.42 95.42 95.42 2.666 0.88% 6.450.00 0.00 0.00 0.000.00 0.00 0.00 0.000.00 0.00 0.00 0.00
Air: 1.50% 0.41 0.00 0.00 0.00Water: 3.80 236.88 10.97 12.00 12.00 1.00
"+-Air: 1.00% AGE psi Avg. psiDate
27.00 4041.55 187.11 188.14 1 day 1830151.97 151.97 152.80 1 day 1900
1 day 20307 day 4350
oz /cwt oz /cy ml /cy batch ml actual ml Sand: -0.34% -0.19 7 day 42803.05 16.1 474.8 22.0 22.0 CA 1 -0.88% -0.84 7 day 4510
CA 2 0.00% 0.00 14 day 5270CA 3 0.00% 0.00 14 day 5250CA 4 0.00% 0.00 14 day 5340
28 day 5930+/- h2o Added W/held 28 day 6050
28 day 58203:07 PM 2.50 56 day 71903:16 PM 150.28 7.83 56 day 7180
3.50 1.25 0.25 56 day 704067.1 NA 45.4070.0 1.000
Air Temp. Relative Yield Bag Factor 5.60 Mix Temp. Initial set, min. Fine/Coarse by Vol 0.601 Bucket Full Technician who
conducted tests:
7137Sample Time Unit Weight (pcf) Act. w/c 0.450 Bucket Weight
Slump, in. Yield Des.Un.Wt. 149.69
Batch Time % Air Des. w/c 0.450 Unit Weight7/11/2011
Bucket Volume
Water Added/Withheld6/13/2011 5933
PLASTIC TEST RESULTS OTHER INFO
05/30/11 5287
Free H2O Content
Batch free H2O (lbs.)ADMIX INFORMATION
05/23/11 4380Type Brand / NameWR Type A Water Reducer
4x8 CYLINDERSTotal:
05/17/11 1920UW w/o Air: Aggregate Moistures
Coarse Aggregate 4:
Water Strength Test Results
Coarse Aggregate 2: Coarse Aggregate 3:
Sand 1: FA-1Coarse Aggregate 1: CA-2
Fly Ash: SCM-2 (Class F Fly Ash)GGBFS:
Cement 1: CS-G-1Cement 2:
Dry Specific Gravity
Agg. absorption
Agg. FMMaterial
MIX DESIGN INFODry mix 1 cu. yd. Wt. (lbs.)
Dry mix lab batch Wt. (lbs.)
Adjusted lab batch Wt. (lbs.)
Actual lab batch Wt.
(lbs.)Material Code
MIX NUMBER Mix 72 Stone G1 75/25FDate: Mix Code: Size(c.f.):
State Study No. 239 - Influences on Strength Variability of Gravel Aggregate Concrete Comments / Notes / ObservationsCustomer: MDOT

200
Project: Lab #: BCDName: Set #: 1
4/27/2011 73 f'c: 4,000 psi 1.25 Factor: 0.05
Vol. (c.f.)
2.72 526.40 24.37 24.37 24.37 3.100.00 0.00 0.00 0.00 1.000.00 0.00 0.00 0.00 1.000.00 0.00 0.00 0.00 1.007.69 1257.97 58.24 58.24 58.24 2.621 0.34% 2.2112.39 1790.00 82.87 82.87 82.87 2.316 4.67% 6.510.00 0.00 0.00 0.000.00 0.00 0.00 0.000.00 0.00 0.00 0.00
Air: 1.50% 0.41 0.00 0.00 0.00Water: 3.80 236.88 10.97 15.03 15.03 1.00
"+-Air: 1.00% AGE psi Avg. psiDate
27.00 3811.25 176.45 180.51 1 day 2230143.31 143.31 146.61 1 day 2220
1 day 22007 day "3720"
oz /cwt oz /cy ml /cy batch ml actual ml Sand: -0.34% -0.20 7 day 43803.05 16.1 474.8 22.0 22.0 CA 1 -4.67% -3.87 7 day 4320
CA 2 0.00% 0.00 14 day 4810CA 3 0.00% 0.00 14 day 4620CA 4 0.00% 0.00 14 day 4760
28 day 4420+/- h2o Added W/held 28 day "4360"
28 day 49109:50 AM 3.75 56 day 52309:59 AM 141.64 7.82 56 day 5270
3.25 1.27 0.25 56 day 500070.1 NA 43.2372.7 1.020
Air Temp. Relative Yield Bag Factor 5.60 Mix Temp. Initial set, min. Fine/Coarse by Vol 0.621 Bucket Full Technician who
conducted tests:
5167Sample Time Unit Weight (pcf) Act. w/c 0.450 Bucket Weight
Slump, in. Yield Des.Un.Wt. 141.16
Batch Time % Air Des. w/c 0.450 Unit Weight6/22/2011
Bucket Volume
Water Added/Withheld5/25/2011 4665
PLASTIC TEST RESULTS OTHER INFO
05/11/11 4730
Free H2O Content
Batch free H2O (lbs.)ADMIX INFORMATION
05/04/11 4350Type Brand / NameWR Type A Water Reducer
4x8 CYLINDERSTotal:
04/28/11 2217UW w/o Air: Aggregate Moistures
Coarse Aggregate 4:
Water Strength Test Results
Coarse Aggregate 2: Coarse Aggregate 3:
Sand 1: FA-1Coarse Aggregate 1: CA-1
Fly Ash:GGBFS:
Cement 1: CS-E-1Cement 2:
Dry Specific Gravity
Agg. absorption
Agg. FMMaterial
MIX DESIGN INFODry mix 1 cu. yd. Wt. (lbs.)
Dry mix lab batch Wt. (lbs.)
Adjusted lab batch Wt. (lbs.)
Actual lab batch Wt.
(lbs.)Material Code
MIX NUMBER Mix 73 Gravel E1 100Date: Mix Code: Size(c.f.):
State Study No. 239 - Influences on Strength Variability of Gravel Aggregate Concrete Comments / Notes / ObservationsCustomer: MDOT

201
Project: Lab #: BCDName: Set #: 1
4/27/2011 74 f'c: 4,000 psi 1.25 Factor: 0.05
Vol. (c.f.)
2.04 394.80 18.28 18.28 18.28 3.100.00 0.00 0.00 0.00 1.000.81 131.60 6.09 6.09 6.09 2.600.00 0.00 0.00 0.00 1.007.56 1236.57 57.25 57.25 57.25 2.621 0.34% 2.2112.39 1790.00 82.87 82.87 82.87 2.316 4.67% 6.510.00 0.00 0.00 0.000.00 0.00 0.00 0.000.00 0.00 0.00 0.00
Air: 1.50% 0.41 0.00 0.00 0.00Water: 3.80 236.88 10.97 15.03 15.03 1.00
"+-Air: 1.00% AGE psi Avg. psiDate
27.00 3789.85 175.46 179.52 1 day 1320142.50 142.50 145.80 1 day 1340
1 day 13907 day 3330
oz /cwt oz /cy ml /cy batch ml actual ml Sand: -0.34% -0.19 7 day 35703.05 16.1 474.8 22.0 22.0 CA 1 -4.67% -3.87 7 day 3490
CA 2 0.00% 0.00 14 day 4150CA 3 0.00% 0.00 14 day 3930CA 4 0.00% 0.00 14 day 4400
28 day 4020+/- h2o Added W/held 28 day 3890
28 day 391010:28 AM 2.50 56 day 522010:35 AM 143.60 7.82 56 day 5050
5.25 1.25 0.25 56 day 489070.2 NA 43.7273.3 1.000
Air Temp. Relative Yield Bag Factor 5.60 Mix Temp. Initial set, min. Fine/Coarse by Vol 0.610 Bucket Full Technician who
conducted tests:
5053Sample Time Unit Weight (pcf) Act. w/c 0.450 Bucket Weight
Slump, in. Yield Des.Un.Wt. 140.36
Batch Time % Air Des. w/c 0.450 Unit Weight6/22/2011
Bucket Volume
Water Added/Withheld5/25/2011 3940
PLASTIC TEST RESULTS OTHER INFO
05/11/11 4160
Free H2O Content
Batch free H2O (lbs.)ADMIX INFORMATION
05/04/11 3463Type Brand / NameWR Type A Water Reducer
4x8 CYLINDERSTotal:
04/28/11 1350UW w/o Air: Aggregate Moistures
Coarse Aggregate 4:
Water Strength Test Results
Coarse Aggregate 2: Coarse Aggregate 3:
Sand 1: FA-1Coarse Aggregate 1: CA-1
Fly Ash: SCM-1 (Class C Fly Ash)GGBFS:
Cement 1: CS-E-1Cement 2:
Dry Specific Gravity
Agg. absorption
Agg. FMMaterial
MIX DESIGN INFODry mix 1 cu. yd. Wt. (lbs.)
Dry mix lab batch Wt. (lbs.)
Adjusted lab batch Wt. (lbs.)
Actual lab batch Wt.
(lbs.)Material Code
MIX NUMBER Mix 74 Gravel E1 75/25CDate: Mix Code: Size(c.f.):
State Study No. 239 - Influences on Strength Variability of Gravel Aggregate Concrete Comments / Notes / ObservationsCustomer: MDOT

202
Project: Lab #: BCDName: Set #: 1
4/27/2011 75 f'c: 4,000 psi 1.25 Factor: 0.05
Vol. (c.f.)
2.04 394.80 18.28 18.28 18.28 3.100.00 0.00 0.00 0.00 1.000.96 131.60 6.09 6.09 6.09 2.200.00 0.00 0.00 0.00 1.007.41 1212.45 56.13 56.13 56.13 2.621 0.34% 2.2112.39 1790.00 82.87 82.87 82.87 2.316 4.67% 6.510.00 0.00 0.00 0.000.00 0.00 0.00 0.000.00 0.00 0.00 0.00
Air: 1.50% 0.41 0.00 0.00 0.00Water: 3.80 236.88 10.97 15.03 15.03 1.00
"+-Air: 1.00% AGE psi Avg. psiDate
27.00 3765.73 174.34 178.40 1 day 1350141.60 141.60 144.89 1 day 1390
1 day 13307 day 2800
oz /cwt oz /cy ml /cy batch ml actual ml Sand: -0.34% -0.19 7 day 28003.05 16.1 474.8 22.0 22.0 CA 1 -4.67% -3.87 7 day 3050
CA 2 0.00% 0.00 14 day 3220CA 3 0.00% 0.00 14 day 3360CA 4 0.00% 0.00 14 day 3520
28 day 3810+/- h2o Added W/held 28 day "4250"
28 day 389011:01 AM 2.00 56 day 475011:10 AM 142.04 7.82 56 day "4280"
4.75 1.26 0.25 56 day 478073.2 NA 43.3374.2 1.010
Air Temp. Relative Yield Bag Factor 5.60 Mix Temp. Initial set, min. Fine/Coarse by Vol 0.599 Bucket Full Technician who
conducted tests:
4765Sample Time Unit Weight (pcf) Act. w/c 0.450 Bucket Weight
Slump, in. Yield Des.Un.Wt. 139.47
Batch Time % Air Des. w/c 0.450 Unit Weight6/22/2011
Bucket Volume
Water Added/Withheld5/25/2011 3850
PLASTIC TEST RESULTS OTHER INFO
05/11/11 3367
Free H2O Content
Batch free H2O (lbs.)ADMIX INFORMATION
05/04/11 2883Type Brand / NameWR Type A Water Reducer
4x8 CYLINDERSTotal:
04/28/11 1357UW w/o Air: Aggregate Moistures
Coarse Aggregate 4:
Water Strength Test Results
Coarse Aggregate 2: Coarse Aggregate 3:
Sand 1: FA-1Coarse Aggregate 1: CA-1
Fly Ash: SCM-2 (Class F Fly Ash)GGBFS:
Cement 1: CS-E-1Cement 2:
Dry Specific Gravity
Agg. absorption
Agg. FMMaterial
MIX DESIGN INFODry mix 1 cu. yd. Wt. (lbs.)
Dry mix lab batch Wt. (lbs.)
Adjusted lab batch Wt. (lbs.)
Actual lab batch Wt.
(lbs.)Material Code
MIX NUMBER Mix 75 Gravel E1 75/25FDate: Mix Code: Size(c.f.):
State Study No. 239 - Influences on Strength Variability of Gravel Aggregate Concrete Comments / Notes / ObservationsCustomer: MDOT

203
Project: Lab #: BCDName: Set #: 1
6/7/2011 76 f'c: 4,000 psi 1.25 Factor: 0.05
Vol. (c.f.)
2.72 526.40 24.37 24.37 24.37 3.100.00 0.00 0.00 0.00 1.000.00 0.00 0.00 0.00 1.000.00 0.00 0.00 0.00 1.007.69 1257.97 58.24 58.24 58.24 2.621 0.34% 2.2112.39 1790.00 82.87 82.87 82.87 2.316 4.67% 6.510.00 0.00 0.00 0.000.00 0.00 0.00 0.000.00 0.00 0.00 0.00
Air: 1.50% 0.41 0.00 0.00 0.00Water: 3.80 236.88 10.97 15.03 15.03 1.00
"+-Air: 1.00% AGE psi Avg. psiDate
27.00 3811.25 176.45 180.51 1 day 2290143.31 143.31 146.61 1 day 2380
1 day 21707 day 4530
oz /cwt oz /cy ml /cy batch ml actual ml Sand: -0.34% -0.20 7 day 42203.05 16.1 474.8 22.0 22.0 CA 1 -4.67% -3.87 7 day 4280
CA 2 0.00% 0.00 14 day 4160CA 3 0.00% 0.00 14 day 4250CA 4 0.00% 0.00 14 day 4400
28 day 4910+/- h2o Added W/held 28 day 5200
28 day 47407:54 AM 3.00 56 day 55208:03 AM 142.28 7.83 56 day 5500
3.00 1.27 0.25 56 day 579069.3 NA 43.4073.1 1.020
MIX NUMBER Mix 76 Gravel E2 100Date: Mix Code: Size(c.f.):
State Study No. 239 - Influences on Strength Variability of Gravel Aggregate Concrete Comments / Notes / ObservationsCustomer: MDOT
Cement 1: CS-E-2Cement 2:
Dry Specific Gravity
Agg. absorption
Agg. FMMaterial
MIX DESIGN INFODry mix 1 cu. yd. Wt. (lbs.)
Dry mix lab batch Wt. (lbs.)
Adjusted lab batch Wt. (lbs.)
Actual lab batch Wt.
(lbs.)Material Code
Sand 1: FA-1Coarse Aggregate 1: CA-1
Fly Ash:GGBFS:
Coarse Aggregate 4:
Water Strength Test Results
Coarse Aggregate 2: Coarse Aggregate 3:
4x8 CYLINDERSTotal:
06/08/11 2280UW w/o Air: Aggregate Moistures
06/21/11 4270
Free H2O Content
Batch free H2O (lbs.)ADMIX INFORMATION
06/14/11 4343Type Brand / NameWR Type A Water Reducer
Water Added/Withheld7/5/2011 4950
PLASTIC TEST RESULTS OTHER INFO
5603Sample Time Unit Weight (pcf) Act. w/c 0.450 Bucket Weight
Slump, in. Yield Des.Un.Wt. 141.16
Batch Time % Air Des. w/c 0.450 Unit Weight8/2/2011
Bucket Volume
Air Temp. Relative Yield Bag Factor 5.60 Mix Temp. Initial set, min. Fine/Coarse by Vol 0.621 Bucket Full Technician who
conducted tests:

204
Project: Lab #: BCDName: Set #: 1
6/7/2011 77 f'c: 4,000 psi 1.25 Factor: 0.05
Vol. (c.f.)
2.04 394.80 18.28 18.28 18.28 3.100.00 0.00 0.00 0.00 1.000.81 131.60 6.09 6.09 6.09 2.600.00 0.00 0.00 0.00 1.007.56 1236.57 57.25 57.25 57.25 2.621 0.34% 2.2112.39 1790.00 82.87 82.87 82.87 2.316 4.67% 6.510.00 0.00 0.00 0.000.00 0.00 0.00 0.000.00 0.00 0.00 0.00
Air: 1.50% 0.41 0.00 0.00 0.00Water: 3.80 236.88 10.97 15.03 15.03 1.00
"+-Air: 1.00% AGE psi Avg. psiDate
27.00 3789.85 175.46 179.52 1 day 1610142.50 142.50 145.80 1 day 1760
1 day 17507 day 3590
oz /cwt oz /cy ml /cy batch ml actual ml Sand: -0.34% -0.19 7 day 35903.05 16.1 474.8 22.0 22.0 CA 1 -4.67% -3.87 7 day 3600
CA 2 0.00% 0.00 14 day 3890CA 3 0.00% 0.00 14 day 3860CA 4 0.00% 0.00 14 day 4000
28 day 4900+/- h2o Added W/held 28 day 4790
28 day 48008:31 AM 2.00 56 day 51908:40 AM 143.00 7.83 56 day 5200
6.25 1.26 0.25 56 day 560069.0 NA 43.5873.8 1.010
MIX NUMBER Mix 77 Gravel E2 75/25CDate: Mix Code: Size(c.f.):
State Study No. 239 - Influences on Strength Variability of Gravel Aggregate Concrete Comments / Notes / ObservationsCustomer: MDOT
Cement 1: CS-E-2Cement 2:
Dry Specific Gravity
Agg. absorption
Agg. FMMaterial
MIX DESIGN INFODry mix 1 cu. yd. Wt. (lbs.)
Dry mix lab batch Wt. (lbs.)
Adjusted lab batch Wt. (lbs.)
Actual lab batch Wt.
(lbs.)Material Code
Sand 1: FA-1Coarse Aggregate 1: CA-1
Fly Ash: SCM-1 (Class C Fly Ash)GGBFS:
Coarse Aggregate 4:
Water Strength Test Results
Coarse Aggregate 2: Coarse Aggregate 3:
4x8 CYLINDERSTotal:
06/08/11 1707UW w/o Air: Aggregate Moistures
06/21/11 3917
Free H2O Content
Batch free H2O (lbs.)ADMIX INFORMATION
06/14/11 3593Type Brand / NameWR Type A Water Reducer
Water Added/Withheld7/5/2011 4830
PLASTIC TEST RESULTS OTHER INFO
5330Sample Time Unit Weight (pcf) Act. w/c 0.450 Bucket Weight
Slump, in. Yield Des.Un.Wt. 140.36
Batch Time % Air Des. w/c 0.450 Unit Weight8/2/2011
Bucket Volume
Air Temp. Relative Yield Bag Factor 5.60 Mix Temp. Initial set, min. Fine/Coarse by Vol 0.610 Bucket Full Technician who
conducted tests:

205
Project: Lab #: BCDName: Set #: 1
6/7/2011 78 f'c: 4,000 psi 1.25 Factor: 0.05
Vol. (c.f.)
2.04 394.80 18.28 18.28 18.28 3.100.00 0.00 0.00 0.00 1.000.96 131.60 6.09 6.09 6.09 2.200.00 0.00 0.00 0.00 1.007.41 1212.45 56.13 56.13 56.13 2.621 0.34% 2.2112.39 1790.00 82.87 82.87 82.87 2.316 4.67% 6.510.00 0.00 0.00 0.000.00 0.00 0.00 0.000.00 0.00 0.00 0.00
Air: 1.50% 0.41 0.00 0.00 0.00Water: 3.80 236.88 10.97 15.03 15.03 1.00
"+-Air: 1.00% AGE psi Avg. psiDate
27.00 3765.73 174.34 178.40 1 day 1500141.60 141.60 144.89 1 day 1480
1 day 15207 day 3040
oz /cwt oz /cy ml /cy batch ml actual ml Sand: -0.34% -0.19 7 day 29803.05 16.1 474.8 22.0 22.0 CA 1 -4.67% -3.87 7 day 3170
CA 2 0.00% 0.00 14 day 3190CA 3 0.00% 0.00 14 day 3540CA 4 0.00% 0.00 14 day 3460
28 day 4460+/- h2o Added W/held 28 day 4290
28 day "3920"9:05 AM 2.00 56 day 50809:20 AM 141.92 7.83 56 day 4890
4.75 1.26 0.25 56 day 472068.5 NA 43.3175.2 1.010
MIX NUMBER Mix 78 Gravel E2 75/25FDate: Mix Code: Size(c.f.):
State Study No. 239 - Influences on Strength Variability of Gravel Aggregate Concrete Comments / Notes / ObservationsCustomer: MDOT
Cement 1: CS-E-2Cement 2:
Dry Specific Gravity
Agg. absorption
Agg. FMMaterial
MIX DESIGN INFODry mix 1 cu. yd. Wt. (lbs.)
Dry mix lab batch Wt. (lbs.)
Adjusted lab batch Wt. (lbs.)
Actual lab batch Wt.
(lbs.)Material Code
Sand 1: FA-1Coarse Aggregate 1: CA-1
Fly Ash: SCM-2 (Class F Fly Ash)GGBFS:
Coarse Aggregate 4:
Water Strength Test Results
Coarse Aggregate 2: Coarse Aggregate 3:
4x8 CYLINDERSTotal:
06/08/11 1500UW w/o Air: Aggregate Moistures
06/21/11 3397
Free H2O Content
Batch free H2O (lbs.)ADMIX INFORMATION
06/14/11 3063Type Brand / NameWR Type A Water Reducer
Water Added/Withheld7/5/2011 4375
PLASTIC TEST RESULTS OTHER INFO
4897Sample Time Unit Weight (pcf) Act. w/c 0.450 Bucket Weight
Slump, in. Yield Des.Un.Wt. 139.47
Batch Time % Air Des. w/c 0.450 Unit Weight8/2/2011
Bucket Volume
Air Temp. Relative Yield Bag Factor 5.60 Mix Temp. Initial set, min. Fine/Coarse by Vol 0.599 Bucket Full Technician who
conducted tests:

206
Project: Lab #: BCDName: Set #: 1
7/11/2011 79 f'c: 4,000 psi 1.25 Factor: 0.05
Vol. (c.f.)
2.72 526.40 24.37 24.37 24.37 3.100.00 0.00 0.00 0.00 1.000.00 0.00 0.00 0.00 1.000.00 0.00 0.00 0.00 1.007.69 1257.97 58.24 58.24 58.24 2.621 0.34% 2.2112.39 1790.00 82.87 82.87 82.87 2.316 4.67% 6.510.00 0.00 0.00 0.000.00 0.00 0.00 0.000.00 0.00 0.00 0.00
Air: 1.50% 0.41 0.00 0.00 0.00Water: 3.80 236.88 10.97 15.03 15.03 1.00
"+-Air: 1.00% AGE psi Avg. psiDate
27.00 3811.25 176.45 180.51 1 day 2200143.31 143.31 146.61 1 day 2240
1 day 23207 day 3860
oz /cwt oz /cy ml /cy batch ml actual ml Sand: -0.34% -0.20 7 day "3520"3.05 16.1 474.8 22.0 22.0 CA 1 -4.67% -3.87 7 day 3990
CA 2 0.00% 0.00 14 day 4350CA 3 0.00% 0.00 14 day 4670CA 4 0.00% 0.00 14 day 4880
28 day 4680+/- h2o Added W/held 28 day 4670
28 day 456010:14 AM 2.75 56 day 570010:23 AM 143.16 7.86 56 day "4970"
2.75 1.26 0.25 56 day 577073.3 NA 43.6575.4 1.010
MIX NUMBER Mix 79 Gravel E3 100Date: Mix Code: Size(c.f.):
State Study No. 239 - Influences on Strength Variability of Gravel Aggregate Concrete Comments / Notes / ObservationsCustomer: MDOT
Cement 1: CS-E-3Cement 2:
Dry Specific Gravity
Agg. absorption
Agg. FMMaterial
MIX DESIGN INFODry mix 1 cu. yd. Wt. (lbs.)
Dry mix lab batch Wt. (lbs.)
Adjusted lab batch Wt. (lbs.)
Actual lab batch Wt.
(lbs.)Material Code
Sand 1: FA-1Coarse Aggregate 1: CA-1
Fly Ash:GGBFS:
Coarse Aggregate 4:
Water Strength Test Results
Coarse Aggregate 2: Coarse Aggregate 3:
4x8 CYLINDERSTotal:
07/12/11 2253UW w/o Air: Aggregate Moistures
07/25/11 4633
Free H2O Content
Batch free H2O (lbs.)ADMIX INFORMATION
07/18/11 3925Type Brand / NameWR Type A Water Reducer
Water Added/Withheld8/8/2011 4637
PLASTIC TEST RESULTS OTHER INFO
5735Sample Time Unit Weight (pcf) Act. w/c 0.450 Bucket Weight
Slump, in. Yield Des.Un.Wt. 141.16
Batch Time % Air Des. w/c 0.450 Unit Weight9/5/2011
Bucket Volume
Air Temp. Relative Yield Bag Factor 5.60 Mix Temp. Initial set, min. Fine/Coarse by Vol 0.621 Bucket Full Technician who
conducted tests:

207
Project: Lab #: BCDName: Set #: 1
7/11/2011 80 f'c: 4,000 psi 1.25 Factor: 0.05
Vol. (c.f.)
2.04 394.80 18.28 18.28 18.28 3.100.00 0.00 0.00 0.00 1.000.81 131.60 6.09 6.09 6.09 2.600.00 0.00 0.00 0.00 1.007.56 1236.57 57.25 57.25 53.13 2.621 0.34% 2.2112.39 1790.00 82.87 82.87 82.87 2.316 4.67% 6.510.00 0.00 0.00 0.000.00 0.00 0.00 0.000.00 0.00 0.00 0.00
Air: 1.50% 0.41 0.00 0.00 0.00Water: 3.80 236.88 10.97 15.03 15.03 1.00
"+-Air: 1.00% AGE psi Avg. psiDate
27.00 3789.85 175.46 179.52 1 day 1450142.50 142.50 145.80 1 day 1250
1 day 14207 day 2860
oz /cwt oz /cy ml /cy batch ml actual ml Sand: -0.34% -0.19 7 day 30203.05 16.1 474.8 22.0 22.0 CA 1 -4.67% -3.87 7 day 2790
CA 2 0.00% 0.00 14 day 3740CA 3 0.00% 0.00 14 day 3390CA 4 0.00% 0.00 14 day 3380
28 day 4340+/- h2o Added W/held 28 day 4730
28 day 467010:43 AM 2.50 56 day 518010:52 AM 143.40 7.86 56 day 5520
3.75 1.22 0.25 56 day 520069.2 NA 43.7176.0 0.980
MIX NUMBER Mix 80 Gravel E3 75/25CDate: Mix Code: Size(c.f.):
State Study No. 239 - Influences on Strength Variability of Gravel Aggregate Concrete Comments / Notes / ObservationsCustomer: MDOT
Cement 1: CS-E-3Cement 2:
Dry Specific Gravity
Agg. absorption
Agg. FMMaterial
MIX DESIGN INFODry mix 1 cu. yd. Wt. (lbs.)
Dry mix lab batch Wt. (lbs.)
Adjusted lab batch Wt. (lbs.)
Actual lab batch Wt.
(lbs.)Material Code
Sand 1: FA-1Coarse Aggregate 1: CA-1
Fly Ash: SCM-1 (Class C Fly Ash)GGBFS:
Coarse Aggregate 4:
Water Strength Test Results
Coarse Aggregate 2: Coarse Aggregate 3:
4x8 CYLINDERSTotal:
07/12/11 1373UW w/o Air: Aggregate Moistures
07/25/11 3503
Free H2O Content
Batch free H2O (lbs.)ADMIX INFORMATION
07/18/11 2890Type Brand / NameWR Type A Water Reducer
Water Added/Withheld8/8/2011 4580
PLASTIC TEST RESULTS OTHER INFO
5300Sample Time Unit Weight (pcf) Act. w/c 0.450 Bucket Weight
Slump, in. Yield Des.Un.Wt. 140.36
Batch Time % Air Des. w/c 0.450 Unit Weight9/5/2011
Bucket Volume
Air Temp. Relative Yield Bag Factor 5.60 Mix Temp. Initial set, min. Fine/Coarse by Vol 0.610 Bucket Full Technician who
conducted tests:

208
Project: Lab #: BCDName: Set #: 1
7/11/2011 81 f'c: 4,000 psi 1.25 Factor: 0.05
Vol. (c.f.)
2.04 394.80 18.28 18.28 18.28 3.100.00 0.00 0.00 0.00 1.000.96 131.60 6.09 6.09 6.09 2.200.00 0.00 0.00 0.00 1.007.41 1212.45 56.13 56.13 56.13 2.621 0.34% 2.2112.39 1790.00 82.87 82.87 82.87 2.316 4.67% 6.510.00 0.00 0.00 0.000.00 0.00 0.00 0.000.00 0.00 0.00 0.00
Air: 1.50% 0.41 0.00 0.00 0.00Water: 3.80 236.88 10.97 15.03 15.03 1.00
"+-Air: 1.00% AGE psi Avg. psiDate
27.00 3765.73 174.34 178.40 1 day 1600141.60 141.60 144.89 1 day 1520
1 day 15607 day 2640
oz /cwt oz /cy ml /cy batch ml actual ml Sand: -0.34% -0.19 7 day "2950"3.05 16.1 474.8 22.0 22.0 CA 1 -4.67% -3.87 7 day 2720
CA 2 0.00% 0.00 14 day 3550CA 3 0.00% 0.00 14 day "3310"CA 4 0.00% 0.00 14 day 3700
28 day 4030+/- h2o Added W/held 28 day 4010
28 day 411011:10 AM 2.00 56 day 456011:18 AM 141.92 7.86 56 day 4890
3.50 1.26 0.25 56 day 488070.8 NA 43.3476.1 1.010
MIX NUMBER Mix 81 Gravel E3 75/25FDate: Mix Code: Size(c.f.):
State Study No. 239 - Influences on Strength Variability of Gravel Aggregate Concrete Comments / Notes / ObservationsCustomer: MDOT
Cement 1: CS-E-3Cement 2:
Dry Specific Gravity
Agg. absorption
Agg. FMMaterial
MIX DESIGN INFODry mix 1 cu. yd. Wt. (lbs.)
Dry mix lab batch Wt. (lbs.)
Adjusted lab batch Wt. (lbs.)
Actual lab batch Wt.
(lbs.)Material Code
Sand 1: FA-1Coarse Aggregate 1: CA-1
Fly Ash: SCM-2 (Class F Fly Ash)GGBFS:
Coarse Aggregate 4:
Water Strength Test Results
Coarse Aggregate 2: Coarse Aggregate 3:
4x8 CYLINDERSTotal:
07/12/11 1560UW w/o Air: Aggregate Moistures
07/25/11 3625
Free H2O Content
Batch free H2O (lbs.)ADMIX INFORMATION
07/18/11 2680Type Brand / NameWR Type A Water Reducer
Water Added/Withheld8/8/2011 4050
PLASTIC TEST RESULTS OTHER INFO
4777Sample Time Unit Weight (pcf) Act. w/c 0.450 Bucket Weight
Slump, in. Yield Des.Un.Wt. 139.47
Batch Time % Air Des. w/c 0.450 Unit Weight9/5/2011
Bucket Volume
Air Temp. Relative Yield Bag Factor 5.60 Mix Temp. Initial set, min. Fine/Coarse by Vol 0.599 Bucket Full Technician who
conducted tests:
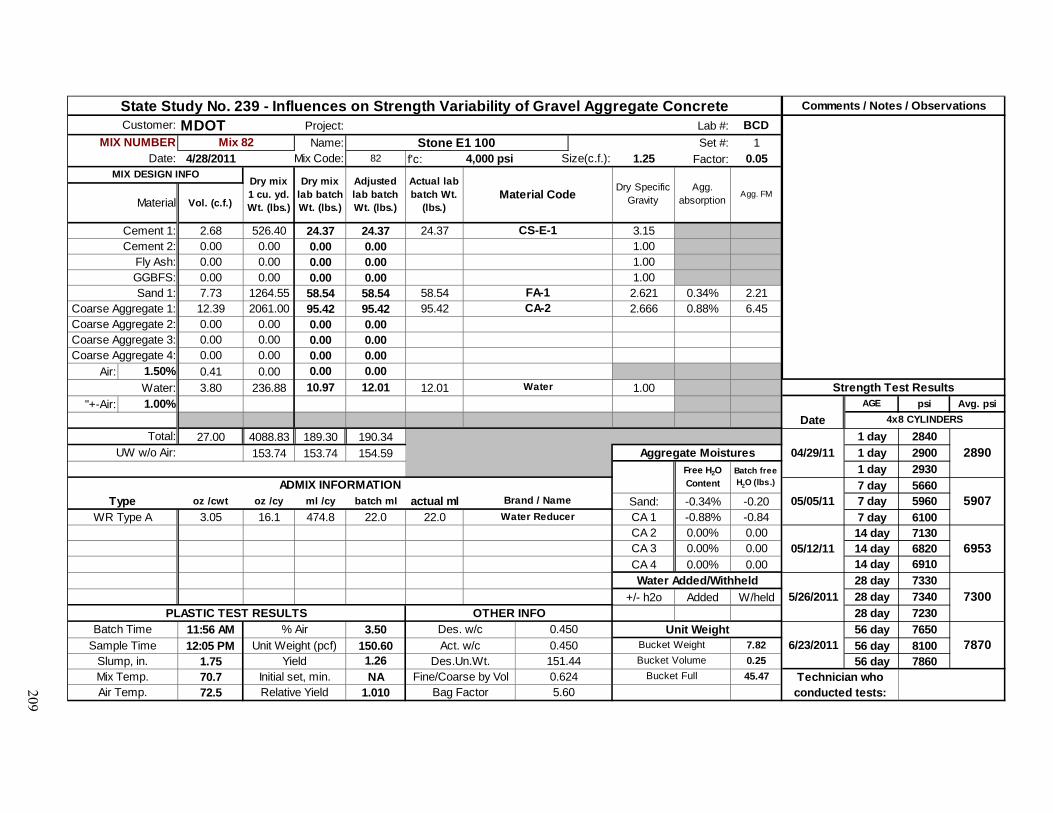
209
Project: Lab #: BCDName: Set #: 1
4/28/2011 82 f'c: 4,000 psi 1.25 Factor: 0.05
Vol. (c.f.)
2.68 526.40 24.37 24.37 24.37 3.150.00 0.00 0.00 0.00 1.000.00 0.00 0.00 0.00 1.000.00 0.00 0.00 0.00 1.007.73 1264.55 58.54 58.54 58.54 2.621 0.34% 2.2112.39 2061.00 95.42 95.42 95.42 2.666 0.88% 6.450.00 0.00 0.00 0.000.00 0.00 0.00 0.000.00 0.00 0.00 0.00
Air: 1.50% 0.41 0.00 0.00 0.00Water: 3.80 236.88 10.97 12.01 12.01 1.00
"+-Air: 1.00% AGE psi Avg. psiDate
27.00 4088.83 189.30 190.34 1 day 2840153.74 153.74 154.59 1 day 2900
1 day 29307 day 5660
oz /cwt oz /cy ml /cy batch ml actual ml Sand: -0.34% -0.20 7 day 59603.05 16.1 474.8 22.0 22.0 CA 1 -0.88% -0.84 7 day 6100
CA 2 0.00% 0.00 14 day 7130CA 3 0.00% 0.00 14 day 6820CA 4 0.00% 0.00 14 day 6910
28 day 7330+/- h2o Added W/held 28 day 7340
28 day 723011:56 AM 3.50 56 day 765012:05 PM 150.60 7.82 56 day 8100
1.75 1.26 0.25 56 day 786070.7 NA 45.4772.5 1.010
MIX NUMBER Mix 82 Stone E1 100Date: Mix Code: Size(c.f.):
State Study No. 239 - Influences on Strength Variability of Gravel Aggregate Concrete Comments / Notes / ObservationsCustomer: MDOT
Cement 1: CS-E-1Cement 2:
Dry Specific Gravity
Agg. absorption
Agg. FMMaterial
MIX DESIGN INFODry mix 1 cu. yd. Wt. (lbs.)
Dry mix lab batch Wt. (lbs.)
Adjusted lab batch Wt. (lbs.)
Actual lab batch Wt.
(lbs.)Material Code
Sand 1: FA-1Coarse Aggregate 1: CA-2
Fly Ash:GGBFS:
Coarse Aggregate 4:
Water Strength Test Results
Coarse Aggregate 2: Coarse Aggregate 3:
4x8 CYLINDERSTotal:
04/29/11 2890UW w/o Air: Aggregate Moistures
05/12/11 6953
Free H2O Content
Batch free H2O (lbs.)ADMIX INFORMATION
05/05/11 5907Type Brand / NameWR Type A Water Reducer
Water Added/Withheld5/26/2011 7300
PLASTIC TEST RESULTS OTHER INFO
7870Sample Time Unit Weight (pcf) Act. w/c 0.450 Bucket Weight
Slump, in. Yield Des.Un.Wt. 151.44
Batch Time % Air Des. w/c 0.450 Unit Weight6/23/2011
Bucket Volume
Air Temp. Relative Yield Bag Factor 5.60 Mix Temp. Initial set, min. Fine/Coarse by Vol 0.624 Bucket Full Technician who
conducted tests:

210
Project: Lab #: BCDName: Set #: 1
4/28/2011 83 f'c: 4,000 psi 1.25 Factor: 0.05
Vol. (c.f.)
2.01 394.80 18.28 18.28 18.28 3.150.00 0.00 0.00 0.00 1.000.81 131.60 6.09 6.09 6.09 2.600.00 0.00 0.00 0.00 1.007.59 1241.39 57.47 57.47 57.47 2.621 0.34% 2.2112.39 2061.00 95.42 95.42 95.42 2.666 0.88% 6.450.00 0.00 0.00 0.000.00 0.00 0.00 0.000.00 0.00 0.00 0.00
Air: 1.50% 0.41 0.00 0.00 0.00Water: 3.80 236.88 10.97 12.00 12.00 1.00
"+-Air: 1.00% AGE psi Avg. psiDate
27.00 4065.67 188.23 189.26 1 day 1890152.87 152.87 153.71 1 day 1990
1 day 19507 day 5550
oz /cwt oz /cy ml /cy batch ml actual ml Sand: -0.34% -0.20 7 day 57503.05 16.1 474.8 22.0 22.0 CA 1 -0.88% -0.84 7 day 5420
CA 2 0.00% 0.00 14 day 6510CA 3 0.00% 0.00 14 day 6750CA 4 0.00% 0.00 14 day 6930
28 day 7550+/- h2o Added W/held 28 day 7390
28 day 747012:41 PM 2.25 56 day 770012:50 PM 151.20 7.82 56 day 7720
3.50 1.25 0.25 56 day 841069.8 NA 45.6272.5 1.000
MIX NUMBER Mix 83 Stone E1 75/25CDate: Mix Code: Size(c.f.):
State Study No. 239 - Influences on Strength Variability of Gravel Aggregate Concrete Comments / Notes / ObservationsCustomer: MDOT
Cement 1: CS-E-1Cement 2:
Dry Specific Gravity
Agg. absorption
Agg. FMMaterial
MIX DESIGN INFODry mix 1 cu. yd. Wt. (lbs.)
Dry mix lab batch Wt. (lbs.)
Adjusted lab batch Wt. (lbs.)
Actual lab batch Wt.
(lbs.)Material Code
Sand 1: FA-1Coarse Aggregate 1: CA-2
Fly Ash: SCM-1 (Class C Fly Ash)GGBFS:
Coarse Aggregate 4:
Water Strength Test Results
Coarse Aggregate 2: Coarse Aggregate 3:
4x8 CYLINDERSTotal:
04/29/11 1943UW w/o Air: Aggregate Moistures
05/12/11 6730
Free H2O Content
Batch free H2O (lbs.)ADMIX INFORMATION
05/05/11 5573Type Brand / NameWR Type A Water Reducer
Water Added/Withheld5/26/2011 7470
PLASTIC TEST RESULTS OTHER INFO
7943Sample Time Unit Weight (pcf) Act. w/c 0.450 Bucket Weight
Slump, in. Yield Des.Un.Wt. 150.58
Batch Time % Air Des. w/c 0.450 Unit Weight6/23/2011
Bucket Volume
Air Temp. Relative Yield Bag Factor 5.60 Mix Temp. Initial set, min. Fine/Coarse by Vol 0.613 Bucket Full Technician who
conducted tests:

211
Project: Lab #: BCDName: Set #: 1
4/28/2011 84 f'c: 4,000 psi 1.25 Factor: 0.05
Vol. (c.f.)
2.01 394.80 18.28 18.28 18.28 3.150.00 0.00 0.00 0.00 1.000.96 131.60 6.09 6.09 6.09 2.200.00 0.00 0.00 0.00 1.007.44 1217.27 56.35 56.35 56.35 2.621 0.34% 2.2112.39 2061.00 95.42 95.42 95.42 2.666 0.88% 6.450.00 0.00 0.00 0.000.00 0.00 0.00 0.000.00 0.00 0.00 0.00
Air: 1.50% 0.41 0.00 0.00 0.00Water: 3.80 236.88 10.97 12.00 12.00 1.00
"+-Air: 1.00% AGE psi Avg. psiDate
27.00 4041.55 187.11 188.14 1 day 1890151.97 151.97 152.80 1 day 1880
1 day 18607 day 4610
oz /cwt oz /cy ml /cy batch ml actual ml Sand: -0.34% -0.19 7 day 44503.05 16.1 474.8 22.0 22.0 CA 1 -0.88% -0.84 7 day 4610
CA 2 0.00% 0.00 14 day 5380CA 3 0.00% 0.00 14 day 5360CA 4 0.00% 0.00 14 day 5520
28 day 6020+/- h2o Added W/held 28 day 5980
28 day 63101:37 PM 1.75 56 day 70301:46 PM 150.76 7.82 56 day 7330
2.50 1.25 0.25 56 day 709069.7 NA 45.5173.1 1.000
MIX NUMBER Mix 84 Stone E1 75/25FDate: Mix Code: Size(c.f.):
State Study No. 239 - Influences on Strength Variability of Gravel Aggregate Concrete Comments / Notes / ObservationsCustomer: MDOT
Cement 1: CS-E-1Cement 2:
Dry Specific Gravity
Agg. absorption
Agg. FMMaterial
MIX DESIGN INFODry mix 1 cu. yd. Wt. (lbs.)
Dry mix lab batch Wt. (lbs.)
Adjusted lab batch Wt. (lbs.)
Actual lab batch Wt.
(lbs.)Material Code
Sand 1: FA-1Coarse Aggregate 1: CA-2
Fly Ash: SCM-2 (Class F Fly Ash)GGBFS:
Coarse Aggregate 4:
Water Strength Test Results
Coarse Aggregate 2: Coarse Aggregate 3:
4x8 CYLINDERSTotal:
04/29/11 1877UW w/o Air: Aggregate Moistures
05/12/11 5420
Free H2O Content
Batch free H2O (lbs.)ADMIX INFORMATION
05/05/11 4557Type Brand / NameWR Type A Water Reducer
Water Added/Withheld5/26/2011 6103
PLASTIC TEST RESULTS OTHER INFO
7150Sample Time Unit Weight (pcf) Act. w/c 0.450 Bucket Weight
Slump, in. Yield Des.Un.Wt. 149.69
Batch Time % Air Des. w/c 0.450 Unit Weight6/23/2011
Bucket Volume
Air Temp. Relative Yield Bag Factor 5.60 Mix Temp. Initial set, min. Fine/Coarse by Vol 0.601 Bucket Full Technician who
conducted tests:
Related Documents