1 Banke-Thomas A, et al. BMJ Global Health 2021;6:e007052. doi:10.1136/bmjgh-2021-007052 Influence of travel time and distance to the hospital of care on stillbirths: a retrospective facility-based cross- sectional study in Lagos, Nigeria Aduragbemi Banke-Thomas , 1 Cephas Ke-on Avoka , 2 Uchenna Gwacham-Anisiobi, 3 Lenka Benova 4 Original research To cite: Banke-Thomas A, Avoka CK, Gwacham-Anisiobi U, et al. Influence of travel time and distance to the hospital of care on stillbirths: a retrospective facility-based cross-sectional study in Lagos, Nigeria. BMJ Global Health 2021;6:e007052. doi:10.1136/ bmjgh-2021-007052 Handling editor Seye Abimbola ► Additional supplemental material is published online only. To view, please visit the journal online (http://dx.doi.org/10. 1136/bmjgh-2021-007052). Received 31 July 2021 Accepted 17 September 2021 1 LSE Health, London School of Economics and Political Science, London, UK 2 Faculty of Public Health, Ghana College of Physicians and Surgeons, Accra, Ghana 3 Nuffield Department of Population Health, University of Oxford, Oxford, UK 4 Department of Public Health, Institute of Tropical Medicine, Antwerpen, Belgium Correspondence to Dr Aduragbemi Banke-Thomas; [email protected] © Author(s) (or their employer(s)) 2021. Re-use permitted under CC BY-NC. No commercial re-use. See rights and permissions. Published by BMJ. ABSTRACT Introduction Access to emergency obstetric care can lead to a 45%–75% reduction in stillbirths. However, before a pregnant woman can access this care, she needs to travel to a health facility. Our objective in this study was to assess the influence of distance and travel time to the actual hospital of care on stillbirth. Methods We conducted a retrospective cross- sectional study of pregnant women who presented with obstetric emergencies over a year across all 24 public hospitals in Lagos, Nigeria. Reviewing clinical records, we extracted sociodemographic, travel and obstetric data. Extracted travel data were exported to Google Maps, where typical distance and travel time for period-of-day they travelled were extracted. Multivariable logistic regression was conducted to determine the relative influence of distance and travel time on stillbirth. Results Of 3278 births, there were 408 stillbirths (12.5%). Women with livebirths travelled a median distance of 7.3 km (IQR 3.3–18.0) and over a median time of 24 min (IQR 12–51). Those with stillbirths travelled a median distance of 8.5 km (IQR 4.4–19.7) and over a median time of 30 min (IQR 16–60). Following adjustments, though no significant association with distance was found, odds of stillbirth were significantly higher for travel of 10–29 min (OR 2.25, 95% CI 1.40 to 3.63), 30–59 min (OR 2.30, 95% CI 1.22 to 4.34) and 60–119 min (OR 2.35, 95% CI 1.05 to 5.25). The adjusted OR of stillbirth was significantly lower following booking (OR 0.37, 95% CI 0.28 to 0.49), obstetric complications with mother (obstructed labour (OR 0.11, 95% CI 0.07 to 0.17) and haemorrhage (OR 0.30, 95%CI 0.20 to 0.46)). Odds were significantly higher with multiple gestations (OR 2.40, 95% CI 1.57 to 3.69) and referral (OR 1.55, 95% CI 1.13 to 2.12). Conclusion Travel time to a hospital was strongly associated with stillbirth. In addition to birth preparedness, efforts to get quality care quicker to women or women quicker to quality care will be critical for efforts to reduce stillbirths in a principally urban low-income and middle- income setting. INTRODUCTION A United Nations Inter-Agency Group report on Child Mortality Estimation estimated that almost two million babies died in the third trimester of pregnancy across the globe in 2019. Almost all these deaths, otherwise Key questions What is already known? ► Nigeria has a stillbirth rate of 22.2 per 1000 total births and contributes the third highest number of stillbirths globally, with over 50% happening just around the time of birth. ► Delays in reaching an appropriately equipped health facility which can render critical maternal and new- born health services contribute to poor maternal and perinatal outcomes. ► No singular study has specifically assessed the influ- ence of travel time and distance to actual facility of care on stillbirths. What are the new findings? ► Almost half of stillbirths occurred among women who had to travel less than 10 km and less than 30 min to the hospital of care. ► Though total distance was a significant factor, it was not significant after adjusting for confounders. ► After adjustments, travel time remained statistically significant for 10–29 min, 30–59 min and 60–119 min to a hospital of care. What do the new findings imply? ► As our findings show, survival of a newborn is time- sensitive and as such any actions aimed at address- ing stillbirths need to focus on time of travel. ► There is also a case for strengthening referral sys- tems to ensure that there are no unnecessary de- lays at first line facilities and that such facilities are equipped to be able to get pregnant women to higher level facilities in quicker time. ► Before the emergency, skilled health personnel need to use antenatal care visits to discuss travel plans with couples as part of birth preparedness. on January 7, 2022 by guest. Protected by copyright. http://gh.bmj.com/ BMJ Glob Health: first published as 10.1136/bmjgh-2021-007052 on 6 October 2021. Downloaded from on January 7, 2022 by guest. Protected by copyright. http://gh.bmj.com/ BMJ Glob Health: first published as 10.1136/bmjgh-2021-007052 on 6 October 2021. Downloaded from on January 7, 2022 by guest. Protected by copyright. http://gh.bmj.com/ BMJ Glob Health: first published as 10.1136/bmjgh-2021-007052 on 6 October 2021. Downloaded from on January 7, 2022 by guest. Protected by copyright. http://gh.bmj.com/ BMJ Glob Health: first published as 10.1136/bmjgh-2021-007052 on 6 October 2021. Downloaded from on January 7, 2022 by guest. Protected by copyright. http://gh.bmj.com/ BMJ Glob Health: first published as 10.1136/bmjgh-2021-007052 on 6 October 2021. Downloaded from on January 7, 2022 by guest. Protected by copyright. http://gh.bmj.com/ BMJ Glob Health: first published as 10.1136/bmjgh-2021-007052 on 6 October 2021. Downloaded from on January 7, 2022 by guest. Protected by copyright. http://gh.bmj.com/ BMJ Glob Health: first published as 10.1136/bmjgh-2021-007052 on 6 October 2021. Downloaded from

Welcome message from author
This document is posted to help you gain knowledge. Please leave a comment to let me know what you think about it! Share it to your friends and learn new things together.
Transcript
1Banke- Thomas A, et al. BMJ Global Health 2021;6:e007052. doi:10.1136/bmjgh-2021-007052
Influence of travel time and distance to the hospital of care on stillbirths: a retrospective facility- based cross- sectional study in Lagos, Nigeria
Aduragbemi Banke- Thomas ,1 Cephas Ke- on Avoka ,2 Uchenna Gwacham- Anisiobi,3 Lenka Benova4
Original research
To cite: Banke- Thomas A, Avoka CK, Gwacham- Anisiobi U, et al. Influence of travel time and distance to the hospital of care on stillbirths: a retrospective facility- based cross- sectional study in Lagos, Nigeria. BMJ Global Health 2021;6:e007052. doi:10.1136/bmjgh-2021-007052
Handling editor Seye Abimbola
► Additional supplemental material is published online only. To view, please visit the journal online (http:// dx. doi. org/ 10. 1136/ bmjgh- 2021- 007052).
Received 31 July 2021Accepted 17 September 2021
1LSE Health, London School of Economics and Political Science, London, UK2Faculty of Public Health, Ghana College of Physicians and Surgeons, Accra, Ghana3Nuffield Department of Population Health, University of Oxford, Oxford, UK4Department of Public Health, Institute of Tropical Medicine, Antwerpen, Belgium
Correspondence toDr Aduragbemi Banke- Thomas; a. banke- thomas@ lse. ac. uk
© Author(s) (or their employer(s)) 2021. Re- use permitted under CC BY- NC. No commercial re- use. See rights and permissions. Published by BMJ.
ABSTRACTIntroduction Access to emergency obstetric care can lead to a 45%–75% reduction in stillbirths. However, before a pregnant woman can access this care, she needs to travel to a health facility. Our objective in this study was to assess the influence of distance and travel time to the actual hospital of care on stillbirth.Methods We conducted a retrospective cross- sectional study of pregnant women who presented with obstetric emergencies over a year across all 24 public hospitals in Lagos, Nigeria. Reviewing clinical records, we extracted sociodemographic, travel and obstetric data. Extracted travel data were exported to Google Maps, where typical distance and travel time for period- of- day they travelled were extracted. Multivariable logistic regression was conducted to determine the relative influence of distance and travel time on stillbirth.Results Of 3278 births, there were 408 stillbirths (12.5%). Women with livebirths travelled a median distance of 7.3 km (IQR 3.3–18.0) and over a median time of 24 min (IQR 12–51). Those with stillbirths travelled a median distance of 8.5 km (IQR 4.4–19.7) and over a median time of 30 min (IQR 16–60). Following adjustments, though no significant association with distance was found, odds of stillbirth were significantly higher for travel of 10–29 min (OR 2.25, 95% CI 1.40 to 3.63), 30–59 min (OR 2.30, 95% CI 1.22 to 4.34) and 60–119 min (OR 2.35, 95% CI 1.05 to 5.25). The adjusted OR of stillbirth was significantly lower following booking (OR 0.37, 95% CI 0.28 to 0.49), obstetric complications with mother (obstructed labour (OR 0.11, 95% CI 0.07 to 0.17) and haemorrhage (OR 0.30, 95%CI 0.20 to 0.46)). Odds were significantly higher with multiple gestations (OR 2.40, 95% CI 1.57 to 3.69) and referral (OR 1.55, 95% CI 1.13 to 2.12).Conclusion Travel time to a hospital was strongly associated with stillbirth. In addition to birth preparedness, efforts to get quality care quicker to women or women quicker to quality care will be critical for efforts to reduce stillbirths in a principally urban low- income and middle- income setting.
INTRODUCTIONA United Nations Inter- Agency Group report on Child Mortality Estimation estimated that almost two million babies died in the third trimester of pregnancy across the globe in 2019. Almost all these deaths, otherwise
Key questions
What is already known? ► Nigeria has a stillbirth rate of 22.2 per 1000 total births and contributes the third highest number of stillbirths globally, with over 50% happening just around the time of birth.
► Delays in reaching an appropriately equipped health facility which can render critical maternal and new-born health services contribute to poor maternal and perinatal outcomes.
► No singular study has specifically assessed the influ-ence of travel time and distance to actual facility of care on stillbirths.
What are the new findings? ► Almost half of stillbirths occurred among women who had to travel less than 10 km and less than 30 min to the hospital of care.
► Though total distance was a significant factor, it was not significant after adjusting for confounders.
► After adjustments, travel time remained statistically significant for 10–29 min, 30–59 min and 60–119 min to a hospital of care.
What do the new findings imply? ► As our findings show, survival of a newborn is time- sensitive and as such any actions aimed at address-ing stillbirths need to focus on time of travel.
► There is also a case for strengthening referral sys-tems to ensure that there are no unnecessary de-lays at first line facilities and that such facilities are equipped to be able to get pregnant women to higher level facilities in quicker time.
► Before the emergency, skilled health personnel need to use antenatal care visits to discuss travel plans with couples as part of birth preparedness.
on January 7, 2022 by guest. Protected by copyright.
http://gh.bmj.com
/B
MJ G
lob Health: first published as 10.1136/bm
jgh-2021-007052 on 6 October 2021. D
ownloaded from
on January 7, 2022 by guest. P
rotected by copyright.http://gh.bm
j.com/
BM
J Glob H
ealth: first published as 10.1136/bmjgh-2021-007052 on 6 O
ctober 2021. Dow
nloaded from
on January 7, 2022 by guest. Protected by copyright.
http://gh.bmj.com
/B
MJ G
lob Health: first published as 10.1136/bm
jgh-2021-007052 on 6 October 2021. D
ownloaded from
2 Banke- Thomas A, et al. BMJ Global Health 2021;6:e007052. doi:10.1136/bmjgh-2021-007052
BMJ Global Health
known as stillbirths, occurred in low- income and middle- income countries (LMICs) (98%) including three- quarters in sub- Saharan Africa and south Asia. Though it is recognised as a ‘neglected tragedy’, Nigeria, third to only India and Pakistan contributes 9% (171 428) of stillbirths annually.1 When the Sustainable Development Goals (SDGs) were declared, though there was a target set for global neonatal mortality, there was none set for stillbirth specifically.2 This necessitated the Lancet Every Newborn Study Group to recommend that national targets for stillbirth rates (SBR) be set at ≤10 per 1000 total births, which should be achieved by year 2035—a target adopted by the 67th World Health Assembly.3 Nigeria currently has an SBR of 22.2 stillbirths per 1000 total births.1
Stillbirths may occur antepartum (on or after 28 weeks’ gestation but before labour) or intrapartum (after the onset of labour but before birth).4 Around half of all still-births in sub- Saharan Africa are intrapartum, compared with about 6% in many high- income countries.1 The distinction between an antepartum and intrapartum stillbirth is based on confirmation of the presence of a fetal heart sound at the onset of labour. Where this is not available, an assessment of the skin for signs of macera-tion, which begins 2–12 hours after death is used to make the distinction, with death occurring in the intrapartum period also referred to as fresh stillbirth and antepartum referred to as a macerated stillbirth.4 While many ante-partum stillbirths are preventable, intrapartum still-births, which are typically deemed to reflect quality of care during labour, are entirely preventable.4 5 Estimates of between 35% and 60% have been reported as propor-tion of intrapartum stillbirths in Nigeria.4
At a global level, the strategy to prevent adverse preg-nancy outcomes, reemphasised with the SDGs, has predominantly focused on increasing access to prompt emergency obstetric care (EmOC) provided by a skilled health personnel.2 6 Evidence suggests that when EmOC, which is a set of nine clinical and surgical interventions including parenteral antibiotics, anticonvulsants and uterotonics, manual removal of placenta, removal of retained products, neonatal resuscitation, assisted vaginal delivery, caesarean section and blood transfusion, can lead to 45%–75% reduction in intrapartum stillbirths.6 7 However, before an expectant mother can access EmOC, she needs to travel to the health facility. Any delay in travel to reach appropriately equipped health facilities can contribute to poor pregnancy outcomes for her and her baby.8 To better understand the association between travel to health facilities and pregnancy outcomes, there is a need to accurately capture the journey including any delays experienced to reach health facilities. However, for many women, their real travel experience to care remains unknown in many LMIC health systems.9 10
Until, only a few studies have looked at influence of travel including distance and travel time on perinatal outcomes in LMICs including one that focused specifi-cally on stillbirths.11–14 The one study that specifically
assessed stillbirth was conducted in a hospital located in a north- eastern city of Nigeria and focused on travel time, not distance.14 However, distance and travel time are both important considerations, especially in urban and peri-urban LMIC settings, where some pregnant women could travel for a long time despite living only a short distance from the health facility, due to traffic and vice versa, due to access to motorised transport.9 The objective of our study was to assess the effect of distance and travel time from home to facility of care on stillbirth that occurred in public hospitals of Nigeria’s most urbanised state, Lagos. This study was part of a larger mixed- methods study that explored the geographical accessibility of pregnant women to public hospitals in Lagos State, Nigeria.
METHODSStudy design, setting and populationLagos State in the southwestern part of Nigeria has diverse geographical terrains (including land and water) and settlement types (including its central megacity, suburbs, slums and towns). While principally urban, Lagos state has some rural parts in its extreme east and west. The state has 20 local government areas and a popu-lation of approximately 26 million (estimated in 2019).15 The most common means of travel in Lagos is by road. However, in many parts of the state, the road infrastruc-ture is poor, evidenced by presence of multiple potholes that sometimes make roads impassable for commuters. Severe traffic congestions are a common feature, with flooding during the rainy season making road conditions even worse. Road renovations are at best a stopgap and sometimes cause even more travel disruptions.16–18
Our study was a statewide multifacility retrospective cross‐sectional study that identified pregnant women who presented with obstetric emergencies at one of the 24 public hospitals with capacity for 24/7 all provision of EmOC services in the state. These 24 public hospitals include 20 general hospitals which are secondary health facilities with either a general obstetric unit or a dedicated Maternal Childcare Centres and four teaching hospitals which are tertiary health facilities (Details of the hospi-tals are in online supplemental table 1). According to the Health Facility Monitoring and Accreditation Agency, there are 1329 accredited private hospitals in Lagos. However, government health facilities manage 42% of deliveries in the state, while private health facilities take up about 28%.19 Two studies that estimated institutional SBR in Nigerian public hospitals reported 39.6 and 61.8 per 1000 births, respectively.20 21
Data collectionWe collected data from all 24 public hospitals over a 6- month period. The data collection team comprised consultant obstetricians, resident doctors and medical officers who had clinical experience working in the obstetric units of the hospitals and were familiar with the patient records system in Lagos public health facilities.
on January 7, 2022 by guest. Protected by copyright.
http://gh.bmj.com
/B
MJ G
lob Health: first published as 10.1136/bm
jgh-2021-007052 on 6 October 2021. D
ownloaded from

Banke- Thomas A, et al. BMJ Global Health 2021;6:e007052. doi:10.1136/bmjgh-2021-007052 3
BMJ Global Health
The data collection team members were all trained on the standard operations protocol to guide data collection and ensure consistency across the different hospitals, use of the pretested online data collection tool in Google Forms and the ethical procedures guiding the research.
From clinical records of all pregnant women with gestational age of 28 weeks or more who presented with an obstetric emergency between 1 November 2018 and 30 October 2019, we obtained data on sociodemographic characteristics, obstetric history, travel to reach the health facility (including day of travel and period- of- day when journey to the facility commenced, street name of women’s self- reported place of residence, referral facili-ties if any, the destination facility (one of the 24 public hospitals)), obstetric complication managed, mode of delivery and pregnancy outcomes. All pregnant women who presented at the obstetric emergency room and had a live or stillbirth at or after gestational age of 28 weeks were included. For the outcome, stillbirth, we aligned with WHO’s definition applicable in many LMIC settings defining a stillbirth as a baby born with no signs of life at 28 weeks of pregnancy or more.4 We excluded 51 cases with perinatal deaths that occurred after the baby was born alive (early neonatal deaths), because these deaths may have more to do with quality of care, as opposed to travel to the health facility. We excluded a further 22 cases which had missing data regarding the outcome of the pregnancy or gestational age could not be estab-lished. All recorded data captured in Google Forms was subsequently exported as a Microsoft Excel file.
Additional data gathering on distance and travel time were required to fully characterise the travel to reach the hospital. Studies that estimated distance and travel time of pregnant women to reach EmOC facilities in LMIC settings have mostly been based on women’s self- reports or spatial models,10 with the accuracy of both approaches questioned by several authors.22–25 Compared with spatial model estimates, distance and travel time estimates using global positioning satellite navigation software like Google Maps (Alphabet, Mountain View, California, USA) have been shown to be closer to reality in an LMIC urban setting.26 Building on this evidence, we georefer-enced the place of residence, referral points and desti-nation facility for each woman in Google Maps, based on the data extracted from their clinical records. For addresses that were not discoverable on Google Maps, we contacted local persons who were well acquainted with the neighbourhoods to check for any spelling errors and reattempted to locate the street. For pregnant women with traceable journeys (meaning location of the home address and all referral points were known), we extracted distance (in kilometres (km) and travel time (in minute (min) for their journeys from Google Maps using the ‘typical time of travel’ tool for the time and day that the woman commenced her journey to the hospital, as per data extracted from the clinical records. To collect travel time estimates for the period- of- day of travel, we used specific time slots (9:00, 15:00, 18:00 and 21:00 hours for
morning, afternoon, evening or night journeys, respec-tively). In cases in which this data was not available (27% of the sample), we assumed the woman travelled in the afternoon (15:00 hours), as it was a midpoint estimate between the two known travel peak periods in Lagos (6:30 and 11:30 hours (morning peak period) and 15:00 and 19.30 hours (evening peak period)).27 For means of transport, we assumed that all pregnant women used motor vehicle, since private cars (25%) and taxis (21%) are the most popular means of transport to health facil-ities, emergency or otherwise, and is almost always the transport means used by pregnant women in emergency situations in Lagos, especially as motorcycles have been banned.9 28 In cases in which it was not possible to find specific points of travel of the women, we labelled the case as untraceable (4% of the sample).
Data analysisFollowing data cleaning in Microsoft Excel (Microsoft Corporation, Redmond, USA), we used the extracted geocoordinates to map and visually inspect places of origin of all women with stillbirths relative to the location of public hospitals and produced maps in ArcGIS 10.6 (Esri, Redlands, California, USA). We then conducted descriptive analysis for all theoretically relevant sociode-mographic and obstetric characteristics, travel path to facility and mode of delivery, indicating frequencies and percentages for categorical variables. The mean and SD as well as median and IQR for distance and travel time were computed. For interpretation, priority was given to the median values as these are known to be robust to the outliers.29 All continuous variables were subsequently converted into categorical variables.
We conducted bivariate logistic regression to test the null hypothesis that there is no statistically significant association between each of the independent variables and stillbirth. The stillbirths were subsequently catego-rised into fresh and macerated stillbirths as extracted from patient records, as we theorised that the fresh type was more likely related to travel, since these occurred after the onset of labour but before birth, when the woman would have been en route to a health facility.4 Where there were discrepancies in stillbirth classifica-tions for multiple gestations (eg, one fresh and one macerated), the stillbirth status of the first baby was used in the classification. Finally, we conducted multivariate logistic regression to determine the relative influence of the independent variable categories on stillbirths while controlling for other variables. The logistic regres-sion models were built stepwise incorporating variables that showed a statistically significant association with stillbirths as an outcome in the bivariate analysis. Four models were fitted. Model I incorporated only signifi-cant sociodemographic and obstetric variables, model II added travel distance to significant sociodemographic and obstetric variables, model III added travel time to significant socio- demographic and obstetric variables and model IV included both travel time and distance to
on January 7, 2022 by guest. Protected by copyright.
http://gh.bmj.com
/B
MJ G
lob Health: first published as 10.1136/bm
jgh-2021-007052 on 6 October 2021. D
ownloaded from

4 Banke- Thomas A, et al. BMJ Global Health 2021;6:e007052. doi:10.1136/bmjgh-2021-007052
BMJ Global Health
significant sociodemographic and obstetric variables. We reported both p values and 95% CIs of ORs derived from regression coefficients to show strength of evidence and considered differences between observations as statis-tically significant when the p value was <0.05. We also conducted a subgroup analysis by referral status and by stillbirth category (fresh and macerated). Missing data were excluded from the analysis.
We conducted all statistical analysis in STATA SE V.15.0 (StataCorp).
Patient and public involvementPatients and/or the public were not involved in the design, conduct, reporting or dissemination of this research.
RESULTSA total of 3459 births with gestational age >28 weeks were born to 3278 pregnant women with obstetric emergen-cies arriving at one of the 24 public hospitals in Lagos state. The first babies of the 3278 women were included for analysis, of which 408 were stillbirths (12.5% of all births). Of the stillbirths, 264 were described as fresh in the notes (64.7% of stillbirths and 8.1% of all births), while 144 were described as macerated (35.3% of still-births and 4.4% of all births). Women who experienced stillbirths were more likely to be in age group 20–34 years old (67%), married (96%), petty traders (43%), multipa-rous (73%), with singleton pregnancies (91%), not regis-tered for antenatal care (ANC) at the hospital in which the birth took place (unbooked) (80%) and presented with bleeding as a complication (35%). Stillbirths were also the most common among women who travelled directly from home to the hospital where they received care (59%), during the week (77%) and in the morning (34%) as well as among women who were referred from primary healthcare centres (38%) and had spontaneous vaginal birth (56%) (table 1). Women who had stillbirths travelled from inside and outside the state. For those within the state, most stillbirths originated from the city and suburb areas. A few stillbirths occurred among women who bypassed other public hospitals before reaching the facility of care with some needing to travel long distances to teaching hospitals in the central part of the state (figure 1).
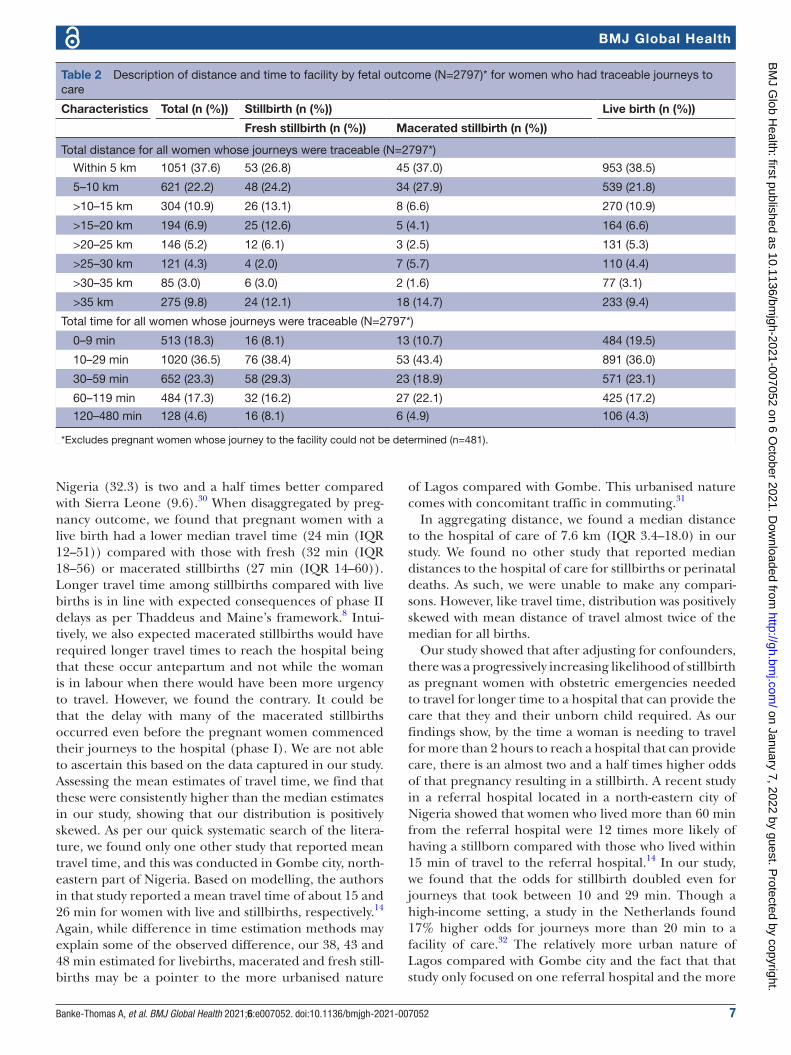
A larger proportion of women who had fresh stillbirths travelled less than 10 km for delivery (51%) with 47% of them getting to the facility of birth in less than 30 min. For women who had a macerated stillbirth, 65% of them travelled less than 10 km for delivery with 54% of them getting there in less than 30 min (table 2). Preg-nant women travelled a median distance of 7.6 km (IQR 3.4–18.0) with a median time of 26 min (IQR 12–52). Women whose pregnancy resulted in a live birth travelled a median distance of 7.3 km (IQR 3.3–18.0) and a median time of 24 min (IQR 12–51). Those with stillbirths trav-elled a median distance of 8.5 km (IQR 4.4–19.7) and a
median time of 30 min (IQR 16–60). Those whose preg-nancy resulted in a fresh stillbirth travelled a median distance of 9.5 km (IQR 4.7–19.8) and used a median time of 32 min (IQR 18–56) to get to the facility of care. Women whose pregnancy resulted in a macerated still-birth on the other hand travelled a median distance of 7.3 km (IQR 3.9–19.4) and got to the hospital in a median time of 27 min (IQR 14–60) (figure 2).
Age, employment status, parity, gestation, booking status, referral, type of referral facility, total distance and total time of travel were found to be significant factors from the bivariate analysis (table 3). When adjusted for sociodemographic, obstetric and pregnancy related factors (model I), the odds of pregnancy resulting in a stillbirth was significantly lower among women who were booked for ANC (OR 0.30, 95% CI 0.23 to 0.39) and all women who presented with obstetric complications compared with women who presented with fetal compli-cations (ranging from OR 0.09 (95% CI 0.06 to 0.14) for obstructed labour to OR 0.31 (95% CI 0.21 to 0.47) for haemorrhage and OR 0.32 (95% CI 0.18 to 0.55) for sepsis). In addition, there was significantly lower odds of stillbirth for self- employed petty traders (OR 0.69, 95% CI 0.52 to 0.93) and those who were employed (OR 0.66, 95% CI 0.46 to 0.95). However, the odds of stillbirth were higher among women aged 35–50 years (OR 1.42, 95% CI 1.10 to 1.84), with multiple gestation (OR 2.16, 95% CI 1.41 to 3.29) and those who were referred (OR 1.42, 95% CI 1.12 to 1.81). When further adjusted for distance, all significant distance categories from the unadjusted model are lost (model II). When time of travel to facility was added (model III), the odds of stillbirth were seen to be significantly higher among women who got to a health facility for care between 10 and 29 min (OR 2.02, 95% CI 1.30 to 3.13) and 30–59 min (OR 1.65, 95% CI 1.03 to 2.63). The odds increased when distance and travel time were included in model IV, with significance evident for 10–29 min (OR 2.25, 95% CI 1.40 to 3.63), 30–59 min (OR=2.30, 95% CI 1.22 to 4.34) and 60–119 min (OR=2.35, 95% CI 1.05 to 5.25) (table 4).
In the subgroup analysis, the odds remained statistically significant for the 10–29 min in the non- referred group, but no significant association for total travel time in the referred group. For fresh stillbirths, statistical signifi-cance remained for 10–29 min (OR 2.19, 95% CI 1.24 to 3.87) and 30–59 min (OR 2.13, 95% CI 1.18 to 3.86). There was also statistical significance for 120–480 min (OR 2.41, 95% CI 1.10 to 5.27). No statistical significance was found in any travel time category for macerated still-births (subgroup analyses in online supplemental tables 2–5).
DISCUSSIONIn our study, we found that about two- thirds of women with macerated stillbirths travelled less than 10 km to the hospital with more than half requiring less than 30 min to travel. For women with fresh stillbirths, half of them
on January 7, 2022 by guest. Protected by copyright.
http://gh.bmj.com
/B
MJ G
lob Health: first published as 10.1136/bm
jgh-2021-007052 on 6 October 2021. D
ownloaded from

Banke- Thomas A, et al. BMJ Global Health 2021;6:e007052. doi:10.1136/bmjgh-2021-007052 5
BMJ Global Health
Table 1 Sociodemographic, obstetric and travel- related characteristics of women with gestational age >28 weeks who gave birth in 1 of the 24 public hospitals in Lagos state (N=3278)
CharacteristicsNo of pregnant women ((%) N=3278)
No of stillbirths ((%) n=408)
No of live births ((%) n=2870)
Age
12–19 81 (2.5) 9 (2.2) 72 (2.5)
20–34 2430 (74.1) 275 (67.4) 2155 (75.1)
35–50 767 (23.4) 124 (30.4) 643 (22.4)
Marital status
Single 139 (4.2) 17 (4.2) 122 (4.3)
Married 3139 (95.8) 391 (95.8) 2748 (95.7)
Employment status
Unemployed/housewife 563 (17.2) 86 (21.1) 477 (16.6)
Student 166 (5.1) 17 (4.2) 149 (5.2)
Self- employed (petty- trader) 1493 (45.6) 174 (42.7) 1319 (46.0)
Self- employed (mid- high business) 357 (10.9) 63 (15.4) 294 (10.2)
Employed 699 (21.3) 68 (16.7) 631 (22.0)
Parity
Nulliparous (0) 1127 (34.4) 109 (26.7) 1018 (35.5)
Multiparous (1–4) 2071 (63.2) 284 (69.6) 1787 (62.3)
Grand- multiparous (5 or more) 80 (2.4) 15 (3.7) 65 (2.3)
No of gestations
Singleton 3112 (94.9) 373 (91.4) 2739 (95.4)
Multiple 166 (5.1) 35 (8.6) 131 (4.6)
Booking status
Booked 1380 (42.1) 81 (19.9) 1299 (45.3)
Unbooked 1898 (57.9) 327 (80.1) 1571 (54.7)
Fetal complications
No fetal complication 2748 (83.8) 13 (3.2) 2735 (95.3)
Reduced/absent fetal movement 371 (11.3) 236 (57.8) 135 (4.7)
Intrauterine fetal death 159 (4.8) 159 (39.0) 0 (0.0)
Obstetric complications
No maternal complication 139 (4.2) 53 (13.0) 86 (3.0)
Obstructed labour 990 (30.2) 51 (12.5) 939 (32.7)
Haemorrhage 727 (22.2) 144 (35.3) 583 (20.3)
Pre- eclampsia/eclampsia 923 (28.2) 96 (23.5) 827 (28.8)
Sepsis 169 (5.2) 29 (7.1) 140 (4.9)
Others 330 (10.1) 35 (8.6) 295 (10.3)
Weekend travel to facility
Yes 751 (22.9) 92 (22.6) 659 (23.0)
No 2527 (77.1) 316 (77.4) 2211 (77.0)
Period of day of travel to the facility (n=2187)
Morning 801 (36.6) 90 (34.4) 711 (36.9)
Afternoon 582 (26.6) 67 (25.6) 515 (26.8)
Evening 501 (22.9) 56 (21.4) 445 (23.1)
Night 303 (13.9) 49 (18.7) 254 (13.2)
Referral
Continued
on January 7, 2022 by guest. Protected by copyright.
http://gh.bmj.com
/B
MJ G
lob Health: first published as 10.1136/bm
jgh-2021-007052 on 6 October 2021. D
ownloaded from

6 Banke- Thomas A, et al. BMJ Global Health 2021;6:e007052. doi:10.1136/bmjgh-2021-007052
BMJ Global Health
travelled less than 10 km to the hospital and more than half required less than 30 min to reach the hospital of care. This finding of high proportions of poor outcomes for babies born to women travelling within 10 km and under half an hour to a hospital has been reported in other studies that explored association between neonatal outcomes and travel time or distance. In Nigeria, more than 75% of mothers with stillbirths travelled within 30 min to the hospital of care,14 and in Malawi and Zambia, 84% and 67% of mothers, respectively, travelled within 10 km.12 In Rwanda, of women who reached a health centre, almost 45% of them still travelled an additional 30–60 min to the hospital requiring caesarean section.13
Aggregating travel time, we estimated a median travel time of 26 min (IQR 12–52) for all women with traceable journeys. This was significantly lower than the 60 min median travel time self- reported by over 1000 women who had an emergency caesarean birth in nine hospitals in Sierra Leone.11 Evidence shows that estimates using Google Maps, like we have done in our study, are more reflective of reality compared with models.26 On the other hand, self- reported travel time are usually higher than modelled estimates.11 While, methodological differ-ences may explain the difference, it might also relate with road transport quality. Benchmarking with South Africa as highest quality (100), road transport quality index in
CharacteristicsNo of pregnant women ((%) N=3278)
No of stillbirths ((%) n=408)
No of live births ((%) n=2870)
Not referred 2384 (72.7) 242 (59.3) 2142 (74.6)
Referred 894 (27.3) 166 (40.7) 728 (25.4)
Referral facility (n=894)
Another hospital (public) 141 (15.8) 24 (14.4) 117 (16.1)
Another hospital (private 179 (20.0) 42 (25.2) 137 (18.8)
Clinic (public or private) 66 (7.4) 3 (1.8) 63 (8.7)
Primary health centre 390 (43.6) 64 (38.3) 326 (44.8)
Traditional birth attendant 92 (10.3) 27 (16.2) 65 (8.9)
Nursing/maternity home 6 (0.7) 2 (1.2) 4 (0.6)
Non- formal referral (Church or Mosque) 20 (2.2) 5 (3.0) 15 (2.1)
Mode of birth
Spontaneous vaginal birth 1211 (36.9) 230 (56.4) 981 (34.2)
Assisted vaginal birth 144 (4.4) 23 (5.6) 121 (4.2)
Caesarean birth 1923 (58.7) 155 (38.0) 1768 (61.6)
Table 1 Continued
Figure 1 Map of Lagos showing points of origin of women with stillbirths in relation to Lagos public hospitals. Black lines link point of origin of women who had stillbirths in Lagos during to study period to the general hospital where they received care. Red lines link point of origin of women who had stillbirths in Lagos during to study period to the teaching hospital where they received care.
on January 7, 2022 by guest. Protected by copyright.
http://gh.bmj.com
/B
MJ G
lob Health: first published as 10.1136/bm
jgh-2021-007052 on 6 October 2021. D
ownloaded from
Banke- Thomas A, et al. BMJ Global Health 2021;6:e007052. doi:10.1136/bmjgh-2021-007052 7
BMJ Global Health
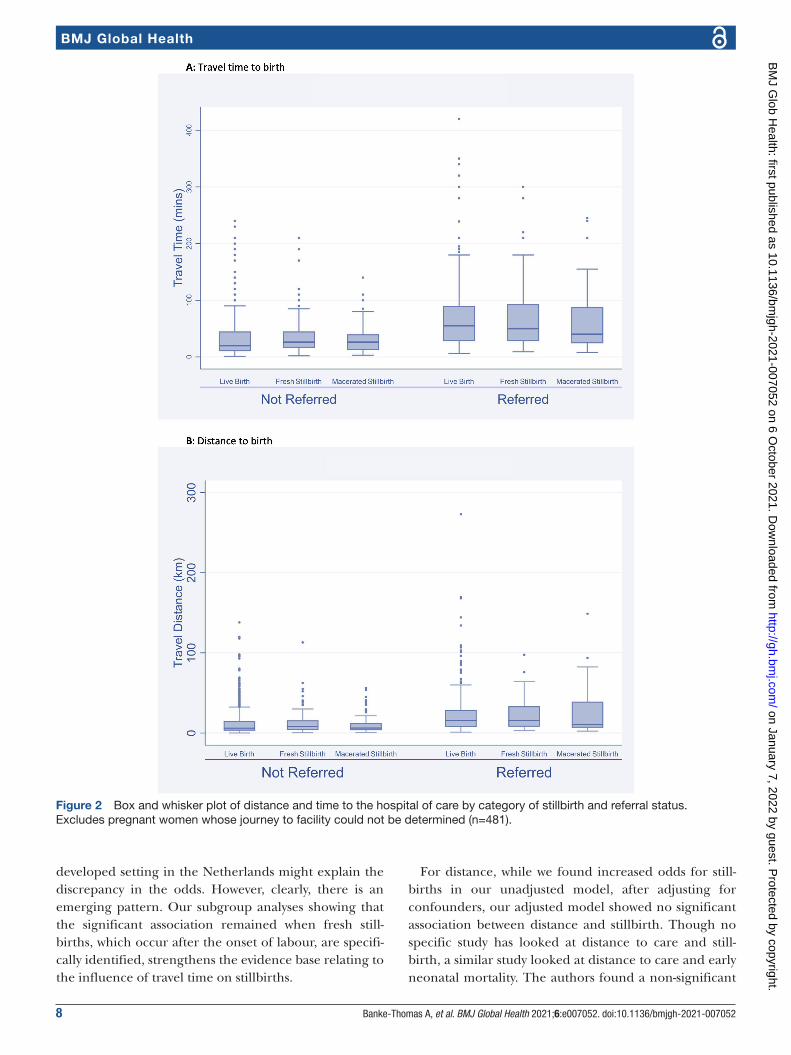
Nigeria (32.3) is two and a half times better compared with Sierra Leone (9.6).30 When disaggregated by preg-nancy outcome, we found that pregnant women with a live birth had a lower median travel time (24 min (IQR 12–51)) compared with those with fresh (32 min (IQR 18–56) or macerated stillbirths (27 min (IQR 14–60)). Longer travel time among stillbirths compared with live births is in line with expected consequences of phase II delays as per Thaddeus and Maine’s framework.8 Intui-tively, we also expected macerated stillbirths would have required longer travel times to reach the hospital being that these occur antepartum and not while the woman is in labour when there would have been more urgency to travel. However, we found the contrary. It could be that the delay with many of the macerated stillbirths occurred even before the pregnant women commenced their journeys to the hospital (phase I). We are not able to ascertain this based on the data captured in our study. Assessing the mean estimates of travel time, we find that these were consistently higher than the median estimates in our study, showing that our distribution is positively skewed. As per our quick systematic search of the litera-ture, we found only one other study that reported mean travel time, and this was conducted in Gombe city, north- eastern part of Nigeria. Based on modelling, the authors in that study reported a mean travel time of about 15 and 26 min for women with live and stillbirths, respectively.14 Again, while difference in time estimation methods may explain some of the observed difference, our 38, 43 and 48 min estimated for livebirths, macerated and fresh still-births may be a pointer to the more urbanised nature
of Lagos compared with Gombe. This urbanised nature comes with concomitant traffic in commuting.31
In aggregating distance, we found a median distance to the hospital of care of 7.6 km (IQR 3.4–18.0) in our study. We found no other study that reported median distances to the hospital of care for stillbirths or perinatal deaths. As such, we were unable to make any compari-sons. However, like travel time, distribution was positively skewed with mean distance of travel almost twice of the median for all births.
Our study showed that after adjusting for confounders, there was a progressively increasing likelihood of stillbirth as pregnant women with obstetric emergencies needed to travel for longer time to a hospital that can provide the care that they and their unborn child required. As our findings show, by the time a woman is needing to travel for more than 2 hours to reach a hospital that can provide care, there is an almost two and a half times higher odds of that pregnancy resulting in a stillbirth. A recent study in a referral hospital located in a north- eastern city of Nigeria showed that women who lived more than 60 min from the referral hospital were 12 times more likely of having a stillborn compared with those who lived within 15 min of travel to the referral hospital.14 In our study, we found that the odds for stillbirth doubled even for journeys that took between 10 and 29 min. Though a high- income setting, a study in the Netherlands found 17% higher odds for journeys more than 20 min to a facility of care.32 The relatively more urban nature of Lagos compared with Gombe city and the fact that that study only focused on one referral hospital and the more
Table 2 Description of distance and time to facility by fetal outcome (N=2797)* for women who had traceable journeys to care
Characteristics Total (n (%)) Stillbirth (n (%)) Live birth (n (%))
Fresh stillbirth (n (%)) Macerated stillbirth (n (%))
Total distance for all women whose journeys were traceable (N=2797*)
Within 5 km 1051 (37.6) 53 (26.8) 45 (37.0) 953 (38.5)
5–10 km 621 (22.2) 48 (24.2) 34 (27.9) 539 (21.8)
>10–15 km 304 (10.9) 26 (13.1) 8 (6.6) 270 (10.9)
>15–20 km 194 (6.9) 25 (12.6) 5 (4.1) 164 (6.6)
>20–25 km 146 (5.2) 12 (6.1) 3 (2.5) 131 (5.3)
>25–30 km 121 (4.3) 4 (2.0) 7 (5.7) 110 (4.4)
>30–35 km 85 (3.0) 6 (3.0) 2 (1.6) 77 (3.1)
>35 km 275 (9.8) 24 (12.1) 18 (14.7) 233 (9.4)
Total time for all women whose journeys were traceable (N=2797*)
0–9 min 513 (18.3) 16 (8.1) 13 (10.7) 484 (19.5)
10–29 min 1020 (36.5) 76 (38.4) 53 (43.4) 891 (36.0)
30–59 min 652 (23.3) 58 (29.3) 23 (18.9) 571 (23.1)
60–119 min 484 (17.3) 32 (16.2) 27 (22.1) 425 (17.2)
120–480 min 128 (4.6) 16 (8.1) 6 (4.9) 106 (4.3)
*Excludes pregnant women whose journey to the facility could not be determined (n=481).
on January 7, 2022 by guest. Protected by copyright.
http://gh.bmj.com
/B
MJ G
lob Health: first published as 10.1136/bm
jgh-2021-007052 on 6 October 2021. D
ownloaded from
8 Banke- Thomas A, et al. BMJ Global Health 2021;6:e007052. doi:10.1136/bmjgh-2021-007052
BMJ Global Health
developed setting in the Netherlands might explain the discrepancy in the odds. However, clearly, there is an emerging pattern. Our subgroup analyses showing that the significant association remained when fresh still-births, which occur after the onset of labour, are specifi-cally identified, strengthens the evidence base relating to the influence of travel time on stillbirths.
For distance, while we found increased odds for still-births in our unadjusted model, after adjusting for confounders, our adjusted model showed no significant association between distance and stillbirth. Though no specific study has looked at distance to care and still-birth, a similar study looked at distance to care and early neonatal mortality. The authors found a non- significant
Figure 2 Box and whisker plot of distance and time to the hospital of care by category of stillbirth and referral status. Excludes pregnant women whose journey to facility could not be determined (n=481).
on January 7, 2022 by guest. Protected by copyright.
http://gh.bmj.com
/B
MJ G
lob Health: first published as 10.1136/bm
jgh-2021-007052 on 6 October 2021. D
ownloaded from

Banke- Thomas A, et al. BMJ Global Health 2021;6:e007052. doi:10.1136/bmjgh-2021-007052 9
BMJ Global Health
Table 3 Bivariate analysis for fetal outcomes (N=3278)
Characteristics No of stillbirths ((%) n=408) No of live births ((%) n=2870) P value
Age
12–19 9 (11.1) 72 (88.9) 0.002
20–34 275 (11.3) 2155 (88.7)
35–50 124 (16.2) 643 (83.8)
Marital status
Single 17 (12.2) 122 (87.8) 0.937
Married 391 (12.5) 2748 (87.5)
Employment status
Unemployed/housewife 86 (15.3) 477 (84.7) 0.001
Student 17 (10.2) 149 (89.8)
Self- employed (petty- trader) 174 (11.7) 1319 (88.3)
Self- employed (mid- high business) 63 (17.7) 294 (82.3)
Employed 68 (9.7) 631 (90.3)
Parity
Nulliparous (0) 109 (9.7) 1018 (90.3) 0.001
Multiparous (1–4) 284 (13.7) 1787 (86.3)
Grand- multiparous (5 or more) 15 (18.8) 65 (81.2)
No of gestations
Singleton 373 (12.0) 2739 (88.0) 0.001
Multiple 35 (21.1) 131 (78.9)
Booking status
Booked 81 (5.9) 1299 (94.1) <0.001
Unbooked 327 (17.2) 1571 (82.8)
Maternal complications
No maternal complication 53 (38.1) 86 (61.9) <0.001
Obstructed labour 51 (5.2) 939 (94.8)
Haemorrhage 144 (19.8) 583 (80.2)
Pre- eclampsia/eclampsia 96 (10.4) 827 (89.6)
Sepsis 29 (17.2) 140 (82.8)
Others 35 (10.6) 295 (89.4)
Weekend travel to facility
Yes 93 (12.2) 669 (87.8) 0.817
No 315 (12.5) 2201 (87.5)
Period of day of travel to the facility (n=2187)
Morning 90 (11.2) 711 (88.8) 0.117
Afternoon 67 (11.5) 515 (88.5)
Evening 56 (11.2) 445 (88.8)
Night 49 (16.2) 254 (83.8)
Referral
Not referred 242 (10.2) 2142 (89.8) <0.001
Referred 166 (18.6) 728 (81.4)
Referral facility (n=894)
Another hospital (public) 24 (17.0) 117 (83.0) 0.002
Another hospital (private 42 (23.5) 137 (76.5)
Clinic (public or private) 3 (4.6) 63 (95.4)
Continued
on January 7, 2022 by guest. Protected by copyright.
http://gh.bmj.com
/B
MJ G
lob Health: first published as 10.1136/bm
jgh-2021-007052 on 6 October 2021. D
ownloaded from

10 Banke- Thomas A, et al. BMJ Global Health 2021;6:e007052. doi:10.1136/bmjgh-2021-007052
BMJ Global Health
Characteristics No of stillbirths ((%) n=408) No of live births ((%) n=2870) P value
Primary health centre 64 (16.4) 326 (83.6)
Traditional birth attendant 27 (29.4) 65 (70.6)
Nursing/maternity home 2 (33.3) 4 (66.7)
Non- formal referral 5 (25.0) 15 (75.0)
Distance of travel from home directly to a hospital (n=2259‡)
Within 5 km 83 (8.6) 885 (91.4) 0.057
5–10 km 63 (12.4) 447 (87.6)
>10–15 km 19 (8.0) 220 (92.0)
>15–20 km 21 (15.3) 116 (84.7)
>20–25 km 8 (8.9) 82 (91.1)
>25–30 km 9 (10.1) 80 (89.9)
>30–35 km 2 (3.5) 55 (96.5)
>35 km 17 (10.1) 152 (89.9)
Distance of travel from home to initial facility for referred women (n=538†)
Within 5 km 47 (18.7) 205 (81.3) 0.513
5–10 km 16 (14.9) 91 (85.1)
>10–15 km 12 (20.7) 46 (79.3)
>15–20 km 9 (21.9) 32 (78.1)
>20–25 km 3 (10.7) 25 (89.3)
>25–30 km 2 (11.1) 16 (88.9)
>30–35 km 3 (42.9) 4 (57.1)
>35 km 6 (22.2) 21 (77.8)
Distance of travel from initial facility to final facility of care for referred women (n=538†)
Within 5 km 37 (18.5) 163 (81.5) 0.408
5–10 km 18 (14.5) 106 (85.5)
>10–15 km 11 (17.2) 53 (82.8)
>15–20 km 11 (22.0) 39 (78.0)
>20–25 km 4 (12.5) 28 (87.5)
>25–30 km 3 (14.3) 18 (85.7)
>30–35 km 3 (37.5) 5 (62.5)
>35 km 11 (28.2) 28 (71.8)
Total traceable distance for all women whose journeys were traceable (n=2797*)
Within 5 km 98 (9.3) 953 (90.7) 0.038
5–10 km 82 (13.2) 539 (86.8)
>10–15 km 34 (11.2) 270 (88.8)
>15–20 km 30 (15.5) 164 (84.5)
>20–25 km 15 (10.3) 131 (89.7)
>25–30 km 11 (9.1) 110 (90.9)
>30–35 km 8 (9.4) 77 (90.6)
>35 km 42 (15.3) 233 (84.7)
Time of travel from home directly to a hospital (N=2259‡)
0–9 min 27 (5.5) 464 (94.5) 0.009
10–29 min 102 (11.4) 794 (88.6)
30–59 min 54 (10.8) 447 (89.2)
60–119 min 33 (10.4) 284 (89.6)
Table 3 Continued
Continued
on January 7, 2022 by guest. Protected by copyright.
http://gh.bmj.com
/B
MJ G
lob Health: first published as 10.1136/bm
jgh-2021-007052 on 6 October 2021. D
ownloaded from

Banke- Thomas A, et al. BMJ Global Health 2021;6:e007052. doi:10.1136/bmjgh-2021-007052 11
BMJ Global Health
relationship in Malawi but found that every additional 10 km distance was associated with lower early neonatal mortality in Zambia.12 This study only included rural births, as defined by the Demographic and Health Surveys of both countries.12 In our study, the explana-tion for the non- significance requires consideration for some of the other variables captured in our research. All evidence points to the higher risk of a stillbirth occurring compared with a maternal death when there is any form of obstetric compromise, and indeed stillbirths occur more commonly than maternal deaths.1 33 A deeper dive into our study findings shows that babies of women who had ‘perceivable’ complications like obstructed labour or haemorrhage had lower odds of dying compared with babies whose mothers had no obstetric complication of their own and only reported in the emergency because of concerns they had for their babies. We argue that the reason for non- significance for distance relates to the fact that women with ‘perceivable’ obstetric complication do not start their journeys early. As such, it really does not matter how far they need to travel (distance), by the time they set out, the risk for obstetric compromise for the newborn is established. This argument is supported by other evidence that risk perception has an influence on when and how soon pregnant women travel to reach a health facility in situations of emergency.9
Another significant factor of being booked for ANC has also been reported as being associated with reduced odds of stillbirth in hospitals in another study.21 Booking allows skilled personnel to promptly identify potential risky pregnancies. On the other hand, being referred and having multiple gestations have been associated with significantly higher odds of stillbirth in hospitals.21 The explanation for both probably relates with high- risk nature of the multiple gestations and any pregnancy that requires a referral. Our finding of significantly lower odds of stillbirths among self- employed petty traders and employed women probably relates to these women being relatively educated or having the means to live in more developed parts of the states that will have the hospitals close by. However, this needs to be further explored.
Our study has some key strengths worth highlighting. First, to the best of our knowledge, it is the first study conducted in an LMIC setting that explicitly and comprehensively explored association between travel time, distance and stillbirths. The study used estimates of distance and travel time from Google Maps, which are closer to reality.26 However, our study also has some limitations that should be considered in interpreting our findings. First, we used reported clinical data, as such, there are some data that are not routinely recorded in patient notes and others not properly recorded. Indeed,
Characteristics No of stillbirths ((%) n=408) No of live births ((%) n=2870) P value
120–480 min 6 (11.1) 48 (88.9)
Time of travel from home to initial facility for referred women (n=538†)
0–9 min 24 (20.2) 95 (79.8) 0.116
10–29 min 39 (18.8) 168 (81.2)
30–59 min 19 (14.7) 110 (85.3)
60–119 min 9 (13.8) 56 (86.2)
120–480 min 7 (38.9) 11 (61.1)
Time of travel from initial facility to final facility of care for referred women (n=538†)
0–9 min 16 (15.7) 86 (84.3) 0.275
10–29 min 39 (20.0) 156 (80.0)
30–59 min 20 (13.8) 125 (86.2)
60–119 min 19 (23.2) 63 (76.8)
120–480 min 4 (28.6) 10 (71.4)
Total travel time for all women whose journeys were traceable (n=2797†)
0–9 min 29 (5.7) 484 (94.3) <0.001
10–29 min 129 (12.7) 891 (87.3)
30–59 min 81 (12.4) 571 (87.6)
60–119 min 59 (12.2) 425 (87.8)
120–480 min 22 (17.2) 106 (82.8)
Mode of birth was excluded from the bivariate analysis, as the outcome occurred before the birth.*Excludes women whose journey from home to health facility could not be determined (n=125).†Excludes women whose referral journey could not be determined (n=356).‡Excludes women whose journey to facility could not be determined (n=134).
Table 3 Continued
on January 7, 2022 by guest. Protected by copyright.
http://gh.bmj.com
/B
MJ G
lob Health: first published as 10.1136/bm
jgh-2021-007052 on 6 October 2021. D
ownloaded from

12 Banke- Thomas A, et al. BMJ Global Health 2021;6:e007052. doi:10.1136/bmjgh-2021-007052
BMJ Global Health
Tab
le 4
Lo
gist
ic r
egre
ssio
n sh
owin
g as
soci
atio
n b
etw
een
still
birt
h an
d t
he s
elec
ted
ind
epen
den
t va
riab
les
(n=
2797
†)
Fact
or
Una
dju
sted
(95%
CI)
Mo
del
I (9
5% C
I)M
od
el II
(95%
CI)
Mo
del
III (
95%
CI)
Mo
del
IV (9
5% C
I)
Boo
king
sta
tus
at h
osp
ital o
f car
e
U
nboo
ked
1.00
1.00
1.00
1.00
1.00
B
ooke
d0.
30 (0
.23
to 0
.39)
***
0.39
(0.2
9 to
0.5
1)**
*0.
38 (0
.28
to 0
.51)
***
0.38
(0.2
8 to
0.5
2)**
*0.
44 (0
.33
to 0
.61)
***
Mat
erna
l com
plic
atio
ns
N
o m
ater
nal c
omp
licat
ion
1.00
1.00
1.00
1.00
1.00
O
bst
ruct
ed la
bou
r0.
09 (0
.06
to 0
.14)
***
0.09
(0.0
6 to
0.1
4)**
*0.
08 (0
.46
to 0
.13)
***
0.08
(0.0
5 to
0.1
3)**
*0.
09 (0
.05
to 0
.16)
***
H
aem
orrh
age
0.40
(0.2
7 to
0.5
9)**
*0.
31 (0
.21
to 0
.47)
***
0.33
(0.2
1 to
0.5
2)**
*0.
32 (0
.20
to 0
.50)
***
0.30
(0.1
9 to
0.4
9)**
*
H
yper
tens
ion
0.19
(0.1
3 to
0.2
8)**
*0.
15 (0
.10
to 0
.23)
***
0.16
(0.1
0 to
0.2
5)**
*0.
15 (0
.09
to 0
.24)
***
0.17
(0.1
0 to
0.2
8)**
*
S
epsi
s0.
34 (0
.20
to 0
.57)
***
0.32
(0.1
8 to
0.5
5)**
*0.
32 (0
.17
to 0
.60)
***
0.32
(0.1
7 to
0.6
0)**
*0.
25 (0
.13
to 0
.47)
***
O
ther
s0.
19 (0
.12
to 0
.31)
***
0.18
(0.1
1 to
0.2
9)**
*0.
14 (0
.08
to 0
.26)
***
0.14
(0.0
8 to
0.2
5)**
*0.
15 (0
.08
to 0
.27)
***
Em
plo
ymen
t st
atus
U
nem
plo
yed
/hou
sew
ife1.
001.
001.
001.
001.
00
S
tud
ent
0.63
(0.3
6 to
1.1
0)0.
87 (0
.48
to 1
.58)
0.90
(0.4
7 to
1.7
4)0.
89 (0
.46
to 1
.71)
0.79
(0.4
0 to
1.5
5)
S
elf-
emp
loye
d (p
etty
- tra
der
)0.
73 (0
.55
to 0
.97)
*0.
69 (0
.52
to 0
.93)
*0.
65 (0
.46
to 0
.92)
*0.
66 (0
.47
to 0
.93)
*0.
65 (0
.46
to 0
.92)
*
S
elf-
emp
loye
d (m
id- h
igh
bus
ines
s)1.
19 (0
.83
to 1
.70)
1.27
(0.8
7 to
1.8
5)1.
32 (0
.87
to 2
.00)
1.32
(0.8
7 to
2.0
0)1.
36 (0
.89
to 2
.09)
E
mp
loye
d0.
60 (0
.43
to 0
.84)
**0.
66 (0
.46
to 0
.95)
*0.
70 (0
.47
to 1
.05)
0.70
(0.4
7 to
1.0
5)0.
69 (0
.45
to 1
.04)
No
of g
esta
tions
S
ingl
eton
1.00
1.00
1.00
1.00
1.00
M
ultip
le1.
96 (1
.33
to 2
.89)
***
2.16
(1.4
1 to
3.2
9)**
*2.
57 (1
.60
to 4
.13)
***
2.48
(1.5
4 to
3.9
7)**
*3.
09 (1
.88
to 5
.06)
***
Par
ity
N
ullip
arou
s (0
)1.
001.
001.
001.
001.
00
M
ultip
arou
s (1
–4)
1.48
(1.1
7 to
1.8
8)**
1.08
(0.8
3 to
1.4
0)0.
96 (0
.72
to 1
.29)
0.96
(0.7
2 to
1.2
9)0.
90 (0
.67
to 1
.22)
G
rand
- mul
tipar
ous
(5 o
r m
ore)
2.16
(1.1
9 to
3.9
1)*
1.43
(0.7
6 to
2.7
2)1.
70 (0
.84
to 3
.47)
1.70
(0.8
3 to
3.4
6)1.
69 (0
.82
to 3
.48)
Age
12
–19
0.98
(0.4
8 to
1.9
8)0.
90 (0
.42
to 1
.93)
0.72
(0.2
9 to
1.8
1)0.
77 (0
.31
to 1
.93)
0.73
(0.2
9 to
1.8
4)
20
–34
1.00
1.00
1.00
1.00
1.00
35
–60
1.51
(1.2
0 to
1.9
0)**
*1.
42 (1
.10
to 1
.84)
**1.
49 (1
.12
to 1
.99)
**1.
50 (1
.13
to 2
.00)
**1.
51 (1
.13
to 2
.02)
**
Ref
erra
l
S
elf-
refe
rral
(hom
e to
ref
erra
l hos
pita
l)1.
001.
001.
001.
001.
00
In
stitu
tiona
l ref
erra
l2.
02 (1
.63
to 2
.50)
***
1.42
(1.1
2 to
1.8
1)**
1.46
(1.0
8 to
1.9
7)*
1.42
(1.0
5 to
1.9
3)*
1.55
(1.1
3 to
2.1
2)**
Tota
l dis
tanc
e to
hos
pita
l of c
are
W
ithin
5 k
m1.
001.
001.
00
Con
tinue
d
on January 7, 2022 by guest. Protected by copyright.
http://gh.bmj.com
/B
MJ G
lob Health: first published as 10.1136/bm
jgh-2021-007052 on 6 October 2021. D
ownloaded from

Banke- Thomas A, et al. BMJ Global Health 2021;6:e007052. doi:10.1136/bmjgh-2021-007052 13
BMJ Global Health
Fact
or
Una
dju
sted
(95%
CI)
Mo
del
I (9
5% C
I)M
od
el II
(95%
CI)
Mo
del
III (
95%
CI)
Mo
del
IV (9
5% C
I)
5–
10 k
m1.
48 (1
.08
to 2
.02)
*1.
21 (0
.87
to 1
.69)
0.95
(0.6
4 to
1.4
1)
>
10–1
5 km
1.22
(0.8
1 to
1.8
5)0.
98 (0
.63
to 1
.53)
0.73
(0.4
1 to
1.3
0)
>
15–2
0 km
1.78
(1.1
4 to
2.7
7)*
1.12
(0.6
9 to
1.8
2)0.
82 (0
.43
to 1
.56)
>
20–2
5 km
1.11
(0.6
3 to
1.9
8)0.
72 (0
.39
to 1
.32)
0.53
(0.2
4 to
1.1
7)
>
25–3
0 km
0.97
(0.5
1 to
1.8
7)0.
61 (0
.31
to 1
.21)
0.43
(0.1
8 to
1.0
5)
>
30–3
5 km
1.01
(0.4
7 to
2.1
5)0.
60 (0
.27
to 1
.33)
0.42
(0.1
5 to
1.1
6)
>
35 k
m1.
75 (1
.19
to 2
.59)
**1.
19 (0
.78
to 1
.83)
0.77
(0.3
4 to
1.7
3)
Tota
l tra
vel t
ime
to h
osp
ital o
f car
e
0–
9 m
in1.
001.
001.
00
10
–29
min
2.42
(1.5
9 to
3.6
7)**
*2.
02 (1
.30
to 3
.13)
**2.
25 (1
.40
to 3
.63)
***
30
–59
min
2.37
(1.5
2 to
3.6
8)**
*1.
65 (1
.03
to 2
.63)
*2.
30 (1
.22
to 4
.34)
**
60
–119
min
2.32
(1.4
6 to
3.6
8)**
*1.
35 (0
.82
to 2
.23)
2.35
(1.0
5 to
5.2
5)*
12
0–48
0 m
in3.
46 (1
.92
to 6
.27)
***
1.83
(0.9
5 to
3.5
1)2.
68 (0
.95
to 7
.55)
Foot
note
(Mod
el d
escr
iptio
n): M
odel
I: a
dju
sted
for
all v
aria
ble
s in
the
mod
el in
clud
ing
soci
odem
ogra
phi
c an
d o
bst
etric
cha
ract
eris
tics;
Mod
el II
: ad
just
ed fo
r al
l var
iab
les
in t
he m
odel
in
clud
ing
soci
odem
ogra
phi
c, o
bst
etric
and
cha
ract
eris
tics
rela
ted
to
trav
el d
ista
nce
for
all w
omen
who
se jo
urne
y fr
om h
ome
to h
osp
ital c
ould
be
trac
ed; M
odel
III:
adju
sted
for
all v
aria
ble
s in
the
mod
el in
clud
ing
soci
odem
ogra
phi
c, o
bst
etric
and
cha
ract
eris
tics
rela
ted
to
time
of t
rave
l for
all
wom
en w
hose
jour
ney
from
hom
e to
hos
pita
l cou
ld b
e tr
aced
; Mod
el IV
: ad
just
ed fo
r al
l va
riab
les
in t
he m
odel
incl
udin
g so
ciod
emog
rap
hic,
ob
stet
ric, d
ista
nce
and
tim
e of
tra
vel c
hara
cter
istic
s fo
r al
l wom
en w
hose
jour
ney
from
hom
e to
hos
pita
l cou
ld b
e tr
aced
.*P
<0.
05, *
*p<
0.01
, ***
p<
0.00
1.†E
xclu
des
wom
en w
hose
jour
ney
to h
osp
ital c
ould
not
be
det
erm
ined
(n=
415)
.
Tab
le 4
C
ontin
ued
on January 7, 2022 by guest. Protected by copyright.
http://gh.bmj.com
/B
MJ G
lob Health: first published as 10.1136/bm
jgh-2021-007052 on 6 October 2021. D
ownloaded from

14 Banke- Thomas A, et al. BMJ Global Health 2021;6:e007052. doi:10.1136/bmjgh-2021-007052
BMJ Global Health
our analysis of such secondary data is only as good as the data that was originally collected. Completeness and accu-racy of the original data could have influenced our classi-fication of stillbirths and traceability of journeys taken by the women. In addition, we have mapped journeys based on reported locations in the case notes. However, we do not know for a fact that this is truly the path that women followed. Furthermore, though we captured travel over the period of a year and accounted for diurnal variations, our estimation of travel time using Google Maps did not account for any seasonal variations in road conditions due to flooding during the wet season and other events that may lead to travel delays in certain periods of the year. This could not be done as the Google Maps typical time of travel tool does not currently have the function-ality of estimating varied travel time for different seasons. Finally, in estimating travel time, we have not included time to find a vehicle before travelling, nor have we considered time spent in deciding to seek care and in attempts made by skilled and unskilled personnel in providing care in an initial facility for those who were subsequently referred.9 Indeed, hospital records do not typically have sufficient data to comprehensively and accurately understand time spent in both phases.34 Also, for women who are referred, they are experiencing the third delay potentially more than once, not just in the final hospital but also in the intermediate facilities. This is difficult to assess unless the research is conducted is some prospective manner allowing researchers to follow each woman on her journey. Our study was retrospectively conducted. In any case, while this could have helped with better understanding of the influence of delays across the three phases, our focus was primarily on travel time. The same approach of estimating just travel time has been used in other studies.11 14
Future research should consider a prospective approach to this study, as it will address some of the limitations around accounting for seasonality and the time contri-bution of other phases to pregnancy outcomes. There is also a case for exploring the potential for minimising risk of stillbirths if women who had stillbirths had used nearer and functional hospitals. In addition, there are some implications for policy and practice emanating from our study findings. First, a high number of stillbirths still occur among women who make it to a hospital with over a third of all stillbirths being macerated. Indeed, before pregnant women need to travel, being booked for ANC remains essential for optimising pregnancy outcomes for them and their babies. Skilled health personnel should use ANC visits to discuss travel plans with couples as part of birth preparedness. It is also important to keep in mind that out of preference or not appreciating the urgency, some pregnant women might choose to bypass services.9 22–24 As our study shows that time is critical for newborn survival, ANC visits of mothers should also be used to discuss recognition of signs of potential compro-mise as well as hospitals they can if they feel there might be an issue with their babies. Schemes that support
women to arrive at facilities in quick time or can start providing the care needed before she arrives at the hospital should be considered. Both can be addressed by providing fully equipped 24/7 ambulances at no- cost to women, which led to some reduction in stillbirths in Uganda.35 However, for this to work, particularly in prin-cipally urban LMIC settings like Lagos, issues that limit effectiveness of ambulances, such as commuters’ unwill-ingness to give way to ambulances,9 need to be addressed. In addition, governments need to really ensure that hospitals with full capacity to provide EmOC are in sites where they can be easily accessed,36 37 while investing in strengthening of referral systems.
CONCLUSIONTravel time to a hospital that can provide the care needed by pregnant women or their babies with obstetric emer-gencies was strongly associated with stillbirth. While birth preparedness incorporated in routine ANC and counsel-ling to use contraception to minimise number of preg-nancies can significantly reduce odds of stillbirths, amid the crisis, efforts to get quality care in quicker time to women or women quicker to quality care will be critical for efforts to reduce stillbirths in high burden countries like Nigeria.Twitter Aduragbemi Banke- Thomas @abankethomas, Cephas Ke- on Avoka @AvokaKeon and Lenka Benova @lenkabenova
Acknowledgements We are grateful to the Lagos State Government, in particular, the Lagos State Ministry of Health and the Lagos State Health Service Commission, for their support in gaining access to all state- owned facilities. We also thank the leadership of Federal government- owned facilities (Federal Medical Centre Ebute- Metta and Lagos University Teaching Hospital) included in our study for their support. We are indebted to the medical officers and residents who helped with collating case notes of pregnant women to be included in the study. We also thank the AXA Research Fund for supporting this research.
Contributors AB- T conceived the study and wrote the protocol. AB- T, CK- oA and LB designed the study. AB- T led data collection. AB- T and CK- oA did the statistical analyses. AB- T, UG- A and CK- oA wrote the first draft of the article. All authors critically reviewed the article, contributed to the interpretation of findings, saw and approved the final version of the article.
Funding This research was funded by grant provided by AXA Research Fund.
Competing interests None declared.
Patient consent for publication Not applicable.
Ethics approval The study was approved by the Research and Ethics Committees of the Lagos State University Teaching Hospital (LREC/06/10/1226) and Lagos University Teaching Hospital (ADM/DCST/HREC/APP/2880). Social approval was obtained from the Lagos State Government (LSHSC/2222/VOLII/107).
Provenance and peer review Not commissioned; externally peer reviewed.
Data availability statement Data are available on reasonable request.
Supplemental material This content has been supplied by the author(s). It has not been vetted by BMJ Publishing Group Limited (BMJ) and may not have been peer- reviewed. Any opinions or recommendations discussed are solely those of the author(s) and are not endorsed by BMJ. BMJ disclaims all liability and responsibility arising from any reliance placed on the content. Where the content includes any translated material, BMJ does not warrant the accuracy and reliability of the translations (including but not limited to local regulations, clinical guidelines, terminology, drug names and drug dosages), and is not responsible for any error and/or omissions arising from translation and adaptation or otherwise.
Open access This is an open access article distributed in accordance with the Creative Commons Attribution Non Commercial (CC BY- NC 4.0) license, which
on January 7, 2022 by guest. Protected by copyright.
http://gh.bmj.com
/B
MJ G
lob Health: first published as 10.1136/bm
jgh-2021-007052 on 6 October 2021. D
ownloaded from

Banke- Thomas A, et al. BMJ Global Health 2021;6:e007052. doi:10.1136/bmjgh-2021-007052 15
BMJ Global Health
permits others to distribute, remix, adapt, build upon this work non- commercially, and license their derivative works on different terms, provided the original work is properly cited, appropriate credit is given, any changes made indicated, and the use is non- commercial. See: http:// creativecommons. org/ licenses/ by- nc/ 4. 0/.
ORCID iDsAduragbemi Banke- Thomas http:// orcid. org/ 0000- 0002- 4449- 0131Cephas Ke- on Avoka http:// orcid. org/ 0000- 0002- 7298- 3670
REFERENCES 1 UNICEF, WHO, World Bank, UNPD. A neglected tragedy: the global
burden of stillbirths. New York: United Nations Children’s Fund, 2020: 1–90.
2 United Nations. Sustainable development goals: 17 goals to transform our world [Internet]. Sustainable development goals, 2016. Available: http://www. un. org/ sust aina bled evel opment/ sustainable- development- goals/
3 Lawn JE, Blencowe H, Oza S, et al. Every newborn: progress, priorities, and potential beyond survival. Lancet 2014;384:189–205.
4 Lawn JE, Blencowe H, Waiswa P, et al. Stillbirths: rates, risk factors, and acceleration towards 2030. Lancet 2016;387:587–603.
5 Smith GCS. Prevention of stillbirth. Obstet Gynecol 2015;17:183–7. 6 WHO, UNFPA, UNICEF, Averting Maternal Deaths and Disabilities.
Monitoring emergency obstetric care: a handbook. Geneva, Switzerland: WHO Press, 2009.
7 Yakoob MY, Ali MA, Ali MU, et al. The effect of providing skilled birth attendance and emergency obstetric care in preventing stillbirths. BMC Public Health 2011;11 Suppl 3:S7.
8 Thaddeus S, Maine D. Too far to walk: maternal mortality in context. Soc Sci Med 1994;38:1091–110.
9 Banke- Thomas A, Balogun M, Wright O, et al. Reaching health facilities in situations of emergency: qualitative study capturing experiences of pregnant women in Africa's largest megacity. Reprod Health 2020;17:145.
10 Banke- Thomas A, Wright K, Collins L. Assessing geographical distribution and accessibility of emergency obstetric care in sub- Saharan Africa: a systematic review. J Glob Health 2019;9:010414.
11 van Duinen AJ, Adde HA, Fredin O, et al. Travel time and perinatal mortality after emergency caesarean sections: an evaluation of the 2- hour proximity indicator in Sierra Leone. BMJ Glob Health 2020;5:e003943.
12 Lohela TJ, Campbell OMR, Gabrysch S. Distance to care, facility delivery and early neonatal mortality in Malawi and Zambia. PLoS One 2012;7:e52110.
13 Niyitegeka J, Nshimirimana G, Silverstein A, et al. Longer travel time to district hospital worsens neonatal outcomes: a retrospective cross- sectional study of the effect of delays in receiving emergency cesarean section in Rwanda. BMC Pregnancy Childbirth 2017;17:242.
14 Wariri O, Onuwabuchi E, Alhassan JAK, et al. The influence of travel time to health facilities on stillbirths: a geospatial case- control analysis of facility- based data in Gombe, Nigeria. PLoS One 2021;16:e0245297.
15 LASG. Abstract of local government statistics. Ikeja: LASG, 2019. 16 Olajide OA, Agunbiade ME, Bishi HB. The realities of Lagos urban
development vision on livelihoods of the urban poor. Journal of Urban Management 2018;7:21–31.
17 Atubi AO. An evaluation of transport infrastructure in Lagos state, Nigeria. Journal of Geography and Earth Science 2013;1:9–18.
18 Aigbe G, Ogundele F, Aliu I. Road facility availability and maintenance in Lagos state, Nigeria. British Journal of Arts and Social Sciences 2012;4:135–9.
19 Kawakatsu Y, Aiga H, Ubani O, et al. Socioeconomic barriers to facility- based delivery in urban poor communities of Lagos:
wealth, linguistic capacity, and residential area. Health Policy OPEN 2020;1:100019.
20 Okunowo AA, Smith- Okonu ST. The trend and characteristics of stillbirth delivery in a university teaching hospital in Lagos, Nigeria. Ann Afr Med 2020;19:221.
21 Okonofua FE, Ntoimo LFC, Ogu R, et al. Prevalence and determinants of stillbirth in Nigerian referral hospitals: a multicentre study. BMC Pregnancy Childbirth 2019;19:533.
22 Salazar M, Vora K, Costa AD. Bypassing health facilities for childbirth: a multilevel study in three districts of Gujarat, India. Glob Health Action 2016;9:32178.
23 Stein DT, Golub G, Rothschild CW. Bypassing high- quality maternity facilities: evidence from pregnant women in peri- urban Nairobi. Health Policy and Planning 2020:czaa092.
24 Mubiri P, Kajjo D, Okuga M, et al. Bypassing or successful referral? a population- based study of reasons why women travel far for childbirth in Eastern Uganda. BMC Pregnancy Childbirth 2020;20:497.
25 Rudolfson N, Gruendl M, Nkurunziza T, et al. Validating the global surgery geographical accessibility indicator: differences in modeled versus patient- reported travel times. World J Surg 2020;44:2123–30.
26 Banke- Thomas A, Wong KLM, Ayomoh FI, et al. "In cities, it's not far, but it takes long": comparing estimated and replicated travel times to reach life- saving obstetric care in Lagos, Nigeria. BMJ Glob Health 2021;6:e004318.
27 Asiyanbola RA, Osoba SB, Adewale SS. Road traffic administration and management in the third World mega- city: Lagos, Nigeria. International Journal of Development and Sustainability 2012;1:490–509.
28 National Population Commission, ICF International. Nigeria demographic and health survey 2018. Abuja, Nigeria and Rockville, Maryland, USA: National Population Commission, ICF International, 2019. https:// dhsprogram. com/ pubs/ pdf/ FR359/ FR359. pdf
29 Leys C, Ley C, Klein O, et al. Detecting outliers: do not use standard deviation around the mean, use absolute deviation around the median. J Exp Soc Psychol 2013;49:764–6.
30 Buys P, Deichmann U, Wheeler D, Development Research Group World Bank. Road network upgrading and overland trade expansion in Sub- Saharan Africa [Internet]. Washington D.C; (World Bank Policy Research Working Paper). Report No.: WPS4097, 2006. Available: https:// documents1. worldbank. org/ curated/ en/ 441351468194327279/ pdf/ wps4097. pdf
31 Aliyu AA, Amadu L. Urbanization, cities, and health: The challenges to Nigeria - A review. Ann Afr Med 2017;16:149–58.
32 Ravelli ACJ, Jager KJ, de Groot MH, et al. Travel time from home to hospital and adverse perinatal outcomes in women at term in the Netherlands. BJOG 2011;118:457–65.
33 WHO, UNICEF, UNFPA, World Bank Group, UNDP. Trends in maternal mortality 2000 to 2017: estimates by WHO, UNICEF, UNFPA, World Bank group and the United Nations population division. Geneva: World Health Organization, 2019: 1–119. https://www. unfpa. org/ sites/ default/ files/ pub- pdf/ Maternal_ mortality_ report. pdf
34 Radovich E, Banke- Thomas A, Campbell OMR, et al. Critical comparative analysis of data sources toward understanding referral during pregnancy and childbirth: three perspectives from Nigeria. BMC Health Serv Res 2021;21:1:927.
35 Mucunguzi S, Wamani H, Lochoro P, et al. Effects of improved access to transportation on emergency obstetric care outcomes in Uganda. Afr J Reprod Health 2014;18:87–94.
36 Banke- Thomas A, Wright K, Sonoiki O, et al. Multi- stakeholder perspectives on access, availability and utilization of emergency obstetric care services in Lagos, Nigeria: a mixed- methods study. J Public Health Afr 2017;8:717.
37 Banke- Thomas A, Wong KL, Collins L, et al. An assessment of geographical access and factors influencing travel time to emergency obstetric care in the urban state of Lagos, Nigeria. Health Policy Plan 2021;00. doi:10.1093/heapol/czab099. [Epub ahead of print: 23 Aug 2021].
on January 7, 2022 by guest. Protected by copyright.
http://gh.bmj.com
/B
MJ G
lob Health: first published as 10.1136/bm
jgh-2021-007052 on 6 October 2021. D
ownloaded from

Banke-Thomas et al. 2021
Supplementary Table S1: Additional information on Lagos public hospitals
S/N Facility name Latitude (x) Longitude (y) Facility type Year of commission Births in 2018
1 Agbowa General Hospital 6.645643 3.712914 General Hospital 2003 157
2 Ajeromi Ifelodun General Hospital 6.455283 3.33362 MCC 1983 825
3 Alimosho General Hospital 6.561196 3.250662 MCC 2006 2,484
4 Amuwo-Odofin MCC 6.461779 3.301963 MCC 2014 2,484
5 Apapa General Hospital 6.441943 3.368962 General Hospital 1964 120
6 Badagry General Hospital 6.413752 2.900374 General Hospital 1957 973
7 Epe General Hospital 6.586945 3.971665 General Hospital 1954 883
8 Eti-Osa MCC* 6.465421 3.585173 MCC 2019 -
9 FMC Ebute-Metta 6.484271 3.380194 Tertiary Hospital 1964 1,820
10 Gbagada General Hospital 6.551919 3.387304 General Hospital 1983 1,729
11 Harvey Road Health Centre 6.50935 3.372629 General Hospital 1962 717
12 Ibeju-Lekki General Hospital 6.439312 3.934335 General Hospital 2006 982
13 Ifako-Ijaiye MCC 6.680364 3.291382 MCC 2006 2,916
14 Ijede Health Care Centre 6.564649 3.596596 General Hospital 1983 869
15 Ikorodu MCC 6.608265 3.499394 MCC 1983 2,820
16
Institute of Maternal and Child Health - Àyìnkę House* 6.590868 3.34092 Tertiary Hospital 1955 -
17 Isolo MCC 6.527787 3.318979 MCC 1975 2,147
18 Lagos Island Maternity Hospital 6.448543 3.397417 Tertiary Hospital 1960 3,681
19 Lagos University Teaching Hospital 6.517803 3.353786 Tertiary Hospital 1962 2,011
20 Mushin General Hospital 6.531566 3.348531 General Hospital 1954 524
21 Onikan Health Care Centre 6.444656 3.405436 General Hospital 1971 544
22 Orile Agege General Hospital 6.635353 3.303379 General Hospital 1982 1,677
23
Randle General Hospital (Gbaja-Surulere MCC) 6.50433 3.359574 MCC 1960 2,056
24 Somolu General Hospital 6.536461 3.372251 General Hospital 2006 619
MCC: Maternal and Childcare Centre
*Facilities not running in 2018. As such no details available on number of deliveries.
BMJ Publishing Group Limited (BMJ) disclaims all liability and responsibility arising from any relianceSupplemental material placed on this supplemental material which has been supplied by the author(s) BMJ Global Health
doi: 10.1136/bmjgh-2021-007052:e007052. 6 2021;BMJ Global Health, et al. Banke-Thomas A
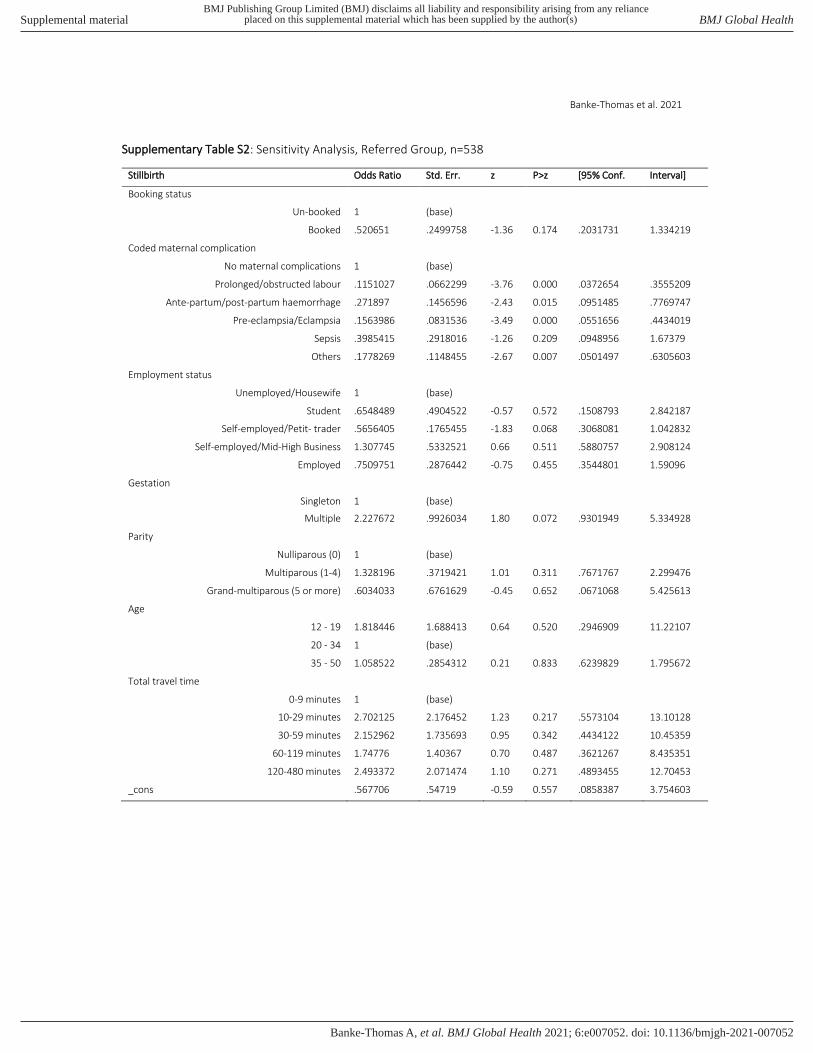
Banke-Thomas et al. 2021
Supplementary Table S2: Sensitivity Analysis, Referred Group, n=538
Stillbirth Odds Ratio Std. Err. z P>z [95% Conf. Interval]
Booking status
Un-booked 1 (base)
Booked .520651 .2499758 -1.36 0.174 .2031731 1.334219
Coded maternal complication
No maternal complications 1 (base)
Prolonged/obstructed labour .1151027 .0662299 -3.76 0.000 .0372654 .3555209
Ante-partum/post-partum haemorrhage .271897 .1456596 -2.43 0.015 .0951485 .7769747
Pre-eclampsia/Eclampsia .1563986 .0831536 -3.49 0.000 .0551656 .4434019
Sepsis .3985415 .2918016 -1.26 0.209 .0948956 1.67379
Others .1778269 .1148455 -2.67 0.007 .0501497 .6305603
Employment status
Unemployed/Housewife 1 (base)
Student .6548489 .4904522 -0.57 0.572 .1508793 2.842187
Self-employed/Petit- trader .5656405 .1765455 -1.83 0.068 .3068081 1.042832
Self-employed/Mid-High Business 1.307745 .5332521 0.66 0.511 .5880757 2.908124
Employed .7509751 .2876442 -0.75 0.455 .3544801 1.59096
Gestation
Singleton 1 (base)
Multiple 2.227672 .9926034 1.80 0.072 .9301949 5.334928
Parity
Nulliparous (0) 1 (base)
Multiparous (1-4) 1.328196 .3719421 1.01 0.311 .7671767 2.299476
Grand-multiparous (5 or more) .6034033 .6761629 -0.45 0.652 .0671068 5.425613
Age
12 - 19 1.818446 1.688413 0.64 0.520 .2946909 11.22107
20 - 34 1 (base)
35 - 50 1.058522 .2854312 0.21 0.833 .6239829 1.795672
Total travel time
0-9 minutes 1 (base)
10-29 minutes 2.702125 2.176452 1.23 0.217 .5573104 13.10128
30-59 minutes 2.152962 1.735693 0.95 0.342 .4434122 10.45359
60-119 minutes 1.74776 1.40367 0.70 0.487 .3621267 8.435351
120-480 minutes 2.493372 2.071474 1.10 0.271 .4893455 12.70453
_cons .567706 .54719 -0.59 0.557 .0858387 3.754603
BMJ Publishing Group Limited (BMJ) disclaims all liability and responsibility arising from any relianceSupplemental material placed on this supplemental material which has been supplied by the author(s) BMJ Global Health
doi: 10.1136/bmjgh-2021-007052:e007052. 6 2021;BMJ Global Health, et al. Banke-Thomas A

Banke-Thomas et al. 2021
Supplementary Table S3: Sensitivity Analysis, Non-Referred Group, n=2,259
Stillbirth Odds Ratio Std. Err. z P>z [95% Conf. Interval]
Booking status
Un-booked 1 (base)
Booked .369942 .0611896 -6.01 0.000 .2675114 .5115935
Coded maternal complication
No maternal complications 1 (base)
Prolonged/obstructed labour .0643348 .0200726 -8.79 0.000 .0349035 .1185832
Ante-partum/post-partum haemorrhage .3250163 .0864367 -4.23 0.000 .1929886 .5473668
Pre-eclampsia/Eclampsia .1468015 .0406688 -6.93 0.000 .0852944 .2526625
Sepsis .3061309 .10783 -3.36 0.001 .1534914 .6105626
Others .1279533 .0449722 -5.85 0.000 .0642505 .2548159
Employment status
Unemployed/Housewife 1 (base)
Student .9582159 .36574 -0.11 0.911 .4534919 2.024684
Self-employed/Petit- trader .7072552 .1517899 -1.61 0.107 .4644005 1.077109
Self-employed/Mid-High Business 1.323551 .3369945 1.10 0.271 .8035502 2.18006
Employed .6852588 .1708679 -1.52 0.130 .4203483 1.11712
Gestation
Singleton 1 (base)
Multiple 2.588755 .7457234 3.30 0.001 1.471946 4.552923
Parity
Nulliparous (0) 1 (base)
Multiparous (1-4) .8521085 .1504627 -0.91 0.365 .6028265 1.204474
Grand-multiparous (5 or more) 1.849566 .7289193 1.56 0.119 .8542965 4.004339
Age
12 - 19 .6083383 .3448521 -0.88 0.381 .2002718 1.847866
20 - 34 1 (base)
35 - 50 1.71517 .2997976 3.09 0.002 1.217655 2.415962
Total travel time
0-9 minutes 1 (base)
10-29 minutes 1.961082 .4631949 2.85 0.004 1.234376 3.115617
30-59 minutes 1.621841 .4203171 1.87 0.062 .9759112 2.695293
60-119 minutes 1.317994 .378855 0.96 0.337 .750304 2.315207
120-480 minutes 1.744984 .8822028 1.10 0.271 .6478188 4.700338
_cons .6185375 .2230251 -1.33 0.183 .3051052 1.253956
BMJ Publishing Group Limited (BMJ) disclaims all liability and responsibility arising from any relianceSupplemental material placed on this supplemental material which has been supplied by the author(s) BMJ Global Health
doi: 10.1136/bmjgh-2021-007052:e007052. 6 2021;BMJ Global Health, et al. Banke-Thomas A

Banke-Thomas et al. 2021
Supplementary Table S4: Sensitivity Analysis, Fresh Stillbirths, N=2,675
Stillbirth Odds Ratio Std. Err. z P>z [95% Conf. Interval]
Booking status
Un-booked 1 (base)
Booked .403047 .0773501 -4.73 0.000 .2766934 .5871008
Coded maternal complication
No maternal complications 1 (base)
Prolonged/obstructed labour .0731021 .0252129 -7.58 0.000 .0371836 .1437173
Ante-partum/post-partum haemorrhage .3681245 .1053156 -3.49 0.000 .2101247 .6449297
Pre-eclampsia/Eclampsia .1718948 .0506609 -5.97 0.000 .096471 .3062873
Sepsis .31814 .1251287 -2.91 0.004 .1471734 .6877128
Others .1976138 .0701013 -4.57 0.000 .0985968 .3960698
Employment status
Unemployed/Housewife 1 (base)
Student .7979088 .3578552 -0.50 0.615 .3312812 1.921807
Self-employed/Petit- trader .8741547 .1912821 -0.61 0.539 .5692838 1.342294
Self-employed/Mid-High Business 1.236778 .3423802 0.77 0.443 .7188723 2.127806
Employed .7421021 .1967799 -1.12 0.261 .4413207 1.24788
Gestation
Singleton 1 (base)
Multiple 2.564732 .7363595 3.28 0.001 1.461012 4.502257
Parity
Nulliparous (0) 1 (base)
Multiparous (1-4) .9306698 .171933 -0.39 0.697 .6479532 1.336742
Grand-multiparous (5 or more) 1.746394 .7401753 1.32 0.188 .7609864 4.007814
Age
12 - 19 .7133609 .4467619 -0.54 0.590 .2090359 2.434432
20 - 34 1 (base)
35 - 50 1.529114 .2671416 2.43 0.015 1.085755 2.153514
Referral
No 1 (base)
Yes 1.489106 .2764 2.15 0.032 1.034975 2.142502
Total travel time
0-9 minutes 1 (base)
10-29 minutes 2.195466 .6361816 2.71 0.007 1.244152 3.874181
30-59 minutes 2.132996 .6453007 2.50 0.012 1.178892 3.859279
60-119 minutes 1.288978 .4267022 0.77 0.443 .6736971 2.46619
120-480 minutes 2.407568 .962584 2.20 0.028 1.09965 5.271115
_cons .2478592 .1032393 -3.35 0.001 .1095618 .5607264
BMJ Publishing Group Limited (BMJ) disclaims all liability and responsibility arising from any relianceSupplemental material placed on this supplemental material which has been supplied by the author(s) BMJ Global Health
doi: 10.1136/bmjgh-2021-007052:e007052. 6 2021;BMJ Global Health, et al. Banke-Thomas A

Banke-Thomas et al. 2021
Supplementary Table S5: Sensitivity Analysis, Macerated Stillbirths, N=2,599
Stillbirth Odds Ratio Std. Err. z P>z [95% Conf. Interval]
Booking status
Un-booked 1 (base)
Booked .3357338 .0816779 -4.49 0.000 .2084075 .54085
Coded maternal complication
No maternal complications 1 (base)
Prolonged/obstructed labour .0834752 .0306951 -6.75 0.000 .0406029 .1716159
Ante-partum/post-partum haemorrhage .2667078 .087031 -4.05 0.000 .1406939 .5055874
Pre-eclampsia/Eclampsia .1287584 .0434935 -6.07 0.000 .0664121 .2496342
Sepsis .3210424 .1407909 -2.59 0.010 .135917 .7583173
Others .0695048 .037138 -4.99 0.000 .0243892 .1980759
Employment status
Unemployed/Housewife 1 (base)
Student 1.072413 .4922673 0.15 0.879 .4361512 2.63686
Self-employed/Petit- trader .386265 .1051595 -3.49 0.000 .2265418 .6586009
Self-employed/Mid-High Business 1.451442 .4285102 1.26 0.207 .8137644 2.588812
Employed .6698821 .1993272 -1.35 0.178 .3738682 1.200268
Gestation
Singleton 1 (base)
Multiple 2.63033 .9469172 2.69 0.007 1.298907 5.326504
Parity
Nulliparous (0) 1 (base)
Multiparous (1-4) .9316755 .2103572 -0.31 0.754 .598518 1.450281
Grand-multiparous (5 or more) 1.411074 .8332897 0.58 0.560 .4434913 4.489673
Age
12 - 19 .741245 .4829908 -0.46 0.646 .2066921 2.658273
20 - 34 1 (base)
35 - 50 1.484419 .3416001 1.72 0.086 .9455289 2.330442
Referral
No 1 (base)
Yes 1.293543 .3112718 1.07 0.285 .8071459 2.07305
Total travel time
0-9 minutes 1 (base)
10-29 minutes 1.76711 .5776148 1.74 0.082 .9311753 3.353479
30-59 minutes 1.029685 .3807361 0.08 0.937 .4988435 2.125419
60-119 minutes 1.428948 .5245364 0.97 0.331 .6959183 2.934096
120-480 minutes 1.192601 .6546144 0.32 0.748 .4066998 3.497169
_cons .3752418 .1741075 -2.11 0.035 .1511348 .9316613
BMJ Publishing Group Limited (BMJ) disclaims all liability and responsibility arising from any relianceSupplemental material placed on this supplemental material which has been supplied by the author(s) BMJ Global Health
doi: 10.1136/bmjgh-2021-007052:e007052. 6 2021;BMJ Global Health, et al. Banke-Thomas A
Related Documents


