Material Properties Influence of thermal treatment on the glass transition temperature of thermosetting epoxy laminate R. Polansky ´ * , V. Mentlı ´k, P. Prosr, J. Sus ˇı ´r Department of Technologies and Measurement, Faculty of Electrical Engineering, University of West Bohemia, Univerzitnı ´ 26, 306 14 Pilsen, Czech Republic article info Article history: Received 29 January 2009 Accepted 10 March 2009 Keywords: Dynamic mechanical analysis Epoxy resin Composite Printed circuit board Activation energy Arrhenius plot abstract The influence of accelerated thermal treatment of thermosetting epoxy laminate on its glass transition temperature was studied. Lamplex Ò FR-4 glass fibre-reinforced epoxy laminate (used for printed circuit board manufacturing) was used in these experiments. The composite was exposed to thermal treatments at temperatures ranging from 170 C to 200 C for times ranging from 10 to 480 h. The glass transition temperature (T g ) was analysed via dynamic mechanical analysis (DMA). It has been proven that the glass tran- sition temperature rapidly decreases in reaction to thermal stress. The obtained T g data were used for Arrhenius plots for different critical temperatures (T g-crit. ¼ 105–120 C). From their slopes (E a /R), the activation energy of the thermal degradation process was calculated as 75.5 kJ/mol. In addition to this main relaxation mechanism, DMA also recorded one smaller relaxation process in the most aged samples. Microscopic analysis of the sample structure showed the presence of pronounced small regions of degradation both on the surface and in the inner structure, which are probably the causes of micro- scopic delamination and the smaller relaxation process. Ó 2009 Elsevier Ltd. All rights reserved. 1. Introduction Verification of the influence of thermal treatment on the properties of thermosetting epoxy laminates is an impor- tant requirement which must be considered during design of electrical machines containing these multicomponent materials. Thermosetting epoxy laminates are essential parts of many engineering structures, and most often appear as glass fibre-reinforced boards for printed circuit manufacturing in the electronics industry. These materials are also used as substrates in multi-chip modules (MCM) for their excellent mechanical properties and relatively good adhesion to metals [1,2]. They are also used in the manufacture of enclosed integrated circuits in credit or identification cards, for example [2–4]. Such laminates are also used in the field of electric power machine manufacturing (for sheet and profiled insulation) and are applied as slot wedges, electric device covers, etc. The laminates are exposed to various conditions during operation, but mainly to thermal stress, which can have a decisive effect on their properties. As a result, character- istics that can sufficiently quantify this effect are needed. Monitoring of the glass transition temperature behaviour and its dependence on level of thermal degradation is one of many options. The importance of this temperature in classification of materials has been already described by many authors [5–8], and measurement techniques and their comparison are also a frequent subject in the litera- ture [7,9–11]. According to an extensive study by Foreman [12], dynamic mechanical analysis (DMA) is considered one of the most accurate techniques for glass transition temper- ature measurement. DMA is a technique in which the deformation of a sample under oscillatory load is measured as a function of temperature whilst the sample is subjected * Corresponding author. Tel.: þ420 377634517; fax: þ420 377634502. E-mail address: [email protected] (R. Polansky ´ ). Contents lists available at ScienceDirect Polymer Testing journal homepage: www.elsevier.com/locate/polytest 0142-9418/$ – see front matter Ó 2009 Elsevier Ltd. All rights reserved. doi:10.1016/j.polymertesting.2009.03.004 Polymer Testing 28 (2009) 428–436

Welcome message from author
This document is posted to help you gain knowledge. Please leave a comment to let me know what you think about it! Share it to your friends and learn new things together.
Transcript
ilable at ScienceDirect
Polymer Testing 28 (2009) 428–436
Contents lists ava
Polymer Testing
journal homepage: www.elsevier .com/locate/polytest
Material Properties
Influence of thermal treatment on the glass transition temperatureof thermosetting epoxy laminate
R. Polansky*, V. Mentlık, P. Prosr, J. SusırDepartment of Technologies and Measurement, Faculty of Electrical Engineering, University of West Bohemia, Univerzitnı 26, 306 14 Pilsen, Czech Republic
a r t i c l e i n f o
Article history:Received 29 January 2009Accepted 10 March 2009
Keywords:Dynamic mechanical analysisEpoxy resinCompositePrinted circuit boardActivation energyArrhenius plot
* Corresponding author. Tel.: þ420 377634517; faE-mail address: [email protected] (R. Polansky
0142-9418/$ – see front matter � 2009 Elsevier Ltddoi:10.1016/j.polymertesting.2009.03.004
a b s t r a c t
The influence of accelerated thermal treatment of thermosetting epoxy laminate on itsglass transition temperature was studied. Lamplex� FR-4 glass fibre-reinforced epoxylaminate (used for printed circuit board manufacturing) was used in these experiments.The composite was exposed to thermal treatments at temperatures ranging from 170 �C to200 �C for times ranging from 10 to 480 h. The glass transition temperature (Tg) wasanalysed via dynamic mechanical analysis (DMA). It has been proven that the glass tran-sition temperature rapidly decreases in reaction to thermal stress. The obtained Tg datawere used for Arrhenius plots for different critical temperatures (Tg-crit.¼105–120 �C).From their slopes (�Ea/R), the activation energy of the thermal degradation process wascalculated as 75.5 kJ/mol. In addition to this main relaxation mechanism, DMA alsorecorded one smaller relaxation process in the most aged samples. Microscopic analysis ofthe sample structure showed the presence of pronounced small regions of degradationboth on the surface and in the inner structure, which are probably the causes of micro-scopic delamination and the smaller relaxation process.
� 2009 Elsevier Ltd. All rights reserved.
1. Introduction
Verification of the influence of thermal treatment on theproperties of thermosetting epoxy laminates is an impor-tant requirement which must be considered during designof electrical machines containing these multicomponentmaterials.
Thermosetting epoxy laminates are essential parts ofmany engineering structures, and most often appear as glassfibre-reinforced boards for printed circuit manufacturing inthe electronics industry. These materials are also used assubstrates in multi-chip modules (MCM) for their excellentmechanical properties and relatively good adhesion tometals [1,2]. They are also used in the manufacture ofenclosed integrated circuits in credit or identification cards,for example [2–4]. Such laminates are also used in the field
x: þ420 377634502.´ ).
. All rights reserved.
of electric power machine manufacturing (for sheet andprofiled insulation) and are applied as slot wedges, electricdevice covers, etc.
The laminates are exposed to various conditions duringoperation, but mainly to thermal stress, which can havea decisive effect on their properties. As a result, character-istics that can sufficiently quantify this effect are needed.Monitoring of the glass transition temperature behaviourand its dependence on level of thermal degradation is oneof many options. The importance of this temperature inclassification of materials has been already described bymany authors [5–8], and measurement techniques andtheir comparison are also a frequent subject in the litera-ture [7,9–11].
According to an extensive study by Foreman [12],dynamic mechanical analysis (DMA) is considered one ofthe most accurate techniques for glass transition temper-ature measurement. DMA is a technique in which thedeformation of a sample under oscillatory load is measuredas a function of temperature whilst the sample is subjected
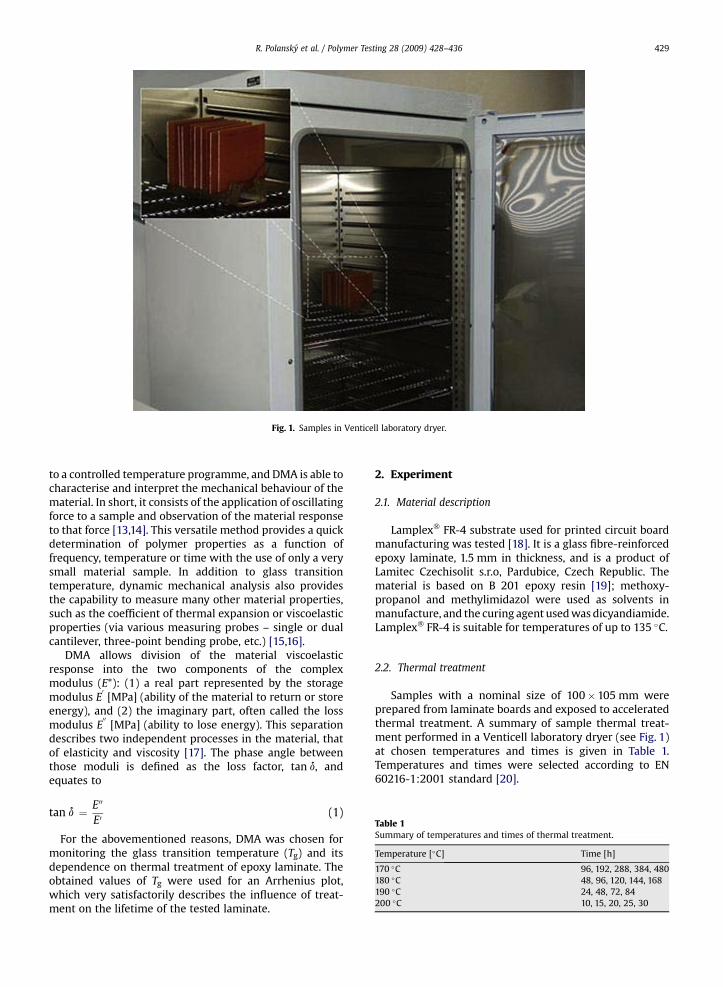
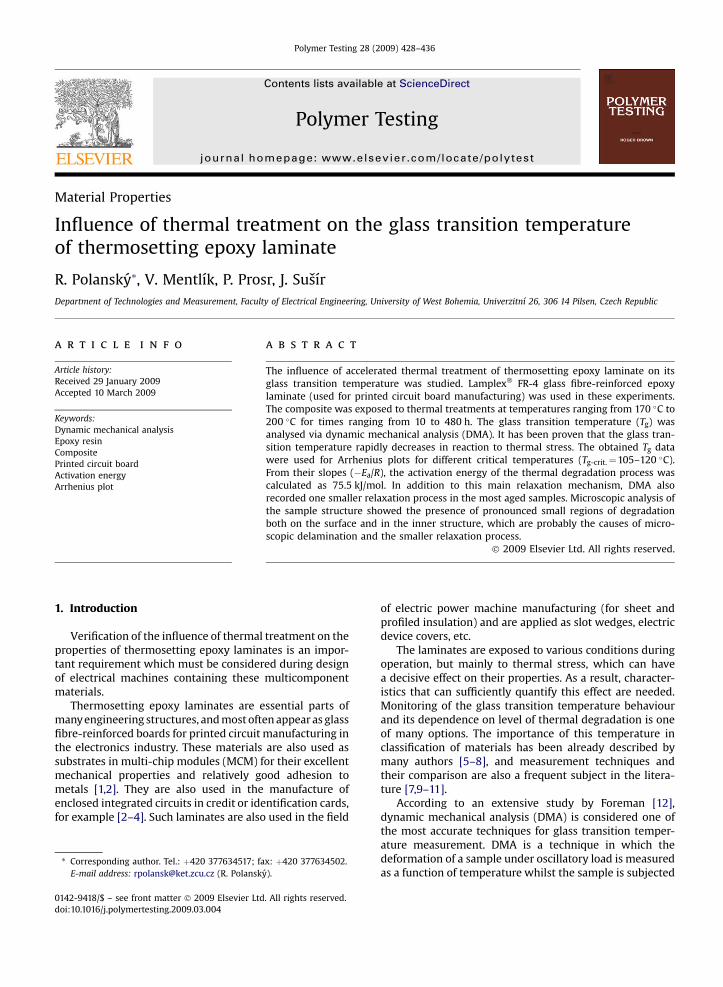
Fig. 1. Samples in Venticell laboratory dryer.
Table 1Summary of temperatures and times of thermal treatment.
Temperature [�C] Time [h]
170 �C 96, 192, 288, 384, 480180 �C 48, 96, 120, 144, 168190 �C 24, 48, 72, 84200 �C 10, 15, 20, 25, 30
R. Polansky et al. / Polymer Testing 28 (2009) 428–436 429
to a controlled temperature programme, and DMA is able tocharacterise and interpret the mechanical behaviour of thematerial. In short, it consists of the application of oscillatingforce to a sample and observation of the material responseto that force [13,14]. This versatile method provides a quickdetermination of polymer properties as a function offrequency, temperature or time with the use of only a verysmall material sample. In addition to glass transitiontemperature, dynamic mechanical analysis also providesthe capability to measure many other material properties,such as the coefficient of thermal expansion or viscoelasticproperties (via various measuring probes – single or dualcantilever, three-point bending probe, etc.) [15,16].
DMA allows division of the material viscoelasticresponse into the two components of the complexmodulus (E*): (1) a real part represented by the storagemodulus E
0[MPa] (ability of the material to return or store
energy), and (2) the imaginary part, often called the lossmodulus E
00[MPa] (ability to lose energy). This separation
describes two independent processes in the material, thatof elasticity and viscosity [17]. The phase angle betweenthose moduli is defined as the loss factor, tan d, andequates to
tan d ¼ E00
E0(1)
For the abovementioned reasons, DMA was chosen formonitoring the glass transition temperature (Tg) and itsdependence on thermal treatment of epoxy laminate. Theobtained values of Tg were used for an Arrhenius plot,which very satisfactorily describes the influence of treat-ment on the lifetime of the tested laminate.
2. Experiment
2.1. Material description
Lamplex� FR-4 substrate used for printed circuit boardmanufacturing was tested [18]. It is a glass fibre-reinforcedepoxy laminate, 1.5 mm in thickness, and is a product ofLamitec Czechisolit s.r.o, Pardubice, Czech Republic. Thematerial is based on B 201 epoxy resin [19]; methoxy-propanol and methylimidazol were used as solvents inmanufacture, and the curing agent used was dicyandiamide.Lamplex� FR-4 is suitable for temperatures of up to 135 �C.
2.2. Thermal treatment
Samples with a nominal size of 100�105 mm wereprepared from laminate boards and exposed to acceleratedthermal treatment. A summary of sample thermal treat-ment performed in a Venticell laboratory dryer (see Fig. 1)at chosen temperatures and times is given in Table 1.Temperatures and times were selected according to EN60216-1:2001 standard [20].
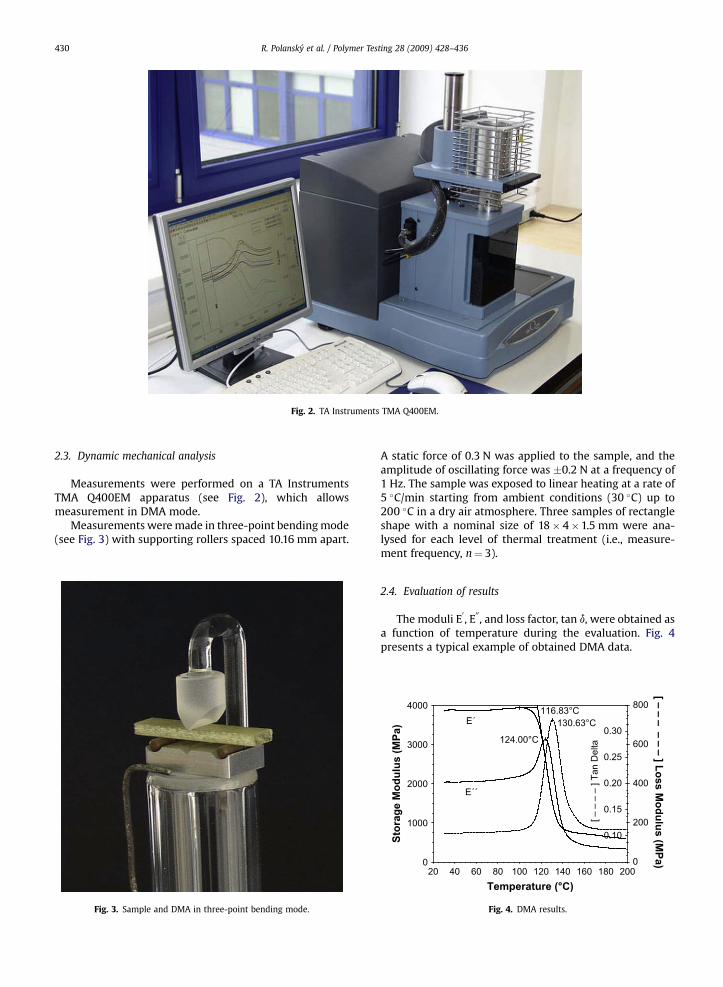
Fig. 2. TA Instruments TMA Q400EM.
R. Polansky et al. / Polymer Testing 28 (2009) 428–436430
2.3. Dynamic mechanical analysis
Measurements were performed on a TA InstrumentsTMA Q400EM apparatus (see Fig. 2), which allowsmeasurement in DMA mode.
Measurements were made in three-point bending mode(see Fig. 3) with supporting rollers spaced 10.16 mm apart.
Fig. 3. Sample and DMA in three-point bending mode.
A static force of 0.3 N was applied to the sample, and theamplitude of oscillating force was �0.2 N at a frequency of1 Hz. The sample was exposed to linear heating at a rate of5 �C/min starting from ambient conditions (30 �C) up to200 �C in a dry air atmosphere. Three samples of rectangleshape with a nominal size of 18� 4�1.5 mm were ana-lysed for each level of thermal treatment (i.e., measure-ment frequency, n¼ 3).
2.4. Evaluation of results
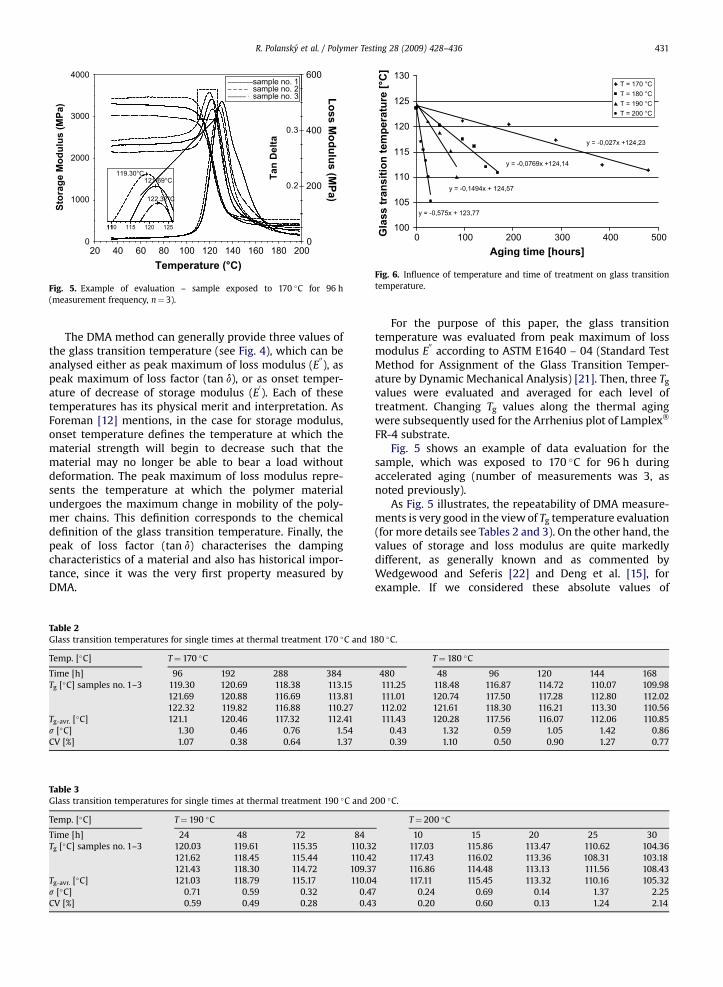
The moduli E0, E00, and loss factor, tan d, were obtained as
a function of temperature during the evaluation. Fig. 4presents a typical example of obtained DMA data.
130.63°C
124.00°C
116.83°CE´
E´´
0.10
0.15
0.20
0.25
0.30
[ – –
– –
] Ta
n D
elta
0
200
400
600
800
[ – – – – – – ] L
oss M
od
ulu
s (M
Pa)
0
1000
2000
3000
4000
Sto
rag
e M
od
ulu
s (M
Pa)
20 40 60 80 100 120 140 160 180 200Temperature (°C)
Fig. 4. DMA results.
y = -0,027x +124,23
y = -0,0769x +124,14
y = -0,575x + 123,77
y = -0,1494x + 124,57
100
105
110
115
120
125
130
0 100 200 300 400 500Aging time [hours]
Glass tran
sitio
n tem
peratu
re [°C
]
T = 170 °CT = 180 °CT = 190 °CT = 200 °C
Fig. 6. Influence of temperature and time of treatment on glass transitiontemperature.
0.2
0.3
Ta
n D
elta
0
200
400
600
Lo
ss M
od
ulu
s (M
Pa) 1000
2000
3000
4000
Sto
rag
e M
od
ulu
s (M
Pa)
020 40 60 80 100 120 140 160 180 200
Temperature (°C)
sample no. 1sample no. 2sample no. 3
110 115 120 125
122.32°C
11
119.30°C
11
121.69°C
Fig. 5. Example of evaluation – sample exposed to 170 �C for 96 h(measurement frequency, n¼ 3).
R. Polansky et al. / Polymer Testing 28 (2009) 428–436 431
The DMA method can generally provide three values ofthe glass transition temperature (see Fig. 4), which can beanalysed either as peak maximum of loss modulus (E
00), as
peak maximum of loss factor (tan d), or as onset temper-ature of decrease of storage modulus (E
0). Each of these
temperatures has its physical merit and interpretation. AsForeman [12] mentions, in the case for storage modulus,onset temperature defines the temperature at which thematerial strength will begin to decrease such that thematerial may no longer be able to bear a load withoutdeformation. The peak maximum of loss modulus repre-sents the temperature at which the polymer materialundergoes the maximum change in mobility of the poly-mer chains. This definition corresponds to the chemicaldefinition of the glass transition temperature. Finally, thepeak of loss factor (tan d) characterises the dampingcharacteristics of a material and also has historical impor-tance, since it was the very first property measured byDMA.
Table 2Glass transition temperatures for single times at thermal treatment 170 �C and 1
Temp. [�C] T¼ 170 �C
Time [h] 96 192 288 384Tg [�C] samples no. 1–3 119.30 120.69 118.38 113.15
121.69 120.88 116.69 113.81122.32 119.82 116.88 110.27
Tg-avr. [�C] 121.1 120.46 117.32 112.41s [�C] 1.30 0.46 0.76 1.54CV [%] 1.07 0.38 0.64 1.37
Table 3Glass transition temperatures for single times at thermal treatment 190 �C and 2
Temp. [�C] T¼ 190 �C
Time [h] 24 48 72 84Tg [�C] samples no. 1–3 120.03 119.61 115.35 110.3
121.62 118.45 115.44 110.4121.43 118.30 114.72 109.3
Tg-avr. [�C] 121.03 118.79 115.17 110.0s [�C] 0.71 0.59 0.32 0.4CV [%] 0.59 0.49 0.28 0.4
For the purpose of this paper, the glass transitiontemperature was evaluated from peak maximum of lossmodulus E
00according to ASTM E1640 – 04 (Standard Test
Method for Assignment of the Glass Transition Temper-ature by Dynamic Mechanical Analysis) [21]. Then, three Tg
values were evaluated and averaged for each level oftreatment. Changing Tg values along the thermal agingwere subsequently used for the Arrhenius plot of Lamplex�
FR-4 substrate.Fig. 5 shows an example of data evaluation for the
sample, which was exposed to 170 �C for 96 h duringaccelerated aging (number of measurements was 3, asnoted previously).
As Fig. 5 illustrates, the repeatability of DMA measure-ments is very good in the view of Tg temperature evaluation(for more details see Tables 2 and 3). On the other hand, thevalues of storage and loss modulus are quite markedlydifferent, as generally known and as commented byWedgewood and Seferis [22] and Deng et al. [15], forexample. If we considered these absolute values of
80 �C.
T¼ 180 �C
480 48 96 120 144 168111.25 118.48 116.87 114.72 110.07 109.98111.01 120.74 117.50 117.28 112.80 112.02112.02 121.61 118.30 116.21 113.30 110.56111.43 120.28 117.56 116.07 112.06 110.85
0.43 1.32 0.59 1.05 1.42 0.860.39 1.10 0.50 0.90 1.27 0.77
00 �C.
T¼ 200 �C
10 15 20 25 302 117.03 115.86 113.47 110.62 104.362 117.43 116.02 113.36 108.31 103.187 116.86 114.48 113.13 111.56 108.434 117.11 115.45 113.32 110.16 105.327 0.24 0.69 0.14 1.37 2.253 0.20 0.60 0.13 1.24 2.14
virgin state–––––––24 hours– – – –48 hours––––– ·72 hours––– – –84 hours––– –––
0
200
400
600
800
Lo
ss M
od
ulu
s (M
Pa)
20 40 60 80 100 120 140 160 180 200Temperature (°C)
110 115 120 125
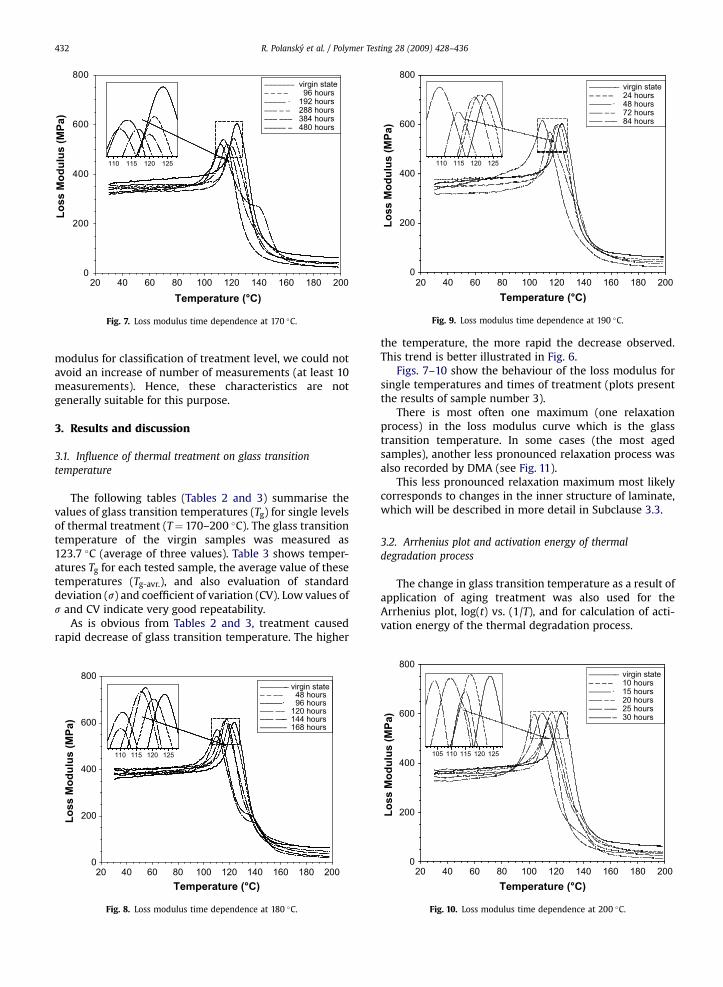
Fig. 9. Loss modulus time dependence at 190 �C.
0
200
400
600
800L
oss M
od
ulu
s (M
Pa)
20 40 60 80 100 120 140 160 180 200
Temperature (°C)
virgin state96 hours
192 hours288 hours384 hours480 hours
115 120 125110
Fig. 7. Loss modulus time dependence at 170 �C.
R. Polansky et al. / Polymer Testing 28 (2009) 428–436432
modulus for classification of treatment level, we could notavoid an increase of number of measurements (at least 10measurements). Hence, these characteristics are notgenerally suitable for this purpose.
3. Results and discussion
3.1. Influence of thermal treatment on glass transitiontemperature
The following tables (Tables 2 and 3) summarise thevalues of glass transition temperatures (Tg) for single levelsof thermal treatment (T¼ 170–200 �C). The glass transitiontemperature of the virgin samples was measured as123.7 �C (average of three values). Table 3 shows temper-atures Tg for each tested sample, the average value of thesetemperatures (Tg-avr.), and also evaluation of standarddeviation (s) and coefficient of variation (CV). Low values ofs and CV indicate very good repeatability.
As is obvious from Tables 2 and 3, treatment causedrapid decrease of glass transition temperature. The higher
0
200
400
600
800
Lo
ss M
od
ulu
s (M
Pa)
20 40 60 80 100 120 140 160 180 200Temperature (°C)
virgin state–––––––48 hours– – – –96 hours––––– ·
120 hours––– – –144 hours––– –––168 hours––––– –
110 115 120 125
Fig. 8. Loss modulus time dependence at 180 �C.
the temperature, the more rapid the decrease observed.This trend is better illustrated in Fig. 6.
Figs. 7–10 show the behaviour of the loss modulus forsingle temperatures and times of treatment (plots presentthe results of sample number 3).
There is most often one maximum (one relaxationprocess) in the loss modulus curve which is the glasstransition temperature. In some cases (the most agedsamples), another less pronounced relaxation process wasalso recorded by DMA (see Fig. 11).
This less pronounced relaxation maximum most likelycorresponds to changes in the inner structure of laminate,which will be described in more detail in Subclause 3.3.
3.2. Arrhenius plot and activation energy of thermaldegradation process
The change in glass transition temperature as a result ofapplication of aging treatment was also used for theArrhenius plot, log(t) vs. (1/T), and for calculation of acti-vation energy of the thermal degradation process.
virgin state–––––––10 hours– – – –15 hours––––– ·20 hours––– – –25 hours––– –––30 hours––––– –
0
200
400
600
800
Lo
ss M
od
ulu
s (M
Pa)
20 40 60 80 100 120 140 160 180 200Temperature (°C)
110105 115 120 125
Fig. 10. Loss modulus time dependence at 200 �C.
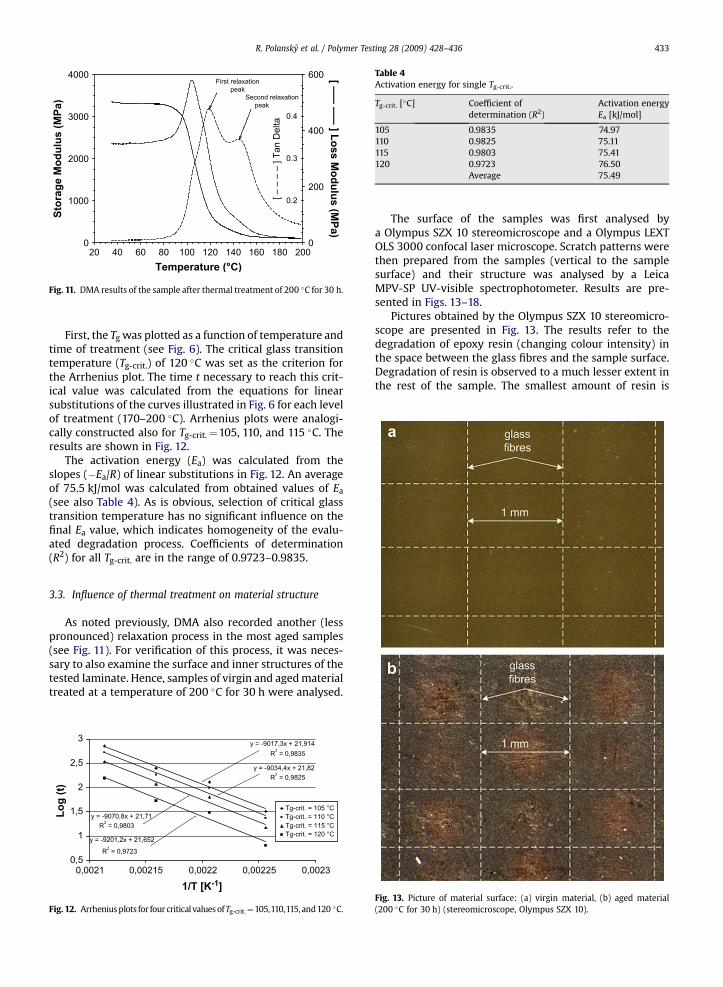
Table 4Activation energy for single Tg-crit..
Tg-crit. [�C] Coefficient ofdetermination (R2)
Activation energyEa [kJ/mol]
105 0.9835 74.97110 0.9825 75.11115 0.9803 75.41120 0.9723 76.50
Average 75.49
First relaxationpeak
Second relaxation peak
0.2
0.3
0.4
[ – –
– –
] Ta
n D
elta
0
200
400
600 [ ––– ––– ] L
oss M
od
ulu
s (M
Pa)
0
1000
2000
3000
4000
Sto
rag
e M
od
ulu
s (M
Pa)
20 40 60 80 100 120 140 160 180 200Temperature (°C)
Fig. 11. DMA results of the sample after thermal treatment of 200 �C for 30 h.
R. Polansky et al. / Polymer Testing 28 (2009) 428–436 433
First, the Tg was plotted as a function of temperature andtime of treatment (see Fig. 6). The critical glass transitiontemperature (Tg-crit.) of 120 �C was set as the criterion forthe Arrhenius plot. The time t necessary to reach this crit-ical value was calculated from the equations for linearsubstitutions of the curves illustrated in Fig. 6 for each levelof treatment (170–200 �C). Arrhenius plots were analogi-cally constructed also for Tg-crit.¼105, 110, and 115 �C. Theresults are shown in Fig. 12.
The activation energy (Ea) was calculated from theslopes (�Ea/R) of linear substitutions in Fig. 12. An averageof 75.5 kJ/mol was calculated from obtained values of Ea
(see also Table 4). As is obvious, selection of critical glasstransition temperature has no significant influence on thefinal Ea value, which indicates homogeneity of the evalu-ated degradation process. Coefficients of determination(R2) for all Tg-crit. are in the range of 0.9723–0.9835.
3.3. Influence of thermal treatment on material structure
As noted previously, DMA also recorded another (lesspronounced) relaxation process in the most aged samples(see Fig. 11). For verification of this process, it was neces-sary to also examine the surface and inner structures of thetested laminate. Hence, samples of virgin and aged materialtreated at a temperature of 200 �C for 30 h were analysed.
y = -9017,3x + 21,914R2 = 0,9835
R2 = 0,9825
R2 = 0,9803
R2 = 0,9723
y = -9034,4x + 21,82
y = -9070,8x + 21,71
y = -9201,2x + 21,652
0,5
1
1,5
2
2,5
3
0,0021 0,00215 0,0022 0,00225 0,0023
1/T [K-1
]
Lo
g (t)
Tg-crit. = 105 °CTg-crit. = 110 °CTg-crit. = 115 °CTg-crit. = 120 °C
Fig. 12. Arrhenius plots for four critical values of Tg-crit.¼105,110,115, and 120 �C.
The surface of the samples was first analysed bya Olympus SZX 10 stereomicroscope and a Olympus LEXTOLS 3000 confocal laser microscope. Scratch patterns werethen prepared from the samples (vertical to the samplesurface) and their structure was analysed by a LeicaMPV-SP UV-visible spectrophotometer. Results are pre-sented in Figs. 13–18.
Pictures obtained by the Olympus SZX 10 stereomicro-scope are presented in Fig. 13. The results refer to thedegradation of epoxy resin (changing colour intensity) inthe space between the glass fibres and the sample surface.Degradation of resin is observed to a much lesser extent inthe rest of the sample. The smallest amount of resin is
Fig. 13. Picture of material surface: (a) virgin material, (b) aged material(200 �C for 30 h) (stereomicroscope, Olympus SZX 10).
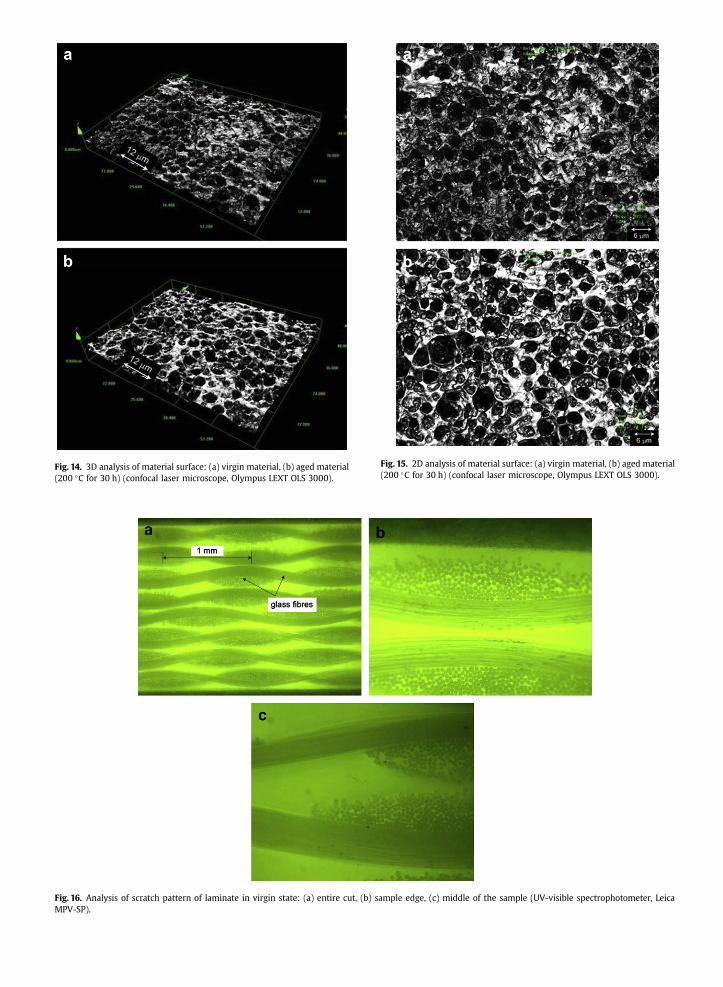
Fig. 16. Analysis of scratch pattern of laminate in virgin state: (a) entire cut, (b) sample edge, (c) middle of the sample (UV-visible spectrophotometer, LeicaMPV-SP).
Fig. 14. 3D analysis of material surface: (a) virgin material, (b) aged material(200 �C for 30 h) (confocal laser microscope, Olympus LEXT OLS 3000).
Fig. 15. 2D analysis of material surface: (a) virgin material, (b) aged material(200 �C for 30 h) (confocal laser microscope, Olympus LEXT OLS 3000).
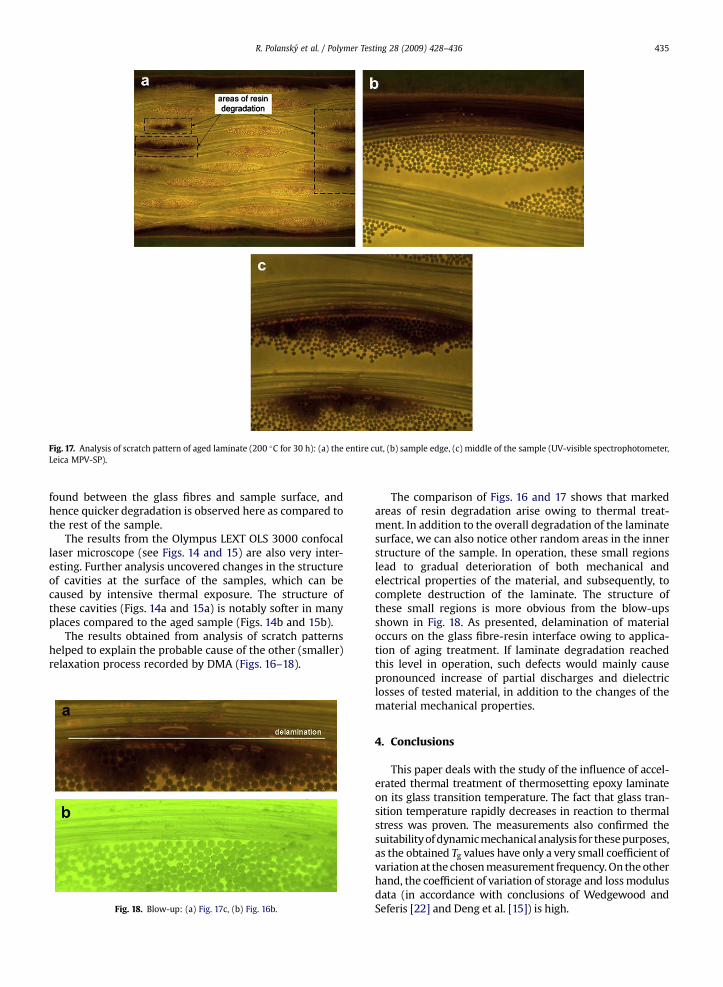
Fig. 17. Analysis of scratch pattern of aged laminate (200 �C for 30 h): (a) the entire cut, (b) sample edge, (c) middle of the sample (UV-visible spectrophotometer,Leica MPV-SP).
R. Polansky et al. / Polymer Testing 28 (2009) 428–436 435
found between the glass fibres and sample surface, andhence quicker degradation is observed here as compared tothe rest of the sample.
The results from the Olympus LEXT OLS 3000 confocallaser microscope (see Figs. 14 and 15) are also very inter-esting. Further analysis uncovered changes in the structureof cavities at the surface of the samples, which can becaused by intensive thermal exposure. The structure ofthese cavities (Figs. 14a and 15a) is notably softer in manyplaces compared to the aged sample (Figs. 14b and 15b).
The results obtained from analysis of scratch patternshelped to explain the probable cause of the other (smaller)relaxation process recorded by DMA (Figs. 16–18).
Fig. 18. Blow-up: (a) Fig. 17c, (b) Fig. 16b.
The comparison of Figs. 16 and 17 shows that markedareas of resin degradation arise owing to thermal treat-ment. In addition to the overall degradation of the laminatesurface, we can also notice other random areas in the innerstructure of the sample. In operation, these small regionslead to gradual deterioration of both mechanical andelectrical properties of the material, and subsequently, tocomplete destruction of the laminate. The structure ofthese small regions is more obvious from the blow-upsshown in Fig. 18. As presented, delamination of materialoccurs on the glass fibre-resin interface owing to applica-tion of aging treatment. If laminate degradation reachedthis level in operation, such defects would mainly causepronounced increase of partial discharges and dielectriclosses of tested material, in addition to the changes of thematerial mechanical properties.
4. Conclusions
This paper deals with the study of the influence of accel-erated thermal treatment of thermosetting epoxy laminateon its glass transition temperature. The fact that glass tran-sition temperature rapidly decreases in reaction to thermalstress was proven. The measurements also confirmed thesuitability of dynamic mechanical analysis for these purposes,as the obtained Tg values have only a very small coefficient ofvariation at the chosen measurement frequency. On the otherhand, the coefficient of variation of storage and loss modulusdata (in accordance with conclusions of Wedgewood andSeferis [22] and Deng et al. [15]) is high.
R. Polansky et al. / Polymer Testing 28 (2009) 428–436436
Arrhenius plots were constructed from measured datafor different critical values of Tg-crit. (105–120 �C). Activationenergy values calculated for these critical temperatures arealmost the same and they indicate homogeneity of themain thermal degradation process. The average value ofactivation energy is 75.5 kJ/mol.
Another, smaller relaxation process (in addition to theglass transition temperature) was also recorded viadynamic mechanical analysis. This process was observedmainly on the most aged samples. Hence, microscopicanalysis was also performed on the sample (in the virginstate as well as after treatment), which uncovered the smallregions of degradation at the surface and in the innerstructure of the laminate; however, it also showed thedelamination of laminate on the glass fibre–resin interface.As these inhomogeneities were not observed on thesamples in the virgin state, it may be said that theyoccurred as a reaction to the applied thermal stress.Microscopic delamination of laminate structure is alsoa probable cause of the other relaxation process recordedby DMA.
In conclusion, it may be noted that applied thermalstress evokes a decrease in the glass transition temperaturein the tested laminate, which can be very well recorded.This trend (at higher temperatures and longer times ofthermal treatment) is at the same time accompanied by thecreation of a second relaxation process, probably connectedto delamination of the inner structure of the laminate.Dynamic mechanical analysis proved very effective formonitoring of both of these processes.
Acknowledgements
This article was carried out with the help of the Ministryof Education, Youth and Sports of Czech Republic, MSM4977751310 – Diagnostics of Interactive Processes in Elec-trical Engineering. The authors also thank Ing. Jan Rebounfor providing pictures of the surface and inner structureanalysis of the tested material.
References
[1] M.E. Nicholson (Ed.), Proceedings of the Electrical Packaging andCorrosion in Microelectronics, ASM International, New York,1987, p. 2.
[2] Y. Zhang, et al., Thermal graft copolymerization-induced adhesionimprovement of a FR-4�/PETG� laminate, International Journal ofAdhesion & Adhesives 20 (2000) 165–171.
[3] N. Kiyoshi, H. Yasuo, K. Tadayuki, T. Masahiro, Japan Patent, JP09216485 A2, 1997.
[4] V. Pennanen, O. Rudanem, Journal of Electronics Manufacturing 7(1997) 287.
[5] J.F. Mano, J.C. Viana, Effects of the strain rate and temperature instress–strain tests: study of the glass transition of a polyamide-6,Polymer Testing 20 (8) (2001) 937–943.
[6] J.F. Mano, J.C. Viana, Stress–strain experiments as a mechanicalspectroscopic technique to characterise the glass transitiondynamics in poly(ethylene terephthalate), Polymer Testing 25 (7)(2006) 953–960.
[7] E. �Cernoskova, et al., Structural relaxation near the glass transitiontemperature, Journal of Non-Crystalline Solids 284 (1–3) (2001)73–78.
[8] A. El-Hadi, et al., Correlation between degree of crystallinity,morphology, glass temperature, mechanical properties andbiodegradation of poly (3-hydroxyalkanoate) PHAs and their blends,Polymer Testing 21 (6) (2002) 665–674.
[9] Z. �Cernosek, J. Holubova, E. �Cernoskova, Non-isothermal structuralrelaxation and the glass transition temperature, Solid State Sciences5 (8) (2003) 1087–1093.
[10] K. Backfolk, et al., Determination of the glass transition temperatureof latex films: comparison of various methods, Polymer Testing 26(8) (2007) 1031–1040.
[11] R. Hagen, et al., Comparison of dynamic mechanical measurementsand Tg determinations with two different instruments, PolymerTesting 13 (2) (1994) 113–128.
[12] J. Foreman, S.R. Sauerbrunn, C.L. Marcozzi, Exploring the Sensitivityof Thermal Analysis Techniques to the Glass Transition TAInstruments: Applications Library Search [online] (2006),<http://www.tainstruments.com/main.aspx?n¼2&id¼181&main_id¼348&siteid¼11> [cit. 2007-09-15].
[13] K.P. Menard, Dynamic Mechanical Analysis: a Practical Introduction,CRC Press LLC, 1999, 205 pp.
[14] R.C. Mackenzie, Nomenclature in thermal analysis: part IV, Journalof Thermal Analysis 13 (2) (1978) 387–392.
[15] S. Deng, M. Hou, L. Ye, Temperature-dependent elastic moduli ofepoxies measured by DMA and their correlations to mechanicaltesting data, Polymer Testing 26 (6) (2007) 803–813.
[16] TA Instruments, 2980 Dynamic Mechanical Analyzer Operator’sManual, 1997.
[17] T. Hatakeyama, F.X. Quinn, Thermal Analysis: Fundamentals andApplications to Polymer Science, second ed. John Wiley & Sons Ltd.,Chichester, 1999, 189 pp.
[18] Lamitec Group, Lamplex� FR4-Cu: Multifunktionelles FR-4 SystemTg 135 �C IPC-4101B, Specification Sheet 21 [online], <http://www.lamitec.de/PDF/Datenblatt%20Lamplex%20FR4-Cu%20Rev%201-D1.pdf> [cit. 2008-11-05].
[19] SPOLCHEMIE�, CHS-EPOXY B 201: Datasheet [online], <http://www.spolchemie.cz/eDoc/dts/53BA4523-F0D0-4156-B2BB-61C01F911BD6.pdf> [cit. 2008-11-05].
[20] EN 60216-1:2001, Electrical Insulating Materials – Properties ofThermal Endurance – Part 1: Ageing Procedures and Evaluation ofTest Results.
[21] ASTM E1640 – 04, Standard Test Method for Assignment of the GlassTransition Temperature By Dynamic Mechanical Analysis.
[22] A.R. Wedgewood, J.C. Seferis, Error analysis and modelling of non-linear stress strain behaviour in measuring dynamic mechanicalproperties of polymers with the Rehovibron, Polymer 22 (1981)966–991.
Related Documents


