Safety in Mines Research Advisory Committee Final Report Influence of surface topography on the loading of pillar workings in near surface and shallow mines A H Swart, G J Keyter, J Wesseloo, T R Stacey and W C Joughin Research agency : SRK Consulting Project number : OTH 501 Date : July 2000

Welcome message from author
This document is posted to help you gain knowledge. Please leave a comment to let me know what you think about it! Share it to your friends and learn new things together.
Transcript

Safety in Mines Research Advisory Committee
Final Report
Influence of surface topography onthe loading of pillar workings in near
surface and shallow mines
A H Swart, G J Keyter, J Wesseloo, T R Stacey
and W C Joughin
Research agency : SRK Consulting
Project number : OTH 501
Date : July 2000
2
Executive summaryMining often takes place in areas with steep and variable surface topography. Variable
surface topography could be due to natural features such as valleys and hills, or man-made
features such as excavations caused by surface mining operations or surcharging by dumping
of spoil material, or tailings from the metallurgical plant. The research carried out for this
project shows that the stability of underground excavations could be adversely affected by the
proximity of such topographical features, especially in near surface mining operations of less
than 100 m below surface.
Perhaps the biggest hazard concerning the influence of surface topography on the loading
of pillar workings in near surface and shallow mines is incorrect pillar design. This includes
the identification of critical areas under influence of topographical features, and consideration
of failure mechanisms not necessarily taken into account under normal conditions. This study
shows that standard pillar design techniques are not applicable in such areas of variable
stress and that a rational pillar design method is therefore required for such situations.
The main objective of this research is to quantify the influence of surface topography on the
stability of pillars and to describe a design methodology for pillars in areas of variable surface
topography. Consideration of the critical factors identified in the study will improve the design
of stable pillar systems, which are required to alleviate the hazard of catastrophic pillar
collapse in areas under influence of varying surface topography.
The proposed procedure for the design of pillars in areas of variable topography caused by
surcharging is based on the procedure described by Fourie (1987). The design procedure can
be summarised as follows:
1) Calculate the pillar strength.
2) Determine the average pillar stress.
3) Calculate the original factor of safety, Fo, where:
4) stresspillaraverage
strengthpillarFo =
5) Determine the thickness of the overburden, H.
6) Determine the height of the spoil pile or tailings dam, h.

3
7) Determine the swell factor of the spoil pile or tailings dam, S.
8) Calculate the ratio of the factor of safety with the applied superficial stress, Fs, to the
original factor of safety, Fo as follows:
ShH
H
hgHgHg
FF
so
o
o
s
++
=
⋅⋅+⋅⋅⋅⋅
=
1
ρρρ
where: ρo = average density of overburden material
ρs = average density of spoil or tailings material
The conventional method of calculating factors of safety for pillars represents the factor of
safety for the pillar in compression only, and implicitly assumes that the shear stresses acting
on a pillar are negligible. However, due to the proximity or orientation of stopes relative to
topographical features, significant rotation of the principal stresses around pillars may occur.
As a result, both the normal and shear stresses acting on a pillar have to be taken into
account to allow rigorous design of the pillar dimensions and to determine the allowable
extraction ratio.
It is therefore necessary to calculate the overall factor of safety for the pillar in terms of the
proximity of the Mohr circle, representing the stress condition in the pillar, to the actual failure
envelope for the pillar. As a result, the overall factor of safety for the pillar will always be less
than the factor of safety for the pillar in compression, especially where significant shear
stresses are acting on the pillars as a result of the influence of surface topography, principal
stress orientation and/or the actual stope orientation.
In order to overcome the limitations of the standard approach to pillar design, more rigorous
approaches using Mohr-Coulomb and Hoek-Brown failure criteria were developed as part of
the research. The basic steps of the proposed design methodology, which is described in
Section 6 of the report, are as follows:
1) Assess the rock mass conditions and collect relevant geotechnical data.
2) Consider the structural complexity of the surrounding rock mass. If the surrounding rock
mass is structurally too complex, a site specific design will be required.
3) Determine a rock mass rating for the rock mass and orebody.

4
4) Calculate the strength and deformational parameters for the rock mass and orebody.
5) Establish a typical cross-section through the proposed mine, as well as the horizontal to
vertical stress ratio.
6) Use typical design charts or carry out numerical modelling to determine the major and
minor principal stresses before mining, as well as the major principal stress orientation
with the vertical at the point of interest.
7) Calculate or select a maximum allowable stope span, Lw, and pillar height, H.
8) For the type of pillar required, select or calculate a suitable stress to strength ratio, SSR
(Table 6.1 or Equations 25 or 33).
9) Calculate the maximum allowable extraction ratio, e, by solving Equations 25 or 33
numerically, or by calculating the SSR for various e values.
10) If the mining operation is financially viable at the calculated extraction ratio, calculate the
corresponding effective pillar width, Weff from Equation 17.
11) Assess the potential for bearing failure of the hanging- and footwall using Equation 34.
The proposed design methodology has been validated by back analysing a regional pillar
collapse in a near surface mine under influence of surface topography, as well as stable areas
down dip of the collapsed area. It is calculated that, using the standard method of analysis
based on uniaxial loading only, 89% extraction would have been allowed under the conditions
found before the collapse. This compares with a maximum allowable extraction ration of 80%
using the Hoek-Brown failure criterion. The corresponding factors of safety are 0,59 and 1,33
respectively.
Thus, it is clear that an overestimation of the allowable extraction ratio is obtained if the shear
stresses due to topographical effects are not taken into account. The amount by which the
allowable extraction ratio is overestimated depends on the pillar orientation with respect to the
major principal stress as well as the magnitude of the minor and major principal stresses. The
higher the shear stress after extraction, the less conservative the results will be that are
obtained using the simplified method of analysis. Overestimating the allowable extraction ratio
could result in regional pillar collapses and safety hazards.

5
AcknowledgementsThe authors gratefully acknowledge the funding provided by SIMRAC to carry out this
research. We should like to thank the management and rock engineering practitioners of the
mines visited for their assistance, for information provided regarding pillar collapses as a
result of surface topography, and for useful discussions on design considerations for pillars
under influence of varying surface topography.

6
Table of contents
Executive summary ....................................................................2
Acknowledgements ....................................................................5
Table of contents........................................................................6
List of figures ............................................................................10
List of tables .............................................................................10
Glossary of abbreviations, symbols and terms.........................11
1 Introduction .........................................................................181.1 Problem statement .......................................................................18
1.2 Objectives of this study ................................................................211.2.1 Main objective .......................................................................................21
1.2.2 Secondary objectives ............................................................................21
1.3 Research methodology ................................................................221.3.1 Research context ..................................................................................22
1.3.2 Research approach...............................................................................22
2 Literature evaluation............................................................242.1 The influence of natural surface topography on the stability of
underground excavations.............................................................24
2.2 The influence of man-made topography on the stability of
underground excavations.............................................................292.2.1 Man-made features such as excavations caused by surface mining....29
2.2.2 Man-made features caused by surcharging..........................................31
2.3 Pillar design methodologies being used in the “other” mining
sector............................................................................................32

7
2.4 The influence of underground excavations on the stability of
surface topography ......................................................................33
3 Data collection from selected mines ...................................34
4 Risk assessment .................................................................364.1 Introduction...................................................................................36
4.2 Fault-event tree analysis approach to risk assessment...............36
4.3 Conclusions..................................................................................37
5 Procedure for the design of pillars in areas of variable
topography caused by surcharging .....................................38
6 Procedure for the design of pillars in areas of variable
topography caused by natural features or man-made
excavations .........................................................................416.1 Description of pillar design methodology .....................................41
6.2 Theoretical considerations in pillar design...................................446.2.1 Stresses around a stope in two-dimensions .........................................44
6.2.2 Pillar Strength .......................................................................................46
6.2.3 Simplified Method of Analysis Considering Uniaxial Compression
Only.......................................................................................................48
6.2.4 Rigorous Method of Analysis using a Mohr-Coulomb failure
Criterion ................................................................................................49
6.2.5 Rigorous Method of Analysis using a Hoek-Brown Failure Criterion.....52
6.2.6 Pillar Dimensions and Stope Layout .....................................................54
6.2.7 Foundation Strength of Pillar ................................................................54
7 Validation of proposed design methodology by means of
back analysis.......................................................................557.1 Engineering Geology....................................................................55

8
7.1.1 Stratigraphy...........................................................................................55
7.1.2 Major Geological Structures..................................................................55
7.1.3 Ubiquitous Joint Sets ............................................................................55
7.1.4 Groundwater .........................................................................................56
7.1.5 Rock Mass Stiffness .............................................................................56
7.2 Homogeneity of Surrounding Rock Mass ....................................56
7.3 Rock Mass Classification .............................................................56
7.4 Horizontal to Vertical Stress Ratio ...............................................58
7.5 Geometry of Underground Mine Workings in relation to
Mountainous Surface Topography...............................................58
7.6 Design Charts of Principal Stresses and Stress Orientation .......58
7.7 Extraction Ratio from Simplified Analysis ....................................61
7.8 Extraction Ratio from Analysis using a Mohr-Coulomb Failure
Criterion........................................................................................62
7.9 Extraction Ratio from Analysis using a Hoek-Brown Failure
Criterion........................................................................................62
7.10 Simplified versus Rigorous Methods of Analysis .........................63
7.11 Correlation of Predicted Extraction Ratios with Actual Extraction
Ratios ...........................................................................................64
7.12 Foundation Strength of Pillar .......................................................65
8 Conclusions and recommendations ....................................668.1 Conclusions..................................................................................668.1.1 Main objective .......................................................................................66
8.1.2 Secondary objectives ............................................................................67
8.2 Recommendations .......................................................................71
9 References..........................................................................72
Appendix A ...............................................................................75

9
Pillar design methodologies being used by the “other” mining
sector ..................................................................................75A.1 Salamon and Munro (1967) approach .........................................75A.1.1 Introduction ...........................................................................................75
A.1.2 Statistical analysis of data.....................................................................75
A.1.3 Requirements of analysis......................................................................76
A.1.1 Critical Factor of Safety (FOSc).............................................................76
A.1.4 The pillar strength formula and estimation of the parameters...............77
A.1.5 Experiences with pillar design procedure..............................................80
A.2 Hedley and Grant (1972) approach .............................................80A.2.1 Introduction ...........................................................................................80
A.2.2 Statistical analysis of data.....................................................................80
A.2.3 Pillar design ..........................................................................................81
Appendix B ...............................................................................83
Fault-Event Tree methodology approach to risk assessment ..83B.1 Introduction...................................................................................83
B.2 Cause/Fault Tree Analysis ...........................................................83
B.3 Probability evaluation in fault tree ................................................84
B.4 Event tree analysis .......................................................................84
B.5 Allocation of probabilities of occurrence ......................................85
Appendix C...............................................................................88
Fault tree analysis of the thread of regional pillar collapse
under the influence of surface topography..........................88

10
List of figures
Figure 5.1 The effect of surface surcharging on pillar factor of safety (swell
factor = 30%)..................................................................................39
Figure 5.2 The effect of surface surcharging on pillar factor of safety (swell
factor = 40%)..................................................................................39
Figure 5.3 The effect of surface surcharging on pillar factor of safety (swell
factor = 50%)..................................................................................40
Figure 6.1 Flowchart of pillar design methodology................................................43
Figure 7.1 Major principal stress contours (MPa)..................................................59
Figure 7.2 Minor principal stress contours (MPa)..................................................59
Figure 7.3 Contours of the angle, θ, between the major principal stress and the
vertical (in degrees)........................................................................60
List of tables
Table 1.1 Number of incidents in the gold and platinum, coal, and other
sectors caused by subsidence or caving as a result of mining
operations or other causes.............................................................19
Table 6.1 Stress to Strength Ratio, SSR, for various degrees of fracturing.........48
11
Glossary of abbreviations, symbols and terms
AbbreviationsDRMS design rock mass strength
FOG fall of ground
FOS factor of safety
GSI Geological Strength Index
MN meganewton
MPa megapascal
MRMR mining rock mass rating
OTH mnemonic for the “other” mining sector
RMR rock mass rating
SAMRASS South African Mines Reportable Accident Statistics System
SG specific gravity
SIMOT The SIMRAC sub-committee representing the “other” mining sector
SIMRAC Safety in Mines Research Advisory Committee
SRK Steffen, Robertson and Kirsten Consulting Engineers and Scientists
SSR ratio between the normal stress acting on the pillar and the UCS of the pillar
UCS uniaxial compressive strength
Symbolsa pillar strength exponent
b pillar strength exponent
g gravitational acceleration
h hour, height of spoil pile, height of tailings dam, pillar height
H pillar height, height of overburden
Fo original factor of safety
Fs factor of safety with applied superficial stress
B pillar breadth, bord width
C cohesion
Cn cohesion at failure
e extraction ratio
σσσσh horizontal stress component
σσσσv vertical stress component

12
σσσσn normal stress acting on pillar
σσσσ1 major principal stress
σσσσ2 intermediate principal stress
σσσσ3 minor principal stress
R pillar breath to width ratio
RL the stope span ratio, LB / LW
ρρρρ rock density
ρρρροοοο average density of overburden material
ρρρρs average density of spoil or tailings material
νννν Poisson’s ratio
εεεε strain
E Young’s modulus
LW maximum allowable stope span in direction of pillar width, W
LB stope span in direction of pillar breadth, B
Nc, Nq, Nγγγγ bearing capacity factors
qu foundation strength
k σh : σv
K The uniaxial compressive strength of a cubic metre of rock.
S swell factor, safety factor
γγγγ unit or specific weight
σσσσc uniaxial compressive strength of the intact rock
φφφφ angle of internal friction
µµµµ coefficient of friction
αααα pillar width coefficient
ββββ pillar height coefficient
θθθθ angle between σ1 and the vertical
ψψψψ pillar inclination with the vertical
ωωωω the angle between the pillar axis and σ1 (= θ + ψ)
P average pillar load
px x component of normal stress, σn, acting on pillar
py y component of normal stress, σn, acting on pillar
Ps uniaxial compressive strength of a slender pillar (w:h < 5)
ττττ shear stress acting on stope
m, s Hoek-Brown material constants
ΣΣΣΣ1, ΣΣΣΣ3 combination of major and minor principal stresses at failure

13
ΣΣΣΣn, normal stress at failure
Tn shear stress at failure
V volume of a pillar which is square in plan (= w2h)
Weff effective pillar width
W actual pillar width in direction of stope span, weight
w pillar width
Terminologyangle of internal friction
The angle, φ, between the axis of normal stress and the tangent to the Mohr envelope at a point
representing a given failure-to-stress condition for a solid material.
anisotropyState of different properties in different directions
bearing failureLoading which exceeds the pillar floor’s bearing capacity.
brittle materialMaterial whose ability to resist a load decreases with increasing deformation.
capacityIs the strength or resisting force of the structure.
cavingCaving, in the context of this study, has taken place when a large area underground has caved
in, for reasons other than block cavity or total extraction in coal mines.
chance, probability or likelihood of occurrenceThe number of times that a particular condition or situation can occur out of a total number of
occurrences.
coefficient of friction
A constant of proportionality, µ, relating the normal stress and the corresponding critical shear
stress at which sliding starts between two surfaces.

14
cohesionThe shear resistance at zero normal stress.
compression failureNormal forces exceeding the strength of the material.
compressive stressNormal stress tending to shorten the body in the direction in which it acts
consequenceThe degree of harm, the potential severity of the injuries or ill health and/or the number of people
potentially affected.
convergenceThe reduction of the distance between two parallel surfaces, usually the hangingwall and
footwall. It is similar to closure, but technically referring to the elastic component of closure.
demandIs the stress or disturbing force in a structure.
empiricalRelying or based on practical experience without reference to scientific principles.
failureThe condition in which the maximum strength of the material is exceeded or when the stress or
strain requirement of a specific design is exceeded.
fall of groundFall of a rock fragment or a portion of fractured rock mass without the simultaneous occurrence
of a seismic event.

15
fault tree techniqueIs a systematic method for acquiring information about a system. The information so gained can
be used in decision making. It can also be defined as a deductive failure analysis which focuses
on one particular undesired event and which provides a method for determining causes of this
event. The undesired event constitutes the top event in a fault tree diagram and generally
consists of a complete or catastrophic failure. Careful choice of the top event is important to the
success of the analysis.
field stressesThe stresses which exist in a rock mass before an excavation is made. At a distance sufficiently
far away from any underground excavation, the field stresses will be equal to the virgin stress.
geotechnical parametersThe parameters describing the technical response of geological materials.
hazard, cause, fault, threatSomething which has the potential to cause harm e.g. hangingwall, methods of work,
etc.
homogeneityThe state in which a material has the same properties at all points within itself.
isotropyThe state in which a material has the same properties in all directions
lithostatic stress fieldHydrostatic stress field in rock where the horizontal stress field equals the vertical stress field,
i.e. k = 1.
near surface miningMining at depths less than 100 m below surface.
“other” mining sectorAll mines other than gold, platinum and coal.
outcropThe exposure of the bedrock at the surface of the ground.
16
pillar workingsUnderground excavations separated by rock left in situ during the mining process to support the
local hangingwall, roof, or to provide regional stability to the mine or portion thereof.
plane strainState of strain within a body in which all the strain components normal to a certain plane are zero.
Poisson’s ratioThe ratio of shortening in the transverse direction to elongation in the direction of an applied
force in a body under tension below the proportional limited.
primary or top faultsAre primary categories in which the hazards to safety and health will be considered.
principal stressStress normal to one of three mutually perpendicular planes on which the shear stress at that
point in the body is zero.
riskIs the product of the probability of occurrence of a hazard and the effect or magnitude of the
damage that would be caused by the hazard.
rock massRock as it occurs in situ, including its structural discontinuities.
rock structureFractures in rock as a result of forces loading the rock beyond its elastic limit
shallow miningMining at depths less than 1000 m below surface.
shear failureFailure in shear when the forces parallel to a plane exceeds the strength of the material in that
direction

17
stabilityThe condition of a structure or a mass of material when it is able to support the applied stress
for a long time without suffering any significant deformation or movement that is not reversed by
the release of stress.
subsidenceDownward movement of the overburden (soil and/or rock) lying above an underground
excavation or adjoining a surface excavation.
topographyNatural or artificial features of a district.
transverse isotropyPlanes of different isotropy approximately parallel to each other. Media exhibiting transverse
isotropy include artificially laminated materials and stratified rocks, such as shales.
virgin stressAlso known as the primary state of stress. It is the stress in the rock mass before it is disturbed
by man-made works.
Young’s modulusModulus of elasticity, E.

18
1 IntroductionThe Safety in Mines Research Advisory Committee, SIMRAC, research project OTH 501 entitled
“Investigation of factors governing the stability/instability of stope panels in order to define a
suitable design methodology for near surface and shallow mining operations; and, influence of
surface topography on the loading of pillar workings and mine structures in near surface and
shallow mines”, was originally gazetted as two separate research projects. Due to the synergy
between the two projects, the SIMOT Committee requested that the two projects be combined.
This report covers the second part of the research topic and emphasises the influence of surface
topography on the loading of pillar workings in near surface and shallow mines.
1.1 Problem statement
Mining often takes place in areas with steep and variable surface topography. Variable surface
topography could be because of natural features such as valleys and hills, or man-made features
such as excavations caused by surface mining operations or surcharging by dumping of spoil
material or tailings from the metallurgical plant. The stability of underground excavations could
be adversely affected by the proximity of such topographical features, especially in near surface
mining operations of say less than 100 m below surface.
Variable topography can have a significant effect on the distribution of field stresses in the region
in which the underground mining takes place. Knowledge of the field stresses under influence
of surface topography and their potential influence on the stability of pillar workings and mine
structures are required to prevent failure.
The classification system used by the South African Mines Reportable Accident Statistics
System, SAMRASS, does not keep records of accidents caused by instability under the influence
of surface topography as such. Accidents of this nature would be classified under “Subsidence
or caving as a result of mining operations or other causes”. The number of incidents caused by
subsidence or caving as a result of mining operations or other causes are summarised in
Table 1.1. Statistics from the Gold and Platinum and Coal sectors are included for comparative
purposes.

19
Table 1.1 Number of incidents in the gold and platinum, coal, and other
sectors caused by subsidence or caving as a result of mining
operations or other causes.
YearGold &
PlatinumCoal Other Total
1988 23 4 3 30
1989 18 11 2 31
1990 3 2 3 8
1991 5 9 2 16
1992 2 7 2 11
1993 7 3 1 11
1994 12 2 5 19
1995 11 4 0 15
1996 22 10 2 34
1997 17 1 0 18
1998 12 1 1 14
1999 3 6 1 10
Eight of the above incidents resulted in accidents, injuring four people and killing six people. Five
of the six fatal accidents were in the “other” mining sector.
A risk assessment of the South African mining industry carried out in 1997, SIMRISK 401
(Gürtunca, 1997), and a review of fall of ground problems in the “other” mining sector, SIMRAC
Project No. OTH 411 (Joughin et al, 1998), did not identify the influence of varying surface
topography as a problem area. Thus, in terms of all the mining activities in the “other” mining
sector, the risk of pillar instability because of varying surface topography is considered low.
However, incidents of catastrophic pillar collapse in these situations have been recorded in the
past. It is also believed that other incidents of this nature could have occurred without being
recorded. Thus, although the frequency of pillar collapse due to the influence of surface
topography is relatively low, the consequence of such collapse represents a major threat to the
safety of workers.

20
In South Africa, and in the “other” mining sector in particular, relatively little mining has beencarried out in areas under influence of surface topography. Most near surface and shallow miningoperations that have been carried out under influence of natural surface topography, werecompleted many years ago. In addition, the geometry and scale of most man-made topographicalfeatures have been such that they had very little influence on the stability of undergroundoperations carried out in close proximity.
It is believed that this trend is changing and that, over the medium to long term, more small-scalemining operations will be carried out. Most of these mining activities will be at very shallowdepths, some of which could be influenced by topographical features. Virgin orebodiesoutcropping on surface will first be exploited by means of surface mining methods and will bemined to much greater depths than in the past before considering underground mining methods.Reasons for this opinion are:
• the South African government’s policy to encourage small-scale mining operations;• growth in the popularity of surface mining over the last few years owing to the efficiency
of surface mining equipment;• the success of surface mining operations in exploiting the outcropping parts of orebodies,
which was considered not feasible in the past;• the tendency for surface mines to mine to much greater depths before considering further
mining by means of underground methods, again owing to the developments in theefficiency of surface mining equipment.
It is therefore likely that more shallow underground mining operations would be carried out inmountainous areas, or areas in close proximity to man-made topographical features. Also, whenunderground mining is carried out in areas influenced by surface topography, the influence couldbe significant and the risk of catastrophic failure higher than in the past. (More mining in veryshallow areas of less than 50 m below surface, and mining below existing open pit mines thatarea deeper than in the past.)
Perhaps the biggest hazard concerning the influence of surface topography on the loading ofpillar workings in near surface and shallow mines, is incorrect pillar design. This also includesthe identification of the critical areas under influence of topographical features and considerationof failure mechanisms not necessarily considered under normal conditions. From discussionswith some on-mine rock mechanics practitioners and back-analysis of a pillar collapse on onemine, there appears to be a lack of understanding of, and ignorance of, the actual loadingmechanism. Standard pillar design techniques are not applicable in such areas of variable stressand a rational pillar design method is therefore required for such situations.

21
Against this background, the specific problem that will be focussed upon in this study is the
influence of varying surface topography on field stresses (magnitude and orientation) and the
influence of varying stress conditions on the stability of pillars in close proximity to highly variable
surface topography. Consideration of the critical factors identified in the study will improve the
design of stable pillar systems, which are required to alleviate the hazard of catastrophic pillar
collapse in areas under the influence of varying surface topography.
1.2 Objectives of this study
1.2.1 Main objective
The main objective of this part of the research project is to quantify the influence of surface
topography on the stability of pillars and to describe a design methodology for pillars in areas of
variable surface topography. Surface topography should include natural topography such as
valleys and mountains, and man-made topography as a result of surface mines, spoil piles and
tailings dams. The design methodology should be simple in order to assist rock mechanics
practitioners and mine managers in identifying and quantifying the critical factors influencing the
stability of pillars in areas of highly variable surface topography.
1.2.2 Secondary objectives
The secondary objectives of the research project are as follows:
• Review relevant literature on pillar design and the influence of surface topography on field
stresses;
• Visit selected mines to obtain information on pillar collapses as a result of surface topography
and to discuss design considerations for pillars under influence of varying surface
topography;
• Identify hazards and assess the risks associated with the influence of surface topography on
the loading of pillars;
• Carry out sensitivity analyses of the effects of variable topography, natural and man-made,
on pillar stability;
• Compile a final report and recommendations;
• Transfer of knowledge through workshops.

22
1.3 Research methodology
1.3.1 Research context
The research is aimed at quantifying the influence of varying surface topography on the field
stresses and quantifying the influence of varying field stresses on pillar stability in order to
develop a simple design methodology for stable pillars under these conditions.
Pillar design has been the topic of many research projects in the past and it is not intended to
repeat any of that work. However, pertinent aspects of pillar design methodologies being used
by the “other” mining sector are summarised and potential shortcomings are highlighted.
1.3.2 Research approach
Literature evaluation
A critical literature review pertaining to the influence of variable surface topography on field
stresses (magnitude and orientation) is presented in Section 2 of the report. The focus is on
identifying the key aspects influencing the field stresses and the sensitivity of field stresses to
changes in the key aspects.
Also included in Section 2 is a literature review of pillar design methodologies being used by
mines in the “other” mining sector. The focus is on pillar design for shallow mines in hard rock
material and the potential shortcomings of these methods.
Data collection from selected mines
Mines with topographical features relevant to this study were identified and visited during the
second part of this study. The aim was to visit areas under influence of surface topography and
to assess the influence of varying surface topography on the stability of pillar workings and mine
structures. The opinions of mine rock mechanics personnel on the design of pillar workings under
these conditions were also elicited during the mine visits. This part of the study is summarised
in Section 3.
Risk assessment
Information obtained from SAMRASS records, the literature survey carried out, and the
information obtained during visits to selected mines were used to identify hazards and assess
the risks relevant to the stability of pillar workings under influence of surface topography. The risk
assessment part of the study is discussed in Section 4.

23
Procedures for the design of pillars in areas of variable topography
A procedure for the design of pillars in areas of variable topography caused by surcharging is
described in Section 5. This method considers the ratio of the factor of safety with the applied
superficial stress to the original factor of safety.
The procedure for the design of pillars in areas of variable topography due to natural causes and
man-made openings is described in Section 6. Aspects such as the gathering and interpretation
of geotechnical parameters, definition of the surface topography and knowledge of the horizontal
to vertical stress ratio were considered.
The field stresses (magnitude and direction) under influence of different topographical features
were then determined by means of numerical analyses. Information obtained from the analyses
was then used to compile contour diagrams of the major and minor principal stresses as well as
the major principal stress orientation.
Thereafter, the required pillar dimensions and extraction ratio to prevent potential pillar failure
in compression or shear, or bearing failure of pillar foundations were determined.
Validation of proposed design methodology by means of back analysis
Back analyses of incidents of pillar stability/instability under the influence of surface topography
were carried out to validate the proposed procedure for the design of pillars in areas of variable
topography. This work is described in Section 7 of the report.

24
2 Literature evaluationLiterature pertaining to the influence of variable surface topography on field stresses, and pillar
design methodologies is evaluated in this section. The aim of the literature evaluation is to:
• identify the areas influenced by the geometry of the topography;
• ascertain the influence of varying topography on field stresses in terms of magnitude and
direction;
• ascertain the sensitivity of field stresses to changes in the geometry of the topography;
• review existing pillar design methodologies applicable to hard rock mines;
• identify potential shortcomings in existing pillar design methodologies;
• identify key hazards associated with the influence of surface topography on shallow
underground workings.
An assessment of the literature and the influence of the literature on the research are shown in
table format.
2.1 The influence of natural surface topography on thestability of underground excavations
Kirsten (1974) investigated an instantaneous collapse of the hangingwall of a shallow chrome
mine in a mountainous area, which occurred during the rainy season of 1972/3. This is the only
known report describing an incident of underground instability under the influence of surface
topography in South Africa.
The collapse was accompanied by crushing of the supporting pillars and by displacements of the
collapsed mass of rock which gave rise to cracks approximately 0,5 m wide on surface, running
along the predominant joint planes and scarp faces. A spatial relationship between the surface
cracks and the damage underground was observed to exist. An area of approximately 380 m x
180 m with a vertical thickness varying between approximately 15 m and 170 m was affected by
the unstable movement. This involved a mass of rock of about 13 million tons. The unstable
movement manifested itself underground in both stope convergence and stope ride. Before the
fall, the mine was relatively free of water. However, immediately afterwards, water had to be
pumped from the affected area at a rate of 25 m3/h.
Movement of the hangingwall rock downward into a stope in a semi-infinite expanse of rock is
inhibited by the development of frictional resistance deriving from the horizontal rock stresses

25
on the joints. The area where the collapse occurred could be considered having one lateral
boundary open to the atmosphere in contrast to this situation. Therefore, instead of the vertical
joints being subjected to compressive stresses, they were largely under tension, which tended
to open them up. As a result, the jointed hangingwall behaved as an assembly of loosely packed
blocks under the action of gravity. Kirsten (1974) back-analysed the observation of this behaviour
and subsequent collapse in two dimensions using a base friction model.
In building the model, Kirsten (1974) assumed that:
• the shorter span constitutes the main direction in which the hangingwall sheds its load;
• joints are persistent on surface, therefore, 100 percent continuity was assumed for all the
joints.
Some of the observations and conclusions drawn by Kirsten (1974) were:• Hangingwall and pillar convergence occurred in the zone of maximum overburden.• Down dip ride of hangingwall was evident.• Tensile openings of vertical joints occurred towards the open side of the model. These
openings were a maximum at the surface and decreased downwards towards the stope.• Joint displacements were mainly confined towards to the hangingwall above the stope.• Vertical joint opening was more pronounced when pillar spacing increased.• Up dip ride occurred closer to the outcrop when pillars spacing was increased.• With very large pillar spacings, some elements close to the outcrop converged into the stope.• Stope closure was observed to increase away from the stope face.• Pillars close to the face were relatively intact and the hangingwall convergence minimal.• The down dip ride effectively weakened the pillars in the models considered. This would be
true in the case of chromitite ore which is known to lose its strength very rapidly undersustained deformation in the work softening range of its stress-strain characteristic.
• The size of pillars should increase with depth of overburden and should be designed to carrythe load tributary to the pillar.
• Due cognisance should be given to the shear rigidity of pillars, so as not to have them subjectto an undue rolling action, however small this may be. Failure of pillars gives rise toexcessive shearing loads on the joints in the hangingwall.
• The presence of cleft water pressure in the tension joints would aggravate a potentiallyunstable situation. It might be necessary to consider the installation of drainage galleries inthe hangingwall above the mine workings and ahead of it.
Kirsten (1974) concluded that the field and model observations corresponded well and that afundamental understanding of the kinematic behaviour of the jointed hangingwall was reachedby application of the base friction technique.

26
The base friction model used to simulate the collapse, although its similitude is questionable,
highlighted several important aspects that should be considered during the design of shallow
underground workings under influence of surface topography. What is clear from this work
is that the stress regime played a significant role in the collapse. It is therefore important that
the influence of surface topography on field stresses should be quantified in terms of
magnitude and orientation, and that the stability of underground excavations under influence
of varying field stresses should be studied in more detail.
Potential pillar failure in shear should also be considered. The description of the pillar collapse
could be used to validate the required design methodology through back analysis.
The influence of groundwater on the stability of underground workings should not be ignored.
Water pressure reduces the stability by reducing the shear strength of potential failure
surfaces. High moisture content could result in an increased unit weight of the rock and
accelerated weathering, with a resultant decrease in stability.
In a paper by Pan et al (1994:293), the effect of topography and rock mass anisotropy on
gravitational stresses in long anisotropic and isolated symmetric ridges and valleys is modelled
using an analytical method proposed by Pan and Amadei (1994:97). The rock mass is modelled
as a linearly elastic, transversely isotropic and homogeneous continuum, which deforms under
a condition of plane strain. A parametric study is presented on the combined effect of
topography, orientation of anisotropy and degree of anisotropy on the magnitude and distribution
of gravitational stresses in transversely isotropic rock masses with planes of anisotropy striking
parallel to the ridge or valley axis.
It is found that:
• the topography can have a major effect on the magnitude and distribution of stresses insitu;
• the magnitude and distribution of gravitational stresses in ridges and valleys depend on:• the ridge and valley geometry;• the orientation of the anisotropy with respect to the ridge and valley axis;• the degree of anisotropy.• non-zero horizontal compressive stresses exceeding the vertical stress develop at and near
ridge crests• horizontal tensile stresses develop under valleys;• the tensile region at the valley bottom increases as the valley broadens;

27
• the tensile region at the valley bottom decreases as the Poisson’s ratio increases andcompletely vanishes for ν = 0,35 for all dip angles;
• horizontal compressive stresses in ridge crests decrease and the horizontal tensilestresses in valleys become more compressive with increasing Poisson’s ratio;
• at the ground surface, principal stresses are parallel and perpendicular to the topography;• with depth, the principal stresses turn and approach the same direction as when the ground
surface is horizontal;• the topography affects gravitational stress distributions even in areas of low regional
slopes;• the magnitude of horizontal stresses in transversely isotropic ridges and valleys depends
strongly on the rock’s elastic properties and the orientation of the rock mass fabric withrespect to the ground surface;
• horizontal stress is the greatest for ridges and valleys with horizontal planes of transverseisotropy and the smallest for ridges and valleys with vertical planes of transverse isotropy;
• for valleys in rock masses with horizontal planes of transverse isotropy, the tensile regionat the bottom of the valleys decreases as the ratio of horizontal to vertical moduli increases;
• the location where the stress maximum is reached on the sides of the ridge moves furtheraway from the ridge axis as the topographic ratio increases, or in other words, as the ridgebroadens;
• broader ridges and valleys affect the stress field to a greater depth and to a wider area asexpected;
• for a given ridge geometry, the effect of the topography on the stresses at depth isstrongest for ridges and valleys in rock masses with vertical planes of transverse isotropy.
The analytical method used and parametric study carried out covers a wide range of variablesand emphasises the effect of rock mass anisotropy on gravitational stresses. Unfortunately,varying boundary conditions, which could have a significant effect on gravitational stresses,were not considered.
Wittke (1990) stated that, when the ground surface is not horizontal, the in situ stresses cannotbe presented analytically, even when the rock mass behaves elastically. Instead, finite elementanalyses should be carried out. He used a two-dimensional, elastic, finite element program todemonstrate the influence of topography. The model represented a symmetric series of hills andvalleys with infinite length. A cross section through the hills and valleys, bounded by two planesof symmetry, was modelled. The planes of symmetry were taken along the trough of a valley andalong the crest of an adjacent hill. Using this model, he confirmed that the major principal stress,near the ground surface, runs approximately parallel to the slope of the ground surface. Only at
28
a considerable distance from the slope or at great depth does this stress act vertically andincrease with depth.
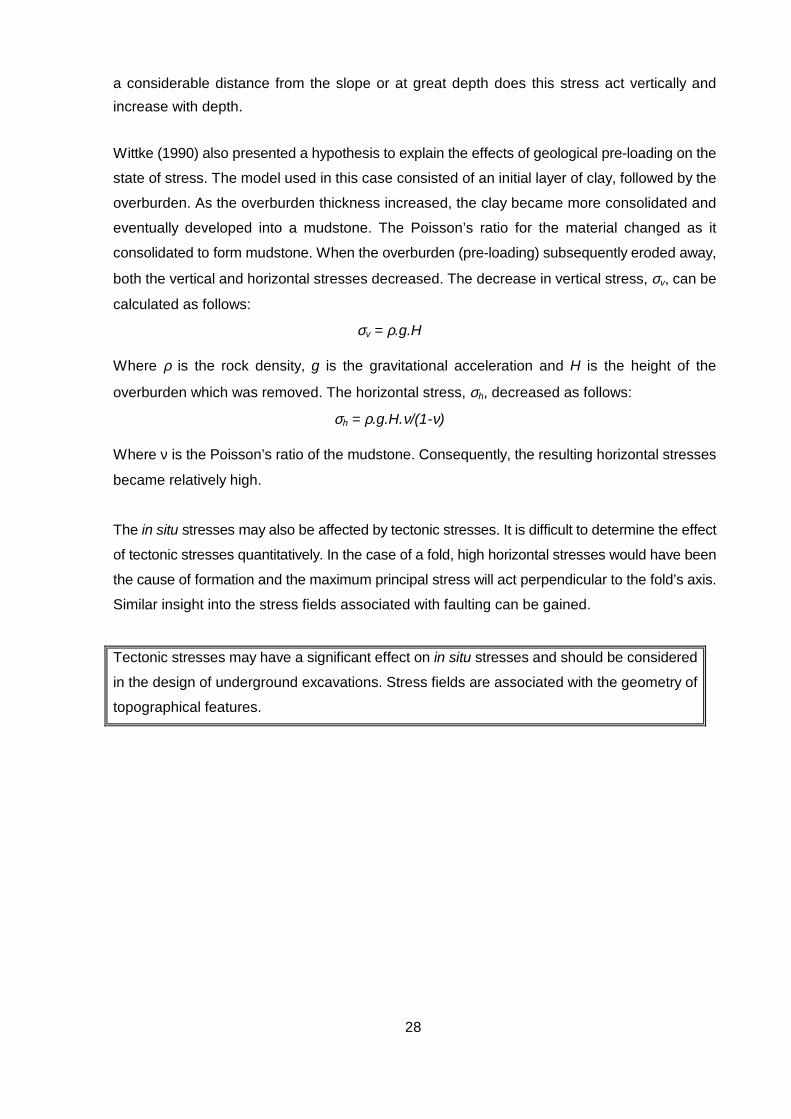
Wittke (1990) also presented a hypothesis to explain the effects of geological pre-loading on the
state of stress. The model used in this case consisted of an initial layer of clay, followed by the
overburden. As the overburden thickness increased, the clay became more consolidated and
eventually developed into a mudstone. The Poisson’s ratio for the material changed as it
consolidated to form mudstone. When the overburden (pre-loading) subsequently eroded away,
both the vertical and horizontal stresses decreased. The decrease in vertical stress, σv, can be
calculated as follows:
σv = ρ.g.H
Where ρ is the rock density, g is the gravitational acceleration and H is the height of the
overburden which was removed. The horizontal stress, σh, decreased as follows:
σh = ρ.g.H.ν/(1-ν)
Where ν is the Poisson’s ratio of the mudstone. Consequently, the resulting horizontal stresses
became relatively high.
The in situ stresses may also be affected by tectonic stresses. It is difficult to determine the effect
of tectonic stresses quantitatively. In the case of a fold, high horizontal stresses would have been
the cause of formation and the maximum principal stress will act perpendicular to the fold’s axis.
Similar insight into the stress fields associated with faulting can be gained.
Tectonic stresses may have a significant effect on in situ stresses and should be considered
in the design of underground excavations. Stress fields are associated with the geometry of
topographical features.

29
2.2 The influence of man-made topography on the stabilityof underground excavations
Man-made topographical features could be caused by surface mining such as open pit and strip
mining operations (Section 2.2.1), or surcharging by dumping of spoil material or tailings from
the metallurgical plant (Section 2.2.2).
2.2.1 Man-made features such as excavations caused by surface
mining
Jones (1986) describes the geotechnical interactions occurring between relatively shallow
quarrying and underground mining operations by means of two case histories. Although the
intervening vertical distance between the quarry floors and the underground workings differed
from less than 20 m to more than 1100 m, sinkholes were a common occurrence in both cases.
Underground mining had been the common denominator in the promotion of unstable ground
conditions in both cases. The vertical distances between the underground workings and the
quarry floors neither modifies the responsible failure mechanism nor necessarily influences the
intensity of surface instability. Rather, the influencing parameters are the character of the
geological profile intervening between the quarries and the underground workings and local
hydrogeological conditions.

30
In the case studies described by the author, the surface topography was changed by
quarrying above old underground workings. Although the quarries did not have a direct
influence on the stability of the underground workings, they allowed water to pond on the
quarry floors. Interaction between the surface and underground excavations occurred through
sinkholes, sometimes known as chimney caves. Water percolating through discontinuities in
the rock mass was the disturbing agent, causing collapse of the underground excavation by
reducing the soil strength or by washing out critical keying or binding material. This
mechanism was also postulated as a potential cause of the mudrush accident at Rovic
Diamond Mine in 1997 where 20 people were killed.
Therefore, surface drainage systems should be designed so that water cannot accumulate
at the bottom of valleys or excavations created by surface mining methods in close proximity
to underground excavations. Care should also be taken that the rock mass forming the
middling between any surface mine and underground excavation is not susceptible to
weathering caused by water.
Thompson et al (1993) describe the instrumentation for monitoring an underground mine below
an open pit mine in order to gain a better understanding of the failure mechanisms involved. The
results from the monitoring concurred with numerical modelling results and established local and
regional failure mechanisms with greater certainty.
Stress measurements indicated that the principal stresses are roughly orthogonal with the plane
of the reef, with the maximum principal stress being oriented down dip. Displacement monitoring
showed that the zone of movement and the patterns of movement between the pit and
underground were consistent with the results of numerical modelling. Shear on weak bedding
planes in the stope hangingwall due to mining of both the underground and the open pit, and
subsidence at the toe of the overlying highwall due to underground mining, were two of the failure
mechanisms observed.
Backfill was used successfully to control large scale shear movement in the hangingwall of the
stope and to increase the extraction ratio significantly.
31
Monitoring results are important for improving and modifying designs based on numerical
modelling. Monitoring also improves the confidence for using numerical models in future
design. Large scale shear movement in the hangingwall of the stope could be caused by in
situ stress conditions and the proximity of an open pit mine. Backfill should be considered as
a means of improving stability and the extraction ratio where high shear movement is
expected.
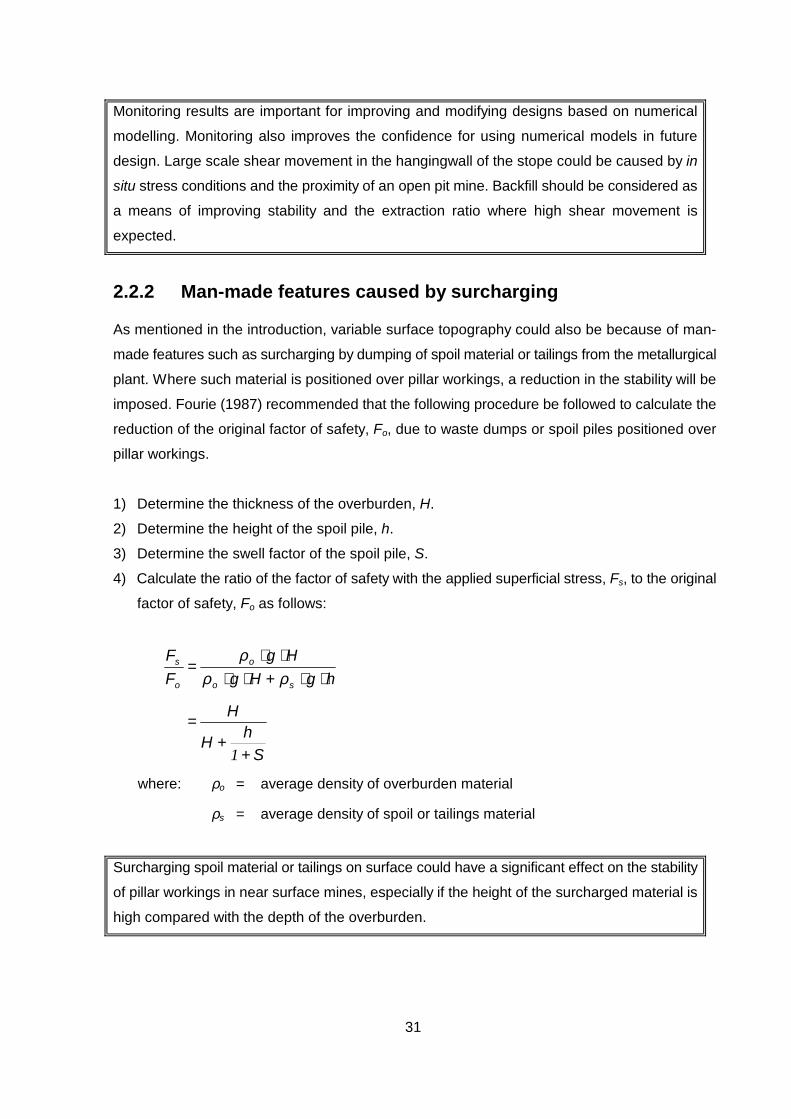
2.2.2 Man-made features caused by surcharging
As mentioned in the introduction, variable surface topography could also be because of man-
made features such as surcharging by dumping of spoil material or tailings from the metallurgical
plant. Where such material is positioned over pillar workings, a reduction in the stability will be
imposed. Fourie (1987) recommended that the following procedure be followed to calculate the
reduction of the original factor of safety, Fo, due to waste dumps or spoil piles positioned over
pillar workings.
1) Determine the thickness of the overburden, H.
2) Determine the height of the spoil pile, h.
3) Determine the swell factor of the spoil pile, S.
4) Calculate the ratio of the factor of safety with the applied superficial stress, Fs, to the original
factor of safety, Fo as follows:
ShH
H
hgHgHg
FF
so
o
o
s
++
=
⋅⋅+⋅⋅⋅⋅
=
1
ρρρ
where: ρo = average density of overburden material
ρs = average density of spoil or tailings material
Surcharging spoil material or tailings on surface could have a significant effect on the stability
of pillar workings in near surface mines, especially if the height of the surcharged material is
high compared with the depth of the overburden.

32
2.3 Pillar design methodologies being used in the “other”mining sector
Pillar design has been the topic of many research projects in the past and it is not intended to
repeat any of the work. However, pertinent aspects of pillar design methodologies being used
by near surface mines in the “other” mining sector are summarised and potential shortcomings
are highlighted in this section.
All mines considered as part of this study, and most of the other mines in the “other” mining
sector only use stable pillars. Yield and crush pillars are being considered for the deeper parts
of some of the mines, but have not been implemented yet. Also, squat pillars with a width to
height ratio greater than five are only used in exceptional cases. It was therefore considered
appropriate to limit this part of the study to the design of stable pillars with a width to height ratio
less than five.
In this regard, the design approaches used by Salamon and Munro (1967) and Hedley and Grant
(1972) form the basis of most pillar designs being used in the “other” mining sector. These
design methodologies are summarised in Appendix A.
The Salamon and Munro (1967) design procedure was the most rigorous and thorough back-
analysis of in situ data at the time.
Very few in situ back analyses of pillar strength measurements have been performed in hard
rock environments. Of these, the Hedley and Grant (1972) method appears to be the most
applicable. However, due to the limitations in the data and the concomitant limitations in the
analysis procedure, the applicability of their results to other hard rock mining environments
is unproven.
None of the design methodologies investigated consider shear failure as the dominant failure
mechanism. As shown in Section 6 of this report, shear failure, as opposed to failure due to
normal stresses becomes the dominant failure mechanism for pillars in mines close to surface
and under influence of surface topography.
Most pillar design work carried out in the “other” mining sector only considers mean, or
expected values of load and strength, pillar dimensions, rock strengths and other design
variables. The exponents used to calculate pillar strengths are normally based on the

33
exponents used by Hedley and Grant (1972). This approach is only acceptable when mining
continues under conditions where sufficient experience has been gained and where
conditions correspond with those existing at the time of developing the Hedley and Grant pillar
formula.
When mining under different conditions, the chance of calculating pillar strengths incorrectly
is high when applying the Hedley formula rigidly. It is therefore recommended that sufficient
back-analyses, based on the work of Salamon and Munro, be carried out in order to determine
exponents for the pillar formula based on local conditions. Alternatively, a probabilistic
approach considering variation in pillar geometries and geotechnical parameters should be
used.
2.4 The influence of underground excavations on thestability of surface topography
Some mines in the “other” mining sector experience problems due to the influence of old
underground excavations on the stability of slopes created by surface mining operations.
However, studying the influence of underground excavations on the stability of surface
topography is beyond the scope of this project. In this regard, readers are referred to work carried
out by the following authors: Singh and Singh (1992), Fourie (1987).

34
3 Data collection from selected minesThe following mines with topographical features were identified and visited during the second
part of the study:
• Eastern Chrome Mines;
• Dilokong Mine;
• Finsch Mine;
• Rosh Pinah Mine;
• Premier Mine;
• Black Mountain Mine;
• Thabazimbi Mine.
The aim was to visit areas under influence of topography and to assess the influence of varying
surface topography on the stability of pillar workings and mine structures. The opinions of mine
rock mechanics personnel on the design of pillar workings under these conditions were also
elicited during the mine visits.
Of the mines visited, Finsch, Premier and Thabazimbi mines are mining under the influence of
man-made surface topography in the form of open pits. In general, these mines have taken very
little cognisance of the effects of surface topography on the design of underground excavations.
Some, however, have used two- and three dimensional stress analyses to account for the effects
of open pit mining on the workings below. These models have been calibrated using in situ stress
and deformation measurements. The observed effects of the open pits on underground workings
are limited to the opening of joints in some tunnels very close to the open pit. At least one of the
mines was convinced that the influence of underground mining on the stability of the open pit
slope was more pronounced than the influence of the open pit mining on the stability of the
underground workings.
Rosh Pinah, Black Mountain, Dilokong and Eastern Chrome mines are mining under the
influence of natural topography. Except for considering the vertical depth below surface, not one
of these mines has considered the effects of topography during the pillar design.
Pillar designs in areas close to surface are normally based on the tributary area theory to
calculate pillar stresses, and the Hedley and Grant (1972) approach to the calculation of pillar
strengths. Relatively high safety factors are normally used, mainly because of concern about
weathering and the stability of the stope spans. On one of the mines visited, an instantaneous

35
collapse occurred close to surface during the rainy season of 1972/73. Although this area is not
accessible, valuable information could be obtained from the investigations carried out by Kirsten
(1974) and Ortlepp (1998). According to these investigations, the collapse occurred due to pillar
failure in an area close to surface, and surface topography contributed significantly to adverse
loading of the pillars. This collapse is discussed in more detail in Sections 2.1 and 7 of this
report.

36
4 Risk assessment
4.1 Introduction
A risk assessment of the South African mining industry carried out in 1997, SIMRISK 401
(Gürtunca, 1997), and a review of fall of ground problems in the “other” mining sector, SIMRAC
Project No. OTH 411 (Joughin et al, 1998), did not identify the influence of varying surface
topography as a problem area. Thus, in terms of all the mining activities in the “other” mining
sector, the risk of pillar instability because of varying surface topography is considered low. As
discussed before, one of the reasons is that very little mining has been carried out under these
conditions.
In the risk assessment carried out as part of this study, it is shown that, although the risks
associated with varying topography are considered low in terms of the South African mining
industry, the risk of a regional collapse in a mine under influence of surface topography could be
high should pertinent aspects such as the loading conditions and failure mechanism be assessed
incorrectly.
4.2 Fault-event tree analysis approach to risk assessment
The risks associated with the influence of surface topography on pillar workings were assessed
during two one-day workshops. The workshops were attended by SRK in-house expertise as well
as two rock engineering consultants from the mining industry. The risk assessment was based
on the fault-event tree analysis technique described in Appendix B. This approach was used in
order to obtain a better understanding of the influence of surface topography on pillar stability
and the associated risks.
First, the hazards associated with pillar collapses due to the influence of topography were
identified using the information obtained from the literature survey, site visits and personal
experience. The hazards were then analysed systematically to form a cause tree. Probabilities
of occurrences were then allocated based on a judgemental basis to form a fault tree as shown
in Appendix C.
Identified hazards pertinent to this study are:
• deterioration of pillar and hangingwall rock on exposure (e.g. weathering);
• weak intact pillar and hangingwall rock;
• adverse parting planes in pillar and hangingwall;

37
• adverse jointing in pillar and hangingwall;
• deficient pillar and hangingwall material due to adverse groundwater;
• incorrect assessment of ground conditions;
• incorrect assessment of loading conditions;
• incorrect assessment of failure mechanism;
• design parameters selected incorrectly;
• in situ stress adversely high due to topography (tectonics, etc.);
• in situ stress adversely low due to proximity to surface.
The risks associated with a regional collapse depend on factors such as the size of the collapse
and the probability of people being exposed to the collapse. These factors vary from mine to
mine and cannot be assessed on an industry basis. However, if it is assumed that the size of
the collapse, and the number of people being exposed are the same, should a regional collapse
occur, the risks associated with certain secondary and tertiary faults can be assessed.
4.3 Conclusions
The identified hazards can be grouped into the following main categories:
• inadequate pillar geometry, mainly because of inappropriate pillar design;
• adverse loading conditions (stress field), mainly because of the proximity to surface;
• deficient pillar material strength, mainly because of weathering, adverse jointing, etc.
Deficient pillar material strength, however, is not a function of surface topography per se.
Therefore, the focus of this report is the influence of variable topography on field stresses and
the effect on pillar stability. Considering the critical hazards identified in the risk assessment,
design methodologies are proposed, which will alleviate the hazard of pillar collapse due to the
influence of surface topography.
The procedure for the design of pillars in areas of variable topography caused by surcharging
is described in Section 5 of this report. The procedure for the design of pillars in areas of variable
topography caused by natural features or man-made excavations is described in Section 6 of this
report.

38
5 Procedure for the design of pillars in areas ofvariable topography caused by surcharging
The design of pillars in areas of variable topography caused by surcharging spoil material or
tailings is adequately described by Fourie (1987). The design procedure can be summarised as
follows:
1) Calculate the pillar strength.
2) Determine the average pillar stress.
3) Calculate the original factor of safety, Fo, where:
stresspillaraveragestrengthpillar
Fo =
4) Determine the thickness of the overburden, H.
5) Determine the height of the spoil pile or tailings dam, h.
6) Determine the swell factor of the spoil pile or tailings dam, S.
7) Calculate the ratio of the factor of safety with the applied superficial stress, Fs, to the original
factor of safety, Fo as follows:
ShH
H
hgHgHg
FF
so
o
o
s
++
=
⋅⋅+⋅⋅⋅⋅
=
1
ρρρ
where: ρo = average density of overburden material
ρs = average density of spoil or tailings material
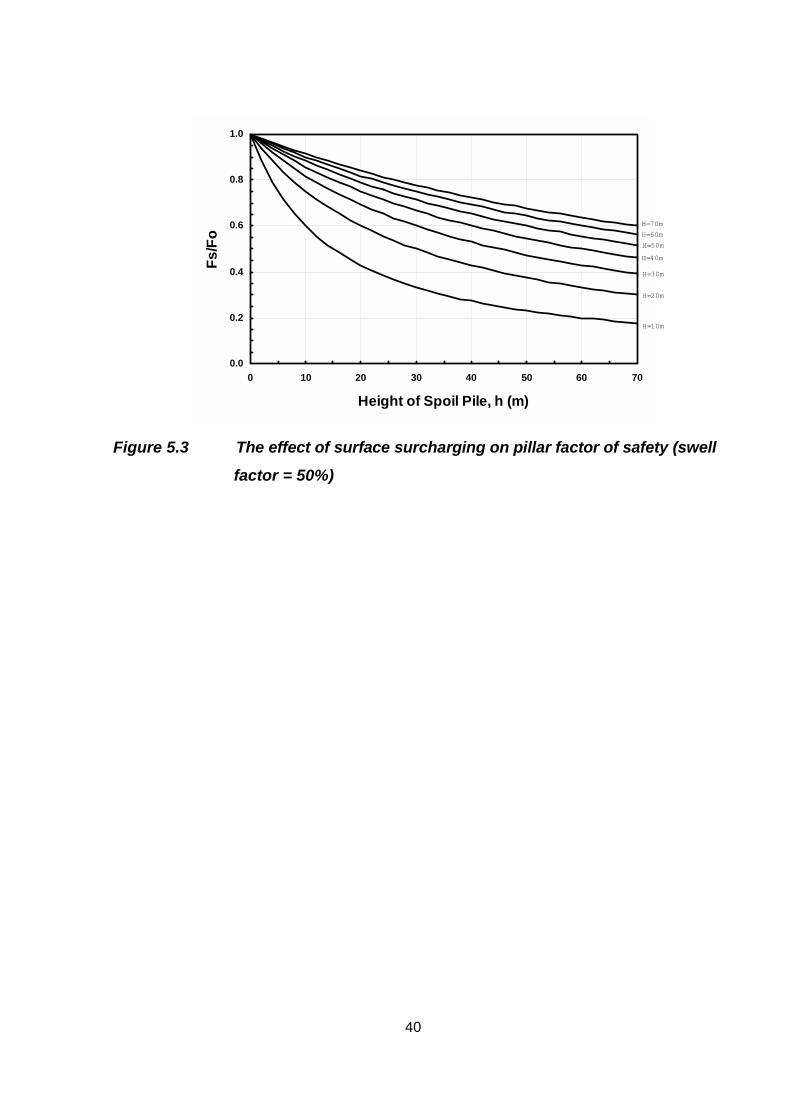
Alternative, the ratio Fs /Fo can be read from one of the following graphs.

39
Figure 5.1 The effect of surface surcharging on pillar factor of safety (swell
factor = 30%)
Figure 5.2 The effect of surface surcharging on pillar factor of safety (swell
factor = 40%)
0.0
0.2
0.4
0.6
0.8
1.0
0 10 20 30 40 50 60 70
Height of Spoil Pile, h (m)
H=10m
H=20m
H=70m
H=40m
H=50m
H=60m
H=30m
Fs/F
o
0.0
0.2
0.4
0.6
0.8
1.0
0 10 20 30 40 50 60 70
Height of Spoil Pile, h (m)
H=10m
H=20m
H=70m
H=40m
H=50m
H=60m
H=30m
Fs/F
o
0.0
0.2
0.4
0.6
0.8
1.0
0 10 20 30 40 50 60 70
Height of Spoil Pile, h (m)
H=10m
H=20m
H=70m
H=40m
H=50m
H=60m
H=30m
Fs/F
o
40
Figure 5.3 The effect of surface surcharging on pillar factor of safety (swell
factor = 50%)
0.0
0.2
0.4
0.6
0.8
1.0
0 10 20 30 40 50 60 70
Height of Spoil Pile, h (m)
H=10m
H=20m
H=70m
H=40m
H=50m
H=60m
H=30m
Fs/F
o

41
6 Procedure for the design of pillars in areas ofvariable topography caused by natural features orman-made excavations
6.1 Description of pillar design methodology
The design methodology developed is based on the design concepts proposed by Stacey and
Page (1986). The methodology is detailed in Figure 6.1 with the basic concepts as follows:
• Engineering GeologyGather as much information as possible on the stratigraphy, major geological structures,
ubiquitous joint sets, groundwater and rock mass stiffness as would normally be required for
the level of the study being conducted.
• Structural complexity of the surrounding rock massEstablish whether the rock mass surrounding the proposed excavation may be regarded as
being structurally complex due to folding or faults, variable stratigraphy or due to any other
reasons. If the surrounding rock mass may be considered homogeneous or at least
approximately so, the design methodology proposed is applicable. If the surrounding rock
mass is structurally complex, a site specific design will be required with additional effort in
modelling the effects of the structural complexities on the stress state before and after
excavation.
• Rock mass rating and strength and deformation parametersFor a rock mass that may be considered homogeneous or at least approximately so, a rating
is determined for the rock mass and orebody using a standard rock mass classification
system.
The ratings obtained are then used to calculate the strength and deformational parameters
for the rock mass and orebody. These are required to carry out numerical analyses using a
finite element program such as Phase2, and for design of the pillars.

42
• Surface topography and horizontal to vertical stress ratioThe surface topography of a typical cross-section through the proposed mine, as well as the
horizontal to vertical stress ratio are established for numerical modelling purposes.
• Design charts of principal stresses and principal stress orientationThe results obtained from numerical modelling are subsequently used to compile contour
diagrams of the major and minor principal stresses, as well as of the angle, θ, between the
major principal stress, σ1, and the vertical.
• Maximum allowable extraction ratioThe maximum allowable extraction ratio is calculated using the following information:
- Design charts of principal stresses and principal stress orientation
- Maximum allowable stable stope span
- Type of pillar required
- Pillar constants, α and β
The financial viability of the mining operation at this extraction ratio is determined at this
stage before any further calculations are carried out, in order to prevent unnecessary work.
• Bearing failure of hanging- or footwallFinally, the potential for bearing failure of the hanging- and footwall is assessed using the
calculated pillar width and the strength parameters for the hanging- and footwall respectively.

Fig
ENGINEERING GEOLOGYStratigraphy
Major geological structuresUbiquitous joint sets
GroundwaterRock mass stiffness
Is the surroundingrock mass structurallycomplex because of:• folding or faults?• variable stratigraphy?• any other reasons?
Is the surroundingrock mass intact/massive
or does it have three or morejoint sets, i.e. can it be
considered to behomogeneous or at least
approximately so?
Determine a rating for the surroundingrock mass and the orebody using a
rock mass classification system
Establish surface topography overlyingunderground workings
Determine the horizontal to verticalstress ratio, i.e.
K = σσ /σσ
ure 6.1 Flowch
σσh σσv
Cs
Reduce extraction ratio, e
C
Determine deformational parametersfor the surrounding rock mass and
the orebody, i.e. E and νν
ννD
Princip
Stress orientation, θθθθ
etermine the principal stresses andstress orientation at position of
proposed underground workings
Consider changes in stope
alculate / select a maximum allowabletable stope span, L , and pillar height, WH
C
S
C
layout, LW, and H
alculate / assume pillar constants,
art o
Bearingo
Is the mfinanci
extra
Design charts
al stresses, σσσσ1 and σσσσ2
43
f pillar design m
αααα and ββββ
failure of hanging-r footwall?
ining operationally viable at thisction ratio, e?
MINING NOT FEASIBLE
PILLAR DESIGN
COMPLETE
alculate the allowable extraction ratio,e, for a pillar
elect a suitable stress-to-strengthratio, SSR
alculate the pillar width, W, for theabove extraction ratio
SITE SPECIFIC DESIGN
YesNo
ethodo
No
No
Yes
Yes
No
Yes
Yes
No
logy
44
σ1
σ3
px
py
τ
σn
O
AB
θ
θ
ω
ψ
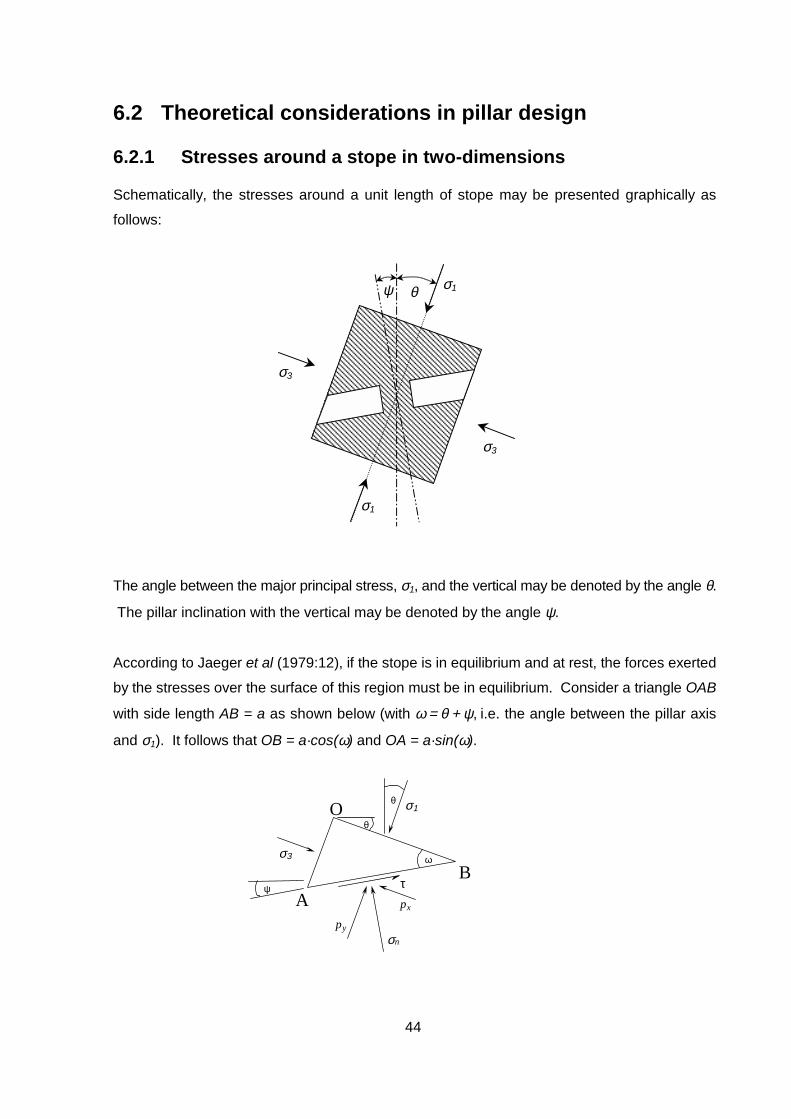
6.2 Theoretical considerations in pillar design
6.2.1 Stresses around a stope in two-dimensions
Schematically, the stresses around a unit length of stope may be presented graphically as
follows:
The angle between the major principal stress, σ1, and the vertical may be denoted by the angle θ.
The pillar inclination with the vertical may be denoted by the angle ψ.
According to Jaeger et al (1979:12), if the stope is in equilibrium and at rest, the forces exerted
by the stresses over the surface of this region must be in equilibrium. Consider a triangle OAB
with side length AB = a as shown below (with ω = θ + ψ, i.e. the angle between the pillar axis
and σ1). It follows that OB = a·cos(ω) and OA = a·sin(ω).
σ3
σ3
θ σ1ψ
σ1

45
Next, the components px and py of the stress vector normal to AB, inclined at θ to OA, need to
be determined.
Resolving forces parallel to OB, we have:
OApAB 3x ⋅=⋅ σ (1)
Rewriting Equation (1) in terms of pz, we find:
)sin(p 3x ωσ ⋅= (2)
Similarly, resolving forces parallel to OA, we have:
OBpAB 1y ⋅=⋅ σ (3)
Rewriting Equation (3) in terms of py, we find:
)cos(p 1y ωσ ⋅= (4)
It therefore follows that the normal stress acting on the pillar, σn, is given by the following
expression:
)sin(p)cos(p xyn ωωσ ⋅+⋅= (5)
Substituting for px and py in Equation (5), the following expression for σn is obtained:
)(sin)(cos 23
21n ωσωσσ ⋅+⋅= (6)
The shear stress acting on the pillar, τ, is given by the following expression:
)cos(p)sin(p xy ωωτ ⋅−⋅= (7)
Again by substituting for px and py in Equation (7) and rewriting the equation, the following
expression for τ is found:
)2sin()(21
31 ωσστ ⋅⋅−⋅= (8)
For an extraction ratio, e, Equations (6) and (8) become:
)e1()(sin)(cos 2
32
1n −
⋅+⋅=
ωσωσσ (9)

46
)e1(2)2sin()( 31
−⋅⋅⋅−
=ωσσ
τ (10)
6.2.2 Pillar Strength
It is assumed that the uniaxial compressive strength of a pillar, Ps, is adequately described in
terms of the work done by Salamon (1976) and Hedley (1978) and after Stacey and Page (1986),
using the following expression:
β
α
HW
KP effs ⋅= (11)
With: K = Design rock mass strength, DRMS, as suggested by Stacey and Page
(1986)
Weff = Effective pillar width
H = Pillar height
α, β = Pillar constants
The relationship between the effective pillar width, Weff, and the actual pillar dimensions, W and
B, is defined as follows:
( )WBWB2
perimeterPillarareaPillar4
Weff +⋅⋅=
⋅= (12)
With: W = Pillar width in direction of stope span LW
B = Pillar breadth
Denoting the pillar breadth to width ratio by R, Equation (12) may be rewritten as follows:
( )R1WR2Weff +
⋅⋅= (13)
For a typical stope layout as shown below, the extraction ratio, e, may be defined in terms of the
pillar dimensions, W and B, and the stope spans, LW and LB, as follows:

47
( ) ( )WB LWLBWB1e
+⋅+⋅−= (14)
With: LW = Maximum allowable stable stope span in direction of pillar width, W
LB = Stope span in direction of pillar breadth, B
Denoting the stope span ratio LB /LW by RL, Equation (14) may be rewritten as follows:
( ) ( )WWL
2
LWLRWRWR1e
+⋅⋅+⋅⋅−= (15)
Rewriting Equation (15), the following expression for the pillar width, W, is obtained:
( ) ( ) ( )
( )1eeR2
LRR1e
e4LRRLRRW
2WL
2W
2LWL
−⋅⋅
⋅⋅⋅−
⋅−⋅+−⋅+−= (16)
Substituting for W in Equation (13), the following expression for the effective pillar width, Weff, is
obtained:
( ) ( ) ( )( )
( )e1R1e
LRRe1
e4LRRLRRW
2WL
2W
2LWL
eff
−+⋅
⋅⋅⋅−
⋅+⋅++⋅+= (17)
Substituting for Weff in Equation (11), the following expression for the uniaxial compressive
strength of the pillar, Ps, is obtained:
( )( ) ( ) ( ) ( )
αα
β
⋅⋅⋅
−⋅+⋅++⋅+⋅
+⋅
−⋅= 2WL
2W
2LWLs LRR
e1e4LRRLRR
R1ee1
HDRMSP (18)
LB
B
W LW

48
6.2.3 Simplified Method of Analysis Considering Uniaxial
Compression Only
The ratio between the normal stress acting on the pillar after extraction of ore from the stope, σn,
and the uniaxial compressive strength of the pillar, Ps, may be denoted by SSR. This ratio is
therefore per definition the inverse of the factor of safety for a pillar in uniaxial compression and
may be expressed as follows:
s
n
PSSR σ= (19)
The SSR ratio was introduced because the type of pillar required in the stope will only depend
on the value of SSR selected. Typically, for non-yielding pillars, an SSR of 0.75 will be used, for
yielding pillars an SSR of 1.05, and for crush pillars an SSR of 1.35 (Table 6.1). This will
correspond with factors of safety in compression of 1.33 for non-yielding pillars, 0.95 for yielding
pillars and 0.75 for crush pillars respectively.
Substituting σn from Equation (9) and Ps from Equation (18) in Equation (19), the extraction ratio,
e, for a pillar in compression may be obtained by solving Equation (19) numerically. Alternatively,
by calculating the stress to strength ratio, SSR, for various extraction ratios, a plot of e against
SSR may be generated. For the required value of SSR, the allowable extraction ratio, e, may
then be obtained from the diagram.
Table 6.1 Stress to Strength Ratio, SSR, for various degrees of fracturing
Stress to StrengthRatio (SSR)
Probable RockMass Quality (Q)
Degree offracturing
Type of pillar
0 – 0.950 – 1000 /
0.06 – 0.4
limited to moderate non-yield
0.9 – 1.20.02 – 125 /
0.02 – 0.06
high Yield
1.2 – 1.50.009 – 75 /
0.009 – 0.02
very high crush
1.5 – 1.80.005 – 50 /
0.005 – 0.009
extremely high crush
It must be emphasised that the ratio Ps / σn represents the factor of safety for the pillar in
compression only. The overall factor of safety for the pillar must be determined in terms of the
proximity of the Mohr circle representing the stress condition in the pillar with regard to the actual

49
failure envelope for the pillar, whether it be a Mohr-Coulomb failure envelope or a Hoek-Brown
failure envelope. As a result, the overall factor of safety for the pillar will always be less
than the factor of safety for the pillar in compression as given by the ratio Ps / σσσσn. In other
words, designs based on the simplified approach described above may be lessconservative than suggested in the design calculations, especially where significant shearstresses are acting on the pillars as a result of the influence of surface topography,principal stress orientation and/or the actual stope orientation.
In order to overcome the limitations of the simplified approach to pillar design as described
above, more rigorous approaches using Mohr-Coulomb and Hoek-Brown failure criteria
respectively, were developed. An approach using a Mohr-Coulomb failure criterion is described
in Section 6.2.4 while an approach using a Hoek-Brown failure criterion is described in Section
6.2.5.
6.2.4 Rigorous Method of Analysis using a Mohr-Coulomb failure
Criterion
The previous section only considered a pillar in uniaxial compression. The calculated allowableextraction ratio, e, therefore only provides a factor of safety for a pillar in compression at thatparticular location in the stope. Therefore, if this simplified design methodology is used, itimplicitly assumes that the shear stresses acting on a pillar are negligible. However, due to theproximity of the stope to mountainous topography or open cast mining operations or as a resultof the orientation of the stope or a combination of these, significant rotation of the principalstresses around the stope may occur. The shear stresses acting on a pillar may therefore notbe negligible. As a result, both the normal and shear stresses acting on a pillar have to be takeninto account to allow rigorous design of the pillar dimensions and in determining the allowableextraction ratio. In this section, a rigorous method of analysis using a Mohr-Coulomb failurecriterion is developed.
As before, it is assumed that the uniaxial compressive strength of a pillar, Ps, is adequatelydescribed in terms of the work done by Salamon (1976) and Hedley (1978) and after Stacey andPage (1986). This assumption is regarded to be valid because the formulation of Ps has beenderived from work done in the underground coal mining industry where stopes are generallyhorizontal in orientation and with minimal rotation of the major principal stress from the vertical. In other words, shear stresses acting on the pillars were negligible and the pillars used duringback analysis in formulating the pillar strength, Ps, may be regarded to have been in compressiononly.

50
Since the pillar strength, Ps, denotes a state of failure in uniaxial compression, the Mohr-Coulomb
envelope controlling the strength of the pillar must be tangential to the Mohr circle associated
with failure of the pillar in uniaxial compression as presented diagrammatically below.
The friction angle, φ, will be a function of the normal stress acting on the pillar as well as of the
mechanical properties of the orebody. For the purpose of calculating a friction angle, φ, the
normal stress may be approximated to half the pillar strength, ½·Ps. It is suggested that the
calculation sequence given in Equations (20) to (22) as proposed by Hoek (1990) be used to
obtain a value for friction.
c2
cs
m3
s2P
m161h
σ
σ
⋅⋅
⋅+⋅⋅
+= (20)
With: m, s = Hoek-Brown material constants for an undisturbed rock mass
σc = Uniaxial compressive strength of the intact rock
−+°⋅=Θ
1h
1arctan9031
3(21)
−Θ⋅⋅=
1cosh4
1arctan2
φ (22)
The cohesion, c, in the pillar may then be calculated using Equation (23) for the calculated
friction angle, φ. The cohesive strength of a pillar is therefore a function of pillar size as it is
defined in terms of the pillar strength, Ps.
Ps
τ
c
φ
σn

51
( )( )
−⋅=
φφ
cossin1
2P
c s (23)
Substituting Ps from Equation (11) into Equation (24) and assuming that K = DRMS, the following
expression is obtained for the pillar cohesion, c:
( )( )
−⋅⋅⋅=
φφ
β
α
cossin1
HW
DRMS21c eff (24)
After excavation of the stope, the stresses acting on the pillar are given by the normal stress, σn,
and the shear stress, τ. This may be represented diagrammatically using Mohr circles as follows:
The stress to strength ratio, SSR, of the pillar is given by the ratio OF / OE as shown on the
above diagram. It can be shown that the ratio OF / OE may be written as:
( ) ( )φσφ
τσ
sincosc4SSR
n21
22
n
⋅⋅+⋅
+= (25)
Again, the maximum allowable extraction ratio, e, for a pillar may be obtained by solving
Equation (25) numerically. Alternatively, by calculating the stress to strength ratio, SSR, for
various extraction ratios, a plot of e against SSR may be generated. The maximum allowable
extraction ratio, e, is then obtained from the diagram for the required value of SSR.
Fτ
E
O
Shea
r stre
ss
Ps
φ
σn Normal

52
6.2.5 Rigorous Method of Analysis using a Hoek-Brown Failure
Criterion
In this section, a rigorous method of analysis using a Hoek-Brown failure criterion (Hoek: 1990)
is developed.
As before, it is assumed that the uniaxial compressive strength of a pillar, Ps, is adequately
described in terms of the work done by Salamon (1976) and Hedley (1978) and after Stacey and
Page (1986).
Since the pillar strength, Ps, denotes a state of failure in uniaxial compression, the Hoek-Brown
failure envelope controlling the strength of the pillar must be tangential to the Mohr circle
associated with failure of the pillar in uniaxial compression as presented diagrammatically below.
The friction, φ, will be a function of the normal stress acting on the pillar as well as of the
mechanical properties of the ore body.
The Hoek-Brown failure criterion is defined as follows:
2c3c31 sm σσ ⋅+Σ⋅⋅+Σ=Σ (26)
With: Σ1, Σ3 = Combination of major and minor principal stresses at failure
Equation (26) may be rewritten as follows assuming that σc = Ps for s = 1, i.e. assuming that the
uniaxial compressive strength of the pillar is given by Ps:
2s3s31 PPm +Σ⋅⋅+Σ=Σ (27)
Ps
τ
σn

53
The Mohr circle representing the stress state, σn and τ, in the pillar after excavation is illustrated
graphically below. The Mohr circle representing the failure state nearest to the actual stress state
in the pillar in terms of the major and minor principal stresses, Σ1 and Σ3 is also shown.
It can be shown that the minor principal stress, Σ3, is given by the following expression:
SSR4
2
22
n
n3
τσ
σ −−=Σ (28)
The major principal stress, Σ1, is obtained by substituting Equation (28) into Equation (27).
Assuming that the stress state at Point E is represented by a normal stress, Σn, and a shear
stress, Τn, the following expressions for Σn and Τn may be developed (after Hoek, 1990):
( )( ) s2
131
231
3n Pm2 ⋅⋅+Σ−Σ⋅Σ−Σ
+Σ=Σ (29)
( ) ( )31
s3nn 2
Pm1
Σ−Σ⋅⋅
+⋅Σ−Σ=Τ (30)
The friction angle, φ, corresponding with the normal stress, Σn, may then be determined from:
( )
Σ−Σ
Τ⋅−°=
31
n2arcsin90φ (31)
Ps
Shea
r stre
ss
NormalΣ1
E
OΣ3
(σn ,τ)F
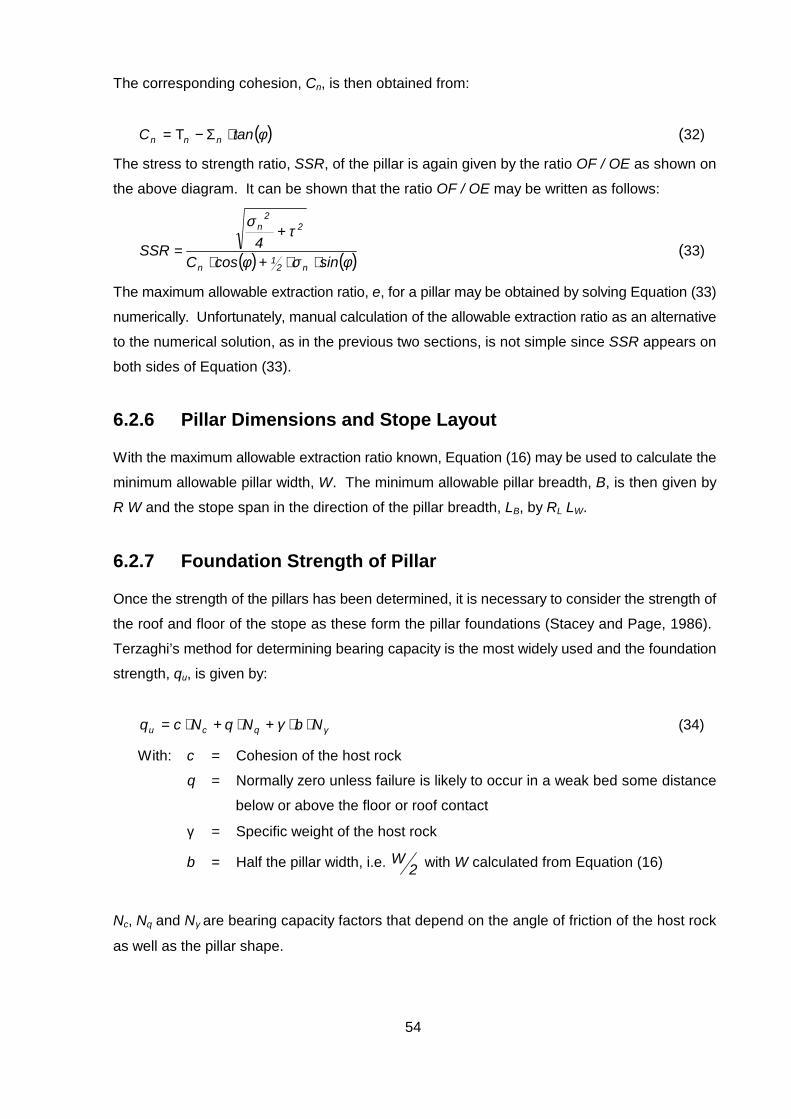
54
The corresponding cohesion, Cn, is then obtained from:
( )φtanC nnn ⋅Σ−Τ= (32)
The stress to strength ratio, SSR, of the pillar is again given by the ratio OF / OE as shown on
the above diagram. It can be shown that the ratio OF / OE may be written as follows:
( ) ( )φσφ
τσ
sincosC4SSR
n21
n
22
n
⋅⋅+⋅
+= (33)
The maximum allowable extraction ratio, e, for a pillar may be obtained by solving Equation (33)
numerically. Unfortunately, manual calculation of the allowable extraction ratio as an alternative
to the numerical solution, as in the previous two sections, is not simple since SSR appears on
both sides of Equation (33).
6.2.6 Pillar Dimensions and Stope Layout
With the maximum allowable extraction ratio known, Equation (16) may be used to calculate the
minimum allowable pillar width, W. The minimum allowable pillar breadth, B, is then given by
R·W and the stope span in the direction of the pillar breadth, LB, by RL·LW.
6.2.7 Foundation Strength of Pillar
Once the strength of the pillars has been determined, it is necessary to consider the strength of
the roof and floor of the stope as these form the pillar foundations (Stacey and Page, 1986).
Terzaghi’s method for determining bearing capacity is the most widely used and the foundation
strength, qu, is given by:
γγ NbNqNcq qcu ⋅⋅+⋅+⋅= (34)
With: c = Cohesion of the host rock
q = Normally zero unless failure is likely to occur in a weak bed some distance
below or above the floor or roof contact
γ = Specific weight of the host rock
b = Half the pillar width, i.e. 2W with W calculated from Equation (16)
Nc, Nq and Nγ are bearing capacity factors that depend on the angle of friction of the host rock
as well as the pillar shape.

55
7 Validation of proposed design methodology bymeans of back analysis
In order to illustrate application of the methodology described, the influence of mountainous
topography on the pillar design of an underground mine is considered. The underground mine
makes use of room and pillar mining with an average stoping height of approximately 1.5m as
determined by the width of the ore seam. Three different mining locations at various depths were
considered. The first two mining locations (Zones A and B) are stopes in an existing mine. Zone
C at depth 500m forms part of a proposed extension to the same mine with a stoping height of
approximately 2.3m. The proposed pillar design for Zone A will be compared with the actual
pillar layout at Zone A at the time of a near surface failure that occurred in this part of the mine.
7.1 Engineering Geology
A detailed geotechnical investigation was carried out which included underground geotechnical
mapping of relevant stopes and geotechnical logging of relevant exploration borehole cores.
Window mapping, zone mapping and scanline surveys were carried out to assess rock mass
conditions.
7.1.1 Stratigraphy
The mine is located within igneous rocks. The ore seams are bounded by host rock that is
massive with no stratification, except for specific layering normally caused by ore seams or
stringers. The ore seams are generally horizontal to sub-horizontal in orientation.
7.1.2 Major Geological Structures
Fracture zones comprising areas of closely spaced joints associated with faults or dykes were
identified. The fracture zones generally have a strike parallel to that of the orebody. The zones
are of limited width of about 2 to 5m and are continuous, with trace lengths of more than 20m.
The fractures are slickensided planar to undulating and usually do not contain any infill.
7.1.3 Ubiquitous Joint Sets
Three main joint sets were identified during underground mapping. Joint set J1 comprised sub-
vertical joints striking parallel to that of the orebody. Joint set J2 comprised sub-vertical joints
striking parallel to the dip of the orebody. Joint set J3 comprised flat-lying joints whose planes
were often sub-parallel to the plane of the orebody.
56
7.1.4 Groundwater
The natural groundwater level was below that of the underground mine workings. As a result,
the effect of groundwater on stability of pillars in the underground workings was not considered.
7.1.5 Rock Mass Stiffness
The stiffness of the host rock mass was regarded to be sufficiently homogeneous within the zone
of influence of the mountainous surface topography and the underground workings to permit use
of the methodology described in Section 6.
7.2 Homogeneity of Surrounding Rock Mass
As described in Section 7.1.3, three major joint sets were identified in the rock mass. Also, the
host rock may be regarded as a massive rock type. The presence of fractured zones is likely to
affect local stability only in the form of wedges that may fall out. It is unlikely, however, that the
design of stope pillars will be seriously affected by the presence of these zones of fracturing.
The surrounding rock mass was therefore considered approximately homogeneous.
7.3 Rock Mass Classification
Geotechnical data were collected as recommended for the mining rock mass rating (MRMR)
system according to Laubscher (1990). Overall conditions for each site were noted and included:
• Rock type and hardnessThe orebody has an average UCS of 45.4 MPa with a standard deviation of 36.9 MPa. From
a limited amount of data, an average UCS of 138 MPa with a standard deviation of 50.7 MPa
was obtained for the host rock.
• Degree of weatheringNo adjustments were made for weathering since the host rock and the orebody were
unweathered at the level of the stope.
• Groundwater conditionsNo adjustments for groundwater were made to the RMR since the mine workings are dry.

57
• Drilling and blasting effectsUnderground observations revealed that blasting is damaging the pillar sidewalls. It was also
noted that minor wedges that had fallen out could be ascribed to bad drilling. As a result, an
adjustment factor of 0.94 for blasting effects was used to calculate the MRMR.
• Joint orientationAn adjustment factor for joint orientation of 0.9 was used to calculate representative MRMR
values.
These conditions were rated first by calculating the rock mass rating (RMR) for each area.Statistical analysis of RMR data for the orebody gave an average RMR of 43 and a standarddeviation of 3.4. An average RMR of 70 with a standard deviation of 9.2 was obtained for thehost rock.
The RMR values were then adjusted to take into account the reduction of the rock mass strengthdue to blasting, mining stresses, weathering and joint orientation. Average MRMR values of 36and 59 were obtained for the orebody and host rock respectively.
The MRMR system was used because it is a rock mass classification system that allows foradjustments to be made specifically for the mining environment. Other advantages of using thissystem include:
• The system can be used to calculate a value for the in situ design rock mass strength
(DRMS) which can be used to calculate the strength of pillars. The average DRMS for the
purposes of this example was estimated to be 20 MPa. This estimate was based on back-
calculated pillar strengths for Zones A and B for a range of stable and failed pillars observed
in the underground workings during field mapping, as well as on rock mass conditions
observed in line surveys, window mapping and borehole logging.
• The classification results can be used to predict the dimensions of stable stope spans.
• The MRMR value can be used to assess support methods needed for each geotechnical
class.
• The classification data can be converted to RMR values (Bieniawski, 1989) which in turn can
be used to estimate other rock mass parameters such as Young’s Modulus (E) and Hoek-
Brown m and s parameters.

58
7.4 Horizontal to Vertical Stress Ratio
From stress measurements that have been carried out in the field (Stacey and Wesseloo: 1998),
the horizontal to vertical stress ratio, K, was estimated to be approximately 1.5.
7.5 Geometry of Underground Mine Workings in relation toMountainous Surface Topography
A typical cross-section through the surface topography is shown in Figure 7.1 with the position
of the three different underground locations, i.e. Zones A to C, also indicated.
7.6 Design Charts of Principal Stresses and StressOrientation
Design charts for major and of minor principal stress contours and of major principal stress
orientation were prepared from an elastic analysis using the Phase2 finite element program. The
mountainous surface topography was modelled in the analysis and the zone of influence of the
topography with regard to existing and proposed underground workings was determined.
Design charts for major and minor principal stress contours are presented in Figure 7.1 and
Figure 7.2. In Figure 7.3, contours of major principal stress orientation with the vertical, θ, are
shown in degrees.

59
85
75
65
55
45
35
25
15
5
5
5
0
250
500
750
1000
1250
1500
1750
2000
(met
res)
B
C
A
Figure 7.1 Major principal stress contours (MPa)
2.55
7.510
15
20
25
30
35
40
45
50
55
60
65
0
250
500
750
1000
1250
1500
1750
2000
(met
res)
B
C
A
Figure 7.2 Minor principal stress contours (MPa)

60
75
85
80
75
70
65
6055
50
4540
3530
25201510
5
45
556570
85
54050
600
250
500
750
1000
1250
1500
1750
2000
(met
res)
A
B
C
Figure 7.3 Contours of the angle, θθθθ, between the major principal stress and
the vertical (in degrees)
The data extracted from these design charts may be summarised as follows for the three
different mining locations considered.
Zone A(near surface) Zone B Zone C
Average major principal stress (MPa) 7.0 11 17.5
Average minor principal stress (MPa) 0.25 4.5 15.5
Average angle of σσσσ1 with vertical, θθθθ 55° 5° 17.5°
Pillar inclination with vertical, ψψψψ 12° 12° 12°
Average angle between σσσσ1 and pillar axis, ωωωω 43° 7° 29.5°

61
7.7 Extraction Ratio from Simplified Analysis
The extraction ratio is a direct function of the type of pillar required as determined by the
specified SSR value as shown in Equation (19). The value of SSR denotes the required stress
to strength ratio in the pillar after excavation. The purpose of the SSR is therefore similar to that
of a conventional factor of safety.
Table 6.1 may be used for guidance in selecting suitable values of SSR for various types of
pillars. For the design example, an acceptable value for SSR of 0.75 was selected in order to
obtain an extraction ratio that will leave non-yielding pillars in the stope.
Through back analyses of actual pillar failures that occurred in these parts of the mine, a best
fit value of approximately 1.0 was obtained for both pillar constants α and β. For a pillar height,
H, of 1.5m and 2.3m in Zones A and B and in Zone C respectively, allowable extraction ratios
were calculated using the simplified method of analysis as described in Section 6.2.3 as follows:
Zone
Parameter description A B C
R = B / W 1 0.5 0.5
RL = LB / LW 0.5 0.125 0.125
H (in metres) 1.5 1.5 2.3
LW (in metres) 7 25 25
DRMS (in MPa) 28 28 28
Allowable extraction ratio, e (%) 89.0 85.9 77.7

62
7.8 Extraction Ratio from Analysis using a Mohr-CoulombFailure Criterion
The same input parameters as presented in Section 7.7 were used to calculate the allowable
extraction ratios at the three mining locations using a rigorous method of analysis involving a
Mohr-Coulomb failure criterion as described in Section 6.2.4. The associated pillar dimensions
and stope layouts are also indicated.
Zone
A B C
Maximum allowable extraction ratio, e (%) 80.8 84.9 76.3
Pillar width, W (in metres) ± 4.0 ± 8.75 ± 13.3
Pillar breadth, B (in metres) ± 4.0 ± 4.4 ± 6.7
Maximum allowable stope span, LW (in metres) 7.0 25 25
Stope span, LB (in metres) 3.5 ± 3.2 ± 3.2
Stope height, H (in metres) 1.5 1.5 2.3
7.9 Extraction Ratio from Analysis using a Hoek-BrownFailure Criterion
The same input parameters as presented in Section 7.7 were used to calculate the allowable
extraction ratios at the three mining locations using a rigorous method of analysis involving a
Hoek-Brown failure criterion as described in Section 6.2.5. The associated pillar dimensions and
stope layouts are also indicated.

63
Zone
A B C
Maximum allowable extraction ratio, e (%) 79.8 84.4 75.7
Pillar width, W (in metres) ± 4.15 ± 9 ± 13.7
Pillar breadth, B (in metres) ± 4.15 ± 4.5 ± 6.9
Maximum allowable stope span, LW (in metres) 7.0 25 25
Stope span, LB (in metres) 3.5 ± 3.2 ± 3.2
Stope height, H (in metres) 1.5 1.5 2.3
7.10 Simplified versus Rigorous Methods of Analysis
From the results presented in Sections 7.7 to 7.9, it is clear that an overestimate of the allowable
extraction ratio is obtained if the simplified method of analysis is used. The amount by which the
allowable extraction ratio is overestimated depends on the pillar orientation with respect to the
major principal stress as well as on the magnitude of the minor and major principal stresses. The
higher the shear stress, τ, after extraction, the less conservative the result will be that is obtained
using the simplified method of analysis.
It may be argued that the difference between the allowable extraction ratios obtained using the
simplified and rigorous methods of analysis respectively are not that significant, especially in the
case of Zones B and C, i.e. 85.9% vs. 84.9% or 84,4% and 77.7% vs. 76.3% or 75,7%.
However, a comparison of the actual factors of safety obtained for allowable extraction ratios
calculated using the simplified and rigorous methods of analysis respectively, clearly indicates
the degree of conservatism in design provided by the three different methods of analysis. The
factor of safety obtained from the analysis using the Hoek-Brown failure criterion was used as
the base case.

64
Actual Factor
Of Safety
Method of Analysis Zone A Zone B Zone C
Simplified, Considering Compression Only 0.59 1.18 1.18
Rigorous, using Mohr-Coulomb failure criterion 1.23 1.28 1.29
Rigorous, using Hoek-Brown failure criterion 1.33 1.33 1.33
From the above table it is clear that the simplified approach to design is far less conservative
than the other two approaches to the extent that designs may even be unstable where significant
shear stresses are acting on the pillars in the stope.
7.11 Correlation of Predicted Extraction Ratios with ActualExtraction Ratios
The actual / proposed extraction ratios at the three mining locations were as follows:
Zone
A B C
Actual extraction ratio, e (%) 90 to 94 75 to 80
Proposed extraction ratio, e (%) 70 to 75
The results of the rigorous methods of analysis presented in Sections 7.8 and 7.9 indicate that
the allowable extraction ratios calculated for Zones B and C are slightly higher than the actual
/ proposed extraction ratios at these locations. The relatively stable conditions that are being
experienced at Zone B in the mine therefore correlates well with the results of the rigorous
analyses. At Zone A, however, the actual extraction ratio significantly exceeded the allowable
extraction ratio as obtained using the rigorous methods of analysis. Again a good correlation
between actual conditions in this part of the mine and the results of the rigorous analyses is
obtained, since major failure of large parts of the stope occurred near surface in Zone A.
For an actual extraction ratio of approximately 90% near surface at Zone A, it may be shown that
the stress to strength ratio for the pillars was approximately 1.68 using the rigorous method of
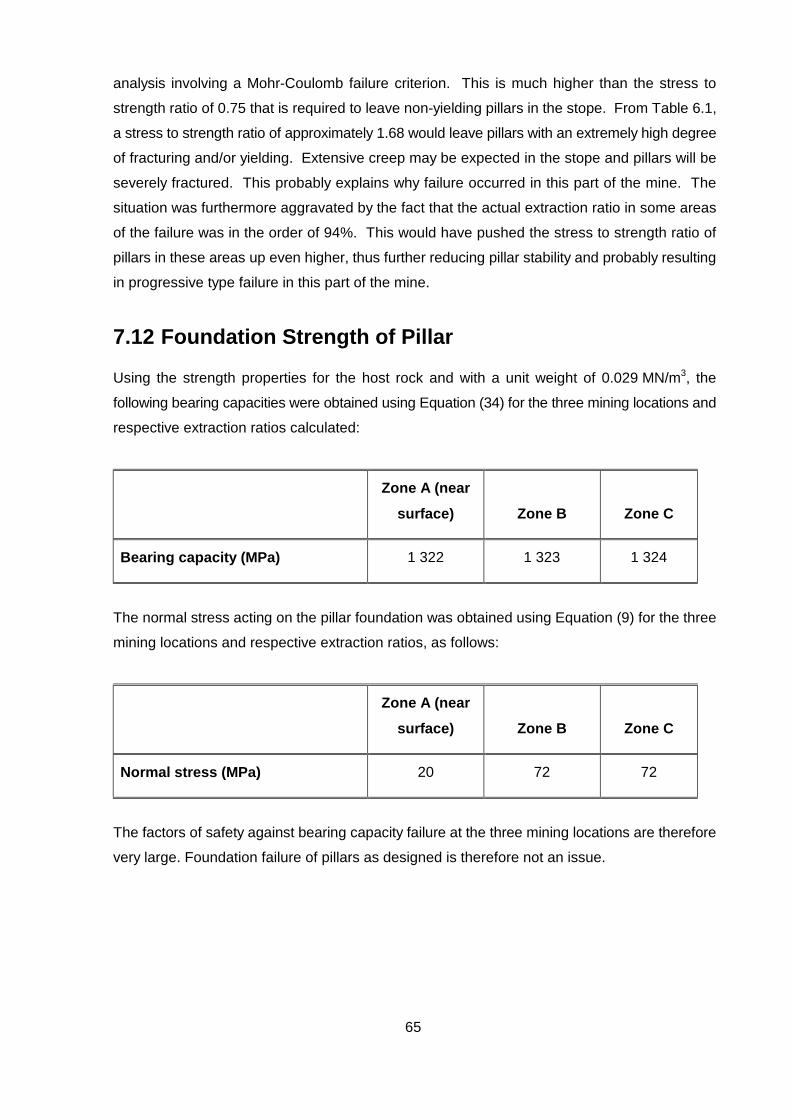
65
analysis involving a Mohr-Coulomb failure criterion. This is much higher than the stress to
strength ratio of 0.75 that is required to leave non-yielding pillars in the stope. From Table 6.1,
a stress to strength ratio of approximately 1.68 would leave pillars with an extremely high degree
of fracturing and/or yielding. Extensive creep may be expected in the stope and pillars will be
severely fractured. This probably explains why failure occurred in this part of the mine. The
situation was furthermore aggravated by the fact that the actual extraction ratio in some areas
of the failure was in the order of 94%. This would have pushed the stress to strength ratio of
pillars in these areas up even higher, thus further reducing pillar stability and probably resulting
in progressive type failure in this part of the mine.
7.12 Foundation Strength of Pillar
Using the strength properties for the host rock and with a unit weight of 0.029 MN/m3, the
following bearing capacities were obtained using Equation (34) for the three mining locations and
respective extraction ratios calculated:
Zone A (nearsurface) Zone B Zone C
Bearing capacity (MPa) 1 322 1 323 1 324
The normal stress acting on the pillar foundation was obtained using Equation (9) for the three
mining locations and respective extraction ratios, as follows:
Zone A (nearsurface) Zone B Zone C
Normal stress (MPa) 20 72 72
The factors of safety against bearing capacity failure at the three mining locations are therefore
very large. Foundation failure of pillars as designed is therefore not an issue.

66
8 Conclusions and recommendations
8.1 Conclusions
Variable surface topography could have an adverse affect on the stability of underground
excavations, especially in near surface mining operations of say less than 100 m below surface.
Perhaps the biggest hazard concerning the influence of surface topography on the loading of
pillar workings in near surface and shallow mines, is incorrect pillar design. This includes the
identification of critical areas under influence of topographical features and consideration of
failure mechanisms not necessarily considered under normal conditions. This study shows that
standard pillar design techniques are not applicable in such areas of variable stress and a
rational pillar design method is therefore required for such situations.
8.1.1 Main objective
The main objective of this part of the research project is to quantify the influence ofsurface topography on the stability of pillars and to describe a design methodologyfor pillars in areas of variable surface topography. Surface topography shouldinclude natural topography such as valleys and mountains, and man-madetopography as a result of surface mines, spoil piles and tailings dams. The designmethodology should be simple in order to assist rock mechanics practitioners andmine managers in identifying and quantifying the critical factors influencing thestability of pillars in areas of highly variable surface topography.
The influence of surface topography on the stability of pillars depends on several factors such
as:
• the proximity of the topographical feature in relation to the pillar workings;
• the geometry of the topographical feature;
• the geotechnical characteristics of the surrounding rock mass and pillars;
• the presence of groundwater;
• the structural complexity of the surrounding rock mass;
• the horizontal to vertical stress ratio;
• the geometry of the underground workings in relation to the topographical feature;
• the angle between the major principal stress and the vertical;
• the normal and shear stresses acting on the pillars.

67
The procedure for the design of pillars in areas of variable topography caused by surcharging
is simple. This procedure has been simplified further by the inclusion of three “design” diagrams.
These can be used to determine the ratio between the factor of safety with the applied superficial
stress and the original factor of safety. The diagrams take into account different swell factors and
spoil pile or tailings dam heights.
The procedure for the design of pillars in areas of variable topography caused by natural features
or man-made excavations is complex, and requires stress analyses of the topographical feature
to determine the major and minor principal stresses and their orientations at the pillar locations.
Also, calculating the maximum allowable extraction ratio requires special mathematical skills.
However, the main objective to quantify the influence of surface topography on the stability of
pillars and to describe a design methodology for pillars in areas of variable surface topography
has been achieved.
8.1.2 Secondary objectives
Review relevant literature on pillar design and the influence of surface topographyon field stresses.
Literature pertaining to the influence of variable surface topography on field stresses (magnitudeand orientation) has been reviewed and is summarised in Section 2 of the report. The keyfindings are as follows:
• the influence of surface topography on field stresses should be quantified in terms ofmagnitude and orientation;
• shear failure of pillars should be considered, especially in close proximity to topographicalfeatures;
• the influence of groundwater on the stability of underground workings should not be ignored;• rock mass anisotropy could have a significant influence on in situ stresses;• tectonic stresses may have a significant effect on in situ stresses;• field stresses are associated with the geometry of topographical features;• large scale shear movement in the hangingwall of stopes could be caused by in situ stress
conditions and the proximity to topographical features;• spoil material or tailings on surface could have a significant effect on the stability of pillar
workings in near surface mines, especially if the height of the surcharged material issignificant compared with the depth of the overburden;
68
• none of the pillar design methodologies investigated considered shear failure as a significant
contributing factor;
• very few in situ back analyses of pillar strength measurements have been performed in hardrock environments. Of these, the Hedley and Grant (1972) work appears to be the mostapplicable. However, due to the limitations in the data and the concomitant limitations in theanalysis procedure, the applicability of their results to other hard rock mining environmentsis unproven.
Visit selected mines to obtain information on pillar collapses as a result of surfacetopography and to discuss design considerations for pillars under influence ofvarying surface topography.
The following mines with topographical features were identified and visited during the secondpart of the study:• Eastern Chrome Mines;• Dilokong Mine;• Finsch Mine;• Rosh Pinah Mine;• Premier Mine;• Black Mountain Mine;• Thabazimbi Mine.
In general, these mines have taken very little cognisance of the effects of surface topography onthe design of underground excavations. Some, however, have used two- and three dimensionalnumerical models to account for the effects of open pit mining on the workings below.
At the mines visited, pillar designs in areas close to surface are normally based on the tributaryarea theory to calculate pillar stresses, and the Hedley and Grant (1972) approach to thecalculation of pillar strengths. Relatively high safety factors are normally used, mainly becauseof concern about weathering and the stability of the stope spans.
Most pillar design work carried out in the “other” mining sector only considers mean, or expectedvalues of load and strength, pillar dimensions, rock strengths and other design variables. Theexponents used to calculate pillar strengths are normally based on the exponents used by Hedleyand Grant (1972). This approach is only acceptable when mining continues under conditionswhere sufficient experience has been gained and where conditions correspond with thoseexisting at the time of developing the Hedley and Grant pillar formula.
69
A regional pillar collapse on one of the mines visited, which occurred in an area close to surfaceand under the influence of surface topography, was back analysed to validate the proposeddesign methodology.
Identify hazards and assess the risks associated with the influence of surfacetopography on the loading of pillars.
The identified hazards can be grouped into the following main categories:
• inadequate pillar geometry, mainly because of inappropriate pillar design;
• adverse loading conditions (stress field), mainly because of the proximity to surface;
• deficient pillar material strength, mainly because of weathering, adverse jointing, etc.
Deficient pillar material strength, however, is not a function of surface topography per se.
Therefore, the focus of this report is the influence of variable topography on field stresses and
the effect on pillar stability. Considering the critical hazards identified in the risk assessment,
design methodologies are proposed, which will alleviate the hazard of pillar collapse due to the
influence of surface topography.
Carry out sensitivity analyses of the effects of variable topography on pillar stability.
The sensitivity of pillar stability under influence of variable surface topography has been analysedduring the back analysis of the regional pillar collapse and the stable areas down dip of thecollapsed area. The analyses show that:
• the conventional method of calculating factors of safety for pillars represents the factor ofsafety for the pillar in compression only, and implicitly assumes that the shear stresses actingon a pillar are negligible;
• the higher the shear stress after extraction, the less conservative the result will be that isobtained using the conventional pillar design approach;
• both the normal and shear stresses acting on a pillar have to be taken into account to allowrigorous design of the pillar dimensions and to determine the allowable extraction ratio;
• the amount by which the allowable extraction ratio could be overestimated depends on thepillar orientation with respect to the major principal stress as well as on the magnitudes of theminor and major principal stresses;
• near surface pillars under the influence of surface topography could have acceptable safetyfactors if the design is based on the uniaxial compressive strength only. However, backanalyses of failed pillars under such conditions have shown that the pillars failed in shear andthat the actual factor of safety could be as low as 0,59.

70
Determine a procedure for the design of pillars in areas of variable surfacetopography.
Two design procedures have been proposed. These are:
1. a design procedure for pillars in areas of variable topography caused by surcharging. This
procedure is based on work by Fourie (1987);
2. a design procedure for pillars in areas of variable topography caused by natural features such
as valleys and hills, or man-made features such as excavations caused by surface mining
operations.
A detailed discussion of the design procedures can be found in Sections 5 and 6 respectively.
Compile a final report and recommendations.
The research findings and recommendations are summarised in this report.
Transfer of knowledge through workshops.
Once approved by SIMRAC, the knowledge gained during this research project will be
transferred through workshops and publications.
71
8.2 Recommendations
1) The procedure for the design of pillars in areas of variable topography caused by natural
features or man-made excavations is complex. It requires stress analyses of the
topographical feature to determine the major and minor principal stresses and the orientation
of the major principal stress with the vertical. Also, calculating the maximum allowable
extraction ratio requires special mathematical skills. It is recommended that these problems
be overcome by:
• compiling a series of diagrams for typical topographical features, indicating the major and
minor principal stresses and the orientation of the major principal stress with the vertical;
• compiling a simple and user friendly computer program for calculating the maximum
allowable extraction ratio.
2) The conventional method of calculating factors of safety for pillars in inclined orebodies
represents the factor of safety for pillars in compression only, and implicitly assumes that the
shear stresses acting on a pillar are negligible. However, due to the orientation of inclined
pillars, significant rotation of the principal stresses around the pillar may occur. As a result,
both the normal and shear stresses acting on pillars have to be taken into consideration. It
is recommended that the proposed design methodology for pillars under influence of natural
topographical features or man-made excavations be extended to include pillars in inclined
orebodies without influence from surface topography as well.
3) It is recommended that this study be extended to include the effects of underground mining
on the stability of surface excavations such as open pits.

72
9 ReferencesCole, K. 1993. Building over abandoned shallow mines. Paper 1: Considerations of Risk and
Reliability. Ground Engineering, pp 35-37.
Fourie, G.A. 1987. The effects of partially extracted coal seams on surface mining. Thesis
submitted in Fulfilment of the Requirement for the Degree of Doctor in Engineering in the Faculty
of Engineering, University of Pretoria.
Gürtunca, R.G. 1997. Identification of safety and health hazards and quantification of risks in
the South African mining industry with time. SIMRAC Report SIMRISK 401. Pretoria: Department
of Minerals and Energy.
Hedley, D.G. F. 1978. Design Guidelines for Multi-Seam Mining at Elliot Lake, Canada Centre
for Mineral and Energy Technology, CANMET, Report 78-9.
Hedley, D.G.F. and Grant, F. 1972. Stope and pillar design for the Elliot Lake uranium mines.
The Canadian Mining and Metallurgical (CIM) bulletin..
Hoek, E. 1990. Estimating Mohr-Coulomb Friction and Cohesion Values from the Hoek-Brown
Failure Criterion. Technical Note, Int. J. Rock Mech. Min. Sci. & Geomech. Abstr., Vol. 27, No.
3, pp. 227-229.
Jaeger, J.C. and Cook, N.G.W. 1979. Fundamentals of Rock Mechanics. Third edition. London,
Chapman & Hall.
Jones, D.H. 1986. Two case histories of ground instability caused by the interaction between
brick clay quarrying and underground mining. Proc. of Symp on “The effect of underground
mining on surface”, ISRM, SANGORM, Sandton, p. 39-45.
Joughin, W.C., Swart, A.H. and Stacey, T.R. 1998. Review of fall of ground problems in
underground diamond mines and other mines with massive orebodies and make
recommendations on research needs to reduce fall of ground casualties, particularly in the face
area. SIMRAC Report OTH 411. Pretoria: Department of Minerals and Energy.

73
Kirsten, H.A.D. 1974 Report on base friction kinematics of jointed hangingwall in Winterveld
Chrome Mine. SRK Report No. 136/1, November 1974.
Kirsten, H.A.D. 1994. Review of norms for probability of failure and risk in engineering design.
Unpublished.
Laubscher, D. H. October 1990. A Geomechanics Classification System for the Rating of Rock
Mass in Mine Design. J. S. Afr. Inst. Min. Metall., Vol. 90, No. 10, pp. 257-273.
Ortlepp, W.D. 1998. Personal communication on the pillar collapse at Winterveld Mine. SRK
Consulting, 265 Oxford Road, Illovo, Johannesburg, 2000.
Pan, E. and Amadei, B. 1994. Stresses in an anisotropic rock mass with irregular topography,
ASCE J. Engng Mech. 120, p. 97-119.
Pan, E., Amadei, B. and Savage, W.Z. 1994. Gravitational stresses in long symmetric ridges
and valleys in anisotropic rock. Int. J. Rock Mech. Min. Sci. & Geomech. Abstr. Vol. 31, No. 4,
p. 293-312.
Salamon, M.D.G. and Munro, A.H. 1967. A study of the strength of coal pillars. Journal of the
South African Institute of Mining and Metallurgy. September 1967 p. 55-67.
Salamon, M. D. G. and Oravecs, K. I. 1976. Rock Mechanics in Coal Mining, Chamber of Mines
of South Africa.
Stacey, T.R. and Page, C.H. 1986. Practical Handbook for Underground Rock Mechanics.
Clausthal-Zellerfeld: Trans Tech Publications.
Stacey, T.R. and Wesseloo, J. 1998. Evaluation and upgrading of records of stress
measurement data in the mining industry. SIMRAC Report GAP 511. Pretoria: Department of
Minerals and Energy
Thompson, P.W., MacGregor, S. and Dight, P. 1993. Instrumentation monitoring at an
underground mine to establish failure mechanisms, confirm numerical modelling and determine
safe working conditions. Geotechnical Instrumentation and Monitoring in Open Pit and
Underground Mining, Szwedzicki (ed.), Balkema, Rotterdam, p. 501-511.

74
Wagner, H and Madden, B.J. 1984. Fifteen years’ experience with the design of coal pillars in
shallow South African collieries: An evaluation of the performance of the design procedures and
recent improvements. Design and Performance of Underground Excavations. Cambridge:
ISRM/BGS.
Wittke. W. 1990. Rock Mechanics Theory and Application with Case Histories. Springer-Verlag.
p. 805-811.
Additional Reading Material:
Singh, T.N. and Singh, D.P. 1992. Prediction of instability of slopes in an opencast mine over
old surface and underground workings. International Journal of Surface Mining and Reclamation.
A.A. Balkema, Rotterdam, Netherlands, p. 81-89.

75
Appendix A
Pillar design methodologies being used by the “other”mining sector
A.1 Salamon and Munro (1967) approach
A.1.1 Introduction
Salamon and Munro derived a formula, which defines approximately the strength of coal pillars
in South African collieries. The derivation is essentially empirical, based on data obtained from
a survey of actual mining dimensions. The data include information regarding stable and
collapsed areas of mining.
They argued that the ratios of the predicted strength to the calculated loads at failure, that is, the
critical safety factor, form a frequency distribution centred around unity. The probability that a
pillar will be stable is indicated by the ordinates of the cumulative distribution curve. This study
assumed that the logarithm of the critical safety factor is normally distributed.
Salamon and Munro postulated that the strength of pillars can be expressed, in the given range
of dimensions, as a power function of the height and width. The values of the three unknown
parameters in this function, the constant multiplier and the powers of width and height, are
estimated by the method of maximum likelihood. It was found that the derived strength formula
described the information obtained from the survey of mining dimensions satisfactorily.
A.1.2 Statistical analysis of data
The data collected and statistical analysed can be described as follows:
• 98 stable and 27 collapsed cases were used;
• data were collected from areas where the mining dimensions were essentially constant and
pillars with square cross-sections were employed;
• the area of mining in each case was fairly large;
• where collapsed cases were included, the diameter of the collapsed area was greater than
the depth below surface; only collieries of the Mpumalanga, Gauteng and Free State
provinces were used;
76
• the data contained the following dimensions: depth below surface (H), height of working (h),
width of the square pillars (w), and bord width (B);
• data was divided into two categories, that is current or stable workings, and collapsed
workings. (The current workings were stable for at least 18 months prior to the analysis.);
• a wide variety of conditions was covered;
• time effects were not considered.
A.1.3 Requirements of analysis
Salamon and Munro realised that the data covered a variation of coal strengths, a great variety
of conditions, and that human error could be involved in the reporting. It was therefore apparent
that the derivation had to be statistical, and that the method employed had to recognise
deviations from both the estimated strength and the estimated pillar load. It was found that these
requirements were satisfied by a probabilistic interpretation of the commonly used factor of
safety (FOS).
where: strength = strength of a coal pillar
load = average pressure acting on the pillar
FOS > 1 : stable structure
FOS < 1 : failed structure
A.1.1 Critical Factor of Safety (FOSc)
The above definitions are always valid when individual structures, with their individual strengths
and loads are considered. When, however, the design of a structure is proposed, the values
substituted for strength and load must be regarded as predictions which are subject to errors.
The strength is calculated from the results of tests carried out and the load is calculated from the
expected loading condition. Consequently, the calculated value of FOS, in general, will not
represent the true FOS. If such a structure is tested to destruction, it is likely that the actual load
at failure will not be the same as the predicted strength. Hence, the critical factor of safety
(FOSc), calculated from the predicted strength and the load at failure, will be either smaller or
greater than unity.
LoadStrengthFOS =

77
Thus, if:
FOS > FOSc : stable structure
FOS < FOSc : failed structure
The exact value of FOSc is not known in practice. Therefore, the future stability of a structure is
secured by employing an FOS which maintains, with an acceptably high probability, that FOS >
FOSc.
If many structures are constructed according to a particular method of predicting strength and
tested to destruction, the observed variation in FOSc may be described by a frequency
distribution with a density function f(FOSc). In the case of a reliable design procedure the scatter
of the FOSc will be small and values will be clustered around unity.
The ordinate on the cumulative distribution, F(FOS), is also the probability that a structure
designed to have a certain FOS, will in fact be stable. The cumulative curve changes from zero
to unity when moving from left to right. This implies that the probability of having a stable
structure is zero when FOS = 0 and that the probability is unity when FOS = ∞.
In the case of symmetrical distributions, where the values for mean, mode and median are equal,
a design procedure can at best yield FOSc values which are distributed densely around FOSc =
1. However, when the distribution is asymmetric, which is the case with FOSc, the median falls
between the mean and the mode. In this case, the location of the distribution of FOSc with the
median at FOSc = 1 is more appropriate.
A.1.4 The pillar strength formula and estimation of the parameters
The strength of a pillar depends on the strength of the material of which it is composed, its
volume and its shape. The effects of shape are due to the constraints imposed on the pillar by
the roof and floor through friction and cohesion.
The most commonly occurring pillar strength formula in the literature is a simple power function
composed of 2 variables and 3 constants.
If substituted into the equation for FOS above:
βα whkStrength ⋅⋅=

78
If the design of pillars is to be based on the dimensions, height (h) and width (w), and the
calculated load (p), estimates of the unknown constants k, α and β are required.
One approach to this problem is to choose those values of the parameters which concentrate
the distribution of FOSc as densely about FOSc = 1 as is possible.
Data collected for this purpose can be divided into two cases. In the collapsed pillar cases, the
load calculated represents the pillar load at failure, hence FOS = FOSc. In the other group, the
stable cases, the information is less explicit. It merely implies that the load p is less than the load
required to crush the pillar, that is FOSc < FOS.
The approach followed by Salamon and Munro (1967) can be summarised as follows:
1) It was assumed that log FOSc follows a normal distribution with zero mean (i.e. FOSc =
1) and standard deviation σ.
2) Functions for the frequency distributions, f1 (log FOSc) and f(FOSc) were then obtained.
3) The corresponding cumulative distribution function, F(FOSc) was then obtained by
integrating f(FOSc) between the limits zero and FOSc. This function corresponds with the
well-known cumulative normal distribution function. (It must be noted that, whereas the
common value of the mean, median and mode in the logarithmic scale is zero, it is only
the median which falls at FOS = 1 on the natural scale.)
4) The condition which maximises the clustering of the observed FOSc about the median,
FOSc = 1, was then expressed by requiring that the product of the frequency ordinates
corresponding to the observed values should be a maximum, i.e. the product function L1
should be maximised. (The estimates of k, α, β and σ, which were obtained by this
means, are in fact the same as those which could be derived by the method of “least
squares”.)
5) In the group of stable cases, the FOS is clearly greater than FOSc, which would arise at
failure. This suggested that, at FOSj, the probability of a stable geometry occurring, that
is F(FOSj ), should be as great as possible, within the limits of compatibility. (The
probability of a stable case is measured by the area under the frequency distribution
curve left of FOSj ).
6) The required estimates of parameters k, α, β and σ are those which maximise the product
function L2.
pwhkFOS
βα ⋅⋅=

79
7) The final values of the parameters were based on the evidence concerning both the
stable and collapsed groups of cases. Hence, a solution was obtained by maximising
function L, where:
L = L1 · L2 with respect to k, α, β and σ.
(The product function L is known as the likelihood function, and the numerical values of
the parameters, which are derived from it, are called maximum likelihood estimators.)
From the above, Salamon and Munro drew the following conclusions:
1) They found a reasonably good agreement between the corresponding estimates obtained
from the stable cases and the failed cases.
2) All these data were then plotted on a graph, pillar load vs pillar strength. The average
load, in each case, was calculated from the tributary area theory, and the corresponding
strength from the power formula, using the estimated parameters. On this graph, the
collapsed and stable cases were distinguished.
3) The values for FOSc were scattered about a median value of unity, i.e. 50 percent of the
points corresponding to the collapsed cases fell on either side of a 45 degree line which
corresponds to FOSc = 1.
4) All but one of the points corresponding to the stable cases fell below the 45 degree line.
(According to the model, at most 50% of the points corresponding to the stable cases
should fall above the line of perfect prediction (FOSc = 1).)
5) Comparison between the observed and expected numbers indicated that the assumption
was reasonable.
6) It was reasonable to conclude that approximately 99 percent of the collapsed cases can
be expected to occur at FOS values in the range of 0,65 to 1,48.
7) The scatter in the results was due to three major causes. These were: natural causes,
the approximate nature of the strength formula, and human error.

80
It was also found that:
• As the size of test specimens increased, the influence of volume diminished, and that there
was perhaps a critical size, above which the effect of volume is negligible. (Bieniawski and
Van Heerden (1975) have subsequently supported this idea.) According to this approach,
strength changes in rock samples greater than the critical size, will be due to the geometry
of the sample, as captured in the w:h ratio (assuming pillars are square in plan).
• The influence of pillar height was less than estimated before.
A.1.5 Experiences with pillar design procedure
Wagner and Madden (1984) assessed the merits and shortcomings of the above pillar design
method 17 years after introduction of the method. It was found that the rate of pillar failure was
less than 0,003 which compared with the predicted probability of pillar failures of 0,003 for a FOS
= 1,6. It was also found that:
• the method of mining has an influence on pillar strength;
• the strength of squat pillars increases very rapidly, perhaps exponentially, with increase in
w:h ratio, once a certain ratio has been exceeded;
• the competency of the roof strata forming the bords should be taken into account.
A.2 Hedley and Grant (1972) approach
A.2.1 Introduction
Hedley and Grant concluded that scientific knowledge had not yet reached the stage of
producing rational design procedures which would reduce the dependence on trial-and-error
methods. Mine design evolved from trial-and-error and from the experiences of other mines. As
mining progressed, stope-and-pillar dimensions were modified to obtain greater extraction, and,
if pillar or roof failures occurred, the extraction was reduced to provide more stable conditions.
A.2.2 Statistical analysis of data
General information collected during the research program conducted by Hedley and Grant can
be summarised as follows:

81
• data were obtained from uranium mines of the Elliot Lake area;
• stress measurements in this area indicated that the K-ratio was in the order of 2;
• the orebodies were relatively flat and room- or stope-and-pillar methods of extraction were
used;
• where the dip of the seam was less than 20 degrees, the horizontal stress had little effect on
the pillar stress;
• pillar strengths could not be measured directly and had to be estimated from small-scale
laboratory tests and from back-analysing pillar failures;
• extrapolating the strength of pillars from laboratory size tests on rock samples allowed for
large inaccuracies;
Data used for the research on pillar design can be summarised as follows:
• 23 stable pillars, 2 cases of partial failure and 3 cases of complete pillar crushing were used;
• the information on complete pillar crushing was obtained second-hand because it happened
in mines which had been closed;
• the depth, dip, extraction, and pillar width and height were recorded;
• only eight cases had w:h ratios above one, with a maximum w:h ratio of 2,5;
• rib pillars were used
A.2.3 Pillar design
Hedley and Grant also recommended the use of the FOS relationship to express the stability of
pillars. They realised that an exact value of the FOS could not be calculated because of the
inaccuracies in pillar data. Their research procedure can be summarised as follows:
1) Pillar stress was estimated based on the tributary area theory, although the dip of the
orebody was also taken into account for orebodies inclined at more than 20 degrees.
Pillar strength was estimated using the power formula. This formula refers to square
pillars. It was, however, assumed that the strength of long and narrow pillars would not
be very much greater than that of square pillars of width equalling the minimum width of
the long pillar.
2) Values for α and β were derived by doing a literature survey which showed that the value
for α is relatively constant at 0,5, whereas that of β varies over a large range. The K
value was estimated from an extrapolation of laboratory tests results.

82
3) The estimated stress acting on the three crushed pillars was then substituted into the
power equation, along with the respective dimensions of the pillars, a K value of 133 MPa
and α equal to 0,5. Three values for β were then calculated ranging from 0,736 to 0,768,
with a mean of 0,75.
4) Consequently, pillar strength was related to pillar width and height by:
5) This formula was then used to
calculate the strengths of all the pillars.
The estimated pillar stresses were then plotted against pillar strengths together with lines
of safety factors. These results were compatible with observations. The factors of safety
of crushed pillars were grouped around 1,0, those of partially failed pillars between 1,0
and 1,3, and those of the stable pillars exceeded 1,5.
6) The above pillar design procedure was checked against actual pillars to confirm the
influence of varying pillar widths, depth of mining and percentage extraction on pillar
strengths.
Unfortunately, the influence of different pillar heights on pillar strengths could not be confirmed.
Also, due to the limitations in the data and the concomitant limitation in the analysis procedure,
the applicability of their results to other hard rock mining environments is unproven.
75,0
5,
133)(hwPStrengthPillar
o
s ⋅=

83
Appendix B
Fault-Event Tree methodology approach to risk assessment
B.1 IntroductionThe failure of any system, e.g. a fall of ground in an underground excavation, is seldom the result
of a single cause, or fault. Failure usually results after a combination of faults occurs in such a
way that the factor of safety of the system falls to below unity. A disciplined and systematic
approach is therefore required to determine the correct logic that controls the failure of the
system and to analyse the potential consequences of failure. One such approach, the Fault-Event Tree Analysis, is discussed in this appendix.
B.2 Cause/Fault Tree AnalysisFault Tree Analysis (FTA) is a quantitative or qualitative technique by which conditions and
factors that can contribute to a specified undesired incident (called the top fault) are deductively
identified, organised in a logical manner, and presented pictorially. It can also be defined as a
deductive failure analysis which focuses on one particular undesired fault and which provides a
method for determining causes of the fault.
FTA affords a disciplined approach that is highly systematic, but at the same time sufficiently
flexible to allow analysis of a variety of factors. The application of the top-down approach focuses
attention on those effects of failure that are directly related to the top fault. FTA is especially
useful for analysing systems with many interfaces and interactions.
Starting with the top fault, the possible causes or failure modes (primary faults) on the next
lower system level are identified. Following the step-by-step identification or undesirable system
operation to successively lower levels, secondary faults, tertiary faults, etc. are identified.
In order to determine the correct logic that controls the failure of the system, the faults are not
initially given probabilities of occurrence. In this form the “tree” is referred to as a “cause tree”.
Once the cause tree is considered to correctly reflect the combinations of faults necessary to
result in failure, probabilities are either calculated or assigned to the faults. In this form, the “tree”
is referred to as a “fault tree”.
Thus, a fault tree represents a quantitative or qualitative evaluation of the probabilities of various
faults leading to the calculation of the top faults, which result in failure of the system.

84
B.3 Probability evaluation in fault treeThe fault tree is a complex of entities known as gates which serve to permit or inhibit the
passage of fault logic up the tree. The gates show the relationships of faults needed for the
occurrence of a higher fault. AND gates and OR gates denote the type of relationship of the input
events required for the output event.
• AND gates are used where faults are statistically dependent. If it is necessary for n secondary
faults to occur in order for a primary fault to result, then the probability of occurrence, p, is
represented by:
• p[primary fault] = p[secondary fault 1] x p[secondary fault 2] x … x p[secondary fault
n]
• OR gates are used where faults are statistically independent. If a primary fault can result as
a consequence of the occurrence of any n secondary faults, then the probability of
occurrence is determined from the calculation as follows:
• p[primary fault] = 1 - (1 – p[secondary fault 1]) x (1 – p[secondary fault 2]) … (1 –
p[secondary fault n])
B.4 Event tree analysisThe potential damaging consequences of a top fault are known as events and the systematic
display of the events is referred to as an event tree. The probability of occurrence of a top fault
together with relative weighting for the associated potentially adverse events, enable their likely
occurrence to be determined. The product of the probability of occurrence and severity of the
damage of an event is defined as the risk.
The systematic nature of the Fault-Event Tree enables the sensitivities of the potentially adverse
consequences to any of the causative hazards to be evaluated. This enables the most
threatening causative hazards to be identified and eliminatory measures to be defined.

85
B.5 Allocation of probabilities of occurrenceThree measures are available for measuring reliability in engineering design, viz:
• the factor of safety;
• the reliability index, and;
• the probability of failure.
The factor of safety is a clearly understood and a numerically sensitive measure. It is, however,
not a consistent measure and is not determined in terms of consistent processes. The reliability
index is a consistent measure and is based on consistent processes for determining operational
values. Its meaning is, however, not clearly understood. It is also not numerically sensitive,
especially not with regard to higher orders of reliability.
The probability of failure is a consistent and numerically sensitive measure and is based on
consistent processes for the determination of operational values. The numerical sensitivity of the
probability of failure, however, detracts from the clarity of its meaning. The probabilities of various
kinds of losses of life, property, etc. vary exponentially over many orders of magnitude between
very large and very small values. The meaning of such a measure is often difficult to understand.
The difficulties that designers have in selecting acceptable thresholds for probability of failure can
be resolved by using the norms and guidelines for selecting acceptable probabilities of failure
for design, presented in a paper entitled: “Review of norms for probability of failure and risk in
engineering design”, (Kirsten, 1994). The acceptable lifetime probabilities of total loss of life
described by Kirsten (1994) are summarised below.
Degree of risk Acceptable lifetime probabilities(after Cole, 1993)
Very Risky 0,7
Risky 0,07
Some risk 0,007
Slight chance 0,000 7
Unlikely 0,000 07
Very unlikely 0,000 007
Practically impossible 0,000 000 7

86
In certain cases, probabilities of occurrence could also be determined more accurately by
assigning probability density functions to primary faults. This is particularly important in
geotechnical engineering designs where input parameters, especially those that are affected by
geology, are often not known accurately and the influence of their variability should be accounted
for. However, probabilistic analyses of multiple variables require sophisticated numerical
techniques that are beyond the scope of this project.
A simplified approach is to assign probabilities based on engineering judgement and past
experience with this type of work. Probabilities assigned to certain levels of risk as described in
the above table could be used as a guideline. The final result will then show if a more accurate
assessment of the probability of occurrence would be necessary. It is likely that the detailed
assessment will only be required for key sensitive areas which will be revealed by sensitivity
analysis.
It is important to note that probabilities of occurrence may not have unique or discreet values. It
is possible for a probability of a particular fault (or event) to change in sympathy with another
probability that it is coupled with. This is best illustrated by means of an example:
Take the example of a “wrong support installation procedure” being used in an
underground excavation. The probability of a wrong support installation procedure being
used depends upon the probability that:
- the knowledge about the correct support installation procedure is lacking, or;
- the equipment being used for support installations is out of order, or;
- the discipline and supervision are poor.
The probability that the knowledge about the correct support installation procedure is
lacking in turn depends on the probability that:
- the support installation procedure is not defined by the mine standards, or;
- the support installation procedure is not communicated to the workers, or;
- the workers are incompetent.
The probability that the workers are incompetent depends on the probability that:
- inadequate training is provided, or;
- the workers are untrainable.

87
The probability of a wrong support installation procedure being used could be different for
different parts or sections of the mine. For example, the equipment being used for support
installation in one section could be more reliable than the equipment being used in another
section.
The acceptability of probabilities of failure for particular design applications can be
evaluated in terms of the magnitudes and distributions of actual frequencies of total
losses of life, property and money. For example, the lifetime frequencies of fatalities due
to unstable ground in gold and coal mines in South Africa in 1993 amounted to
approximately 7,9% and 2,8% respectively (Kirsten, 1994). (These correspond with
fatality rates/1000 at work of 0,76 and 0,37 respectively.) According to Cole (1993), an
acceptable lifetime probability of loss of life in respect of voluntary employment in
underground mines would be 0,7%.
Ground conditions are known to carry potentially high risks and uncertainty. According
to Sowers (1993) a study of 500 geotechnical failures revealed that 88 percent of the
failures were produced by human shortcomings and that 75 percent of the failures
originated in the design process. It is for these reasons that Kirsten (1994) suggested
that acceptable levels for probabilities of failure for which designs may be prepared
should be significantly smaller than the actual probabilities of failure observed for similar
situations.

88
Appendix C
Fault tree analysis of the thread of regional pillar collapseunder the influence of surface topography

89
Fault tree analysis - Regional collapse due to influence of surface topography
Threat of regional collapse 7.39E-01
1 Inadequate pillar strength OR 7.46E-02
1.1 Inadequate pillar strength (unsupported) AND 7.46E-01
1.1.1 Inadequate rock mass strength OR 5.70E-01
1.1.1.1 Deficient pillar material strength OR 3.44E-01
1.1.1.1.1 Deficient pillar material strength due to in situ rock mass conditions OR 3.44E-01
1.1.1.1.1.1 Deficient pillar material strength due to adverse geology OR 3.44E-01
1.1.1.1.1.1.1 Weak intact rock OR 1.00E-01 VH1.1.1.1.1.1.2 Deterioration of rock on exposure (e.g. weathering) OR 1.00E-01 VH1.1.1.1.1.1.3 Adverse geological structure 1.90E-01
1.1.1.1.1.1.3.1 Intersected by large discontinuity OR 1.00E-04 L1.1.1.1.1.1.3.2 Adverse parting planes (e.g. parting planes with weak infill material, closely spaced parting planes causing thin beams) OR 1.00E-01 VH1.1.1.1.1.1.3.3 Adverse jointing (e.g. flat dipping joints, high joint frequency, joints with infill material) 1.00E-01 VH
1.1.1.1.1.2 Deficient pillar material strength due to adverse groundwater conditions 1.00E-04 L
1.1.1.1.2 Deficient pillar material strength due to mining induced conditions 1.00E-04
1.1.1.1.2.1 Deficient pillar material strength due to poor blasting practice 1.00E-04 L
1.1.1.2 Deficient foundation material strength OR 7.00E-04
1.1.1.2.1 Deficient foundation material strength due to in situ rock mass conditions OR 6.00E-04
1.1.1.2.1.1 Deficient foundation material strength due to adverse geology OR 5.00E-04
1.1.1.2.1.1.1 Weak intact rock OR 1.00E-04 L
1.1.1.2.1.1.2 Deterioration of rock on exposure OR 1.00E-04 L
1.1.1.2.1.1.3 Adverse geological structure 3.00E-04
1.1.1.2.1.1.3.1 Intersected by large discontinuity OR 1.00E-04 L
1.1.1.2.1.1.3.2 Adverse parting planes (e.g. parting planes with weak infill material, closely spaced parting planes causing thin beams) OR 1.00E-04 L
1.1.1.2.1.1.3.3 Adverse jointing (e.g. flat dipping joints, high joint frequency, joints with infill material) 1.00E-04 L
1.1.1.2.1.2 Deficient foundation material strength due to adverse groundwater conditions 1.00E-04 L
1.1.1.2.2 Deficient foundation material strength due to mining induced conditions 1.00E-04
1.1.1.2.2.1 Deficient foundation material strength due to poor blasting practice 1.00E-04 L
1.1.1.3 Deficient hangingwall material strength 3.44E-01
1.1.1.3.1 Deficient hangingwall material strength due to in situ rock mass conditions OR 3.44E-01
1.1.1.3.1.1 Deficient hangingwall material strength due to adverse geology OR 2.71E-01
1.1.1.3.1.1.1 Weak intact rock OR 1.00E-04 L
1.1.1.3.1.1.2 Deterioration of rock on exposure OR 1.00E-01 VH
1.1.1.3.1.1.3 Adverse geological structure 1.90E-01
1.1.1.3.1.1.3.1 Intersected by large discontinuity OR 1.00E-04 L

90
1.1.1.3.1.1.3.2 Adverse parting planes (e.g. parting planes with weak infill material, closely spaced parting planes causing thin beams) OR 1.00E-01 VH
1.1.1.3.1.1.3.3 Adverse jointing (e.g. flat dipping joints, high joint frequency, joints with infill material) 1.00E-01 VH
1.1.1.3.1.2 Deficient hangingwall material strength due to adverse groundwater conditions 1.00E-01 VH
1.1.1.3.2 Deficient hangingwall material strength due to mining induced conditions 1.00E-04
1.1.1.3.2.1 Deficient hangingwall material strength due to poor blasting practice 1.00E-04 L
1.1.2 Inadequate pillar geometry (size, shape, geometry) 4.10E-01
1.1.2.1 Incorrect / inadequate standards for pillar geometry 4.10E-01
1.1.2.1.1 Pillars geometry designed incorrectly (too small, inappropriate shape, unfavourable orientation)l 4.10E-01
1.1.2.1.1.1 Inappropriate pillar design methodology OR 3.44E-01
1.1.2.1.1.1.1 Incorrect assessment of ground conditions OR 1.00E-01 VH
1.1.2.1.1.1.2 Incorrect assessment of loading conditions OR 1.00E-01 VH
1.1.2.1.1.1.3 Incorrect assessment of failure mechanism OR 1.00E-01 VH
1.1.2.1.1.1.4 Selection of design methodology inappropriate 1.00E-01 VH
1.1.2.1.1.2 Incorrect application of pillar design methodology 1.00E-01
1.1.2.1.1.2.1 Design parameters selected incorrectly OR 1.00E-01 VH
1.1.2.1.1.2.2 Calculation error 1.00E-04 L
1.1.2.1.2 Standard for pillar geometry does not comply with pillar design 1.00E-04 L
1.1.2.2 Incorrect application of standards for pillar geometry 1.10E-03
1.1.2.2.1 Pillar geometry standard selected inappropriate forconditions OR
2.00E-04
1.1.2.2.1.1 Pillar geometry standard selected inappropriate for conditions OR 1.00E-04 L
1.1.2.2.1.2 Incorrect assessment of ground conditions 1.00E-04 L
1.1.2.2.2 Pillar geometry standard not properly applied 9.00E-04
1.1.2.2.2.1 Pillar cut too narrow (off line) OR 1.00E-04 L
1.1.2.2.2.2 Pillar cut too high (off line) OR 1.00E-04 L
1.1.2.2.2.3 Pillar too narrow due to pillar scaling OR 1.00E-04 L
1.1.2.2.2.4 Pillar too narrow due to pillar robbing OR 1.00E-04 L
1.1.2.2.2.5 Pillar too high due to excessive width of seam OR 1.00E-04 L
1.1.2.2.2.6 Incorrect pillar layout used OR 1.00E-04 L
1.1.2.2.2.7 Inappropriate pillar shape (e.g. long rib pillars) OR 1.00E-04 L
1.1.2.2.2.8 Inappropriate pillar orientation (e.g. parallel with major structures) OR 1.00E-04 L
1.1.2.2.2.9 Pillar too high due to hangingwall fallout 1.00E-04 L
1.2 Inadequate reinforcement of pillars (e.g. backfill, rockbolts, cable anchors) 1.00E-01 VH

91
2 Adverse pillar loading 7.18E-01
2.1 Adverse natural loading OR 1.90E-01
2.1.1 Adverse dynamic loading due to natural seismicity (e.g. earth quakes) OR 1.00E-06 EL
2.1.2 Adverse static loading due to in situ stress 1.90E-01
2.1.2.1 In situ stress adversely high OR 1.00E-01
2.1.2.1.1 In situ stress adversely high due to topography (tectonics, residual stress) OR 1.00E-01 VH
2.1.2.2 In situ stress adversely low 1.00E-01
2.1.2.2.1 In situ stress adversely low due to proximity to surface OR 1.00E-01 VH
2.1.2.2.2 In situ stress adversely low due to tectonics 1.00E-04 L
2.2 Adverse mining induced loading 6.52E-01
2.2.1 Adverse dynamic loading due to mining induced seismicity (e.g. rockbursts) 1.00E-06 EL
2.2.2 Adverse static loading due to inappropriate mining layouts 6.52E-01
2.2.2.1 Inadequate mine layout standards OR 6.51E-01
2.2.2.1.1 Inadequate standard for excavation geometry OR 4.10E-01
2.2.2.1.2 Inadequate standard for pillar geometry resulting in inappropriate excavation geometry 4.10E-01
2.2.2.1.2.1 Pillars geometry designed incorrectly (too small, inappropriate shape, unfavourable orientation)l 4.10E-01
2.2.2.1.2.1.1 Inappropriate pillar design methodology OR 3.44E-01
2.2.2.1.2.1.2 Incorrect application of pillar design methodology 1.00E-01
2.2.2.1.2.2 Standard for pillar geometry does not comply with pillar design 1.00E-04
2.2.2.2 Incorrect application of mine layout standards 1.80E-03
2.2.2.2.1 Incorrect application of excavation geometry standards OR 7.00E-04
2.2.2.2.1.1 Excavation geometry standard selected inappropriate for conditions OR 1.00E-04 L
2.2.2.2.1.2 Excavation geometry standard not properly applied 6.00E-04
2.2.2.2.1.2.1 Excavation excessively high OR 1.00E-04 L
2.2.2.2.1.2.2 Excavation excessively wide OR 1.00E-04 L
2.2.2.2.1.2.3 Inappropriate orientation (e.g. parallel to high stress abutment) OR 1.00E-04 L
2.2.2.2.1.2.4 Inappropriate excavation shape (e.g. brows causing low confining stresses) OR 1.00E-04 L
2.2.2.2.1.2.5 Layout do not comply with excavation geometry standard OR 1.00E-04 L
2.2.2.2.1.2.6 Location of excavation inappropriate (e.g. too small middling, too close to stope abutments, etc.) 1.00E-04 L
2.2.2.2.2 Incorrect application of pillar geometry standard resulting in inappropriate excavation geometry 1.10E-03
2.2.2.2.2.1 Pillar geometry standard selected inappropriate for conditions OR 2.00E-04
2.2.2.2.2.2 Pillar geometry standard not properlyapplied
9.00E-04
Related Documents