INFLUENCE OF STRATEGY IMPLEMENTATION ON THE PERFORMANCE OF MANUFACTURING SMALL AND MEDIUM FIRMS IN KENYA MWANGI PETER KIHARA DOCTOR OF PHILOSOPY (Business Administration) JOMO KENYATTA UNIVERSITY OF AGRICULTURE AND TECHNOLOGY 2016

Welcome message from author
This document is posted to help you gain knowledge. Please leave a comment to let me know what you think about it! Share it to your friends and learn new things together.
Transcript

INFLUENCE OF STRATEGY IMPLEMENTATION ON
THE PERFORMANCE OF MANUFACTURING SMALL
AND MEDIUM FIRMS IN KENYA
MWANGI PETER KIHARA
DOCTOR OF PHILOSOPY
(Business Administration)
JOMO KENYATTA UNIVERSITY OF
AGRICULTURE AND TECHNOLOGY
2016

Influence of Strategy Implementation on the Performance of Manufacturing
Small and Medium Firms in Kenya
Mwangi Peter Kihara
A Thesis Submitted in Partial Fulfillment for the Degree of Doctor of
Philosophy in Business Administration (Strategic Management Option)
in the Jomo Kenyatta University of Agriculture and Technology
2016

ii
DECLARATION
This thesis is my original work and has not been presented for a degree in any other
university.
Signature ……………………. Date ………………………………..
Mwangi Peter Kihara
This thesis has been submitted for examination with our approval as university
supervisors
Signature …………………………. Date …………………………………..
Professor Henry M. Bwisa
JKUAT, Kenya
Signature …………………………….. Date………………………………..
Professor John M. Kihoro
Cooperative University of Kenya

iii
DEDICATION
To Joyce, Consolata, Perpetua and Tracy

iv
ACKNOWLEDGEMENT
My profound appreciations go to my supervisors Professor Henry M. Bwisa and
Professor John M. Kihoro who took a keen interest in my progress from thesis
conception up to writing the final report. Their tireless efforts, ad-hoc advice,
constructive criticisms and timely feedback enabled this thesis to take shape. I also want
to thank all my lecturers in the Ph.D program who continuously shaped and reshaped my
thinking in research especially Professor Gregory Namusonge, Professor Elegwa
Mukulu, Dr. Esther Waiganjo, Dr. Hazel Gachunga and Dr. Karanja Kabare. I also want
to recognize the owners/ or CEOs of the manufacturing SME firms in Thika Sub-County
for allowing me to collect data in their firms and the time and efforts of my research
assistants who supported me in data collection. I am always indebted to you.
Secondly, I wish to register my sincere gratitude to my wife Joyce Nyambura Mwangi
for her encouragement and moral support and to my lovely daughters Consolata Njoki,
Perpetua Wangari and Tracy Muthoni who, for many times, missed my whole hearted
attention as I spent many days thinking and working on this thesis. This was the most
challenging moment that the entire family eagerly looked forward to the successful
completion of my studies. Kudos to my family, you are and will always remain dear in
my heart and to my father, William Kihara, mother, Fraciah Njoki, who took a keen
interest in my education right from childhood and for having foregone so much in life to
give me a profound education base. May the God Almighty forever bless you.
Finally, I wish to thank all my colleagues at KeMU who assisted me in one way or
another and made this thesis work come into fruition. This goes to Dr. Risper Orero, Dr.
Rachael Gesami, Dr. Thomas Senaji, Dr. Wanja Tenambergen, Dr. John Mariene, Mr.
Simon Muriithi and Ms. Rosalia Kitaka. To all and those who assisted me and their
names are not mentioned here, I say, thanks a lot.

v
TABLE OF CONTENTS
DECLARATION .............................................................................................................. ii
DEDICATION .................................................................................................................iii
ACKNOWLEDGEMENT .............................................................................................. iv
TABLE OF CONTENTS ................................................................................................ v
LIST OT TABLES ........................................................................................................viii
LIST OF FIGURES ...................................................................................................... xiv
LIST OF APPENDICES .............................................................................................. xvi
LIST OF ACRONYMS AND ABBREVIATIONS ................................................... xvii
DEFINITION OF TERMS ........................................................................................... xix
ABSTRACT .................................................................................................................. xxii
CHAPTER ONE .............................................................................................................. 1
INTRODUCTION ............................................................................................................ 1
1.1 Background of the Study .............................................................................................. 1
1.2 Statement of the Problem ........................................................................................... 12
1.3 Objectives of the Study .............................................................................................. 13
1.4 Hypotheses of the Study ............................................................................................. 14
1.5 Significance of the study ............................................................................................ 16
1.6 Scope of the Study ..................................................................................................... 18
1.7 Limitations of the Study ............................................................................................. 18
CHAPTER TWO ........................................................................................................... 20
LITERATURE REVIEW ............................................................................................. 20
2.1 Introduction ................................................................................................................ 20

vi
2.2 Theoretical Framework .............................................................................................. 20
2.3 Conceptual Framework ............................................................................................. 33
2.4 Review of Literature and Variables........................................................................... 35
2.5 Critique of the Existing Literature............................................................................. 56
2.6 Research Gaps ........................................................................................................... 60
2.7 Summary ................................................................................................................... 61
CHAPTER THREE ....................................................................................................... 63
RESEARCH METHODOLODY ................................................................................. 63
3.1 Introduction ................................................................................................................ 63
3.2 Research Design ......................................................................................................... 63
3.3 Target Population ....................................................................................................... 64
3.4 Sampling Frame ......................................................................................................... 65
3.5 Sample and Sampling Technique ............................................................................... 66
3.6 Data Collection Instruments ...................................................................................... 68
3.7 Data Collection Procedures ........................................................................................ 69
3.8 Pilot Test Results ....................................................................................................... 70
3.9 Data Analysis and Presentation.................................................................................. 72
CHAPTER FOUR .......................................................................................................... 82
RESEARCH FINDINGS AND DISCUSSION ............................................................ 82
4.1 Introduction ................................................................................................................ 82
4.2 Response Rate ............................................................................................................ 82
4.3 Demographics Characteristics of the Respondents .................................................... 82
4.4 Demographic Characteristics of the SME Firm ......................................................... 90

vii
4.5 Descriptive Statistics of the SME firm ...................................................................... 93
4.6 Bivariate Correlations .............................................................................................. 105
4.7 Inferential Statistical Analysis ................................................................................. 107
4.7.1 Influence of Leadership on the SME Performance ............................................... 111
4.7.2 Influence of the Structural Adaptations on the SME Performance ....................... 120
4.7.3 Influence of Human Resources on the SME Performance ................................... 128
4.7.4 Influence of Technology on the SME Performance ............................................ 132
4.7.5 Influence of Strategic Direction and SME Performance ..................................... 135
4.8 The Combined Effects of all Variables: (Multiple Regression) .............................. 138
4.9 Moderating of the Firm Level Characteristics on Strategy & Performance ............ 142
4.9.1Moderation Effect of Age: Overall Model ............................................................. 182
4.9.3 Qualitative Data Analysis ..................................................................................... 194
CHAPTER FIVE ......................................................................................................... 200
SUMMARY, CONCLUSION AND RECOMMENDATIONS ................................ 200
5.1 Introduction .............................................................................................................. 200
5.2 Summary .................................................................................................................. 200
5.3 Conclusion ............................................................................................................... 207
5.4 Recommendations .................................................................................................... 209
5.5 Areas for Further Research ...................................................................................... 211
REFERENCES ............................................................................................................. 214
APPENDICES .............................................................................................................. 239

viii
LIST OT TABLES
Table 3.1: Target Population ........................................................................................... 64
Table 3.2: Sampling Frame ............................................................................................. 66
Table 3.3: Sample Size .................................................................................................... 68
Table 3.4: Reliability and Validity Measurement Results .............................................. 71
Table 3.5: Operationalization of Variables ..................................................................... 76
Table 3.6: Study Hypotheses .......................................................................................... 81
Table 4.1: Gender, Education and Current Position: Cross-tabulations ......................... 87
Table 4.2: Age, Education and Current Position: Cross-tabulation ................................ 89
Table 4.3: Age and Size of Manufacturing SME: Cross-tabulation ............................... 92
Table 4.4: Descriptive Statistics on SME Performance .................................................. 94
Table 4.5: Bivariate Correlation Results: All Variables ............................................... 105
Table 4.6: Tests for Normality ...................................................................................... 108
Table 4.7: Leadership Styles Model Validity ............................................................... 112
Table 4.8: Leadership Styles and SME Performance: Coefficients .............................. 112
Table 4.9: Specific Leadership Styles Bivariate Correlations Coefficients .................. 114
Table 4.10: Specific Leadership Styles: Model Validity .............................................. 115

ix
Table 4.11: Specific Leadership Styles: Regression Weights ....................................... 115
Table 4.12: Structural Adaptations and SME Performance: Model Validity ............... 120
Table 4.13: Structural Adaptations and SME Performance: Regression Weights ........ 121
Table 4.14: Specific Structural Dimensions: Correlation Coefficients ......................... 123
Table 4.15: Specific Structural Dimensions and Performance: Model Validity ........... 124
Table 4.16: The Combined Structural Dimensions: Regression Weights .................... 124
Table 4.17: Work Specialization and Performance: Regression Weights .................... 126
Table 4.18: Human Resources and Performance: Model Validity ............................... 129
Table 4.19: Human Resources and SME Performance: Regression Weights ............... 129
Table 4.20: Technology and SME Performance: Model Validity ................................ 132
Table 4.21: Technology and Performance: Regression Weights .................................. 133
Table 4.22: Strategic Direction and SME Performance: Model Validity ..................... 136
Table 4.23: Strategic Direction and SME Performance: Regression Weights ............. 136
Table 4.24: The Multiple Regression: Model Validity ................................................. 139
Table 4.30: The Multiple Regression: Model Summary ............................................... 140
Table 4.26: The Multiple Regression: Weights of Variables ........................................ 141
Table 4.27: Summary of Results of Hypotheses Tested ............................................... 142

x
Table 4.28: Moderating Effect of Age on Leadership Styles and Performance: Model
Validity .......................................................................................................................... 144
Table 4.29: Moderating Effect of Age on Leadership Styles and Performance: Model
Summary ........................................................................................................................ 145
Table 4.30: Moderating Effect of Age on Leadership Styles and Performance:
Regression Coefficients ................................................................................................. 146
Table 4.31: Moderating Effect of Size on Leadership Styles and Performance: Model
Validity .......................................................................................................................... 149
Table 4.32: Moderating Effect of Size on Leadership Styles and Performance: Model
Summary ........................................................................................................................ 150
Table 4.33: Moderating Effect of Size on Leadership Styles and Performance:
Regression Weights ....................................................................................................... 151
Table 4.34: Moderating Effect of Age on Structure and Performance: Model Validity
........................................................................................................................................ 153
Table 4.35: Moderating Effect of Age on Structure and Performance: Model Summary
........................................................................................................................................ 154
Table 4.36: Moderating Effect of Age on Structure and Performance: Regression
Weights .......................................................................................................................... 155
Table 4.37: Moderating Effect of Size on Structure and Performance: Model Validity
........................................................................................................................................ 156
Table 4.38: Moderating Effect of Size on Structure and Performance: Model Summary
........................................................................................................................................ 157

xi
Table 4.39: Moderating Effect of Size on Structure and Performance: Regression
Weights .......................................................................................................................... 159
Table 4.40: Moderating Effect of Age on Human Resource and Performance: Model
Validity .......................................................................................................................... 160
Table 4.41: Moderating Effect of Age on Human Resource and Performance: Model
Summary ........................................................................................................................ 161
Table 4.42: Moderating Effect of Age on Human Resource and Performance:
Regression Weights ....................................................................................................... 162
Table 4.43: Moderating Effect of Size on Human Resource and Performance: Model
Validity .......................................................................................................................... 163
Table 4.44: Moderating Effect of Size on Human Resource and Performance: Model
Summary ........................................................................................................................ 164
Table 4.45: Moderating Effect of Size on Human Resource and Performance:
Regression Weights ....................................................................................................... 165
Table 4.46: Moderating Effect of Age on Technology and Performance: Model Validity
........................................................................................................................................ 166
Table 4.47: Moderating Effect of Age on Technology and Performance: Model
Summary ........................................................................................................................ 167
Table 4.48: Moderating Effect of Age on Technology and Performance: Regression
Weights .......................................................................................................................... 168
Table 4.49: Moderating Effect of Size on Technology and Performance: Model Validity
........................................................................................................................................ 171

xii
Table 4.50: Moderating Effect of Size on Technology and Performance: Model
Summary ........................................................................................................................ 172
Table 4.51: Moderating Effect of Size on Technology and Performance: Regression
Weights .......................................................................................................................... 173
Table 4.52: Moderating Effect of Age on Strategic Direction and Performance: Model
Validity .......................................................................................................................... 174
Table 4.53: Moderating Effect of Age on Strategic Direction and Performance: Model
Summary ........................................................................................................................ 175
Table 4.54: Moderating Effect of Age on Strategic Direction and Performance:
Regression Weights ....................................................................................................... 176
Table 4.60: Moderating Effect of Size on Strategic Direction and Performance: Model
Validity .......................................................................................................................... 178
Table 4.56: Moderating Effect of Size on Strategic Direction and Performance: Model
Summary ........................................................................................................................ 179
Table 4.57: Moderating Effect of Size on Strategic Direction and Performance:
Regression Weights ....................................................................................................... 180
Table 4.58: Moderation Effect of Age in all variables: Model Validity ...................... 183
Table 4.59: Moderation Effect of Age: Model Summary ............................................. 184
Table 4.60: Moderation Effect of Age: Regression Weights ........................................ 185
Table 4.61: Moderation Effect of Size in all Variables: Model Validity ...................... 189

xiii
Table 4.62: Moderation Effect of Size in all Variables: Model Summary ................... 190
Table 4.63: Moderation Effect of Size: Regression Weights ........................................ 191
Table 4.64: Summary of Moderation Effects: Hypotheses Tested ............................... 194
Table 4.65: How to Improve Awareness of the Firm’s Strategic Direction ................. 195
Table 4.66: Areas in Human Resources the SMEs need to improve on ....................... 196
Table 4.67: Areas in Technology the SMEs need to improve on ................................. 198

xiv
LIST OF FIGURES
Figure 2.1: McKinsey 7-S Framework ......................................................................... 28
Figure 2.2: Higgin’s 8-S Framework ............................................................................ 30
Figure 2.3: The Conceptual Framework ...................................................................... 34
Figure 4.1: Gender of the Respondents ....................................................................... 83
Figure 4.2: Positions held by the Respondents ........................................................... 84
Figure 4.3: Age of the Respondents by Category ....................................................... 85
Figure 4.4: Education of the Respondents .................................................................. 86
Figure 4.5: Location of the SME firm ........................................................................ 90
Figure 4.6: Core Business of the manufacturing SME ............................................... 91
Figure 4.7: Availability of a Strategic Plan in SME firms .......................................... 92
Figure 4.8: Common Strategies Pursued by the SME firm ....................................... 93
Figure 4.9: Common Leadership Styles Practiced in SME Firms in Kenya ............. 96
Figure 4.10: Structures Adopted by the Manufacturing SMEs in Kenya .................... 98
Figure 4.11: Level of Formalization in the Manufacturing SME Firm ..................... 100
Figure 4.12: SME Firm’s Ability to Adapt to Technological Changes ..................... 102
Figure 4.13: Q-Q Plot for SME performance ........................................................... 109

xv
Figure 4.14: Histogram on SME performance data distribution .............................. 110
Figure 4.15: Q-Q Plot for Leadership Styles ............................................................ 110
Figure 4.16: Histogram on Leadership Styles data distribution ............................... 111
Figure 4.17: Moderating Effect of Age on Leadership and SME Performance ....... 147
Figure 4.18: Moderating Effect of Age on Technology and SME Performance ...... 169
Figure 4.19: Moderating Effect of Size on Strategic Direction and Performance .... 181

xvi
LIST OF APPENDICES
Appendix i: Introduction Letter .................................................................................... 239
Appendix ii: Questionnaire ........................................................................................... 240
Appendix iii: Questionnaire-Leadership Styles ............................................................ 242
Appendix iv: Questionnaire-Structures ........................................................................ 243
Appendix v: Questionnaire-Attention to Human Resources ........................................ 244
Appendix vi: Questionnaire-Attention to Technology ................................................. 245
Appendix vii: Questionnaire-Emphasis On Strategic Direction ................................... 246
Appendix viii: List of Firms ......................................................................................... 247
Appendix ix: Okumu’s Strategy Implementation Framework...................................... 249

xvii
LIST OF ACRONYMS AND ABBREVIATIONS
ANOVA Analysis of Variance
DCV Dynamic Capability View
EC European Commission
CEO Chief Executive Officer
CRM Customer Relations Management
GST General Systems Theory
HR Human Resources
HRM Human Resource Management
ICT Information Communication Technology
IFC International Finance Corporation
ISO International Standard Organization
Kshs Kenya Shillings
Kms Kilometers
MBEP Management-by-Exception Passive
MLQ-6S Multi-factor Leadership Questionnaire short form
MMR Moderated Multiple Regression

xviii
MSE Micro and Small Enterprise
OLS Ordinary Least Square Regression
PESTEL Political, Economic, Social, Technological & Legal
R & D Research and Development
RBV Resource Based View
ROA Return on Assets
ROE Return on Equity
RoK Republic of Kenya
SME Small and Medium Enterprises
SPSS Statistical Package for Social Sciences
USD United States Dollars
VRIO Valuable, Rare, Inimitable and Organization

xix
DEFINITION OF TERMS
Strategy Strategy is a choice of a unique and a valuable
position which is rooted in system of activities that
are much more difficult to match. (Porter, 1996).
Jonas (2000) defines strategy as a plan of action that
allows the organization to accomplish her mission in
terms of goals, objectives and purpose.
Strategy implementation This is the process that turns strategies and plans into
actions in order to accomplish strategic
objectives/goals (Jouste & Fourie, 2009; Sage, 2015).
It focuses on the processes through which strategies
are achieved. Questions addressed are who, where,
when and how, the organizational objectives will be
achieved (Barnat, 2012).
Strategic leadership It is a leadership style that provides vision and
direction for the growth and success of an
organization. Its purpose during strategy
implementation is to maintain effective
communication, make crucial decisions, motivate
staff and build a strong team that deriver good results
(Mehdi & Rowe, 2009).
Strategic direction This refers to the courses of actions adopted by an
organization that leads to the achievement of goals of
an organizational strategy. Components of a good
strategic direction include a vision, mission, goals

xx
and objectives of an organization (Dess & Picken,
2000).
Leadership style This refers to the consistent pattern of behavior
exhibited by leaders when relating to subordinates
and others. Major issues include the way leader’s
presents, communicate, and control the people or
situation (Higgins, 2005).
Performance Performance is a major construct in strategy because
almost every researcher attempts to relate their
constructs to organization’s performance
(Sorooshian, Norzima, Yusuf, & Rosnah, 2010).
Combs, Crook and Shook (2005) views performance
as an “economic outcomes resulting from the
interplay among organizational attributes, actions and
environment. Performance is mostly measured in
financial terms (Barnat, 2012) and it encompasses
three specific areas namely: (1) financial performance
(profits, return on assets, return on investment); (2)
market performance (sales, market share); and (3)
shareholder return (total shareholder return, economic
value added)
SME “SME” stand for Small and Medium sized
Enterprises, which according to the literature, has no
universally accepted definition. According to World
Bank (IFC, 2012), an SME is a registered business

xxi
where small businesses employ between 10-50
people, has a total annual sales of between 100,000 to
3 million USD while a medium enterprise employ
between 50-300 people, has a total annual sales of
between 3 million to 15 million USD. Most
definitions of SMEs are based on the number of
employees since it is easier to collect information
about employees than any other criteria used to
define SMEs.
Structure It is a set of building blocks that can be used to
configure an organization (Griffin, 2013). It refers to
the hierarchical arrangement of duties and
responsibilities, lines of authority, communications
and coordination of activities in an organization.
HR Management HRM is the term used to describe all those activities
concerned with recruiting and selecting, designing
work, training and developing, appraising and
rewarding, directing, motivating and controlling
workers in an organization (Wilton, 2013).
Technology Technology is a means to fulfill a human purpose. It
is a method or process or device, it may be
complicated, or it may be material, or it may be
nonmaterial. Whichever it is, it is always a means to
carry out a human purpose.” (Arthur, 2011).

xxii
ABSTRACT
This study aimed at establishing the influence of strategy implementation on the
performance of manufacturing SMEs moderated by age and size of the firm.
Specifically, the study intended to establish whether leadership styles, structure, human
resources, technology and strategic direction influences the performance of
manufacturing SMEs in Kenya. The study is anchored in the Dynamic Capabilities View
of the firm where successful firms master and develops unique capabilities that drive
them to superior performance. Guided by the philosophy of logical positivism, a mixed
design involving quantitative and qualitative designs was used to obtain information
from 115 firms drawn from the total population of 593 registered SMEs in Kenya.
Stratified sampling technique was used to classify these firms as small or medium,
young or old. A systematic random sampling was the used to select the SMEs that
participated in this study. In each firm selected, a self-administered questionnaire was
then used to collect data from 115 respondents who were either the real owners or
CEOs. Data was analyzed using SPSS and summary statistics such mean scores,
variances, standard deviation and inferential statistics namely; correlation and regression
results were used to present the data. Bivariate correlations and regression results were
also used to test the hypotheses. The results provided statistical evidence that a positive
and significant influence exists between strategy implementation and performance of the
manufacturing SMEs. Specifically, four out of five drivers tested in this study were
found to be significant and positive influence on the performance of manufacturing
SMEs. These drivers are leadership styles, structural adaptations, human resources and
technology embraced by the SME firm. The emphasis on the strategic direction of the
firm was found to be statistically insignificant. The study also noted that the age and size
of the firm does not significantly influence on the relationship between strategy
implementation and performance of the SMEs in Kenya. In the practice, this study
recommends that the manufacturing SMEs should build more and stronger capacities
and capabilities in leadership skills by adopting more of the transformational leadership
qualities, maintain flexible structures that are well matched to their goals, maintain a
proper balance between strategy and human resources and pay close attention to their
technology requirements. On methodology, the study recommends further studies using
experimental designs since strategy implementation is a process and actual effects,
influence or impact can only be well captured using a longitudinal approach. On policy,
the study recommends that the Kenyan government need to assist the SMEs by setting a
strong policy framework that focuses on technological needs and improvements; market
and capacity building to enable these firms run and perform better.

1
CHAPTER ONE
INTRODUCTION
1.1 Background of the Study
Strategy implementation is the second step in the strategic management process and it is
usually regarded by many scholars and practitioners of management as the most
difficult, challenging and time consuming activity (Barnat, 2012; Sage, 2015; Sial,
Usman, Zufiqar, Satti & Khurheed, 2013). Other steps in the process include the strategy
formulation and control which come first and third respectively.
The strategy implementation process determines whether an organization excels,
survives or dies (Barnat, 2012) depending on the manner in which it is undertaken by the
stakeholders. In turbulent environments, the ability to implement new strategies quickly
and effectively may well mean the difference between success and failure for an
organization (Drazin & Howard, 1984; Hauc & Kovac, 2000). The practical experiences
and scholarly works in the past have indicated that strategy implementation has a
significant influence on organizational performance (Hrebiniak & Joyce, 1984; Li,
Gouhui & Eppler, 2010). Therefore, it follows that successful execution and
implementation of strong and robust strategies will always give a firm a significant
competitive edge (Sage, 2015), especially in the industries where unique strategies are
difficult to achieve (Noble, 1999).
Before a strategy is implemented, it has to be formulated first. The strategy formulation
and implementation activities are intertwined and should not be separated during the
strategic planning stage. However, the literature indicates that many scholars in strategic
management have concentrated their researches on strategy formulation and neglected
research works on strategy implementation (Heracleous, 2000; Hrebiniak, 2005),

2
therefore, the literature on strategy implementation exists in pockets, is fragmented and
is inadequate (Noble, 1999).
Strategy implementation is a more elaborate and difficult task than strategy formulation
(Sage, 2015) and involves concentrated efforts and actions and by all stakeholders in an
organization. Hrebiniak (2006) underscored that it is not only true for people to believe
that strategy formulation is a difficult task because it is even more difficult to implement
that strategy throughout the organization.
The meaning of term strategy has been approached differently by different scholars.
According to Porter (1996), the essence of a strategy is to choose a unique and a
valuable position rooted in system of activities that are much more difficult to match.
The term strategy was first used by Chandler (1962) to refer to the determination of
basic long term goals of an enterprise, the adoption of the courses of action and the
allocation of resources necessary to carry out these goals. This implies that a strategy is
a long term plan of an organization that shows how resources will be mobilized,
marshaled and deployed in a way that guarantee success to an organization in terms of
goal achievement and attaining competitive advantage. It is documented by the
researchers in strategic management that strategy became the most important concept in
management sciences in the second half of twentieth century (Sial et al., 2013).
The main focus of the earlier researchers in management after Chandler (1962) was in
strategy formulation at the expense strategy implementation and control. However, in
recent studies, the situation has changed and attention of the researchers, practitioners
and other stakeholders in management has shifted towards successful implementation of
strategic plans in organizations (Sial et al., 2013). This phenomenon may be explained
by the ability of successful strategy implementation process to deliver better
organizational performance and success.

3
Speculand (2009) underscored the importance of the strategy implementation and
concluded that the success of any business entity is not governed by how well strategies
are formulated but how a good strategy is implemented in order to realize the goals and
objectives it was set to achieve. Strategy implementation is viewed as a dynamic activity
within the strategic management literature that define the manner in which organization
should develop, utilize and amalgamate organizational structures, control systems and
manage culture in implementing strategies that lead to competitive advantage and
improved performance (Jooste & Fourie, 2009; Sorooshian, Norzima, Yusuf & Rosnah,
2010).
Several other researchers in strategy have underscored the importance of strategy
implementation and made the following observations, strategy implementation is a
critical process that guarantees proper functioning and survival of an organization during
turbulent times (Sial et al., 2013), it is an essential factor and a formula for success of
any business organization (Noble, 1999), implementation of strong and robust strategies
gives any organization better performance and a competitive edge (Awino, 2013;
Okwachi, Gakure & Ragui, 2013; Sage, 2015 ), both practical experience and research
indicate that strategy implementation has a substantial impact on organizational
performance (Giles, 1991).
The foregoing discussion clearly indicates that a good strategic plan is of little use to an
organization without a means of putting it to action. Equally true is that, strategies that
are well formulated and not implemented can be described as mere a cosmetic that does
not add any value to an organization and are only good as the paper that contains them.
It therefore follows that strategy implementation is an integral and essential part of
strategic management process and organizations that develop strategic plans must
seriously think of a better process of applying them.

4
1.1.1 Strategy Implementation Drivers
The strategic management literature indicates that, several researchers have identified
various drivers in strategy implementation that leads to superior performance in an
organization.
Kaplan and Norton (1996) identified four key factors that assure the success of
implementation of strategic plan. These factors are, clarified and translated strategy
according to structure of the organization, links and relationships with the executive
team, planning and goal setting and strategic feedback and learning (Kaplan & Norton
(1996) cited in Sial et al. 2013).
Mackenzie, Wilson and Kider (2001) focused on the leadership style of an organization
by which one can obtain the desired goals and objectives of the company through
creating the vision for the organization according to the setup of the firm, aligning the
staff for the achievement of the goals of the firm rather than personal goals, providing
the assistance to the intellectual in complicated things and clarifying expectations of the
organization from the team and their performance for the organization.
Aatonen and Ikavalko (2002) identified three main factors that bring success in strategy
implementation process. These factors are proper and significant communication among
the executors and top management, strategic acting, identifying, supporting and assisting
the major key player of strategy implementation and also establishing the relationship
between the system and structure of the organization with the content and context of the
strategy.
Brenes, Mena and Molina (2007) identified the key factors which determine the success
of strategy implementation in an organization. These key factors are the execution
process in an organization, strategy formulation procedure from internal scanning to
external scanning of the organization, strategy control process and motivation of the top

5
level management and top leaders to achieve objectives of the organization, strategy
control process and motivation of the top level management and strategic leader to
achieve objectives of the organization, and corporate governance issues in an
organization,
Sorooshian et al. (2010) summarized various drivers of strategy implementation
identified by most of the researchers in strategic management literature and grouped
them in three categories that is attention to organizational structure, attention to
leadership styles and attention to human resources.
Among the intentions of this study was to find out whether, apart from the three main
drivers (leadership styles, human resources and attention to organization structure)
mentioned by most researchers, technology is a major driver explaining the success of
strategy implementation and performance in organizations today.
1.1.2 Leadership Styles and Strategy Implementation
Several studies in the past have underscored the importance of leadership in strategy
formulation and implementation (Jooste & Fourie, 2009; Mapetere, Mavhiki,
Nyamwanza, Sikomwe & Mhonde., 2012; Okwachi et al., 2013; Sorooshian et al.,
2010).
Strategic leadership defines the ability of a leader to anticipate, envision, empower
others and maintain flexibility in creating strategic change as necessary (Hitt, Ireland &
Hoskission, 2007 cited in Jooste & Fourie, 2009). The purpose of strategic leadership
during strategy implementation is to maintain effective communication, make crucial
decisions, motivate staff and build a strong team that deriver’s good result. Strategic
leadership has been identified in the past studies as one of the key drivers of effective
strategy implementation (Bossidy & Charan, 2002; Collins, 2001; Freedman & Tregoe,

6
2003; Hrebiniak, 2005; Kaplan & Norton, 2004; Lynch, 1997; Noble, 1999; Pearce &
Robinson, 2007; Thompson & Strickland, 2003; Ulrich, Zenger & Smallwood, 1999).
1.1.3 Structure and Strategy Implementation
A study of 200 senior managers in United States of America established that
performance of an organization is largely influenced by how well a firm’s business
strategy is matched to its organizational structure and behavioral norms of its employees.
Three structural dimensions that affect communication, co-ordination and decision
making, which are core to strategy implementation, are formalization, centralization and
specialization (Oslon, Slater & Hult, 2005).
The relationship between structure and strategy an organization adopts was first
championed by Chandler (1962). He argued that the strategy of an organization
determines the long term goals and objectives. In order to do this better, there is the
need, in the organization, to determine the course of actions, allocate adequate resources
and determine the appropriate structure that supports a given strategy.
Organizational structure and strategy are related because organizational strategy helps
the organization to define and build an appropriate organization structure that enables
the accomplishment of the set goals and objectives. A good structure in an organization
defines how employees work together and it clearly establishes the roles and
responsibilities each employee performs in order to support the achievement of the set
goals and objectives.
The type of structure adopted in an organization also determines the number of
employees and managers required. Due to the market dynamics such as competition,
demographic changes, technological advancements and other environmental changes,
strategy formulation and implementation is a dynamic process and organizations
generates new strategies from time to time that dictates structural revisions and new

7
alignments to suit the environmental dynamism and the resultant strategic changes that
take place in a given industry.
1.1.4 Human Resource Management and Strategy Implementation
Human resources refer to people in terms of, time, personnel skills, capabilities,
experiences and knowledge they bring to their work place. Human resource capital is
obtained through a variety of means which includes formal education, job training, on
the job learning and real life experiences. Management of human resources in an
organization is very crucial for the survival and proper functioning of an organization
and recent studies have shown that human resource practices play an important role in
formulating and implementing strategy (Myloni, Harzing & Mirza, 2004). Accordingly,
human resource management should be looked at as part of the overall organizational
strategy of a firm and its importance has made human resource managers to be part of
decision making process during strategy formulation and implementation. Lee, Lee and
Wu (2010) indicated that there is a direct relationship between a firm’s strategy and the
use of human resources.
A review of literature by Abdullar, Ahsan and Alam (2009) indicated that most
researchers suggest that human resource management is vital in order for an
organization to achieve competitive advantage and organizational success. According to
Gupta and Carol (1996) human resource management plays an important role in strategy
implementation therefore if human resource in an organization is not managed
effectively, it would potentially cause disruptions to the strategy implementation process
(cited in Wei, 2006)
Since human resource plays a crucial role in strategy implementation and the attainment
of organizational goals and objectives, there is need for an organization to develop an
elaborate human resource policy that promotes employees understanding and
expectations of the organizational goals, encourages communication between the

8
employees and leadership. The elaborate HR policy should include the selection of
employees, recruitment and hiring procedures, training and development, performance
appraisal and rewards and incentives.
1.1.5 Technology and Strategy Implementation
Technology refers to knowledge, products, processes, instruments, procedures and
systems which helps in producing goods and services. An organization's technological
capabilities allow them to implement technology strategies that best fit their goals. The
experience gained from implementing technology strategy feeds back into the
technological capabilities which then enable firms to improve and build their core
competencies to help them maintain their competitive advantage (Burgelman &
Rosenbloom, 1989).
In a dynamic environment that characterizes organizations today, development of
technological capabilities becomes very vital in order to cope with environmental
demands. New and innovative technological competencies are needed for survival in a
highly competitive environment (Burgelman & Rosenbloom, 1989). One of the key
areas of technology is the information technology which has become a key business
function for almost every organization and most have great expectations of their
investment in information technology for future benefits to the business expectations
that will enable the business to reduce cost, enhance productivity, implement new
business strategies and gain competitive advantage.
A study by Chung, Hsu, Tsai, Huang and Tsai (2012) underscored the importance of
information technology in implementing Customer Relationship Management (CRM)
strategy and concluded that there is a positive relationship between information
technology and implementation of CRM strategy. Proper alignment of technology and
business strategy should be a focus of organizations aiming at achieving competitive
advantage. Therefore, the current study investigated whether attention to technological

9
requirements by the organizational leadership is a major driver explaining success in
strategy implementation processes.
1.1.6 Manufacturing SMEs Sector in Kenya
For the purposes of this study the terms “enterprise,” “firm,” “business,” and
“organization” have been used interchangeably. A manufacturing “enterprise”, as used
in this study, refers to any income-generating activity derived from making of goods and
services in an industrial processing establishment.
“SME” stand for small and medium sized enterprises. There is no universally accepted
definition of an SME and several parameters have been used in different countries to
define an SME firm. In Europe, an SME is defined using the number of employees and
or annual the turnover or the balance sheet total: In this case small firms employ less
than 50 employees and has a turnover of up to 10 million Euros or a balance sheet total
of up to 10 million Euros. A medium enterprise on the other hand employs up to 250
people and has a turnover of up to 50 million Euros or a balance sheet total of up to 43
million Euros (EC, 2015).
In USA and Canada, a small firm employs less than 100 people while a medium firm
employs up to 500 employees. According to World Bank, an SME is a registered
business where small businesses employ between 10-50 people, has a total assets of
between 100,000 to 3 million USD and a total annual sales of between 100,000 to 3
million USD while a medium enterprise employ between 50-300 people, has a total
assets of between 3 million USD to 15 million USD and a total annual sales of between
3 million to 15 million USD (IFC, 2012). In Japan, an SME is defined according to the
type of industry, paid-up capital and number of paid employees. SME’s in
manufacturing industry have a stated capital of up to 300 million yens and employing up
to 300 people (SMEA, 2013). In Kenya, SME manufacturing enterprises are defined as

10
enterprises with fulltime employees not exceeding 100 or annual sales turnover not
exceeding Ksh 150 million (RoK, 2007).
The small and medium scale enterprise plays a major role in the growth and
development of the Kenyan economy in line of creating employment, poverty reduction,
and investment distribution as stipulated in the Kenyan economic report (2013). The
SME’s sector is fast growing employing 42% of the working population and accounting
for 75% of all modern accomplishments in Kenya as at 2011. According to the Kenyan
economic survey 2011, out of 503,000 jobs created in the year 2010, 440,400, or 80.6
percent were in small and medium enterprises, with only 62,600 or 12.4 percent were
created in the formal sector (RoK, 2011).
The performance of SME’s in the manufacturing sector is still dismally low. The 2013
economic reports observed that while the number of employees in micro and small
enterprises (MSE’s) increased between 2010 and 2011; there was a decline with respect
to employees in medium and large enterprises. The manufacturing value added
contribution made by MSEs also increased, though the contribution is still low,
accounting for 14.2 per cent yet two thirds (67%) of manufacturing firms are micro and
small enterprises (Kippra, 2013) This dismal performance is likely to slow down the
path of economic development as envisioned by vision 2030 strategic plan.
The Kenyan Vision 2030 (RoK, 2008), which is the main strategic blueprint for the
country, envisages a vibrant and a robust small and medium scale firms in the formal
and informal sectors as one of the engines of growth and development in Kenya.
According to the blue print, Kenya’s competitive advantage lies in agro-industrial
exports and one of the key strategies is to strengthen the manufacturing sector,
specifically strengthening SME’s to become the key industries of tomorrow. This goal
can be accomplished by improving their productivity and innovation. The Vision 2030
Kenya’s strategic plan document (RoK, 2008) therefore recommends the need to boost

11
science, technology and innovation in the SME’s sector by increasing investment in
research and development.
The Kenyan government has also recognized the need to fully support this important
SME’s sector of the economy by creating an elaborate policy framework that would lead
to full support and growth of the sector. According to the economic report 2013 (Kippra,
2013), SME’s dominate in majority of the sectors in the Kenyan economy, including
wholesale and retail trade, restaurants, hotels, community and social services, insurance,
real estate, business services, manufacturing, agriculture, transport and communication
and construction. Due to the structure of Kenya’s per capita income, most of businesses
in Kenya would fall in the SME strata and as such any attempt by the government to
grow the economy would logically include the development and sustenance of the SME
sector.
The official policy framework of SME’s in Kenya is contained in the “Sessional Paper
No. 2 of 2005” which enacted policies to institutionalize SMEs and to give direction
among other key issues like the legal and regulatory environment, markets and
marketing, business linkages, the tax regime, skills and technology and financial
services (RoK, 2005).
Despite the important role played by small and medium enterprises and numerous policy
prescriptions and interventions by the government, the sector is still riddled with
numerous challenges that inhibit its growth and development. Some of these challenges
include but not limited to inadequate financial support, unfavourable policy
environment, inadequate knowledge and business skills, low usage and absorption of
technology, limited access to information, underdeveloped infrastructure among other
problems (RoK, 2005).
Recent studies in Kenya acknowledge that the small and medium scale enterprises are
engaged in strategic management to boost their performance (Awino, 2013; Gakure &

12
Amurle, 2013; Okwachi et al., 2013). However, majority of these firms encounters a lot
of difficulties and some are kicked out of the market before they reach five years.
1.2 Statement of the Problem
Implementation of a chosen strategy requires the managers to break down that strategy
into a series of activities and actions that leads to the achievement of the intended goals
and objectives (Jouste & Fourie, 2009). Strategy implementation is the second stage in
strategic management process that involves operationalization of the strategic plans into
work activities that leads to the realization of the organization goals and objectives. The
strategic management literature has documented that this stage is the most important and
most difficult in the entire strategic management practices (Carter & Pucko, 2010; Sage,
2015). According to Sage (2015), strategy implementation process is an important stage
in a firm/organization which is even more important than strategy formulation itself.
Literature of the past scholarly works documents a high failure rate in strategy
implementation in most organizations all over the world. Carter and Pucko (2010) noted
that 60 to 80 % of organizations worldwide perform very well in strategic formulation
but either fail or seriously struggle during the strategy implementation process. A high
failure rate in strategy implementation does not only discourage the stakeholders
involved but also makes it difficult for these firms to fully realize their goals.
The Kenyan Vision 2030 (RoK, 2008) envisages a vibrant manufacturing sector as one
of the key sectors meant to make the economy industrialized by the year 2030. However,
the manufacturing sector has recorded poor performance in the past contributing a
dismal 14.2% to the country’s value addition (Kippra, 2013). This phenomenon not only
paints a gloomy picture of the sector, as a one of the key pillars of economic growth, but
also threatens to slow down the realization vision 2030 dream. The manufacturing SME
firms outperformed large industries in terms of growth and job creation (Kippra, 2013).

13
These manufacturing SME’s in the country are likely to perform even better when they
fully embrace and get committed to their strategic plans.
The impetus of this study is that not all SME’s in Kenya are engaged in strategic
management practices (Gakure & Amurle, 2013) and the gap existing in the literature
where past studies globally have largely ignored the strategy implementation process.
Several scholars in Kenya have conducted researches on the strategic management
practices among the SME’s (Awino, 2013; Bowen, Morara & Mureithi, 2009; Gakure &
Amurle, 2013; Okwachi et al., 2013). Awino, Wandera, Imaita and K’obonyo (2009)
studied the challenges facing implementation of differentiation strategy in Mumia Sugar
in Kenya while Gakure and Awino (2011) studied Amurle (2013) studied strategic
planning practices in ICT firms. Okwachi et al. (2013) examined the effects of business
models in strategic plans implementation in SME firms. Atikiya (2015) examined the
effects of competitive strategies on performance of manufacturing firms in Kenya.
Among all these studies, the key drivers of strategy and their effects on the overall
outcomes have not been adequately addressed. The SME’s can grow faster as envisioned
by Kenyan Strategic Plan (RoK, 2008) through proper practices of strategic management
and when it is very clear to them the factors they need to pay attention to when
implementing their strategies. It is on this backdrop that the current study undertook to
investigate the key drivers of strategy implementation and their influence on the overall
outcome in the manufacturing SME’s in Kenya.
1.3 Objectives of the Study
1.3.1 General Objective
The overall objective of this study was to establish the influence of strategy
implementation on the performance of manufacturing small and medium firms in Kenya.

14
1.3.2 Specific Objectives
The specific objectives of this study were;
1. To determine whether attention to leadership styles influences the
performance of manufacturing SME firms in Kenya.
2. To establish whether structural adaptations influences the performance of
manufacturing SME firms in Kenya.
3. To determine whether attention to human resources influence the
performance of manufacturing SME firms in Kenya.
4. To establish attention to technological requirements influences the
performance of manufacturing SME firms in Kenya.
5. To determine whether the firm’s emphasis on strategic direction
influences the performance of manufacturing SME firms in Kenya.
6. To establish whether the firm level characteristics (age & size) influences
the relationship between strategy implementation and performance of the
SME firms in Kenya.
1.4 Hypotheses of the Study
A hypothesis is an educated guess that attempts to explain a set of facts or natural
phenomena based on prior knowledge (Bradford, 2015). This proposition can be tested
for validity scientifically (Banerjee, Chitnis, Jadhav, Bhawalkar & Chaudhury, 2009).
This study sought to test the following hypotheses;
H01. Attention to leadership styles has no significant influence on the performance of
manufacturing SME firms in Kenya
H1. Attention to leadership styles has a significant influence on the performance of
manufacturing SME firms in Kenya

15
H02. Structural adaptations has no significant influence on the performance of
manufacturing SME firms in Kenya
H2. Structural adaptations has no significant influence on the performance of
manufacturing SME firms in Kenya
H03. Attention to human resources has no significant influence on the performance of
the manufacturing SME firms in Kenya
H3. Attention to human resources has a significant influence on the performance of the
manufacturing SME firms in Kenya
H04. Attention to technological requirements has no significant influence on the
performance of manufacturing SME firms in Kenya
H4. Attention to technological requirements has a significant influence on the
performance of manufacturing SME firms in Kenya
H05. Emphasis on strategic direction has no significant influence on the performance of
manufacturing SME firms in Kenya
H5. Attention to technological requirements has a significant influence on the
performance of manufacturing SME firms in Kenya
H06. The age and size of the firm has no significant influence on the relationship between
strategy implementation and performance of the manufacturing SME firm
H6. The age and size of the firm significantly influence on the relationship between
strategy implementation and performance of the manufacturing SME firm
16
1.5 Significance of the study
Strategic management is practiced by organizations of all walks of life (small or large)
consciously or unconsciously, formally or informally (Todd, Sergio, Lazzarini & Laura,
2000). While quite a number of SME’s do not have formal strategic plans, they plan and
strategize informally for their own survival. Large organizations have well laid and
elaborate procedures and structures that oversee and coordinate strategy implementation
activities. The literature has documented that majority of SME’s practice strategic
management (Awino, 2013; Bowen, Morara & Mureithi, 2009; Gakure & Amurle, 2013;
Okwachi et al., 2013).
This study focused on the SME’s in the manufacturing sector in Kenya due to their
strategic importance in the country’s economy. It has been envisaged that
industrialization in Kenya, as contained in Kenyan Vision 2030 strategic plan, is to be
partly propelled by a vibrant and a robust small and medium scale firms in the formal
and informal sectors. According to the Kenyan economic survey 2011, out of 503,000
jobs created in the year 2010, 440,400, or 80.6 percent were in small and medium
enterprises, with only 62,600 or 12.4 percent were created in the formal sector (RoK,
2011). This underscores the importance of SME’s in employment, wealth creation and
promoting growth and development.
This study further observed that the medium and small business sector is the fastest
growing among other sectors of the Kenyan economy despite the perceived inadequate
commitment by the Kenyan government. According to Vision 2030 blue print, the
Kenya’s competitive advantage lies in agro-industrial exports and one of the key
strategies is to strengthen the manufacturing sector, and specifically strengthening
SME’s manufacturing firms to become the key industries of tomorrow. This, according
to the policy document, can be accomplished by improving their productivity and
innovation. Vision 2030 policy document therefore recommended the need to boost

17
science, technology and innovation in SMEs manufacturing sector by increasing
investment in research and development (RoK, 2008).
Thika Sub-County was selected for the focus in this study for a number of reasons;
First, the town is ranked number three in Kenya, apart from Malaba and Narok towns
which are ranked first and second respectively in terms of the easiness to do business
according to World Bank Report (2010). Secondly, Thika is one of the key industrial
towns in Kenya having over twenty large scale industries and over 100 small industries
within and around the town (Kenya book, 2014) The high concentration of
manufacturing SME’s within the town (Nyang’au, Mukulu & Mung’atu, 2014) and its
surroundings informed the choice of the location of this study. Thirdly, the town is
surrounded by a rich agricultural neighborhood and most of the manufacturing firms are
agro-based (Kenyabook, 2014) giving a relatively homogeneous population.
The study is also justified by its importance to the following stakeholders in the country;
1.5.1 SME Owners/CEO’s
This study helps the owners and chief executives of the manufacturing SME firms to
understand the key factors that drive successful strategy implementation process. In this
regard, these leaders need to pay close attention to leadership styles, human resources,
structures and technological requirements during strategy implementation in order to
achieve better results.
1.5.2 The Policy Makers
This study enables the policy makers in the SME sector to understand the key drivers of
strategy implementation and their influence on performance in organizations. With this
understanding, the government, as one of the policy makers, is able to play a better role
in supporting and strengthening the SME’s sector by offering support services like

18
training, financing, technology and marketing of products locally and abroad. The
government creates this platform because the SME firms play a significant role in the
growth and development of the Kenyan economy.
1.5.3 Scholars in Strategic Management
This study is important to the scholars in strategic management who may want to carry
further researches in the area of strategy implementation and performance among
various organizations in the country. The literature underscored the need for
organizations to pay more attention in strategy implementation for better performance.
The literature also documented the neglect of many scholars in the past to carry out
studies on strategy implementation. Given the importance of successful strategy
implementation efforts, this study is a pointer to the perceived influence between
strategy implementation and performance of manufacturing SME firms in Kenya.
1.6 Scope of the Study
In order to maintain a desired level of homogeneity, this study considered small and
medium manufacturing firms in Thika town and within 15 km radius from the town.
The manufacturing small and medium firms in Thika town centre and in the surrounding
areas like Jamhuri market, Jua Kali, Munene industries, Mandaraka, Kiganjo, Ngoigwa,
Landless markets and Witeithie area formed the population of this study.
1.7 Limitations of the Study
The first limitation is that majority of the CEO’s of the selected firms were not willing
to disclose their profits, annual sales or any financial information in actual figures that
this study needed to know concerning performance of the firm. This study opted to use
indirect methods to obtain information on financial performance. For example, the
CEO’s were requested to indicate whether their revenues have increased, decreased or

19
remained constant in a given period. They were also requested to give their perceptions
on financial performance based on more indirect approach where Likert scale
psychometric constructs were used. This method worked better and they were able to
give directions of the movements of financial variables without necessarily stating the
actual figures.
The second limitation is that some of the CEO’s/owners of these SME manufacturing
firms are not well educated and preferred the questions to be read and interpreted for
them. This limited their ability and freedom to take time, interpret and reflect on these
questions on their own. The researcher read and interpreted each question slowly in a
language well understood by these CEO’s/owners. The researcher would then record the
answer as given in a designated questionnaire. The researcher also requested to meet
these CEO’s for more than once since the interpretation process would take much of
their time. Others chose to take questionnaires home and be assisted to fill by their
family members. The researcher gave adequate time to such respondents to return their
filled questionnaire and several follow ups were made to get the questionnaires back.
The third limitation of this study was time. Majority of the CEO’s of the manufacturing
SME firms are busy and required a lot of time and patience from the researcher. The
researcher requested to be given an appointment when they are available and not busy.
The researcher complied with these appointments and would even visit these CEO
outside the firm to get them to be involved in the study. Some CEO’s took more than
three months to return a filled questionnaire. Others lost their questionnaires and new
ones were given. The researcher, before getting the filled questionnaire back, would go
through each questionnaire slowly to make sure that all the items are responded to.

20
CHAPTER TWO
LITERATURE REVIEW
2.1 Introduction
This chapter reviews both the theoretical frameworks and empirical studies related to
implementation of strategic plans in an organization. It develops the conceptual
framework and reviews the independent variables in relation to the dependent variable.
The study then proceeds to critique the literature reviewed, identify the research gaps
and finally provide a summary of the chapter.
2.2 Theoretical Framework
A theoretical framework is the “blueprint” for the entire research which serves as the
guide on which to build and support a research idea. It provides the structure to define
how a researcher will philosophically, epistemologically, methodologically, and
analytically approach the study as a whole (Grant, 2014). Eisenhart (1991) defines a
theoretical framework as a “structure that guide’s research by relying on a formal theory;
that is, the framework is constructed by using an established, coherent explanation of
certain phenomena and relationships”. This study was guided by the theoretical
frameworks discussed here below.
2.2.1 The General Systems Theory
According to Chen and Stoup (1993), the General Systems Theory (GST) emerged from
the works of an Austrian biologist Ludwig von Bertalanffy in 1930’s. The theory studies
the structure and properties of a system in terms of relationships and interdependencies
among various components from which the properties of the whole emerge. The system
theory also views the world in terms of relationships and integration and emphasizes the
principle of organization.

21
Bank, Carson and Nelson (1996) define a system as a group of objects that are joined
together in some regular interaction or interdependence toward the accomplishment of
some purpose. This implies that a system is made up of different components that work
together in a regular relationship to accomplish a common goal.
The system components include entities, objects of interest within the system, attributes,
or defining properties of entities, states of the system’s collective descriptive variables at
a given time, activities taking place at a given time, and events that have the potential to
change the state of the system (Bank et al., 1996)
Modern organizations qualify as open systems and within an organization as a system;
there exist subsystems like human resource, administrative, management information
systems, social-technical, structural and others (Swanson & Holton, 2001; Torraco,
2005) The common features of a system include the systems boundary, its external
environment, and sensitivity to disturbances both within and outside the system.
The foundation of systems theory is that all the components of an organization are
interrelated, and changing one variable brings changes to other variables. Organizations
are viewed as open systems where they are continually interacting with their
environment. They are in a state of dynamic equilibrium as they adapt to environmental
changes. A central theme of systems theory is that sometimes nonlinear relationships
might exist between variables where small changes in one variable can cause huge
changes in another and large changes in another variable might only have a nominal
effect on another.
French, Kast and Rosenzweig (1985) underscored that the systems theory views
organizational structure as the established pattern of relationships among different parts
of the organization. The most important according to the theory are the patterns in
relationships and duties which includes integration (the way activities are coordinated),
differentiation (the way tasks are divided), the structure of the hierarchical relationships

22
(authority systems), and the formalized policies, procedures, and controls that guide the
organization (administrative systems).
The relationship between the environment and organizational structure is especially
important in the system theory. Organizations are open systems and always depend on
their environment for support. Generally, the more complex environments which
characterizes today’s organizations lead to greater differentiation (Burn & Stalker,
1961). The trend in organizations is currently away from stable (mechanistic) structures
to more adaptive (organic) structures. The advantage is that organizations become more
dynamic and flexible while the disadvantage is that integration and coordination of
activities require more time and effort.
From a systems theory point of view, successful strategy implementation requires a
well-coordinated effort and harmonious interactions among various components of an
organization. The leadership component in an organization alone may not succeed in
strategy implementation effort without creating proper structures and ensuring active
participation of other subsystems like human resources (people), social-technical and
information subsystem (technology). Moreover, organizations must also continuously
interact with the dynamic environment to obtain the required resources that drive
implementation of a strategy to success. The systems theory underpins all the variables
in this study apart from strategic direction of the firm.
2.2.2 The Dynamic Capabilities View
The dynamic capabilities view of a firm was launched Teece in early 1990s. The
framework is based on the works of Barney (1991), Rumelt (1984) and Wernerfelt
(1984). The theoretical framework is an advancement of the resource-based view of the
firm which views resources as the key to superior organization performance. If a
resource exhibits the VRIO attributes, it enables an organization to achieve a
competitive advantage (Barney, 1991; Rothaermel, 2012).

23
According to Barney (2001), the RBV’s framework emerged in 1980s and 1990’s after
the major works published by Wernerfelt, B. (the resource based view of the firm),
Prahalad & Hamel (the core competence of the corporation), Barney, J. (Firms resource
and sustained competitive advantage). However, the RBV theory failed to recognize the
fact that environment in which organizations works today is not static but dynamic and
turbulent in nature (Priem & Butler, 2001). The effort to rethink about the applicability
of the RBV in a dynamic environmental context that characterizes today’s organizations
is what gave birth to the Dynamic Capabilities Theory or approach to organizations.
According to Teece (2014), a capability is the capacity to utilize resources to perform a
task or an activity, against opposition of circumstance. Capabilities flow from astute
bundling or orchestration of resources. While resources base according to RBV refer to
physical, human and organizational assets (Eisenhardt & Martin, 2000), dynamic
capabilities are learned and stable patterns of behavior through which a firm
systematically generates and modifies its way of doing things, so that it can become
more effective (Zollo & Winter, 2002).
The dynamic capability theory (Eisenhardt & Martin, 2000) is based on the concept that
organizations will always attempt to renew their resources in a way that suits the
changes taking place in a dynamic environment. According to Teece, Pisano and Shuen
(1997), dynamic capability approach examines how firms are able to integrate, build,
and reconfigure their specific competencies (internal or external) into new competencies
that match changes taking place in a turbulent environment (Helfat, Finkelstein, Mitchel,
Peteraf, Singh, Teece & Winter, 2007).
The dynamic capability framework is based on the assumption that firms with greater
dynamic capabilities will always outperform those with smaller dynamic capabilities.
Therefore, operations in a dynamic environment call for firms to continuously renew, re-

24
engineer and regenerate their internal and external firm’s specific capabilities in order to
remain competitive (Teece, 2007).
The dynamic capabilities are hard to develop and difficult to transfer because they are
tacit and are embedded in a unique set of relationships and histories of a firm. Ordinary
capabilities, according to RBV (Grant, 2001), are about doing things right whereas
dynamic capabilities are about doing right things at the right time based on unique
processes, organizational culture and prescient assessments of the business environment
and technological opportunities surrounding a firm (Teece, 2014).
Managerial functions are relevant to dynamic capabilities in areas of co-ordination,
guided learning, and reconfiguration or transformation. Dynamic capabilities reside in at
least part, in managerial entrepreneurship and leadership skills of the firm’s top
management and in managerial ability to design, develop, implement and modify their
daily organizational routines (Teece et al., 1997).
Strong dynamic capabilities include processes, business models, technology, and
leadership skills needed to effectuate high performance sensing, seizing and
transforming an organization. Firms with strong dynamic capabilities exhibit
technological and market agility, they are able to create new technologies, differentiate
and maintain superior processes and modify their structures and business models in
order to stay ahead of competition, stay in tune with the market and even shape and
reshape the market when necessary (Teece, 2014).
The dynamic capability theory underpins three independent variables in this study.
Leadership is a dynamic capability and a change in leadership skills is required as the
environment of business changes. Organizational structures keep on changing with
changes in strategies necessitated by the market changes. Structural capabilities and
adaptability are required for organizations to survive in a complex and dynamic
environment. Technology is a dynamic capability and keeps on changing with changes

25
in the environment. Human resource is not a dynamic capability but new capabilities can
be created in human resources through training and acquisition of new knowledge and
skills in line with environmental changes.
2.2.3 Okumu’s Strategy Implementation Framework
Okumu’s (2003) identified eleven variables commonly mentioned by other research
frameworks that have an effect on strategy implementation and outcome. These
variables are; strategy development, environmental uncertainty, organizational structure,
organizational culture, leadership, operational planning, resource allocation,
communication, people, control and the outcome.
Out of these variables, he developed a new strategy implementation framework by
grouping the variables into four main categories namely strategic content, strategic
context, operational process and the outcome. Strategic content includes the
development of strategy where various issues are addressed like whether the new
strategy conforms to the overall strategic direction of the firm, identification of aims of
the new initiative, adequate knowledge and expertise in managing change and active
participation of management at all levels in an organization.
The second group include strategic context which is divided into two categories; the
internal and external contexts. The external context focuses on the environmental
uncertainty in both task and general environment. New changes and developments in the
general and task environments require a new strategy. The new strategy must fit and be
in line with market conditions until it is fully implemented (Okumu’s, 2003). The
internal context factors includes the organizational structure in terms of its shape,
division of labour, job duties and responsibilities, power distribution, decision making
procedures, reporting relationships, information flow, coordination and cooperation
between different levels of management, of activities, informal networks and politics.

26
Changes in external context (environment) will cause changes and modification of
organizational structure.
The internal context also includes organizational culture which relates to the
understanding of the employees about how they do things within the organization.
Internal context also include leadership which shows the actual support and involvement
of the CEO in the strategic initiative. According to Okumu’s (2003), leadership is crucial
in using the process factors and also in manipulating the internal context to create a
context receptive to change. Key issues considered here include the actual involvement
of the CEO in the strategy development and implementation process, the level of support
and backing from the CEO to the new strategy until it is completed and the open and
covert messages coming from the CEO about the project and its importance.
The third group includes the organizational processes which incorporates operational
planning. This is the process of initiating the project and the operational planning of
implementation activities and tasks. Issues dealt with here include preparing and
planning implementation activities, participation and feedback from different levels of
management and functional areas in preparing operational plans and implementing
activities, initial pilot projects and knowledge gained from them and the time scale for
making resources available and using them. The second key variable in the
organizational process is resource allocation which ensures that all the necessary time,
financial resources, skills and knowledge are made available. Issues dwelt here include
procedures of securing and allocating financial resources, information and knowledge
requirements, time available to complete the implementation process and the politics and
cultural issues within the company and their impact on resource allocation. The third key
variable is people. This involves recruitment of new staff, provision of training and
incentives for relevant employees.

27
According to Okumu’s (2003) operational planning and resource allocation has a direct
impact on people in an organization. Key issues include the recruitment of relevant staff
for new strategy implementation, acquisition and development of new skills and
knowledge to implement the new strategy, the types of training activities to develop and
prepare relevant managers and employees, provision of incentives related to strategy
implementation and their implications and the overall impact of company’s overall
human resource policies and practices on implementing new strategies.
The fourth variable is communication which is the mechanism that sends formal and
informal messages about new strategy. Issues considered here include communication
materials like operation plans, training programs and incentives. Use of clear messages
when passing vital information to people, implications of using multiple modes of
communication, problems related to communication and their causes and the impact of
organizational structure, culture and leadership on selling the new strategy. The final
variable in the process is control and feedback which is the formal and informal
mechanisms that allow the efforts and results of strategy implementation to be
monitored and compared against predetermined objectives.
The fourth group includes the outcome which is the intended and unintended results of
the strategy implementation process. The key issues considered here include whether the
new strategy has been implemented according to plan or not, whether the predetermined
objectives have been achieved or not, whether the outcomes are satisfactory or not and
whether the company has learnt anything from the strategy implementation process.
Okumu’s framework (2003) is relevant to this study in that it underpins all the variables
of this study. The framework begins by setting the strategic direction in the strategy
content component of the framework. After the strategy has been developed then the
organization carries out the implementation process where factors like leadership,
organizational structure, human resources (people) and physical resources are taken into

28
consideration in the internal context component. The implementation of strategy is
influenced by the happenings in the external context component which includes the
environmental dynamics in general and task environment. Implementation of strategies
leads to an outcome (performance) which is either intended or unintended (See
Appendix ix).
2.2.4 Higgins 8-S Strategy Implementation Framework
Higgins (2005) revised the original McKinsey’s 7-S framework and developed the 8-S
framework for implementing strategies in organizations. The famous and widely applied
7-S strategy implementation framework was developed in 1980’s by Peters and
Waterman (1982). In their study of the “best run” American companies, Peters and
Waterman identified seven intertwined components that managers need to pay attention
when implementing organizational strategies.
Figure 2.1: McKinsey 7-S Framework: McKinsey’s 7-S Framework: (Pearce &
Robinson, 1991)
Shared Values
Strategy
System
s
Staff
Structure
Style Skills

29
Higgins (2005) then revised and improved the McKinsey’s 7-S model by adding the 8th
S component (Strategic performance) which is the derivative or outcome of the
interaction of 7-S’s components contained in the original McKinsey’s 7-S’s framework.
He also replaced skills as one of the contextual “S” with Re-Sources since organization
cannot successfully implement strategy without marshalling additional resources such as
money, information, technology and time.
Higgins pointed out that the 8-S’s framework enables a manager to work more
efficiently and effectively in managing the cross-functional duties and activities
associated with strategy implementation. The model observes that executives who
realize that strategy implementation is as important as strategy formulation usually
spend a lot of their time and efforts in strategy execution and this enables their
organizations achieve better performance.
The 8-S’s framework states that successful strategy implementation revolves around
aligning the key organizational components (the 8-S’s) with the strategy that the
organization intends to implement. However, due to environmental dynamism and
changes that take place in organization’s business environment now and then, it is
important for managers to continue reshaping their strategies in line with these changes.
Therefore, this call for a continuous realignment of the 8-S’s components in line with the
new strategy and this presents the greatest challenge to managers in their endeavor to
successfully implementation strategies. Since the 8-S’s components are intertwined, the
executives in the organizations must continuously align all these eight cross-functional
components with the new strategy for successful strategy execution and better
performance (Higgins, 2005).

30
Figure 2.2: Higgin’s 8-S Framework
Higgins, (2005), Journal of Change Management 5 (1)
a. Strategy and Purposes
The 8-S model points out that an organizational strategy is formulated with an aim
of achieving a given purpose. Therefore, any change in the organizational purpose as
contained in the organization’s vision, mission and goals and objectives calls for a
revision of the earlier strategies applied to achieve that purpose. The model identifies
four different types of strategies in an organization that is the corporate level,
business level, functional level and the cross functional process strategies. The
corporate level strategy focuses on the entire business the organization is involved in
and how this business will be accomplished in the best way possible, the business
strategy aims at conducting business in a particular manner that brings in a
competitive edge over the rival firms, the functional strategies are more specific and
Context
Aligned Strategic
Performance
System and Processes
Shared Values
Structure
Style
Staff Re-Sources
Strategy and Purposes
Performance

31
are applied in areas like production, marketing, finance and human resource and are
related to the business strategy. Lastly, the process strategies cuts across various
functional areas and are intended to integrate the entire organization’s processes in a
manner that guarantees improved efficiency and effectiveness (Higgins, 2005).
b. Structure
The 8-S model views organizational structure as made up of five different elements
namely, the job itself, the line of authority to perform these jobs, the grouping of
jobs in a given order that allows achievement of the objectives, the coordination
mechanism applied by managers to supervise jobs effectively and the span of control
that shows the number of subordinates that a manager can effectively supervise. The
success in a given organization is determined by how well the organization is
structured along its business strategy. Therefore, strategy implementation calls for
proper decisions to be made in line with proper identification and grouping of the
jobs, delegating and giving authority to perform these jobs, coming up with different
departments and divisions to serve the job purpose, establishing proper
communication and control mechanisms to ensure jobs are done well and defining
the span of control that will ensure effective supervision of these jobs (Higgins,
2005).
c. Systems and Processes
The 8-S model describes systems and processes as formal and informal policies and
procedures applied by an organization to enable achievement of the set objectives. These
policies and procedures enable the organization to carry out her daily activities in a
successful manner. These procedures are applied in different areas like in resource
allocation, budgeting, planning, human resource management, information and
technology, quality control and other important areas in an organization (Higgins, 2005).

32
d. Style
The 8-S’s model describes style as the leadership mode exhibited by managers or leaders
when they are relating or dealing with employees and other stakeholders in an
organization. Style is all about what leaders or managers focus on and how they treat
their colleagues and other employees in the process of doing work meant to achieve
organizational objectives (Higgins, 2005).
e. Staff
The 8-S’s framework views staff as the manpower required to help the organization
achieve her strategic purpose. This component defines the number of the employees
required, their backgrounds, skills, aptitudes qualities and characteristics. It also deals
with issues like staff training, career development remuneration and promotion of
employees (Higgins, 2005).
f. Resources
Sufficient resources are required for an organization to successfully implement a
strategy. It is important that in the strategy implementation process, managers must
ensure that the organization has fully access to the required resources such as materials,
manpower, money, technology and other management systems (Higgins, 2005).
g. Shared Values
Higgins (2005) state that shared values relates to the culture established by an organization
in its endeavor to accomplish her strategic purpose. These are values held in common
and shared by members of an organization (Higgins, 2005).

33
h. Strategic performance
The 8-S model views strategic performance as a derivative of the other seven ‘S’s
and refers to the total outcome after the interaction of the 7-S’s components
identified by McKinsey’s 7-S’s framework. It is the results obtained in an
organization as a whole and it is best measured in financial terms. Balanced Score
Card is the best approach in measuring this kind of performance in an organization.
The Higgin 8-S model points out clearly that the components of strategy
implementation are intertwined and this reinforces the idea of systems thinking in
strategy implementation process. The model brings out the need of constantly
realigning organizational strategies to environmental changes in order to make
strategies workable, finally, the model help managers to detect problems in the
system and avoid failures when implementing strategies (Higgins, 2005).
The 8-S framework is relevant to this study since it underpins all variables in this
study. The framework goes a step further than Okumu’s model by explaining how
the 8-S variables work together in a closely aligned relationship. This supports the
systems theory that postulates that objectives of a system are realized when
components work together in a regular relationship (Higgins, 2005).
2.3 Conceptual Framework
A conceptual framework is a written or visual presentation that explains either
graphically or in a narrative forms the main things to be studied like the key factors,
concepts or variables and their presumed relationship among them (Miles & Huberman,
1994; Robson, 2011). Kothari (2003) define a variable as a concept which can take on
qualities of quantitative values. A dependent variable is the outcome variable that is
being predicted and whose variation is what the study tries to explain while independent
variables are factors that tries to explain variations in the dependent variable.

34
The current study adopted the Higgins 8-S framework (2005), where all components
influencing strategic performance are intertwined and aligned from a systems
theory’s perspective, and Okumu’s strategy implementation framework (2003) as a
lens in developing a suitable conceptual framework that explains the influence of
strategy implementation on performance in SME manufacturing firms in Kenya. The
relevance of these two models is that the five main strategy implementation drivers
that influence performance, that is, strategic direction, leadership, structure, human
resource and technology are well underpinned. The models also give managers a
clear direction of the key variables to focus on during strategy implementation.
Figure 2.3: The Conceptual Framework
Independent Variables Moderating Variables Dependent Variable
FIRM’S
PERFORMANCE
Financial
ROA,
ROE
Growth
(sales and
employees)
Attitude
towards
ROA &
ROE
H01-H05
H06
Leadership Styles
Transformational
Transactional
Passive/Avoidant
Organizational Structure
Formalization
Centralization
Specialization
Human Resources
Training
Reward
Availability
Technology
Machine/equipment
Knowledge
Research
FIRM’S LEVEL
CHARACTERISTICS
Size
Age
Strategic Direction
Vision
Mission
Goals/Objectives

35
2.4 Review of Literature and Variables
This section reviewed the past studies based on the influence of the independent
variables (Leadership styles, Structure, Human resources and Technology) on the
dependent variables (Performance).
2.4.1 Firm’s Performance
Many scholars in management strongly believe that the strong practices of strategic
management have a significant positive effect on business firm’s performance (Griffins,
2003; Griffins, 2013; Hrebiniak & Joyce, 2005; Jooste & Fourie, 2010; Kaplan &
Norton, 2004; Kihara, Bwisa & Kihoro, 2016; Lynch, 1997; Noble, 1999; Okumu’s,
2003; Pearce & Robinson, Sage, 2015; 2007; Sial et al., 2013; Sorooshian et al., 2010;
Teece, 2014; Thompson & Strickland, 2003; Ulrich, Zenger & Smallwood, 1999).
Griffins (2003) define business performance as the extent to which the firm is able to
meet the needs of its stakeholders and its own needs for survival. The International
Standard Organization (ISO) views performance as a measurable outcome out of
attainment of organizational goals and objectives efficiently and effectively or
measurable results out of the organizations proper administration and management of its
actions and activities (ISO, 2015). Performance is the results obtained in an
organization as a whole (Higgins, 2005) or an outcome obtained after successful
efforts in implementing a strategy.
In the systems approach to organizations, Bank, Carson and Nelson (1996) define a
system as a group of objects that are joined together in some regular interaction or
interdependence toward the accomplishment of some purpose. This implies that a
system is made up of different components that work together in a regular relationship to
accomplish a common goal. The common goal referred to here is the overall outcome of
various interactions of different components that make up a system. This is what this

36
study refers to as firm’s performance. The RBV and DCV, on the other hand, consider
firms resources as the key to superior performance and competitive advantage (Barney,
1991; Grant, 1991; Rumelt, 1984; Wernerfelt, 1984, Teece, 2009; Teece, 2014).
Performance is a major construct in management because almost every researchers and
scholars attempts to relate their constructs to business firm’s performance (Sorooshian,
Norzima, Yusuf, & Rosnah, 2010). Combs et al. (2005) views performance as an
“economic outcome resulting from the interplay among organizational attributes, actions
and environment. Performance is mostly measured in financial terms (Barnat, 2012) and
it encompasses three specific areas namely: (1) financial performance (profits, return on
assets, return on investment); (2) market performance (sales, market share); and (3)
shareholder return (total shareholder return, economic value added)
2.4.2 Leadership styles and Firm’s Performance
A leader in strategy implementation is someone who is responsible for owning up,
steering and driving forward the implementation efforts towards achievements of the set
objectives. He is responsible for fully supporting strategy implementation efforts by
providing the necessary resources, giving directions and creating an enabling
environment for the employees to perform without fear or intimidation.
Teece (2014) underscored the importance of leadership by stating that a leader must
possess superior skills required to effectuate high performance through sensing, seizing
and transformation. A strong leadership skill is an important dynamic capability required
to drive superior performance in organizations operating in a dynamic environment that
characterizes organizations today.
Thompson and Strickland (2007) further stated that strategic leadership keeps
organizations innovative and responsive by taking special plans to foster, nourish and
support people who are willing to champion new ideas, new products and product

37
applications. Griffins (2011) identified leadership in an organization as one of the main
factors influencing strategy implementation by providing a clear direction, up to date
communications, motivating staff and setting up culture and values that drives
organizations to better performance.
Van Maas (2008) identified leadership as an important variable affecting organization
performance. Consequently, strategy implementation and superior performance requires
a leader who drives the implementation effort successfully by motivating employees, by
providing the overall direction for the implementation effort, by creating strategic vision
and communicating that vision to organizational members, by actively leading the
implementation effort as an example or a role model, by radiating and building
confidence of the organizational members implementing the strategy, by taking decisive
stand when confronted with problems of resistance to change or when they are forced to
take tough decisions during implementation effort and by maintaining integrity, honesty
and making just decisions during the strategy implementation effort.
Heracleous (2000) identified various roles played by leaders during strategy
implementation process and classified them as a commander (a leader who attempts to
formulate an optimum strategy), an architect (a leader who tries to designs the best way
to implement a given strategy), a coordinator (a leader who attempts to involve other
managers to get committed to a given strategy, a coach (a leader who attempts to involve
everybody in the strategy implementation efforts) and a premise-setter (a leader who
encourages other managers to come forward as champions of sound strategies).
A study by Jouste and Fourie (2009) in South Africa concluded that leadership and
especially strategic leadership role of providing direction during strategy implementation
is important in influencing organization performance. Noble & Mokwa (1999) found out
that manager’s commitment to strategy (which refer the extent to which a manager
comprehends and supports the goals and objectives of a strategy) and individual

38
manager’s role performance (the degree to which a manager achieves goals and
objectives of a particular role) positively influences the success of strategy
implementation effort and performance in an organization.
Bourgeois and Brodwin (1998) identified a variety of leadership styles which are
practiced by leaders during strategy implementation. This study found out that
leadership approaches to strategy implementation varies from being an autocratic leader
to a more participative style that involves active engagement of various stake holders in
the implementation process. According to Bourgeois and Brodwin (1998), the five main
categories of leadership styles practiced during strategy implementation include
commander, collaborative, coercive, cultural and organizational change. The
commander and organizational change styles are the traditional approach to strategy
implementation where the leader first formulate strategy and think about implementation
latter on. Collaborative and cultural styles are more current and capture clearly the
aspect of stakeholder’s active participation during the implementation process while a
coercive leader has the monopoly of driving the implementation agenda alone without
involving other stakeholders.
Ling, Siek, Lubatkin and Veiga (2008) identified that there is a significant relationship
between transformational CEOs and the performance in SMEs. Their findings tended to
confirm the Upper Echelons theory’s argument that CEO characteristics affect
organizational performance.
Aziz, Mahmood and Abdullah (2013), tested three most common leadership styles
commonly practiced by SMEs. These styles are the transactional, transformational and
passive avoidant (Laissez-faire) leadership styles. The study found out that among the
three leadership styles, the transformational leadership has the highest influence and is
directly related to the performance in SMEs. These findings are in consistent with a
study by Naeem and Tayyeb (2011) in Pakistan who found a positive correlation

39
between the transformational leadership style and SMEs performance and a weak
positive correlation between transactional leadership style and SMEs performance. The
study concluded that transformational leadership style positively and significantly
influences performance in SMEs in Pakistan.
Okwu, Obiwuru, Akpa and Nwankwere (2011) tested the application of transformational
and transaction leadership styles in Nigerian SMEs and found out that transformational
leadership traits tested (charisma, intellectual stimulation/individual consideration,
inspirational motivation) are weak in explaining variations in performance. On the other
hand, the transactional leadership traits (constructive/contingent reward, corrective and
management by exception) have a significant positive effect on followers and
performance and both jointly explain very high proportion of variations in performance.
The study concluded that transactional leadership style is more appropriate in inducing
performance than transformational leadership. They recommended that small scale
enterprises should adopt transactional leadership style but strategize to transit to
transformational leadership style as their enterprises develop, grow and mature.
Ojokuku, Odetayo and Sajuyigbe (2012) examined the impact of the leadership style on
organizational performance in selected banks in Nigeria and found that there is a strong
relationship between leadership style and organizational performance. The study also
found out that the transformational leadership style is positively related to the bank’s
performance. Transactional leadership style is negatively related to performance but
insignificant.
Udoh and Agu (2012) investigated the impact of transformational and transactional
leadership styles on performance of manufacturing organizations in Nigeria found that
there is a positive and significant relationship between transformation and transactional
leadership and organizational performance. In a similar study Ejere and Ugochuku
(2012) empirically studied the effect of transformational and transactional leadership

40
styles on organizational performance in Nigeria and found that transformational
leadership style is positively and highly related to organizational performance while
transactional leadership style has a positively but weak influence on firms performance.
Koech and Namsonge (2012) investigated the effects of leadership styles on
organizational performance of state owned corporations in Kenya and found a high
correlation between transformational leadership, a low but significant correlation
between transactional leadership style and performance and no correlation between the
passive avoidant leadership (Laissez-faire) style and performance. Okwachi et al. (2013)
studied Kenyan SMEs and found out that leadership practice has a direct relationship
with strategy implementation. The study concluded that managerial practices greatly
affect implementation of strategic plan in Kenya.
Zumitzavani and Udchachone (2014) examined the influence of leadership styles on
organizational performance in hospitality industry in Thailand and found out that
transformational leadership style has a positive influence with organizational
performance; Transactional leadership style has a weak positive influence while passive
avoidant leadership style has a negative influence with organizational performance. All
these studies on leadership styles reinforces the idea that leadership style as contained in
Higgins 8-S strategy implementation framework (2005) positively or negatively affects
performance in organizations.
2.4.3 Structure and Firm’s Performance
A structure is a hierarchical arrangement of duties and responsibilities, lines of authority,
communications and coordination in an organization. It refers to the shape, division of
labour, job duties and responsibilities, distribution of power and decision making
procedures within a company (Okumus, 2003)
Higgins (2005) views an organizational structure in terms of five different elements

41
that make a structure namely, the job itself, the line of authority to perform these
jobs, the grouping of jobs in a given order that allows achievement of the objectives,
the coordination mechanism applied by managers to supervise jobs effectively and
the span of control that shows the number of subordinates that a manager can
effectively supervise. He posits that the success in a given organization is determined
by how well the organization is structured along its business strategy.
Studies on organizational structure dates back in1960s when Alfred Chandler studied
hundreds of American large companies in order to establish the relationship between
organization’s strategy and its structure (Robbins, 2006). His study came into a
conclusion that modifications in the strategy of these companies led to changes in their
structure. Expansion of the production line in these companies necessitated revision of
their structures so that they can cope with the increased output and conform to the new
strategies. According to Chandler (1961) an organization structure must follow her
strategy for better performance. Companies with limited product lines initially had
centralized structures with less complexity and formality but when they increased and
diversified their production lines, they were forced to adapt different structures that
matched their new strategy. Chandler (1961) concluded that when organizations
diversifies, they must employ different structure compared to firms that follow single-
product strategy (Robbins, 2006)
Burns and Stalker (1961) studied about 20 British and Scottish companies with an aim
of finding out how their managerial activities and structures differed in relation to
changes in the environment. They found out that the structures adopted by organizations
operating under stable environmental conditions differed from those operating in a
dynamic environment. In a stable environment, organizations tended to adopt a
mechanistic structure that is characterized by low differentiation of tasks, low
integration between departments and functional areas, centralization of decision making
and standardization and formalization of tasks. Organizations operating in a dynamic

42
environment tended to adopt a more flexible organic structure that allows for changes to
be made in line with the environmental changes. Organic structures are characterized by
high differentiation of tasks, high integration of departments and functional areas with
rapid communication and information sharing, decentralized decision making
mechanisms and little formalization and standardization of tasks and procedures. They
came to a conclusion that firms will adopt a structure in relation to the environment they
are operating in. Most of businesses today operate in turbulent environments and they
are likely to adopt an organic structure that allow for changes and modifications to be
made in line with changes taking place in the environment (Robbins, 2006)
However, variant to Burns and Stalker’s study, Sine, Mitsuhashi & Kirsch (2006) posits
that the effect of structure is contingent to the stage of development in an organization.
In their study, they found out that structures increases performance of new ventures even
in the context of very dynamic sector. This applies to small firms and start-ups where
the study found that firms with more employees tended to outperform those with small
number and that new ventures that formalize functional assignments and assign
important tasks to team members who specialize in those assignments outperform firms
whose founding teams have relatively undefined roles. The study concluded that in a
dynamic and uncertain environments, new and mature organizations face fundamentally
different challenges requiring different approaches to organizational structure.
The mature organizations with well-defined structure and embedded practices need to
become more organic and flexible in order to adapt to dynamic environments, the
opposite is true for new ventures because they are already flexible and attuned to the
environment but what they need are the benefits of organizational structure which they
lack, lower role ambiguity, increased individual focus and discretion, lower coordination
costs and higher levels of organizational efficiency.

43
A study of 200 senior managers in United States of America by Oslon, Slater and Hult
(2005) revealed that performance of an organization is largely influenced by how well a
firm’s business strategy is matched to its organizational structure and behavioral norms
of its employees. The researchers identified three structural dimensions that affect
strategy implementation and performance in an organization that is formalization,
centralization and specialization. Formalization is the degree to which decisions and
working relationships are governed by formal rules and procedures. The benefits of
using rules and procedures include defining and shaping of employee behaviour,
problems are solved easily, activities are organized to the benefit of individuals and the
organization, efficiency and lower administrative costs and the firm is able to exploit
previous discoveries and innovations.
Centralization is the decision making authority which is held by the top, middle or lower
level managers in a firm. In a centralized structure, the top layer of management has
most of the decision making power and has tight control over departments and divisions.
Communication much easier and faster, while there are only few innovative ideas,
implementation is much straight forward and faster once the decision has been made.
The benefits of a centralized structure are only realized in stable noncomplex
environments while specialization refer to the degree to which tasks and activities are
divided in an organization (Oslon et al., 2005)
A study by Meijaard, Brand and Mosselman (2005) entitled “organizational structure
and performance of Dutch small firms” found out that small firms occur in a wide
variety of structures with various degree of departmentation. Secondly, departmentation
in these firms has a strong correlation with firm’s size. A third finding is that
decentralized structures perform well in several contexts notably in business services
and manufacturing. Firms with strong centralization and strong vertical specialization
only occur and only perform well in relatively simple structures. Apparently for large
firms, strict vertical specialization requires at least some decentralization in order to be

44
efficient. The fourth finding is that hierarchical, centralized structure with strong
specialized employees occurs frequently in SMEs and performs well in terms of growth.
In combination with complex coordination mechanisms, hierarchically structured and
departmentalized firms with formalized tasks and specialized employees perform well in
terms of growth as well, particularly in manufacturing and financial services. Non
specialized, simple organizational structures in business services perform well in term of
profit to sale ratios. They finally concluded that given contextual conditions, different
types of organizational structures perform well.
Organizations need to pay more attention to their structures and restructure according to
the environmental needs from time to time achieve better performance. A study by
Leitao and Franco (2011) on the individual entrepreneurship capacity and SMEs
performance found out that the economic performance of SMEs is positively affected by
maintenance of efficient organizational structure and at the same time the non-economic
performance of SMEs is also affected by enthusiasm at work, incentives and
maintenance of efficient organizational structure in a dynamic environment. These
findings reinforce the idea that structure affects organizational performance.
2.4.4 Human Resource and Firm’s Performance
The influence of human resources on performance in an organization has been a hot
subject for research for the last two decades. The initial impetus to study this
relationship was initiated by the works of Huselid (1995) in his study of the impact of
human resource management practices on turnover, productivity and corporate financial
performance and Becker and Gerhart (1996), in a study of the “impact of human
resource management on organizational performance: progress and prospects”. To date,
the empirical literature from several other scholars in management documents a
supportive evidence of the existence of a positive influence between human resource
practices and performance in an organization (Amin, Ismail, Rashid & Salemani, 2014;

45
Cho, Woods, Jang & Erdem, 2006; Huselid, 1995; Olrando & Johnson, 2001; Osman, &
Galang, 2011; Wong, Tan, Ng, & Fong, 2013; Wright, Gardener & Moynihan, 2003)
Organizations cannot perform well without quality and resourceful people. The
Resource Based View of the firm’s (RBV) supports this view by recognizing the fact
that human resources provides the firm with an important asset that, when well used, can
lead to superior performance and or a competitive advantage. In order for human
resources to provide a sustainable competitive advantage, Barney (1991), identified four
conditions that need to be met. First; that human resources must add value to the firm’s
production process meaning that the level of individual’s contribution to the total
production really matters, secondly; that human resources must present special skills that
are rare to find in an ordinary market place, thirdly; that the combined human capital
investments a firm’s employees represents cannot be easily imitated by other firms in the
market and in the industry and fourthly; that the human resources cannot be easily
substituted by technology. However, in the dynamic environment that SMEs find
themselves today, the ability of the firm to create dynamic capabilities in human
resources is vital for survival and competitiveness. The dynamic capability in people can
be developed through injecting new knowledge and skills and continuous improvement
of human resources through training and development initiatives (Teece, 2014).
Organizations that often practice human resources management experiences lower levels
of labour turnover (Orlando & Johnson, 2001). A study by Cho et al. (2006) which
investigated the relationship between the use of 12 human resource management
practices and organizational performance measured by turnover rates for managerial and
non-managerial employees, labour productivity and return on assets found out that
companies implementing HRM practices such as labour management participation
programs, incentive plans, and pre-employment tests experiences lower labour turnover
rates for non-managerial employees.

46
The association between human resource management practices and performance may
not be direct, something that has been referred to as a “black box” by the scholars, and is
mediated by strategy (Orlando & Johnson, 2001), employee’s ability and motivation
(Fey, Yakoushev, Park, & Bjorkman, 2007). In support of this observation, a study done
by Katou (2008) involving 178 organizations in Greece made a confirmation that a
relationship between human resource policies (resourcing and development,
compensation and incentives, involvement and job design) and organizational
performance exists. The researcher also observed that this relationship is partially
mediated through human resource management outcomes (skills, attitudes, behaviour)
and it is influenced by business strategies (cost, quality & innovation). These findings
imply that human resource management policies associated with business strategies
affects organizational performance through human resource management.
Several human resource practices were found to have a significant influence on
organizational performance. Beh and Loo (2013) found out that best practices in human
resources like performance appraisal, internal communication, career planning, training
and development, recruitment and selection and strategic human resource alignment in
the organization positively affect firm’s performance. Amin et al. (2014) interviewed a
total of 300 employees from a public university and found out that human resource
practices like recruitment, training, performance appraisal, career planning, employee
participation, job definition and compensation have a significant relationship with
university performance.
Other practices identified in the literature include job security, employees autonomy,
hiring of new personnel on a selective basis, creation of self-managed and cross
functional teams, initiating structures that support decentralization of decision making, a
relatively high compensation in line with the performance of the organization, extensive
training of personnel, reduced status distinctions and barriers, including dress, language,
office arrangements, wage differences, and extensive sharing of information throughout

47
the organization, incentives and information technology (Ahmad & Shroeder, 2003; Cho
et al., 2006; Jayaram, Droge & Vickery, 1999; Lo, 2009; Pfeffer, 1996).
Vlachos (2009) observed that firm’s growth as a strategic priority depends on human
capital that is selecting, developing and rewarding the best people as well as revealing to
them the critical company information in order to make informed decisions. His study
on “effects of human resource practices on firm’s growth” studied six variables namely:
the compensation policy, decentralization and self-managed teams, information sharing,
selective hiring, training and development and job security. The study established a
strong correlation between selective hiring and market share growth. Compensation
policy was found to be the strongest predictor of sales growth. Decentralization & team
working were also found to be a significant factor on firm’s growth, training and
development was related to all firm’s growth measures used in the study and showed a
higher correlation with the overall firm’s performance improvement. The study also
found a strong positive correlation between information sharing and sales growth, firm’s
growth and overall firm performance. However, decentralization and information
sharing did not contribute significantly to sales growth while job security was not seen
as an important human resource management practice.
Safari, Karimian and Khosravi (2014) ranked HRM practices affecting organizational
performance and found that performance evaluation, job design and human resource
planning ranked highly, fourth in the ranking was recruitment and selection, employee
health and hygiene, training and development and compensation system. Employee
communication ranked lowest. On performance evaluation, detecting employee
capabilities and improving employee’s task doing and performance evaluation by
interest groups received most attention.
Human resource is one of the critical components required in order to achieve better
performance in an organization (Higgins, 2005; Okumu’s 2003). This component needs

48
to be well aligned with the other components in the 8-S framework and as implied in
Teece (2014), the human resources of a firm need to be well aligned with the dynamism
of the environment if superior performance in a firm is to be realized. Okumu’s (2003)
observed that people are required to drive the process of strategy implementation to
success. Sorooshian et al. (2010) also observed that the significance of human resource
in strategy implementation is based on the idea that people management can be an
essential source of sustained competitive advantage of a firm. This implies that
organizations need to embrace better HRM practices that build a strong asset in form of
people. A strong human resource component is required for proper implementation of
strategies and better performance in an organization.
2.4.5 Technology and Firm’s Performance
Technology refers to the body of knowledge, innovations, products, processes, tools,
procedures and organization systems used by people to accomplish their daily tasks
(Damanpour, 1991). The Resource Based View (Grant, 2001) considers technology as
one of the essential capabilities in the organization’s bundle of resources that are used by
the firm to develop, manufacture and deliver products and services to its customers
(Barney, 1991; Wernerfelt, 1984). However, in line with frequent changes that takes
place in the firm’s industry, the dynamic capability theory (Zollo & Winter, 2002) views
technology as a dynamic capability that is embedded in firm’s practices and is essential
in determining the competitiveness and performance of a firm in a dynamic and
turbulent environment. Firms with strong dynamic capabilities exhibit technological and
market agility, are able to create new technologies, differentiate and maintain superior
processes and modify their structures and business models in a way that ensures they
stay ahead of the competition (Teece, 2014).
Building technological capacity within a firm requires a change where new knowledge,
skills and experience are developed and injected to drive the existing systems and to
generate the required technical change (Lall, 1992; Bell & Pavitt, 1995). Lall (1992)

49
views technological capability as a continuous process of interacting with the
environment to create, accumulate and absorb technological knowledge and skills
required by the firm. According to Kumar, Kumar and Madanmohan (2004), a firm
achieves technological capability through process learning. The ability to create and
manage changes in technologies in production is necessary if a firm has to achieve
success in terms of superior performance (Bell & Pavitt, 1995; Trez, Steffanello,
Reichert, DeRossi & Pufal, 2012; Zawislak, Alves, Tello-Gamarra, Barbieux &
Reichert, 2012).
Since technological capability is often associated with the knowledge of the firm (Jin &
Von Zedtwitz, 2008), then it is incremental in nature (Pavitt, 1998) and there is a limit to
which a firm can accumulate new knowledge. Therefore, many firms in developing
countries go through a learning process after importing new technology which
eventually enables them to develop their own technologies. They need to learn how to
use the new technology and to them technological capacity means generation of new
knowledge and skills (Jin et al., 2008).
In a dynamic environment, creation of technological capacity requires not only new
knowledge but also innovative ideas (Teece, 2014). Innovation allows the alteration of
the firm’s production function and processes and gives the firm a chance to build its
distinctive technological competence. At the firm level, innovation is viewed as the
application of new ideas that lead to development of new products (Rubera & Kirca,
2012; Therrien, Doloreux & Chamberin, 2011).
Employees in organizations apply technology on a daily basis to carry out their duties
and responsibilities. Since it is embedded in almost all organizations activities and
practices from production to marketing of goods and services, from the structure,
culture, systems, organization to leadership, then technology becomes an important
factor that determines the success and competitiveness of a firm. Urich and Wayne

50
(2005) conclude that human resources in a firm regularly apply technology in many
ways in order to improve their efficiency and their effectiveness. This in turn influences
the firm’s performance.
From a system’s thinking, a traditional question many researchers have asked is the
relationship between innovation, the structure of a firm (formalization, centralization,
and specialization) and the industrial environment. From a traditional perspective, it is
supposed that differences in firm’s innovative activities are basically explained by
industry and organizational structural characteristics (Daft, 1992; Damanpour, 1991;
Duncan, 1976; Kimberly & Evanisko, 1981; Wolfe, 1994).
In developing countries where the economies are driven by SMEs in terms of growth
and employment, technology adoption is a growing area of interest (Mubaraki & Aruna,
2013). Due to their flexibility and robust growth, innovation adoption in SMEs enables
them to survive in tight competition, global economic crisis and compete against larger
organizations. SMEs structural flexibility and their ability to adapt themselves better
enable them to innovate, adopt, develop and implement new ideas (Harrison & Watson,
1998). Through this, they are able to offer customers new products.
SMEs are also increasingly using information technology to leverage on their
competitive position and improve their productivity (Premkumar, 2003). Although the
rate of IT adoption in developing countries is still low (MacGregor & Vrazalic, 2005),
IT tools can significantly assist SMEs by creating the necessary infrastructure for
providing appropriate types of information at the right time. IT can also provide SMEs
with competitiveness through integration between supply chain partners and inter-
organizational functions, as well as by providing critical information (Bhagwat &
Sharma, 2007).
Past studies have tried to link technology and better performance in organizations
(Nohria & Gulati, 1996). According to Becheikh, Landry and Amara (2006),

51
technological innovation is a key factor in firm competitiveness and it is unavoidable for
firms which want to develop and maintain superior performance in the current or new
markets. Manimala and Vijay (2012) maintains that technology adoption is crucial for
growth of business in the private sector and Mubaraki and Aruna (2013) observes that
technology adoption behaviour significantly improves organizational performance in
terms of profit, growth and market share. Lumiste, Lumiste and Kilvits (2004) found
that SMEs were engaged in developing their products together with processes. However,
Becheikh et al. (2006) recommended that more research is required in both product and
process innovations in SMEs because it is limited in literature. Artz, Norman, Hatfield
and Cardinal (2010) found that product innovation had a significant impact on firm
performance, Therrien, Doloreux and Chamberlin (2011) found out that for firms
success in the market depended on early entrance, innovation and introduction of new
and novelty products, Atalay, Anafarta and Savan (2013) explored the effect of product,
process, marketing and organizational innovation and found out that both product and
process innovation has a significant effect on firms performance.
2.4.6 Strategic Direction and Firm’s Performance
The strategic direction of the firm is often embedded in its strategic vision and mission
statements. The strategic vision and mission of the firm is the first step in formulating
and implementing strategies. The firm’s strategic vision provides the logical reason for
future plans and directions of the organization. It aims the organization in a particular
direction while providing a long term strategic direction to follow in line with the
aspirations of shareholders (Madu, 2013).
According to Benson (cited in the Economist, 2009), the pre-requisite of strategic
direction is a “mental image” of the possible and desirable state of the organization.
“This image, which we call a vision, may be as vague as a dream or as precise as a goal
or a mission statement”. “To realize strategic intent or direction, some level of activities
and behaviour in an organization are required” (Hamel & Prahalad, 1989). In respect to

52
this, the organization need to redirect all her energies to discover ways that confers
success, mobilize, marshal and allocate requisite resources, communicate effectively to
all staff, motivate employees and clarify issues on a timely basis when there is change or
need to change. “Strategic intent should also create an internal firm wide tension,
inspiring and compelling all employees to be dedicated to the specified future direction”
(Hamel & Prahalad, 1989).
Before a strategy is implemented, it has to be formulated first. A lot of information and
participation of all stakeholders is required during the strategy formulation stage. The
firm’s leadership work hard to create the awareness among all employees and the
stakeholders the direction the organization is headed and how the stakeholders will
benefit from implementation of a new strategy. These efforts are meant to create a
shared vision among all stake holders about the benefits of the new strategy. This step is
very crucial before and during the strategy implementation process. The strategic
direction in this study was considered as an independent variable that is often related to
the first stage in the strategic management process which involves strategy formulation.
It is during the formation stage that the organization usually sets its goals and objectives
which are well aligned to their vision and mission statements. This process also gives the
organization a general focus, an identity and the direction needed to be followed to
achieve her goals.
A number of scholars in management has attempted to link strategic direction sometimes
referred to strategic intent to organizational performance. These studies have yielded
mixed results. Outcomes of some of these studies are discussed in the foregoing.
Lumpkin and Dess, (1996) observed that the relationship between strategic orientation
and organizational performance is influenced by many third-party variables, and the
different effects of third variables may lead to different performance levels. The
researcher recommended that studies on the complex relationship between strategic

53
direction and other predictor variables should be conducted in specific context. As Liu
and Fu (2011) noted, several studies on strategic direction has been conducted in large
established companies (Jantunen et al., 2005), in the context of SMEs (Wiklund &
Shephend, 2005), in industry cluster context (Dai & Li, 2006), in international
background (Martin & Lumpkin, 2003) but their findings on the relationship with
performance are not consistent.
O’regan & Ghobadian (2006) did a study based on the importance of capabilities for
strategic direction and performance management decision. This study found out that
generic organizational capabilities have a positive impact on strategy deployment and on
the achievement of overall performance. This study concluded that generic capability is
one of the main drivers of performance and firms seeking high overall performance
would well be advised to ensure that they actively consider their generic capabilities as
the basis of their strategic direction.
Odita & Bello (2015) conducted a study on strategic intent and organizational
performance in the banking sector in Nigeria. This study found out that strategic
direction is positively and significantly related to organizational performance. The study
also revealed the existence of a positive relationship between various dimensions of
strategic direction such as goals and objectives, mission and vision with the
organization’s performance. Specifically, the study found that the objectives component
of the strategic direction accounted for 58% variance in organizational performance
while mission and vision accounted for 47 and 19% variations in organization
performance respectively. The study concluded that strategic direction has a significant
positive relationship with performance in the banking industry.
Kitonga, Bichanga & Muema (2016) studied the role of determining strategic direction
on not-for- profit organizational performance in Kenya and found out that strategic
direction has a significant positive influence on performance in these organizations.

54
Strategic direction is the cornerstone upon which strategies are crafted, developed and
eventually implemented. Therefore, it is paramount that strategic direction needs to be
very clear and understandable to all stakeholders in an organization. Leaders in SME
firms need to develop their directions with vision and mission in mind. Once developed
then crystallize it and cascade it downward to all employees who need to know the
direction their organization is taking. Finally, the strategic direction should be the
impetus upon which strategic actions and activities are designed and operationalized.
2.4.7 Age, size of the firm and Firm’s performance
Firm level characteristics related to size and age has been found in the past studies to
have a moderating effect on organizations performance (Anic, Rajh & Teodorovic,
2009; Hui, Radzi, Jenetabadi, Kasim, & Radu, 2013). Firm size is a variable that is
widely acknowledged to have an effect on firm’s performance. The causal relationship
between size and performance has yielded mixed results in a number of studies.
Although a study conducted by Capon, Farley and Hoenig, (1990) did not find a
significant relationship between size in terms of number of employees and firms
performance, several other studies have found a positive relationship between firm’s size
and profitability (Lee & Giorgis, 2004; Ural & Acaravci, 2006).
Bigger firms are presumed to be more efficient than smaller ones. The size helps in
achieving economies of scale and therefore can afford to offer their products in the
market at lower prices. Large firms also have power to access capital markets which
give them more access to opportunities that are not available to small firms (Amato &
Wilder, 1985). However, in a variant study, Zumitzavan and Udchachone (2014) found
the number of employees to be negatively related to performance of an organization
meaning that organizations with smaller number of employees may perform better than
those with large number of employees.

55
On the other hand, firm’s age measured in terms of the number of years a company has
been operating in the market is an important determinant of firm’s dynamics. Past
studies shows a relationship between the age of the firm and firm’s growth, failure and
variability in growth decreases with age (Yasuda, 2005). Young firms are more flexible
and dynamic and more volatile in their growth compared to older firms. As the firm ages
they are likely to become more stable in growth, gain more knowledge and innovations,
position itself better in the market, develop a better structure that increases efficiency
and help lower costs and are more likely to have better investment plans.
Anic et al. (2009) carried out a study involving firm level characteristics, strategic
factors and firm performance in Croatian manufacturing industry found out that high
performing firms were small and younger companies. The study concluded that these
firms are highly motivated to succeed and since they do not carry the burden from the
past, they are more flexible in adjusting to dynamic market trends.
Hui et al. (2013) in a study entitled the impact of age and size on the relationship among
organizational innovation, learning and performance in Asian manufacturing companies
and confirmed that a relationship exist between age, size of the firm with organizational
learning, innovation and performance. The study found a significant positive impact on
organizational innovation, organizational learning and organizational performance and
concluded that larger companies have access to more resources to be invested in
organizational innovation and therefore large companies are less dependent on
organizational learning than smaller companies. The study also found that age enables
firms to develop routines to be able to perform their activities with more efficiency and
better performance. Younger firms suffer from missing consolidated routines meaning
that innovation needs further attention and work from organizational learning process.
The variables of age and size are frequently cited in the literature as precursors for
organization innovation and performance (Hui et al., 2013) and according to research

56
outcomes, they were found to have the capability of moderating the relationship between
the variables identified in this study.
2.5 Critique of the Existing Literature
The review of the literature related to strategy implementation tends to point out that
strategy implementation is the panacea to success in organizations in terms of superior
performance and competitive advantage (Barnat, 2012). The literature has statistical
evidence that a number of the strategy implementation drivers reviewed in this study
play a key role in determining superior performance in business firms.
The literature also tends to lead to the thinking that only those firms paying close
attention to strategic management processes are guaranteed of success (Sorooshian et al.,
2010). This perspective raises fundamental questions concerning those firms which have
no clue of what a formal strategy is and yet they succeed in their own unique ways (EC,
2003). Most studies have concentrated on strategies and organizational performance
from a formal and direct perspective and largely ignored organization’s informal and
indirect practices (EC, 2003). According to Gakure and Armule (2013) quite a number
of SMEs in Kenya do not have documented plans and yet they still perform well on their
own unique ways and styles. Future studies need to look at the informal application of
strategies and the performance of business organizations.
The second fundamental issue arising from the literature is why organizations fails or
seriously struggles in strategy implementation despite having robust and strong
strategies. Carter & Pucko (2010) point out that between 60 - 80% of firms globally fails
or seriously struggle in their strategy implementation processes. The implications here is
that the same number of firms do not have a good strategies or leadership. Many good
CEOs have been fired because of strategic failures but not necessarily that they do not
practice strong leadership styles (Ekelund, 2015; Forbes, 2013). Therefore, leadership
styles are contingent to the environment the firm is working in and at a particular point

57
in time (Fuchs, 2007; Hersey & Blanchard, 1969). There are instances where autocratic
leadership style yield better and faster results than transformational leadership. The
literature has concentrated on three main leadership styles that is, transformational,
transactional and passive/avoidant ignoring others (Avolio & Bass, 2004).
A key variable under investigation in this study is organization structure. There is a
mixed perception from contemporary scholars that deviates from the original thinking
advanced by Chandler (1962) that “structure always follows organization’s strategy”.
There are counter arguments in the literature that tend to point out that the opposite also
holds some truth. Some scholars have argued that organization “strategy follows the
structures that are already laid down in organizations” (Hall & Saias, 1980; Bielawska,
2016). The scholars observed that while most of the studies are in agreement with
Chandler’s (1962) works, the nature of the relationship between structure and strategy
requires re-examination. The scholars suggested an alternative view by stating that the
strategy, structure, and environment are closely intertwined. “Whereas a man builds the
structure of an organization, in practice, it is this very structure that later constrains the
strategic choices they make” (Hall & Sias, 1980).
There have been divergent views on the contributions of human resources to
performance in organizations and the literature has referred this as a “black box” that is
often mediated by strategy (Orlando & Johnson, 2001; Fey et al. 2007). Over the years,
scholars have argued whether human resources contribute directly or indirectly to the
performance in an organization (Huselid, 1995; Becker & Gerhart, 1996; Orlando &
Johnson, 2001; Fey, Yakoushev, Park, & Bjorkman, 2007; Katou, 2008; Beh and Loo,
2013). Some of the studies have tended to confirm the findings by Huselid (1995) that a
direct link exists between human resources and organizations performance while the
divergent views tends to follow Orlando & Johnson’s (2001) arguments that human
resource need to be mediated by other variables for it to have a positive effect on
organizations performance.

58
Technology variable, according to the RBV (Grant, 2001) and DCV framework
(Wernerfelt, 1984; Rumelt, 1984, Barney, 1991, Zollo & Winter, 2002, Teece, 2014),
and strategic direction variable (Hamel & Prahalad, 1989, Madu, 2013) are often
embedded in various organizations practices and configurations implying that they do
not influence organization’s performance directly. The direct treatment of these two
variables in previous studies also raises a fundamental question whether these variables
need to be treated directly or have to be mediated by other variables. Majority of the past
studies have treated both variables directly.
While some of the past studies have documented a direct relationship between
technology and organizational performance (Nohria & Gulati, 1996; Becheikh, Landry
& Amara, 2006; Manimala & Vijay, 2012; Mubaraki & Aruna; 2013), similar studies in
strategic directions have yielded mixed results (Lumpkin & Dess, 1996; Odita & Bello,
2015; Kitonga, Bichanga & Muema; 2016). Some of these studies have found a direct
relationship between strategic direction and organization performance (Odita & Bello,
2015; Kitonga, Bichanga & Muema; 2016) while others have found that strategic
direction works well when it is embedded in other strategy variables (Lumpkin & Dess,
1996). These studies projects divergent approaches on technology and strategic direction
variables. The implication here is that these variables are based on different frameworks
and a unitary approach is required in future studies.
The literature reviewed also portends a dual perspective on variation in firm’s
performance. The first perspective is aligned to environmental dynamism as the main
cause of variations in performance (Teece et al., 1997; Teece; 2007; 2014) while the
second perspective is based on resources and capabilities (Grant, 2001; Barney, 1991;
Wernerfelt, 1984; Rumelt; 1984; Eisenhardt & Martin, 2000; Teece; 2014). These mixed
perspectives put scholars in a difficult situation when deciding which one to follow. This
could also explain for variations in findings of the past studies as documented in
strategic management literature. Several scholars in strategic management have also

59
observed that the management literature pertaining to strategy implementation is
fragmented, inconclusive and lacks theories or comprehensive frameworks (Alexander,
1991; Maas, 2008; Noble, 1999; Okumus, 2001). However, the review of literature
related to strategy implementation indicates that the performance is a derivative of the
interactions between various components and activities within a firm.
First, the systems theory views performance as a product of harmonious interactions of
various components that must work together at all times. However, the theory does not
address how the environmental factors like technological changes are likely to influence
the harmonious relationships existing between sub-components and in turn affecting the
performance of a firm either positively or negatively. The theory assumes that there will
always be an agreement between various systems’ sub-components and each system
sub-components is aware of the end result which is not practically true in a highly
dynamic and competitive environment. The systems theory locks out outsider
components and assumes that an outstanding performance is as a result of only the sub-
components working within the system only. This is also not practically true because
performance in an organization may be influenced by other social-cultural, legal,
economic and political factors outside the firm’s environment.
The Dynamic Capability View of the firm (DCV) attributes good performance of a firm
as a result of possession of unique capabilities which are dynamic and tacit in nature and
are hard to be imitated by rival firms. These unique dynamic capabilities like superior
leadership skills give a firm a competitive edge over her rivals. In the DCV’s approach,
it is the competitive advantage that explains the superior performance in a business firm.
However, the DCV framework is criticized in that it lacks a proper grounding theory and
appears to ride on the foundations of the RBV. The DCV also lacks empirical research
and evidences on dynamic capabilities, it lacks conceptual clarity and it is often seen to
be inconsistent in explaining successful change in a logical manner. The DCV suffer

60
from vagueness and has confusing definitions that make it difficult for researchers to
pick or capture the constructs properly. Furthermore, the framework is based on the
narrow qualitative empirical tests from case studies.
The McKinsey’s 7-S framework lays a good foundation of how the variables in the
current study are intertwined and work in a harmonious relationship like a system.
However, the model is limited because it omits the outcome of these interactions
(performance of a firm). It therefore follows that all the variables in the current study are
underpinned in McKinsey’s framework except firm’s performance. This led the current
study to adopt the Higgins 8-S framework which is considered more complete.
Finally, the Okumu’s strategy implementation framework gives a more comprehensive
view of how variables are related and work harmoniously in order to achieve objectives
of an organization. In this model, all the variables in the current study are underpinned.
2.6 Research Gaps
The past studies have presented divergent views on the contributions of some of the key
variables influencing strategy implementation and consequently organization’s
performance. For instance first, the scholars don’t seem to agree whether human
resources, strategic direction and technology should be treated as a direct or indirect
independent variables affecting organization’s performance or they have to pass through
other mediating variables. Secondly, past studies don’t seem to agree on how to treat
strategic direction, whether as a direct or an antecedent independent variable. Thirdly,
the argument that organization’ strategy follows structure requires further research.
Previous studies have provided little evidence on the influence of strategy
implementation on performance of firms (Okumu’s 2001). Sorooshian et al. (2010) did
an empirical study of the relationship between strategy implementation and performance
in SME’s operating in Iran using empirical data sources. Primary data need to be

61
collected to validate or invalidate the findings in their study. Sorooshian et al. (2010)
explored the relationship between three major factors in strategy implementation
(Leadership styles, Human Resource Management and Structure). The study did not
focus on technology as a major driver. However, the literature reviewed in this study has
confirmed that there is a positive and significant relationship between technology and
performance of an organization. This gap requires further investigation.
A number of studies in the past have not examined how the strategy implementation
variables behave in combined relationships as evidenced in studies done by Jouste &
Fourie (2009) in South Africa, Oku et al. (2011), Ojokuku et al. (2012), Undo et al.
(2012), Ugochuku et al. (2012) in Nigeria, Koech & Namusonge (2012), Okwachi et al.
(2013) in Kenya. Further studies are required to establish the effect of strategy
implementation drivers in a combined relationship. In Kenya, a number of the past
studies have mainly focused on the nexus between strategic planning practices and
performance of a firm. Only a handful focuses on the influence of strategy
implementation and organization’s performance (Awino 2013, Bowen et al., 2009;
Bunyasi, Bwisa & Namusonge, 2014; Gathogo & Ragui, 2014; Gakure & Amure, 2013;
Kiganane, Bwisa & Kihoro, 2012; Mosoti & Murabu, 2014; Mwangi, 2011; Okwachi et
al., 2013; Oseh, 2013) and this gap requires further investigation.
This study aimed at filling part of the existing research gaps by examining the influence
among the key strategy implementation drivers on the performance of manufacturing
SME’s in Kenya: The perceptions from the Chief Executive officers.
2.7 Summary
The empirical review gives a clear indication that leadership styles, organizational
structure, human resource practices, strategic direction and technology positively
influence business firm’s performance. It is also clear that the strategic direction the firm
positively influences the strategy implementation efforts. For instance, if the employees

62
do not know the direction the organization is heading to or do not know the vision and
mission of the firm, then they are less likely to be committed in strategy implementation.
In a dynamic environment the SMEs firms find themselves today, success is only
guaranteed by development of unique sets of capabilities and competences in technology
to enable them develop new knowledge, innovate and develop better products. Strategic
leadership is required and managers need better skills that are unique and adaptable to
the ever changing environment. Superior skills in human resource management are
critical in areas like training, hiring, motivation and creating an enabling environment
needed to support the strategy implementation efforts. Finally, firms need to often revise
and align their structures with the requirements of new strategy.

63
CHAPTER THREE
RESEARCH METHODOLODY
3.1 Introduction
This chapter documents the methods and procedures that were used to gather and
analyze data on the influence of strategy implementation on performance of small and
medium manufacturing firms in Kenya. It presents the research designs adopted, the
population of interest, sampling frame, sample size determination and sampling
techniques, data collection instruments and procedures, pilot test and data processing
and analysis. Also presented in this chapter are the research models that this study
utilized to analyze and test various hypotheses developed in the study.
3.2 Research Design
A research design is a blue print used for collection, measurement and analysis of the
data. It is a plan and structure of investigation used to obtain answers to research
questions the study intends to answer (Kothari, 2004). This study aimed at establishing
the influence of strategy implementation on the performance of small and medium sized
manufacturing enterprises in Kenya. To achieve this, the study employed a combination
of both qualitative and quantitative designs. Part of the designs in this study was the
exploratory design which was guided by the philosophy of logical positivism with the
claim that a statement is only meaningful if it can be proven to be true or false
(Gathenya, Bwisa & Kihoro, 2012) Under this philosophy, knowledge is accumulated
through logical reasoning and empirical experience (Creswell, 2003; Scotland, 2012).
In a nutshell, this study applied a mixed designs approach which is the triangulation of
several research designs. This approach had been used by several scholars in the past in
similar studies because of its ability to increase validity of the outcomes while at the

64
same time compensating for the weaknesses of each method used (Creswell & Plano,
2011, Johnson & Onwuegbuzie, 2004; Northhouse, 2013). Quantitative design was used
to quantify the hypothesized influence of strategy implementation on performance while
qualitative design was used in open ended constructs meant to interrogate a given
variable further. Locally in Kenya, mixed research designs have been used by several
scholars in related studies (Karimi, 2012; Gathenya et al., 2012) and Atikiya, 2015).
3.3 Target Population
Population refers to the entire group of people, events or things of interest that the
researcher wishes to investigate (Sekaran, 2003). The population of interest in this study
included all the small and medium manufacturing firms engaged in manufacturing
activities in Thika Sub-County and employed between 10 and 100 people. A list of all
registered business firms within Thika sub-county was obtained from the County
Government of Kiambu, as at November 2014. The list contained 593 SME firms
engaged in manufacturing, activities.
Table 3.1: Target Population
SME Type Population Percentage
Medium sized firms 10 1.7
Small sized firms 583 98.3
Total 593 100
Adapted from the County Government of Kiambu (2014): Registered Business
Enterprises in Thika Sub-County

65
3.4 Sampling Frame
The sampling frame for this study included 593 small and medium sized manufacturing
firms which operated within the Sub-County of Thika and were registered by the County
Government of Kiambu as at November 2014. These firms were grouped into two main
clusters according to size. This led to classifications like the medium sized firms and
small sized firms. Since most of these firms were concentrated within Thika town, then
the study limited itself to all the small and medium manufacturing firms operating in
Thika town and within a radius of 15 kms from the town. The aim of this limitation was
to ensure that the sample selected in this study maintained homogeneous characteristics
(Gatheya, Bwisa & Kihoro, 2012). Areas that were covered in this study include Thika
town, Jamhuri market, Jua Kali, Munene industries, Mandaraka market, Kiganjo market,
Ngoigwa and Landless markets.
The entire population of medium and small sized firms within the specified areas was
considered in this study. However, an enterprise with less than 10 full time employees
and annual sales of less 100,000 to 3 million USD based on the amount of money an
enterprise pay for a business license (County Government-Kiambu, 2014) was excluded
due to the fact that the enterprise did not fit in well in the working definition of an SME
in Kenya. Based on this criterion, 165 business enterprises constituted the sampling
frame for this study.

66
Table 3.2: Sampling Frame
SME Type Population Percentage
Medium sized firms 10 6
Small sized firms 155 94
Total 165 100
Source: County Government of Kiambu (2014)
3.5 Sample and Sampling Technique
Sampling refers to the selection of the elements of the population to be included in the
study. A sample is a part of the entire population that can be used for study and has all
the characteristics of the entire population. According to Kothari (2004), the ultimate
test of a sample is how well it represents the characteristics of the entire population.
3.5.1 Sample Size Determination
The study sample was selected using the formulae given by Mugenda and Mugenda
(2003) where the sample size for a population of 10,000 or more is computed using the
formula given below:
n = pqz2
e2
Where, n = Minimum Sample Size
p = Population proportion with given characteristic
z = Standard normal deviation at the required confidence level

67
e = Error Margin
Mugenda and Mugenda (2003) recommend that since p and q are unknown, both are set
at 50%. At a confidence level of 95% that will be used for this study, z = 1.96 and the
sampling error of e = +5%. Thus, sample size n becomes:
N = 50*50*(1.96/5) 2 = 384
For a population less than 10,000, the sample is computed as follows;
nf = n/(1+n/N)
Where, nf = desired sample size when the population is less than 10,000
n =sample size (when the population is greater than 10,000) =384
N =estimate of the population size = 165
384/(1+384/165) = 384/3.33
=115 firms.
Using this formula, a sample size of 115 SMEs manufacturing firms were selected for
the purpose of this study as shown in Table 3.3;

68
Table 3.3: Sample Size
SME Type Population Formulae Sample Size
Medium sized firms 10 115(10/165) 7
Small sized firms 155 115(155/165) 108
Total 165
115
3.5.2 Sampling Technique
This study grouped SMEs manufacturing firms according to size resulting to categories
like medium sized and small sized firms. A multi-stage sampling technique was used to
select the firms to participate in this study where the firms were stratified into two main
categories namely the medium and small sized firms. After this stratification, a
systematic random sampling procedure was applied to determine the actual number of
firms to participate in the study. Every 2nd firm from the sampling list was selected. This
procedure was repeated several times on the remaining firms until the study obtained the
required 115 manufacturing firms that participated in this study.
3.6 Data Collection Instruments
This study utilized open ended and closed ended questionnaires and secondary sources
as the main instruments for data collection. The secondary data reviewed mainly
concerned the audited financial records which gave an indication of the movement of
various indicators for the period sought by the study. However, majority of these firms
do not keep proper financial records. This forced this study to rely mostly on the
perceptions obtained from the questionnaires given to the CEOs.

69
The questionnaire included Likert scale psychometric constructs with a scale ranging
from 1-5 where each respondent was required to rate each and every statement given
describing a given variable. The scale ranged from 5=Strongly Agree, 4=Agree,
3=Neutral, 2= Disagree and 1=Strongly Disagree. Each and every item in the
psychometric constructs was meant to measure a certain attribute of the main variable.
These constructs were set in unambiguous terms allowing the respondents to react to
them without wasting time. At the end of each Likert scale questions, open ended
questions were included to allow the respondent give additional information that is not
captured in the Likert scales questions. This is the section that enabled the study to
capture vital information directly from the respondents based on their understanding of
their environment and the challenges they face on a daily basis.
3.7 Data Collection Procedures
Secondary sources of data were also used from the SME manufacturing firms that
possessed publications, brochures, financial statements and other vital records useable to
inform on the study objectives. Since the owners or CEO’s are the major architect of
strategy implementation in organizations, one questionnaire was administered to the
owner or CEO of each firm selected for this study. A total of 115 questionnaires were
administered to 115 selected manufacturing SMEs firms in this study. Included in the
self-administered questionnaire are both close ended and open ended and Likert scale
psychometric constructs.
Due to the work commitments among the CEO’s and the owners of the firms, drop and
pick latter method was used for questionnaires. This gave managers enough time to
reflect and respond to all questions. The researcher read, interpreted the questions and
recorded the responses from those owners who could not read or write or those who
indicated that they did not understand the questions well.

70
The researcher recruited and trained two research assistants to assist in saving time and
ensuring proper regular follow-ups are made. Appointments were obtained for those
firms where the owners or the CEO’s had busy schedules and the researcher ensured that
these appointments are kept. The study only required one questionnaire for every firm
and therefore it was paramount to adhere to the work schedules and appointments given.
3.8 Pilot Test Results
The research instruments for this study were pretested using a sample of 12 SMEs
manufacturing firms in Thika Sub-County as recommended by Mugenda and Mugenda
(2003), where a sample of 1% to 10% of the actual sample size is adequate for piloting
purposes. The study’s respondents were owners or the CEOs of SMEs manufacturing
firms with similar characteristics to, but not those which were used in the main study.
The purpose of the pilot study was to assess the reliability of the instruments used in the
main study. The results obtained indicated that the instruments were reliable with a
Cronbach alpha above 0.70. However, the study suffered the presence of multi-
collinearity among the strategy variables that is strategic direction, leadership styles,
organization structure, human resources and technology. As a remedy, the items in the
questionnaire were thoroughly revised to identify and isolate similar questions in
different variables after which the items were further subjected to reliability tests.
Several measures of variables and methods used for data analysis were also refined.
3.8.1 Reliability and Validity Analysis
Reliability is the extent to which a test, experiment or any measuring procedure yields
similar results in the repeated trials and can therefore be generalized. The tendency
towards yielding similar results in repeated trials or measurements is its consistency.
Validity, on the other hand, is the extent to which the constructs are able to measure
what it is supposed to measure (APA, 2014).

71
In order to measure the internal consistency of the study instruments, this study used the
Cronbach alpha (α) which measures how well items in a set are correlated to each other
(Cronbach, 1951). The value of alpha varies from zero to 1 since it is a ratio of two
variances. As a rule, an alpha value between 0.70-1.00 is considered an adequate
measure of internal consistency (reliability) among the constructs being tested. The
results of the Cronbach alpha tests for the dependent variable and independent variables
used in this study are shown in Table 3.4.
Table 3.4: Reliability and Validity Measurement Results
Constructs Number of items Cronbach Alpha
Attention to Leadership Styles 21 0.800
Emphasis on the Strategic Direction 11 0.707
Attention to Human Resources 15 0.706
Structural Adaptations 15 0.705
Attention to technology 13 0.854
Performance 10 0.815
As shown in Table 3.4, organizational performance, which is the dependent variable,
had a Cronbach alpha coefficient of 0.815 for 10 items that were investigated. This
shows that the measurement of performance was acceptable according to Cronbach’s
rule for internal consistence and reliability. Attention to leadership styles (21 items),
awareness of the strategic direction (11 items), attention to human resources (15 items),
structural adaptations (15 items) and the level of technology (13 items) are the
independent variables and had a Cronbach alpha of 0.800, 0.707, 0.706, 0.705 and 0.854
respectively. All these variables had Cronbach alpha (α) value above 0.70 which
indicated that the measures of these variables were consistent and reliable.

72
3.9 Data Processing and Analysis
Prior to the processing of the responses obtained in this study, the questionnaires were
edited for completeness and consistency and the incomplete ones were excluded for
analysis. Descriptive statistics such as frequency distributions, mean score, mode,
median, variance and standard deviations were used to analyze quantitative data. The
results were presented in simple and cross tabulations, charts and frequency
distributions. Qualitative data was coded into different factors and analyzed through
computer aided content analysis. The content analysis (Berelson (1952), is an objective
technique that ensures systematic, quantitative description of and communication of
information. The technique is able to detect the presence of certain words, concepts,
themes, phrases, characters, or sentences within texts and quantify them in an objective
manner.
The mean score was used to analyze the Likert scale based psychometric constructs
ranging from 1-5 and presented in a nominal scale and the Cronbach alpha coefficient
was used to check the goodness of the data leading to consistency and reliability of
measures in the Likert scale psychometric constructs. An alpha level of 0.70 and above
was used as an acceptable test for reliability and consistence in the items included in the
questionnaire (Cronbach, 1951).
Inferential statistics were used to test variable relationships and influences in the
regression analysis. The ordinary least square regression (OLS) analysis was used to
determine the relationship that the independent variables has on the dependent variable.
In order to test the linear relationship between the various independent and the
dependent variables in this study; Spearman’s rho correlation was used where the
designation r symbolizes the correlation coefficient. This varies over a range of +1 to -1,
whereby the sign signifies the direction of the relationship. This coefficient is significant
in situations where the significance level is P < 0.05 and P < 0.01. The regression output

73
obtained in OLS gave the coefficient of determination (R2) and the F-statistics which
were then used to determine the goodness of the fit and the model validity respectively.
The F-statistics is significant when p-value P < 0.05 while the R2 output above 0.75 is
generally considered good for the model fitness.
To test the hypotheses in this study, the following two conditions were set such that
given H0 and H1, set α = 0.05, the rule is that reject H0 if P- value is less than α else fail to
reject H0 : where
1. H0: Null Hypothesis: H0i: βi =0. Where, (i=1, 2, 3, 4, 5)
2. H1: Alternative Hypothesis: H1i: βi ≠ 0. Where, (i = 1, 2, 3, 4, 5)
The bivariate linear Correlation output has a corresponding P-value for a given variable.
If P > 0.05 then reject the null hypothesis H0 and accept alternative hypothesis H1
otherwise fail to reject the null hypothesis H0 for P-values less than 0.05. The regression
output also provided the t- values and the corresponding p-values. In the test results of
the hypotheses where the p-value was less than 0.05 (P < 0.05) then null hypotheses H0i
was be rejected in favour of alternative hypotheses H1i implying that the independent
variable (Xi) has a significant relationship with dependent variable (Y).
3.9.2 Measurement of Variables
The psychometric instruments developed to measure variables in this study were based
on the philosophy of logical positivism (Scotland, 2012) where logical analysis is used
as a major instrument in resolving philosophical issues or disputes. Several statements
which attempt to establish the correlation between real objects or processes and the
abstract concepts of the theory were developed as psychometric measures of the
independent variables (leadership styles, organizational structure, human resources,
technology and strategic direction) and dependent variable (performance) in this study.

74
a. Firm’s Performance
The performance of a firm was measured by the degree of satisfaction on the levels of
profitability, Return on Assets (ROA), Return on Equity (ROE) and sales turnover. Due
to the sensitivity of obtaining information related to financial performance where owners
of a firm were not willing to cooperate or information was not available, A 5 point
Likert scale psychometric instrument (Boone & Boone, 2012) was developed to capture
information using indirect financial measures where the degree of satisfaction with
firm’s performance was used based on owner’s perceptions on performance. The scale
ranged from (1= Strongly Disagree, 2= Disagree 3= Not Sure, 4=Agree, 5= Strongly
Agree). The mean score was then calculated as an average of the 5 items examined on
the enterprises’ perceived performance. A mean score of 3.4 and above on each item
indicates that the respondents agreed with the statement given while those with a mean
score below 3.4 indicates disagreement. Then the average mean score per firm was
obtained from aggregating the means on performance and dividing by 5 items. The
higher the score, the better the statement is in terms of the firm’s perceived performance.
This was also reinforced by an indirect approach where the profitability and sales
turnover were measured by the degree of satisfaction with firm’s performance (Njuguna,
2008). A 5 point Likert scale (with 1= Completely Dissatisfied, 2= Dissatisfied, 3=
Neutral, 4=Satisfied, 5= Completely Satisfied) was used for each of the two statements
given about the enterprise’s performance. The mean score was then computed as an
average of the 5 items examined on the enterprises’ perceived performance.
b. Strategy Implementation
Strategy implementation was used to measure the extent to which a firm pays close
attention to the requirements of the key factors that drives successful strategy
implementation in a firm. In order to measure the variables under strategy
implementation (leadership styles, organizational structure, human resources and

75
technology), a 5-items Likert scale was developed (Boone & Boone, 2012) which ranged
from (1= Strongly Disagree, 2= Disagree 3= Not Sure, 4=Agree, 5= Strongly Agree).
The mean score was then computed as the average of the 5 items. The higher the score,
the more the variable is important to the performance of small and medium
manufacturing firms in Kenya.
c. Strategic Direction
Strategic direction of the firm was used to measure the extent to which a firm
emphasizes on her vision, mission and goals/objectives as a key guide in strategy
implementation efforts. In order to measure this antecedent variable under strategy
implementation, a 5-items Likert scale was used (Boone & Boone, 2012) which ranged
from (1= Strongly Disagree, 2= Disagree 3= Not Sure, 4=Agree, 5= Strongly Agree).
The mean score was then computed as the average of the 5 items. The higher the score,
the more the variable is important to the performance of small and medium
manufacturing firms in Kenya.
d. Firm Level Characteristics
The age and size of a firm was used to measure the moderating effect of the
relationship between strategy implementation and performance of small and medium
manufacturing firms in Kenya. Age of the firm was considered as the number of
years the firm has been operating since its initial establishment. A firm which has
been operating for less than 5 years was considered as a young while vice versa is true
for an old firm. On the other hand, the size of the firm was measured by the number
of full time employees working in a given firm’s establishment. A firm that employed
between 10-50 people was regarded as small while the one that employed between 50
and 100 people was regarded as a medium enterprise.

76
Table 3.5: Operationalization of Variables
Type of Variable Name Operationalized indicator of the variable
Dependent
Variable
Firm’s
Performance
Annual sales, profitability, employees growth, degree of
satisfaction on levels of profitability, perceptions towards
ROA and ROE
Independent
Variables
Leadership
Styles
Idealized Attributes, Idealized Behaviors, Inspirational
Motivation, Intellectual Stimulation, Individualized
Consideration, Contingent Reward, , Laissez-Faire
Structure Formalization, Centralization and, Specialized functions
Human
Resource
Training, remuneration, promotion, recruiting and staffing
system, Performance evaluation, Job descriptions.
motivation and incentives, number of staff,
Technology Proper technology reachable for all employees,
Consideration of technologies which are facilitators for work
processes, R&D efforts for developing technologies needed
for organization, Availability of communication
technologies Technology auditing system and update
service, Consideration of new technologies
Strategic
Direction
Relevant vision & mission, Mission compatible with the
activities that goes on, Employee’s contribution to Vision
and mission Clearly defined objectives, Motivated staff ,
Performance targets aligned with objectives
Moderating
Variable
Size
Age
Number of full time employees
Number of years the firm has been in operation

77
3.9.3 The Research Model
This study adopted a multiple regression model that attempted to predict the extent to
which each of the five independent variables (X1, X2, X3, X4 and X5) and the two
moderating variables (Z1, Z2) influences the dependent variable (Y) through strategy
implementation initiatives of the manufacturing SME firm. The influence of Xi and Y is
expressed in the following functional relationship;
Y = f (X1, X2, X3, X4, X5, Z1, Z2) + ε
Where:
Y is the firm’s performance,
X1 is the attention to leadership styles during strategy implementation
X2 is the attention to structure during strategy implementation
X3 is the attention to human resource requirements
X4 is the attention to technology requirements
X5 is the strategic direction of the firm
Z1 is the dummy variable for age of the firm where 1 = over 5 years of age
and 0 = less than 5 years.
Z2 is the dummy variable for the size of the firm where 1 = Medium Enterprise
and 0 = Small Enterprise
ε is the stochastic disturbance error term.

78
To achieve the objectives of this study, the following three multiple regression models
were developed to show the steps or the order in which the variables in this study were
tested in a hierarchical manner.
a) Model 1
Y= β0 + βiXi + ε, (i = 1, 2, 3, 4, 5) …………………………………... (1a)
Y = β0 + β1X1 + β2X2 + β3X3 + β4X4 + β5X5 + ε…………………… (1b)
Where:
Y is the firm’s performance
β0 is the Y intercept / constant.
βi is the coefficient of independent variable Xi where i = 1,2,3, 4, 5.
X1 is the attention to leadership styles during strategy implementation
X2 is the attention to structure during strategy implementation
X3 is the attention to human resource requirements
X4 is the attention to technology requirements during strategy implementation
X5 is the strategic direction of the firm
ε is the error term.
These models were used to establish the influence of the independent variables
(Leadership styles, Human Resource, Structure, Technology and Strategic Direction) on
the dependent variable (performance). The model included the ordinary predictors of

79
performance in manufacturing SME firms before any moderating moderation effect of
age or size of the firm.
b) Model 2
Y = β0 + βiXi + βjZj + ε, (i = 1, 2, 3, 4, 5, j = 1, 2) ………. ……….. (2a)
Y = β0 + β1X1 + β2X2 + β3X3 + β4X4 + β5X5 + βjZj + ε…………….. (2b)
Where:
Zj is the moderating variable (dichotomized age/size)
Βj is the coefficient of the moderator as a predictor
The rest of the variables are as defined in the model 1. These regression models were
used to test whether the moderating variable is a significant predictor of performance in
the presence of the variable to be moderated in the manufacturing firms in Kenya.
c) Model 3
Y = β0 + βiXi + βjZj + βijXiZj + ε …………………………………………….. (3a)
Y= β0 + β1X1 + β2X2 + β3X3 + β4X4 + β5X5 + βjZj + βijXiZj + ε………….. (3b)
Where:
XiZj is the interaction term between variable Xi (i = 1, 2, 3, 4, 5) and moderating
variable Zj (j = 1, 2)
Βij is the coefficient of the interaction term

80
The rest of the variables are as defined previously. These regression models were used to
bring in the interaction terms between Xj and Zj. The models were used to test whether
the age/size of the firm has any moderating effect on the relationship between strategy
implementation and performance of small and medium manufacturing firms in Kenya.

81
3.9.4 Study Hypotheses
This study utilized different tests for hypotheses as presented in Table 3.6
Table 3.6: Study Hypotheses
Variable Null Hypothesis Type of Analysis Interpretation
Leadership
Styles
H01
No significant
difference
Pearson Correlation
Linear Regression
p < 0.05 reject null
p > 0.05 fail to reject null
Structural
adaptations
H02.
No significant
difference
Pearson Correlation
Linear Regression
p < 0.05 reject null
p > 0.05 fail to reject null
Human
Resource
H03.
No significant
difference
Pearson Correlation
Linear Regression
p < 0.05 reject null
p > 0.05 fail to reject null
Technology H04.
No significant
difference
Pearson Correlation
Linear Regression
p < 0.05 reject null
p > 0.05 fail to reject null
Strategic
Direction
H05.
No significant
difference
Pearson Correlation
Linear Regression
p < 0.05 reject null
p > 0.05 fail to reject null
Moderation:
Age & Size
H06.
No significant
difference
Pearson Correlation
MMR
p < 0.05 reject null
p > 0.05 fail to reject null

82
CHAPTER FOUR
RESEARCH FINDINGS AND DISCUSSION
4.1 Introduction
The aim of this study was to establish the influence of strategy implementation on the
performance manufacturing SME firms in Kenya as moderated by the age and the size
of the firm. Specific objectives were to determine how the attention to leadership styles,
structure, human resources, technology and strategic direction relates to the performance
of these firms. This chapter presents the results and findings of the study.
4.2 Response Rate
A total of 115 manufacturing SMEs participated in the study. In each firm, one
questionnaire was administered to the CEO or the owner of the business. A total of 115
questionnaires were distributed filled and returned. All the questionnaires returned were
valid for data analysis and therefore the response rate was 100%.
4.3 Demographics Characteristics of the Respondents
This study sought to establish the demographic characteristics of the respondents in
terms of gender, age, marital status, educational qualifications and current position.
Summary results of respondent’s demographics is presented in Figure 4.1
4.3.1 Gender of the Respondents
The study findings in Figure 4.1 indicate that there were more male respondents than
their female counterparts. Male respondents accounted for 70% of the entire sample
while female respondents only accounted for 30%. This implies that the SME
manufacturing sector in Kenya is largely dominated by males in terms of gender.

83
Figure 4.1: Gender of the Respondents
4.3.2 Position held in the firm
This study intended to find out the current position of the respondents providing the data
for this study. The results in Figure 4.2 indicate that majority of the respondents (87.8%)
occupied the position of a chief executive officer or closely related titles depending on
the firm’s structure while the rest (12.2%) were the real owners of the firm. The
literature and real life experience has it that it is the CEOs or their representatives who
are the chief architects of strategies in organizations. It can be deduced from this finding
that the current study collected data from the right sources implying that the results give
a true picture of what is happening on the real world of their business firms.
Female30%
Male70%

84
Figure 4.2: Positions held by the Respondents
4.3.3 Age of the Respondents by Category
This study wanted to find out the age of the respondents and the findings are presented
in Figure 4.3. The study findings indicate that majority of the CEOs in manufacturing
SMEs are in their middle ages hence relatively young. Since these businesses are
currently operating in a highly competitive environment, these CEOs are relatively
flexible in mastering, reacting and adjusting to these environmental changes swiftly.
0
20
40
60
80
100
120
OWNER CEO
OWNER
CEO
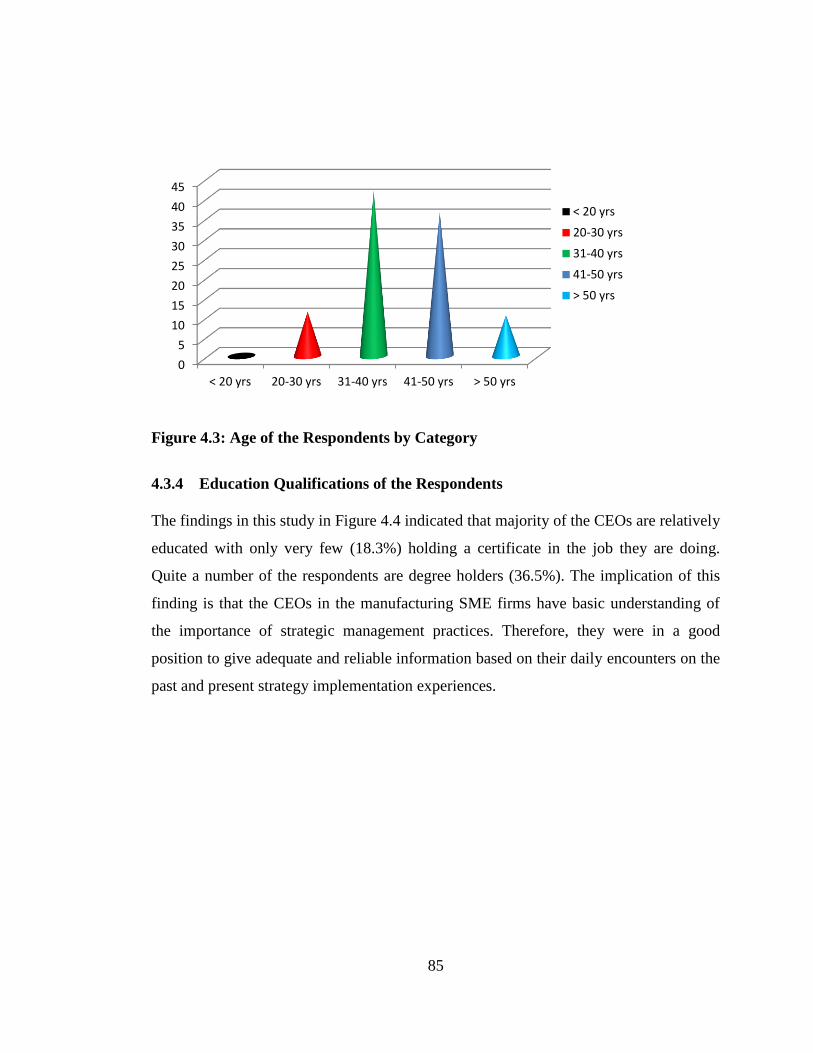
85
Figure 4.3: Age of the Respondents by Category
4.3.4 Education Qualifications of the Respondents
The findings in this study in Figure 4.4 indicated that majority of the CEOs are relatively
educated with only very few (18.3%) holding a certificate in the job they are doing.
Quite a number of the respondents are degree holders (36.5%). The implication of this
finding is that the CEOs in the manufacturing SME firms have basic understanding of
the importance of strategic management practices. Therefore, they were in a good
position to give adequate and reliable information based on their daily encounters on the
past and present strategy implementation experiences.
0
5
10
15
20
25
30
35
40
45
< 20 yrs 20-30 yrs 31-40 yrs 41-50 yrs > 50 yrs
< 20 yrs
20-30 yrs
31-40 yrs
41-50 yrs
> 50 yrs

86
Figure 4.4: Education of the Respondents
4.3.5 Gender, Education and Current Position: Cross-tabulation
Information based on important demographic characteristics of the respondents were
cross-tabulated and the results are presented in Table 4.1. The results in this table are a
cross-tabulation of the position held in the SME firm against one’s gender and the
highest level of education attained. The findings indicate that among the females who
are real owners of the manufacturing SME firm, 60% had attained diploma level of
education while the rest 40% had attained at least a bachelor degree. On the other hand,
33.3% of males owners of the SME firm had attained certificate level of education,
55.6% are diploma holders and the rest 11.1% had attained university education. The
observation here is that majority of the degree holders in the SMEs are women.
Secondly, the findings also indicate that respondents who had a CEO tag under their
names, among the females, 6.9% are certificate holders, 37.9% are diploma holders,
13.8% holds a higher National diploma, 37.8% are bachelor degree holders while the
rest 3.4% have a post graduate experience. Among the male CEOs, 22.5% are certificate
holders, 26.8% are diploma holders, 12.7% have a higher National diploma, and 33.8%
0
5
10
15
20
25
30
35
PostGraduate
BachelorDegree
HigherDiploma
Diploma Certificate
Post Graduate
Bachelor Degree
Higher Diploma
Diploma
Certificate

87
are bachelor degree holders while the rest 4.2% have a post graduate qualification. The
general observation here is that the CEOs who are respondents in this study were more
educated than the real owners of the manufacturing SME firms in Kenya.
Table 4.1: Gender, Education and Current Position: Cross-tabulations
Position Highest education qualification Total
Certificate Diploma Higher
diploma
Bachelor's
degree
Post
graduate
Owner
Gender
Female Count 0 3 2 5
% within Gender 0.0% 60.0% 40.0% 100.0%
Male Count 3 5 1 9
% within Gender 33.3% 55.6% 11.1% 100.0%
Total Count 3 8 3 14
% within Gender 21.4% 57.1% 21.4% 100.0%
CEO
Gender
Female Count 2 11 4 11 1 29
% within Gender 6.9% 37.9% 13.8% 37.9% 3.4% 100.0%
Male Count 16 19 9 24 3 71
% within Gender 22.5% 26.8% 12.7% 33.8% 4.2% 100.0%
Total Count 18 30 13 35 4 100
% within Gender 18.0% 30.0% 13.0% 35.0% 4.0% 100.0%
Total
Gender
Female Count 2 14 4 13 1 34
% within Gender 5.9% 41.2% 11.8% 38.2% 2.9% 100.0%
Male Count 19 24 9 25 3 80
% within Gender 23.8% 30.0% 11.3% 31.3% 3.8% 100.0%
Total Count 21 38 13 38 4 114
% within Gender 18.4% 33.3% 11.4% 33.3% 3.5% 100.0%
4.3.6 Age, Education and Current Position: Cross-tabulation
The study findings in Table 4.2 is a cross-tabulation of age of the respondents against
position held in the firm and the highest level of education attained. The results show
that among the female owners aged between 26-30 years, 66.7% holds a diploma and the
rest 33.3% are degree holders. For those aged between 31-35 years, 25% are certificate
holders, 50% are diploma holders while the rest 25% are degree holders. The owners
aged between 36-40 years, 50% are diploma holders while the rest 50% are degree
holders. Between 41-45 years, 50% are certificate holders while the rest 50% are
88
diploma holders and finally the owners who are over 50 years all of them are diploma
holders.
Among the CEOs category, those aged 21-25 years all of them are bachelor degree
holders. Those aged 26-30 years 33.3% are diploma holders, 11.1% are holders of higher
diploma and the rest 55.6% are bachelor degree holders. Among the CEOs aged between
31-35 years category, 23.3% are certificate holders, 41.2% are diploma holders, 23.5%
hold a higher diploma, 5.9% are bachelor degree holders while the rest 5.9% are post
graduate degree holders. The CEOs in the age category between 36-40 years, 16% are
certificate holders, 24% are diploma holders, 12% are higher diploma holders, 44% are
bachelor degree holders while the rest 4% are postgraduate degree holders. Among the
CEOs in between 41-45 years of age, 11.1% are certificate holders, 33.3% are diploma
holders, 33.3% are bachelor degree holder and 22.2% hold post graduate qualifications.
CEOs in between 46-50 years, 14.3% are certificate holders, 28.6% are diploma holders,
17.9% holds a higher diploma while the rest 39.3% are degree holders and lastly among
the CEOs, who are over 50 years, 45.5% are certificate holders, 27.3% are diploma
holders while the rest 27.3% are bachelor degree holders.
The general observation from these results is that the young CEOs are entering the job
market with a university education while the older CEOs have more postgraduate
qualifications than the young ones. This can be attributed by the fact that post graduate
qualifications take time to acquire. All in all, it can be deduced from this study that all
the CEOs in various age categories are well educated.

89
Table 4.2: Age, Education and Current Position: Cross-tabulation
Position Highest education qualification Total
Cert Dip H dip degree Post
Owner
Age
26-30 Count 0 2 1 3
% within Age 0.0% 66.7% 33.3% 100.0%
31-35 Count 1 2 1 4
% within Age 25.0% 50.0% 25.0% 100.0%
36-40 Count 0 1 1 2
% within Age 0.0% 50.0% 50.0% 100.0%
41-45 Count 2 2 0 4
% within Age 50.0% 50.0% 0.0% 100.0%
Over
50
Count 0 1 0 1
% within Age 0.0% 100.0% 0.0% 100.0%
Total Count 3 8 3 14
% within Age 21.4% 57.1% 21.4% 100.0%
CEO
Age
21-25 Count 0 0 0 1 0 1
% within Age 0.0% 0.0% 0.0% 100.0% 0.0% 100.0%
26-30 Count 0 3 1 5 0 9
% within Age 0.0% 33.3% 11.1% 55.6% 0.0% 100.0%
31-35 Count 4 7 4 1 1 17
% within Age 23.5% 41.2% 23.5% 5.9% 5.9% 100.0%
36-40 Count 4 6 3 11 1 25
% within Age 16.0% 24.0% 12.0% 44.0% 4.0% 100.0%
41-45 Count 1 3 0 3 2 9
% within Age 11.1% 33.3% 0.0% 33.3% 22.2% 100.0%
46-50 Count 4 8 5 11 0 28
% within Age 14.3% 28.6% 17.9% 39.3% 0.0% 100.0%
Over
50
Count 5 3 0 3 0 11
% within Age 45.5% 27.3% 0.0% 27.3% 0.0% 100.0%
Total Count 18 30 13 35 4 100
% within Age 18.0% 30.0% 13.0% 35.0% 4.0% 100.0%

90
4.4 Demographic Characteristics of the SME Firm
The study sought to establish the location of the firm, its core business, age, size,
availability of a documented strategic plan and recent strategies implemented.
4.4.1 Location of the Firm
This study found out that majority of the manufacturing SME firms was located along
Kenyatta Avenue in Thika (35.7%). Those located off Garissa Road accounted for
23.8% while those located in town centre were 13.8%. The manufacturing SME firms
located in the Light industrial area accounted for 7.3% of the firms. Makongeni area in
Thika Sub-County accounted for 5.5% of manufacturing SME firms. Those located in
Thika East were 4.6%, Munene area had 3.7% of SME firms selected while Jamhuri and
Witeithie area each had 2.8% of the manufacturing SME firms selected to participate in
this study. The results base on location of the firm are presented in Figure 4.5
Figure 4.5: Location of the SME firm
4.4.2 Core Business of the SME firm
The study findings presented in Figure 4.6 show the core business of the manufacturing
SME firm. Results show that 53% of the firms are engaged in manufacturing and
0 10 20 30 40 50
Thika Town
Thika East
Light Industries
Off Garissa Rd
Kenyatta Highway
Munene Area
Makongeni
Witeithie
Jamhuri Market Thika Town
Thika East
Light Industries
Off Garissa Rd
Kenyatta Highway
Munene Area
Makongeni
Witeithie
Jamhuri Market

91
processing category. Furniture making business accounts for 11% of the SME firms
selected while 10% are in baking business. Firms engaged in metal works are 6%.
Electricity generation and distribution comprised of 5% of all firms while 4% of the
SME firms selected are in milling business. 3% of the firms were in welding &
fabrications, engineering & construction respectively and textile business respectively.
Lastly, motor vehicle repair and electronics accounted for 1% each.
Figure 4.6: Core Business of the manufacturing SME
4.4.3 Age and Size of the Firm: Cross-tabulation
This study used categories to classify firms in terms of age and size. Those firms in the
age category of between 1-5 years were considered young while those above 5 years
were considered old. The firms employing between 10 and 50 employees were
considered small while those employing 51-99 employees were considered medium.
This study found out that 79.5% of all manufacturing SMEs are young while the rest
20.5 are old. In the cross-tabulated results in Table 4.3, the young firms that are small
sized accounted for 89.7% while the rest of the young firms are medium sized (10.3%).
On the other hand, old firms which have remained small accounted for 75.9% and the
rest of old firms are medium sized (24.1%). The general observation here is that there
Manufacturing & Processing
53%
Welding3%
Engineering3%
Electricity Gen5%
Milling4%
Metal works6%
Baking10%
Electronics1%
Textile3%
Furniture11%
Motor Vehicle1%

92
are quite a number of small firms compared to medium sized firms. Secondly, a good
number of old firms have remained small for reasons beyond the scope of this study.
Table 4.3: Age and Size of Manufacturing SME: Cross-tabulation
Size of the Firm Total
Small Medium
Age of the Firm
Young
Count 26 3 29
% within Duration the organization
has been operating in years 89.7% 10.3% 100.0%
Old
Count 63 20 83
% within Duration the organization
has been operating in years 75.9% 24.1% 100.0%
Total
Count 89 23 112
% within Duration the organization
has been operating in years 79.5% 20.5% 100.0%
4.5 Common Strategies Pursued by SMEs
Most of the firms had a documented strategic plan (80.4%) while 19.6% of the firms had
not documented their strategic plans as shown in Figure 4.7
Figure 4.7: Availability of a Strategic Plan in SME firms
Figure 4.7 and 4.8 indicate that majority of manufacturing firms are practicing strategic
management practices. This implies that the perceptions given by the CEOs were based
0
50
100
With Formal Plan No Formal Plan
With Formal Plan
No Formal Plan

93
on experience and therefore they are reliable. Secondly, on the types of strategies the
firm was pursued, majority of them had implemented market expansion strategy which
ranked first (25%) followed by cost reduction (23%), followed by new product
development (18%), product modification ranked 4th (17%) fifth was diversification
strategy (7%), growth strategy ranked 6th position (6%), while lastly, 4% of the firms
had implemented stability strategy.
Figure 4.8: Common Strategies Pursued by the SME firm
4.5 Descriptive Statistics of the SME firm
4.5.1 Descriptive Statistics on the SME’s Performance
The performance of the small and medium manufacturing firms in Kenya was the
dependent variable upon which this study intended to investigate. Due to unavailable
records, sensitivity and/or confidentiality concerns, this study was unable to obtain the
actual performance figures and relied on those items that intended to capture
performance based on the perceptions of the owners, CEOs/lead managers of SMEs over
a period of five years as shown in Table 4.4.
Market Expansion
25%
Cost Reduction
23%
New Product Development
18%
Product Modification
17%
Diversification7%
Growth Strategy
6%
Stability Strategy
4%
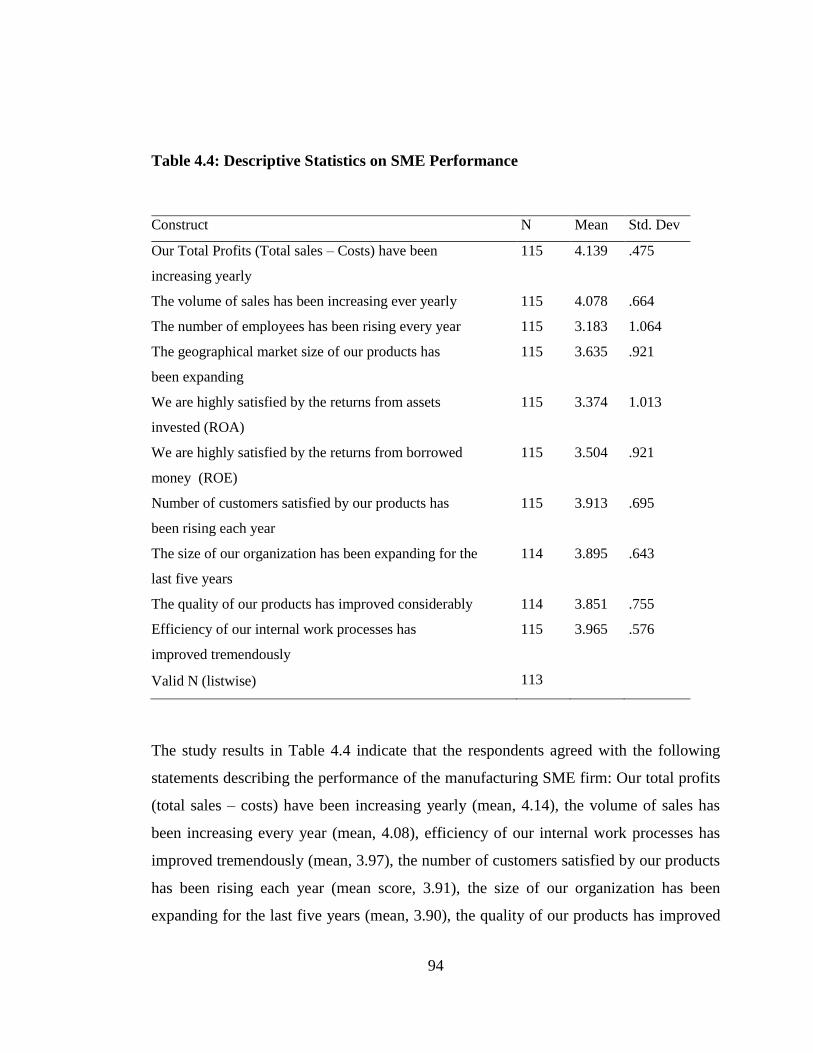
94
Table 4.4: Descriptive Statistics on SME Performance
Construct N Mean Std. Dev
Our Total Profits (Total sales – Costs) have been
increasing yearly
115 4.139 .475
The volume of sales has been increasing ever yearly 115 4.078 .664
The number of employees has been rising every year 115 3.183 1.064
The geographical market size of our products has
been expanding
115 3.635 .921
We are highly satisfied by the returns from assets
invested (ROA)
115 3.374 1.013
We are highly satisfied by the returns from borrowed
money (ROE)
115 3.504 .921
Number of customers satisfied by our products has
been rising each year
115 3.913 .695
The size of our organization has been expanding for the
last five years
114 3.895 .643
The quality of our products has improved considerably 114 3.851 .755
Efficiency of our internal work processes has
improved tremendously
115 3.965 .576
Valid N (listwise) 113
The study results in Table 4.4 indicate that the respondents agreed with the following
statements describing the performance of the manufacturing SME firm: Our total profits
(total sales – costs) have been increasing yearly (mean, 4.14), the volume of sales has
been increasing every year (mean, 4.08), efficiency of our internal work processes has
improved tremendously (mean, 3.97), the number of customers satisfied by our products
has been rising each year (mean score, 3.91), the size of our organization has been
expanding for the last five years (mean, 3.90), the quality of our products has improved

95
considerably (mean, 3.85), the geographical market size of our products has been
expanding (mean, 3.64), we are highly satisfied by the (ROE) returns from borrowed
money (mean, 3.50). On the other hand, the respondents disagreed with the following
statements on manufacturing small and medium firm’s performance; we are highly
satisfied by the returns from assets (ROA) invested (mean, 3.37) and that the number of
employees has been rising every year (mean, 3.18).
4.5.1 Descriptive Statistics on Attention to Leadership Styles
A superior and strong leadership skill is an important dynamic capability required to
drive superior performance in organizations operating in a dynamic environment that
characterizes organizations today (Teece, 2014). This study adopted the Multi-factor
Leadership Questionnaire short form 6-S (MLQ – 6S, Bass & Avolio, 1992) to measure
the three dominant leadership styles commonly practiced in organizations today namely
the transformational leadership, transactional leadership and passive/avoidant leadership
behaviour. The tool consisted of 21 items which are marked from 1-5 rating scale where
1 = not at all, 2 = once in a while, 3 = sometimes, 4 = fairly often, 5 = frequently if not
always.
The factors of MLQ 6-S are grouped according to Avolio and Bass’s (2004) definitions.
The transformational leadership style includes: Factor 1. Idealized influence (item 1, 8 &
15), Factor 2. Inspirational motivation (items 2, 9 & 16), Factor 3. Intellectual
stimulation (item 3, 10 & 17), Factor 4. Individualized consideration (item 4, 11 & 18).
Transactional leadership style include: Factor 5. Contingent reward (item 5, 12 & 19)
and Passive/Avoidant leadership behaviour include: Factor 6. Management-by-
Exception Passive (item 6, 13 & 20) and Factor 7. Laissez-faire (items 7, 14 & 21).
According to Avolio and Bass (2004), the MLQ 6-S short form is scored as follows:
Summing three scores of specified factor 1, 2, 3 & 4 gives the total score of
transformational leadership. The total score of transformational leadership is divided by

96
four to give the composite mean score of transformational leadership style. Total score
of factor 5 gives the total score of transactional leadership. The total score of
transactional leadership divided by one gives the composite mean score of transactional
leadership style. Summing scores of factor 6 and 7 gives the total score of
passive/avoidant leadership behaviour while total score of passive/avoidant behaviour is
divided by two to give the composite mean score of passive/avoidant behaviour. The
descriptive statistics on leadership styles are presented by mean scores and standard
deviations as indicated in Appendix iii.
According to Avolio and Bass’s (2004) definitions of transformational, transactional and
passive/avoidant leadership styles as shown in Appendix iii and Figure 4.9, it is evident
that majority of the respondents in manufacturing SME firms in Kenya practiced
transactional leadership style (composite mean score, 3.54), followed by
transformational leadership style (composite mean score, 3.42) and lastly passive /
avoidant leadership behaviour (composite mean score, 3.12).
Figure 4.9: Common Leadership Styles Practiced in SME Firms in Kenya
2.8 3 3.2 3.4 3.6
Trasformational
Transactional
Passive/Avoidant
Trasformational
Transactional
Passive/Avoidant

97
The respondents agreed with the following MLQ 6-S statements according to Avolio
and Bass (2004): I am satisfied when employees meet the required targets (mean, 4.88),
I give employees feedback to let them know how they are doing (mean, 4.18), I let
employees to know what they are entitled to after achieving their targets (mean score,
4.05), I do not ask anything more from others than what is absolutely necessary (mean
score, 3.94), I tell others in a few simple words what need to be done (mean score, 3.84),
I help the employees to find meaning in their work (mean score, 3.82), I remind
employees the standards they need to maintain (mean score, 3.65), other people are
proud to be associated with me (mean score, 3.57), I help others to think about old
problems in new ways (mean score, 3.40), I help other employees to develop themselves
(mean score, 3.40).
However, the respondents disagreed with the following MLQ 6- S statements according
to Avolio and Bass (2004): I reward employees when they achieve their targets (mean
score, 3.33), I provide employees with new ways of looking at complex or difficult
issues (mean score, 3.33), other people have complete faith in me (mean score, 3.29), I
give personal attention to others when they are in need (mean score, 3.25), I tell
employees what to do if they want to be rewarded for their work (mean score, 3.24), I
help employees to rethink about issues that they had never thought of or questioned
before (mean score, 3.13), I use tools, images, stories and models to help other people
understand (mean score. 3.04), I make employees feel good to be around me (mean
score, 2.84), As long as things are working, I do not try to change anything (mean score,
2.29), I am contented to let others to continue working in the same ways always (mean
score, 2.15) and finally the respondents strongly disagreed with the statement that
employees are given freedom to do whatever they want to do (mean score, 1.03).
4.5.2 Descriptive Statistics on Structural Adaptations
Performance of a firm is largely affected by how well a firm’s business strategy is
matched to its organizational structure and behavioral norms of its employees. Business

98
firms are structured along three different dimensions that affect strategy implementation
namely formalization, centralization and specialization (Oslon et al., 2005). The tool
developed in this study to measure structural adaptations consists of 15 items out of
which 9 items measured formalization (item 1, 2, 3, 5, 7, 9, 12, 13 & 15), 3 items
measured centralization ( item 4, 6 & 8) and 3 items measured specialization (item 10,
11 & 14). The study wanted to find out whether firm’s structural adaptations positively
influences the performance of manufacturing SME firms in Kenya (Appendix iv).
Results in Appendix iv and Figure 4.10 show the mean scores based on the structural
adaptations of the manufacturing SME firms during the strategy implementation. The
results indicated that structures adopted by these firms are highly Specialized (composite
mean score, 3.68), Formalized (composite mean score, 3.67) and Centralized
(Composite mean score, 3.54).
Figure 4.10: Structures Adopted by the Manufacturing SMEs in Kenya
3.45 3.5 3.55 3.6 3.65 3.7
Formalization
Centralization
Specialization
Formalization
Centralization
Specialization

99
The results in Table 4.6 also indicated that all the respondents agreed with the following
statements: that the organization revises and creates appropriate structures to match the
changes in strategy requirements (mean score, 4.17), the organization has a well-
designed reporting authority and employees know to whom they report to (mean score,
4.12), the organization is governed by a clear system of with rules, regulations, policies
and procedures (mean score, 4.09), there is a central command center that oversees
strategy implementation (mean score, 4.08), strategic work activities are well
coordinated across sections, departments and divisions (mean score, 4.06), the
organization encourages division of work and specialization (mean score, 4.03).
The respondents agreed that there is adequate level of supervision in every section,
department or divisions (mean score, 4.01), the organization have a centralized decision
structure that allows quick decisions to be made (mean score, 3.92), jobs are well
structured with no overlaps, conflicts or ambiguity (mean score, 3.89), the organization’s
structure allows quick decisions and feedback (mean score, 3.88), the organization
makes sure that employees work have adequate knowledge, experience and skills (3.84),
the organization encourages employees to refer to the past experience when
implementing a new strategy (mean score, 3.77), structures in the organization are
flexible enough to allow changes to be effected quickly and timely (mean score, 3.70),
the organization’s management encourages team work (mean score, 3.50). On the other
hand, the respondents disagreed that the organization gives adequate information before
a new strategy is implemented (mean score, 3.34)

100
Figure 4.11: Level of Formalization in the Manufacturing SME Firm
The study results in Figure 4.11 shows what the respondents felt about the level of
formalization in their organizations. Seventy six percent (76%) of the respondents felt
that their organizations are highly formalized while 24% felt that their organizations are
moderately formalized. The level of formalization is one of the dimensions of an
organizational structure according to Oslon et al. (2005).
4.5.3 Descriptive Statistics on Attention to Human Resources
People in organizations are required in every stage of the strategic management process
from strategy formulation, implementation to strategy evaluation and control.
Organizations cannot perform well without quality and resourceful people. The
Resource Based View of the firm’s (Barney, 2001) supports this view by recognizing
that human resources provides the firm with an important asset that, when well used, can
lead to superior performance and or a competitive advantage. This study aimed at
establishing whether attention to human resources requirements during strategy
implementation process leads to superior performance of manufacturing SME firm in
Kenya. The descriptive statistics are presented in Appendix v.
The results in Appendix v indicates that all the respondents agreed with the following
statements based on the attention to human resources during strategy implementation:
0%
76%
24%
Moderate High

101
Jobs and responsibilities are well understood by most of the employees (mean score,
4.04), jobs are well designed and employees are aware of what they are supposed to do
(mean score, 3.98), most of the employees are highly committed to do their work well
(mean score, 3.97), promotions are always done on merit (mean score, 3.89), rewards
and incentives are based on merit (mean score, 3.87), the organization always hire
people with adequate skills and experience (mean score, 3.74), the organization have an
unbiased system of recruitment and placement of staff (mean score, 3.72),
The respondents also agreed that the organization have a well-designed system of
rewards, remuneration and promotions of staff (mean score, 3.69), organization’s clients
are well served all the times (mean score, 3.54), the organization encourages employees
to showcase their creativity and competencies among their peers (mean score, 3.53),
performance evaluations and appraisals are done on a timely basis (mean score, 3.50),
employees are regularly trained (mean score, 3.44), the organization frequently gives
incentives to motivate employees (mean score, 3.44). However, the respondents
disagreed with the following statements: employees individual needs are well taken care
of (mean score, 3.20) and there is no shortage of staff (mean score, 3.16).
4.5.4 Descriptive Statistics on attention to the SMEs Technology
Technology is a dynamic capability that is embedded in firm’s practices and is essential
in determining the competitiveness and performance of a firm in a dynamic and
turbulent environment (Zollo & Winter, 2002). Firms with strong dynamic capabilities
(Teece, 2014) exhibit technological, create new technologies, differentiate and maintain
superior processes and modify their structures and business to stay ahead of the
competition. This study aimed at establishing whether the level of technology adopted
by the SME manufacturing firm affects it strategy implementation performance. The
descriptive statistics are presented in Appendix vi.

102
Study findings in Appendix vi shows that the respondents agreed with the following
statements regarding the level of technology in strategy implementation process: That
the level of technology in place has greatly assisted the organization to implement
strategies (mean score, 4.02), adequate tools, machines and equipments enable
employees to their jobs better and faster (mean score, 3.98), the organization uses the
current technology in the market to produce good/services (3.78), the organization is
keen to ensure that technology required is availed (mean score, 3.70), employees are
encouraged to make suggestions of the type and kind of technology required (mean
score, 3.65), all departments are well equipped with appropriate technology (mean score,
3.55), the SME organization is quick to respond to the changes in technology (mean
score, 3.51), the level of technology is higher than that of our immediate competitors
(mean score, 3.46).
The respondents however disagreed with the following statements: the organization
have efficient Information Communication Technology (mean score, 3.35), the
organization updates and improves our ICT systems to ensure they are efficient (mean
score, 3.26), the organization conduct researches in order to develop her products (mean
score, 2.90), the organization have a technology audit committee that reviews the
technology (mean score, 2.88) and the organization has a budget for research and
development (mean score, 2.80).
Figure 4.12: SME Firm’s Ability to Adapt to Technological Changes
2%
34%
52%
12% 0%
Low Moderate High Highest

103
The study findings in Figure 4.12 show what the respondents felt about their firm’s
ability to adapt to the technological changes in relation to dynamics in the environment.
Majority of the firms (52%) responds highly to the changes in technology as a result of
changes in the market while 34% of the firms moderately respond to these changes.
Two percent (2%) of the firms have a low response while only 12% of all the
manufacturing SME firms in Kenya are able to respond very fast to the technological
changes in the market.
4.5.5 Descriptive Statistics on Emphasis on Firm’s Strategic Direction
Before a strategy is implemented, it has to be formulated first. A lot of information and
participation of stakeholders is required during the strategic formulation stage. The
organizational leadership need to work hard to create the awareness among all
employees and other stakeholders of the direction the organization is headed to and the
benefits the new strategy will accrue to the organization. These efforts are meant to
create a shared vision among all participants of the intentions of the organizations which
are beneficial during the strategy implementation. The study sought to investigate
whether emphasis on strategic direction contributes positively to the performance of an
SME firm. The descriptive statistics on the emphasis on strategic direction are presented
in Appendix vii.
The study results in Appendix vii indicate that the respondents agreed with the following
statements concerning the strategic direction of the SME firm: that the organization has
a clear vision and mission statements to all employees (mean score, 4.23), the mission
statement is in line with what is intended to be achieved in future (mean score, 4.19), the
mission is well aligned to the work activities in the entire organization (mean score,
4.04), deliberate efforts are made to align the vision and mission statements to the
changes in the environment (mean score, 3.97), most of the employees work hard in
trying to meet the goals and objectives (mean score, 3.90), performance targets are

104
frequently reviewed to ensure that they are in line with the organization's goals and
objectives (mean score, 3.85).
The respondents also agreed that the employees understand well how their work
contributes to the achievement of the organization’s vision and mission (mean score,
3.79), employees are frequently reminded about the direction the organization is headed
to (mean score, 3.72), the organization regularly revise her goals and objectives to
ensure they are in line with the market changes (mean score, 3.60), meetings are
occasionally arranged to discuss successes, failures and challenges arising (mean score,
3.53), the respondents however disagreed with the statements that most of the employees
are aware of the plans which need to be implemented (mean score, 3.35) and that
employees are involved in developing firm’s strategies (mean score, 3.28)

105
4.6 Bivariate Correlations
Table 4.5: Bivariate Correlation Results: All Variables
Table 4.5 shows the bivariate linear correlations among the key strategy implementation
variables in this study and performance of a manufacturing SME firms in Kenya. The
Y X1 X2 X3 X4 X5
Performance
(Y)
Pearson Correlation 1
Sig. (2-tailed)
N 115
Leadership
Styles
(X1)
Pearson Correlation .259** 1
Sig. (2-tailed) .005
N 114 114
Structural
Adaptations
(X2)
Pearson Correlation .442** .386** 1
Sig. (2-tailed) .000 .000
N 115 114 115
Human
Resources
(X3)
Pearson Correlation .408** .337** .526** 1
Sig. (2-tailed) .000 .000 .000
N 115 114 115 115
Technology
(X4)
Pearson Correlation .482** .337** .468** .525** 1
Sig. (2-tailed) .000 .000 .000 .000
N 115 114 115 115 115
Strategic
Direction
(X5)
Pearson Correlation .137 .527** .225* .447** .358** 1
Sig. (2-tailed) .143 .000 .016 .000 .000
N 115 114 115 115 115 115
**. Correlation is significant at the 0.01 level (2-tailed).
*. Correlation is significant at the 0.05 level (2-tailed).

106
study revealed that leadership styles (X1) has a positive and significant influence on the
performance of the manufacturing SME firm (r =.259**, P = .005). A leadership style
has been identified by the literature as one of the key drivers under strategy
implementation that influences organization performance. This means that as the
leadership styles improve during the strategy implementation process, there is a
significant positive change in the firm’s performance. The study findings also revealed
that there is a positive and significant influence of structural adaptations on the
performance of the manufacturing SME firm (r = .442**, P < .001).
Structure is one of the dynamic capabilities that influence firm performance in a
dynamic environment. This means that, as the SME’s leadership adopts dynamic
structures that fit and support the firms’ strategy implementation efforts, the
performance significantly improves. The bivariate correlations also revealed that there is
a positive and significant influence of human resources on performance of the
manufacturing SME firm during strategy implementation (r = .408**, P < .001). The
literature identified human resources as one of the key driver that influences firm’s
performance positively. The findings of this study support this observation.
The study findings indicate that technology and performance of the SME firm relates
positively and significantly during strategy implementation (r =.482**, P < .001). This
study intended to test whether technology is one of the key variables influencing
performance of manufacturing SME firm during strategy implementation.
The findings indicated that compared to the other four key variables (leadership styles,
structural adaptations, human resource and strategic direction), technology has the
strongest and significant influence on the manufacturing SME’s performance in Kenya.
Lastly, the study found an insignificant influence of the firm’s strategic direction (X5) on
manufacturing SME performance in Kenya (r = .137, P = .143).

107
4.7 Inferential Statistical Analysis
The first model under investigation in this study intended to establish the influence of
strategy implementation drivers on the performance of the manufacturing small and
medium manufacturing firms in Kenya. This model expressed as;
Y = β0 + β1X1 + β2X2 + β3X3 + β4X4 + β5X5 + ε
Where: Y= SME’s performance, β0 = Intercept, β1, β2, β3, β4, β5 = slope coefficients
representing the relationship of the associated independent variable with the dependent
variable, X1 = Attention to leadership styles, X2 = Structural Adaptations, X3 = Attention
to human resources, X4 = Level of Technology. X5 = Awareness of the Strategic
Direction and ε = error term, was the basis under which the first 5 objectives outlined in
chapter one were set. Each of these objectives and the hypotheses were tested and
analyzed to find out whether they conformed to what the study had proposed to achieve.
4.7.1 (a) Test for Normality: All Variables
Many data analysis methods depend on the assumption that data were sampled from a
Gaussian distribution (Athanasiou, Debas & Darzi, 2010). The best way to evaluate how
far data are from Gaussian is to look at a graph and see if the distribution deviates
grossly from a bell-shaped normal distribution. The testing of normality all variables in
this study was done by using the Shapiro-Wilk test since it is considered more reliable
than Kolmogorov-Smirnov test. Such that given H0 and H1, set α = 0.05, the rule is that
reject H0 if P- value is less than α else fail to reject H0 : where
H0: The data is normally distributed
H1: The data is not normally distributed.

108
Table 4.6: Tests for Normality
Table 4.6 gives the tests results for all variables. Using Shapiro-Wilk tests of normality
which this study considers more reliable, Four out of six variables had P-values greater
than 0.05. that is, attention to structural adaptations (X2), Attention to human resource
(X3), attention to technology (X4) and strategic direction (X5). This study, therefore,
failed to reject their corresponding null hypotheses (H02, H03, H04, and H05) respectively
and concludes that the data sets for these four variables are normally distributed. On the
other hand the Shapiro-Wilk tests indicated that the P-vales for leadership styles (X1)
and SME performance (Y) were less than 0.05. This study further interrogated these
two variables further by looking at their normal Q-Q plots.
Kolmogorov-Smirnova Shapiro-Wilk
Statistic df Sig. Statistic df Sig.
Leadership Styles .123 114 .000 .960 114 .002
Structural
Adaptations .085 114 .040 .990 114 .535
Human Resource .073 114 .188 .990 114 .588
Technology .091 114 .021 .980 114 .091
Strategic Direction .079 114 .077 .987 114 .348
Performance .105 114 .003 .969 114 .010
a. Lilliefors Significance Correction

109
a) Q-Q Plot for Manufacturing SME performance
Figure 4.13: Q-Q Plot for SME performance
Although the manufacturing SME performance returned a P-value less than 0.05 in the
Shapiro-Wilk test for normality, the Q-Q plot shows that apart from some few cases the
data collected fits along the line of best fit. From the observations made in the Q-Q plot
for SME performance, it true to say that, even when this study results indicate that the
null hypothesis (H06) need to be rejected, the data on the perceived performance of the
manufacturing SME firm does not so much deviate from the normal distribution. This
study proceeded for further analysis with the treatment that the data on SME firm as can
be seen from Figure 4.13 and Figure 4.14 closely approximates a normal distribution.

110
Figure 4.14: Histogram on SME performance data distribution
b) Q-Q Plot for Leadership Styles
Figure 4.15: Q-Q Plot for Leadership Styles
The study results in Figure 4.15 show the Q-Q plot attention to leadership styles (X1).
The Sharpiro-Wilk test indicates that the P-value is less than 0.05. The observation from
the Q-Q plot indicates that the data does not deviate too much from the line of best fit.
Although Shirpiro-Wilk results indicate that H01 should be rejected in favour of H1 and
conclude that the data is not normally distributed, the Q-Q plot shows that this data does
not so much deviate from the normal distribution. This study proceeded for further

111
analysis on this variable (X1) based on the fact that the data on leadership styles as can
be seen in Figure 4.15 and Figure 4.16 fairly approximates the normal distribution.
Figure 4.16: Histogram on Leadership Styles data distribution
4.7.1 Influence of Leadership Styles on the SME Performance
Objective 1: To determine whether attention to leadership styles influences the
performance of manufacturing SME firms in Kenya
The bivariate correlations in Table 4.5 indicated that there is a positive and significant
influence of leadership styles on the performance of the manufacturing small and
medium enterprise firms in Kenya (r =.259** , P = .005). This implies that the
performance of the manufacturing SME firms improves significantly when the CEOs
and the owners adopt better leadership styles.
These findings were subjected to further analysis where a univariate linear regression
model Y = β0 + β1X1 + ε was used to determine the influence of leadership styles on the
performance of the manufacturing SME firm. Results in Table 4.7 shows that the model
is valid (F (1, 112) = 8.062, P = .005) hence the explanatory variable (X1, Leadership
Styles) is good in explaining total variations in performance of the SME.

112
Table 4.7: Leadership Styles Model Validity
Model Sum of Squares df Mean Square F Sig.
Regression 1.745 1 1.745 8.062 .005b
Residual 24.245 112 .216
Total 25.990 113
a. Dependent Variable: Performance
b. Predictors: (Constant), Leadership Styles (X1)
The study further revealed that leadership styles (X1) explains 6.7% of the total
variations in the manufacturing SME firm’s performance (R2 =.067). The coefficients in
the regression model as shown in Table 4.8 indicate that leadership styles will always
exist at a certain minimum (β0 = 3.754, P < .001). The attention to leadership styles
during strategy implementation in the manufacturing SME firm positively and
significantly influences the performance of the SME firm (β1 = .284, P = .005). This
confirms the findings of the bivariate correlations in Table 10 which indicated that when
the leadership styles improve, the performance of SME firm will also improve.
Table 4.8: Leadership Styles and SME Performance: Coefficients
Model Unstandardized
Coefficients
Standardized
Coefficients
R2 t Sig.
B Std. Error Beta
Constant 3.754 .044 85.988 .000
Leadership .284 .100 .259 .067 2.839 .005
a. Dependent Variable: Performance
The univariate model in Table 4.8 was significant (P = 0.005) and therefore, supports
objective 1 that attention to leadership styles practiced during strategy implementation

113
influences positively the performance of small and medium manufacturing firms in
Kenya.
i) Test of Hypothesis One:
H01. Attention to leadership styles has no significant influence on the performance of
manufacturing SME firms in Kenya
This hypothesis intended to test whether there is any influence between the attention to
leadership styles and performance of the manufacturing SME firm. The hypothesis H01:
β1 = 0 versus H1: β1 ≠ 0 was tested. Results from the bivariate correlation in Table 4.5
shows a significant and positive relationship between leadership styles and
manufacturing SME’s performance (r =.259**, P = .005). On the other hand, the
univariate regression results in Table 4.8 also show that there is a positive and
significant influence between leadership styles and the SME firm’s performance
(β1=.284, P = .005). This leads to the rejection of the null hypothesis (H01) and the
acceptance of alternative hypothesis (H1). The study, therefore, concludes that attention
to leadership styles has a significant positive relationship influence on the performance
of the manufacturing SME firm in Kenya
The leadership style variable (X1) was further broken down into specific leadership
styles identified by Bass and Avolio (1992). The univariate model Y = β0 + β1X1 + ε was
therefore modified to include the effects of these specific leadership styles giving rise to
a new model Y = β0 + β1X11 +β2X12 + β3X13 + ε Where: Y= Manufacturing SME’s
performance, β0 = Intercept, β1,β2,β3= slope coefficients representing the relationship
between the independent variable and the dependent variable, X11 = Transformational
leadership style, X12= Transactional leadership style, X13 = Passive/Avoidant leadership
style and ε = error term. A bivariate correlation was then obtained for these specific
leadership styles following the classifications given by Avolio and Bass (2004).

114
The bivariate correlation in Table 4.9 indicates that the transformational leadership style
has a significant and positive influence on the performance of manufacturing SME firm
(r =.297**, P =.001), the transactional and the passive/avoidant leadership styles both
have insignificant relationships with the manufacturing SME firm firm’s performance (r
=.180, P =.054), (r =.169, P =.071) respectively. Therefore, the two styles influences
very little on the overall performance of the SME manufacturing firm in Kenya.
Table 4.9: Specific Leadership Styles Bivariate Correlations Coefficients
Y X11 X12 X13
Performance (Y)
Pearson Correlation 1
Sig. (2-tailed)
N 115
Transformational (X11)
Pearson Correlation .297** 1
Sig. (2-tailed) .001
N 115 115
Transactional (X12)
Pearson Correlation .180 .395** 1
Sig. (2-tailed) .054 .000
N 115 115 115
Passive/Avoidant (X13)
Pearson Correlation .169 .494** .480** 1
Sig. (2-tailed) .071 .000 .000
N 115 115 115 115
**. Correlation is significant at the 0.01 level (2-tailed).
The three specific leadership styles were further subjected to a multiple regression to test
their combined effect on the SME’s firm’s performance. The model containing the three
leadership styles in Table 4.10 was found to be valid (F (3, 111) = 3.788, P =.012) hence
they are good predictors of the total variations in the SME firm’s performance in Kenya.

115
Table 4.10: Specific Leadership Styles: Model Validity
Model Sum of Squares df Mean Square F Sig.
Regression 2.466 3 .822 3.788 .012b
Residual 24.087 111 .217
Total 26.553 114
a. Dependent Variable: Performance
b. Predictors: (Constant), X13, X12, X11
The combined leadership styles explains 9.3% of the total variations in manufacturing
SME firm’s performance (R2 = .093). The constant in the regression model as shown in
Table 4.16 indicate that combined leadership styles will be always exist at a certain
minimum (β0 = 2.864, P <.001). The transformational leadership style (X11) is
significant and is related positively to the performance of the manufacturing SME
(β1=.208, P=.013). However, the transactional leadership style (X12, β2 = .049, P = .481)
and passive/avoidant leadership behaviour (X13, β3 = .001, P = .099) have insignificant
influence on the performance of the manufacturing SME’s firm in Kenya.
Table 4.11: Specific Leadership Styles: Regression Weights
Model Unstandardized
Coefficients
Standardized
Coefficients
R2
t Sig.
B Std. Error Beta
Constant 2.864 .289 9.914 .000
Transformational .208 .083 .267 2.512 .013
Transactional .049 .069 .074 .706 .481
Passive/avoidant .001 .091 .001 .093 .012 .990 a. Dependent Variable: (Y) Performance

116
The findings in Table 4.9 and Table 4.11 were used to test the three null hypotheses
based on Avolio and Bass (2004) definitions of leadership styles. These hypotheses are
stated as follows;
H01a. The practice of transformational leadership has no significant influence on the
performance of manufacturing SME firm in Kenya
H01b. The practice of transactional leadership has no significant influence on the
performance of manufacturing SME firm in Kenya
H01c. The practice of passive/avoidant leadership has no significant influence on the
performance of manufacturing SME firm in Kenya
The findings in Table 4.9 and Table 4.11 indicates that the transformational leadership
style (X11) has a positive and statistically significant influence on the performance of the
manufacturing SME firm (r =.297**, P =.001; β1=.208, P=.013). This leads to the
rejection of the null hypothesis (H01a) and the acceptance of the alternative hypothesis
(H1a). The study, therefore, concludes that the practice of transformational leadership
style has a significant positive influence on the performance of manufacturing SME
firms in Kenya. This implies that leaders in the manufacturing SME firms who are able
to practice the transformational leadership style during strategy implementation efforts
help their organizations to achieve better results. The findings also revealed that the
transactional leadership style (X12) has an insignificant influence on the SME’s
performance (r = .180, P =.054). This study, therefore, fails to reject the null hypothesis
(H01b) and conclude that the practice of transactional leadership style has no significant
influence on the performance of manufacturing SME firm in Kenya. Likewise, the
passive/avoidant leadership behaviour (X13) has an insignificant influence on the
manufacturing SME’s performance (r = .169, P = .071). This study, therefore, fails to
reject the null hypothesis (H01c) and conclude that the practice of passive/avoidant has
no significant influence on the performance of SME firm in Kenya.

117
1. Discussion of the Findings on Leadership Styles and SME Performance
The results of both bivariate correlations (r =.259**, P = .005) in Table 4.5 and
univariate regression analysis (β1=.284, P = .005) in Table 4.8 indicates that leadership
styles have a positive and significant influence on the performance of the small and
medium manufacturing firms in Kenya. This means that the choice of a leadership style
affects how manufacturing firms performs during strategy implementation process. This
finding concurs with observations and conclusions made by earlier scholars in
management that firms’ leadership is an important factor that leads to superior
performance in a dynamic environment (Heracleous, 2000; Griffin, 2011; Jouste &
Fourie, 2009; Noble & Mokwa, 1999; Teece, 2014; Thompson & Strickland, 2007; Van
Mass, 2008). The role of leadership in owning up, steering and driving forward strategy
implementation efforts is a critical factor to the success of a firm.
Further analysis on the specific types of leadership styles practiced in these firms in
Table 4.14 reveals that transformational leadership style has a positive and significant
influence on the performance of manufacturing SME firm (r =.297**, P=.001; β1=.208,
P=.013) while transactional leadership styles (r = .180, P =.054; β2=.049, P=.481) and
passive/avoidant behaviour (r = .169, P = .071; β3= .001, P = .990) have insignificant
influence on the manufacturing SME’s performance.
A comparative analysis of the past studies indicated that the findings of the current study
are consistent with the works of several scholars who attempted to relate the three
specific leadership styles. Aziz et al. (2013) found out that among the leadership styles
practiced by SMEs, the transformational leadership has the highest influence and is
directly related to the firm’s performance. Ejere and Ugochuku (2012), in an empirical
study of transformational and transactional leadership styles in Nigeria, found that
transformational leadership style is positively and highly related to organizational
performance while transactional leadership style has a positive but weak relationship
with organizational performance.

118
Ling, Simek, Lubatkin and Veiga (2008) found a significant relationship between
transformational CEO’s and performance of the SME’s and noted that their findings
tended to confirm the Upper Echelons theory’s argument that CEO characteristics affect
organizational performance. Udoh and Agu (2012) studied the transformational and
transaction leadership styles on performance of manufacturing organizations in Nigeria
and found a significant positive relationship between transformational and transactional
leadership styles and the organizational performance. However, deviating from Udoh
and Agu’s findings this study found that, although the transactional leadership style is
positively related to performance of the manufacturing SME firm in Kenya, this
relationship is statistically insignificant (r = .180, P =.054; β2=.049, P =.481). This can
be attributed to the existence of different PESTEL conditions in Kenya and Nigeria.
Okwu, Obiwuru, Akpa and Nwankwere (2011) tested the application of transformational
and transactional leadership styles in Nigerian SME’s and found out that
transformational leadership traits (charisma, intellectual stimulation/individual
consideration, inspirational motivation) are weak in explaining variations in
performance. Their study also found that the transactional leadership traits
(constructive/contingent reward, corrective and management by exception) have a
significant effect on followers and performance and explains very high proportion of
variations in performance. They concluded that transactional leadership style is more
appropriate in inducing performance than transformational leadership style. The current
study finds these findings completely the opposite. This study found that, although, the
SME manufacturing firms in Kenya are currently practicing more of transactional
leadership style, it is only the transformational leadership style which is statistically
significant under the Kenyan PESTEL conditions. The leadership styles practiced by
these SME’s during strategy implementation process were also found to have some
transformational attributes.

119
Naeem and Tayyeb (2011) in Pakistan found a positive correlation between
transformational leadership style and SMEs performance and a weak positive correlation
between transactional leadership style and SME performance. The findings of these two
studies (Neem & Tayyeb; Ejere & Ugochuku, 2012 are in agreement with this study on
the significance of the transformational leadership style but disagree on the significance
of transactional leadership. Their studies found a weak relationship between
transactional leadership and SME performance but the current study indicated that
although there is a weak positive relationship between the two variables, this
relationship is statistically insignificant. Ojokuku, Odetayo and Sajuyigbe (2012)
examined the impact of the leadership styles in unrelated sector to this study which
included the banking industry in Nigeria and found a strong relationship between
leadership and organizational performance.
The findings of their study indicated that the transformational leadership is positively
and significantly related to bank’s performance. The transactional leadership style is
negatively related to performance but insignificant. Their study findings are in
agreement with current study on both leadership styles. Zumitzavani and Udchachone
(2014) also examined the influence of leadership on organizational performance in
hospitality industry in Thailand and found out that transformational leadership style has
a positive relationship with organizational performance; transactional leadership style
has a weak positive relationship while passive/avoidant has a negative relationship with
organizational performance. Koech and Namsonge (2011) investigated the effects of
leadership styles on organizational performance of state owned corporations in Kenya
and found a high correlation between transformational leadership, a low but significant
correlation between transactional leadership and performance and no correlation
between passive/avoidant leadership style and performance. Okwachi et al. (2013)
studied Kenya SME’s and found that leadership practice has a direct relationship with
organizational performance.

120
4.7.2 The Relationship between Structural Adaptations and SME Performance
Objective 2: To establish whether structural adaptations influences the performance of
manufacturing SME firms in Kenya
The bivariate correlation analysis in Table 4.5 indicates that there is a positive and
significant influence of the structural adaptations on the performance of the
manufacturing small and medium firms in Kenya (r =.442**, P < .001). This finding
implies that the owners, CEOs or other SME leaders who are able to frequently revise
and adjust their structural configurations in relation to the environmental changes or
adapt structures that support strategy implementation efforts help their organizations
achieve better results.
These findings were further analyzed using a univariate linear regression model Y = β0 +
β2X2 + ε to determine whether the structural adaptations of a manufacturing small and
medium enterprise positively affects the performance. The model in Table 4.12
containing the explanatory variable (X2) representing the structural adaptations of the
SME firm was found to be valid (F (1, 113) =27.480, P < .001) meaning that the
explanatory variable (X2, Structural Adaptation) is a good predictor of variations in
performance in the manufacturing small and medium enterprises in Kenya.
Table 4.12: Structural Adaptations and SME Performance: Model Validity
Model Sum of Squares df Mean Square F Sig.
Regression 5.194 1 5.194 27.480 .000b
Residual 21.359 113 .189
Total 26.553 114
a. Dependent Variable: Performance
b. Predictors: (Constant), Structural Adaptations (X2)

121
The study further revealed that structural adaptations of the small and medium
manufacturing firm (X2) explains 19.6% of the total variations in the performance of the
firm (R2 = .0196). The value of the constant in Table 4.13 shows that the structural
adaptations of the firm will always exist at a certain minimum (β0 = 3.753, P < .001).
The structural adaptations were found to influence the performance of the SME
manufacturing firm positively and significantly (β1 = .677, P < .001) meaning that as the
SME firm adopts better structures that supports strategy implementation initiatives, her
performance will always improve significantly.
Table 4.13: Structural Adaptations and SME Performance: Regression Weights
Model Unstandardized
Coefficients
Standardized
Coefficients
R2 t Sig.
B Std. Error Beta
Constant 3.753 .041 92.570 .000
Structure .677 .129 .442 .196 5.242 .000
a. Dependent Variable: Performance
The univariate model in Table 4.13 was found to be significant (P< 0.001) and therefore,
supports objective 2 that the structural adaptations of the small and medium
manufacturing firm positively and significantly influences her performance.
ii) Test of Hypothesis Two:
H02. Structural adaptations has no significant influence on the performance of
manufacturing SME firms in Kenya
This hypothesis intended to test whether structural adaptations positively translate to
better performance in the SMEs or not. The hypothesis H02: β1 = 0 versus H2: β1 ≠ 0 was
tested. The findings from the bivariate correlations in Table 4.5 indicates that structural

122
adaptations relates positively and significantly with the performance of the SME firm (r
=.442**, P < .001). On the other hand, the univariate regression results in Table 4.13
indicates that a positive and significant relationship exists between structural adaptations
and performance of the manufacturing SME firm (β1 = .677, P < .001). This leads to the
rejection of the null hypothesis (H02a) and acceptance of (H2a). This study, therefore,
concludes that Structural adaptations have a significant positive influence on the
performance of the manufacturing SME firms in Kenya.
The structural adaptations variable was further broken down into specific structural
dimensions identified in the literature by Oslon et al. (2005) as responsible for
influencing organization’s performance. This led to the revision of the univariate model
Y = β0 + β2X2 + ε in order to include these specific structural dimensions leading to a
new model Y = β0 + β1X21 + β2X22 + β3X23 + ε where: Y= Manufacturing SME’s
performance, β0 = Intercept, β1,β2,β3= slope coefficients representing the relationship
between the independent variable and the dependent variable, X21 = Formalization of the
manufacturing SME structure, X22= Centralization of the manufacturing SME structure,
X23 = Specialization of functions in the manufacturing SME structure and ε = error term.
A bivariate correlation matrix was then obtained as shown in Table 4.14.

123
Table 4.14: Specific Structural Dimensions: Correlation Coefficients
Y X21 X22 X23
Performance
(Y)
Pearson Correlation 1
Sig. (2-tailed)
N 115
Formalization
(X21)
Pearson Correlation .456** 1
Sig. (2-tailed) .000
N 115 115
Centralization
(X22)
Pearson Correlation .159 .433** 1
Sig. (2-tailed) .090 .000
N 115 115 115
Specialization
(X23)
Pearson Correlation .350** .611** .107 1
Sig. (2-tailed) .000 .000 .253
N 115 115 115 115
**. Correlation is significant at the 0.01 level (2-tailed)
The results obtained from the bivariate correlation in Table 4.14 reveals that the
formalization of the manufacturing SME has a significant positive relationship with the
SMEs performance (r = .456**, P < .001), followed by specialization (r=.350**, P<.001).
The relationship between centralization in the firm’s structure and the SME performance
was found to be insignificant (r = .159, P = .09).
These three structural dimensions were further subjected to a multiple regression to test
their combined effects on SMEs performance. The model in Table 4.15 containing these
structural dimensions was found to be valid (F (3, 111) = 10.255, P < .001) meaning that a
structural dimension is a good predictor of variations in firm’s performance in Kenya.

124
Table 4.15: Specific Structural Dimensions and Performance: Model Validity
Model Sum of Squares df Mean Square F Sig.
Regression 5.762 3 1.921 10.255 .000b
Residual 20.791 111 .187
Total 26.553 114
a. Dependent Variable: Performance
b. Predictors: (Constant), SPECIAL (X21), CENTR (X22), FORMAL(X23)
The combined structural dimensions in Table 4.16 explains 21.7% of the total variations
in manufacturing SME firm’s performance (R2 = .217). The constant in the regression
model indicates that the structural adaptations will be always exist at a certain minimum
(β0 = 1.156, P =.026). Formalization of the structure is significant and positively relates
to the SMEs performance (β1 = .599, P = .001). However, the influence of centralization
(β2 = -.028, P = .780), and work specialization (β3=.100, P =.325) on manufacturing
SME firm’s performance is not statistically significant.
Table 4.16: The Combined Structural Dimensions: Regression Weights
Model Unstandardized
Coefficients
Standardized
Coefficients
R2
t Sig.
B Std. Error Beta
Constant 1.156 .511 2.264 .026
Formalization .599 .179 .402 3.356 .001
Centralization -.028 .099 -.027 -.279 .780
Specialization .100 .101 .107 .217 .988 .325 a. Dependent Variable: (Y) Performance
These findings in Table 4.14 and Table 4.16 were used to test three null hypotheses
based on the structural dimensions (Oslon et al., 2005) of the SME firm in Kenya.

125
H02a. A formalized structure has no significant influence on the performance of SME
manufacturing firms in Kenya
H02b. A centralized structure has no significant influence on the performance of SME
manufacturing firms in Kenya
H02c. A specialized structure has no significant influence on the performance of SME
manufacturing firms in Kenya
The findings in Tables 4.14 and 4.16 indicate that formalization (X21) has a positive and
statistically significant influence on the performance of the SME firm (.456**, P < .001).
This leads to the rejection of the null hypothesis (H02a) and acceptance of (H2a). This
study, therefore, concludes that a formalized structure has a significant positive
influence on the performance of SME firms in Kenya. This implies that the leaders who
maintain proper procedures, rules, policies and regulations in their firms help their
organizations to achieve better results. The findings also revealed that specialized
structures posted mixed results where the bivariate correlation in Table 4.14 shows that
specialization on its own positively and significantly influences the SME performance (r
= .350**, P < .001) while the multiple regression results in Table 4.16 indicates that
specialization has an insignificant influence on the SME firm’s performance (β3 = .100,
P = .325). The univariate regression in Table 4.22 indicated that a positive relationship
exists between work specialization and firm’s performance (β1 = 3.27, P < .001).

126
Table 4.17: Work Specialization and Performance: Regression Weights
Model Unstandardized
Coefficients
Standardized
Coefficients
R2
t Sig.
B Std. Error Beta
Constant 2.472 .325 7.606 .000
Specialization .327 .082 .350 .123 3.974 .000
a. Dependent Variable: (Y) Performance
The univariate regression results in Table 4.17 for specialization (β1 = 3.27, P < .001)
and the bivariate correlation results in Table 4.14 (r=.350**, P <.001) indicates that a
positive and significant influence exist between specialization and the SME’s
performance. This leads to the rejection of the null hypothesis (H02c) and acceptance of
H2c. This study, therefore, concludes that a specialized structure positively influences the
performance of manufacturing SMEs in Kenya.
The findings on the influence of centralized structures on the SME’s performance in
both bivariate (r = .159, P = .090) in Table 4.14 and regression analysis (β2 = -.028, P =
.780) in Table 4.21 is insignificant. This study, therefore, fails to reject the null
hypothesis (H02b) and concludes that a centralized structure has no significant effects on
the performance of SME manufacturing firm in Kenya.
2. Discussion of Findings on Structural Adaptations and SME Performance
Results from bivariate correlation (r =.442**, P < .001), in Table 4.5, univariate
regression analysis (β1 = .677, P < .001) in Table 4.13 and multiple regression (β2 =
.308, P =.049) in Table 4.26 reveals that the structural adaptations of the manufacturing
small and medium firms in Kenya are significant and positively influences the

127
performance of the firm. This implies that these firms need to examine and re-adjust
their structures in line with changes in the environment and new strategies being
implemented if superior performance is to be achieved. Structure is a dynamic capability
and the firms that are able to adjust their structures in line with changes taking place in
the environment experience better results. These findings concur with various
observations and conclusions made by several scholars in management who have studied
organizational structure. This study confirms the work of Chandler (1961) who
contended that an organization structure must follow her strategy for better performance,
Burns and Stalker (1961) who observed that firms will always adopt a structure in
relation to the environment they are operating in, Sine et al. (2006) who observed that
structures increases performance of new ventures in the context of very dynamic sector,
Oslon et al. (2005) who concluded that performance of an organization is largely
influenced by how well an organization’s strategy is matched to its structure.
Further analysis on the specific structural dimensions practiced by SME firm revealed
that formalization (r = .456**, P < .001) and specialization (r =.350**, P <.001) in Table
4.114 are positively and significantly related with the SME performance. On the other
hand, the relationship between centralization and SME performance is insignificant (r =
.159, P = .090). This finding is in line with the conclusions made by Oslon et al. (2005)
who identified the three structural dimensions along which organizations are structured
(formalization, centralization and specialization). This study observes that the benefits of
a centralized structure are only realized in stable non-complex environments. This is not
the case with the manufacturing SMEs in Kenya since these firms operate in a complex
and highly competitive environment. Leitao (2011) found that the economic
performance of SMEs is positively affected by maintenance of efficient organizational
structure while non-economic performance of the firm is affected by enthusiasm at
work, incentives and maintenance of efficient and sound organizational structure.

128
The findings of this study also confirm the works of Meijaard et al. (2005) in a study
entitled “organizational structure of Dutch small firms”. The study found out small firms
is structured along many dimensions with various degree of departmentation. The study
concluded that departmentation is strongly correlated with the size of the firm,
centralization perform well in relatively small structures and decentralized structures
perform well in firms engaged in business services and manufacturing, in combination
with complex coordination mechanisms hierarchically structured and departmentalized
firms with formalized tasks and specialized employees perform well in terms of growth
especially in manufacturing and financial services and finally, deviating from these
findings of this study, the centralized structure with strong specialized employees occur
frequently in SMEs and performs well in terms of growth.
4.7.3 Influence of Human Resources on the SME Performance
Objective 3: To determine whether attention to human resources influence the
performance of manufacturing SME firms in Kenya
Results from the bivariate correlations in Table 4.5 indicates that there is a positive and
significant influence exists between attention to human resources and performance of
the SME firms in Kenya (r =.408**, P < .001). This implies that performance of these
firms improves significantly when the CEOs/owners pay a close attention to the human
resource requirements during the strategy implementation process.
The findings on human resources was subjected to further analysis where a univariate
linear regression model Y = β0 + β3X3 + ε was used. The model in Table 4.18 was found
to be valid (F (1, 113) =22.559, P < .001) hence the conclusion that human resource (X3) is
a good predictor of variations in performance of the manufacturing SME firms in Kenya.

129
Table 4.18: Human Resources and Performance: Model Validity
Sum of Squares df Mean Square F Sig.
Regression 4.419 1 4.419 22.559 .000b
Residual 22.134 113 .196
Total 26.553 114
a. Dependent Variable: Performance
b. Predictors: (Constant), Human Resources (X3)
The study results in Table 4.19 further revealed that attention to human resource
requirements during strategy implementation explains 16.6% of the total variations in
the performance of the SME firm (R2 = .166). These results indicates that firm’s
attention to human resources will always exist at a certain minimum as shown by the
constant (β0 = 3.753, P < .001). Human resource variable was found to positively and
significantly related to the SME’s performance (β1 = .499, P < .001). The implication
here is that, as the SME firm continuously pays attention to their human resource
requirements during strategy implementation initiatives, their performance improves.
Table 4.19: Human Resources and SME Performance: Regression Weights
Model Unstandardized
Coefficients
Standardized
Coefficients
R2 t Sig.
B Std. Error Beta
Constant 3.753 .041 90.935 .000
Human Resource .499 .105 .408 .166 4.750 .000
a. Dependent Variable: Performance

130
The univariate model in Table 4.19 is significant (P<0.001) and supports the study’s
objective 3 that attention to human resource requirements in the firm during strategy
implementation is positively and significantly influences the performance in SMEs.
iii) Test of Hypothesis Three:
H03. Attention to human resources has no significant influence on the
performance of the manufacturing SME firms in Kenya
This hypothesis intended to test whether there is an influence of human resource on the
performance of the SME firm or not. The hypothesis H03: β1 = 0 versus H3: β1 ≠ 0 was
tested. The findings from the bivariate correlations in Table 4.10 shows that there is a
significant and positive relationship between human resources and SME performance (r
=.408**, P < .001). On the other hand, the univariate regression results in Table 4.19
shows that human resources has a positive and significant relationship with performance
of the SME firm (β1 = .499, P < .001). This leads to the rejection of the null hypothesis
(H03) and acceptance of the alternative hypothesis (H3). This study, therefore, concludes
that attention to human resources positively and significantly influences the performance
of manufacturing SME firms in Kenya.
3. Discussion of Findings on Human Resources and SME Performance
According to Huselid (1995), Becker and Gerhart (1996), there is a significant
relationship between human resources and organizational performance. The bivariate
correlation (r =.408**, P < .001) in Table 4.5 and univariate regression results (β1 = .499,
P < .001) in Table 4.19 indicate that the attention to human resource requirements in
SME firm is significant and positively influences her performance. Okumu’s (2003)
observed that people are required to drive the process of strategy implementation to
success. Although human resource is not a dynamic capability that give firms a direct
advantage and uniqueness in the industry, the SMEs can gain competitiveness and

131
perform well in strategy implementation by building strong capacities and capabilities in
people. This is done better when there is adequate skills development, strong policies
and procedures, clear targets and motivation and when SME’s leadership fosters
confidence among their employees. Teece (2014) observed that a dynamic capability in
people can be developed through injecting new knowledge and skills and continuous
improvement in human resources through training and development initiatives.
The findings from this study concurred with the works of other several contemporary
scholars who found a positive relationship between human resources and organization
performance (Amin et al., 2014; Cho et al., 2006; Olrando & Johnson, 2001; Osman, &
Galang, 2011; Wong et al., 2013; Wright et al., 2003).
Amin et al. (2014), in an interview of 300 employees from a public university, found out
that human resource practices like recruitment, training, performance appraisal, career
planning, employee participation, job definition and compensation have a significant
relationship with university performance. His findings confirmed an earlier study by Beh
and Loo (2013) who found out that best practices in human resources like performance
appraisals, internal communications, career planning, training and development,
recruitment and selection and strategic human resource alignment in the organization
positively affect firm’s performance. Katou (2008), in a study involving 178
organizations in Greece, confirmed that a relationship exists between practice of human
resources and organization performance. This study concluded that the finding on the
relationship between attentions to human resource requirements during strategy
implementation is consistent with the works of earlier scholars who studied the same
variable in an attempt to establish its effect with organizational performance.

132
4.7.4 Influence of Technology on the SME Performance
Objective 4: To establish the relationship between technology and performance of SME
firm in Kenya
The bivariate correlation analysis in Table 4.5 indicates that there is a positive and
significant influence of technology on the performance of manufacturing SME firm in
Kenya (r =.482**, P <.001). This finding implies that the owners, CEOs or the SME
leaders who adapts to technological changes in line with changes in the environment and
provides the required technological support during strategy implementation help their
organizations to achieve better results.
These finding were subjected to further analysis using univariate linear regression model
Y = β0 + β4X4 + ε to determine whether attention to technological requirements by the
SME leadership influences the performance of the SMEs. The model in Table 4.20
containing the explanatory variable technology (X4) was found to be valid (F (1, 113) =
34.106, P <.001) meaning that technology is a good predictor of variations in
performance in the manufacturing SME firms in Kenya.
Table 4.20: Technology and SME Performance: Model Validity
Model Sum of Squares df Mean Square F Sig.
Regression 6.156 1 6.156 34.106 .000b
Residual 20.397 113 .181
Total 26.553 114
a. Dependent Variable: Performance
b. Predictors: (Constant), Technology (X4)

133
The study results in Table 4.21 further revealed that attention the technological
requirements during strategy implementation explains 23.2% of the total variations in
the firm’s performance (R2 = .232). These results shows that technology in the will
always exist at a certain minimum as shown by the constant (β0 = 3.753, P < .001). The
technology variable was found to have a positive and significant relationship with the
SME performance (β1 = .417, P < .001). This implies that, as the SME firms employ
additional and better technology, her performance improves significantly.
Table 4.21: Technology and Performance: Regression Weights
Model Unstandardized
Coefficients
Standardized
Coefficients
R2 t Sig.
B Std. Error Beta
Constant 3.753 .040 94.729 .000
Technology .417 .071 .482 .232 5.840 .000
a. Dependent Variable: Performance
The univariate model in Table 4.21 was found to be significant (P<0.001) and therefore,
supports the study’s objective 4 that the relationship between attention to technological
requirements by the firm during strategy implementation and performance is positive
and significant.
iv) Test of Hypothesis Four:
v) Attention to technological requirements has no significant influence on the
performance of manufacturing SME firms in Kenya

134
This hypothesis intended to test whether attention to technological requirements
positively and significantly influences the performance of the SME or not. The
hypothesis H04: β1 = 0 versus H4: β1 ≠ 0 was tested. Findings from the bivariate
correlation in Table 4.10 revealed the existence of a positive and significant influence
relationship between technology and the manufacturing SME firm’s performance in
Kenya (r =.482**, P < .001). On the other hand, the univariate regression results in Table
4.21 indicates the existence of a positive and significant relationship between attention
to technological requirements and the SME performance (β1 = .417, P < .001). This
leads to the rejection of the null hypothesis (H04) and acceptance of the alternative
hypothesis (H4). This study, therefore, concludes that attention to technological
requirements during strategy implementation positively and significantly influences the
performance of SME firms in Kenya.
4. Discussion of Findings on Technology and SME Performance
Zollo and Winter (2002) views technology as a dynamic capability that is embedded in
firm’s practices and is essential in determining the competitiveness and performance of a
firm in a dynamic environment. The bivariate correlation (r =.482**, P <0.001) in Table
4.5, the univariate regression results (β1 = .417, P < .001) in Table 4.21 and multiple
regression results (β4 = 0.320, P = .002) in Table 4.26 indicate that the attention to
technology requirements during strategy implementation in SME firms relates to her
performance positively and significantly. Teece (2014) noted that those firms with
strong dynamic capabilities tended to exhibit strong technological agility, are able to
create new technologies, differentiate and maintain superior processes and modify their
structures and business models in a way that ensures they stay ahead of the competition.
The findings in this study on technology are in line with earlier scholars who did studies
aimed at linking technology to superior performance in organizations (Bell & Pavitt,

135
1995; Nohria & Gulati, 1996; Reichert et al., 2012; Trez et al., 2012). Becheikh et al.
(2006) observed that technological innovation is a key factor in firm competitiveness
and it is unavoidable for those firms that want to develop and maintain superior
performance in the current or new markets. Manimala and Vijay (2012) maintained that
technology adoption is crucial for growth of business in the private sector and Mubaraki
and Aruna (2013) noted that technology adoption behaviour significantly improves
organizational performance in terms of profit, growth and market share.
Lumiste et al. (2004) found that SMEs were engaged in developing their products
together with processes. However, Becheikh et al. (2006) recommended that more
research is required in both product and process innovations in SMEs because it is
limited in literature. This study aimed at filling this gap and found that among all the
predictor variables included, technology has the highest correlation coefficient with the
firm’s performance and also has a significant positive relationship her performance in
Kenya.
4.7.5 Influence of the Strategic Direction on SME Performance
Objective 5: To determine whether the firm’s emphasis on strategic direction influences
the performance of manufacturing SME firms in Kenya
The bivariate correlation results in Table 4.5 indicates that there is an insignificant
influence of the firm’s strategic direction on the performance of the SME firms in Kenya
(r =.137, P = .143). These finding were subjected to further analysis where a univariate
linear regression model Y = β0 + β5X5 + ε was used to determine whether emphasis on
the strategic direction has any significant influence on the performance of the
manufacturing SME firm.
The model in Table 4.22 containing the explanatory variable (X5, strategic direction)
was found to be invalid for further analysis (F (1, 113) = 2.174, P = .143) meaning that

136
emphasis on the strategic direction of the firm (X5) is not a good predictor of variations
in performance of these SME firms in Kenya.
Table 4.22: Strategic Direction and SME Performance: Model Validity
Model Sum of Squares df Mean Square F Sig.
Regression .501 1 .501 2.174 .143b
Residual 26.052 113 .231
Total 26.553 114
a. Dependent Variable: Performance
Table 4.23: Strategic Direction and SME Performance: Regression Weights
Model Unstandardized
Coefficients
Standardized
Coefficients
R2 t Sig.
B Std. Error Beta
Constant 3.161 .0404 7.828 .000
Strategic Direction .157 .106 .137 .019 1.474 .143
a. Dependent Variable: Performance
b. Predictors: (Constant), Strategic Direction (X5)
The univariate model in Table 4.23 revealed that emphasis on strategic direction only
explains 1.9% of the total variations in performance of the firm (R2 =.019). The
coefficients in the model show that strategic direction will always exist at a certain
minimum as shown by the positive constant (β0 = 3.161, P < .001). However, the

137
continued emphasis of the strategic direction during strategy implementation does not
significantly yield better results among the Kenyan SME firms (β1 = .157, P = .143)
vi) Test of Hypothesis Five:
H05. Emphasis on strategic direction has no significant influence on the performance
of manufacturing SME firms in Kenya
This hypothesis tested whether emphasis on the strategic direction during strategy
implementation significantly influence the performance of the SME firm or not. The
hypothesis H05: β1 = 0 versus H5: β1 ≠ 0 was tested. Both the correlation and regression
results in Table 4.5 and Table 4.23 show that strategic direction has an insignificant
relationship on the firm’s performance. This study, therefore, failed to reject the null
hypothesis (H05) and concludes that emphasis on strategic direction has no significant
influence on the performance of manufacturing SMEs in Kenya.
5. Discussion of Findings on Strategic Direction and SME Performance
The strategic direction of an organization is often embedded in its strategic vision and
mission statements. Madu (2013) observed that strategic vision is the first step in
formulating and implementing strategy in organizations. A company’s strategic vision
provides the logical reason for future plans and directions of the company, and aims the
organization in a particular direction, providing a strategic direction for the organization
to follow in the aspirations of shareholders in the long run.
The bivariate correlation (r =.137, P = .143) in Table 4.5, the univariate regression
results (β1 = .157, P = .143) in Table 4.23 and multiple regression results (β5 = -.175, P
= .581) in Table 4.26 show that strategic direction has an insignificant influence on the
performance of manufacturing SME firms in Kenya. This is explained by the fact that

138
strategic direction of the SME firm in this study was considered as a guide on the
activities and actions the firm takes and how resources are mobilized, deployed and re-
deployed in a way that leads to the achievement of the firm’s mission and vision.
The implication of this finding the role of strategic direction during strategy
implementation usually is taken up by the other predictor variables (leadership styles,
structural adaptations, human resources and technology). As shown in Table 4.5, there
is a strong and significant correlations between strategic direction and leadership styles
(r = .527**, P <.001), structural adaptations (r = .225*, p =.016), human resources (r =
.447**, P <.001) and technology (r = .358**, P <.001).
This result confirms the findings by Lumpkin and Dess, (1996) who observed that the
relationship between strategic orientation and organizational performance is influenced
by many third-party variables, and the different effects of third variables may lead to
different performance levels. The researcher recommended that studies on the complex
relationship between strategic direction and other predictor variables should be
conducted in specific context. As Liu and Fu (2011) noted, several studies on strategic
direction has been conducted in large established companies (Jantunen et al., 2005), in
the context of SMEs (Wiklund & Shephend, 2005), in industry cluster context (Dai &
Li, 2006), in international background (Martin & Lumpkin, 2003) but their findings on
the relationship with performance are not consistent. This study is therefore, consistent
with the observations made by Liu and Fu (2011) in that it failed to establish any
significant influence of the strategic direction on the performance of manufacturing
SME’s in Kenya.
4.8 The Combined Effects of all Variables: (Multiple Regression)
A multiple regression analysis was performed on the five drivers of strategy
implementation to test their combined effects on the SMEs performance in Kenya.

139
The regression model in Table 4.24 containing all variables was found to be valid (F
(5,108) = 9.314, P < .001) meaning the all the variables in this study are good predictors of
the variations in performance of the manufacturing small and medium in Kenya.
Table 4.24: The Multiple Regression: Model Validity
Model Sum of Squares df Mean Square F Sig.
Regression 7.830 5 1.566 9.314 .000b
Residual 18.160 108 .168
Total 25.990 113
a. Dependent Variable: Performance
b. Predictors: (Constant), X5, X4, X3, X2, X1
The multiple regression results in Table 4.25 indicated that all the drivers of the strategy
implementation in this study explains 30.1% of the total variations in the performance of
the manufacturing SME firm in Kenya (R2 = 0.301). The Durbin-Watson statistics (d =
2.429). According to the Durbin and Watson (1950, 1951) statistics, the values of d
always lie between 2.00 and 4.00. The value of dU, α, = 2.00 indicate the absence of
autocorrelation among the study variables. The value of d below 2.00, (d < dU, α)
indicates the presence of autocorrelation while the value of d above 2.00, (d > dU, α)
indicate lack of statistical evidence that the error terms are positively auto correlated.
The Durbin–Watson statistic (d) in this study is 2.43 meaning that there is no statistical
evidence of the presence of autocorrelation in the error term.

140
Table 4.30: The Multiple Regression: Model Summary
Model R R Square Adjusted R Square Std. Error
of the
Estimate
Durbin-
Watson
.549a .301 .269 .41006 2.429
a. Predictors: (Constant), X5, X2, X4, X1, X3
b. Dependent Variable: Performance
Due to the presence of multi-collinearity among some of the study variables, all the
variables were centered and the results thereafter showed collinearity statistics (VIF)
value of less than ten in all variables indicating absence of multi-collinearity after
centering all the variables (see Table 4.26).
The multiple regressions results in Table 4.26 indicates that only attention to
technological requirements (X4) during strategy implementation (β4 = 0.320, P = .002)
and the structural adaptations (X2) of the firm (β2 = .200, P =.049) are significant and
positively relates to performance of the SME firms in Kenya. The constant (β0) is also
positive and significant (β0 = 3.756, P < .001).
All the other variables, that is, leadership styles (X1), attention to human resources (X3)
and awareness of the strategic direction (X5) have a p-value greater than 5% (P > 0.05)
meaning that, when all variables in this study are combined, leadership styles, human
resources and strategic direction becomes insignificant in explaining variations in
performance of the manufacturing SME firms in Kenya.

141
Table 4.26: The Multiple Regression: Weights of Variables
Model Unstandardized
Coefficients
Standardized
Coefficients
t Sig. Collinearity
Statistics
B Std. Error Beta Tolerance VIF
Constant 3.756 .039 97.433 .000
Leadership .106 .109 .097 .974 .332 .654 1.530
Structure .308 .155 .200 1.994 .049 .645 1.551
HR .212 .133 .171 1.587 .115 .558 1.792
Technology .279 .086 .320 3.239 .002 .663 1.508
Strategic
Direction
-.175 .121 -.152 -1.442 .152 .581 1.720
a. Dependent Variable: Performance
6. Discussion of Findings on Overall Model and SME Performance
The multiple regression model in Table 4.26 established that only constant (β0 = 3.756,
P < .001), technology (β4 = 0.320, P = .002) and structural adaptations are significant in
influencing performance in a combined relationships. This means that the most
important factors in predicting performance in SME firms are technology followed by
structure. These findings are consistent with observations on techno-structure by
Mintzberg (1980). This means that, for a strategy to be well implemented, the
organization has to maintain a fair balance between technology and structure in a
machine bureaucracy as advanced by Mintzberg (1980). Based on the findings of the
multiple regressions, the study rejected the null hypotheses H02 and H04 in favour of H2
and H4 and concludes that the structural adaptations and the level of technology in the
manufacturing small and medium firm have a significant positive influence on the
manufacturing SME firm’s performance. On the other hand this study failed to reject
H01, H03 and H05 and concluded that, in a combined effect, there are no significant

142
influence among leadership styles, human resources and strategic direction on the
performance of the manufacturing SME firms in Kenya.
Table 4.27: Summary of Results of Hypotheses Tested
No. Variable P -Value Direction Deduction
H01 Leadership styles & Performance .005 Positive Reject H01
H01a Transformational leadership style <.001 Positive Reject H01a
H01b Transactional leadership style .054 Positive Fail to reject H01b
H01c Passive/avoidant behaviour .071 Positive Fail to reject H01c
H02 Structure & Performance <.001 Positive Reject H02
H02a Formalization <.001 Positive Reject H02a
H02b Centralization .090 Negative Fail to reject H02b
H02c Specialization <.001 Positive Reject H02c
H03 Human Resource & Performance <.001 Positive Reject H03
H04 Technology & Performance <.001 Positive Reject H04
H05 Strategic Direction & Performance .143 Positive Fail to reject H05
4.9. Moderating Effects of the Firm Level Characteristics on Strategy &
Performance
Objective 6: To establish whether the firm level characteristics (age and size) has a
moderating effect on the relationship between strategy implementation and the
performance SME manufacturing firms in Kenya.
This study intended to establish whether the firm’s level characteristics such as age and
size moderate the relationship between strategy implementation and the performance of
the manufacturing SME in Kenya. To achieve this objective, this study was guided by

143
the moderated multiple regression model (MMR) showing the interactions between age
and size of the firm with the dependent and independent variables in this study;
Y = β0 + βiXi + ε, where (i= 1, 2, 3, 4, 5)………………… (i)
Y = β0 + βiXi + βzZj + ε, where (j = 1, 2)………………… (ii)
Y = β0 + βiXi + βzZj + βizXiZj + ε ………………………… (iii)
The first model shows the relationship between the dependent variable and the
independent variables of the study. The second model shows introduction of the
moderating variable (Zj: age/size) into the multiple regression model while the third
model shows the introduction of the interaction terms (Xi*Zj) in the relationship between
strategy implementation variables and the dependent variable. The relationship between
strategy implementation and performance of the SME firm in this study was moderated
by the firm-level characteristics (age and size). The age of the firm was broken down
into two categories where those firms whose age fall below 5 years were classified as
young while those which age was above 5 years were classified as old firms. The size of
the firm was also classified into two categories based on the definitions of SMEs
according to World Bank (IFC, 2012) where firms with less than 50 employees was
classified as small while those with over 50 employees were classified as medium
enterprises.
a) Moderating Effect of Age on Leadership Styles and SME firm’s
Performance.
To test whether age of the firm moderates the relationship between leadership styles and
performance of manufacturing small and medium firms during strategy implementation,
a moderated multiple regression model was used: Y = β0 + β1X1 + βzZ1 + βizX1Z1 + ε,
where Y is the performance, β0 is the constant, β1, β2, β3 are slope coefficients

144
representing the relationship between independent variable and the dependent variable,
X1 is leadership styles, Z1 represents age as a moderating variable while X1Z1 is the
interaction term which is the product of age and leadership styles (Age*Leadership
styles). The results are presented in Tables 4.28, 4.29 and 4.30.
Table 4.28: Moderating Effect of Age on Leadership Styles and Performance:
Model Validity
Model Sum of Squares df Mean Square F Sig.
1
Regression 1.724 1 1.724 7.925 .006b
Residual 24.145 111 .218
Total 25.869 112
2
Regression 2.737 2 1.368 6.507 .002c
Residual 23.132 110 .210
Total 25.869 112
3
Regression 3.694 3 1.231 6.053 .001d
Residual 22.175 109 .203
Total 25.869 112
a. Dependent Variable: Performance
b. Predictors: (Constant), Leadership Styles
c. Predictors: (Constant), Leadership Styles, Age
d. Predictors: (Constant), Leadership Styles, Age, Age*Leadership
The results in Table 4.28 shows that the F statistics in model one, F (1,111) = 7.925, P =
.006 was valid and there is a significant influence between leadership styles and the
performance of the manufacturing small and medium firms. When age was introduced as
a moderating variable, the F statistics, F (2, 110) = 6.507, P = .002 in model two remained
valid and indicated that there is a significant influence among leadership styles, age of
the firm on the performance of the manufacturing SME. When the interaction term
(age*leadership styles) was added in model two, the new model three was valid (F (3,109)

145
= 6.053, P = .001) indicating that there is a significant influence among leadership
styles, age of the firm, the interaction term (age*leadership styles) on the performance of
manufacturing small and medium firm in Kenya.
Table 4.29: Moderating Effect of Age on Leadership Styles and Performance:
Model Summary
The R2 in model one in Table 4.29 show that 6.7% of the total variations in performance
of the manufacturing small and medium firms in Kenya can be explained by leadership
styles. The adjusted R2 shows that when the constant is excluded from the study,
leadership styles explain 5.8% of the total variation in performance. The value of (r
=.258, P =.006) in the table indicate a significant positive influence of leadership styles
on the performance of the manufacturing small and medium firms and the standard
error of estimate (0.466) shows mean deviation of the predictor variable from the line of
best fit.
Model R R
Square
Adjusted R
Square
Std.
Error of
the
Estimate
Change Statistics
R
Square
Change
F
Change
df1 df2 Sig. F
Change
1 .258a .067 .058 .46639 .067 7.925 1 111 .006
2 .325b .106 .090 .45858 .039 4.817 1 110 .030
3 .378c .143 .119 .45104 .037 4.705 1 109 .032
a. Predictors: (Constant), Leadership Styles
b. Predictors: (Constant), Leadership Styles, Age
c. Predictors: (Constant), Leadership Styles, Age, Age*Leadership

146
The second model introduced age of the firm into the relationship between leadership
styles and performance of manufacturing small and medium firms. The change in R2
from 6.7% to 10.6% implies that age of the firm significantly improved the relationship
between leadership styles and SME performance by 3.9% (P =.030). The third model
shows the relationships among leadership styles, age of the firm, the interaction term
(age*leadership) and performance of the SME firm. The results indicated that with the
introduction of the interacting term, the R2 significantly improved further by 3.7% (P =
.032) from 10.6% to 14.3% implying that age of the firm is a significant moderator of
the relationship between leadership styles and the performance of manufacturing SME
firms.
Table 4.30: Moderating Effect of Age on Leadership Styles and Manufacturing
SME Performance: Regression Coefficients
Model one in Table 4.30 indicate that leadership styles is a significant predictor of SME
firm’s performance (β1 = .282, P = .006), with the introduction of the moderating
variable (age) in model two, both leadership styles (β1 = .262, P = .009) and age (β2 =
.215, P = .030) become significant predictors of performance in manufacturing SME
firm. When the interaction term (age*leadership) was introduced as shown in model
Model Unstandardized
Coefficients
Standardized
Coefficients
t Sig.
B Std. Error Beta
1 (Constant) 3.757 .044 85.478 .000
Leadership Styles .282 .100 .258 2.815 .006
2
(Constant) 3.598 .084 42.711 .000
Leadership Styles .262 .099 .239 2.644 .009
Age .215 .098 .199 2.195 .030
3
(Constant) 3.554 .085 41.659 .000
Leadership Styles -.207 .237 -.189 -.874 .384
Age .259 .099 .239 2.631 .010
Age*Leadership .564 .260 .468 2.169 .032
a. Dependent Variable: Performance

147
three, leadership styles became insignificant predictor of performance in manufacturing
SME firm (β1 = -.207, P = .384) and its role is significantly taken up by age of the firm
(β2 = .259, P = .010) and the interaction term (age*leadership) (β3 = .564, P = .032).
Figure 4.17: Moderating Effect of Age on Leadership and SME Performance
7. Discussion of Findings on Moderating Effect of Age on Leadership
Styles and SME Performance
Figure 4.17 clearly shows the interaction between age of the firm as the moderating
variable in the relationship between leadership styles and the performance of
manufacturing small and medium firms in Kenya.
The findings on the moderation effect of age on leadership styles and performance
indicated that the practice of superior leadership skills, as a dynamic capability, matures
with time and enables the older manufacturing firms to perform better in a dynamic

148
environment. The implication here is that those firms that have existed in the industry
for some time have been able to develop strong capacities and capabilities in leadership
skills through practice, experience, training and recruitment from other high performing
organizations.
On the other hand the young manufacturing firm enjoys high performance in the initial
years after establishment due to its newness in the market, its small size and the ability
to manage better. The performance of young manufacturing firms, however, declines
gradually with time as the competition intensify and the opportunity cost of continuous
focus on growth and performance at the expense developing better capacities and skills
for future survival weighs on the firm. This creates inconsistencies in leadership styles
as the firm attempts to understand the environmental dynamism and position itself better
in the market. The implication of these findings is that, since the literature have
documented that majority of SME firms do not live to celebrate their fifth birthday
(Gakure, 2013), these firms need to start practicing strategic management in their second
to fourth year of existence to avoid their collapse. The findings from the moderated
regression analysis also showed that the age of the firm has a significant moderating
effect on leadership styles and the performance of the SME firms in Kenya.
b) Moderating Effect of Size on Leadership Styles and SME firm’s
Performance
To test whether size of the firm influence the relationship between leadership styles and
performance of manufacturing small and medium firms during strategy implementation
process, a moderated multiple regression model was used: Y = β0 + β1X1 + βzZ2 + βizX1Z2
+ ε, where Y is the performance, β0 is the constant, β1, β2, β3 are the slope coefficients
representing the relationship between the independent variable and dependent variable,
X1 is leadership styles, Z2 represents size as a moderator while X1Z2 is the interaction

149
term which is the product of size and leadership styles (Size*Leadership styles). The
results are presented in Tables 4.31, 4.32 and 4.33.
Table 4.31: Moderating Effect of Size on Leadership Styles and Manufacturing
SME Performance: Model Validity
Model Sum of
Squares
df Mean
Square
F Sig.
1
Regression 1.729 1 1.729 7.854 .006b
Residual 24.216 110 .220
Total 25.945 111
2
Regression 1.801 2 .901 4.066 .020c
Residual 24.144 109 .222
Total 25.945 111
3
Regression 2.079 3 .693 3.136 .028d
Residual 23.866 108 .221
Total 25.945 111
a. Dependent Variable: Performance
b. Predictors: (Constant), Leadership Styles
c. Predictors: (Constant), Leadership Styles, Size
d. Predictors: (Constant), Leadership Styles, Size, Size*Leadership
The results in Table 4.31 shows that the F statistics in model one, F (1,110) = 7.854, P =
.006 is valid and there is a significant influence of leadership styles on the performance
of the manufacturing SMEs. When size of the firm was introduced as a moderating
variable in model two, the F statistics, F (2, 109) = 4.066, P = .02 indicated that model
remains valid and there is a significant influence among leadership styles, size of the
firm and the performance of the SME. When the interaction term (Size*leadership

150
styles) was added in model three, the F statistics, F (3,108) = 3.136, P = .028 indicated that
the results remained valid and there is a significant influence among leadership styles,
size of the firm, the interaction term (size*leadership styles) on the performance of
manufacturing small and medium firm in Kenya.
Table 4.32: Moderating Effect of Size on Leadership Styles and Manufacturing
SME Performance: Model Summary
The coefficient of determination (R2) in model one in Table 4.32 show that 6.7% of the
total variation in performance of the manufacturing small and medium firms in Kenya
can be explained by leadership styles. The adjusted R2 shows that when the constant is
excluded from the study, leadership styles explain 5.8% of the total variation in
performance. The value of (r =.258, P =.006) in the table indicated a significant positive
influence of leadership styles on the performance of the manufacturing SME firms and
the standard error of estimate (0.469) shows mean deviation of the predictor variable
from the line of best fit.
Model R R
Square
Adjusted
R Square
Std.
Error of
the
Estimate
Change Statistics
R
Square
Change
F
Change
df1 df2 Sig. F
Change
1 .258a .067 .058 .46920 .067 7.854 1 110 .006
2 .263b .069 .052 .47064 .003 .326 1 109 .569
3 .283c .080 .055 .47008 .011 1.258 1 108 .265
a. Predictors: (Constant), Leadership Styles
b. Predictors: (Constant), Leadership Styles, Size
c. Predictors: (Constant), Leadership Styles, Size, Size*Leadership

151
The second model introduced size of the firm into the relationship between leadership
styles and performance of manufacturing small and medium firms. The change in R2
from 6.7% to 6.9% implied that size of the firm improves the relationship between
leadership styles and SME performance by 0.3% but the improvement is not statistically
significant (P =.569). The third model show the influence among leadership styles, size
of the firm, the interaction term (size*leadership) and performance of the SME firm. The
results indicated that the interacting term improves the R2 by 1.1% from 6.9% to 8.0%
but the improvement is not statistically significant (P = .265). This implies that the size
of the firm does not significantly influence the relationship between leadership styles
and the performance of small and medium manufacturing firms in Kenya.
Table 4.33: Moderating Effect of Size on Leadership Styles and Manufacturing
SME Performance: Regression Weights
The results in model one Table 4.33 indicates that leadership styles is a significant
predictor of manufacturing SME firm’s performance (β1 = .283, P = .006), with the
introduction of the moderating variable (size) in model two, leadership styles remained
Model Unstandardized
Coefficients
Standardized
Coefficients
t Sig.
B Std. Error Beta
1 (Constant) 3.754 .044 84.515 .000
Leadership Styles .283 .101 .258 2.803 .006
2
(Constant) 3.767 .050 74.971 .000
Leadership Styles .291 .102 .266 2.847 .005
Size -.064 .111 -.053 -.571 .569
3
(Constant) 3.762 .050 74.705 .000
Leadership Styles .211 .125 .193 1.692 .094
Size -.075 .112 -.063 -.669 .505
Size*Leadership .244 .217 .128 1.122 .265
a. Dependent Variable: Performance

152
significant (β1 = .291, P = .005) but size (β2 =- .064, P = .569) became insignificant.
When the interaction term (size*leadership) was introduced as shown in model three, all
the three variables became insignificant predictors of performance in SME firm.
c) Moderating Effect of Age on Structure and SME firm’s Performance
To test whether age of the firm influences the relationship between structural adaptations
and performance of manufacturing SME firms during strategy implementation process, a
moderated multiple regression model was used: Y = β0 + β1X2 + βzZ1 + βizX2Z1 + ε,
where Y is the performance, β0 is the constant, β1, β2, β3 are slope coefficients
representing the relationship between the independent variable and dependent variable,
X2 is structural adaptations, Z1 is age as a moderating variable while X2Z1 is the
interaction term which is the product of age and structure (Age*Structure). The results
are presented in Tables 4.34, 4.35 and 4.36.

153
Table 4.34: Moderating Effect of Age on Structure and Manufacturing SME
Performance: Model Validity
Model Sum of
Squares
df Mean
Square
F Sig.
1
Regression 5.129 1 5.129 26.974 .000b
Residual 21.298 112 .190
Total 26.427 113
2
Regression 5.611 2 2.805 14.958 .000c
Residual 20.817 111 .188
Total 26.427 113
3
Regression 6.311 3 2.104 11.504 .000d
Residual 20.116 110 .183
Total 26.427 113
a. Dependent Variable: Performance
b. Predictors: (Constant), Structural Adaptations
c. Predictors: (Constant), Structural Adaptations, Age
d. Predictors: (Constant), Structural Adaptations, Age, Age*Structure
The results in Table 4.34 show that model one, F (1,112) = 26.974, P < .001 is valid and
that there is a significant influence of structural adaptations on the performance of the
manufacturing small and medium firms. When age was introduced as a moderating
variable in model two, F (2, 111) = 14.958, P < .001, the new model remained valid
indicating that there is a significant influence among structural adaptations, age of the
firm and the performance of the manufacturing SME firm. When the interaction term
(age*structure) was introduced in model three, the new model, F (3,110) = 11.504, P <
.001 remained valid indicating that there is a significant influence among the structural

154
adaptations of the firm, age, the interaction term (age*structure) on the performance of
manufacturing small and medium firm in Kenya.
Table 4.35: Moderating Effect of Age on Structure and Performance of the
Manufacturing SME: Model Summary
The R2 in model one in Table 4.35 show that 19.4% of the total variation in performance
of the manufacturing SME firms in Kenya can be explained by structural adaptations.
The adjusted R2 show that when the constant is excluded from the study, structural
adaptations explain 18.7% of the total variation in performance. The value of (r =.441, P
< .001) in the table indicated a significant positive influence between structural
adaptations and performance of the manufacturing SME firms and the standard error of
estimate (0.436) shows mean deviation of the predictor variable from the line of best fit.
The second model introduced age of the firm into the relationship between structural
adaptations and performance of manufacturing small and medium firms. The change in
R2 from 19.4% to 21.2% implied that age of the firm improved the relationship between
Model R R
Square
Adjusted
R Square
Std.
Error of
the
Estimate
Change Statistics
R
Square
Change
F
Change
df1 df2 Sig. F
Change
1 .441a .194 .187 .43607 .194 26.974 1 112 .000
2 .461b .212 .198 .43306 .018 2.566 1 111 .112
3 .489c .239 .218 .42763 .027 3.832 1 110 .053
a. Predictors: (Constant), Structural Adaptations
b. Predictors: (Constant), Structural Adaptations, Age
c. Predictors: (Constant), Structural Adaptations, Age, Age*Structure

155
structural adaptations and SME performance by 1.8% which is not significant (P =.112).
The third model shows the influence among structural adaptations, age of the firm, the
interaction term (age*structure) and performance of the SME firm. The results indicated
that with the introduction of the interacting term, the R2 improved further by 2.7% from
21.2% to 23.9% but the change in R2 is not statistically significant (P = .053). This
implied that age of the firm is not a significant moderator of the relationship between
structural adaptations and performance of manufacturing SME firms in Kenya.
Table 4.36: Moderating Effect of Age on Structure and Manufacturing SME
Performance: Regression Weights
The results in model one Table 4.36 indicate that structural adaptations is a significant
predictor of manufacturing SME firm’s performance (β1 = .674, P < .001), with the
introduction of the moderating variable (age) in model two, structural adaptations (β1 =
.628, P < .001) remained statistically significant while age (β2 = .151, P = .112) became
an insignificant predictor of performance in manufacturing SME firm. When the
Model Unstandardized
Coefficients
Standardized
Coefficients
t Sig.
B Std. Error Beta
1 (Constant) 3.755 .041 91.941 .000
Structural Adaptations .674 .130 .441 5.194 .000
2
(Constant) 3.644 .080 45.299 .000
Structural Adaptations .628 .132 .411 4.761 .000
Age .151 .094 .138 1.602 .112
3
(Constant) 3.585 .085 42.172 .000
Structural Adaptations .100 .299 .066 .335 .739
Age -2.329 1.270 -2.130 -1.833 .069
Age*Structure .651 .333 2.372 1.958 .053
a. Dependent Variable: Performance

156
interaction term (age*structure) was introduced as shown in model three, all variables
became an insignificant predictors of performance in the manufacturing SME firm.
d) Moderating Effect of Size on Structure and Performance of the
Manufacturing SME
To test whether size of the firm influences the relationship between structural
adaptations and performance of manufacturing small and medium firms during strategy
implementation process, a moderated multiple regression model was used: Y = β0 + β1X2
+ βzZ2 + βizX2Z2 + ε, where Y is the performance, β0 is the constant, β1, β2, β3 are slope
coefficients representing the influence of the independent variable on the dependent
variable, X2 is structural adaptations, Z2 represents size as a moderator while X2Z2 is the
interaction term which is the product of size and structural adaptations (size*structure).
The results are presented in Tables 4.37, 4.38 and 4.39.
Table 4.37: Moderating Effect of Size on Structure and Manufacturing SME
Performance: Model Validity
Model Sum of
Squares
df Mean
Square
F Sig.
1
Regression 5.277 1 5.277 27.589 .000b
Residual 21.231 111 .191
Total 26.508 112
2
Regression 5.301 2 2.650 13.748 .000c
Residual 21.207 110 .193
Total 26.508 112
3
Regression 5.316 3 1.772 9.114 .000d
Residual 21.192 109 .194
Total 26.508 112
a. Dependent Variable: Performance
b. Predictors: (Constant), Structural Adaptations
c. Predictors: (Constant), Structural Adaptations, Size
d. Predictors: (Constant), Structural Adaptations, Size, Size*Structure

157
The results in Table 4.37 show that model one, F (1,111) = 27.589, p < .001 is valid and
there is a significant influence between structure and the performance of the
manufacturing small and medium firms. When size of the firm was introduced as a
moderating variable, the F statistics, F (2, 110) = 13.748, P < .001 indicated that the new
model remained valid and there is a significant influence among structural adaptations of
the firm, size on the performance of the manufacturing SME.
When the interaction term (size*structure) was introduced in model three, the F
statistics, F (3,109) = 9.114, P < .001 indicated that the new model remained valid and
there is a significant influence among structural adaptations, size of the firm, the
interaction term (size*structure) on the performance of manufacturing small and
medium firm in Kenya.
Table 4.38: Moderating Effect of Size on Structure and Performance of the
Manufacturing SME: Model Summary
The R2 in model one in Table 4.38 show that 19.9% of the total variations in
Model R R
Square
Adjusted
R Square
Std.
Error of
the
Estimate
Change Statistics
R
Square
Change
F
Change
df1 df2 Sig. F
Change
1 .446a .199 .192 .43734 .199 27.589 1 111 .000
2 .447b .200 .185 .43908 .001 .124 1 110 .725
3 .448c .201 .179 .44093 .001 .078 1 109 .780
a. Predictors: (Constant), Structural Adaptations
b. Predictors: (Constant), Structural Adaptations, Size
c. Predictors: (Constant), Structural Adaptations, Size, Size*Structure

158
performance of the manufacturing SME firms in Kenya can be explained by structural
adaptations. The adjusted R2 show that when the constant is excluded from the study,
structural adaptations explain 19.2% of the total variation in performance. The value of
(r =.446, P < .001) in the table indicate a significant positive influence of structural
adaptations on the performance of the manufacturing small and medium firms and the
standard error of estimate (0.437) shows mean deviation of the predictor variable from
the line of best fit.
The second model introduced size of the firm into the relationship between structural
adaptations and performance of manufacturing small and medium firms. The change in
R2 from 19.9% to 20% is not significant (P = .725) implying that the introduction of size
in the model made the relationship between structural adaptation and performance of
SME manufacturing firms insignificant. The third model also shows that by introducing
the interaction term (size*structure) into the regression model, the relationship between
structural adaptations and performance of SME manufacturing firms became
insignificant.

159
Table 4.39: Moderating Effect of Size on Structure and Manufacturing SME
Performance: Regression Weights
Table 4.39 show that structural adaptations of the SME firm in all the three models
remains statistically significant with a P < .001. The introduction of size as a moderator
in model two and the introduction of the interaction terms (size*structure) in model three
did not improve the situation as both cases remained insignificant. This study therefore
concluded that the size of the firm is not a significant moderator of the influence of
structural adaptations on the performance of the SME firms in Kenya.
e) Moderating Effect of Age on Human Resource and Performance of the
Manufacturing SME
To test whether age of the firm influences the relationship between human resource
requirements and performance of manufacturing SME firms during strategy
Model Unstandardized
Coefficients
Standardized
Coefficients
t Sig.
B Std. Error Beta
1 (Constant) 3.754 .041 91.250 .000
Structural Adaptations .684 .130 .446 5.253 .000
2
(Constant) 3.747 .046 80.864 .000
Structural Adaptations .690 .132 .450 5.237 .000
Size .036 .103 .030 .352 .725
3
(Constant) 3.746 .047 80.457 .000
Structural Adaptations .719 .169 .469 4.252 .000
Size .328 1.050 .273 .313 .755
Size*Structure -.076 .271 -.243 -.279 .780
a. Dependent Variable: Performance
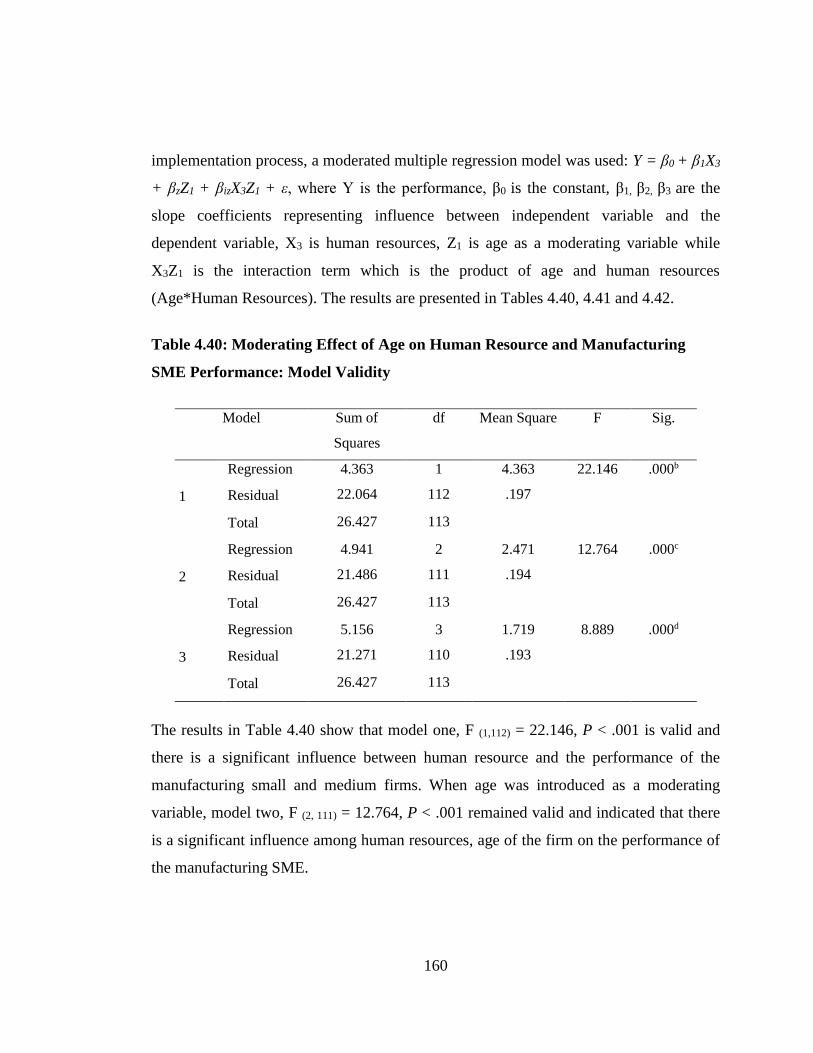
160
implementation process, a moderated multiple regression model was used: Y = β0 + β1X3
+ βzZ1 + βizX3Z1 + ε, where Y is the performance, β0 is the constant, β1, β2, β3 are the
slope coefficients representing influence between independent variable and the
dependent variable, X3 is human resources, Z1 is age as a moderating variable while
X3Z1 is the interaction term which is the product of age and human resources
(Age*Human Resources). The results are presented in Tables 4.40, 4.41 and 4.42.
Table 4.40: Moderating Effect of Age on Human Resource and Manufacturing
SME Performance: Model Validity
Model Sum of
Squares
df Mean Square F Sig.
1
Regression 4.363 1 4.363 22.146 .000b
Residual 22.064 112 .197
Total 26.427 113
2
Regression 4.941 2 2.471 12.764 .000c
Residual 21.486 111 .194
Total 26.427 113
3
Regression 5.156 3 1.719 8.889 .000d
Residual 21.271 110 .193
Total 26.427 113
The results in Table 4.40 show that model one, F (1,112) = 22.146, P < .001 is valid and
there is a significant influence between human resource and the performance of the
manufacturing small and medium firms. When age was introduced as a moderating
variable, model two, F (2, 111) = 12.764, P < .001 remained valid and indicated that there
is a significant influence among human resources, age of the firm on the performance of
the manufacturing SME.

161
When the interaction term (age*human resources) was added in the regression model,
the F statistics, F (3,110) = 8.889, P < .001 indicated that model three remained valid and
there is a significant influence among human resources, age of the firm, the interaction
term on the performance of manufacturing SME firm.
Table 4.41: Moderating Effect of Age on Human Resource and Manufacturing
SME Performance: Model Summary
The R2 in model one in Table 4.41 show that 16.5% of the total variation in performance
of the SME firms in Kenya can be explained by human resources. The adjusted R2 show
that when the constant is excluded from the study, human resources explain 15.8% of
the total variation in performance. The value of (r =.406, P < .001) in the table indicate a
significant positive influence of the attention to human resources on the performance of
the manufacturing small and medium firms and the standard error of estimate (0.444)
shows mean deviation of the predictor variable from the line of best fit.
The second model introduced age of the firm into the relationship between human
resources and performance of manufacturing small and medium firms. The change in R2
from 16.5% to 18.7% is not significant (P = .087) implying that the introduction of age
in the model made the influence of human resource on performance of SME
Model R R
Square
Adjusted
R Square
Std.
Error of
the
Estimate
Change Statistics
R
Square
Change
F
Change
df1 df2 Sig. F
Change
1 .406a .165 .158 .44385 .165 22.146 1 112 .000
2 .432b .187 .172 .43996 .022 2.988 1 111 .087
3 .442c .195 .173 .43974 .008 1.112 1 110 .294

162
manufacturing firms insignificant. The third model also showed that by introducing the
interaction term (age*human resource) into the regression model, the influence of
human resources on performance of SME manufacturing firms became insignificant (P
= .294).
Table 4.42: Moderating Effect of Age on Human Resource and Manufacturing
SME Performance: Regression Weights
Table 4.42 shows that attention to human resource requirements in the SME firm
remained significant only in the first and second model. When age of the firm was
introduced in the second model, it became insignificant (P = .987). When the interaction
term was introduced in model three all the variables became insignificant. This study
therefore concluded that the age of the firm is not a significant moderator of the
influence of human resource requirements on the performance of the SME
manufacturing firms in Kenya.
Model Unstandardized
Coefficients
Standardized
Coefficients
t Sig.
B Std. Error Beta
1 (Constant) 3.755 .042 90.334 .000
Human Resource .496 .105 .406 4.706 .000
2
(Constant) 3.634 .082 44.563 .000
Human Resource .459 .107 .376 4.302 .000
Age .165 .096 .151 1.729 .087
3
(Constant) 3.606 .086 42.072 .000
Human Resource .246 .228 .202 1.079 .283
Age .190 .098 .174 1.933 .056
Age*Human Resource .272 .258 .193 1.055 .217

163
f) Moderating Effect of Size on Human Resources and SME firm’s
Performance
To test whether size of the firm moderates the influence of human resources on the
performance of manufacturing SME firms during strategy implementation process, a
moderated multiple regression model was used: Y = β0 + β1X3 + βzZ2 + βizX3Z2 + ε,
where Y is the performance, β0 is the constant, β1, β2, β3 are the slope coefficients
representing influence between independent variable and the dependent variable, X3 is
human resources, Z2 is size as a moderating variable while X3Z2 is the interaction term
which is the product of size and human resources (size*human resources). The results
are presented in Tables 4.43, 4.44 and 4.45.
Table 4.43: Moderating Effect of Size on Human Resource and Manufacturing
SME Performance: Model Validity
Model Sum of
Squares
df Mean
Square
F Sig.
1
Regression 4.379 1 4.379 21.963 .000b
Residual 22.129 111 .199
Total 26.508 112
2
Regression 4.386 2 2.193 10.903 .000c
Residual 22.122 110 .201
Total 26.508 112
3
Regression 4.391 3 1.464 7.213 .000d
Residual 22.117 109 .203
Total 26.508 112
The results in Table 4.43 shows that model one, F (1,111) = 21.963, P < .001 is valid and
there is a significant influence of human resource on the performance of the
manufacturing small and medium firms. When size was introduced as a moderating
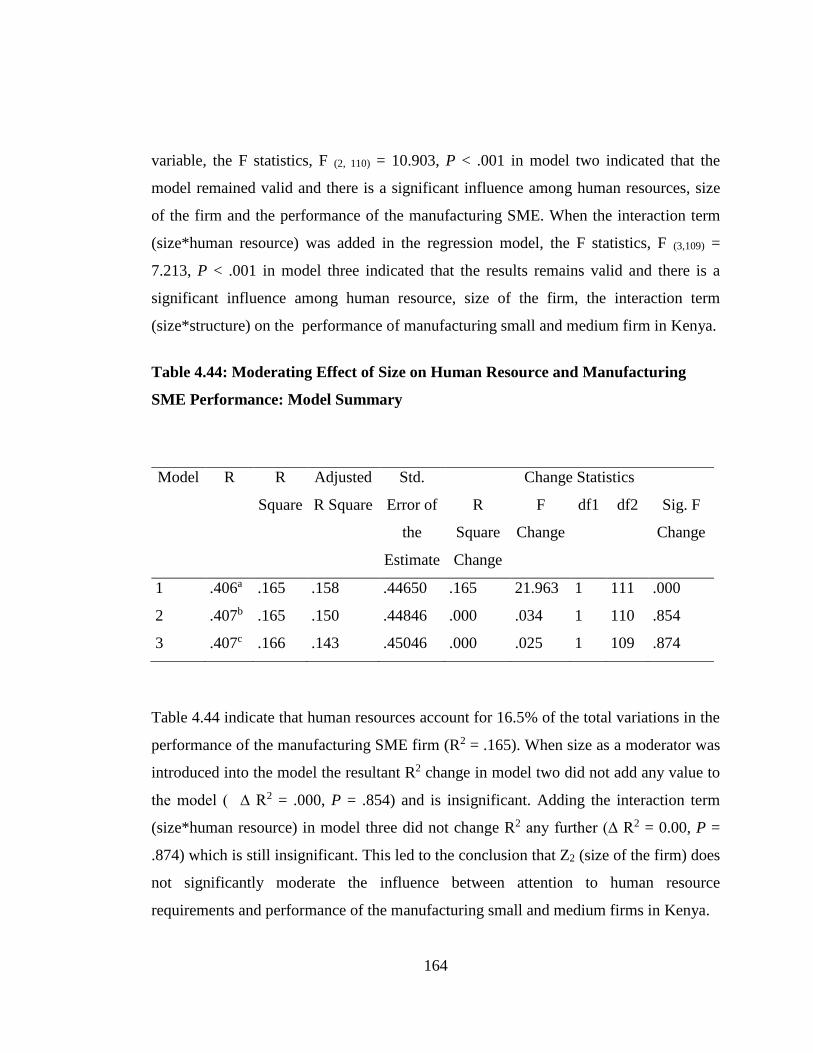
164
variable, the F statistics, F (2, 110) = 10.903, P < .001 in model two indicated that the
model remained valid and there is a significant influence among human resources, size
of the firm and the performance of the manufacturing SME. When the interaction term
(size*human resource) was added in the regression model, the F statistics, F (3,109) =
7.213, P < .001 in model three indicated that the results remains valid and there is a
significant influence among human resource, size of the firm, the interaction term
(size*structure) on the performance of manufacturing small and medium firm in Kenya.
Table 4.44: Moderating Effect of Size on Human Resource and Manufacturing
SME Performance: Model Summary
Table 4.44 indicate that human resources account for 16.5% of the total variations in the
performance of the manufacturing SME firm (R2 = .165). When size as a moderator was
introduced into the model the resultant R2 change in model two did not add any value to
the model ( ∆ R2 = .000, P = .854) and is insignificant. Adding the interaction term
(size*human resource) in model three did not change R2 any further (∆ R2 = 0.00, P =
.874) which is still insignificant. This led to the conclusion that Z2 (size of the firm) does
not significantly moderate the influence between attention to human resource
requirements and performance of the manufacturing small and medium firms in Kenya.
Model R R
Square
Adjusted
R Square
Std.
Error of
the
Estimate
Change Statistics
R
Square
Change
F
Change
df1 df2 Sig. F
Change
1 .406a .165 .158 .44650 .165 21.963 1 111 .000
2 .407b .165 .150 .44846 .000 .034 1 110 .854
3 .407c .166 .143 .45046 .000 .025 1 109 .874

165
Table 4.45: Moderating Effect of Size on Human Resource and Manufacturing
SME Performance: Regression Weights
Table 4.45 shows that attention to human resource requirements in the SME firm
remained significant (P < .001) in all the three models. When size of the firm, as a
moderator, was introduced in the second model, it became insignificant (P = .854).
When the interaction term (size* Human Resource) was introduced in the third model,
all the other variables, except human resource became insignificant. This study,
therefore, concluded that the size of the firm is not a significant moderator of the
influence between human resource requirements and performance of the SME
manufacturing firms in Kenya.
Model Unstandardized
Coefficients
Standardized
Coefficients
t Sig.
B Std. Error Beta
1 (Constant) 3.754 .042 89.368 .000
Human Resource .499 .106 .406 4.687 .000
2
(Constant) 3.758 .047 79.492 .000
Human Resource .499 .107 .406 4.663 .000
Size -.019 .105 -.016 -.185 .854
3
(Constant) 3.758 .047 79.139 .000
Human Resource .510 .130 .416 3.936 .000
Size -.020 .105 -.016 -.187 .852
Size*Human Resource -.037 .232 -.017 -.159 .874

166
g) Moderating Effect of Age on Technology and SME firm’s Performance
To test whether age of the firm influences the relationship between technology and the
performance of SME firms during strategy implementation process, a moderated
multiple regression model was used: Y = β0+β1X4+ βzZ1+βizX4Z1+ε, where Y is the
performance, β0 is the constant, β1, β2, β3 are the slopes, X3 is technology, Z1 is age as a
moderating variable while X4Z1 is the interaction term which is the product of age and
technology (age*technology). The results are presented in Tables 4.46, 4.47 and 4.48.
Table 4.46: Moderating Effect of Age on Technology and Manufacturing SME
Performance Model Validity
Model Sum of
Squares
df Mean
Square
F Sig.
1
Regression 6.036 1 6.036 33.151 .000b
Residual 20.392 112 .182
Total 26.427 113
2
Regression 7.301 2 3.651 21.187 .000c
Residual 19.126 111 .172
Total 26.427 113
3
Regression 7.970 3 2.657 15.832 .000d
Residual 18.458 110 .168
Total 26.427 113
The results in Table 4.46 shows that model one, F (1,112) = 33.151, P < .001 is valid
showing a significant influence of technology on the performance of the manufacturing
small and medium firms. When age of the firm was introduced as a moderating variable,
the F statistics, F (2, 111) = 21.187, P < .001 indicated that model two remained valid and
there is a significant influence among technology, age of the firm on the performance of
the manufacturing SME. When the interaction term (age*technology) was introduced in

167
the regression model, the new model, F (3,110) = 15.382, P < .001 remained valid
indicating a significant influence among technology, age of the firm, interaction term
(age*technology) on the performance of manufacturing SME firm in Kenya.
Table 4.47: Moderating Effect of Age on Technology and Manufacturing SME
Performance: Model Summary
Table 4.47 indicated that technology explains 22.8% of the total variations in the
performance of the manufacturing SME firm (R2 = 0.228). When age of the firm as a
moderator was introduced into the model, the resultant R2 change in model two
improved and added value to the model ( ∆ R2 = .048, P = .008) and is significant.
Adding the interaction term (age*technology) in model three improved the R2 further by
2.5% (∆ R2 = 0.025, P = .48) which is significant. This led to the conclusion that Z1 (age
of the firm) is a significant moderator of the influence between the level of technology
and performance of the manufacturing small and medium firms in Kenya.
Model R R
Square
Adjusted
R Square
Std.
Error of
the
Estimate
Change Statistics
R
Square
Change
F
Change
df1 df2 Sig. F
Change
1 .478a .228 .221 .42669 .228 33.151 1 112 .000
2 .526b .276 .263 .41510 .048 7.346 1 111 .008
3 .549c .302 .283 .40963 .025 3.983 1 110 .048

168
Table 4.48: Moderating Effect of Age on Technology and Manufacturing SME
Performance: Regression Weights
The results in model one Table 4.48 indicated that technology is a significant predictor
of manufacturing SME firm’s performance (β1 = .415, P < .001). With the introduction
of the moderating variable (age) in model two, both technology (β1 = .412, P < .001) and
age (β2 = .239, P = .008) became significant predictors of performance in manufacturing
SME firm. When the interaction term (age*technology) was introduced as shown in
model three, technology became an insignificant predictor of performance in
manufacturing SME firm (β1 = .086, P = .627) and its role was significantly taken up by
the interaction term (age*technology) (β3 = .384, P = .048).
Model Unstandardized
Coefficients
Standardized
Coefficients
t Sig.
B Std. Error Beta
1 (Constant) 3.754 .040 93.920 .000
Technology .415 .072 .478 5.758 .000
2
(Constant) 3.577 .076 47.200 .000
Technology .412 .070 .474 5.873 .000
Age .239 .088 .219 2.710 .008
3
(Constant) 3.574 .075 47.779 .000
Technology .086 .177 .099 .487 .627
Age .242 .087 .221 2.774 .007
Age*Technology .384 .193 .407 1.996 .048

169
To further investigate the moderation effect of age in the relationship between the
technology and performance of the manufacturing SME firm, a scatter diagram was
plotted and the results are presented in Figure 4.18.
Figure 4.18: Moderating Effect of Age on Technology and SME Performance
a. Discussion of Findings on the Moderating Effect of Age on the
Relationship between Technology and SME Performance
Technology is a dynamic capability that is embedded in the organization resources,
processes and configurations. Figure 4.18 showed that performance of SME
manufacturing firms in Kenya improves with the acquisition of additional technology or
with the improvements in technology. The moderated multiple regression results in
Table 4.48 had shown that age is a significant moderator of the relationship between
technology and SME performance.

170
The implications of these findings are that older firms are more advanced in technology
compared to young firms. This can be explained by the fact that older firms have been in
the market for some time and have learnt how to cope with technological changes as a
result of changes in the environment. They have also learnt the techniques of sensing
(Teece, 2014), innovating and configuring their technology in a way that ensures they
stay ahead of competition. Younger firms, on the other hand, learn these tricks with
time. Therefore, the age of the firm moderates the relationship between technology and
performance of SME firm.
h) Moderating Effect of Size on Technology and SME firm’s
Performance
To test whether size of the firm moderates the influence between technology and the
performance of manufacturing SME firms during strategy implementation process, a
moderated multiple regression model was used: Y = β0 + β1X4+ βzZ2+ βizX4Z2 + ε, where
Y is the performance, β0 is the constant, β1, β2, β3 are the slope coefficients representing
influence of independent variable on dependent variable, X3 is technology, Z2 is size as a
moderating variable while X4Z2 is the interaction term which is the product of size and
technology (size*technology). The results are presented in Tables 4.49, 4.50 and 4.51.

171
Table 4.49: Moderating Effect of Size on Technology and Manufacturing SME
Performance: Model Validity
Model Sum of
Squares
df Mean
Square
F Sig.
1
Regression 6.121 1 6.121 33.325 .000b
Residual 20.387 111 .184
Total 26.508 112
2
Regression 6.342 2 3.171 17.298 .000c
Residual 20.165 110 .183
Total 26.508 112
3
Regression 6.674 3 2.225 12.226 .000d
Residual 19.834 109 .182
Total 26.508 112
a. Dependent Variable: Performance
b. Predictors: (Constant), Technology
c. Predictors: (Constant), Technology, Size
d. Predictors: (Constant), Technology, Size, Size*Technology
The results in Table 4.49 shows that model one, F (1,111) = 33.325, P < .001 is valid
showing a significant influence of technology on the performance of the manufacturing
small and medium firms. When size of the firm was introduced as a moderating variable,
the F statistics, F (2, 110) = 17.298, P < .001 in model two remained valid indicating a
significant influence among technology, size of the firm on the performance of the
manufacturing SME. When the interaction term (size*technology) was introduced in
model three, the F statistics, F (3,109) = 12.226, P < .001 indicated that the new model
remained valid implying that there is a significant influence among technology, size of
the firm, interaction term (size*technology) on the performance of the SME
manufacturing firm.

172
Table 4.50: Moderating Effect of Size on Technology and Manufacturing SME
Performance: Model Summary
Table 4.50 indicated that technology explains 23.1% of the total variations in the
performance of the manufacturing SME firm (R2 = 0.231). When size of the firm as a
moderator was introduced into the model the resultant R2 change in model two added
little value to the model ( ∆ R2 = .008, P = .274) which was insignificant. Adding the
interaction term (size*technology) in model three slightly improved the R2 further by
1.3% (∆ R2 = .013, P = .180) which was still insignificant. This led to the conclusion
that Z2 (size of the firm) is not a significant moderator of the influence between the level
of technology and performance of the manufacturing SME firms in Kenya.
Model R R
Square
Adjusted
R Square
Std.
Error of
the
Estimate
Change Statistics
R
Square
Change
F
Change
df1 df2 Sig. F
Change
1 .481a .231 .224 .42857 .231 33.325 1 111 .000
2 .489b .239 .225 .42816 .008 1.209 1 110 .274
3 .502c .252 .231 .42657 .013 1.822 1 109 .180
a. Predictors: (Constant), Technology
b. Predictors: (Constant), Technology, Size
c. Predictors: (Constant), Technology, Size, Size*Technology

173
Table 4.51: Moderating Effect of Size on Technology and Manufacturing SME
Performance: Regression Weights
Table 4.51 shows that the level of technological requirements in the SME firm remained
significant (P <.001) in all the three models. When size of the firm, as a moderator, was
introduced in the second model, it became insignificant (P = .274). When the interaction
term (size*technology) was introduced in the third model, all the other variables, except
technology became insignificant. This study therefore concluded that the size of the firm
is not a significant moderator of the influence between technological requirements and
performance of the SME manufacturing firms in Kenya.
Model Unstandardized
Coefficients
Standardized
Coefficients
t Sig.
B Std. Error Beta
1 (Constant) 3.754 .040 93.113 .000
Technology .417 .072 .481 5.773 .000
2
(Constant) 3.777 .045 83.482 .000
Technology .428 .073 .494 5.876 .000
Size -.111 .101 -.092 -1.100 .274
3
(Constant) 3.774 .045 83.646 .000
Technology .363 .087 .419 4.172 .000
Size -.131 .102 -.109 -1.290 .200
Size*Technology .213 .158 .137 1.350 .180
a. Dependent Variable: Performance

174
i) Moderating Effect of Age on Strategic Direction and SME firm’s
Performance
A moderated multiple regression model was used to test whether age of the firm
moderates the influence between strategic direction and the performance of
manufacturing SME firms during strategy implementation process: Y = β0+β1X5+
βzZ1+βizX5Z1+ε, where Y is the performance, β0 is the constant, β1, β2, β3 are the slope
coefficients representing the influence of independent variable on the dependent
variable, X5 is strategic direction, Z1 is age as a moderating variable while X5Z1 is the
interaction term which is the product of age and strategic direction (age*strategic
direction). The results are presented in Tables 4.52, 4.53 and 4.54.
Table 4.52: Moderating Effect of Age on Strategic Direction and Manufacturing
SME Performance: Model Validity
Model Sum of
Squares
df Mean Square F Sig.
1
Regression .469 1 .469 2.023 .158b
Residual 25.958 112 .232
Total 26.427 113
2
Regression 1.736 2 .868 3.902 .023c
Residual 24.691 111 .222
Total 26.427 113
3
Regression 2.401 3 .800 3.664 .015d
Residual 24.026 110 .218
Total 26.427 113
a. Dependent Variable: Performance b. Predictors: (Constant), Strategic Direction c. Predictors: (Constant), Strategic Direction, Age d. Predictors: (Constant), Strategic Direction, Age, Age*Strategic Direction

175
The results in Table 4.52 show that model one, F (1,112) = 2.023, P = .158 is not valid for
further analysis. When age of the firm was introduced as a moderating variable, the F
statistics, F (2, 111) = 3.902, P = .023 in model two indicated that the new model became
valid showing a significant influence among strategic direction, age of the firm on the
performance of the SME. When the interaction term (age*strategic direction) was
introduced in model three, F (3,110) = 3.664, P = .015, the new model remained valid
showing significant influence among strategic direction, age of the firm, the interaction
term (age*strategic direction) on the performance of SME manufacturing firm.
Table 4.53: Moderating Effect of Age on Strategic Direction and Manufacturing
SME Performance: Model Summary
Table 4.53 indicate that strategic direction explains 1.8% of the total variations in the
performance of the manufacturing SME firm (R2 = 0.018). When age of the firm as a
moderator was introduced into the model the resultant R2 change in model improved and
added value to the model ( ∆ R2 = .048, P = .019) which was significant. Adding the
interaction term (age*strategic direction) in model three slightly improved the R2 further
Model R R
Square
Adjusted
R Square
Std.
Error of
the
Estimate
Change Statistics
R
Square
Change
F
Change
df1 df2 Sig. F
Change
1 .133a .018 .009 .48143 .018 2.023 1 112 .158
2 .256b .066 .049 .47164 .048 5.697 1 111 .019
3 .301c .091 .066 .46735 .025 3.045 1 110 .084
a. Predictors: (Constant), Strategic Direction
b. Predictors: (Constant), Strategic Direction, Age
c. Predictors: (Constant), Strategic Direction, Age, Age*Strategic Direction

176
by 2.5% (∆ R2 = 0.025, P = .084) which was still insignificant. This led to the
conclusion that Z1 (age of the firm) is not a significant moderator of the influence
between strategic direction and the performance of the manufacturing small and medium
firms in Kenya.
Table 4.54: Moderating Effect of Age on Strategic Direction and Manufacturing
SME Performance: Regression Weights
Table 4.54 shows that the emphasis on strategic direction in the SME firm remained
insignificant in all the three models. When age of the firm, as a moderator, was
introduced in the second model, it became significant (P = .019). When the interaction
term (age*strategic direction) was introduced in the third model, the model became
insignificant (P = .084). This study, therefore, concluded that the age of the firm is not a
Model Unstandardized
Coefficients
Standardized
Coefficients
t Sig.
B Std. Error Beta
1 (Constant) 3.756 .045 83.290 .000
Strategic Direction .152 .107 .133 1.422 .158
2
(Constant) 3.579 .086 41.511 .000
Strategic Direction .137 .105 .120 1.302 .196
Age .240 .101 .219 2.387 .019
3
(Constant) 3.567 .086 41.635 .000
Strategic Direction -.145 .192 -.127 -.755 .452
Age .249 .100 .228 2.499 .014
Age*Strategic
Direction
.399 .229 .293 1.745 .084
a. Dependent Variable: Performance

177
significant moderator of the influence of strategic direction on the performance of the
SME manufacturing firms in Kenya.
j) Moderating Effect of Size on Strategic Direction and SME firm’s
Performance
A moderated multiple regression model was used to test whether size of the firm
moderates the influence between strategic direction and the performance of
manufacturing SME firms during strategy implementation process: Y = β0+β1X5+
βzZ2+βizX5Z2+ε, where Y is the performance, β0 is the constant, β1, β2, β3 are the slope
coefficients representing influence of the independent variables on the dependent
variable, X5 is strategic direction, Z2 is size as a moderating variable while X5Z2 is the
interaction term which is the product of size and strategic direction (size*strategic
direction). The results are presented in Tables 4.55, 4.56 and 4.57.

178
Table 4.60: Moderating Effect of Size on Strategic Direction and Manufacturing
SME Performance: Model Validity
Model Sum of
Squares
df Mean
Square
F Sig.
1
Regression .466 1 .466 1.985 .162b
Residual 25.958 111 .235
Total 26.508 112
2
Regression .514 2 .257 1.088 .341c
Residual 25.994 110 .236
Total 26.508 112
3
Regression 2.969 3 .990 4.583 .005d
Residual 23.539 109 .216
Total 26.508 112
a. Dependent Variable: Performance
b. Predictors: (Constant), Strategic Direction
c. Predictors: (Constant), Strategic Direction, Size
d. Predictors: (Constant), Strategic Direction, Size, Size*Strategic Direction
The results in Table 4.55 show that model one, F (1,111) = 1.985, P = .162 is not valid for
further analysis. When size of the firm was introduced as a moderating variable in model
two, the F statistics, F (2, 110) = 1.088, P = .341 indicated that the new model is invalid.
When the interaction term (size*strategic direction) was introduced in model three, F
(3,109) = 4.583, P = .005 the new model became valid indicating significant influence
among strategic direction of the firm, size, the interaction term (size*strategic direction)
on the performance of manufacturing SME in Kenya.

179
Table 4.56: Moderating Effect of Size on Strategic Direction and Manufacturing
SME Performance: Model Summary
Table 4.56 indicate that strategic direction explains 1.8% of the total variations in the
performance of the manufacturing SME firm (R2 = 0.018). When size of the firm as a
moderator was introduced into the model the R2 improved by 0.2% meaning that size of
the firm as a moderator slightly improves the model (∆ R2 = .002, P = .652) which is in
significant. Adding the interaction term (size*strategic direction) in model three greatly
improved the R2 further by 9.3% (∆ R2 = .093, P = .001) and made it highly significant.
This led to the conclusion that Z2 (size of the firm) is a significant moderator of the
influence between the strategic direction and performance of the SME firms in Kenya.
Model R R
Square
Adjusted
R
Square
Std.
Error of
the
Estimate
Change Statistics
R
Square
Change
F
Change
df1 df2 Sig. F
Change
1 .133a .018 .009 .48437 .018 1.985 1 111 .162
2 .139b .019 .002 .48611 .002 .204 1 110 .652
3 .335c .112 .088 .46471 .093 11.367 1 109 .001
a. Predictors: (Constant), Strategic Direction
b. Predictors: (Constant), Strategic Direction, Size
c. Predictors: (Constant), Strategic Direction, Size, Size*Strategic Direction

180
Table 4.57: Moderating Effect of Size on Strategic Direction and Manufacturing
SME Performance: Regression Weights
The results in model one Table 4.57 indicate that strategic directions is not a significant
predictor of manufacturing SME firm’s performance (β1= .154, P = .162), with the
introduction of the moderating variable (size) in model two, both strategic direction (β1 =
.161, P = .148) and size (β2 = -.052, P = .652) became insignificant predictors of
performance in manufacturing SME firm. When the interaction term (size*strategic
direction) was introduced as shown in model three, the interaction term (size* strategic
direction) became a significant predictor of performance in manufacturing SME firm (β3
= .850, P = .001) and takes the role of moderating the influence between strategic
direction and performance of small and medium manufacturing firms in Kenya.
Model Unstandardized
Coefficients
Standardized
Coefficients
t Sig.
B Std. Error Beta
1 (Constant) 3.753 .046 82.372 .000
Strategic Direction .154 .109 .133 1.409 .162
2
(Constant) 3.764 .051 73.252 .000
Strategic Direction .161 .111 .139 1.456 .148
Size -.052 .115 -.043 -.452 .652
3
(Constant) 3.757 .049 76.427 .000
Strategic Direction -.033 .121 -.029 -.275 .784
Size -.126 .112 -.105 -1.124 .263
Size*Strategic
Direction
.850 .252 .357 3.371 .001
a. Dependent Variable: Performance

181
To further investigate the moderation effect of size on the relationship between strategic
direction and the performance of the manufacturing SME firm, a scatter diagram was
plotted and the results are presented in Figure 4.19.
Figure 4.19: Moderating Effect of Size on Strategic Direction and Performance
8. Discussion of Findings on the Moderating Effect of Size on the
Relationship between Strategic Direction and SME Performance
Figure 4.19 shows the interactions between strategic direction and performance of the
small and medium manufacturing SME firms. These interactions indicated that the size
of the firm has a moderating effect on the relationship between strategic direction and
performance of the manufacturing SME firm in Kenya.
The figure shows that the emphasis on strategic direction during strategy implementation
steadily improves the performance of medium sized firms. This is due to the fact that
these firms are well established and with time they have learnt the art of developing

182
clear visions, missions and goals that are in line with their strategies. On the other hand,
the small firms do not have well elaborate visions, mission and goals that are well
aligned in their work activities. A number of SME firms have strategic plans in place but
rarely emphasize them when they are implementing strategies or the plans are ambitious
or not well aligned with the work activities taking place in these firms.
As time goes by, the small manufacturing firms start to learn the art of strategy
alignment and fitness. As observed from the scatter gram, the small firm’s performance
decline with time as competition in the market intensifies. These firms, as they grow in
size, need to embrace strategic management practices in between the second and fourth
year of existence. The adoption of an appropriate strategic direction in form formulation
of a good vision, mission and goal/objectives is so crucial and critical for their future
survival before their fifth year of existence. These firms also need to formalize their
strategies as they grow in size for better management.
4.9.1 Moderation Effect of Age: Overall Model
A moderated multiple regression model (MMR) was used to test the moderation effect
of age in the relationship between strategy implementation variables and the
performance of small and medium manufacturing firms. The strategy implementation
variables were tested in a combined relationship and the findings are presented in Tables
4.58, 4.59 and 4.60. The following MMR model was used;
Y = β0 + β1X1 + β2X2 + β3X3 + β4X4 + β5X5 + βjZj + βijXiZj + ε
Where: Y= firm’s performance, β0 = constant, βi = coefficient of independent variable
Xi where i = (1, 2, 3, 4, 5), X1 – X5 = independent variables (leadership, structure, human
resources, technology and strategic direction), Zj = moderating variable (age/size) of the
firm, Xi Zj = interaction terms, j = (1, 2) ε = error term.

183
Table 4.58: Moderation Effect of Age in all variables: Model Validity
Model Sum of
Squares
df Mean
Square
F Sig.
1
Regression 7.724 5 1.545 9.110 .000b
Residual 18.145 107 .170
Total 25.869 112
2
Regression 8.320 6 1.387 8.337 .000c
Residual 17.548 106 .166
Total 25.869 112
3
Regression 9.569 11 .870 5.390 .000d
Residual 16.300 101 .161
Total 25.869 112
a. Dependent Variable: Performance
b. Predictors: (Constant), Strategic Direction, Structural Adaptations, Technology, Leadership
Styles, Human Resource
c. Predictors: (Constant), Strategic Direction, Structural Adaptations, Technology, Leadership
Styles, Human Resource, Age
d. Predictors: (Constant), Strategic Direction, Structural Adaptations, Technology, Leadership
Styles, Human Resource, Age, Age*Strategic Direction, Age*Human Resource,
Age*Leadership, Age*Technology, Age*Structure
The results in Table 4.58 show that model one, F (5,107) = 9.110, P < .001 is valid for
further analysis. When age of the firm was introduced as a moderating variable, the F
statistics, F (6, 106) = 8.337, P < .001 indicated that model two remained valid showing
significant influence among all the strategy implementation predictor variables, age of
the firm and performance of the manufacturing small and medium enterprises. When the
interaction term (Xi*Zj) was introduced, the new model three, F (11,101) = 5.390, P < .001
remained valid indicating significant influence among all strategic implementation
predictor variables, age of the firm, interaction term (Xi*Zj) on the performance of SME
manufacturing firm.

184
Table 4.59: Moderation Effect of Age: Model Summary
Table 4.59 indicate that all strategy implementation predictor variables explains 29.9%
of the total variations in the performance of the manufacturing SME firm (R2 = .299).
When age of the firm, as a moderator, was introduced into the model the R2 improved by
2.3% meaning that age of the firm slightly improved the model (∆ R2 = 0.023, P = .060)
but the model remained insignificant. Adding the interaction term (Z1*Xi) in model three
improved the R2 further by 4.8% (∆ R2 = .048, P = .182) which is still insignificant. This
led to the conclusion that Z1 (age of the firm) is not a significant moderator of the
influence between the strategy implementation and performance of the manufacturing
small and medium firms in Kenya.
Model R R
Square
Adjusted
R Square
Std.
Error of
the
Estimate
Change Statistics
R
Square
Change
F
Change
df1 df2 Sig. F
Change
1 .546a .299 .266 .41180 .299 9.110 5 107 .000
2 .567b .322 .283 .40688 .023 3.603 1 106 .060
3 .608c .370 .301 .40173 .048 1.547 5 101 .182
a. Predictors: (Constant), Strategic Direction, Structural Adaptations, Technology, Leadership Styles,
Human Resource
b. Predictors: (Constant), Strategic Direction, Structural Adaptations, Technology, Leadership Styles,
Human Resource, Age
c. Predictors: (Constant), Strategic Direction, Structural Adaptations, Technology, Leadership Styles,
Human Resource, Age, Age*Strategic Direction, Age*Human Resource, Age*Leadership,
Age*Technology, Age*Structure

185
Table 4.60: Moderation Effect of Age: Regression Weights
Model Unstandardized
Coefficients
Standardized
Coefficients
t Sig.
B Std. Error Beta
1
(Constant) 3.758 .039 96.600 .000
Leadership Styles .107 .109 .098 .979 .330
Structural Adaptations .308 .155 .200 1.982 .050
Human Resource .213 .134 .172 1.589 .115
Technology .276 .087 .316 3.182 .002
Strategic Direction -.176 .122 -.154 -1.449 .150
2
(Constant) 3.631 .077 47.298 .000
Leadership Styles .103 .108 .094 .950 .344
Structural Adaptations .262 .155 .170 1.689 .094
Human Resource .176 .134 .143 1.319 .190
Technology .300 .087 .343 3.464 .001
Strategic Direction -.174 .120 -.151 -1.445 .151
Age .171 .090 .158 1.898 .060
3
(Constant) 3.587 .086 41.829 .000
Leadership Styles -.053 .272 -.049 -.196 .845
Structural Adaptations -.158 .386 -.103 -.410 .683
Human Resource .357 .235 .289 1.522 .131
Technology .219 .254 .250 .863 .390
Strategic Direction -.310 .250 -.270 -1.240 .218
Age -2.012 1.627 -1.857 -1.237 .219
Age*Leadership .152 .297 .126 .513 .609
Age*Structure .572 .423 2.098 1.351 .180
Age*Human Resource -.355 .287 -.247 -1.235 .220
Age*Technology .131 .271 .138 .485 .629
Age*Strategic Direction .257 .289 .187 .892 .375
a. Dependent Variable: Performance

186
9. Discussion of Findings on Moderation effect of Age in the Relationship
between Strategy Implementation and SME Performance
Model one in Table 4.60 show that only constant (β0 = 3.758, P < .001), technology (β4
=.276, P = .002) and structural adaptations (β2 =.308, P = .050) are significant in a
combined MMR before moderation. When age of the firm (Z1) was introduced as a
moderator in model two, only constant (β0 = 3.631, P < .001) and technology (β4 = .300,
P = .001) remained significant. After introducing the interaction term (Z1*Xi) in model
three, only the constant (β0 = 3.587, P < .001) remained significant. This implies that
age, as a moderating variable, does not significantly improve the influence between
strategy implementation and performance of manufacturing SME firms in Kenya.
However, the study found some significant relationships on the moderation effect of age
among individual drivers of strategy implementation. For instance, the study established
that age of the firm significantly moderates the influence between leadership styles and
the performance of the manufacturing SME firms which is also true to technology.
Firm level characteristics related to size and age has been found in the past studies to
have a moderating effect on organizations performance (Anic, Rajh & Teodorovic,
2009; Hui, Radzi, Jenetabadi, Kasim, & Radu, 2013). Several studies in the past
examined the moderation effect of age on performance in organizations (Anic et al.,
2009; Hui et al., 2013; Yasuda, 2005). Hui et al. 2013, in a study entitled the impact of
age and size on the relationship among organizational innovation, learning and
performance in Asian manufacturing companies, confirmed that a relationship exist
between age of the firm with organizational learning, innovation and performance. The
study found out that age enables firms to develop organizational routines to be able to
perform their activities with more efficiency and better performance. Anic et al. (2009)
carried out a study involving firm level characteristics, strategic factors and firm
performance in Croatian manufacturing industry found out that high performing firms
were small and younger companies. Past studies shows a relationship between the age of

187
the firm and firm’s growth, failure and variability in growth decreases with age (Yasuda,
2005). Young firms are more flexible and dynamic and more volatile in their growth
compared to older firms. As the firm ages they are likely to become more stable in
growth, gain more knowledge and innovations, position itself better in the market,
develop a better structure that increases efficiency and help lower costs and are more
likely to have better investment plans. Most of these study shows that age is an
important variable that impact of organization’s performance but deviating from these
findings, this study did not establish a significant relationship between age of the firm
and performance. The study found out with proper structures and right technology small
firms could outdo medium firms in terms of performance.
vii) Test of Hypothesis Six (a):
H06a. The age of the firm has no significant influence on the relationship
between strategy implementation and performance of the manufacturing
SME firm
This hypothesis intended to test whether the age of the firm significantly moderates the
influence between strategy implementation and performance of small and medium
manufacturing firms or not. The hypothesis H06a: β1= 0 versus H6a: β1 ≠ 0 was tested.
The findings from the moderated multiple regression (MMR) in Table 4.60 show that
when age, as a moderating variable, was introduced in the model, only constant (β0 =
3.631, P < .001) and technology (β4 =.300, P = .001) remained significant and when the
interaction term, which is the product of age and the predictors of performance (Z1*Xi),
was introduced, all the strategy implementation variables became insignificant apart
from constant (β0 = 3.587, P < .001). This study, therefore, failed to reject H06a and
concluded that the age of the firm is an insignificant moderator of the influence between
strategy implementation and the performance of manufacturing SME in Kenya.

188
4.9.2 Moderation Effect of Size: Overall Model.
A moderated multiple regression model (MMR) was used to test the moderation effect
of size on the influence between strategy implementation variables and the performance
of small and medium manufacturing firms. The strategy implementation variables were
tested in a combined relationship and the findings are presented in Tables 4.61, 4.62 and
4.63. The following MMR model was used;
Y = β0 + β1X1 + β2X2 + β3X3 + β4X4 + β5X5 + βjZj + βijXiZj + ε
Where: Y= firm’s performance, β0 = constant, βi = coefficient of independent variable
Xi where i = (1, 2, 3, 4, 5), X1 – X5 = independent variables (leadership, structure, human
resources, technology and strategic direction), Zj = moderating variable (age/size) of the
firm, Xi Zj= interaction terms, j = (1, 2) ε = error term.

189
Table 4.61: Moderation Effect of Size in all Variables: Model Validity
The results in Table 4.61 shows that model one, F (5,106) = 9.177, P < .001 is valid for
further analysis. When size of the firm was introduced as a moderating variable, the new
model two, F (6, 105) = 7.617, P < .001, remained valid indicating significant influence
among all strategy implementation predictor variables, size of the firm on the
performance of the manufacturing small and medium enterprises. When the interaction
term (Xi*Z2) was added, the new model three, F (11,100) = 5.144, P < .001 remained valid
indicating significant influence among all the strategic implementation predictor
Model Sum of
Squares
df Mean
Square
F Sig.
1
Regression 7.838 5 1.568 9.177 .000b
Residual 18.107 106 .171
Total 25.945 111
2
Regression 7.868 6 1.311 7.617 .000c
Residual 18.077 105 .172
Total 25.945 111
3
Regression 9.375 11 .852 5.144 .000d
Residual 16.570 100 .166
Total 25.945 111
a. Dependent Variable: Performance
b. Predictors: (Constant), Strategic Direction, Structural Adaptations, Technology, Leadership Styles,
Human Resource
c. Predictors: (Constant), Strategic Direction, Structural Adaptations, Technology, Leadership Styles,
Human Resource, Size
d. Predictors: (Constant), Strategic Direction, Structural Adaptations, Technology, Leadership Styles,
Human Resource, Size, Size*Strategic Direction, Size*Human Resource, Size*Leadership,
Size*Technology, Size*Structure

190
variables, size of the firm, the interaction term (Xi*Z2) on the performance of
manufacturing SME firm.
Table 4.62: Moderation Effect of Size in all Variables: Model Summary
Table 4.62 indicate that all the strategy implementation predictor variables explains
30.2% of the total variations in the performance of the manufacturing SME firm (R2 =
.302). When size of the firm, as a moderator, was introduced into the model, the R2
improved by 0.1% meaning that the size of a firm slightly improved the model, (∆ R2 =
.001, P = .678), but the results were insignificant. Adding the interaction term (Xi*Z2) in
model three improved the R2 further by 5.8% (∆ R2 = .058, P = .116) but the model was
still insignificant. This led to the conclusion that Z2 (size of the firm) is not a significant
moderator of the influence between the strategy implementation and performance of the
manufacturing small and medium firms in Kenya.
Model R R
Square
Adjusted
R Square
Std.
Error of
the
Estimate
Change Statistics
R
Square
Change
F
Change
df1 df2 Sig. F
Change
1 .550a .302 .269 .41330 .302 9.177 5 106 .000
2 .551b .303 .263 .41492 .001 .173 1 105 .678
3 .601c .361 .291 .40706 .058 1.819 5 100 .116
a. Predictors: (Constant), Strategic Direction, Structural Adaptations, Technology, Leadership Styles,
Human Resource
b. Predictors: (Constant), Strategic Direction, Structural Adaptations, Technology, Leadership Styles,
Human Resource, Size
c. Predictors: (Constant), Strategic Direction, Structural Adaptations, Technology, Leadership Styles,
Human Resource, Size, Size*Strategic Direction, Size*Human Resource, Size*Leadership,
Size*Technology, Size*Structure

191
Table 4.63: Moderation Effect of Size: Regression Weights
Model Unstandardized
Coefficients
Standardized
Coefficients
t Sig.
B Std. Error Beta
1
(Constant) 3.758 .039 95.881 .000
Leadership Styles .107 .110 .098 .977 .331
Structural Adaptations .319 .157 .206 2.031 .045
Human Resource .208 .135 .167 1.546 .125
Technology .278 .087 .318 3.200 .002
Strategic Direction -.182 .123 -.157 -1.479 .142
2
(Constant) 3.767 .045 84.313 .000
Leadership Styles .113 .111 .103 1.017 .312
Structural Adaptations .305 .161 .197 1.893 .061
Human Resource .204 .135 .164 1.509 .134
Technology .285 .089 .326 3.209 .002
Strategic Direction -.179 .124 -.153 -1.438 .153
Size -.042 .102 -.036 -.416 .678
3
(Constant) 3.759 .044 84.868 .000
Leadership Styles .122 .131 .111 .935 .352
Structural Adaptations .388 .190 .251 2.043 .044
Human Resource .362 .156 .291 2.327 .022
Technology .186 .101 .213 1.829 .070
Strategic Direction -.305 .132 -.262 -2.310 .023
Size .219 1.455 .184 .150 .881
Size*Leadership -.351 .272 -.184 -1.287 .201
Size*Structure -.085 .378 -.273 -.224 .823
Size*Human Resource -.618 .334 -.285 -1.850 .067
Size*Technology .300 .273 .195 1.099 .274
Size*Strategic Direction .710 .380 .302 1.869 .065
a. Dependent Variable: Performance

192
10. Discussion of Findings on Moderation Effect of Size in the
Relationship between Strategy Implementation and SME Performance
Model one in Table 4.63 show that only the constant, (β0 = 3.758, P < .001), structural
adaptations (β2 =.319, P = .045) and technology, (β4 =.278, P = .002) are significant in a
combined MMR before moderation is performed. When size of the firm (Z2) was
introduced, as a moderator, in model two, only the constant (β0 =3.767, P < .001) and
technology (β4 =.285, P = .002) remained significant. After introducing the interaction
term (Xi*Z2) in model three, the constant (β0 = 3.759, P < .001), human resources (β3 =
.362, P = .022), strategic direction (β5 = -.305, P = .023) and structural adaptations (β2
=.388, P = .044) remained significant. The size of the firm (βz = .219, P = .881) and the
interaction term (Xi*Z2 = P > .05) became insignificant. This implies that the size of the
firm, as a moderator, does not significantly improve the influence between strategy
implementation and performance of manufacturing SME’s. However, the study found
significant relationships on the moderation effect of size among individual drivers of
strategy implementation. For instance, the study established that the size of the firm
significantly moderates the influence between firm’s emphasis on strategic direction and
the performance of the manufacturing SME firms in Kenya.
Several studies in the past have examined the influence of size on organization
performance (Anic, Rajh & Teodorovic, 2009; Hui, Radzi, Jenetabadi, Kasim, & Radu,
2013). Although firm size is a variable that is widely acknowledged to have an effect on
firm’s performance, the causal relationship between size and performance has yielded
mixed results in a number of studies. The findings in this study did not establish a
significant influence between size and performance of SME manufacturing firms in
Kenya. These findings are consistent with a study conducted by Capon, Farley and
Hoenig, (1990) which failed to establish a significant relationship between size in terms
of number of employees and firm’s performance. Other studies have found a positive
relationship between size and organizational performance (Lee & Giorgis, 2004; Ural &

193
Acaravci, 2006). Bigger firms are presumed to be more efficient than smaller ones. The
size helps in achieving economies of scale and therefore can afford to offer their
products in the market at lower prices. Large firms also have power to access capital
markets which give them more access to opportunities that are not available to small
firms (Amato & Wilder, 1985). Zumitzavan and Udchachone (2014) found that the
number of employees to be negatively related to performance of an organization
meaning that organizations with smaller number of employees may perform better than
those with large number of employees. While this study found no significant influence
between size of firm, strategy implementation and performance, it is evident from the
past findings that there are mixed results on the effects of size on performance of various
organizations.
viii) Test of Hypothesis Six (b):
H06b. The size of the firm has no significantly influence on the relationship
between strategy implementation and performance of the manufacturing
SME firm
This hypothesis intended to test whether the size of the firm significantly moderates the
influence between strategy implementation and performance of small and medium
manufacturing firms or not. The hypothesis H06b: β1= 0 versus H6b: β1 ≠ 0 was tested.
The findings from the moderated multiple regression (MMR) showed that when size, as
a moderating variable, was introduced in the model, only constant (β0 = 3.767, P < .001)
and technology (β4 =.285, P = .002) remained significant and when the interaction term,
which is the product of size and the predictors of performance (Z2*Xi), was introduced,
size (βz = .219, P = .881) and the interaction term (P > 0.05) are insignificant. This
study, therefore, failed to reject H06b and concludes that size of the firm is an
insignificant moderator of the influence between strategy implementation and the
performance of manufacturing SME firms in Kenya.

194
Table 4.64: Summary of Moderation Effects: Hypotheses Tested
No. Moderating Variable (s) F-Change P-Value Deduction
H06a
Age*All variables &Performance
1.547
.182
Fail to reject H06a
H06b Size*All variables &Performance 1.819 .116 Fail to reject H06b
H06a1 Age*Leadership styles & Performance 4.705 .032 Reject H06a1
H06b1 Size*Leadership styles & Performance 1.258 .265 Fail to reject H06b1
H06a2 Age*Structure & Performance 3.832 .053 Fail to reject H06a2
H06b2 Size*Structure & Performance .078 .780 Fail to reject H06b2
H06a3 Age*Human Resource & Performance 1.112 .294 Fail to reject H06a3
H06b3 Size*Human Resource & Performance .025 .874 Fail to reject H06b3
H06a4 Age*Technology & Performance 3.983 .048 Reject H06a4
H06b4 Size*Technology & Performance 1.822 .180 Fail to reject H06b4
H06a5 Age*Strategic Direction & Performance 3.045 .084 Fail to reject H06a5
H06b5 Size, Strategic Direction & Performance 11.367 .001 Reject H06b5
4.9.3 Qualitative Data Analysis
For triangulation purposes, the open ended questions asking the respondent’s their
perception on various constructs were analyzed using the computer aided content
analysis (Berelson, 1952). Content analysis is an objective technique that ensures
systematic, quantitative description and communication of information. The technique
detects the presence of certain words, concepts, themes, phrases, characters, or sentences
within texts and quantifies them in an objective manner. The results were summarized in
Tables 4.65, 4.6 and 4.67.

195
Table 4.65: How to Improve Awareness of the Firm’s Strategic Direction
Statement Responses Percent of
Cases N Percent
Involve them in the planning 33 26.2% 31.4%
Giving them the necessary information towards
the strategic direction
31 24.6% 29.5%
Regular meetings with them 19 15.1% 18.1%
Frequently revising goals and objectives 11 8.7% 10.5%
Educating employees through in-house training 5 4.0% 4.8%
Give circulars reminding them about the targets
of the organization
4 3.2% 3.8%
The study findings in Table 4.65 indicated that the respondents felt that in order to
improve the employee’s awareness of the strategic direction of the firm, the
manufacturing SME firm need to involve employees in the planning and strategy
formulation process (31.4%), give them necessary information in regard to the direction
the organization is focused on (29.5%), the SME firm need to arrange regular meetings
where all the employees participates in strategy formulation and implementation
(18.1%). The respondents perceived the ability of the organization to frequently revise
her goals and objectives as an important factor that creates the awareness of strategic
direction of the firm (10.5%), the SME firm need to conduct in-house trainings in order
to educate the employees on the need to be focused on the vision, mission and the goals
of the organization (4.8%) and there is need for the organization to give more
information in form of circulars to remind them of the targets they are supposed to
achieve (3.8%).

196
These findings confirms the observations made in this study that strategic direction is an
important factor that is embedded in other variables influencing strategy implementation
efforts in manufacturing SME firms like leadership styles, structure, technology and
human resources. When leaders and other stakeholders in a SME’s are aware of the
strategic direction of the firm, they are able to choose leadership styles that match their
strategy requirements, secure both physical and human resources required to facilitate
the organization move along her established mission, vision and goals. These findings
concur with the observation made by Lumpkin and Dess (1996) that the relationship
between strategic orientation and organizational performance is influenced by many
third-party variables.
Table 4.66: Areas in Human Resources the SMEs need to improve on
Statement Responses Percent of
Cases N Percent
Rewards and incentives should always be based
on merit
41 23.4% 38.0%
Training employees to improve their skills 28 16.0% 25.9%
Ensure proper induction 18 10.3% 16.7%
Hire enough staff in the organization 15 8.6% 13.9%
Encourage employees to show their
competence among their peer groups
14 8.0% 13.0%
Take care of employee's welfare 13 7.4% 12.0%
Staff motivation, mentally and financially 9 5.1% 8.3%
Promotion of staff 5 2.9% 4.6%

197
The respondents, as shown in Table 4.66, felt that the manufacturing SME firms need to
motivate their employees both mentally and financially (8.3%), take care of their welfare
(12.0%), promote them (4.6%) and base their rewards and incentives on merit and the
performance of an individual employee (38%). A lot of emphasis also needs to be
placed on training (25.9%) and induction of staff (16.7%) to ensure they have adequate
knowledge and skills and are aware of what they are supposed to do. The organization
should also ensure that there is adequate number of staff (13.9%) who should work in
teams sharing their experiences and show casing their experiences and competences
among their peer groups (13.0%).
These findings are consistent with the results in Tables 4.5 and 4.19 which indicate that
the attention to human resources positively and significantly improves the performance
of the SME firms. They also concur with the works of other contemporary scholars who
found that attention to human resources has a positive and significant influence on
organization’s performance (Amin et al., 2014; Cho et al., 2006; Olrando & Johnson,
2001; Osman, & Galang, 2011; Wong et al., 2013; Wright et al., 2003).

198
Table 4.67: Areas in Technology the SMEs need to improve on
Most of the respondents as shown in Table 4.67 felt that SME firms need to improve on
their levels of technology (47.7%), allocate research funds (7.5%) and conduct
researches on a regular basis (21.5%). The firms need to increase the number of
machines in place (8.4%), improve their ICT systems (9.3%) and ensure that the firm
uses technology in communicating to both employees and customers. Moreover, the
respondents felt that there is a need for the SME organizations to have a technology
audit committee (11.2%) that keep track on the current and future technology
requirements. These findings are in line with the results in Table 4.20 which indicated
that technology is an important factor that positively and significantly related to the
performance of the SME manufacturing firms.
Statement Responses Percent of
Cases N Percent
Improve the level of technology
51
37.5%
47.7%
Conduct research regularly 23 16.9% 21.5%
Allocate funds for research 8 5.9% 7.5%
Should have a technology audit committee 12 8.8% 11.2%
Use technology in communication 8 5.9% 7.5%
Improve ICT Systems 10 7.4% 9.3%
To increase the number of machines in the
organization
9 6.6% 8.4%

199
The findings on technology this study is in line with earlier scholars who attempted to
link technology to superior performance in organizations (Bell & Pavitt, 1995; Nohria &
Gulati, 1996; Reichert et al., 2012; Trez et al., 2012).

200
CHAPTER FIVE
SUMMARY, CONCLUSION AND RECOMMENDATIONS
5.1 Introduction
This chapter presents summary of the study findings guided by the specific objectives in
chapter one. Conclusions and recommendations are also given for future action and
research direction.
5.2 Summary
The purpose of this study was to establish the influence of strategy implementation has
on the performance of small and medium manufacturing firms in Kenya moderated by
the firm level characteristics of age and size. In particular, the study was designed to
determine how the attention to leadership styles, structural adaptations, attention to
human resources, level of technology and emphasis on the strategic direction is related
to the performance of the manufacturing SMEs firms in Kenya.
5.2.1 To determine whether attention to leadership styles influences the
performance of the SME firm in Kenya
A leadership skill is one of the most important dynamic capabilities required by firms
operating in a dynamic environment to drive superior performance (Teece, 2014). This
study investigated the relationship between leadership styles and performance of
manufacturing SME firms in Kenya. Three Leadership styles investigated included the
transformational, transactional and passive/avoidant behaviour based on Avolio and
Bass definitions (2004).

201
The transformational leadership style is the process in which leaders change their
associates’ awareness of what is important, and move them to see themselves and the
opportunities/challenges of their environment in a new way. These leaders proactively
seek to optimize organizational innovation and development at individual, group and
organizational levels. Secondly, the transactional leadership style exhibits behaviors
associated with constructive and corrective transactions. The constructive style is labeled
Contingent Reward while the corrective style is labeled Management-by-Exception.
Transactional leadership defines expectations and promotes performance to achieve
these levels and thirdly, the passive/avoidant leadership style is more quiet and reactive
in nature. It does not respond to situations and problems systematically and has a
negative effect on desired outcomes expected by the leaders. It is similar to laissez-faire
leadership.
The results from this study indicated that leadership style significantly and positively
influences the performance of the manufacturing SME firms in Kenya. This implies that
the performance of the firm improves significantly when the CEOs and the owners adopt
better leadership styles. This finding concurs with observations and conclusions made by
earlier scholars that organization’s leadership is an important factor that leads to superior
performance in a dynamic environment. Therefore, the role of organization’s leadership
in owning up, steering and driving forward strategy implementation efforts is such a
crucial and critical factor to the success of a firm in a dynamic and turbulent
environment .
The findings are also in agreement with the arguments in the DCV framework that firms
with superior performance exhibit strong leadership skills among other dynamic
capabilities. Leadership skills are tacit and dynamic in nature making it difficult for
other firms to acquire or imitate. The evidence from this study, on the significance of
leadership styles supports the Dynamic Capabilities View’s argument that leadership is a
strong dynamic capability that leads to superior performance.

202
Finally, this study also revealed that most of the owners and the CEOs of the
manufacturing firms in Kenya exhibits transactional leadership style followed by
transformational leadership and lastly passive/avoidant leadership behaviour. The study
further indicated that the transformational leadership style is the best in Kenyan
manufacturing SME set up and relates with performance positively and significantly.
Transactional and passive/avoidant leadership styles are both statistically insignificant in
a combined relationship.
5.2.2 To establish whether structural adaptations influences the performance of
the SME firm in Kenya
A firm’s structure is an important dynamic capability that influences the strategy
implementation efforts of the firm and leads to superior performance. The success of an
organization does not only depends on how well and quickly a firm adapts a structure
that fits the environmental changes but also how well a firm’s business strategy is
matched to its structure and the behavioral norms of its employees.
The three main dimensions along which organizations tend to follow in their structural
adaptation efforts are formalization, centralization and specialization. The formalization
refers to the degree in which the firm has official policies, rules, regulations, and
procedures. A business firm may have a formal structure, but may choose to operate
informally. Centralization is the degree to which decisions are made at the top of the
organization while specialization is the degree to which jobs are narrowly defined to a
particular unique expertise.
The findings in this study revealed that the structural adaptations of the manufacturing
SME firm positively and significantly influences her performance. This implies that the
owners, CEOs or other SME leaders who are able frequently revise and adjust their
structural configurations in relation to the environmental changes or adapt structures that
support strategy implementation efforts help their organizations to achieve better results.

203
These findings confirms the works of Alfred Chandler who contended that an
organization structure must follow her strategy for better performance, Burns and
Stalker who observed that firms will adopt a structure in relation to the environment they
are operating in.
This study found out that structures adopted by the manufacturing SME firms in Kenya
are highly specialized, formalized and centralized respectively. On the other hand,
results indicated that formalized and specialized structures both relates positively and
significantly to the firm’s performance while the centralized structures in a combined
relationship is insignificant.
5.2.3 To determine whether attention to human resources influences the
performance of the SME firm in Kenya
Organizations require people in every stage of the strategy implementation process since
they will not be able to perform well without quality and resourceful people. The
Resource Based View supports this view by recognizing that human resources provides
the firm with an important asset that, when well used, can lead to superior performance
and or a competitive advantage. Although human resource is not a dynamic capability
that gives the firm a direct advantage and uniqueness in the industry, the SME
organizations can gain competitiveness and perform well in strategy implementation by
building strong capacities and capabilities in people. This is done better when there is
adequate skills development, strong policies and procedures, clear targets, motivation
and when leadership are able to foster confidence among their employees. Dynamic
capabilities in people can be developed through injecting new knowledge and skills and
continuous improvement in human resources through training and development
initiatives.
This study provided statistical evidence that attention to human resource requirements
during strategy implementation by the SME’s firm’s leadership is positively and

204
significantly influences the manufacturing SME’s performance. This finding supports
the works of a number of contemporary scholars cited in the literature who concluded
that management of HR impacts positively on the performance of an organization.
5.2.4 To establish whether attention to technological requirements influences the
performance of SME firm in Kenya
The Dynamic Capability framework views technology as a dynamic capability that is
embedded in firm’s practices and is essential in determining the competitiveness and
performance of a firm in a dynamic and turbulent environment. A firm with strong
dynamic capabilities exhibits technological agility creates new technologies,
differentiate itself and maintain superior processes. A review of literature concluded that
most scholars in strategic management have identified three major drivers that drive
superior performance in organizations today. These drivers are leadership styles,
structure and human resources. This study investigated whether in addition to the three,
technology is a key driver.
This study found statistical evidence that attention to technological requirements by the
manufacturing SME’s leaders positively and significantly influences the performance of
the manufacturing SME firm in Kenya. The bivariate correlation results among all
variables in this study showed that technology had the highest correlation coefficient
meaning that it scored better compared to other predictors of performance. Based on this
evidence, this study finds technology as a major driver that relates positively with the
performance of the manufacturing SME firm. This finding in line with prior studies on
the role of technology in determining firm’s performance. It also further strengthens the
DCV’s argument that technology is an important dynamic capability required by firms
for superior performance and competitive advantage.
205
5.2.5 To determine whether firm’s emphasis on the strategic direction influences
the performance of SME firm in Kenya
The strategic direction of the firm is often embedded in its strategic vision and mission
statements. The strategic vision and mission of the firm is the first step in formulating
and implementing strategies. The firm’s strategic vision provides the logical reason for
future plans and directions of the organization. It aims the organization in a particular
direction while providing a long term strategic direction to follow in line with the
aspirations of shareholders. The strategic direction of the firm in this study was
considered as an important variable that guides the actions and activities in the entire
strategic management processes.
Before a strategy is implemented, the firm’s leadership works hard to create the
awareness among all employees of the direction the organization is headed to and how
the organization stakeholders are going to benefit from the implementation of a new
strategy. The efforts are meant to create a shared vision among all stake holders about
the benefits of the new strategy. This step is very crucial before and during the strategy
implementation process.
The study results found that there is no direct influence of the emphasis of the strategic
direction of the firm during strategy implementation on the performance of
manufacturing SME’s in Kenya. However, in the absence of a significant influence, the
study further established that the role of strategic direction during strategy
implementation stage is often taken up by other predictor variables that include
leadership styles, structural adaptations, human resources and technology. This finding
is not surprising since awareness of the strategic direction on its own without the
presence of other variables and resources to implement the formulated strategy cannot
achieve any results. Liu and Fu (2011) noted that several studies, in the past, that
attempted to link strategic direction and performance yielded mixed results. This study

206
is, therefore, consistent with Liu and Fu (2011) and the observations made by other
earlier scholars who did not establish any significant link between strategic directions
and firm performance.
5.2.6 To establish whether the firm level characteristics (age and size) moderates
the influence between strategy implementation and performance SME
manufacturing firms in Kenya
Firm level characteristics related to size and age has been found, in the past studies, to
have a moderating effect on organizations performance. The age of the firm was broken
down into two categories where those firms whose age fall below 5 years were classified
as young while those aged 5 years and above were classified as old firms. The size of the
firm was also classified into two categories based on the definitions of SME’s according
to World Bank (IFC, 2012) where firms with less than 50 employees were classified as
small and those with over 50 employees were classified as medium enterprises.
This study failed to establish any significant moderation effect of the firm level
characteristics (age and size) on the influence between strategy implementation and
performance of the manufacturing small and medium firms in Kenya. However, this
study found significant influence on the moderation effect of age and size among the
individual drivers. For instance, the study established that age of the firm significantly
moderates the influence between leadership styles and the performance of the
manufacturing SME which is also true with technology. On the other hand, the size of
the firm significantly moderates the influence between emphasis on strategic direction
and the manufacturing SME’s performance. Therefore, the findings in this study on the
moderation effect of age deviated from number of studies in the past while the results on
the moderating effect of size was consistent with a number of studies which posted
mixed results.

207
5.3 Conclusion
This study found a positive and significant influence of leadership styles on the
performance of the manufacturing SME firms in Kenya. It therefore, follows that the
SME manufacturing firms’ leadership needs to enhance, foster and vary their dynamic
capabilities with respect to leadership skills to suit the ever changing demands in the
society. These changes should be well aligned with the changes taking place in the
competitive and dynamic environment these firms find themselves in today.
The SME leadership that endeavors to foster and improve their leadership skills and
consequently apply these skills during strategy implementation helps their firms to
achieve better results. Since majority of manufacturing SME firms in Kenya practices
transactional leadership style, the study concludes that leaders in these firms should start
by practicing transactional leadership style and progressively change to transformational
style. Transformational leadership style posted better results in this study than
transactional or passive/avoidant styles.
Secondly, the study also found that a positive and significant influence exists between
structural adaptations of the manufacturing SME firm and its performance. It can be
concluded that the structural adaptations of the firm is an important variable that
explains, to a greater extent, the variations in firm’s performance. This means that those
SME firms that are able to adapt their structures in line with the changes in the
environment or adapt structures that support their strategy are able to achieve superior
performance. Therefore the SME firms should always endeavor to properly fit or match
their structures to the requirements of the strategy.
Based on the findings of this study, it can be concluded that among the specific
structural dimensions of the SME firm, formalization and specialization plays an
important role in determining better performance. Centralization, on the other hand, is

208
not significant. In order to perform better, these firms need to move away from
centralization and adopt more of the formalized and specialized structures.
Thirdly, this study revealed that a significant positive influence exists between attention
to human resource requirements during strategy implementation and the performance of
the manufacturing SME’s in Kenya. From this finding, it can be concluded that those
firms that give information and trains staff on important issues of the strategy performs
better. Leaders in these firms need to be in the forefront in demonstrating how to
implement the new strategy and motivate employees through incentives upon achieving
the set targets. Employees also need to be given an opportunity to make their individual
contributions and suggest how strategy implementation efforts can be made better. On
the other hand, leaders should match their strategy requirements with human resource
needs, set targets and give timely feedback. Finally, make sure that performance
appraisals are unbiased and promotion is given on merit basis based on objectives
achieved.
Fourthly, the findings from this study revealed that there is a positive and significant
influence of technology on the SME firm’s performance. This implies that for the
manufacturing SME firms to perform better they need to do the following; update their
technology regularly, provide new and better knowledge to employee and give adequate
tools, machine and equipments to their employees. These firms should also conduct
researches regularly to update their production quality and be responsive to the changes
in technology. They should be able to match their technological requirements to the
changes in the environment or the needs of the strategy being implemented. From the
evidence given by this study, it can also be concluded technology is a major driver
influencing strategy implementation and performance of SME manufacturing firms.
Fifthly, this study established that there is no direct influence of strategic direction on
the performance of manufacturing SME firm in Kenya. However, this study provided

209
statistical evidence from the bivariate correlations results that the role of strategic
direction is played by other predictor variables during strategy implementation. Since
the firm’s strategic direction is embedded on other factors influencing performance, it
can be concluded that the strategic direction of an organization, as documented in
strategic plans, is an important variable to be considered during implementation. It
guides actions and how activities are done.
The leadership in these firms must ensure that all employees are aware of the direction
the firm. They also need to realize that knowledge of the strategic direction alone does
not lead to superior performance and therefore, the need to provide requisite human and
non-human resources as per the needs of the new strategy being implemented. They
should also be at the forefront in driving the entire strategy implementation process
forward.
Lastly, this study failed to establish any significant moderation effect of the Firmlevel
characteristics (age and size) on the influence between strategy implementation and the
performance of manufacturing SME firms. It can therefore be concluded that the age and
size of a firm are not important when it comes to strategy implementation. All firms,
whether young or old, small, medium or large in size, should engage and participate in
strategy implementation. Also the study concluded that success in business initiatives
cannot be pegged to age or size. Any firm can succeed in strategy implementation efforts
and achieve superior performance whether young or old, large or small so long as proper
attention is given to leadership, structure, human and non-human resources and
technology.
5.4 Recommendations
This study recommends that the manufacturing SME firms should build more and
stronger capacities in leadership skills. The owners, CEOs and other leaders need
additional knowledge on various leadership styles that can be used to promote better

210
performance in their firms. The study found out that leadership skill, as a dynamic
capability, guarantees superior performance. This is in line with the recommendations
from the literature in management.
Secondly, the owners, CEOs and other leaders in the SME firms should adopt more of
the transformational leadership qualities that endeavor to build trust, confidence and
attracting following. The style raises expectations and beliefs concerning the
mission/vision of the firm and challenges old assumptions and stimulates idea
generation. It determines individual needs and raises them to highest levels.
Thirdly, the manufacturing SME firms should maintain flexible structures that are well
matched to the structural needs of the strategy being implemented at any given time.
Secondly, these firms need to move away from centralized structures and embrace more
of a decentralized structure while maintaining specialized and formalized procedures.
Fourthly, the manufacturing SME firms need to maintain a proper balance between
strategy and the human resource requirements. Leaders in these organizations should
ensure that tasks are well defined, there are adequate personnel, staffs are properly
motivated and incentives are given to encourage people to work harder. They should
also maintain proper systems of recruitment, remuneration, appraisal and promotion of
staff. The study revealed that proper attention to human resource requirements is
significantly related with the performance of manufacturing SME firms. The SME firms
also need to pay close attention to their technology levels during strategy
implementation and maintain a proper balance between the strategy implementation and
the technological needs. This study revealed that Technology is one of the most
important drivers of strategy implementation and performance. The manufacturing SME
leadership needs to ensure there are adequate tools, machines and equipments and
continuously scan the environment for changes in technology and respond to these

211
changes quickly. Another area which needs to be considered is research and innovation,
as it brings new ideas, methods and products which enable the firm to do better.
Finally, since the role of the strategic direction is played by other variables in strategy
implementation, it implies that, the strategic plan is such an important document that
houses the intended direction for the future and how the objectives are to be achieved. It
is recommended that the manufacturing SME firms should play an active role and ensure
they develop strategic plans in line with the available resources. Leaders should always
show commitment and be in the forefront successfully driving the strategy
implementation process forward in line with their strategic plans.
5.5 Areas for Further Research
The findings of the study, as summarized in the previous section have several
implications for theory, methodology and practice.
5.5.1 Theoretical Studies and Academic Implications
The Dynamic Capability View of the firm (DCV) views dynamic capabilities as a
unique source of superior performance and competitive advantage. The leadership
styles, structure of the firm and technology in this study are dynamic capabilities which
have been found to be significant in influencing manufacturing SME firm’s performance
in a developing country. Most of the studies in the application of DCV have been
conducted in western world and the findings from this study provide useful insights on
the applicability of the theory in a developing country.
The results from this study contribute to the existing stock of knowledge in the literature
by providing experience of strategy implementation in SME in manufacturing sector in a
developing country (Kenya). Many studies in strategic management have tended to

212
ignore strategy implementation stage in the strategic management process. Therefore,
the findings from this study have contributed in filling this gap of knowledge.
The study has laid emphasis on three main drivers of strategy implementation often cited
in literature that is; leadership styles, structure and human resources. As an addition to
the existing body of knowledge, this study tested whether attention to technological
requirements is an important driver in a manufacturing setup. The results indicated that
technology is the most important driver among the rest three.
The study also tested the moderation effect of age and size on the relationship between
strategy implementation and performance of manufacturing SMEs. Although age was
found insignificant, it was found to moderate the individual predictors of performance
such as leadership styles and technology. Similarly, size was found to be insignificant in
overall moderation but it is significant in moderating the strategic direction of the
manufacturing SME firm.
Future studies should replicate this study in other sectors of the economy to establish
whether the study variables are applicable as well. More studies are needed to confirm
whether age and size of the firm has any moderating role on the influence between
strategy implementation and performance. Studies are needed to establish whether
emphasis on strategic direction has a direct influence on the performance in other
organizations.
5.5.2 Studies on Methods and Methodology Implications
This study was cross-sectional utilizing descriptive and quantitative designs. The study
relied on the information given based on the perceptions of the owners, CEOs and the
key leaders on the performance of the manufacturing SME firm. Unavailability of the
actual financial data is likely to have introduced some biasness in this study and hence to

213
increase the reliability of the findings, future studies should strive to obtain actual
financial records of these firms.
This study has developed a strategy implementation model. Future studies should
incorporate other drivers such as organization’s culture and further expand this model.
Since strategy implementation is a process which takes a long time, future studies should
also consider using a longitudinal approach and incorporate the experimental design to
capture the real “effect” “impact” or “influence”. This study only captured the perceived
influence but not real influence.
5.5.3 Practice and Policy Implications
The findings of this study indicate that manufacturing SMEs can improve their
performance by implementing their strategies properly and effectively.
On practice, small and medium manufacturing firms need to pay close attention to and
adopt better leadership styles, adapt their structures to the requirements of the new
strategy, balance the needs of the strategy to human resource requirements and ensure to
maintain a proper match between technology and the requirements of the strategy being
implemented.
On policy, the vision 2030 lays a lot of emphasis on the role of manufacturing SMEs as
engines of economic development in Kenya by the year 2030. To realize this dream, the
finding of this study implies that the government of Kenya needs to assist the small and
medium manufacturing firms by setting a strong policy framework that focuses on areas
like technology improvements, market of the SME products and capacity building
within this vital sector of the economy.

214
REFERENCES
Aaltonen, P., & Ikavalko, H. (2002). Implementing strategies successfully.” Integrated
Manufacturing Systems, 13(6), 415-418.
Abdullar, Z., Ahsan, N., & Alam, S. (2009). The effect of human resource management
practices on business performance among private companies in Malaysia. International
Journal of Business Management, 4(6) 65-72.
Ahmad, S., & Schroeder, R. (2003). The impact of human resource management practices on
operational performance: Recognising country and industry differences. Journal of
operations management, 21, 19-43.
Amato, L., & Wilder, R. (1985). The Effects of Firm Size on Profit Rates in U. S.
Manufacturing. Southern Economic Journal, 52(1) 181-190.
APA (2014). ETS standards for quality and fairness, AERA, Washington DC.
Amin, M., Ismail, W., Rasid, S., & Salemani, R. (2014). “The impact of human resource
management practices on performance: Evidence from a Public University". The TQM
Journal, 26(2), 125 – 142.
Anic, I., Rajh, E., & Teodorovic, I. (2009). Firm’s characteristics, strategic factors and firm
performance in the Croatian Manufacturing Industry. Ekonimski Pregled, 60(10) 413-
431.
Atalay, M., Anafarta, N., & Savan, F. (2013). The relationship between innovation and firm
performance: An empirical evidence from Turkish Automobile Supplier Industry.

215
Procedia-Social and behavioural Sciences, 75, 226-235. doi:
10.1016/j.sbspro.2013.04.026.
Atikiya, R. (2015). Effect of Competitve Strategies on the Performance of Manufacturing Firms
in Kenya; Unpublished Ph. D thesis, Jomo Kenyatta University.
Arthur, W. (2011). The nature of Technology: What it is and How it Evolves. Reprint edition,
Free Press, New York (USA).
Artz, K., Norman, P., Hatfield, D., & Cardinal, L. (2010). A longitudinal study of the impact of
R&D, patents, and product innovation on firm performance. Journal of Product
Innovation Management, 27(5) 725-740.
Athanasiou, Debas & Darzi (2010). Key Topics in Surgical Research & Methodology. Springer
DOI: 10.1007/978-3-540-71915-1.
Avolio, B., & Bass, B. (2004). Multifactor Leadership Questionnaire. Mind Garden, Inc., (17)
22-36.
Awino, Z. (2013). Strategic planning and competitive advantage of ICT small and medium
enterprises in Kenya. Business and Management Horizons J. 1(1).
Awino, Z., Wandera, R., Imaita, I., & K’Obonyo, P. (2009). Challenges facing the
implementation of differentiation strategy in the operations of the Mumia’s Sugar
Company. University of Nairobi Repository; uonbi.ac.ke/xmlui/bitstream/handle/11295/.
Aziz, R., Mahmood, R., & Abdullah, M. (2013). The effects of leadership styles and
entrepreneurial orientation on the business performance of SMEs in Malaysia. The IBEA
International Conference on Business, Economics and Accounting-Bangkok, Thailand.

216
Banks, J., Carson, J., & Nelson, B. (1996). Discrete-event system simulation. (2nd ed.). Upper
Saddle River, NJ: Prentice-Hall.
Barnat, R. (2012) . Introduction to Management. Available online: NOW: Design, n.d. Web. 12
Sep 2012. <http://www.introduction-to- management.24xls.com/en222>.
Banerjee, A., Chitnis, U., Jadhav, S., Bhawalker, J., & Chaudhury, S. (2009). Hypothesis
testing, type I and type II errors. Industrial Psychiatry Journal. 18(2) 127-131.
doi:10.4103/0972-6748.62274.
Barney, J. (1991). Firm Resources and Sustained Competitive Advantage. Journal of
Management. 17, 99–120.
Barney, J. (2001a). Is the resource-based view a useful perspective for strategic management
research? Yes. Academy of Management Review. 26, 41–56.
Barney, J. (2001b). Resource-based theories of competitive advantage: a ten year retrospective
on the Resource-Based View. Journal of Management. 27, 643–650.
Bass, B. & Aviolo, B. (1992). Multifactor Leadership Questionnaire--Short Form
6S. Binghamton, NY: Center for Leadership Studies. In B. M. Bass’s Measures for
Leadership Development Multifactor Leadership Questionnaire (MLQ). Retrieved May
6, 2015 from, http://www.uwec.edu/Ssow/Meares/Leadership-MLQ.htm.
Becker, B., & Gerhart, B. (1996). The impact of human resource management on organizational
performance: Progress and prospects. Academy of Management Journal. 39(4) 779 -801.
Beh, L., & Loo, L. (2013). Human resource management best practices and firm performance:
A universalistic perspective Approach. Serbian Journal of Management, 8 (2) 155-167.

217
Bell, M., & Pavitt, K. (1995). The development of technological capabilities. Trade,
Technology and International Competitiveness. Economic Development Institute of the
World Bank, 69-100.
Becheikh, N., Landry, R. & Amara, N. (2006). Lessons from Innovation Empirical Studies in
the Manufacturing Sector: A Systematic Review of the Literature from 1993–2003.
Technovation, 26(5/6) 644–64.
Bhagwat, R. & Sharma, M. (2007). Performance measurement of supply chain management
using the analytical hierarchy process, computers in industry. 18(8) 666-680.
Bielawska, A. (2016). Perceived mutual impact of strategy and organizational structure:
Findings from the high technology enterprises. Journal of Management & Organization;
22(5) DOI: http://dx.doi.org/10.1017/mo.2015.55.
Boone, H., & Boone, A. (2012). Analysing Likert data. Journal of Extension. 50(2). Available
online: http://www.joe.org/joe/2012april/pdf/JOE_v50_2tt2.pdf.
Bourgeois, L. & Brodwin, D. (1998). Linking planning and implementation. Wit, B. de/Meyer,
R. 682-691.
Bourgeois L., & Brodwin, D. (1984). Strategic Implementation: Five Approaches to an Elusive
Phenomenon. Strategic Management Journal, 5, 241-264.
Bowen, M., Morara, M., & Mureithi, S. (2009). Management challenges among small and
micro enterprises in Nairobi-Kenya. KCA journal of management, 2(1).
Bowman, C., & Ambrosini, V. (1997). Using Single Respondents in Strategy Research.
British Journal of Management, 8(2) 119-13.

218
Burgelman, R., & Rosenbloom, R. (1989). Technology Strategy: An evolutionary Process
Perspective. Research on Technological Innovation. Management of Technology J.
4(1989) 1-23.
Bunyasi, G., Bwisa, H., & Namusonge, G. (2014). Effect of entrepreneurial finance on growth
of small and medium enterprises in Kenya. European Journal of Business and
Management, 6 (31), 113 -123.
Burns, T., & Stalker, G. (1961). The management of innovation. London: Tavistock
Publications.
Bradford, A. (2015). What is a scientific hypothesis? Definition of a hypothesis. Available
online: http://www.livescience.com/21490-what-is-a-scientific-hypothesis-definition-
of-hypothesis.html.
Brenes, E., Mena, M., & Molina, G. (2007). Key success factors for strategy implementation in
Latin America. Journal of Business Research, 1-9.
Carter, T. & Pucko, D. (2010). Factors of effective strategy implementation: Empirical evidence
from Slovenian business practice. Journal for East European Management Studies,
15(3), 207-236.
Capon, N., Farley, J., & Hoenig, S. (1990). Determinants of financial performance: a meta-
analysis, Management Science, 10 (36): 1143-1159.
http://dx.doi.org/10.1287/mnsc.36.10.1143.
Chandler, A. (1962). Strategy and structure. Cambridge, MA: MIT Press.

219
Chen, D., & Stroup, W. (1993). General System Theory: Toward a Conceptual Framework for
Science and Technology: Education for All, Journal of Science Education and
Technology, 2 (7)
Cho, S., Woods, R., Jang, S. & Erdem, M. (2006). Measuring the impact of human resource
management practices on hospitality firm’s performances. Hospitality Management
Journal, 25(2) 262-277.
Chung, Y., Hsu, Y., Tsai, S., Huang, H., & Tsai, C. (2012). The correlation between Business
Strategy, Information technology, Organizational Culture, Implementation of CRM and
Business Performance in a high tech Industry. South African Journal of Industrial
Engineer. 23(2).
Combs, J., Crook, T., & Shook, C. (2005). The dimensionality of organizational performance
and its implications for strategic management research. In D. J. Ketchen (Ed.), Research
methodology in strategy and management, 2, 259-286.
Creswell, J. (2003). Research Design: Qualitative, Quantitative, and mixed method approaches.
2nd edition, Sage publications Inc. USA.
Creswell, J., & Plano C. (2011). Designing and conducting mixed methods research (2nd ed.).
Thousand Oaks, CA, Sage Publications.
Cronbach, L. (1951). Coefficient alpha and the internal structure of tests. Psychometrika, 22(3)
297-334.
CGK (2014). Local Authority Integrated Financial Operations Management Systems, County
government of Kiambu (Thika Sub County).
Damanpour, F. (1991). Organizational Innovation: a meta-analysis of effects of determinants
and moderators, Academy of Management Journal, 34, 555-590. doi: 10.2307/256406.

220
Daft, R. (1992). ‘Organization Theory and Design’, West St. Paul, MN
Dess, G., & Picken, J. (2000). Changing roles: Leadership in the 21st century. Organizational
Dynamics, 28(3) 18–33.
Drazin, R. & Howard, P. (1984) Strategy Implementation: A Technique for Organizational
Design, Columbia Journal of World Business, 19, 40-46.
Duncan, R. (1976). The ambidextrous organization: Designing dual structures for innovation in
R. H. Kilmann, L.R. Pondy & D.P. Slevin (Eds.), The management of organization:
Strategy and implementation, 1, 167-188.
Durbin, J., & Watson, G. (1950). Testing for Serial Correlation in Least Squares Regression, I.
Biometrika, 37(3–4): 409–428. doi:10.1093/biomet/37.3-4.409.
Durbin, J., & Watson, G. (1951). Testing for Serial Correlation in Least Squares Regression, II.
Biometrika, 38(1–2), 159–179. doi:10.1093/biomet/38.1-2.159.
EC (2003) Does Implementation Matter? Informal Administration Practices and Shifting
Immigrant Strategies in Four Member States, European Commission Publications:
HPSE-CT-1999-00001. Available at https://cordis.europa.eu/pub/citizens/docs/hpse-ct-
1999-00001iapasis21703.pdf.
Ejere, E., & Ugochuku, A. (2012). Impact of transactional and transformational leadership
styles on organisational performance: empirical evidence from Nigeria. The Journal of
Commerce, 5(1) 30-41.
Ekelund, H. (2015). Why some CEOs Fail and Others Succeed. Bts. Availabel online at
http://www.bts.com/docs/default-source/newsletter/BTS_Insights_Why_CEOs_Fail.

221
Eisenhardt, K., & Martin, J. (2000). Dynamic capabilities: what are they? Strategic
Management Journal, 21, 1105-1121.
Eisenhart, M. (1991). Conceptual frameworks circa 1991: Ideas from a cultural anthropologist;
Implications for mathematics education researchers. In Proceedings of the Thirteenth
Annual Meeting of the North American Chapter of the International Group for the
Psychology of Mathematics Education (pp. 202-219).
European Commission (2015). Enterprise and Industry. SME definition. Available online:
http://ec.europa.eu/enterprise/policies/sme/facts-figures-analysis/sme-
definition/index_en.htm.
Fey, C., Yakoushev, M., Park, H., & Bjorkman, I. (2007). Opening the black box of the
relationship between HRM practices and firm performance. A comparison of USA,
Finland and Russia: Stockholm School of Economics – Russia- Working Paper No. 7 -
101.
Forbes (2013). The Worst CEO Screw-Ups Of 2013. Available online at
http://www.forbes.com/sites/susanadams/2013/12/18/
French, W., Kast, F., & Rosenzweig, J. (1985). Understanding Human Behavior in
Organizations. New York: Harper & Row.
Gakure, R., & Amurle, G. (2013). Strategic planning practices in ICT SMEs in Kenya: What
other SMEs can learn. Prime Journal of Social Sciences, 2(6) 336-349.
Gathenya, J., Bwisa, H., & Kihoro, J. (2012). Entrepreneurial Strategic Planning Practices and
Firm Performance among Women-led Small and Medium Enterprises in Kenya.
Unpublished Ph. D thesis, Jomo Kenyatta University.

222
Gathogo, G., & Ragui, M. (2014). Effects of Capital and Technology on the performance ofr
SMEs in the manufacturing sector in Kenya. Case of selected firms in Thika
Municipality. European journal of management and science, 6(7) 308 – 311.
Grant R. (1991) The Resource-Based Theory of Competitive Advantage: Implications for
Strategy Implementation. California Management Review, 33(3) 114-135:
DOI: 10.2307/41166664.
Grant, C. & Osanloo, A. (2014). Understanding, selecting and integrating a theoretical
framework in dissertation research: Creating a blue print for your house, Administrative
issues Journal. 4(2) 12-26.
Griffin, M. (2003). Organizational performance model. Available at: http://griffin-oc.com/GOC.
Griffin, R. (2013). Fundamentals of Management. 7th edition, Cengage South Western
Publishers (USA)
Hall, D. & Sias, M. (1980). Strategy follow structure!, Strategic Management Journal, 1. 149-
163.
Hambrick, D. (1981). Strategic Awareness within Top Management Teams. Strategic
Management Journal, 2(3) 263-279.
Hamel, G. & Prahalad, C. (1989). Strategic intent, Harvard Business Review, 67(3), 63- 76.
Harrison, N., & Watson, T. (1998). The Focus for Innovation in Small and Medium Service
Enterprises. Conference Proceedings of the 7th Annual Meeting of the Western Decision
Sciences Institute, 7–11 April, Reno, NV, USA.
Hauc, A., & Kovac, J. (2000) Project Management in Strategy Implementation – Experiences in
Slovenia, International Journal of Project Management, 18: 61-67.

223
Hax, A., & Majruf, N. (1986). Strategy and the strategy formation process. Sloan School of
Management, MIT (1986).
Helfat, C., Finkelstein, S., Mitchell, W., Peteraf, M., Singh,H., Teece,D., & Winter, S. (2007).
Dynamic capabilities and organizational processes in Dynamic Capabilities:
Understanding Strategic Change in Organizations, Blackwell, London.
Heracleous, L. (2000). The role of strategy implementation in organization development,
Organization Development Journal, 18(3): 75-86.
Higgins, J. (2005), The Eight ‘S’s of Successful Strategy Execution. Journal of Change
Management. 5(1).
Hrebiniak, L. (2005). Making Strategy Work: Leading Effective Execution and Change. New
Jersey: Wharton School Publishing.
Hrebiniak, L. (2006). Obstacles to Effective Strategy Implementation.”Organizational
Dynamics, 35, 12-31.
Hrebiniak, L., & Joyce, W. (1984) Implementing Strategy, New York: Macmillan Publishing
Company.
Hui, H., Radzi, C., Jenatabadi, H., Kasim, F., & Radu, S. (2013). The impact of firm age, size
on the relationship among organizational innovation, learning and performance. A
moderation analysis in Asian food manufacturing companies. Interdisciplinary Journal
of Contemporaly Research in Business, 5(4) 166-174.
Huselid, M. (1985). The impact of human resources management practices on turnover,
productivity and corporate financial performance. Academy of Management Journal,
38(3) 635-672.

224
Hussey, D. (2000). How to Manage Organizational Change. London: Kogan Page.
IFC (2012). Interpretation note on small and medium enterprise and environmental and social
risk management. IFC, World Bank Group.
ISO (2015). How automating your quality management solution will help foster compliance;
Geneva, Switzerland.
Lumpkin, G., & Dess, G. (1996). Clarifying the Entrepreneurial Orientation construct and
Linking it to Performance. Academy of Management Review, 21(1) 135-172.
Jantunen, A., Nummela, N., Puumalainen, K., & Saarenketo, S. (2008). Strategic orientations of
born globals - Do they really matter?. Journal of World Business, 43(2) 158-170.
Jayaram, J., Droge, C., & Vickery, S. (1999). The impact of human resource management
practices on manufacturing performance, Journal of Operations Management, 18(1) 1-
20.
Jin, J., & Von Zedtwitz, M. (2008). Technological capability development in China mobile
phone industry. Technovation, 28, 327-334.
Johnson, R., & Onwuegbuzie, A. (2004). Mixed methods research: A research paradigm whose
time has come. Educational Researcher, 33(7), 14–26,
http://dx.doi.org/10.3102/0013189X033007014.
Jonas, R. (2000). Strategic Planning: The Real Meaning of Strategy, Handbook of Business
Strategy, 1(1) 141 - 143
Jooste, C., & Fourie, B. (2009). The role of strategic leadership in effective strategy
implementation: Perceptions of South African strategic leaders; South African Business
Review, 13(3).

225
Karimi, J. (2012). Relationship between intellectual capital accounting and business
performance in the pharmaceutical firms in Kenya, Unpublished Ph.D thesis, Jomo
Kenyatta University.
Katou, A. (2008). Measuring the impact of HRM on organizational performance. Journal of
Industrial Engineering & Management, 01(02) 199-142.
Kast, F. & Rosenzweig, J. (1972). General systems theory: Applications for organizations and
management. Academy of Management Journal. 15(4) 451.
Kiganane, L., Bwisa, H., & Kihoro, J. (2012). Assessing influence of firm characteristics on the
effect of mobile phone services on firm performance: A case study of Thika Town in
Kenya. International journal of economics and management sciences, 1(10): 12-2
Kihara, P., Bwisa H, & Kihoro J. (2016) Relationship among Structural Adaptations, Strategy
Implementation and Performance of Manufacturing Small and Medium Firms in Thika,
Kenya. British Journal of Applied Science & Technology, 17(1) 1-16
DOI:10.9734/BJAST/2016/28025.
Kitonga, D., Bichanga, W., & Muema, B. (2016). The role of determining strategic direction on
not-for-profit organizational performance in Nairobi County in Kenya, International
Journal of Scientific & Technology Research, 5(5): 28-32.
Kenyabook (2014). Thika, a market town in Kenya’s central province, Available online:
http://www.kenyabook.com/thika.html. Accessed 10th Dec 2014. At 4.01 pm.
Kimberly J., & Evanisko M. (1981). Organizational Innovation: the influence of individual,
organizational and confextual factors on hospital adoption of technical and
administrative innovations, Academy of Management Journal, 24, 689-713.
Kippra (2013). Kenya Economic Report 2013, Nairobi, Kenya.

226
Koech, P. & Namsonge, G. (2012). The Effect of Leadership Styles on Organizational
Performance at State Corporations in Kenya. International Journal of Business and
Commerce , 2(1) 01-12.
Kothari, C (2003). Research Methodology: methods and Techniques. (4th Ed.). New Delhi:
Vishwa Parakashan.
Kothari, C. (2004). Research Methodology; Methods and Techniques, New Delhi: New Age
International.
Kumar, U., Kumar, V., & Madanmohan, T. (2004). Import-led technological capability: a
comparative analysis of Indian and Indonesian manufacturing firms. Technovation, 24,
979-993. DOI: 10.1016/S0166-4972(03)00030-0.
Lall, S. (1992). Technological capabilities and industrialization. World Development, 20(2) 165-
186.
Lee, F., Lee, T., & Wu, W. (2010). The relationship between human resource management
practices, business strategy and firm performance: evidence from steel industry in
Taiwan, The International J. Human Resource Management, 21(9)1351-1372
Lee J., & Giorgis, B. (2004). Empirical Approach to the Sequential Relationships between Firm
Strategy, Export Activity, and Performance in U.S. Manufacturing Firms”, International
Business Review, 13(1), 101-129.
Leitao, J., & Franco, M. (2011). Individual entrepreneurship capacity and small and medium
enterprise (SME) performance: A human and organizational capacity approach: African
Journal of Business Management, 5(15) 6350-6365. DOI: 10.2139/ssrn.1118257

227
Leon, C., Davis, L. & Kraemer, C. (2011). The role and interpretation of pilot studies in clinical
research. Journal of Psychiatric Research, 45, 626–629.
DOI:10.1016/j.jpsychires.2010.10.008
Li, Y., Gouhui, S., & Eppler, M. (2008). Making strategy work: A literature review of factors
influencing strategy implementation. ICA Working Paper 2/2008, Institute of Corporate
Communication, Univesita della Svizzera Italiana.
Liu, B., & Fu, Z. (2011). Relationship between strategic orientation and organizational
performance in Born Global: A Critical Review. International Journal of Business and
Management, 6(3), 109-115.
Ling, Y., Simek, Z., Lubatkin, M., & Veiga, J. (2008). The impact of Transformational CEOs
on Performance of Small-to Medium Sized firms: Does organizational context matter?
Journal of Applied Psychology, 93(4) 923-934. DOI: 10.1037/0021-9010.93.4.923
Lumiste, R., Lumiste, R. & Kilvits, K. (2004). Estonian Manufacturing SMEs Innovation
Strategies and Development of Innovation Networks. Paper presented at the 13th
Nordic Conference on Small Business Research, 10–12 June, Tromsø, Norway.
Lumpkin, G., & Dess, G. (1996). Clarifying the entrepreneurial orientation construct and
linking it to performance. Academy of Management Review, 21(1) 135–172.
Mackenzie, D., Wilson, D., & Kider, S. (2001). Effects of Correctional Boot Camps on
offending. The ANNALS of the American Academy of Political and Social Science,
578(1), 126-143.
Madu, B. (2013). Vision: the relationship between a firm’s strategy and business model. Journal
of behavioral studies in business. 1(9).

228
Manimala, M., & Vijay, D. (2012). Technology Business Incubators (TBIs): A Perspective for
the Emerging Economies. IIM Bangalore Research Paper No. 358. Available online:
http://dx.doi.org/10.2139/ssrn.2117720
Mapetere, D., Mavhiki, S., Nyamwanza, T., Sikomwe, S., & Mhonde, C. (2012). Strategic Role
of leadership in strategy implementation in Zimbabwe’s state owned enterprises.
International Journal of Business and Social Science, 3 (16)
Martell, K., Gupta, A., & Carroll, S. (1996). Human resource management practices, business
strategies, and firm performance: A test of strategy implementation theory, Irish
Business and Administrative Research, 17(1) 18-35.
Martin, L., & Lumpkin, T. (2003). From EO to “Family Orientation”:Generational Differences
in the Management of Family Businesses. Paper presented at the 22nd Babson College
Entrepreneurship Research Conference, Babson College.
Mehdi, H. & Rowe, G. (2009). Strategic Leadership: Short-term stability and Long-term
viability. Ivey business Journal, Sept/Oct 2009.
McGregor, R. & Vrazalic, L. (2005). A basic model of electronic commerce adoption barriers: a
study of regional business in Sweden and Australia. Journal of small business and
enterprise development, 12(4) 510-527.
Meijaard, J., Brand, M., & Mosselman, M. (2005). Organizational structure and performance in
Dutch small firms, Small Business Economics, 25 (1) 83-96. DOI 10.1007/s 11187-005-
4259-7
Miles, M., & Huberman, M. (1994). Qualitative Data Analysis: An Expanded Sourcebook (2nd
edition). Beverley Hills, Sage

229
Mintzberg, H. (1980). Structure in 5’s: A synthesis of the research on organization design.
Management Science, 26 (3), 322-341.
Mohamad, A., Lo, M., & La, M. (2009). The relationship between human resource management
and firm performance in Malaysia. International Journal of Economics and Finance
1(1) 103 -109.
Mosoti, Z., & Murabu, E. (2014). Assessing the implication of strategic planning on
performance of small sized organizations: A case study of small enterprises in Thika
town. Journal of Research in Business and Management, 2(3) 1-13.
Mubaraki, H., & Aruna, M. (2013). Technology Innovation for SME Growth: A Perception for
the Emerging Economies, Journal of Economics and Sustainable Development, 4(3)
156-162.
Mugenda, O., & Mugenda, A. (2003). Research Methods – Quantitative and Qualitative
Approaches. Nairobi: ACT Press.
Myloni, B., Harzing, A., & Mirza, H. (2004). Host country specific factors and the transfer of
human resource management practices in multinational companies. International
Journal of Manpower, 2 (6) 518-534.
Mwangi, G. (2011). An analysis of factors affecting the performance of small and medium
enterprises in the manufacturing sector in Kenya. The case of selected firms in Thika
Municipality. Unpublished MBA Thesis, Kenyatta University.
Naeem, H., & Tayyeb, M. (2011). The Influence of the SMES Top-Level Managers’ Leadership
Styles and Their Entrepreneurial Orientation on the Business Performance. Available
online: http://dx.doi.org/10.2139/ssrn.1884069

230
Njuguna, J. (2008). Organizational learning, competitive advantage and firm performance: An
empirical study of Kenyan small and medium sized enterprises in the manufacturing
sector. Jomo Kenyatta University of Agriculture and Technology, Unpublished PhD
Thesis.
Noble, C., & Mokwa, M. (1999). Implementing Marketing Strategies: Developing and Testing a
Managerial Theory, Journal of Marketing, 63, 57-73
Noble, C. (1999b). Building the Strategy Implementation Network, Business Horizons,
November-December, 19-28.
Noble, C. (1999). The Eclectic Roots of Strategy Implementation Research, Journal of Business
Research, 45, 119-134.
Nohria, N., & Gulati, R. (1996). Is slack good or bad for innovation? Academy of Management
Journal, 39(5) 1245-1264.
Northhouse, P. (2013). Leadership theory and practice (6th ed.), Thousand Oaks, CA: Sage
Publications, Inc.
Nyang’au, P., Mukulu, E., & Mang’atu, J. (2014). The influence of entrepreneur’s motivation
on growth of micro and small enterprises in Thika town, Kenya. International Journal of
Business, Humanities and Technology, 4(2)123 – 128.
Odita, A. & Bello, A. (2015). Strategic intent and organizational performance: A study of Banks
in Asaba Delta State in Nigeria, Information and Knowledge Management, 5(4): 60-71.
Ojokuku, R., Odetayo, T., & Sajuyigbe, A. (2012). Impact of Leadership Style on
Organizational Performance: A Case Study of Nigerian Banks. American Journal of
Business and Management, 1(4) 202-207.

231
Okumus, F. (2001). Towards a strategy implementation framework, International Journal of
Contemporary Hospitality Management, 13 (7) 327-338.
Okumus, F. (2003). Framework to implement strategies in organizations, Management
Decisions, 41(9) 871-882.
Okwachi, S., Gakure, R., & Ragui, M. (2013). Business Models-What is their effect on the
implementation of strategic plans by SME’s, Prime Journal of Business Administration
and Management. 3(5) 1025-1032.
Okwu, A., Obiwuru, T., Akpa, V. & Nwankwere, I. (2011). Effects of Leadership style on
Organizational Performance: A survey of selected small scale enterprises in Ikosi-Ketu
Council development Area of Lagos State, Nigeria. Australian Journal of Business and
Management Research, 1(7) 100-111.
O’regan, N., & Ghobadian, A. (2006). The importance of capabilities for strategic direction and
performance. Management Decisions, 42(2) 292-313.
Orlando, C., & Johnson, N. (2001). Strategic Human Resource Management effectiveness and
firm performance. Int. Journal of Human Resource Management, 12(2) 299 -310 DOI:
10.1080/09585190010015105
Oseh, C. (2013). Factors associated with internationalization of small and medium enterprises in
Thika town, Kenya. European Journal of Management Sciences and Economics, 1(3),
128-136.
Oslon, E., Slater, S., & Hult, T. (2005). The importance of structure and process to strategy
implementation, Business Horizon Journal, 48, 47-54.

232
Osman I., Ho, T. C., & Galang, M. (2011). The relationship between human resource practices
and firm performance: An empirical assessment of firms in Malaysia, Business Strategy
Series, 12(1) 41 – 48. DOI:10.1016/j.bushor.2004.10.002
Pavitt, K. (1998). Technologies, products and organization in the innovating firm: what Adam
Smith tells us and Joseph Schumpeter doesn’t. Industrial and Corporate Change, 7(3)
433-452.
Pearce, J. & Robinson, B. (1991). Formulation, Implementation and Control of Competitive
Strategy, Homewood, Boston, MA: Irwin.
Pearce J. & Robinson, B. (2007). Strategic Management: Strategy Formulation and
Implementation, Richard D. IRWIN, INC. Homewood, Illinois 60430.
Premkumar, G. (2003). A meta-analysis of research on information technology implementation
in small businesses. Journal of Organizational Computing and Electronic Commerce, 13
(2) 91–121.
Priem, R., & Butler, J. (2001a). Is the resource-based view a useful perspective for strategic
management research?, Academy of Management Review, 26, 22-40.
Priem, R., & Butler, J. (2001b). Tautology in the resource-based view and the implications of
externally determined resource value: further comments, Academy of Management
Review, 26, 57-66.
Peters, J. & Robert H. (1982). In Search of Excellence - Lessons from America’s Best-Run
Companies, HarperCollins Publishers, London.
Pfeffer, J. (1998). Seven practices of successful organizations, California Management Review,
40(2), 96-124.

233
Porter, M. (1996). What is strategy? Harvard Business Review, November 1, 1996.
Prahalad, C, & Hamel, G. (1990). The core competence of the corporation. Harvard Business
Review.
Reichert, F., & Zawislak, P. (2014). Technology capability and firm performance. Journal of
Technology Management & Innovation, 9(4) 20-35.
Republic of Kenya (2005). Development of Micro and Small Enterprises for Employment and
Wealth Creation. Sessional Paper No. 2. Government Printer, Nairobi, Kenya.
Republic of Kenya (2008). Vision 2030: A Globally Competitive and a Prosperous Kenya,
Government Printer, Nairobi, Kenya.
Republic of Kenya (2011). Kenya Economic Survey 2011. Kenya National Bureau of Statistics,
Government Printer, Nairobi, Kenya.
Richard, P., Devinney, T., Yip, G., & Johnson, G. (2009). Measuring organizational
performance: Towards methodological best practice. Journal of Management, 35(3)
718-804. DOI: 10.1177/0149206308330560.
Robbins, S. (2006). Organization theory (Mahdi Alvani and Danaeefard, Trans. Tehran:
SAFFAR publication, 14th Ed.
Robson, C., (2011). Real world research: a resource for social scientists and practitioner-
researchers, 3rd ed. Oxford, Blackwell Publishing.
Rothaermel, F. (2012). Strategic Management: Concepts and Cases. McGraw-Hill/Irwin, p. 5
Rubera, G. & Kirca, A. (2012). Firm innovativeness and its performance outcomes: A meta-
analytic review and theoretical integration, Journal of Marketing, 76(3) 130-147: DOI:
http://dx.doi.org/10.1509/jm.10.0494

234
Rumelt, R. (1984). Towards a strategic theory of the firm'. In R. Lamb (ed.) Competitive
Strategic Management. Prentice-Hall, Englewood Cliffs, NJ, pp. 556-570.
Safari, S. Karimian, M., & Khosravi, A. (2014). Identifying and ranking the human resources
management criteria influencing on organizational performance using MADM Fuzzy
techniques. Management Science Letters, 4(7) 1577-1590.
Sage, S. (2015). 5 questions to evaluate your implementation strategy. Available online:
http://onstrategyhq.com/resources/strategic-implementation/.
Scotland, J. (2012). Exploring the philosophical underpinnings of research: Relating ontology
and epistemology to the methodology and methods of the scientific, interpretive and
critical research paradigms. English Language Teaching, 5 (9) 9-16.
DOI:10.5539/elt.v5n9p9, URL: http://dx.doi.org/10.5539/elt.v5n9p9
Shah, A. (2005). The foundation of successful strategy implementation: Overcoming the
obstacles. Global Business Review, 6(2): 293-307.
Sial, A., Usman, M., Zufiqar, S., Satti, A., & Khursheed, I. (2013). Why do public sector
organizations fail in implementation of strategic plan in Pakistan. Public Policy and
Administration Journal, 3(1)
Sine, W., Mitsuhashi, H., & Kirsch, D. (2006). Revisiting Burns and Stalker: Formal structure
and new venture performance in emerging economies. Academy of management journal,
49(1) 121-132.
SMEA (2013). Japan’s Policy on Small and Medium Enterprises (SMEs) and micro enterprises.
Ministry of Economy, Trade and Industry. Available
online:http://www.chusho.meti.go.jp/sme.

235
Sorooshian, S., Norzima, Z., Yusuf, I. & Rosnah, Y. (2010). Effects analysis on strategy
implementation drivers. World Applied Sciences Journal. 11(10) 1255-1261.
Speculand, R. (2009). Six necessary mind shifts for implementing strategy. Business Strategy
Series, Volume: 10(3) 167 – 172.
Swanson, R., & Holton, E. (2001). Foundations of human resource development. San Francisco:
Berrett-Koehler.
Teece, D. (2014). A dynamic capabilities-based entrepreneurial theory of multinational
enterprise. Journal of International Business Studies, 45, 8-37
Teece, D. (2007). Explicating dynamic capabilities: The nature and micro foundations of
(sustainable) enterprise performance. Strategic Management Journal, 28(13): 1319–
1350.
Teece, D., Pisano, G., & Shuen, A. (1997). Dynamic capabilities and strategic management.
Strategic Management Journal, 18 (7): 537–533.
Thabane, L., Ma, J., Chu, R., Cheng, J., Ismaila, A., Rios, L., & Goldsmith, C. (2010). A
tutorial on pilot studies: The what, why and how. BMC Medical Research Methodology,
10, Article 1. DOI: 10.1186/1471-2288-10-1.
The Economist (2009). Great leaders create visions: The final management idea in our series:
Retrieved on 22nd October 2016 from World Wide Web; www.economist/node/1430175
Therrien, P., Doloreux, D. & Chamberlin, T. (2011). Innovation novelty and (commercial)
performance in the service sector: A Canadian firm level analysis, Technovation, 31,
655-665.

236
Thompson, A., Strickland, A., & Gamble, J. (2007). Crafting and Executing Strategy – Texts
and Readings. (15th
Ed.). New York: McGraw-Hill Irwin.
Todd R. , Sergio. L., & Laura P. (2000). Informal and formal organization in new institutional
economics, in Paul Ingram, Brian S. Silverman (ed.) The New Institutionalism in
Strategic Management (Advances in Strategic Management, Volume 19) Emerald.
Limited, 277 - 305
Torraco, R. (2005). Work design theory: A review and critique with implications for human
resource development. Human Resource Development Quarterly, 16, 85-109.
Trez, J., Steffanello, M., Reichert, F., DeRossi, G., & Pufal, N. (2012). Footware Industry
Innovation Capability: Southern Brazilian Evidence: Academy of Management Meeting,
Boston. 1-32.
Udoh, B., & Agu, A. (2012). Impact of Transformational leadership on Organizational
Performance. International Journal of Current Research, 4(11), 142-147.
Ural, T., & Acaravci, S. (2006). “The Effects of Firm’s Strategic Factors on Export and Firm
Performance: A Comparison of Permanent and Sporadic Exporters”, Problems &
Perspectives in Management, 4(4): 42-62.
Urich, D., & Wayne, B. (2005). HRM value of proposition, Boston, Harvard Business Press
Maas, A. (2008). Strategy implementation in a small island: An integrative framework, PhD
thesis, Erasmus University, RotterDam.
Vlachos, I. (2009). The effects of human resource practices on firm growth. Int. Journal of
Business Science and Applied management, 4(2) 18-34.

237
Wernerfelt, B. (1984). A Resource-Based View of the firm, Strategic Management Journal, 5,
171-180.
Wei, L. (2006). Strategic Human Resource Management: Determinants of Fit. Research and
Practice in Human Resource Management, 14(2) 49 – 60.
Wiklund, J., & Shepherd, D. (2005). Entrepreneurial orientation and small business
performance: a configurationally approach, Journal of Business Venturing, 20(1), 71-91.
Wilton (2013). What is HRM? Sage publication. Available:
www.sagepub.com/wilton2/Wilton%20Chapter%201
Winter, S. (2003). Understanding dynamic capabilities, Strategic Management Journal, 24,
991–995.
Wright, P., Gardener, T., & Moynihan, L. (2003). The impact of HR practices on performance
of business units. Human Resource Management Journal, 13(3) 21-36.
Wolfe, R. (1994). ‘Organizational Innovation: Review, critique and suggested research
directions, Journal of Management Studies, 31, 405-431.
Wong, K., Tan, P., Ng, Y., & Fong, C. (2013). The Role of HRM in Enhancing Organizational
Performance. Human Resource Management Research. 3 (1) 11-15. DOI:
10.5923/j.hrmr.20130301.03.
Wood, F. & Sangster, N. (2008). Business Accounting, (11th Ed), Prentice Hall.
World Bank (2010). Doing Business in Kenya 2010. International Bank for Reconstruction and
Development; Washington DC, USA.
Yasuda, T. (2005). Firm Growth, Size, Age and Behavior in Japanese Manufacturing, Small
Business Economics, 24(1)1-15.

238
World Bank (2012). Doing Business in Kenya 2012: Comparing Regulations for domestic firms
in 13 Cities and with 183 Economies, World Bank and IFC publication.
World Bank (2009). Doing Business in Kenya 2010: Comparing Regulations in 11 Localities
and 183 Economies, World Bank and IFC publication.
Zahra, S. & Garvis, D. (2000). International Corporate Entrepreneurship and Firm Performance:
The Moderating Effect of International Environmental Hostility. Journal of Business
Venturing, 15(5/6) 469.
Zawislak, P., Alves, A., Gamarra, J., Barbieux, D., & Reichert, F. (2012). Innovation capability:
From technology development to transaction capability. Journal of Technology
Management and Innovation. 7(2) 14-27.
Zollo, M. & Winter, S. (2002). Deliberate learning and the evolution of dynamic capabilities,
Organization Science, 13, 339-351.
Zumitzavani, V. & Udchachone, S. (2014). The Influence of Leadership Styles on
Organisational Performance Mediated by Organisational Innovation: A Case Study of
the Hospitality Industry in Thailand. International Conference on Economics,
Management and Development.
Okwachi, S., Gakure, R., & Ragui, M. (2013). Business Models-What is their effect on the
implementation of strategic plans by SME’s: Prime Journal of Business Administration
and Management. 3(5) 1025-1032

239
APPENDICES
Appendix i: Introduction Letter
SERIAL NO________
Dear Respondent,
I am a Ph.D candidate at Jomo Kenyatta University of Agriculture and Technology
(JKUAT) undertaking a doctoral degree in Business Administration. I am working on
my final thesis titled “Influence of Strategy Implementation on the Performance of
small and medium manufacturing firms in Kenya”. I am collecting data from the
field to enable me complete my thesis work and I humbly request you to fill the
questionnaire provided below. Your responses will be used for the purposes of this study
only and the information will be held with utmost confidentiality. The information
obtained will also not be used to reveal the identity of person (s) or organization (s) that
participated in this study. Place a tick (√) or provide a brief response to the statements
that require you to write down your opinion. I am greatly humbled by your acceptance to
provide me with necessary information. I salute you.
Yours faithfully,
Peter M. Kihara,
Email: [email protected]

240
Appendix ii: Questionnaire
SECTION A: BIO-DATA
1. Name of the organization__________________________ (Optional)
2. Where is your organization located in Thika Sub-County ________
3. What is your core business? _________________________________
4. How many years has your organization been operating? __________
5. What is your gender? a. Male { } b. Female { }
6. Your age in years? a. Below 20 { } b. 21-25 { } c. 26- 30 { } d. 31-35 { } e. 36-
40 { } f. 41-45 { } g. 46-50 { } h. Over 50 years { }
7. You marital status? a. Single { } b. Married { } c. Other { }
8. Your highest education qualification? a. Post graduate { } b. Bachelor’s degree { } c.
Higher Diploma { } d. Diploma { } e. Certificate { } f. Other (Specify)
9. Your current position? __________________________________
10. Number of years worked in your current position? __________
11. Number of full time employees in your organization ________
12. Do you have a documented strategic plan in your organization?
a. Yes { } b. No { } c. No idea { }
13. Which of the following strategies has your organization implemented in the last one
year or is currently implementing? Please tick (√) all that applies.

241
a. New product development { } b. Market expansion { } c. Product modification { }
d. Cost reduction { } e. diversification { } f. Growth { } g. Stability { } h. No
strategy implemented { } i. Other strategies (specify) ______

242
Appendix iii: Questionnaire-Leadership Styles
MLQ 6-S Statement N Mean Std. Dev
I make employees feel good to be around me 115 2.835 1.059
I tell others in a few simple words what need to be done 115 3.844 1.204
I help others to think about old problems in new ways 115 3.400 .896
I help other employees to develop themselves 113 3.398 .797
I tell employees what to do if they want to be rewarded for
their work
115 3.244 1.014
I am satisfied when employees meet the agreed targets 114 4.877 .356
I am contented to let others to continue working in the same
ways always
115 2.145 1.258
Other people have complete faith in me 114 3.290 .938
I use tools, images, stories and models to help other
people understand
115 3.044 .862
I provide employees with new ways of looking at complex
or difficult issues
114 3.333 .984
I give employees feedback to let them know how they are doing 113 4.177 .804
I reward employees when they achieve their targets 113 3.336 1.040
As long as things are working, I do not try to change anything 112 2.286 1.352
I give employees freedom to do whatever they want 115 1.730 1.029
Other people are proud to be associated with me 115 3.574 3.978
I help the employees to find meaning in their work 113 3.814 .892
I help employees to rethink about issues that they had never
thought of or questioned before
115 3.130 .822
I give personal attention to others when they are in need 114 3.254 1.037
I let employees to know what they are entitled to after
achieving their targets
114 4.053 .967
I remind employees the standards they need to maintain while
doing their work
114 3.649 1.137
I do not ask anything more from others than what is
absolutely necessary
114 3.939 1.271
Valid N (listwise) 103

243
Appendix iv: Questionnaire-Structures
Note: Reliability α – Structural Adaptations = 0.705
Statement N Mean Std. Dev
Our organization revises and creates appropriate structures
to match the changes in strategy requirements
115 4.165 .561
Our organization gives adequate information before a new
strategy is implemented
115 3.357 1.010
Our organization is governed by a clear system of with
rules, regulations, policies and procedures
113 4.089 .600
We have a central command center that oversees
strategy implementation
114 4.079 .597
Strategic work activities are well coordinated across
sections, departments and divisions
114 4.061 .485
Our structure allows quick decisions and feedback 112 3.875 .773
Our organization has a well-designed reporting authority
and employees know to whom they report to
113 4.115 .395
We have a centralized decision structure that allows
quick decisions to be made
115 3.913 .615
Structures in our organization are flexible enough to allow
changes to be effected quickly and timely
115 3.696 .880
Our organization makes sure that employees work have
adequate knowledge, experience and skills
114 3.842 .837
Our organization encourages division of work and
specialization
113 4.027 .604
There is adequate level of supervision in every section,
department or divisions
113 4.009 .605
Our management encourages team work 115 3.504 1.071
Jobs in our organization are well structured with no
overlaps, conflicts or ambiguity
115 3.887 .646
Our organization encourages employees to refer to the
past experience when implementing a new strategy
115 3.774 .784
Valid N (listwise) 103

244
Appendix v: Questionnaire-Attention to Human Resources
Statement N Mean Std. Dev
Employees are regularly trained 115 3.443 1.028
Jobs and responsibilities are well understood by most of
the employees
114 4.044 .449
The organization always hire people with adequate skills
and experience
115 3.739 .889
Our organization frequently gives incentives to
motivate employees
115 3.435 .965
Most of our employees are highly committed to do their
work well
114 3.965 .579
We have well-designed systems of rewards, remuneration
and promotions of staff
115 3.687 .958
We have unbiased systems of recruitment and placement
of staff
113 3.717 .773
Performance evaluations and appraisals are done on
timely basis
115 3.496 .977
Promotions are always done on merit basis 113 3.894 .541
Jobs are well designed and employees are aware of what
they are supposed to do
114 3.983 .564
Rewards and incentives are always based on merit 114 3.868 .659
There is no shortage of staff 114 3.156 1.044
Our clients are well served all the times 114 3.544 1.065
Employees individual needs are often well taken care of 115 3.200 1.045
We encourage employees to showcase their creativity
and competencies among their peer groups
114 3.526 1.015
Valid N (listwise) 107
Note: Reliability α – Attention to Human Resources Requirements = 0.706

245
Appendix vi: Questionnaire-Attention to Technology
Statement N Mean Std. Dev
We use the current technology in the market to
produce good/services
115 3.783 .935
The level of technology in place has greatly assisted us
to implement strategies
115 4.017 .649
Adequate tools, machines and equipments enable employees
to their jobs better and faster
113 3.982 .719
Our organization has a budget for research and
development and money is always available
114 2.798 1.006
We conduct researches in order to develop our products 115 2.904 1.043
We have efficient Information Communication Technology 115 3.348 1.060
Our technology level is higher than that of our
immediate competitors
115 3.461 .830
Employees are encouraged to make suggestions of the
type and kind of technology required
114 3.649 .787
Our organization is keen to ensure that technology required
is availed
113 3.699 .812
All departments are well equipped with appropriate
technology
115 3.548 .920
Our organization is quick to respond to the changes
in technology
115 3.513 .940
Our organization updates and improves our ICT systems
to ensure they are efficient
115 3.261 1.069
We have a technology audit committee that reviews
the technology
115 2.878 1.061
Valid N (listwise) 111
Note: Reliability α – Attention to Technology Requirements = 0.854

246
Appendix vii: Questionnaire-Emphasis On Strategic Direction
Statement N Mean Std. Dev
Our organization has a clear vision and mission statements to
all employees
115 4.226 .663
Our mission statement is in line with what we intend to achieve
in future
115 4.191 .544
Our mission is well aligned to the work activities in the
entire organization
114 4.044 .643
Deliberate efforts are made to align our vision and
mission statements to the changes in the environment
113 3.974 .674
Our employees understand well how their work contributes to
the achievement our mission and vision
112 3.786 .853
Employees are always involved in developing strategies 115 3.278 1.048
We regularly revise our goals and objectives to ensure they are
in line with the market changes
114 3.597 .993
Most of our employees are aware of the plans which need to
be implemented
115 3.348 1.052
Most of our employees work hard in trying to meet the goals
and objectives
114 3.904 .704
Meetings are occasionally arranged to discuss successes,
failures and challenges arising
115 3.530 .911
Employees are frequently reminded about the direction
the organization is headed to
115 3.722 .894
Performance targets are frequently reviewed to ensure that they
are in line with the organization's goals and objectives
115 3.852 .797
Valid N (listwise) 107
Note: Reliability α – Emphasis on Strategic Direction of the Firm = 0.707

247
Appendix viii: List of Firms
Name of organization Name of organization
Highlands Coffee Company Ltd Lewa Feeds Industry
Kenya Power and Lighting Co. Ltd Mini Mart Bakers
Kamagambo Welding and Fabrication Sheku Bakers Indusry
Bidco Africa Ltd Banga feed industry
Munene Industries Omari millers Ltd
Privamnuts swissgourmet Kenya Ltd Milele feeds Ltd
Scopers Beverage Ltd Popular Industries
Bewa Feeds Industry Peak feeds Ltd
Delmonte Mach Electrical Ltd
Milky Millers Ltd Huduma feeds Industry
Muwandu Timber Cornmeal feeds Industry
Malisho Feeds Industry Up next feeds Industry
Shubu Animal feeds Prime Feeds Industry
Sawasawa feeds Ltd New Galaxy Feeds Industry
Central food Industries Golden Toast Industry
Wananchi Millers Ltd Wakabura Furniture Mart Ltd
Scopers Beverage Ltd Tiger Farm Ltd
Gram Ltd Jowabu Ltd
Mily timber Ltd Capwell
Country style Farm feeds Ltd Jungle Nut
Friends bakers Industry Ruhiu Furniture
Sweet cakes bakers Weaverbird Ltd
Chwichwi feeds Industry Punjab Ltd
Highrise millers Industry Mukafura
Furaha bakers China Mirror/glasses
New season feeds Industry Trust feeds Industry
Prosper Feeds Ltd Hika Feeds Industry

248
Name of organization Name of organization
Pamwa Timber Ltd
Pamoja bakers
Kerian Industry Ltd
Joska furniture
Match Electronics Joramu Tech Engineering
Kifaru Textiles Fresh Milk Ltd
Komu Hardware Bewa feeds sales
Wilmar Ltd Silverest meat baker
Kendia Ltd Anani bakers Industry
Thika cloth Mill Mandu Timber
Joy Fruit Industry Ngoigwa Welding
Kahora Furniture Gaoco Company
Booth Extrusions Ltd Landless bakers
Kenya Vehicle manufacturing Kelvian Juice Factory
Kandara Leather products Broadways
Blue Nile Industry Wamwangi dairy products
Murang'a Motors Josper Ltd
Silmart Wood Works Chania Feeds
Everest Industry Ltd Francis furniture workshop
Skyblue Farmlands Ltd Thika Power
Sawalu Bakers Wamiru Auto Tech Garage
Africana Smart Furniture Romy Auto works
Elgon Furniture Ltd Landless Welding
Boss Millers Ltd Kel Chemicals
Rijo Industry Ngoigwa Welding
Furaha Metal Box dealers Josper Ltd
Gunners Jikos Makers Gatitu Timber & workshop
Mwireri Furniture Ltd Karani Motors
Marmic Feeds Ltd Super Grip Ltd
Polysack Ltd Kenblest Kenya Ltd
Leather Factory Mwireri Faniture
Kel Chemicals Thika Cloth Mills
Source: County Government-Kiambu (2014).

249
Appendix IX: Okumu’s Strategy Implementation Framework
Key
a Changes in external environment influence the strategic context and force organizations to adopt new
initiatives.
b Problems and inconsistencies in the internal context require new initiatives.
c The strategy is implemented in the internal context, and the characteristics of organizational structure, culture
and leadership influences the process factors.
d Having an organizational context that is receptive to change is essential for the successful implementation of a
strategy.
e The process factors are primarily used on a continuous basis to implement the strategy and manipulate the
internal context.
f The characteristics of the context and process factors and how they are used directly influence the outcomes.
Figure 2.1: Okumu’s Strategy Implementation Framework: Fezzy Okumu (2003),
Management Decisions, 41(9).
External Context (a) Environmental uncertainty in the general and task environment
Leadership: (backing and involvement of senior executive in the process)
Internal Context (b, c, d) Organizational Structure (Power share, Coordination and decision
making practices) Organizational culture (traditions, values and standards)
Operational Process (e) Operational Planning (Preparation, planning and
piloting activities)
Resources (Resource allocation, information and time
limitation)
Communication (selling activities of strategy in multiple
models
People (Recruitment, training, incentives, and developing
competencies) Control (monitoring and feedback activities)
Outcome (f) Intended and unintended
results
Content: Strategy development
Need for new initiative and
participation
Related Documents