Journal of Membrane Science 279 (2006) 176–185 Influence of steam and carbon dioxide on the hydrogen flux through thin Pd/Ag and Pd membranes F.C. Gielens a , R.J.J. Knibbeler a , P.F.J. Duysinx a , H.D. Tong b , M.A.G. Vorstman a , J.T.F. Keurentjes a,∗ a Process Development Group, Department of Chemical Engineering and Chemistry, Eindhoven University of Technology, P.O. Box 513, 5600 MB Eindhoven, The Netherlands b Transducer Science Technology Group, MESA+ Research Institute, University of Twente, P.O. Box 217, 7500 AE, Enschede, The Netherlands Received 26 June 2005; received in revised form 28 November 2005; accepted 2 December 2005 Available online 13 March 2006 Abstract The influence of CO 2 and steam on the H 2 permeation behavior of high-flux Pd/Ag alloy and Pd membranes has been determined. The membranes – fabricated with microsystem technology (MEMS technology) – are 1.0 and 0.5 m thick; the thin membranes will reveal inhibitive effects more strongly than relatively thick membranes. The H 2 flux through the membranes has been studied for periods of more than 80 h during and after addition of CO 2 or H 2 O to the feed. Measurements have been carried out at 623, 673 and 723 K. The largest flux reductions found are 70 and 69% at 623 K for H 2 O and CO 2 , respectively. After stopping the steam addition the H 2 permeance restores to its original value. After stopping the CO 2 addition the H 2 permeance increases, but to a value lower than before the CO 2 addition. Surprisingly large time constants have been found for the transient permeance behavior. The inhibitive effect caused by the addition of CO 2 is almost certainly caused by the formation of CO and H 2 O by the reverse water gas shift (WGS) reaction. Besides by adsorption of CO 2 , CO and H 2 O, a far stronger inhibitive effect is caused by carbon, which is formed by the dissociation of CO and CO 2 . © 2005 Elsevier B.V. All rights reserved. Keywords: Hydrogen permeation; Contamination; Microsystem technology 1. Introduction Steam reforming is an important process for the production of hydrogen. About 95% of the hydrogen demand in the US is supplied via steam reforming of light hydrocarbons [1]. The two important chemical reactions in the steam reforming process of methane are: CH 4 + H 2 O CO + 3H 2 steam reforming (1) CO + H 2 O CO 2 + H 2 water gas shift (WGS) reaction (2) To obtain high conversions it is necessary to use an operational temperature of around 1100 K in the steam reforming reactor. The equilibrium of reaction (1) will be shifted to the right hand side and of reaction (2) will be forced to the left. Normally a second reactor, which is operated at a lower temperature and has ∗ Corresponding author. Tel.: +31 40 247 3622. E-mail address: [email protected] (J.T.F. Keurentjes). a different catalyst, is used to shift the equilibrium of reaction 2 to the H 2 and CO 2 side [2]. Changing the operation temperature is not the only way to shift reaction 2 to the CO 2 and H 2 side; by removing the pro- duced H 2 the shift in equilibrium can also be obtained [3–5]. Removing the H 2 in the first reaction step by applying a mem- brane could make the second reactor redundant. Shu et al. [3] measured a 40% higher methane conversion than the equilibrium conversion without membrane using a Pd/Ag alloy membrane on a stainless steel support. Criscuoli et al. [6] performed an economic feasibility study for a water gas shift reactor and con- cluded that a reactor equipped with a Pd membrane of 20 m thick or less could be an alternative for the conventional appa- ratus. In their calculation, it was assumed that H 2 permeation through Pd membranes of 10 m or more is limited by the diffu- sion of H-atoms through the membrane. For membranes thinner than 10 m an extra resistance term was added into the perme- ation model to include the influence of adsorption and desorption at the membrane surfaces. However, if the membrane surface is poisoned, the diffusion of H-atoms through the membrane will 0376-7388/$ – see front matter © 2005 Elsevier B.V. All rights reserved. doi:10.1016/j.memsci.2005.12.002

Welcome message from author
This document is posted to help you gain knowledge. Please leave a comment to let me know what you think about it! Share it to your friends and learn new things together.
Transcript
Journal of Membrane Science 279 (2006) 176–185
Influence of steam and carbon dioxide on the hydrogen flux through thinPd/Ag and Pd membranes
F.C. Gielens a, R.J.J. Knibbeler a, P.F.J. Duysinx a, H.D. Tong b,M.A.G. Vorstman a, J.T.F. Keurentjes a,∗
a Process Development Group, Department of Chemical Engineering and Chemistry, Eindhoven University of Technology,P.O. Box 513, 5600 MB Eindhoven, The Netherlands
b Transducer Science Technology Group, MESA+ Research Institute, University of Twente, P.O. Box 217, 7500 AE, Enschede, The Netherlands
Received 26 June 2005; received in revised form 28 November 2005; accepted 2 December 2005Available online 13 March 2006
Abstract
The influence of CO2 and steam on the H2 permeation behavior of high-flux Pd/Ag alloy and Pd membranes has been determined. The membranes– fabricated with microsystem technology (MEMS technology) – are 1.0 and 0.5 �m thick; the thin membranes will reveal inhibitive effects moresa
rSaH©
K
1
osim
C
C
TtTss
0d
trongly than relatively thick membranes. The H2 flux through the membranes has been studied for periods of more than 80 h during and afterddition of CO2 or H2O to the feed. Measurements have been carried out at 623, 673 and 723 K.
The largest flux reductions found are 70 and 69% at 623 K for H2O and CO2, respectively. After stopping the steam addition the H2 permeanceestores to its original value. After stopping the CO2 addition the H2 permeance increases, but to a value lower than before the CO2 addition.urprisingly large time constants have been found for the transient permeance behavior. The inhibitive effect caused by the addition of CO2 islmost certainly caused by the formation of CO and H2O by the reverse water gas shift (WGS) reaction. Besides by adsorption of CO2, CO and2O, a far stronger inhibitive effect is caused by carbon, which is formed by the dissociation of CO and CO2.2005 Elsevier B.V. All rights reserved.
eywords: Hydrogen permeation; Contamination; Microsystem technology
. Introduction
Steam reforming is an important process for the productionf hydrogen. About 95% of the hydrogen demand in the US isupplied via steam reforming of light hydrocarbons [1]. The twomportant chemical reactions in the steam reforming process of
ethane are:
H4 + H2O � CO + 3H2 steam reforming (1)
O + H2O � CO2 + H2 water gas shift (WGS) reaction (2)
o obtain high conversions it is necessary to use an operationalemperature of around 1100 K in the steam reforming reactor.he equilibrium of reaction (1) will be shifted to the right handide and of reaction (2) will be forced to the left. Normally aecond reactor, which is operated at a lower temperature and has
∗ Corresponding author. Tel.: +31 40 247 3622.E-mail address: [email protected] (J.T.F. Keurentjes).
a different catalyst, is used to shift the equilibrium of reaction 2to the H2 and CO2 side [2].
Changing the operation temperature is not the only way toshift reaction 2 to the CO2 and H2 side; by removing the pro-duced H2 the shift in equilibrium can also be obtained [3–5].Removing the H2 in the first reaction step by applying a mem-brane could make the second reactor redundant. Shu et al. [3]measured a 40% higher methane conversion than the equilibriumconversion without membrane using a Pd/Ag alloy membraneon a stainless steel support. Criscuoli et al. [6] performed aneconomic feasibility study for a water gas shift reactor and con-cluded that a reactor equipped with a Pd membrane of 20 �mthick or less could be an alternative for the conventional appa-ratus. In their calculation, it was assumed that H2 permeationthrough Pd membranes of 10 �m or more is limited by the diffu-sion of H-atoms through the membrane. For membranes thinnerthan 10 �m an extra resistance term was added into the perme-ation model to include the influence of adsorption and desorptionat the membrane surfaces. However, if the membrane surface ispoisoned, the diffusion of H-atoms through the membrane will
376-7388/$ – see front matter © 2005 Elsevier B.V. All rights reserved.
oi:10.1016/j.memsci.2005.12.002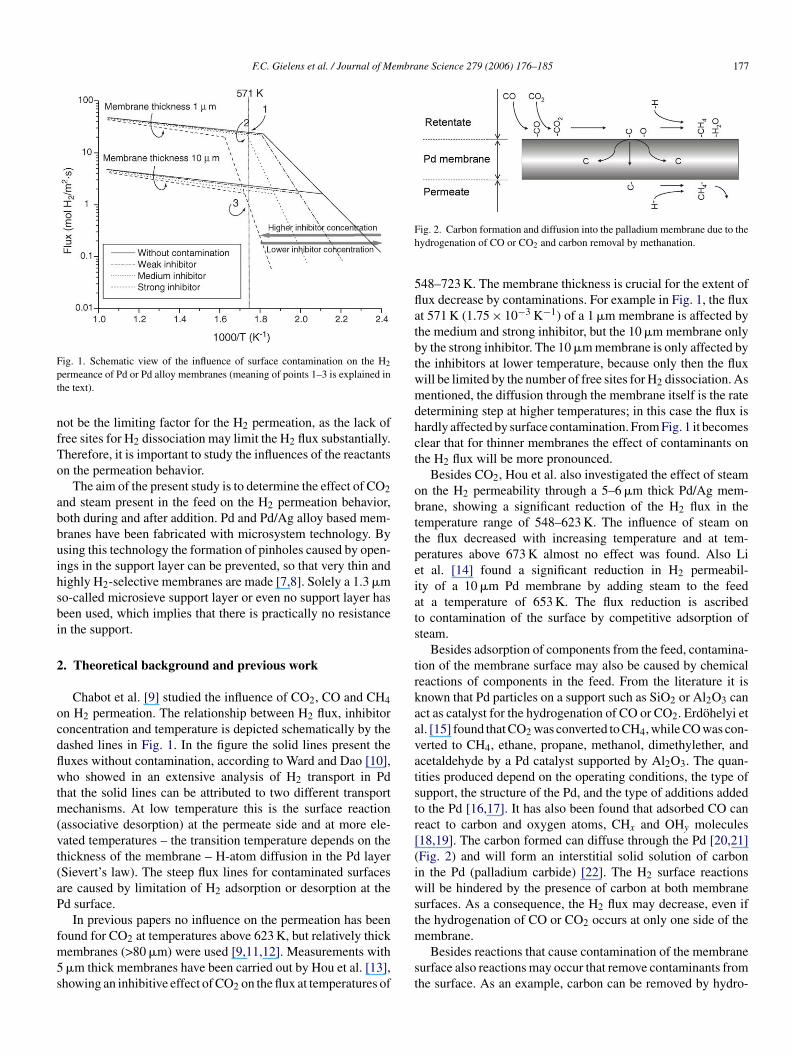
F.C. Gielens et al. / Journal of Membrane Science 279 (2006) 176–185 177
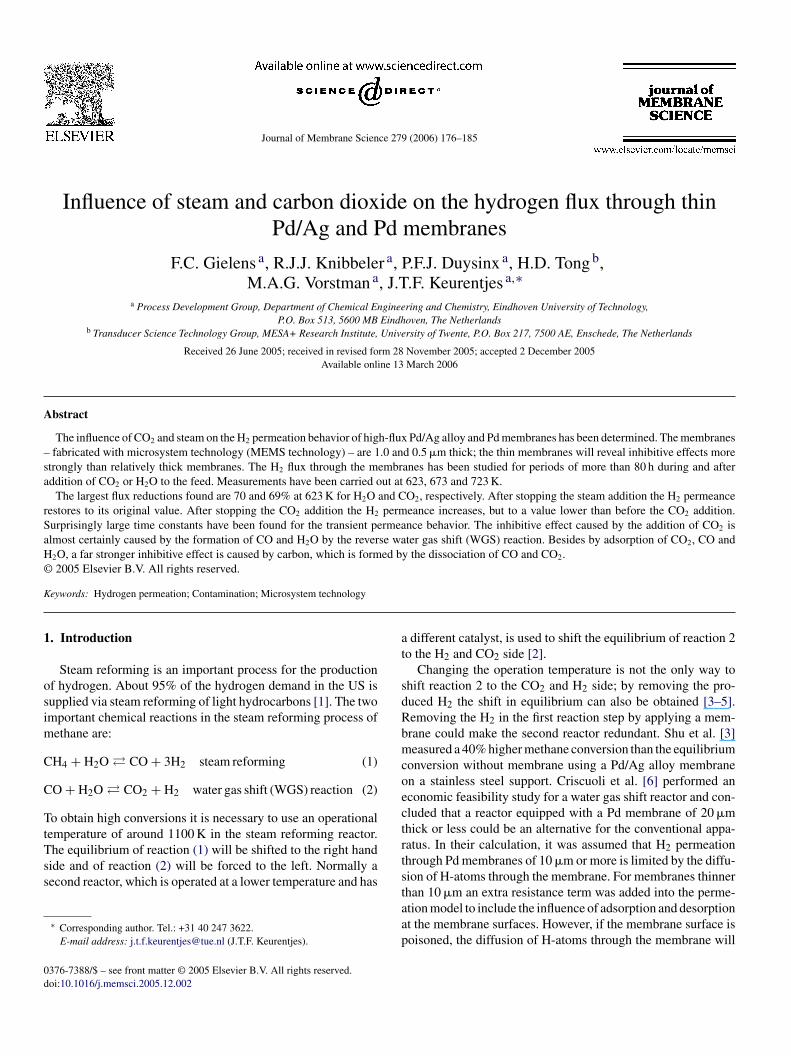
Fig. 1. Schematic view of the influence of surface contamination on the H2
permeance of Pd or Pd alloy membranes (meaning of points 1–3 is explained inthe text).
not be the limiting factor for the H2 permeation, as the lack offree sites for H2 dissociation may limit the H2 flux substantially.Therefore, it is important to study the influences of the reactantson the permeation behavior.
The aim of the present study is to determine the effect of CO2and steam present in the feed on the H2 permeation behavior,both during and after addition. Pd and Pd/Ag alloy based mem-branes have been fabricated with microsystem technology. Byusing this technology the formation of pinholes caused by open-ings in the support layer can be prevented, so that very thin andhighly H2-selective membranes are made [7,8]. Solely a 1.3 �mso-called microsieve support layer or even no support layer hasbeen used, which implies that there is practically no resistancein the support.
2. Theoretical background and previous work
Chabot et al. [9] studied the influence of CO2, CO and CH4on H2 permeation. The relationship between H2 flux, inhibitorconcentration and temperature is depicted schematically by thedashed lines in Fig. 1. In the figure the solid lines present thefluxes without contamination, according to Ward and Dao [10],who showed in an extensive analysis of H2 transport in Pdthat the solid lines can be attributed to two different transportmechanisms. At low temperature this is the surface reaction(vt(aP
fm5s
Fig. 2. Carbon formation and diffusion into the palladium membrane due to thehydrogenation of CO or CO2 and carbon removal by methanation.
548–723 K. The membrane thickness is crucial for the extent offlux decrease by contaminations. For example in Fig. 1, the fluxat 571 K (1.75 × 10⁻³ K−1) of a 1 �m membrane is affected bythe medium and strong inhibitor, but the 10 �m membrane onlyby the strong inhibitor. The 10 �m membrane is only affected bythe inhibitors at lower temperature, because only then the fluxwill be limited by the number of free sites for H2 dissociation. Asmentioned, the diffusion through the membrane itself is the ratedetermining step at higher temperatures; in this case the flux ishardly affected by surface contamination. From Fig. 1 it becomesclear that for thinner membranes the effect of contaminants onthe H2 flux will be more pronounced.
Besides CO2, Hou et al. also investigated the effect of steamon the H2 permeability through a 5–6 �m thick Pd/Ag mem-brane, showing a significant reduction of the H2 flux in thetemperature range of 548–623 K. The influence of steam onthe flux decreased with increasing temperature and at tem-peratures above 673 K almost no effect was found. Also Liet al. [14] found a significant reduction in H2 permeabil-ity of a 10 �m Pd membrane by adding steam to the feedat a temperature of 653 K. The flux reduction is ascribedto contamination of the surface by competitive adsorption ofsteam.
Besides adsorption of components from the feed, contamina-tion of the membrane surface may also be caused by chemicalreactions of components in the feed. From the literature it iskaavatstr[(iwstm
st
associative desorption) at the permeate side and at more ele-ated temperatures – the transition temperature depends on thehickness of the membrane – H-atom diffusion in the Pd layerSievert’s law). The steep flux lines for contaminated surfacesre caused by limitation of H2 adsorption or desorption at thed surface.
In previous papers no influence on the permeation has beenound for CO2 at temperatures above 623 K, but relatively thickembranes (>80 �m) were used [9,11,12]. Measurements with�m thick membranes have been carried out by Hou et al. [13],
howing an inhibitive effect of CO2 on the flux at temperatures of
nown that Pd particles on a support such as SiO2 or Al2O3 canct as catalyst for the hydrogenation of CO or CO2. Erdohelyi etl. [15] found that CO2 was converted to CH4, while CO was con-erted to CH4, ethane, propane, methanol, dimethylether, andcetaldehyde by a Pd catalyst supported by Al2O3. The quan-ities produced depend on the operating conditions, the type ofupport, the structure of the Pd, and the type of additions addedo the Pd [16,17]. It has also been found that adsorbed CO caneact to carbon and oxygen atoms, CHx and OHy molecules18,19]. The carbon formed can diffuse through the Pd [20,21]Fig. 2) and will form an interstitial solid solution of carbonn the Pd (palladium carbide) [22]. The H2 surface reactionsill be hindered by the presence of carbon at both membrane
urfaces. As a consequence, the H2 flux may decrease, even ifhe hydrogenation of CO or CO2 occurs at only one side of the
embrane.Besides reactions that cause contamination of the membrane
urface also reactions may occur that remove contaminants fromhe surface. As an example, carbon can be removed by hydro-
178 F.C. Gielens et al. / Journal of Membrane Science 279 (2006) 176–185
Table 1Membrane module parameters
Membrane name Composition Thickness (nm) Flow forced through apertures Microsieve H2 activationtemperature (K)
H2 activationtime (h)
Pd (wt.%) Ag (wt.%)
Pd/Ag 77 23 500 No Yes 673 4Pd-1 100 – 900 Yes No 723 3Pd-2 100 – 1000 Yes No 673 3
genation of the carbon to methane. This reaction is often usedto activate Pd or Pd/Ag membranes. Hsiung et al. [23] – usinga commercial Pd/Ag membrane of 120 �m thick – found thatafter CO2 addition was stopped for more than 4 h, still H2O andCH4 were detected in the retentate and CH4 but no H2O in thepermeate. This implies that reaction rates involved are ratherlow.
3. Experimental
3.1. Membrane and module description
Pinhole free membranes were obtained by sputtering a thinlayer of Pd or Pd/Ag onto a closed SiO2 layer prepared on top ofa silicon wafer. After sputtering, the SiO2 is partly removed byetching apertures in the silicon wafer to free the membrane. In
the case of a so called microsieve supported membranes the SiO2layer was supported by a layer of low stress silicon rich nitride.Circular openings were made in the low stress silicon rich nitrideto create the microsieve. For the work described in this paperthree membrane modules were prepared: one module (Pd/Ag)contained a 77/23 wt.% Pd/Ag membrane layer on a 1.3 �mthick microsieve of silicon rich nitride and silicon oxide and twomodules (Pd-1, Pd-2) contained a pure Pd membrane withoutmicrosieve support. In the last two modules the flow was forcedthrough the apertures present in the Si wafer, leading to an evenlower mass transfer resistance in the gas phase. Both fabricationprocesses have been described in other publications [24–26].The free membrane area was 8.8 mm2 for all membranes. Thefluxes are based on this area. The thickness of the membranesand other properties of the three membrane modules are givenin Table 1.
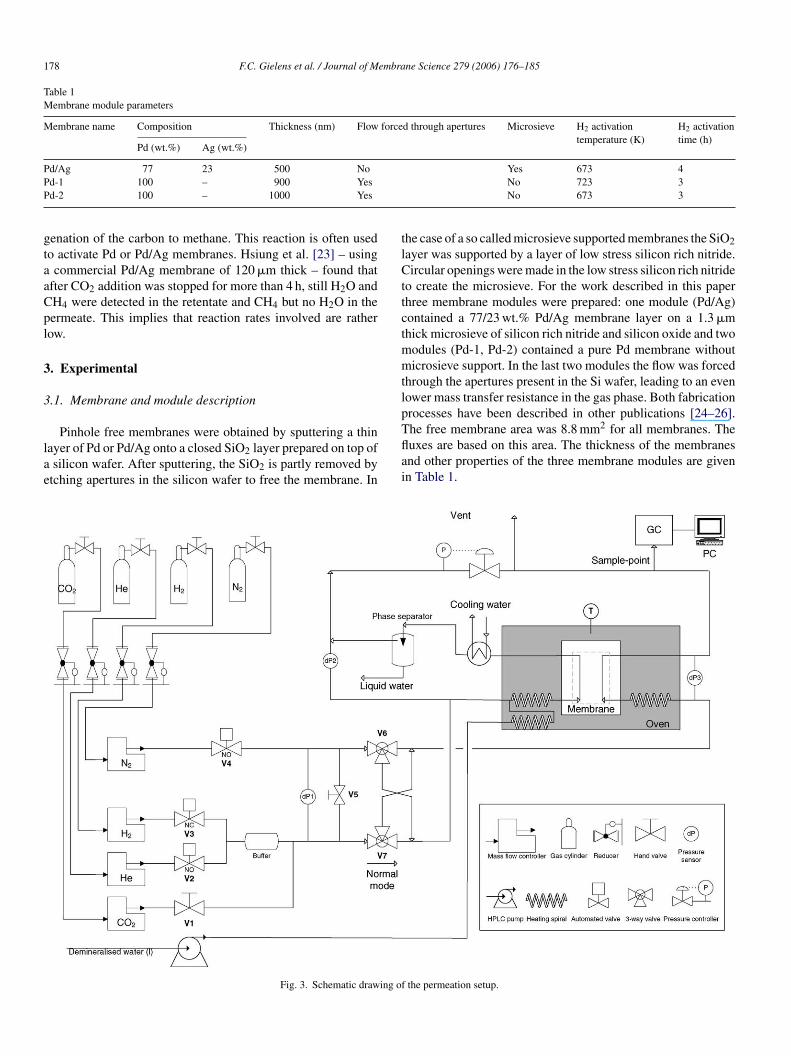
Fig. 3. Schematic drawing of
the permeation setup.
F.C. Gielens et al. / Journal of Membrane Science 279 (2006) 176–185 179
3.2. Membrane permeation
The H2 permeance of the membranes is determined in thesetup given in Fig. 3. The retentate and permeate side were con-tinuously flushed: the retentate side with a known mixture ofH2 and He, and the permeate side with N2. All gas flows wereregulated by mass flow controllers. The pressure at the retentateside was regulated slightly above atmospheric pressure with apressure controller and at the permeate side the flow outlet wasnot restricted. The permeate composition was measured by a gaschromatograph (GC), equipped with a molsieve 5 A column andthermal conductivity detector (TCD). Argon was used as carriergas, which made the TCD highly sensitive to He and H2 andmuch less sensitive for N2. The purities of H2, He, N2 and Arwere 99.999 vol.%; the CO2 purity was 99.995 vol.%.
Carbon dioxide or water was added to the H2/He mixture byan additional mass flow controller and a HPLC pump, respec-tively. The water was evaporated by pumping it through a stain-less steel spiral of 0.8 mm inner diameter and 1.5 m length, whichwas placed in an oven together with the membrane module. Afterthe steam passed the spiral, it entered a second stainless steel spi-ral of 4 mm inner diameter and 3 m length where the steam wasmixed with the H2 and He and temperatures were equalised. Thesteam flow rate was calculated from the amount of liquid thatwas pumped by the HPLC pump into the spiral. During steamaddition, the steam was removed from the retentate outlet byaapsw
(mbsatdbsg
rTctmoikm
3
b
Table 2Measurement history of the Pd-1 membrane
Time (h) Temperature (K) Measurement type
0 723 H2 activation4 723 Stabilization, 20 vol.% H2
148 723 Influence CO2, 20 vol.% CO2 and H2
291 723 Stabilization, 20 vol.% H2
405 723 Influence steam, 20 vol.% steam and H2
477 723 Stabilization, 20 vol.% H2
573 723 Influence CO2, 20 vol.% CO2 and H2
621 723 Stabilization, 20 vol.% H2
731 723 Influence steam, 20 vol.% steam and H2
793 723 Stabilization, 20 vol.% H2
883 723 Influence steam, 20 vol.% steam and H2
979 723 Stabilization, 20 vol.% H2
1047 723 Variable H2 feed concentration1209 673 Temperature change and stabilization,
20 vol.% H2
1249 673 Influence steam, 20 vol.% steam and H2
1300 673 Variable H2 feed concentration1518 673 Influence CO2, 20 vol.% CO2 and H2
1587 673 Stabilization, 20 vol.% H2
1680 623 Temperature change and stabilization,20 vol.% H2
1703 623 Influence steam, 20 vol.% steam and H2
1751 623 Variable H2 feed concentration1915 623 Influence CO2, 20 vol.% CO2 and H2
2107 623 Stabilization, 20 vol.% H2
Table 3Measurement history of the Pd-2 membrane
Time (h) Temperature (K) Measurement type
0 673 H2 activation4 673 Stabilization, 20 vol.% H2
75 673 Influence CO2, 20 vol.% CO2 and H2
456 673 Stabilization, 20 vol.% H2
566 673 Influence CO2, 20 vol.% CO2 and H2
753 673 Stabilization, 20 vol.% H2
ior of the membrane. In order to investigate the occurrence ofthe reverse WGS reaction, small grains of Pd, Pd/Ag and stain-less steel (ss316) were tested for catalytic activity in a separatesetup, shown in Fig. 4. Stainless steel is investigated, because
Table 4Measurement history of the Pd/Ag membrane
Time (h) Temperature (K) Measurement type
0 723 H2 activation4 723 Stabilization, 20 vol.% H2
54 623 Stabilization, 20 vol.% H2
84 673 Stabilization, 20 vol.% H2
256 673 Influence CO2, 20 vol.% CO2 and H2
391 673 Stabilization, 20 vol.% H2
441 673 Influence CO2, 20 vol.% CO2 and H2
511 673 Stabilization, 20 vol.% H2
674 673 Stabilization, 20 vol.%, switchedmembrane sides feed/flush
720 673 Influence CO2, 20 vol.% CO2 and H2
(switched)855 673 Stabilization, 20 vol.% (switched)
water-cooled condenser and knockout drum. After the steamddition was stopped the spiral was disconnected from the HPLCump and most of the water was removed from the spiral by thelight overpressure in the system; thereafter the tube was closedith a plug.After placing the membrane module in the experimental setup
and also when the temperature was changed between experi-ents) the absence of pinholes in the membrane was determined
y feeding the retentate side with pure He and the permeateide with N2. A small positive trans-membrane pressure waspplied and the permeate was checked on the presence of He. Theemperature of the oven was increased with 3 K/min. After theesired temperature was reached, the membrane was activatedy feeding a mixture of 20 vol.% H2 in He to both membraneides (retentate and permeate). The applied activation times areiven in Table 1.
The permeation experiments with CO2 and steam were car-ied out separately (CO2 and steam were never added together).he influence of CO2 and steam were both measured at a feedoncentration of 20 vol.% of CO2 or H2O. The H2 feed concen-ration was kept at 20 vol.% by adapting the He flow. Experi-
ents with and without 20 vol.% of CO2 or steam were carriedut at 623, 673 and 723 K. The total feed flow rate was var-ed between 300 and 500 mL/min. The sweep gas flow rate wasept constant at 300 mL/min. The measurement history of theembranes are summarized in Tables 2–4.
.3. Changes in feed composition caused by reactions
Reactions might change the feed composition of the mem-rane during CO2 addition and influence the permeation behav-
180 F.C. Gielens et al. / Journal of Membrane Science 279 (2006) 176–185
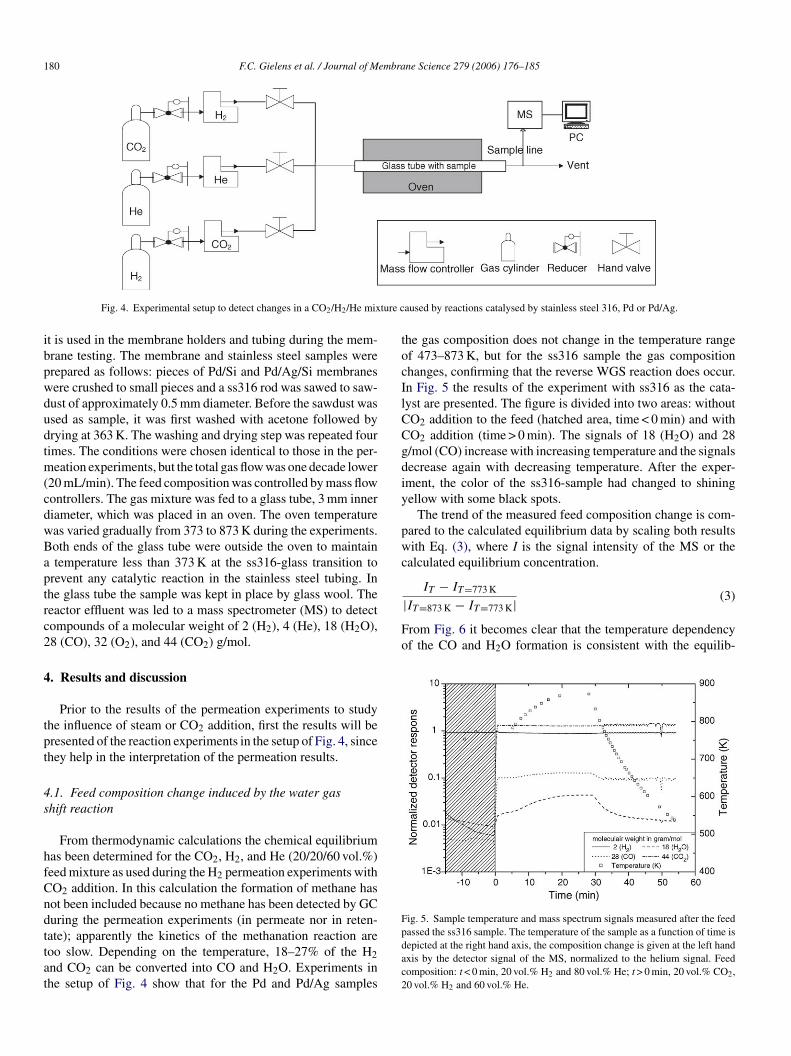
Fig. 4. Experimental setup to detect changes in a CO2/H2/He mixture caused by reactions catalysed by stainless steel 316, Pd or Pd/Ag.
it is used in the membrane holders and tubing during the mem-brane testing. The membrane and stainless steel samples wereprepared as follows: pieces of Pd/Si and Pd/Ag/Si membraneswere crushed to small pieces and a ss316 rod was sawed to saw-dust of approximately 0.5 mm diameter. Before the sawdust wasused as sample, it was first washed with acetone followed bydrying at 363 K. The washing and drying step was repeated fourtimes. The conditions were chosen identical to those in the per-meation experiments, but the total gas flow was one decade lower(20 mL/min). The feed composition was controlled by mass flowcontrollers. The gas mixture was fed to a glass tube, 3 mm innerdiameter, which was placed in an oven. The oven temperaturewas varied gradually from 373 to 873 K during the experiments.Both ends of the glass tube were outside the oven to maintaina temperature less than 373 K at the ss316-glass transition toprevent any catalytic reaction in the stainless steel tubing. Inthe glass tube the sample was kept in place by glass wool. Thereactor effluent was led to a mass spectrometer (MS) to detectcompounds of a molecular weight of 2 (H2), 4 (He), 18 (H2O),28 (CO), 32 (O2), and 44 (CO2) g/mol.
4. Results and discussion
Prior to the results of the permeation experiments to studythe influence of steam or CO2 addition, first the results will bept
4s
hfCndttat
the gas composition does not change in the temperature rangeof 473–873 K, but for the ss316 sample the gas compositionchanges, confirming that the reverse WGS reaction does occur.In Fig. 5 the results of the experiment with ss316 as the cata-lyst are presented. The figure is divided into two areas: withoutCO2 addition to the feed (hatched area, time < 0 min) and withCO2 addition (time > 0 min). The signals of 18 (H2O) and 28g/mol (CO) increase with increasing temperature and the signalsdecrease again with decreasing temperature. After the exper-iment, the color of the ss316-sample had changed to shiningyellow with some black spots.
The trend of the measured feed composition change is com-pared to the calculated equilibrium data by scaling both resultswith Eq. (3), where I is the signal intensity of the MS or thecalculated equilibrium concentration.
IT − IT=773 K
|IT=873 K − IT=773 K| (3)
From Fig. 6 it becomes clear that the temperature dependencyof the CO and H2O formation is consistent with the equilib-
Fpdac2
resented of the reaction experiments in the setup of Fig. 4, sincehey help in the interpretation of the permeation results.
.1. Feed composition change induced by the water gashift reaction
From thermodynamic calculations the chemical equilibriumas been determined for the CO2, H2, and He (20/20/60 vol.%)eed mixture as used during the H2 permeation experiments withO2 addition. In this calculation the formation of methane hasot been included because no methane has been detected by GCuring the permeation experiments (in permeate nor in reten-ate); apparently the kinetics of the methanation reaction areoo slow. Depending on the temperature, 18–27% of the H2nd CO2 can be converted into CO and H2O. Experiments inhe setup of Fig. 4 show that for the Pd and Pd/Ag samples
ig. 5. Sample temperature and mass spectrum signals measured after the feedassed the ss316 sample. The temperature of the sample as a function of time isepicted at the right hand axis, the composition change is given at the left handxis by the detector signal of the MS, normalized to the helium signal. Feedomposition: t < 0 min, 20 vol.% H2 and 80 vol.% He; t > 0 min, 20 vol.% CO2,0 vol.% H2 and 60 vol.% He.
F.C. Gielens et al. / Journal of Membrane Science 279 (2006) 176–185 181
Fig. 6. Mass spectrometer results of catalytic activity of ss316 sample comparedto thermodynamic equilibrium calculations (scaled according to Eq. (3)). Gasfeed composition was 20 vol.% H2, 20 vol.% CO2 and 60 vol.% He.
rium calculations. At higher temperatures more CO and H2Oare formed and less CO2 and H2 are present in the gas mix-ture. Therefore, we conclude that if CO2 and H2 are present,the formation of H2O and CO will occur during the permeationexperiments. In retrospect the interpretation of the results wouldhave been simpler if no stainless steel parts had been applied inthe experimental setup.
4.2. Steam influence on the H2 permeation
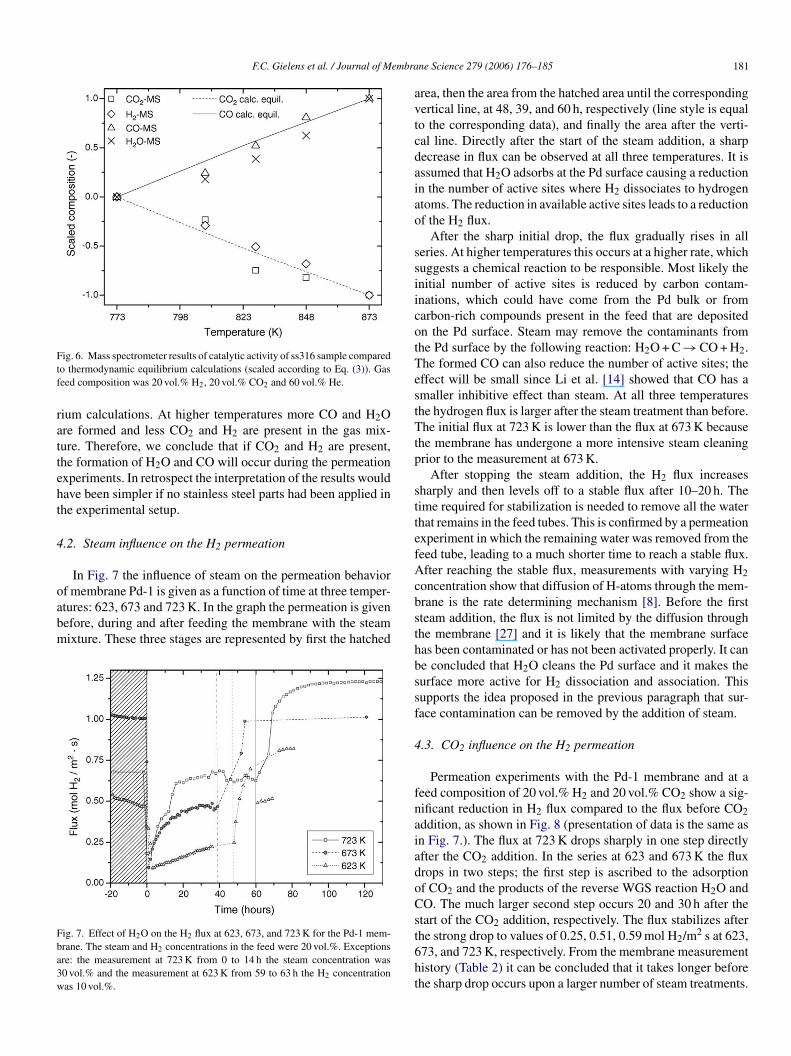
In Fig. 7 the influence of steam on the permeation behaviorof membrane Pd-1 is given as a function of time at three temper-atures: 623, 673 and 723 K. In the graph the permeation is givenbefore, during and after feeding the membrane with the steammixture. These three stages are represented by first the hatched
Fba3w
area, then the area from the hatched area until the correspondingvertical line, at 48, 39, and 60 h, respectively (line style is equalto the corresponding data), and finally the area after the verti-cal line. Directly after the start of the steam addition, a sharpdecrease in flux can be observed at all three temperatures. It isassumed that H2O adsorbs at the Pd surface causing a reductionin the number of active sites where H2 dissociates to hydrogenatoms. The reduction in available active sites leads to a reductionof the H2 flux.
After the sharp initial drop, the flux gradually rises in allseries. At higher temperatures this occurs at a higher rate, whichsuggests a chemical reaction to be responsible. Most likely theinitial number of active sites is reduced by carbon contam-inations, which could have come from the Pd bulk or fromcarbon-rich compounds present in the feed that are depositedon the Pd surface. Steam may remove the contaminants fromthe Pd surface by the following reaction: H2O + C → CO + H2.The formed CO can also reduce the number of active sites; theeffect will be small since Li et al. [14] showed that CO has asmaller inhibitive effect than steam. At all three temperaturesthe hydrogen flux is larger after the steam treatment than before.The initial flux at 723 K is lower than the flux at 673 K becausethe membrane has undergone a more intensive steam cleaningprior to the measurement at 673 K.
After stopping the steam addition, the H2 flux increasessharply and then levels off to a stable flux after 10–20 h. ThettefAcbsthbssf
4
fnaiadoCst6ht
ig. 7. Effect of H2O on the H2 flux at 623, 673, and 723 K for the Pd-1 mem-rane. The steam and H2 concentrations in the feed were 20 vol.%. Exceptionsre: the measurement at 723 K from 0 to 14 h the steam concentration was0 vol.% and the measurement at 623 K from 59 to 63 h the H2 concentrationas 10 vol.%.
ime required for stabilization is needed to remove all the waterhat remains in the feed tubes. This is confirmed by a permeationxperiment in which the remaining water was removed from theeed tube, leading to a much shorter time to reach a stable flux.fter reaching the stable flux, measurements with varying H2
oncentration show that diffusion of H-atoms through the mem-rane is the rate determining mechanism [8]. Before the firstteam addition, the flux is not limited by the diffusion throughhe membrane [27] and it is likely that the membrane surfaceas been contaminated or has not been activated properly. It cane concluded that H2O cleans the Pd surface and it makes theurface more active for H2 dissociation and association. Thisupports the idea proposed in the previous paragraph that sur-ace contamination can be removed by the addition of steam.
.3. CO2 influence on the H2 permeation
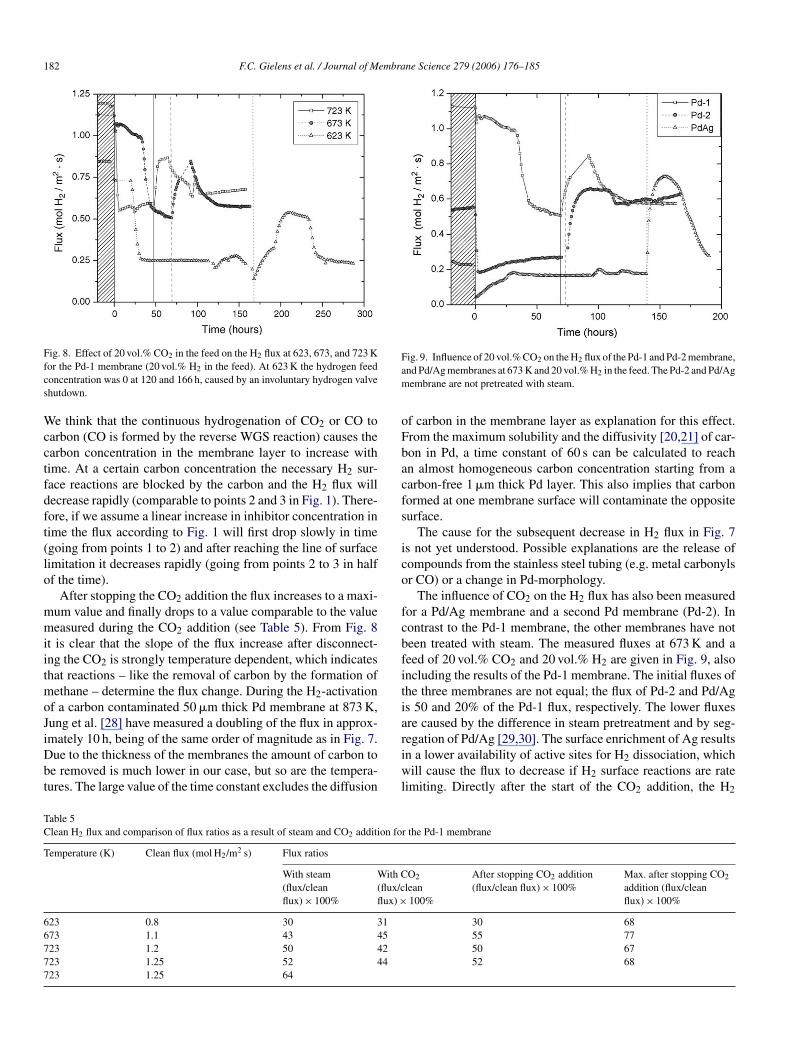
Permeation experiments with the Pd-1 membrane and at aeed composition of 20 vol.% H2 and 20 vol.% CO2 show a sig-ificant reduction in H2 flux compared to the flux before CO2ddition, as shown in Fig. 8 (presentation of data is the same asn Fig. 7.). The flux at 723 K drops sharply in one step directlyfter the CO2 addition. In the series at 623 and 673 K the fluxrops in two steps; the first step is ascribed to the adsorptionf CO2 and the products of the reverse WGS reaction H2O andO. The much larger second step occurs 20 and 30 h after the
tart of the CO2 addition, respectively. The flux stabilizes afterhe strong drop to values of 0.25, 0.51, 0.59 mol H2/m2 s at 623,73, and 723 K, respectively. From the membrane measurementistory (Table 2) it can be concluded that it takes longer beforehe sharp drop occurs upon a larger number of steam treatments.
182 F.C. Gielens et al. / Journal of Membrane Science 279 (2006) 176–185
Fig. 8. Effect of 20 vol.% CO2 in the feed on the H2 flux at 623, 673, and 723 Kfor the Pd-1 membrane (20 vol.% H2 in the feed). At 623 K the hydrogen feedconcentration was 0 at 120 and 166 h, caused by an involuntary hydrogen valveshutdown.
We think that the continuous hydrogenation of CO2 or CO tocarbon (CO is formed by the reverse WGS reaction) causes thecarbon concentration in the membrane layer to increase withtime. At a certain carbon concentration the necessary H2 sur-face reactions are blocked by the carbon and the H2 flux willdecrease rapidly (comparable to points 2 and 3 in Fig. 1). There-fore, if we assume a linear increase in inhibitor concentration intime the flux according to Fig. 1 will first drop slowly in time(going from points 1 to 2) and after reaching the line of surfacelimitation it decreases rapidly (going from points 2 to 3 in halfof the time).
After stopping the CO2 addition the flux increases to a maxi-mum value and finally drops to a value comparable to the valuemeasured during the CO2 addition (see Table 5). From Fig. 8it is clear that the slope of the flux increase after disconnect-ing the CO2 is strongly temperature dependent, which indicatesthat reactions – like the removal of carbon by the formation ofmethane – determine the flux change. During the H2-activationof a carbon contaminated 50 �m thick Pd membrane at 873 K,Jung et al. [28] have measured a doubling of the flux in approx-imately 10 h, being of the same order of magnitude as in Fig. 7.Due to the thickness of the membranes the amount of carbon tobe removed is much lower in our case, but so are the tempera-tures. The large value of the time constant excludes the diffusion
Fig. 9. Influence of 20 vol.% CO2 on the H2 flux of the Pd-1 and Pd-2 membrane,and Pd/Ag membranes at 673 K and 20 vol.% H2 in the feed. The Pd-2 and Pd/Agmembrane are not pretreated with steam.
of carbon in the membrane layer as explanation for this effect.From the maximum solubility and the diffusivity [20,21] of car-bon in Pd, a time constant of 60 s can be calculated to reachan almost homogeneous carbon concentration starting from acarbon-free 1 �m thick Pd layer. This also implies that carbonformed at one membrane surface will contaminate the oppositesurface.
The cause for the subsequent decrease in H2 flux in Fig. 7is not yet understood. Possible explanations are the release ofcompounds from the stainless steel tubing (e.g. metal carbonylsor CO) or a change in Pd-morphology.
The influence of CO2 on the H2 flux has also been measuredfor a Pd/Ag membrane and a second Pd membrane (Pd-2). Incontrast to the Pd-1 membrane, the other membranes have notbeen treated with steam. The measured fluxes at 673 K and afeed of 20 vol.% CO2 and 20 vol.% H2 are given in Fig. 9, alsoincluding the results of the Pd-1 membrane. The initial fluxes ofthe three membranes are not equal; the flux of Pd-2 and Pd/Agis 50 and 20% of the Pd-1 flux, respectively. The lower fluxesare caused by the difference in steam pretreatment and by seg-regation of Pd/Ag [29,30]. The surface enrichment of Ag resultsin a lower availability of active sites for H2 dissociation, whichwill cause the flux to decrease if H2 surface reactions are ratelimiting. Directly after the start of the CO2 addition, the H2
Table 5C on fo
T
ith Cflux/cux) ×
6 16 57 27 47
lean H2 flux and comparison of flux ratios as a result of steam and CO2 additi
emperature (K) Clean flux (mol H2/m2 s) Flux ratios
With steam(flux/cleanflux) × 100%
W(fl
23 0.8 30 373 1.1 43 423 1.2 50 423 1.25 52 423 1.25 64
r the Pd-1 membrane
O2
lean100%
After stopping CO2 addition(flux/clean flux) × 100%
Max. after stopping CO2
addition (flux/cleanflux) × 100%
30 6855 7750 6752 68
F.C. Gielens et al. / Journal of Membrane Science 279 (2006) 176–185 183
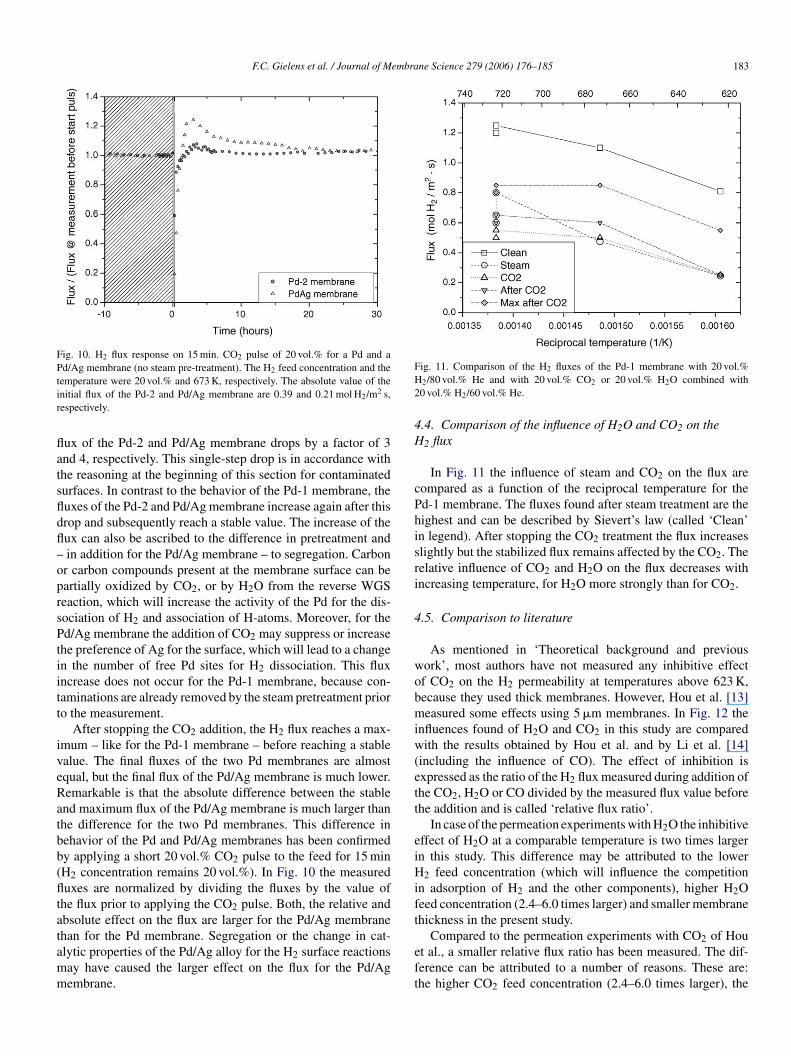
Fig. 10. H2 flux response on 15 min. CO2 pulse of 20 vol.% for a Pd and aPd/Ag membrane (no steam pre-treatment). The H2 feed concentration and thetemperature were 20 vol.% and 673 K, respectively. The absolute value of theinitial flux of the Pd-2 and Pd/Ag membrane are 0.39 and 0.21 mol H2/m2 s,respectively.
flux of the Pd-2 and Pd/Ag membrane drops by a factor of 3and 4, respectively. This single-step drop is in accordance withthe reasoning at the beginning of this section for contaminatedsurfaces. In contrast to the behavior of the Pd-1 membrane, thefluxes of the Pd-2 and Pd/Ag membrane increase again after thisdrop and subsequently reach a stable value. The increase of theflux can also be ascribed to the difference in pretreatment and– in addition for the Pd/Ag membrane – to segregation. Carbonor carbon compounds present at the membrane surface can bepartially oxidized by CO2, or by H2O from the reverse WGSreaction, which will increase the activity of the Pd for the dis-sociation of H2 and association of H-atoms. Moreover, for thePd/Ag membrane the addition of CO2 may suppress or increasethe preference of Ag for the surface, which will lead to a changein the number of free Pd sites for H2 dissociation. This fluxincrease does not occur for the Pd-1 membrane, because con-taminations are already removed by the steam pretreatment priorto the measurement.
After stopping the CO2 addition, the H2 flux reaches a max-imum – like for the Pd-1 membrane – before reaching a stablevalue. The final fluxes of the two Pd membranes are almostequal, but the final flux of the Pd/Ag membrane is much lower.Remarkable is that the absolute difference between the stableand maximum flux of the Pd/Ag membrane is much larger thanthe difference for the two Pd membranes. This difference inbehavior of the Pd and Pd/Ag membranes has been confirmedb(fltatamm
Fig. 11. Comparison of the H2 fluxes of the Pd-1 membrane with 20 vol.%H2/80 vol.% He and with 20 vol.% CO2 or 20 vol.% H2O combined with20 vol.% H2/60 vol.% He.
4.4. Comparison of the influence of H2O and CO2 on theH2 flux
In Fig. 11 the influence of steam and CO2 on the flux arecompared as a function of the reciprocal temperature for thePd-1 membrane. The fluxes found after steam treatment are thehighest and can be described by Sievert’s law (called ‘Clean’in legend). After stopping the CO2 treatment the flux increasesslightly but the stabilized flux remains affected by the CO2. Therelative influence of CO2 and H2O on the flux decreases withincreasing temperature, for H2O more strongly than for CO2.
4.5. Comparison to literature
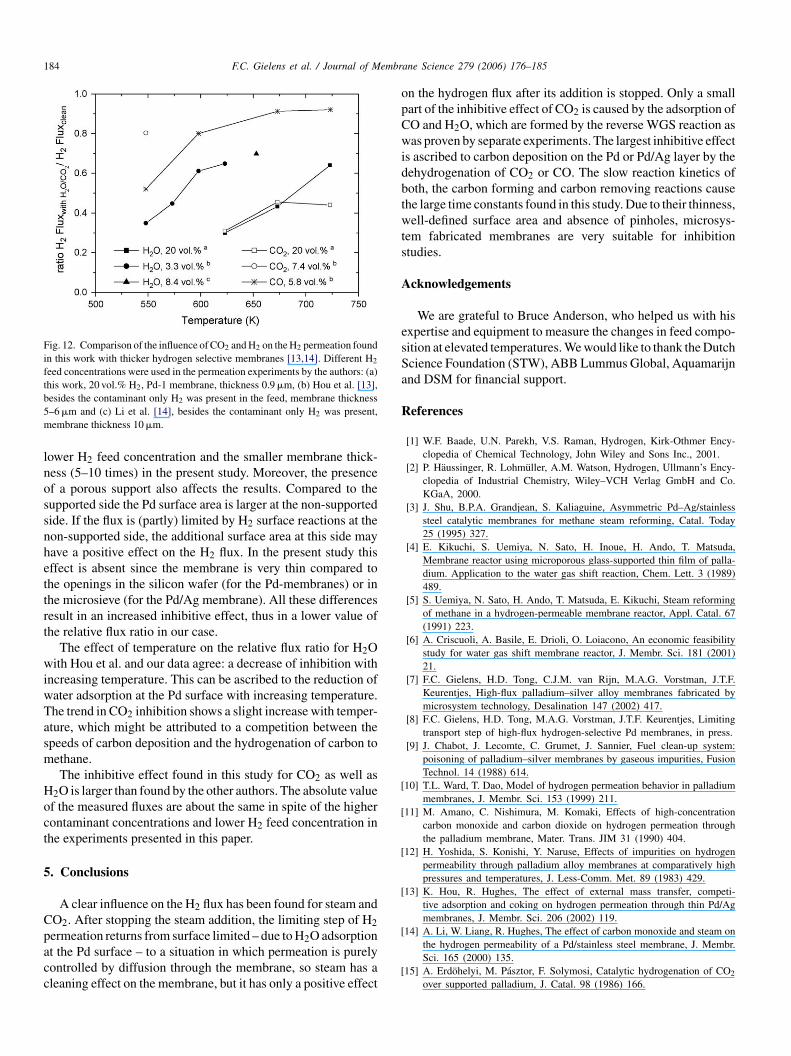
As mentioned in ‘Theoretical background and previouswork’, most authors have not measured any inhibitive effectof CO2 on the H2 permeability at temperatures above 623 K,because they used thick membranes. However, Hou et al. [13]measured some effects using 5 �m membranes. In Fig. 12 theinfluences found of H2O and CO2 in this study are comparedwith the results obtained by Hou et al. and by Li et al. [14](including the influence of CO). The effect of inhibition isexpressed as the ratio of the H2 flux measured during addition ofthe CO2, H2O or CO divided by the measured flux value beforethe addition and is called ‘relative flux ratio’.
In case of the permeation experiments with H O the inhibitiveeiHift
eft
y applying a short 20 vol.% CO2 pulse to the feed for 15 minH2 concentration remains 20 vol.%). In Fig. 10 the measureduxes are normalized by dividing the fluxes by the value of
he flux prior to applying the CO2 pulse. Both, the relative andbsolute effect on the flux are larger for the Pd/Ag membranehan for the Pd membrane. Segregation or the change in cat-lytic properties of the Pd/Ag alloy for the H2 surface reactionsay have caused the larger effect on the flux for the Pd/Agembrane.
2ffect of H2O at a comparable temperature is two times largern this study. This difference may be attributed to the lower
2 feed concentration (which will influence the competitionn adsorption of H2 and the other components), higher H2Oeed concentration (2.4–6.0 times larger) and smaller membranehickness in the present study.
Compared to the permeation experiments with CO2 of Hout al., a smaller relative flux ratio has been measured. The dif-erence can be attributed to a number of reasons. These are:he higher CO2 feed concentration (2.4–6.0 times larger), the
184 F.C. Gielens et al. / Journal of Membrane Science 279 (2006) 176–185
Fig. 12. Comparison of the influence of CO2 and H2 on the H2 permeation foundin this work with thicker hydrogen selective membranes [13,14]. Different H2
feed concentrations were used in the permeation experiments by the authors: (a)this work, 20 vol.% H2, Pd-1 membrane, thickness 0.9 �m, (b) Hou et al. [13],besides the contaminant only H2 was present in the feed, membrane thickness5–6 �m and (c) Li et al. [14], besides the contaminant only H2 was present,membrane thickness 10 �m.
lower H2 feed concentration and the smaller membrane thick-ness (5–10 times) in the present study. Moreover, the presenceof a porous support also affects the results. Compared to thesupported side the Pd surface area is larger at the non-supportedside. If the flux is (partly) limited by H2 surface reactions at thenon-supported side, the additional surface area at this side mayhave a positive effect on the H2 flux. In the present study thiseffect is absent since the membrane is very thin compared tothe openings in the silicon wafer (for the Pd-membranes) or inthe microsieve (for the Pd/Ag membrane). All these differencesresult in an increased inhibitive effect, thus in a lower value ofthe relative flux ratio in our case.
The effect of temperature on the relative flux ratio for H2Owith Hou et al. and our data agree: a decrease of inhibition withincreasing temperature. This can be ascribed to the reduction ofwater adsorption at the Pd surface with increasing temperature.The trend in CO2 inhibition shows a slight increase with temper-ature, which might be attributed to a competition between thespeeds of carbon deposition and the hydrogenation of carbon tomethane.
The inhibitive effect found in this study for CO2 as well asH2O is larger than found by the other authors. The absolute valueof the measured fluxes are about the same in spite of the highercontaminant concentrations and lower H2 feed concentration inthe experiments presented in this paper.
5
Cpacc
on the hydrogen flux after its addition is stopped. Only a smallpart of the inhibitive effect of CO2 is caused by the adsorption ofCO and H2O, which are formed by the reverse WGS reaction aswas proven by separate experiments. The largest inhibitive effectis ascribed to carbon deposition on the Pd or Pd/Ag layer by thedehydrogenation of CO2 or CO. The slow reaction kinetics ofboth, the carbon forming and carbon removing reactions causethe large time constants found in this study. Due to their thinness,well-defined surface area and absence of pinholes, microsys-tem fabricated membranes are very suitable for inhibitionstudies.
Acknowledgements
We are grateful to Bruce Anderson, who helped us with hisexpertise and equipment to measure the changes in feed compo-sition at elevated temperatures. We would like to thank the DutchScience Foundation (STW), ABB Lummus Global, Aquamarijnand DSM for financial support.
References
[1] W.F. Baade, U.N. Parekh, V.S. Raman, Hydrogen, Kirk-Othmer Ency-clopedia of Chemical Technology, John Wiley and Sons Inc., 2001.
[2] P. Haussinger, R. Lohmuller, A.M. Watson, Hydrogen, Ullmann’s Ency-clopedia of Industrial Chemistry, Wiley–VCH Verlag GmbH and Co.
[
[
[
[
[
[
. Conclusions
A clear influence on the H2 flux has been found for steam andO2. After stopping the steam addition, the limiting step of H2ermeation returns from surface limited – due to H2O adsorptiont the Pd surface – to a situation in which permeation is purelyontrolled by diffusion through the membrane, so steam has aleaning effect on the membrane, but it has only a positive effect
KGaA, 2000.[3] J. Shu, B.P.A. Grandjean, S. Kaliaguine, Asymmetric Pd–Ag/stainless
steel catalytic membranes for methane steam reforming, Catal. Today25 (1995) 327.
[4] E. Kikuchi, S. Uemiya, N. Sato, H. Inoue, H. Ando, T. Matsuda,Membrane reactor using microporous glass-supported thin film of palla-dium. Application to the water gas shift reaction, Chem. Lett. 3 (1989)489.
[5] S. Uemiya, N. Sato, H. Ando, T. Matsuda, E. Kikuchi, Steam reformingof methane in a hydrogen-permeable membrane reactor, Appl. Catal. 67(1991) 223.
[6] A. Criscuoli, A. Basile, E. Drioli, O. Loiacono, An economic feasibilitystudy for water gas shift membrane reactor, J. Membr. Sci. 181 (2001)21.
[7] F.C. Gielens, H.D. Tong, C.J.M. van Rijn, M.A.G. Vorstman, J.T.F.Keurentjes, High-flux palladium–silver alloy membranes fabricated bymicrosystem technology, Desalination 147 (2002) 417.
[8] F.C. Gielens, H.D. Tong, M.A.G. Vorstman, J.T.F. Keurentjes, Limitingtransport step of high-flux hydrogen-selective Pd membranes, in press.
[9] J. Chabot, J. Lecomte, C. Grumet, J. Sannier, Fuel clean-up system:poisoning of palladium–silver membranes by gaseous impurities, FusionTechnol. 14 (1988) 614.
10] T.L. Ward, T. Dao, Model of hydrogen permeation behavior in palladiummembranes, J. Membr. Sci. 153 (1999) 211.
11] M. Amano, C. Nishimura, M. Komaki, Effects of high-concentrationcarbon monoxide and carbon dioxide on hydrogen permeation throughthe palladium membrane, Mater. Trans. JIM 31 (1990) 404.
12] H. Yoshida, S. Konishi, Y. Naruse, Effects of impurities on hydrogenpermeability through palladium alloy membranes at comparatively highpressures and temperatures, J. Less-Comm. Met. 89 (1983) 429.
13] K. Hou, R. Hughes, The effect of external mass transfer, competi-tive adsorption and coking on hydrogen permeation through thin Pd/Agmembranes, J. Membr. Sci. 206 (2002) 119.
14] A. Li, W. Liang, R. Hughes, The effect of carbon monoxide and steam onthe hydrogen permeability of a Pd/stainless steel membrane, J. Membr.Sci. 165 (2000) 135.
15] A. Erdohelyi, M. Pasztor, F. Solymosi, Catalytic hydrogenation of CO2
over supported palladium, J. Catal. 98 (1986) 166.
F.C. Gielens et al. / Journal of Membrane Science 279 (2006) 176–185 185
[16] A.P. Gloor, R. Prins, Influence of chlorine and metal cation impuritiesin the CO hydrogenation over Pd/SiO2 and Rh/SiO2, Recl. Trav. Chim.Pays-Bas 113 (1994) 481.
[17] B. Klotzer, W. Unterberger, K. Hayek, Adsorption and hydrogenation ofCO on Pd(1 1 1) and Rh(1 1 1) modified by subsurface vanadium, Surf.Sci. 532–535 (2003) 142.
[18] T. Mori, H. Masuda, H. Imai, A. Miyamoto, R. Hasebe, Y. Murakami,Kinetics, isotope effects, and mechanism of the hydrogenation of carbonmonoxide on a supported palladium catalyst, J. Phys. Chem. 87 (1983)3648.
[19] V. Matolin, M. Rebholz, N. Kruse, Defect-induced dissociation of COon palladium, Surf. Sci. 245 (1991) 233.
[20] R.T. Yang, P.J. Goethel, J.M. Schwartz, C.R.F. Lund, Solubility anddiffusivity of carbon in metals, J. Catal. 122 (1990) 211.
[21] H. Yokoyama, H. Numakura, M. Koiwa, The solubility and diffusion ofcarbon in palladium, Acta Mater. 46 (1998) 2823.
[22] S.B. Ziemecki, G.A. Jones, D.G. Swartzfager, R.L. Harlow, J. Faber,Formation of interstitial palladium-carbon phase by interaction of ethy-lene, acetylene, and carbon monoxide with palladium, J. Am. Chem.Soc. 107 (1985) 4547.
[23] T.H. Hsiung, D.D. Christman, E.J. Hunter, A.R. Homyak, Methane for-mation on H2 purification using a commercial Pd–Ag membrane, AIChEJ. 45 (1999) 204.
[24] H.D. Tong, F.C. Gielens, J.W. Berenschot, M.J. de Boer, J.G.E. Gar-deniers, W. Nijdam, C.J.M. van Rijn, M.C. Elwenspoek, Fabrication
and characterization of MEMS based wafer-scale palladium–silver alloymembranes for hydrogen separation and hydrogenation/dehydrogenationreactions, in: Proceedings of the International Conference on Micro Elec-tro Mechanical Systems (MEMS 02), 2002, p. 268.
[25] H.D. Tong, F.C. Gielens, J.W. Berenschot, M.J. de Boer, J.G.E. Garde-niers, W. Nijdam, C.J.M. van Rijn, M.C. Elwenspoek, Microfabricationof palladium–silver alloy membranes for hydrogen separation, J. Micro-electromech. Syst. 12 (2003) 622.
[26] H.D. Tong, F.C. Gielens, H.T. Hoang, J.W. Berenschot, M.J. de Boer,J.G.E. Gardeniers, H.V. Jansen, C.J.M. van Rijn, M.C. Elwenspoek,A hydrogen separation module based on wafer-scale micromachinedpalladium–silver alloy membranes, in: Proceedings of the 12th Interna-tional Conference on Solid State Sensors, Actuators and Microsystems,Boston, 2003, p. 1742.
[27] F.C. Gielens, H.D. Tong, C.J.M. van Rijn, M.A.G. Vorstman, J.T.F.Keurentjes, Microsystem technology for high-flux hydrogen separationmembranes, J. Membr. Sci. 243 (2004) 203.
[28] S.H. Jung, K. Kusakabe, S. Morooka, S.-D. Kim, Effects of co-existinghydrocarbons on hydrogen permeation through a palladium membrane,J. Membr. Sci. 170 (2000) 53.
[29] F.J. Kuijers, V. Ponec, The surface composition of Pd–Ag alloys, J.Catal. 60 (1979) 100.
[30] J. Shu, B.E.W. Bogondo, B.P.A. Grandjean, A. Adnot, S. Kaliaguine,Surface segregation of Pd–Ag membranes upon hydrogen permeation,Surf. Sci. 291 (1993) 129.
Related Documents


![Titanium Dioxide Additives in Food...trate through cell membranes thus conferring the poten-tial for trafficking across biological barriers including the intestinal mucosa [16–18].](https://static.cupdf.com/doc/110x72/5e7e1f38f0bb6137f2308620/titanium-dioxide-additives-in-food-trate-through-cell-membranes-thus-conferring.jpg)


