This is a repository copy of Influence of sound source characteristics in determining objective speech intelligibility metrics. White Rose Research Online URL for this paper: http://eprints.whiterose.ac.uk/86022/ Version: Accepted Version Article: Zhu, P., Mo, F. and Kang, J. (2015) Influence of sound source characteristics in determining objective speech intelligibility metrics. Applied Acoustics, 89. 188 - 198. ISSN 0003-682X https://doi.org/10.1016/j.apacoust.2014.09.023 [email protected] https://eprints.whiterose.ac.uk/ Reuse Unless indicated otherwise, fulltext items are protected by copyright with all rights reserved. The copyright exception in section 29 of the Copyright, Designs and Patents Act 1988 allows the making of a single copy solely for the purpose of non-commercial research or private study within the limits of fair dealing. The publisher or other rights-holder may allow further reproduction and re-use of this version - refer to the White Rose Research Online record for this item. Where records identify the publisher as the copyright holder, users can verify any specific terms of use on the publisher’s website. Takedown If you consider content in White Rose Research Online to be in breach of UK law, please notify us by emailing [email protected] including the URL of the record and the reason for the withdrawal request.

Welcome message from author
This document is posted to help you gain knowledge. Please leave a comment to let me know what you think about it! Share it to your friends and learn new things together.
Transcript

This is a repository copy of Influence of sound source characteristics in determining objective speech intelligibility metrics.
White Rose Research Online URL for this paper:http://eprints.whiterose.ac.uk/86022/
Version: Accepted Version
Article:
Zhu, P., Mo, F. and Kang, J. (2015) Influence of sound source characteristics in determining objective speech intelligibility metrics. Applied Acoustics, 89. 188 - 198. ISSN 0003-682X
https://doi.org/10.1016/j.apacoust.2014.09.023
[email protected]://eprints.whiterose.ac.uk/
Reuse
Unless indicated otherwise, fulltext items are protected by copyright with all rights reserved. The copyright exception in section 29 of the Copyright, Designs and Patents Act 1988 allows the making of a single copy solely for the purpose of non-commercial research or private study within the limits of fair dealing. The publisher or other rights-holder may allow further reproduction and re-use of this version - refer to the White Rose Research Online record for this item. Where records identify the publisher as the copyright holder, users can verify any specific terms of use on the publisher’s website.
Takedown
If you consider content in White Rose Research Online to be in breach of UK law, please notify us by emailing [email protected] including the URL of the record and the reason for the withdrawal request.

Peisheng Zhu,Fangshuo Mo & Jian Kang: Applied Acoustics [DOI: 10.1016/j.apacoust.2014.09.023]
Applied Acoustics, Volume 89, 2015, Pages 188-198 Page 1
Influence of sound source characteristics indetermining objective speech intelligibility metrics
Peisheng Zhua, Fangshuo Mob*, Jian Kangc
a School of Architecture and Fine Art, Dalian University of Technology, Dalian 116023, Chinab Institute of Acoustics, Tongji University, Shanghai 200092, China
c School of Architecture, University of Sheffield, Western Bank, Sheffield S10 2TN, UK
* Corresponding author
Abstract: Sound source characteristics may be one of the main causes of objective speech intelligibilitymetric inaccuracy. In this study, the influences of the sound source directivity and frequency responsewere investigated using three typical sound sources: an artificial mouth, a monitor speaker, and adodecahedral sound source. The results show that, the simultaneous influences of directivity andfrequency response on the objective speech intelligibility metric are significant, typically with a variationof 0.147 in speech transmission index (STI); sound source directivity may also result in a noticeabledifference in the objective speech intelligibility metric, typically with a variation of 0.123 in STI. Incomparison with sound sources with a high directivity index (DI), the measurement results for soundsources with a relatively low DI may be higher when background noise is high, and may be lower whenbackground noise is low. The influence of sound source directivity may also depend on the room acousticconditions, and at receiver position where reflections are abundant, the influence of sound sourcedirectivity may be more significant. Not applying frequency response equalisation resulted in large errorsin the values being measured, which deviate from the real values of STI by up to 0.172, depending on theoriginal frequency response characteristics of the sound sources that are used.
Keywords: sound source characteristics; directivity; frequency response; speech intelligibility;objective speech intelligibility metric.
2015 Applied AcousticsDate Received: 17 December 2013 Date Accepted: 25 September 2014Publish online: 23 October 2014
1. Introduction
Speech intelligibility is an important metric and can be used to evaluate the sound transmission quality ofauditorium, public address system and communication system. Attempts for objective evaluation ofspeech intelligibility began in the 1920s, and the first objective evaluation metric, the articulation index(AI) [1], that was developed into SII (speech intelligibility index) recently [2], was put forwardsubsequently in the 1940s to 1950s. At the end of the 1970s, other metrics, such as speech transmissionindex (STI) [3] and articulation loss of consonants (%ALcons) [4], were created. STI and SII arecurrently the two most commonly used objective evaluation metrics for speech intelligibility,corresponding to two current standards: IEC 60268-16 [5] and ANSI S3.5 [2], respectively.
There are many factors affecting STI and SII measurement results, and one of them is the characteristicsof the sound source. For sound sources, directivity and frequency response are important characteristicsthat can influence the results of STI and SII measurements [6, 7, 8, 9]. In IEC 60268-16 [5], it is specifiedclearly that STI measurement shall be conducted using a sound source with directivity and radiationpattern similar to those of the average human mouth and an omnidirectional microphone, and there arealso corresponding specifications for the frequency response of sound sources. In ANSI S3.5 [2], there isno clear specification for the directivity of the sound sources, and both directional sound sources and

Peisheng Zhu,Fangshuo Mo & Jian Kang: Applied Acoustics [DOI: 10.1016/j.apacoust.2014.09.023]
Applied Acoustics, Volume 89, 2015, Pages 188-198 Page 2
omnidirectional sound sources can be used. However, there are some specifications for the frequencyresponse of the sound sources.
Bozzoli and Farina [6] conducted a study on the influence of the directivity of three artificial mouths onSTI measurements in different acoustic environments. The study shows that the measurement of STI isnot strongly influenced by the directivity of the artificial mouths, for room acoustics applications becauseof the substantial distance between speaker and receiver, and the presence of numerous reflections.However, in their study the influence of frequency response was not investigated. Another studyconducted by Mapp [7] shows that equalisation can significantly affect the intelligibility. However, thestudy focuses particularly on the influence of sound system equalisation on speech intelligibility, and theinfluence of directivity was not investigated. Petra and Hongistob [8] compared the STI and SIImeasurement methods and suggested that loudspeakers possibly have a considerable influence on the STIand SII measurements. Peng et al. [9] evaluated subjective Chinese speech intelligibility using threesources with different directional patterns: an omnidirectional source, a source with directivity similar toa human speaker, and a human speaker in both real and virtual rooms with different reverberation times.The results show that speech intelligibility scores obtained using an omnidirectional source are lowerthan those obtained using the other two sources. However, the influence of frequency response was notconsidered. Overall, there is still a lack of study of the systematic and simultaneous influence offrequency response and directivity of sound sources on the intelligibility.
The aim of this study is therefore to systematically investigate the influence of sound sourcecharacteristics, including frequency response and directivity in determining objective speechintelligibility metrics. This paper starts with selecting three typical sound sources with differentdirectivities and frequency responses; then the full STI of eight receiver positions, and a total of 32 soundenvironments in three rooms were measured. Finally, analyses of the results are presented.
2. Methods
2.1 Sound sources
In this study, three typical sound sources were used: (1) An artificial mouth GRAS 44AA with adirectivity and radiation pattern similar to those of the average human mouth, which is the standard soundsource for measuring STI recommended in IEC 60268-16 [5]; (2) a monitor loudspeaker GENELEC8020B (cone diameter is 4 inch), which is the alternative sound source for measuring STI recommendedin IEC 60268-16 [5]; and (3) a dodecahedral sound source B&K 4292L, which is one of the soundsources that can be used for measuring SII in ANSI S3.5 [2]. Although the three sound sources arerecommended or allowed to be used in the standards, they are rather different in acoustic characteristics,having completely different frequency response and directivity patterns.
The relative amplitude in relation to 1000 Hz of the three sources was measured in an anechoic hamberusing impulse responses. For the dodecahedral sound source 4292L, because there was no main radiationand the directivity changed with orientations, an average of the 20 frequency responses from the 20measurement points with solid angles covering the measurement sphere based on ISO 3745 [10] wasused as the equivalent frequency response. The results are shown in Figure 1. It can be seen that thefrequency response of the monitor loudspeaker 8020B is the best of the three sound sources, and theresponse is almost flat in the entire frequency range, which also meet the specification in IEC 60268-16[5] that "over the range 88 Hz to 11300 Hz, the 1/3 octave frequency response of the test signal source iswithin ±1 dB when measured in a free field" without frequency response equalisation. The frequencyresponse of the artificial mouth 44AA is poor, which is strongest at 1000 Hz but decreases greatly at otherfrequencies, especially at 125 Hz and as the frequency exceeds 2000 Hz. The frequency response of thedodecahedral sound source 4292L is not good either, which is relatively strong at 125-250 Hz or so, butdecreased as the frequency increases once the frequency exceeds 125 Hz.
The relative amplitude in relation to 1000 Hz of the artificial mouth 44AA and the dodecahedral soundsource 4292L, after being equalised by inverse filtering of the frequency response, was measured in an

Peisheng Zhu,Fangshuo Mo & Jian Kang: Applied Acoustics [DOI: 10.1016/j.apacoust.2014.09.023]
Applied Acoustics, Volume 89, 2015, Pages 188-198 Page 3
anechoic chamber with the same layout for the artificial mouth 44AA and the layout rotating by 180°about the z-axis for the dodecahedral sound source 4292L, and the results are shown in Figure 2. It can beseen that the frequency responses for both the artificial mouth 44AA and the dodecahedral sound source4292L are almost flat in the entire frequency range, both meet the specification in IEC 60268-16 [5].
In Figure 2, the inverse filters were generated from the sound source frequency response measured in ananechoic chamber by employing the Kirkeby method [11, 12]. For the dodecahedral sound source 4292L,the equivalent frequency response H f that was used to generate the inverse filter was the average of20 frequency responses Hn(f) from 20 measurement points with solid angles covering the measurementsphere, which was based on ISO 3745 [10]. H f can be calculated using Eq.(1):
j H fH f H f e (1),
where H f is the equivalent amplitude response and H f is the equivalent phrase response. The
equivalent amplitude response H f can be calculated using Eq. (2):
2
1
14π
N
n nn
H f H f
(2),
where 20N and π5n for equal solid angles ( 1 to 20n ) in the measurement. The equivalent
phrase response H f can be calculated by integrating the energy-weighted average group delay
f , which can be calculated using Eq. (3):
2
21
d d12π d 2π d4π
Nn
n nn
H f H ff H f
f fH f
(3),
where nH f is the phrase response of the n-th solid angle. Using the method above, the equivalentfrequency response H f for the dodecahedral sound source 4292L was obtained and then the inversefilter was generated. The 20 frequency responses measured without frequency response equalisation andafter being equalised for the dodecahedral sound source 4292L are shown in Figure 3 and Figure 4. Ineach figure the relative amplitude is in relation to 1000 Hz of the average amplitude, and the black thickline is the average of the 20 frequency responses. The 20 frequency responses measured in Figure 4 usingdifferent solid angles are from those in Figure 3 by rotating by 180° about the z-axis. It can be observedthat though great improvement was achieved after the frequency response equalisation was applied, the20 frequency responses in Figure 4 are still not equal in the high frequency range. However, the averageof the 20 frequency responses can meet the IEC 60268-16 [5] specification.
In Figure 5 the horizontal and vertical directivity patterns of the three sources at 250, 500, 1000, 2000,4000, and 8000 Hz are shown, where the manufacturer provides the data for the monitor loudspeaker8020B, the data for the dodecahedral sound source 4292L are based on the product description [13], andthe data for the artificial mouth 44AA are obtained through measurements in this study in an anechoicchamber. The octave band directivity index (DI) for the three sources is also listed in Table 1.
Table1. The octave band DI for the three sound sources.
Frequency band (Hz) 125 250 500 1000 2000 4000 8000
B&K 4292L (dB) 0 0 0 0 0 0 0
GRAS 44AA (dB) 0.6 1.2 1.3 1.7 3.9 4.8 6.3
GENELEC 8020B (dB) 1.2 0.9 3.3 5.7 8.1 9.3 9.1

Peisheng Zhu,Fangshuo Mo & Jian Kang: Applied Acoustics [DOI: 10.1016/j.apacoust.2014.09.023]
Applied Acoustics, Volume 89, 2015, Pages 188-198 Page 4
102 103 104-50
-40
-30
-20
-10
0
10
20
Frequency /Hz
Rel
ativ
e am
plitu
de /d
B
44AA8020B4292L
Fig. 1. The relative amplitude in relation to1000 Hz of the three sound sources, measured
in an anechoic chamber.
102 103 104-50
-40
-30
-20
-10
0
10
20
Frequency /Hz
Rel
ativ
e am
plitu
de /d
B
44AA4292L
Fig. 2. The relative amplitude in relation to1000 Hz of the artificial mouth 44AA and thedodecahedral sound source 4292L after beingequalised by inverse filtering of the frequencyresponse, measured in an anechoic chamber.
102 103 104-50
-40
-30
-20
-10
0
10
20
Frequency /Hz
Rel
ativ
e am
plitu
de /d
B
Fig. 3. The 20 frequency responses for thedodecahedral sound source 4292L measured
without frequency response equalisation, and anaverage of the 20 frequency responses. The
relative amplitude is in relation to 1000 Hz ofthe average amplitude. The thin lines indicate
the 20 frequency responses, and the thick blackline indicates an average of the 20 frequency
responses.
102 103 104-50
-40
-30
-20
-10
0
10
20
Frequency /Hz
Rel
ativ
e am
plitu
de /d
B
Fig. 4. The 20 frequency responses for thedodecahedral sound source 4292L measured
after being equalised, and an average of the 20frequency responses. The relative amplitude is
in relation to 1000 Hz of the average amplitude.The thin lines indicate the 20 frequency
responses, and the thick black line indicates anaverage of the 20 frequency responses.

Peisheng Zhu,Fangshuo Mo & Jian Kang: Applied Acoustics [DOI: 10.1016/j.apacoust.2014.09.023]
Applied Acoustics, Volume 89, 2015, Pages 188-198 Page 5
500 Hz 1000 Hz
2000 Hz
44AA
4292L8020B
0330
300
270
240
210180
30
60
90
120
150
0-10-20-30-40
0-10-20-30-40
0-10-20-30-40
0-10-20-30-40
0330
300
270
240
210180
30
60
90
120
150
0330
300
270
240
210180
30
60
90
120
150
0330
300
270
240
210180
30
60
90
120
150
250 Hz
8000 Hz
0330
300
270
240
210180
30
60
90
120
150
0-10-20-30-40
0-10-20-30-40
0330
300
270
240
210180
30
60
90
120
150
4000 Hz
(a) Horizontal directivity patterns of 44AA, 8020B and 4292L
500 Hz 1000 Hz
2000 Hz
0330
300
270
240
210180
30
60
90
120
150
0-10-20-30-40
0-10-20-30-40
0-10-20-30-40
0-10-20-30-40
0330
300
270
240
210180
30
60
90
120
150
0330
300
270
240
210180
30
60
90
120
150
0330
300
270
240
210180
30
60
90
120
150
250 Hz
8000 Hz
0330
300
270
240
210180
30
60
90
120
150
0-10-20-30-40
0-10-20-30-40
0330
300
270
240
210180
30
60
90
120
150
4000 Hz
(b) Vertical directivity patterns of 44AA, 8020B and 4292L
44AA
4292L8020B
5 dB 5 dB 5 dB
5 dB 5 dB 5 dB
5 dB 5 dB 5 dB
5 dB 5 dB 5 dB
Fig. 5. Horizontal and vertical directivity patterns of the three sound sources.

Peisheng Zhu,Fangshuo Mo & Jian Kang: Applied Acoustics [DOI: 10.1016/j.apacoust.2014.09.023]
Applied Acoustics, Volume 89, 2015, Pages 188-198 Page 6
2.2 Experimental arrangement
As two important objective measurement metrics of speech intelligibility, STI and SII have many thingsin common [8]. In view of the better representativeness of STI for speech intelligibility, only STI ismeasured in this study. Three rooms were used for measurement, an office, a lab and a multimedia lecturehall, and their characteristics, including the mean absorption coefficient for the three rooms areshown in Table 2, where the early decay time (EDT), reverberation time (T30) and clarity (C50) for theaverage of 500 Hz and 1000 Hz octave band are also shown with the source being the dodecahedralsound source 4292L. There are two receiver positions in the office, three receiver positions in the lab,three receiver positions in the multimedia lecture hall, and the layout of the receiver positions and thesound sources is shown in Figure 6. In the three rooms, the height of all of the receivers is 1.2 m, and theheight of all of the sound sources is 1.5 m. In Figure 6, S1 indicates the signal sound sources (includingthe artificial mouth 44AA, the monitor loudspeaker 8020B and the dodecahedral sound source 4292L), S2
indicates a noise source, and R1-R8 are receiver positions.
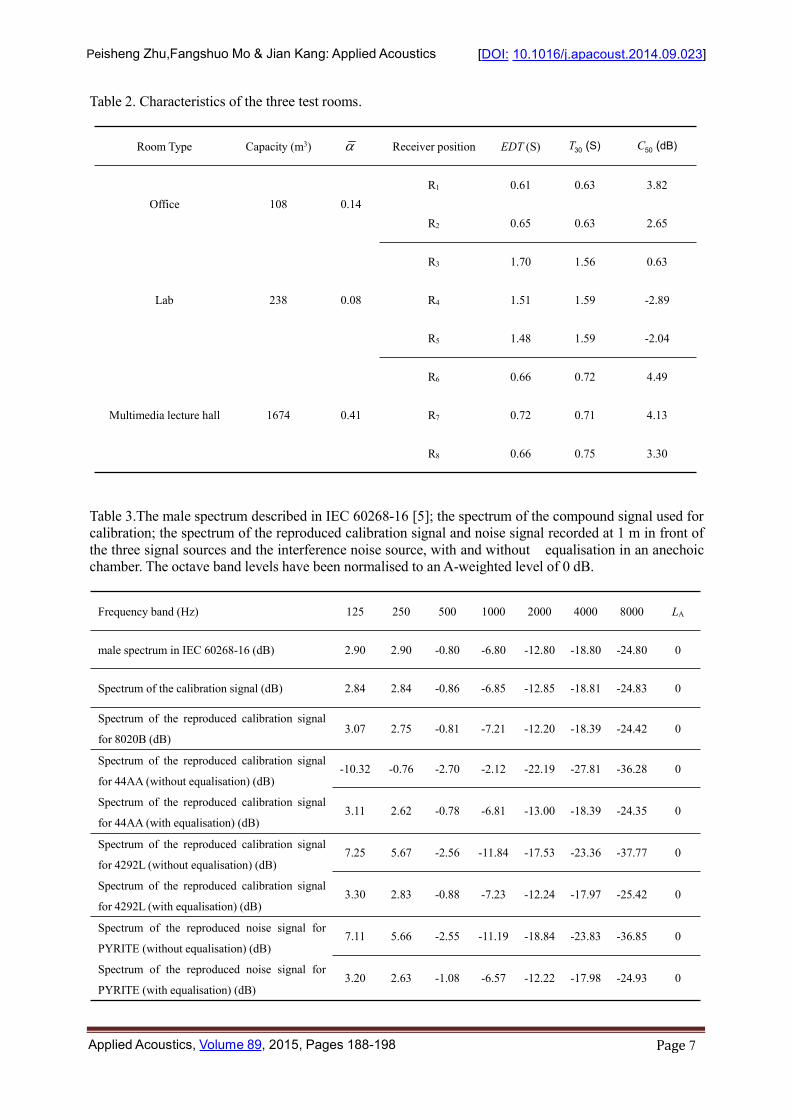
To obtain a wide range of STI, a noise source (PYRITE dodecahedral sound source) was arranged at adistance of 0.5 m from the signal sources to reproduce interference noise at four different sound pressurelevels (SPL) so that each receiver position in the three rooms would correspond to four different testenvironments. The noise source reproduces a males spectra [5] shaped pink noise. In accordance withIEC 60268-16 [5], the SPL at 1 m right ahead of the signal sound source (on the main radiation axis ofthe artificial mouth GRAS 44AA and the monitor loudspeaker GENELEC 8020B) was set at 60 dBA inan anechoic chamber. At the same time, the SPL of the noise source was adjusted to make the positions at1 m away from the two sound sources correspond to four different relative background noise levels(RBNLs): 5 dB, 0 dB, -10 dB, and -20 dB (the SPL at 1 m right ahead of the PYRITE dodecahedralsound source was set as 65 dBA, 60 dBA, 50 dBA, and 40 dBA, respectively. The RBNL equals the SNRin a noiseless anechoic chamber; however, due to the influence of different reflections and perhapsenvironmental noise, the RBNL does not equal the actual SNR at the R1-R8 receiver positions). After that,the signal source and the noise source pre-set in the anechoic chamber were placed in the correspondingsound source positions in the test rooms, and during the measurement, the signal sound sources alwayspointed towards the receiver, the acoustic output microphone always pointed towards the signal soundsources, then measurements were performed at each receiver position in turn. There are two types ofsignal used for the artificial mouth 44AA and the dodecahedral sound source 4292L, one withoutfrequency response equalisation and the other equalised according to the frequency response of the twosound sources. For the monitor loudspeaker 8020B, only signals without frequency response equalisationwere used. The interference noise signal was equalised. The signal used for the SPL calibration of thethree sound sources in an anechoic chamber was a compound signal of seven half octave-band carrierswithout frequency modulation including the male spectrum described in IEC 60268-16 [5]. The malespectrum described in IEC 60268-16 [5], the spectrum of the signal used for calibration, the spectrum ofthe reproduced calibration signal and noise signal recorded at 1 m in front of the three signal sources andthe interference noise source with and without equalisation in an anechoic chamber, after the octave bandlevels are normalised to an A-weighted level of 0 dB, are shown in Table 3. Considering that the SPL forthe dodecahedral sound source 4292L varies with the orientation, the SPL in Table 3 is an average of thethree SPLs measured from three representative specific orientations, and the STI used for thedodecahedral sound source 4292L in this paper is also an average of the three STIs measured from thethree specific orientations. Figure 7 shows the three specific representative orientations. In an anechoicchamber, the equalisation and calibration for the PYRITE dodecahedral sound source were simpler than4292L. Only a fixed orientation was selected to be pointed towards the receiver, and this fixed orientationalways pointed towards the receiver during STI measurements.
The STI values of the three sources were measured at eight receiver positions, considering that eachreceiver position will correspond to four different RBNLs, resulting in a total of 32 measuring conditionsin the office, the lab and the multimedia lecture hall.
Peisheng Zhu,Fangshuo Mo & Jian Kang: Applied Acoustics [DOI: 10.1016/j.apacoust.2014.09.023]
Applied Acoustics, Volume 89, 2015, Pages 188-198 Page 7
Table 2. Characteristics of the three test rooms.
Room Type Capacity (m3) Receiver position EDT (S) T30 S) ( C50 dB) (
Office 108 0.14R1 0.61 0.63 3.82
R2 0.65 0.63 2.65
Lab 238 0.08
R3 1.70 1.56 0.63
R4 1.51 1.59 -2.89
R5 1.48 1.59 -2.04
Multimedia lecture hall 1674 0.41
R6 0.66 0.72 4.49
R7 0.72 0.71 4.13
R8 0.66 0.75 3.30
Table 3.The male spectrum described in IEC 60268-16 [5]; the spectrum of the compound signal used forcalibration; the spectrum of the reproduced calibration signal and noise signal recorded at 1 m in front ofthe three signal sources and the interference noise source, with and without equalisation in an anechoicchamber. The octave band levels have been normalised to an A-weighted level of 0 dB.
Frequency band (Hz) 125 250 500 1000 2000 4000 8000 LA
male spectrum in IEC 60268-16 (dB) 2.90 2.90 -0.80 -6.80 -12.80 -18.80 -24.80 0
Spectrum of the calibration signal (dB) 2.84 2.84 -0.86 -6.85 -12.85 -18.81 -24.83 0
Spectrum of the reproduced calibration signal
for 8020B (dB)3.07 2.75 -0.81 -7.21 -12.20 -18.39 -24.42 0
Spectrum of the reproduced calibration signal
for 44AA (without equalisation) (dB)
Spectrum of the reproduced calibration signal
for 44AA (with equalisation) (dB)
-10.32 -0.76 -2.70 -2.12 -22.19 -27.81 -36.28 0
3.11 2.62 -0.78 -6.81 -13.00 -18.39 -24.35 0
Spectrum of the reproduced calibration signal
for 4292L (without equalisation) (dB)
Spectrum of the reproduced calibration signal
for 4292L (with equalisation) (dB)
7.25 5.67 -2.56 -11.84 -17.53 -23.36 -37.77 0
3.30 2.83 -0.88 -7.23 -12.24 -17.97 -25.42 0
Spectrum of the reproduced noise signal for
PYRITE (without equalisation) (dB)
Spectrum of the reproduced noise signal for
PYRITE (with equalisation) (dB)
7.11 5.66 -2.55 -11.19 -18.84 -23.83 -36.85 0
3.20 2.63 -1.08 -6.57 -12.22 -17.98 -24.93 0

Peisheng Zhu,Fangshuo Mo & Jian Kang: Applied Acoustics [DOI: 10.1016/j.apacoust.2014.09.023]
Applied Acoustics, Volume 89, 2015, Pages 188-198 Page 8
Fig. 6. Source and receiver locations in the office, the lab, and the multimedia lecture hall.
Fig. 7. The three specific representative orientations of the dodecahedral sound source 4292L used for themeasurement of STI.
2.3 Measurement of STI
There are two STI measurement methods recommended by IEC 60268-16 [5], namely a direct methodbased on signal modulation and an indirect method based on impulse response. The two methods usedifferent ways to obtain the envelope of signals, but they are almost the same for later-stage datatime-consuming, and the resulting data processing has relatively high requirements for the hardware.Most significantly, it is more difficult to measure full STI, though usually used in scientific research inaccordance with the suggestion in IEC [5]. To reflect the authentic STI measurement methodrecommended by IEC 60268-16 [5], the full STI test signals and the computing programs of the directmeasurement method were compiled in this study.
During measurement, there may be inaccuracies caused by the measurement system, such as inaccuraciesin calibration of the SPL of the sound source, the generation of measuring signals and the later-stageprocessing. To reduce such inaccuracies, a standardised measurement system was used, and the

Peisheng Zhu,Fangshuo Mo & Jian Kang: Applied Acoustics [DOI: 10.1016/j.apacoust.2014.09.023]
Applied Acoustics, Volume 89, 2015, Pages 188-198 Page 9
measurement process followed the requirements strictly. The measurement systems used in thisexperiment include signal sources (GRAS 44AA, GENELEC 8020B and B&K 4292L), interferencenoise source PYRITE, power amplifier B&K 2734B (corresponding to B&K 4292L), power amplifierAMPHION (corresponding to PYRITE), and audio interface B&K ZE-0948, microphone B&K 4189(power supply is B&K 1704), and sound recording software Audition 3.0. Loop calibration wasperformed for the entire system before measurement to make sure it is a linear time-invariant (LTI)system without harmonic distortions. All of the sound sources used in the experiment were calibrated inthe anechoic chamber. The SPL of all of the signals being measured are controlled accurately at thebeginning of signal generation by filtering.
The effectiveness of the measurement program is also the key to the reliability of the measurement results.A measurement signal whose modulation depth is 0.8 has been generated according to the standard, and itis processed (loop calibrated) directly as a received signal. After loop calibration, 98 modulationtransmission values obtained will not be 0.8. There are many factors to consider. For example, the pinknoise is a pseudo-random signal, filtering and modulation is required during signal generation, andfiltering and envelope extraction are also required after the signal is received, which may cause loss ofsignals and result in inaccuracy. To evaluate these inaccuracies, a one-sample T test statistical methodwas used to check whether there is significant difference between the population mean of the 98 figuresand the designated value of 0.8. It was shown that the p-value is 0.819, indicating that there is nosignificant variation. Ninety-eight modulation transmission values whose modulation depth is 0.8 and 98modulation transmission values after passing the loop are also input into the program to calculate the STIsimultaneously. The STI difference under the two conditions is only 0.001, far smaller than a JND (JustNoticeable Difference, which is approximately 0.03) [17]. This shows that the inaccuracy brought aboutby the measuring program is very small.
3. Results
This section first considers simultaneous influence of frequency response and directivity, and it theninvestigates the influence of directivity. The section subsequently examines the influence of frequencyresponse equalisation. Appendix A lists the STI values at eight receiver positions, with a total of 32 soundenvironments for the three sound sources. Appendix B lists the operational speech level using test signalswith and without frequency response equalisation for the three sound sources at eight receiver positions;it also lists the background noise levels under four RBNLs.
3.1 Simultaneous influence of frequency response and directivity
The STI values of the three sources without frequency response equalisation are shown in Figure 8.Under such conditions, both the directivity and the frequency response have an effect on themeasurement results. The figure shows that the result of the artificial mouth 44AA is the lowest, exceptwhen the RBNL is -20 dB at receiver position R3 and when the RBNL is 5 dB at receiver positions R4
and R5. The result of the monitor loudspeaker 8020B is the highest, except when the RBNL is 5 dB atreceiver position R4 and when the RBNL is 5 dB and 0 dB at receiver position R5. The result of thedodecahedral sound source 4292L is in the middle, except when the RBNL is -20 dB at receiver positionR3 and when the RBNL is 5 dB and 0 dB at receiver position R5. Corresponding to the four RBNLs, 5 dB,0 dB, -10 dB, and -20 dB, the average STI differences between the dodecahedral sound source 4292L andthe artificial mouth 44AA at eight receiver positions are 0.023, 0.057, 0.051, and 0.013, and the largestdifference that is reached, 0.093, occurs when RBNL is -10 dB at receiver position R5. The average STIdifferences between the dodecahedral sound source 4292L and the monitor loudspeaker 8020B of eightreceiver positions are -0.021, -0.042, -0.058, and -0.063, and the largest difference reached is -0.125when RBNL is -20 dB in receiver position R6. The average STI differences between the monitorloudspeaker 8020B and the artificial mouth 44AA of eight receiver positions are 0.044, 0.098, 0.109, and0.077, and the largest difference that is reached, 0.147, occurs when RBNL is -10 dB in receiver positionR6. The STI differences between different sources under four RBNLs at eight receiver positions are listedin Appendix C. These differences above are considerable, may reflect the simultaneous influence ofdirectivity and the frequency response on the measurement results, and are consistent with Petra and

Peisheng Zhu,Fangshuo Mo & Jian Kang: Applied Acoustics [DOI: 10.1016/j.apacoust.2014.09.023]
Applied Acoustics, Volume 89, 2015, Pages 188-198 Page 10
Hongistob's research [8] that loudspeakers may have a considerable influence, though their conclusioncomes only through an inference based on measurement results, without accurate measurement andanalysis. Our measured differences are also similar to Mapp's result [7], though the influence ofdirectivity was not involved in his study, and are greater than Bozzoli and Farina's result [6]. However, inBozzoli and Farina's study, the influence of frequency response was excluded by calibrating the threeartificial mouths in an anechoic room to fit ITU recommendations [18].
0.10
0.00
0.20
0.30
0.40
0.50
0.60
0.70
0.80S
TI0.90
4292L44AA8020B
Receiver positions and RBNL /dBR1 R2 R3 R4 R5 R6 R7 R8
-20-100
5
Fig. 8. STI of the three sound sources without frequency response equalisation(note: results are notcompliant with the IEC standard due to missing source equalisation).
3.2 Influence of directivity
The STI values of the three sources, with frequency response equalisation, are shown in Figure 9. Undersuch conditions, the sound source can be deemed to only be subject to the influence of directivity. It canbe observed from the figure that the result of the dodecahedral sound source 4292L with the small DI isthe highest when RBNLs are 5 dB and 0 dB, and is the lowest when RBNL is decreased to -20 dB exceptat receiver positions R5. The result of monitor loudspeaker 8020B with the large DI is the lowest whenRBNLs are 5 dB and 0 dB, and when RBNL is decreased to -20 dB, it becomes the highest at receiverpositions R3, R6, R7 and R8. The result of the artificial mouth 44AA with the middle DI is in the middlewhen RBNLs are 5 dB and 0 dB, and when RBNL is decreased to -20 dB, it is still in the middle atreceiver positions R3, R5, R6, R7 and R8. These results are reasonable because at the eight receiverpositions, the received sound signals for the three sound sources are all composed of direct and reflectedsound. As the three sound sources are calibrated in an anechoic chamber, and the SPL at 1 m right aheadof the three sound sources are exactly the same, the SPLs for the direct sound of the three sound sourcesat each receiver position should also be the same, while the SPLs from the reflected sound of the threesound sources at each receiver position are different due to the different sound source directivities. At agiven receiver position, the sound energy for the reflected sound of the monitor loudspeaker 8020B withthe large DI may be the lowest, and the dodecahedral sound source 4292L greatest, with the small DI.According to IEC 60268-16 [5], the modulation transfer function mk (fm) can be calculated using Eq. (4):
j2π2
10 /10
2
0
( ) d( ) 1 10
( ) d
m
k
f tk
SNRk m
k
h t e tm f
h t t
(4),
where k is the octave band; hk(t) is impulse response of octave band k; and fm is the modulation frequency;SNRk is the signal-to-noise ratio (SNR) in dB. The contribution of reflected sound to STI can beconsidered in two ways. Firstly, all the reflections measured can increase SNR, which will increase theSTI correspondingly. However, when background noise is low, the influence of this SNR variation on

Peisheng Zhu,Fangshuo Mo & Jian Kang: Applied Acoustics [DOI: 10.1016/j.apacoust.2014.09.023]
Applied Acoustics, Volume 89, 2015, Pages 188-198 Page 11
STI would be less significant, which means that when RBNL is decreased to -20 dB, the influence of theSNR variation from the extra sound energy of the dodecahedral sound source 4292L in comparison withthat of the monitor loudspeaker 8020B or the artificial mouth 44AA on STI may be negligible. Secondly,when background noise is not taken into account, all the reflections measured can result in the reductionof the modulation depth, thus more reflections can change the pattern of early sound energy decay, whichmay result in more decrease of modulation depth of the test signal and thus decrease the STI. Theinteraction of these two aspects results in the results above, namely, when background noise is high, theSNR variation caused by the extra sound energy may influence STI more significantly, and thus, theresult of the dodecahedral sound source 4292L with low DI is the highest when RBNLs are 5 dB and 0dB. Conversely, when background noise is low, the influence from changing pattern of early soundenergy decay would be more significant, and thus, the result of the dodecahedral sound source 4292Lwith low DI is the lowest as RBNL is decreased to -20 dB. There are similar tendencies for the monitorloudspeaker 8020B and the artificial mouth 44AA.
To further examine the tendency for the STI differences with the decrease of RBNL, the STI differencesbetween the dodecahedral sound source 4292L and the monitor loudspeaker 8020B, between thedodecahedral sound source 4292L and the artificial mouth 44AA, and between the monitor loudspeaker8020B and the artificial mouth 44AA for the eight receiver positions, are shown in Figure 10, Figure 11,and Figure 12, respectively. In Figure 10, It can be observed that corresponding to the four RBNLs, 5 dB,0 dB, -10 dB, and -20 dB, the average STI differences between the dodecahedral sound source 4292L andthe monitor loudspeaker 8020B of eight receiver positions are 0.082, 0.072, 0.015, and -0.029,respectively, decreasing with the decrease of RBNL, which reflects the interaction effect of the SNRvariation and the changing pattern of early sound energy decay, and the greatest value, 0.123, appearswhen RBNL is 0 dB at receiver position R5, larger than one JND. It can also be observed that at receiverposition R3 in the lab, and at R6, R7 and R8 in the multimedia lecture hall, the STI difference between thedodecahedral sound source 4292L and the monitor loudspeaker 8020B is lower than that at receiverpositions R4 and R5 in the lab, and R1 and R2 in the office. This suggests that the influence of soundsource directivity may also depend on the room acoustic conditions, and at receiver position wherereflections are abundant, the influence of the sound source directivity may be more significant, and theSTI difference between the sound sources with different directivities may be greater. This tendency canalso be seen in Figure 11, and Figure 12, although at R3 in Figure 10 and Figure 11, where reflections arealso abundant, this tendency is not strong due to the high direct sound energy and also the directivitycharacterises of the sound sources used for comparison.
In Figure 11, the average STI differences between the dodecahedral sound source 4292L and the artificialmouth 44AA of the eight receiver positions are 0.036, 0.029, -0.001, and -0.020, decreasing with thedecrease of RBNL, which also reflects the interaction effect of the SNR variation and the changingpattern of early sound energy decay, and the greatest value, 0.068, appears when RBNL is 5 dB at R5,larger than one JND. The STI difference between the dodecahedral sound source 4292L and the artificialmouth 44AA is not very high, as the STI used for the dodecahedral sound source 4292L is an average ofthree STIs measured using three specific orientations. The difference between the three STIs is significant,and the greatest value, 0.043, appears when RBNL is 5 dB at R3, larger than one JND, suggesting thatwhen dodecahedral sound source like the dodecahedral sound source 4292L is used as the test source forthe measurement of STI or SII, the influence of orientations should not be ignored.
In Figure 12, the average STI differences between the monitor loudspeaker 8020B and the artificialmouth 44AA at the eight receiver positions are -0.046, -0.044, -0.015, and 0.009, increasing with thedecrease of RBNL, which again reflects the interaction effect of the SNR variation and the changingpattern in early sound energy decay, and the greatest value, -0.065, occurs when RBNL is 5 dB atreceiver position R2, larger than a JND. This result suggests that when using a 4 inch cone diametermonitor loudspeaker like GENELEC 8020B as the test source for the measurement of STI or SII, theinfluence of the directivity should also be considered. This is different from the result of a previous study[6], where a smaller range of source directivity range was used. Also, due to the differences in roomconditions, it is not necessary that a sound source with better directivity will have a higher intelligibilityresult when background noise is high, as suggested in another previous study [9].

Peisheng Zhu,Fangshuo Mo & Jian Kang: Applied Acoustics [DOI: 10.1016/j.apacoust.2014.09.023]
Applied Acoustics, Volume 89, 2015, Pages 188-198 Page 12
0.10
0.00
0.20
0.30
0.40
0.50
0.60
0.70
0.80
STI
4292L44AA8020B0.90
Receiver positions and RBNL /dBR1 R2 R3 R4 R5 R6 R7 R8
-20-100
5
Fig. 9. STI of the three sound sources afterfrequency response equalisation.
-0.10
0.14
STI
diff
eren
ce Office R2
Office R1
Lab R3
Lab R4
Lab R5
Lecture hall R6
Lecture hall R7
Lecture hall R8
0.10
0.06
0.02
-0.02
-0.06
RBNL /dB0 -10 -205
Fig. 10. The difference between STI measuredusing the dodecahedral sound source 4292L andthe monitor loudspeaker 8020B with different
RBNL.
STI
diff
eren
ce
0
Office R2
Office R1
Lab R3
Lab R4
Lab R5
Lecture hall R6
Lecture hall R7
Lecture hall R8
-0.10
0.14
0.10
0.06
0.02
-0.02
-0.06
RBNL /dB5 -10 -20
Fig. 11. The difference between STI measuredusing the dodecahedral sound source 4292L andthe artificial mouth 44AA with different RBNL.
STI
diff
eren
ce
0
Office R2
Office R1
Lab R3
Lab R4
Lab R5
Lecture hall R6
Lecture hall R7
Lecture hall R8
-0.10
0.14
0.10
0.06
0.02
-0.02
-0.06
RBNL /dB-10 -205
Fig. 12. The difference between STI measuredusing the monitor loudspeaker 8020B and theartificial mouth 44AA with different RBNL.
3.3 Influence of frequency response equalisation
The STI for the artificial mouth 44AA and the dodecahedral sound source 4292L, with and withoutfrequency response equalisation, are compared in Figure 13. It can be observed that all of the differencesare greater than zero, the artificial mouth 44AA has clear improvement after the frequency responseequalisation is applied, and the greatest value, 0.172, appears when the RBNL is 0 dB at the receiverposition R1. As a JND is only 0.03 or so, this finding indicates that the artificial mouth cannot be usedwithout a frequency response equalisation, although the artificial mouth is not designed to be the soundsource for building acoustic measurements, and its frequency response should include a specific speechspectrum. However, it is not precise to use such a spectrum for accurate STI measurement. Thedodecahedral sound source 4292L clearly improves after frequency response equalisation is applied, andthe greatest value, 0.124, which exceeded a JND, appears when the RBNL is 0 dB at receiver position R6.This finding indicates that the dodecahedral sound source 4292L cannot be used without frequencyresponse equalisation. Figure 13 also shows that, for the two sound sources, all maximum STIimprovement occurs when the RBNL is 0 dB, and all minimum STI improvement occurs when theRBNL is -20 dB. When the background noise is very high or very low, the influence of SNR variation onthe STI will be less significant, while when the SNR is relatively low, the influence of SNR variation onthe STI will be clear (the maximum influence will appear when the SNR is 0 dB, which can be derivedbased on Eq. (4)). In addition, for the two sources, as equalisation-induced SNR variations at each octave

Peisheng Zhu,Fangshuo Mo & Jian Kang: Applied Acoustics [DOI: 10.1016/j.apacoust.2014.09.023]
Applied Acoustics, Volume 89, 2015, Pages 188-198 Page 13
band are different, their influences on the STI will be different, even though the overall SNR variation isequal. Moreover, equalisation-induced SNR variations at different receiver positions will still be differentdue to different reflections, even though the RBNL is equal. These factors will also influence the actualimprovement result. For the monitor loudspeaker 8020B, there is no need to perform such a frequencyresponse equalisation. Overall, the results show that the influence of the frequency response equalisationon the sound sources depends on the original frequency response characteristics of the sources.
R1 R2 R3 R4 R5 R6 R7 R8
-20-100
5 0.00
0.05
0.10
0.15
0.204292L44AA
STI
diff
eren
ce
Receiver positions and RBNL /dB
Fig. 13. STI difference between with and without frequency response equalisation of the artificial mouth44AA and the dodecahedral sound source 4292L.
4. Conclusions
Sound source characteristics may be one of the main causes of objective speech intelligibility metricinaccuracy. In this study, the influences of sound source directivity and frequency response wereinvestigated using three typical sound sources: an artificial mouth, a monitor speaker, and a dodecahedralsound source. It has been revealed that:
1) The simultaneous influences of directivity and the frequency response of the three sound sources aresignificant: the STI difference between the sound source 4292L and the artificial mouth 44AA reached0.093, the STI difference between the dodecahedral sound source 4292L and the monitor loudspeaker8020B reached -0.125, and the STI difference between the monitor loudspeaker 8020B and the artificialmouth 44AA reached 0.147.
2) Sound source directivity may cause noticeable differences in the objective speech intelligibility metric.The STI measured using the dodecahedral sound source 4292L with the small DI is the highest whenbackground noise is high, and may be the lowest when background noise is low; the STI measured usingthe monitor loudspeaker 8020B with the large DI is the lowest when background noise is high, and maybe the highest when background noise is low. The STI difference between them, caused by the soundsource directivity, is up to 0.123. The STI difference caused by the sound source directivity between themonitor loudspeaker 8020B and the artificial mouth 44AA is also obvious, and the STI differencebetween them, is up to -0.065. The influence of sound source directivity may also depend on the roomacoustic conditions, and at the receiver position where reflections are abundant, the influence of thesound source directivity may be more significant.
3) Not applying frequency response equalisation resulted in large errors in the values being measured,which deviate from the real values of STI by up to 0.172, depending on the original frequency responsecharacteristics of the sound source. Considering the significant influence of frequency response, carefulequalisation of the sound source is always required when performing a STI test according to IEC60268-16 [5].

Peisheng Zhu,Fangshuo Mo & Jian Kang: Applied Acoustics [DOI: 10.1016/j.apacoust.2014.09.023]
Applied Acoustics, Volume 89, 2015, Pages 188-198 Page 14
Acknowledgements
This work was supported by National Natural Science Foundation of China (Grant No. 51278078,11274243, and 51308087) and Fundamental Research Funds for the Central Universities (Grant No.DUT13RW306).

Peisheng Zhu,Fangshuo Mo & Jian Kang: Applied Acoustics [DOI: 10.1016/j.apacoust.2014.09.023]
Applied Acoustics, Volume 89, 2015, Pages 188-198 Page 15
References:
[1] French NR, Steinberg JC. Factors governing the intelligibility of speech sounds. J Acoust Soc Am1947;19:90–119.[2] ANSI S3 5-1997. Methods for the calculation of the speech intelligibility index.American NationalStandard; 1998.[3] Houtgast T, Steeneken HJM. The modulation transfer function in room acoustics as a predictor ofspeech intelligibility. Acta Acust/Acust 1973;28:66–73.[4] Peutz VMA. Articulation loss of consonants as a criterion for speech transmission in a room. J AudioEng Soc 1971;11:915–9.[5] IEC 60268-16. Sound system equipment – Part 16: Objective rating of speech intelligibility by speechtransmission index. 4th ed. IEC; 2011.[6] Bozzoli F, Farina A. Influence of artificial mouth’s directivity in determining speech transmissionindex. In: AES 119th convention. New York; 2005.[7] Mapp P. Some effects of equalisation on sound system intelligibility and measurement. In: AES 115thconvention. New York; 2003.[8] Petra L, Hongistob V. Experimental comparison between speech transmission index, rapid speechtransmission index, and speech intelligibility index. J Acoust Soc Am 2006;2:1106–17.[9] Peng JX, Wang T, Wu SX. Investigation on the effects of source directivity of Chinese speechintelligibility in real and virtual rooms. Appl Acoust 2013;8:1037–43.[10] ISO 3745. Acoustics-determination of sound power levels of noise sources using pressure-precisionmethods for anechoic and semi-anechoic rooms. ISO;2003.[11] Farina A. Advancements in impulse response measurements by sine sweeps.122nd AES Convention.Vienna, Austria; 5–8 May 2007.[12] Kirkeby O, Nelson PA, Hamada H. The ‘‘Stereo Dipole’’ – a virtual source imaging system usingtwo closely spaced loudspeakers. J Audio Eng Soc 1998;46:387–95.[13] Product data, Sound sources and impact sound source for building acoustics,Lyngby (Denmark):Brüel & Kjᴂr Sound & Vibration Measurement A/S; 2010.Available:<http://www.bksv.com/Products/transducers/acoustic/soundsources/omni-power-light-4292?tab=descriptions>.[14] User Manual, V5.0. DIRAC Room Acoustics Software, Lyngby (Denmark): Brüel & Kjᴂr Sound &Vibration Measurement A/S; 2010.[15] Farina A. User manual of Aurora43. Parma (Italy): University of Parma A/S;2012.[16] Bowden EE, Wang LM. Verifying two commercial software implementations ofimpulse-response-based speech intelligibility measurements. Appl Acoust 2007;68:717–28.[17] Bradley JS, Reich R, Norcross SG. A just noticeable difference in C50 for speech.Appl Acoust1999;58:99–108.[18] ITU-T Recommendation P56. Telephone Transmission Quality-Objective Measuring Apparatus;March 1996.

Peisheng Zhu,Fangshuo Mo & Jian Kang: Applied Acoustics [DOI: 10.1016/j.apacoust.2014.09.023]
Applied Acoustics, Volume 89, 2015, Pages 188-198 Page 16
Appendix A. STI values at eight receiver positions, with a total of 32 sound environments for the threesound sources, using test signals without frequency response equalisation and after equalised accordingto the frequency response of the sound sources. Ori. 1, Ori. 2, and Ori. 3 are the three specificrepresentative orientations for the dodecahedral sound source 4292L.
Receiver
position
RNBL
(dB)
Without equalisation With equalisation
44AA8020
B
4292L44AA
4292L
Ori. 1 Ori. 2 Ori. 3 Average Ori. 1 Ori. 2 Ori. 3 Average
R1
5 0.130 0.180 0.178 0.157 0.156 0.164 0.244 0.297 0.265 0.271 0.278
0 0.219 0.332 0.315 0.288 0.289 0.297 0.391 0.437 0.406 0.413 0.419
-10 0.473 0.581 0.555 0.524 0.530 0.536 0.615 0.633 0.605 0.615 0.618
-20 0.634 0.701 0.671 0.643 0.653 0.656 0.709 0.703 0.678 0.690 0.690
R2
5 0.119 0.147 0.159 0.142 0.139 0.147 0.212 0.267 0.244 0.250 0.254
0 0.204 0.302 0.295 0.274 0.275 0.281 0.361 0.408 0.386 0.393 0.396
-10 0.443 0.550 0.527 0.512 0.515 0.518 0.582 0.598 0.583 0.590 0.590
-20 0.595 0.663 0.633 0.623 0.629 0.628 0.670 0.664 0.654 0.660 0.659
R3
5 0.105 0.157 0.156 0.104 0.117 0.126 0.214 0.269 0.208 0.226 0.234
0 0.196 0.310 0.292 0.233 0.250 0.258 0.360 0.403 0.343 0.361 0.369
-10 0.423 0.535 0.499 0.438 0.458 0.465 0.553 0.556 0.502 0.519 0.526
-20 0.552 0.616 0.572 0.516 0.536 0.541 0.611 0.594 0.542 0.559 0.565
R4
5 0.081 0.072 0.096 0.091 0.092 0.093 0.129 0.175 0.164 0.175 0.171
0 0.140 0.203 0.199 0.193 0.195 0.196 0.265 0.303 0.291 0.297 0.297
-10 0.334 0.425 0.402 0.393 0.396 0.397 0.454 0.457 0.448 0.452 0.452
-20 0.460 0.504 0.477 0.469 0.471 0.472 0.510 0.495 0.487 0.491 0.491
R5
5 0.076 0.074 0.107 0.114 0.104 0.108 0.128 0.189 0.204 0.194 0.196
0 0.131 0.198 0.215 0.228 0.214 0.219 0.259 0.314 0.330 0.320 0.321
-10 0.319 0.417 0.408 0.420 0.407 0.412 0.441 0.461 0.474 0.466 0.467
-20 0.442 0.494 0.477 0.488 0.477 0.481 0.494 0.496 0.507 0.500 0.501
R6
5 0.140 0.252 0.199 0.183 0.168 0.183 0.277 0.320 0.292 0.296 0.303
0 0.266 0.407 0.337 0.316 0.309 0.321 0.428 0.463 0.433 0.440 0.445
-10 0.519 0.666 0.575 0.543 0.550 0.556 0.660 0.666 0.628 0.646 0.647
-20 0.663 0.793 0.689 0.648 0.666 0.668 0.759 0.737 0.695 0.721 0.718
R7
5 0.141 0.206 0.141 0.144 0.155 0.147 0.229 0.257 0.262 0.272 0.264
0 0.255 0.359 0.280 0.281 0.295 0.285 0.377 0.398 0.402 0.413 0.404
-10 0.485 0.600 0.509 0.505 0.523 0.512 0.594 0.592 0.591 0.605 0.596
-20 0.601 0.706 0.607 0.598 0.618 0.608 0.678 0.658 0.654 0.669 0.660
R8
5 0.157 0.209 0.155 0.179 0.155 0.163 0.232 0.243 0.272 0.252 0.256
0 0.273 0.359 0.269 0.296 0.271 0.279 0.377 0.384 0.411 0.391 0.395
-10 0.495 0.588 0.492 0.513 0.493 0.499 0.584 0.574 0.594 0.579 0.582
-20 0.602 0.686 0.597 0.611 0.597 0.602 0.661 0.639 0.653 0.642 0.645

Peisheng Zhu,Fangshuo Mo & Jian Kang: Applied Acoustics [DOI: 10.1016/j.apacoust.2014.09.023]
Applied Acoustics, Volume 89, 2015, Pages 188-198 Page 17
Appendix B. The three sound sources’ operational speech levels using test signals with and withoutfrequency response equalisation and the background noise levels under four RBNLs at eight receiverpositions. Ori. 1, Ori. 2, and Ori. 3 are the three specific representative orientations for the dodecahedralsound source 4292L.
Receiver
positionFrequency bands (Hz) 125 250 500 1000 2000 4000 8000 LA
R1
Operational speech
level without
equalisation (dB)
44AA 50.34 61.57 60.31 60.38 39.70 32.26 22.47 62.60
8020B 63.21 64.24 60.52 53.50 47.22 38.37 32.36 61.01
4292L
Ori. 1 67.61 69.31 61.80 51.77 47.54 39.58 25.24 63.58
Ori. 2 67.77 69.47 61.75 51.30 47.13 38.16 22.69 63.61
Ori. 3 67.8 69.49 61.71 51.61 46.48 38.32 23.1 63.61
Operational speech
level with
equalisation (dB)
44AA 63.69 65.16 62.64 55.63 48.99 42.19 33.95 62.75
4292L
Ori. 1 63.32 66.17 62.78 55.79 52.27 44.96 36.88 63.38
Ori. 2 63.38 66.14 62.86 55.59 51.92 43.58 34.18 63.31
Ori. 3 63.47 66.24 62.74 55.81 51.91 43.64 34.33 63.33
Background noise
level (dB)
RBNL (5dB) 68.55 71.10 67.09 60.43 55.93 48.94 41.19 67.88
RBNL (0dB) 63.56 66.15 62.14 55.55 51.04 44.03 36.34 62.95
RBNL (-10dB) 53.67 56.21 52.11 45.70 41.06 34.05 26.61 52.99
RBNL (-20dB) 44.10 46.31 42.19 35.73 31.34 24.72 18.01 43.11
R2
Operational speech
level without
equalisation (dB)
44AA 48.92 59.98 57.91 58.18 38.02 30.16 21.11 60.42
8020B 60.99 62.83 58.26 50.75 45.33 37.02 29.83 58.96
4292L
Ori. 1 65.86 66.87 58.44 50.98 47.27 37.09 22.16 61.15
Ori. 2 65.79 67.02 58.53 51.23 45.12 37.35 22.64 61.18
Ori. 3 65.76 66.89 58.43 51.21 45.42 36.27 22.29 61.09
Operational speech
level with
equalisation (dB)
44AA 61.17 63.51 59.94 53.99 47.15 40.19 31.93 60.60
4292L
Ori. 1 61.14 63.81 59.82 55.08 51.68 42.53 33.23 61.35
Ori. 2 61.08 63.81 59.83 55.20 49.29 42.83 33.41 61.12
Ori. 3 61.07 63.84 59.71 55.33 50.19 41.73 33.33 61.19
Background noise
level (dB)
RBNL (5dB) 69.14 69.69 64.68 59.17 55.08 47.04 39.11 66.25
RBNL (0dB) 64.09 64.67 59.66 54.06 50.13 42.13 34.19 61.22
RBNL (-10dB) 54.12 54.70 49.68 44.13 40.22 32.15 24.50 51.26
RBNL (-20dB) 44.19 44.64 39.74 34.31 30.46 22.97 16.36 41.35
R3
Operational speech
level without
equalisation (dB)
44AA 52.16 63.25 58.88 61.46 40.28 32.25 23.27 63.18
8020B 66.23 66.42 58.99 54.80 47.59 38.73 32.46 61.69
4292L
Ori. 1 70.56 69.91 60.01 53.66 49.32 39.57 25.56 63.92
Ori. 2 70.63 69.96 59.83 53.39 47.25 37.71 22.81 63.82
Ori. 3 70.54 70.15 60.05 53.67 47.48 38.54 23.51 63.99
Operational speech
level with
equalisation (dB)
44AA 66.77 66.87 60.91 57.04 48.91 42.71 34.59 63.04
4292LOri. 1 66.61 66.75 61.30 57.84 53.62 44.93 36.95 63.74
Ori. 2 66.71 66.73 61.14 57.58 52.09 43.00 33.82 63.43

Peisheng Zhu,Fangshuo Mo & Jian Kang: Applied Acoustics [DOI: 10.1016/j.apacoust.2014.09.023]
Applied Acoustics, Volume 89, 2015, Pages 188-198 Page 18
Ori. 3 66.66 66.77 61.25 57.74 52.20 43.97 34.42 63.53
Background noise
level (dB)
RBNL (5dB) 73.62 71.31 67.73 62.06 56.29 48.26 40.76 68.77
RBNL (0dB) 68.77 66.20 62.67 57.09 51.25 43.24 35.86 63.74
RBNL (-10dB) 58.70 56.22 52.72 47.15 41.35 33.35 26.11 53.78
RBNL (-20dB) 48.89 46.36 42.92 37.39 31.61 23.84 17.56 43.98
R4
Operational speech
level without
equalisation (dB)
44AA 46.20 59.68 58.27 58.50 37.53 29.19 19.20 60.67
8020B 60.06 63.19 58.78 51.51 43.89 36.27 27.15 59.31
4292L
Ori. 1 63.76 66.93 60.71 50.29 45.88 36.89 20.70 61.66
Ori. 2 63.95 67.02 60.83 50.09 45.74 36.19 20.35 61.74
Ori. 3 63.79 66.88 60.81 49.99 45.68 36.61 21.29 61.65
Operational speech
level with
equalisation (dB)
44AA 60.10 63.79 60.98 53.50 46.92 38.96 29.15 60.99
4292L
Ori. 1 59.87 63.40 62.03 54.38 50.54 42.46 31.60 61.87
Ori. 2 59.88 63.63 61.98 54.17 50.33 41.43 31.12 61.82
Ori. 3 59.91 63.35 61.98 54.05 50.29 42.16 32.26 61.75
Background noise
level (dB)
RBNL (5dB) 68.38 69.37 66.59 59.95 55.14 47.18 38.21 67.02
RBNL (0dB) 63.40 64.34 61.58 54.97 50.38 42.21 33.24 62.04
RBNL (-10dB) 53.35 54.34 51.58 44.97 40.40 32.27 23.60 52.04
RBNL (-20dB) 43.57 44.30 41.60 35.05 30.51 22.74 15.80 42.08
R5
Operational speech
level without
equalisation (dB)
44AA 50.41 58.60 57.87 57.59 37.61 28.67 19.13 59.91
8020B 63.28 61.31 58.13 50.76 44.01 35.20 26.72 58.50
4292L
Ori. 1 67.78 66.36 59.90 51.20 45.82 36.55 20.25 61.46
Ori. 2 67.78 66.57 60.11 51.19 46.17 36.82 20.92 61.63
Ori. 3 67.80 66.57 60.13 50.93 45.39 36.54 20.52 61.59
Operational speech
level with
equalisation (dB)
44AA 63.48 62.05 60.01 53.13 46.71 39.14 28.52 60.15
4292L
Ori. 1 63.38 63.13 60.99 55.32 50.26 42.12 31.04 61.59
Ori. 2 63.29 63.20 61.21 55.38 50.76 42.30 31.80 61.76
Ori. 3 63.41 63.20 61.39 55.12 50.38 41.90 31.41 61.74
Background noise
level (dB)
RBNL (5dB) 68.86 68.87 65.59 59.10 55.02 46.85 37.70 66.32
RBNL (0dB) 63.85 63.87 60.62 54.15 50.06 41.90 32.76 61.35
RBNL (-10dB) 53.87 53.80 50.64 44.19 40.07 31.97 23.17 51.35
RBNL (-20dB) 43.95 43.99 40.72 34.47 30.34 22.49 15.50 41.53
R6
Operational speech
level without
equalisation (dB)
44AA 44.39 52.52 49.14 49.37 29.83 22.55 17.72 51.84
8020B 57.17 55.86 50.82 43.49 39.09 31.12 25.87 52.01
4292L
Ori. 1 61.27 59.46 50.61 41.82 36.93 30.06 16.08 53.67
Ori. 2 61.32 59.54 50.74 41.40 37.78 28.29 14.61 53.74
Ori. 3 61.11 59.52 50.73 41.55 35.59 28.39 16.52 53.65
Operational speech
level with
equalisation (dB)
44AA 56.86 55.96 51.43 44.71 38.96 32.30 26.46 52.44
4292LOri. 1 56.82 56.38 51.58 46.01 42.00 35.47 26.57 53.15
Ori. 2 56.87 56.44 51.73 45.53 42.37 33.67 25.15 53.14

Peisheng Zhu,Fangshuo Mo & Jian Kang: Applied Acoustics [DOI: 10.1016/j.apacoust.2014.09.023]
Applied Acoustics, Volume 89, 2015, Pages 188-198 Page 19
Ori. 3 56.70 56.46 51.78 45.77 40.48 33.87 27.22 53.03
Background noise
level (dB)
RBNL (5dB) 61.34 59.20 56.31 50.09 44.23 40.09 32.59 57.03
RBNL (0dB) 56.30 54.14 51.30 45.13 39.29 35.14 27.75 52.03
RBNL (-10dB) 46.52 44.19 41.28 35.18 29.51 25.35 18.61 42.08
RBNL (-20dB) 37.48 34.62 31.49 25.46 20.48 16.64 12.94 32.54
R7
Operational speech
level without
equalisation (dB)
44AA 43.89 49.02 44.98 45.39 25.81 18.87 16.31 47.92
8020B 58.02 52.40 46.35 39.51 34.25 25.69 19.71 48.65
4292L
Ori. 1 62.36 56.22 46.64 37.79 31.29 23.60 11.40 51.15
Ori. 2 62.46 56.23 46.76 37.47 32.32 23.48 11.78 51.21
Ori. 3 61.92 56.21 46.62 37.89 32.90 23.18 11.55 51.03
Operational speech
level with
equalisation (dB)
44AA 58.03 52.51 47.14 41.03 34.47 26.61 19.35 49.14
4292L
Ori. 1 58.33 53.29 47.73 42.01 36.00 29.01 21.14 49.86
Ori. 2 58.41 53.22 47.84 41.57 37.24 28.88 21.63 49.89
Ori. 3 57.92 53.30 47.72 42.07 37.35 28.60 21.54 49.89
Background noise
level (dB)
RBNL (5dB) 62.89 57.53 52.89 46.22 41.68 34.28 26.69 54.54
RBNL (0dB) 57.98 52.56 47.91 41.21 36.78 29.36 21.99 49.57
RBNL (-10dB) 48.00 42.61 37.96 31.34 26.97 19.98 14.56 39.66
RBNL (-20dB) 38.56 32.84 28.17 21.88 18.56 13.50 11.85 30.22
R8
Operational speech
level without
equalisation (dB)
44AA 41.94 49.93 43.35 45.15 25.69 18.31 16.18 47.61
8020B 53.97 52.89 44.25 38.58 34.24 23.83 17.62 47.54
4292L
Ori. 1 58.04 57.15 47.72 35.49 29.63 20.37 9.69 50.81
Ori. 2 58.01 57.19 47.85 35.73 31.96 20.60 9.77 50.90
Ori. 3 58.12 57.02 47.82 35.89 29.68 19.93 9.91 50.78
Operational speech
level with
equalisation (dB)
44AA 53.71 53.32 45.66 40.56 33.96 24.18 17.21 48.33
4292L
Ori. 1 53.56 54.45 48.53 39.57 34.44 25.73 18.70 49.61
Ori. 2 53.52 54.37 48.68 39.86 36.89 25.86 18.46 49.79
Ori. 3 53.51 54.33 48.64 39.96 35.19 25.26 18.95 49.67
Background noise
level (dB)
RBNL (5dB) 57.65 56.36 52.3 45.39 41.33 31.63 24.07 53.22
RBNL (0dB) 52.73 51.35 47.32 40.39 36.37 26.8 19.55 48.24
RBNL (-10dB) 42.96 41.45 37.38 30.51 26.61 17.76 13.32 38.36
RBNL (-20dB) 34.99 32.14 27.7 21.19 18.13 12.87 11.63 29.27

Peisheng Zhu,Fangshuo Mo & Jian Kang: Applied Acoustics [DOI: 10.1016/j.apacoust.2014.09.023]
Applied Acoustics, Volume 89, 2015, Pages 188-198 Page 20
Appendix C. The STI differences (in Section 3.1) of different sources at eight receiver positions underdifferent RNBLs, without frequency response equalisation.
Receiver
position
RNBL
(dB)
STI difference
4292L-44AA 4292L-8020B 8020B-44AA
R1
5 0.034 -0.016 0.050
0 0.078 -0.035 0.113
-10 0.063 -0.045 0.108
-20 0.022 -0.045 0.067
R2
5 0.028 0.000 0.028
0 0.077 -0.021 0.098
-10 0.075 -0.032 0.107
-20 0.033 -0.035 0.068
R3
5 0.021 -0.031 0.052
0 0.062 -0.052 0.114
-10 0.042 -0.070 0.112
-20 -0.011 -0.075 0.064
R4
5 0.012 0.021 -0.009
0 0.056 -0.007 0.063
-10 0.063 -0.028 0.091
-20 0.012 -0.032 0.044
R5
5 0.032 0.034 -0.002
0 0.088 0.021 0.067
-10 0.093 -0.005 0.098
-20 0.039 -0.013 0.052
R6
5 0.043 -0.069 0.112
0 0.055 -0.086 0.141
-10 0.037 -0.110 0.147
-20 0.005 -0.125 0.130
R7
5 0.006 -0.059 0.065
0 0.030 -0.074 0.104
-10 0.027 -0.088 0.115
-20 0.007 -0.098 0.105
R8
5 0.006 -0.046 0.052
0 0.006 -0.08 0.086
-10 0.004 -0.089 0.093
-20 0.000 -0.084 0.084
Related Documents