INFLUENCE OF PORTER’S FIVE FORCES ON THE COMPETITIVENESS OF AGRODEALER BUSINESSES IN NAKURU EAST SUB-COUNTY, KENYA EILEEN INYANJI WANYONYI A Thesis Submitted to the Graduate School in Partial Fulfillment of the Requirements for the Master of Science Degree in Agribusiness Management of Egerton University EGERTON UNIVERSITY OCTOBER, 2021

Welcome message from author
This document is posted to help you gain knowledge. Please leave a comment to let me know what you think about it! Share it to your friends and learn new things together.
Transcript

INFLUENCE OF PORTER’S FIVE FORCES ON THE COMPETITIVENESS OF
AGRODEALER BUSINESSES IN NAKURU EAST SUB-COUNTY, KENYA
EILEEN INYANJI WANYONYI
A Thesis Submitted to the Graduate School in Partial Fulfillment of the Requirements
for the Master of Science Degree in Agribusiness Management of Egerton University
EGERTON UNIVERSITY
OCTOBER, 2021
ii
DECLARATION AND RECOMMENDATION
Declaration
This thesis is my original work and has not been presented in any university or institution of
highe r learning for the award of any degree.
Signature Date: 12/11/2021
Eileen Inyanji Wanyonyi
KM19/11821/16
Recommendation
This thesis has been submitted with our approval as the university supervisors.
Signature Date: 12/11/2021
Prof. Hillary Kiplangat Bett, PhD
Department of Agricultural Economics and Agribusiness Management
Faculty of Agriculture, Egerton University
Signature Date: 12/11/2021
Dr. Edith Wambui Gathungu, PhD
Department of Agricultural Economics and Agribusiness Management
Faculty of Agriculture, Egerton University

iii
COPYRIGHT
©2021 Eileen Inyanji Wanyonyi
All Rights Reserved. No part of this thesis may be reproduced, transmitted or stored in any
form or means such as electronic, mechanical or photocopying including recording or any
information storage and retrieval system, or translated in any language, without prior written
permission of the author or Egerton University on that behalf.

iv
DEDICATION
This research is heartily dedicated to my mother Margaret Nyilile, daughters; Scheryl and
Stephie and siblings; Meltreen, Schein and Nockler.

v
ACKNOWLEDGEMENTS
My sincere gratitude goes to Egerton University for giving me a chance to pursue my Master
of Science degree in Agribusiness Management. Special thanks goes to RUFORUM through
TAGDev program at Egerton University for their support during my research work. I would
like to acknowledge the contribution of the entire Agricultural Economics and Agribusiness
Management department staff who kept me on toes and helped me achieve my academic
goals. Special thanks to my supervisors; Prof. Hillary Bett and Dr. Edith Gathungu for their
selflessness, guidance and great contribution to my research work. Indeed, their guidance and
dedication made it possible for me to complete my thesis. My gratitude also goes to Prof.
Patience Mshenga and Dr. Dickson Okello; who mentored me throughout the master
program and ensured that I achieved my objectives. Equally, am indebted to my classmates
for the support they provided through knowledge sharing during the entire program. Above
all, special thanks to God for His love, favour, strength and guidance during my entire study
period.

vi
ABSTRACT
Agrodealers play a crucial role in the agribusiness value chain by linking input manufacturers
to farmers. With a high number of agrodealer businesses in Kenya, the industry is highly
competitive necessitating the businesses to design strategies to gain a competitive edge.
Interaction of various forces in the industry has led to high competition with changes in the
environment requiring constant strategic adjustments by the businesses in their bid to remain
competitive. As such, businesses are at task to design strategies to enable them counter this
pressure, ensure survival and increase their market share. Despite their importance in the
agribusiness value chain, minimal efforts have been done to identify the challenges that
agrodealer businesses face in their quest to overcome competition. This study focused on
determining the influence of Porter’s five forces on the competitiveness of agrodealer
businesses in Nakuru East Sub-County, Kenya. Census study targeting all the 138 agrodealer
businesses was carried out and achieved a 79% response rate. Semi-structured questionnaires
were used for the collection of both qualitative and quantitative data which was analyzed
through the facilitation of STATA. Factor analysis was used to assess the agrodealers
perception of the main competitive forces in the industry while a multivariate probit model
was used to analyze the effect of Porter’s five forces on the choice of competitive strategies.
Market share was used as a metric for measuring competitiveness with the Tobit model being
used to estimate the influence of Porter’s five forces and strategies on business market share.
Results showed that competitive rivalry, buyer switching costs, operational costs, product
substitution, and branding were the main forces leading to competition in the industry. Study
findings revealed that significant factors that affect agrodealers’ preferences for generic
strategies are age, experience, group membership, education, ownership structure,
engagement in other businesses, business age, business branches, competitive rivalry, product
substitution, operational costs, and branding. Results further indicated that market share was
greatly influenced by business age, promotions strategies, competitive rivalry, branding,
business expenditure, and entrepreneurial skills. The study recommends both the national and
county governments create an enabling environment by devising strategies that will help curb
counterfeit inputs from accessing the market and selling input subsidies through agrodealer
businesses to minimize competition. Furthermore, policies geared towards educating and
training agrodealers on maximum utilization of Porter’s generic strategies should be
enhanced. There is also a need for agrodealer businesses to increase use of cost leadership
strategies as they were found to have a positive impact on market share.

vii
TABLE OF CONTENTS
DECLARATION AND RECOMMENDATION .................................................................... ii
COPYRIGHT .......................................................................................................................... iii
DEDICATION ........................................................................................................................ iv
ACKNOWLEDGEMENTS ......................................................................................................v
ABSTRACT............................................................................................................................. vi
LIST OF TABLES ....................................................................................................................x
LIST OF FIGURES ................................................................................................................ xi
LIST OF ABBREVIATIONS AND ACRONYMS ............................................................... xii
CHAPTER ONE .......................................................................................................................1
INTRODUCTION .....................................................................................................................1
1.1 Background to the study ..................................................................................................1
1.2 Statement of the problem .................................................................................................3
1.3 Objectives .......................................................................................................................3
1.3.1 General objective ....................................................................................................3
1.3.2 Specific objectives ..................................................................................................4
1.4 Research questions ..........................................................................................................4
1.5 Justification of the study ..................................................................................................4
1.6 Scope and limitation of the study .....................................................................................5
1.7 Operational definition of terms ........................................................................................6
CHAPTER TWO ......................................................................................................................7
LITERATURE REVIEW .........................................................................................................7
2.1 The agrodealer industry in Kenya ....................................................................................7
2.2 Porter’s five forces ..........................................................................................................8
2.2.1 Indicators of Porter’s five forces in an industry .......................................................9
2.3 Competitive strategies ................................................................................................... 11
2.4 The concept of competitiveness ..................................................................................... 14
2.4.1 Market share as a measure of competitiveness ....................................................... 15
2.5 Empirical review ........................................................................................................... 16
2.6 Theoretical framework ................................................................................................... 18
2.6.1 Resource-based view theory .................................................................................. 18

viii
2.7 Conceptual framework ................................................................................................... 19
CHAPTER THREE ................................................................................................................ 21
RESEARCH METHODOLOGY ........................................................................................... 21
3.1 Study area ...................................................................................................................... 21
3.2 Research design ............................................................................................................. 22
3.3 Data and sampling approach .......................................................................................... 23
3.3.1 Target population for the study ............................................................................. 23
3.3.2 Sampling procedure .............................................................................................. 23
3.4 Data collection procedures and data sources .................................................................. 23
3.5 Pilot study ..................................................................................................................... 24
3.6 Data analysis ................................................................................................................. 24
3.7 Analytical framework .................................................................................................... 24
CHAPTER FOUR ................................................................................................................... 32
RESULTS AND DISCUSSION .............................................................................................. 32
4.0 Introduction ................................................................................................................... 32
4.1 Descriptive statistics ...................................................................................................... 32
4.1.1 Socio-economic characteristics of agrodealers ....................................................... 32
4.1.2 Trainings received by agrodealers ......................................................................... 34
4.1.3 Business characteristics ......................................................................................... 35
4.1.4 Porter’s five forces ................................................................................................ 37
4.1.5 Competitive strategies ........................................................................................... 41
4.1.6 Performance measures .......................................................................................... 44
4.2 Agrodealers perception of the main competitive forces in the industry ........................... 44
4.2.1 Validity ................................................................................................................. 44
4.2.2 Sampling adequacy ............................................................................................... 44
4.2.3 Factor extraction ................................................................................................... 45
4.3 Influence of Porter’s five forces on the choice of competitive strategies among
agrodealer businesses in Nakuru East Sub-County ......................................................... 48
4.3.1 Pairwise correlations of competitive strategies ...................................................... 49
4.3.2 Strategic usage among agrodealer businesses ........................................................ 50
4.3.3 Determinants of competitive strategic choices among agrodealer businesses ......... 51

ix
4.4 Effects of Porter’s five forces and strategies on the market share of agrodealer
businesses in Nakuru East Sub-County .......................................................................... 56
4.4.1 Diagnostic tests ..................................................................................................... 56
4.2.3 Factors influencing market share of agrodealer businesses .................................... 56
CHAPTER FIVE..................................................................................................................... 61
CONCLUSIONS AND RECOMMENDATIONS .................................................................. 61
5.1 Conclusions ................................................................................................................... 61
5.2 Recommendations ......................................................................................................... 62
5.3 Suggestions for further studies ....................................................................................... 63
REFERENCES ........................................................................................................................ 64
APPENDICES ......................................................................................................................... 73
Appendix i: NACOSTI research permit ................................................................................. 73
Appendix ii: Questionnaire ..................................................................................................... 74
Appendix iii: Factor analysis ................................................................................................... 84
Appendix iv: Pair-wise correlation of competitive strategies ................................................... 86
Appendix v: Multivariate regression for determinants of competitive strategic choices ........... 87
Appendix vi: Tobit regression for factors influencing the market share of agrodealer
businesses .......................................................................................................... 88
Appendix vii: Marginal effects of the Tobit regression model ................................................... 89
Appendix viii: Publication ......................................................................................................... 90

x
LIST OF TABLES
Table 3.1: Total number of agrodealer businesses per sampling ward .............................. 23
Table 3.2: Variables used in factor analysis ..................................................................... 26
Table 3.3: Variables used in the multivariate probit model ............................................... 29
Table 3.4: Variables used in the Tobit model ................................................................... 31
Table 4.1: Socio-economic characteristics of agrodealers................................................. 33
Table 4.2: Trainings received by agrodealers ................................................................... 34
Table 4.3: Business characteristics ................................................................................... 36
Table 4.4: Bargaining power of buyers ............................................................................ 37
Table 4.5: Bargaining power of suppliers......................................................................... 38
Table 4.6: Threat of substitute products ........................................................................... 39
Table 4.7: Threat of new entrants..................................................................................... 40
Table 4.8: Competitive rivalry ......................................................................................... 41
Table 4.9: Cost leadership strategies ................................................................................ 41
Table 4.10: Differentiation strategies ................................................................................. 42
Table 4.11: Focus strategies............................................................................................... 43
Table 4.12: Diversification strategies ................................................................................. 43
Table 4.13: Performance measures .................................................................................... 44
Table 4.14: Sample size adequacy test ............................................................................... 45
Table 4.15: Eigenvalues and their cumulative proportion of total sample variance ............. 45
Table 4.16: Factors and their loadings using Pearson correlation matrix ............................ 47
Table 4.17: Heteroskedasticity test on competitive strategies ............................................. 49
Table 4.18: Pair-wise correlations of competitive strategies ............................................... 50
Table 4.19: Multivariate probit regression for determinants of competitive strategic choices
among agrodealer businesses .......................................................................... 52
Table 4.20: Tobit model on factors influencing market share ............................................. 57

xi
LIST OF FIGURES
Figure 2.1: Conceptual framework ...................................................................................... 20
Figure 3.1: Map of study area, Nakuru East Sub-County ..................................................... 22
Figure 4.1: Usage of competitive strategies among agrodealer businesses in Kenya ............ 51
xii
LIST OF ABBREVIATIONS AND ACRONYMS
AGRA Alliance for a Green Revolution in Africa
BCG Bayesian Consulting Group
CGN County Government of Nakuru
ECA Economic Commission of Africa
GDP Gross Domestic Product
GOK Government of Kenya
KASP Kenya Agrodealers Strengthening Program
KEPHIS Kenya Plant Health Inspectorate Service
KFA Kenya Farmers Association
KNBS Kenya National Bureau of Statistics
NAAIAP National Accelerated Agricultural Inputs Access Program
OLS Ordinary Least Square
RBV Resource-Based View
SMEs Small and Medium Enterprises
SPSS Statistical Package for Social Sciences
SRA Strategy for Revitalizing Agriculture

1
CHAPTER ONE
INTRODUCTION
1.1 Background to the study
Agribusiness is a set of collective business activities ranging from production,
processing, marketing to retailing agricultural products. Agribusiness creates employment
and generates income for millions of people worldwide contributing to its significant growth.
It further contributes to approximately 20% of Africa’s Gross Domestic Product (GDP)
(World Bank, 2013). Besides, it is a key driver to agricultural transformation geared towards
delivering a 10% annual growth rate entrenched in Vision 2030 in Kenya (Government of
Kenya [GOK], 2012). Three crucial agribusiness systems must work together to achieve this
transformation and have been identified as; input, production, and processing systems.
According to a report from the Economic Commission of Africa (ECA, 2012), the
input system has undergone tremendous changes in the world over the past 40 years
accounting for an increase in agricultural growth in other regions except for Africa. This is
because most African countries are yet to establish and implement a systematic focus on the
system. Moreover, the existence of segmented input markets do not maximize profitability to
most investors. Agrodealers form part of this input system and play a crucial role in the
provision and distribution of farm inputs to farmers. They are recognized as distribution
channels in a liberalized economy for improved promotion, generation, and continuous use of
modern farm input technologies in the Strategy for Revitalizing Agriculture (SRA) in Kenya
(GOK, 2004).
Historically, the farm input sector in Kenya was dominated by the government
through the Kenya Farmers Association (KFA) which had a chain of stores countrywide with
standard branding and explicit structures (Sheahan et al., 2016; Soi, 2016). Its dominance
caused most private investors to exit the market and some to fall under receivership while at
the same time, it did not reach out to the rural small-holder farmers. As a result, the
government initiated plans in 1990 to reform the africultural input market through
abolishment of import quotas, relaxation of import licenses, and decontrolling prices to
encourage private investment. However, since its full liberalization in 1996, significant
reorganization took place bringing in more investors which redefined input mandates and
influenced the role of agrodealers in Kenya (Odame & Muange, 2011a).
Following its liberalization, the number of agrodealer businesses in the country has
been increasing making the market competitive. Kenya Plant Health Inspectorate Services
(KEPHIS) estimates 3,500 licensed agrodealer businesses while the National Accelerated
2
Agricultural Inputs Access Program (NAAIAP) estimates a total of 9,000 businesses in
Kenya (Korir, 2016). Given the agricultural orientation of Nakuru County, agriculture
accounts for 70% of its arable land Kenya National Bureau of Statistics (KNBS, 2015)
leading to a rise in demand for farm inputs hence an increase in the number of businesses. A
report from the County Government of Nakuru (CGN, 2018), indicated there being at least
192 registered agrodealer businesses in Nakuru East Sub-County with some having more than
one branch. The agricultural endowment and increase in demand for farm inputs have
presented agrodealer businesses with both opportunities and threats. Annually, the industry
has seen businesses enter and exit the agricultural input market (CGN, 2018).
With rapid and extensive changes in the socio-cultural, economic, political, and
technological environments (Tucker & Miles, 2004), the agrodealer business environment is
increasingly competitive and uncertain. Several changes have taken place including customer
preferences, government policies, improved technologies, and increased focus on customer
satisfaction. Intensified competitive pressure has further necessitated the businesses to design
plans on how best to sustain their survival and overall performance. Dälken (2014) argued
that factors leading to competition are various and it is, therefore, wise to only consider
factors that affect businesses within a specific industry. These forces are identified by Porter
(1980) as; buyer bargaining power, competitive rivalry, the threat of substitutes, supplier
bargaining power, and threat of entrants.
According to Eskandari et al. (2015), intensive competition from the forces highly
indicates the industry structure, nature of competitive relationships among businesses, and the
overall profit potential of the industry. Agrodealers intending to grow their businesses need to
understand the underlying competitive forces for them to effectively formulate strategies that
will lead to their success. Arasa and Gathinji (2014) further noted that, for a business to be
sustainable and increase its performance, it has to identify its sources of competition in the
dynamic environment then develop strategies that match the organization’s capabilities to
cope with the environmental changes. Through strategies, businesses can create a competitive
advantage by linking their resources, competencies, and skills.
Different competitive strategies have been implemented by various businesses to
sustain their competitiveness. Most importantly, business long-term goals can be achieved
through effective adoption of the following strategies; cost leadership, differentiation,
diversification, promotions, and focus. These strategies have been proven to help businesses
compete favorably in the market. According to Sifuna (2014), for a business to remain
competitive, it has to at least implement one competitive strategy otherwise it cannot easily

3
take advantage of available market opportunities leading to its failure. Thus, there is a need to
ensure that the strategies the businesses adopt are strategically aligned to their overall goal for
them to remain competitive. They also need to consider the available business resources and
ensure their maximum utilization for competitive advantage. The strategies will further
enable them to respond positively to both internal and external environmental changes.
With modernization and changes in farming technologies becoming more appealing
against the shrinking arable land, the industry is a lucrative area to venture into. Tucker &
Miles (2004) posit that, with the dynamic changes in the business environment; the growth
and development, survival, and sustainability of businesses will depend on how well they
respond to changes. Therefore, agrodealers need a comprehensive analysis to understand the
main competitive forces which will further provide a suitable foundation for strategic
choices. However, there have been minimal substantial efforts that have been made to look
into the main forces bringing about competition and to what extent they affect strategic
choices and market share of agrodealer businesses yet they are an important segment in the
agribusiness input sector.
1.2 Statement of the problem
Given the agricultural orientation of Nakuru County, there has been increased
demand for farm inputs providing a great opportunity for agrodealer businesses to serve
farmers and achieve greater returns. However, interaction of various forces in the market has
resulted in a competitive environment for them with changes in the business environment
requiring constant strategic adjustments and alignment of the same to ensure their
sustainability. This has affected majority of the business leading to business failures with
others exiting the market. Hence, in an attempt to remain competitive, the businesses are at
task to come up with strategies that will ensure they achieve greater performance and
survival. Basic foundational knowledge of Porter’s five forces in the industry is key to
business strategic formulations. However, there is limited evidence to show whether or not
these forces contribute to strategic choices and affect agrodealer business market share which
formed the basis of this study in a modest attempt to fill this gap.
1.3 Objectives
1.3.1 General objective
To contribute towards improved agrodealer business competitiveness through
identification of the main underlying competitive forces in the industry.

4
1.3.2 Specific objectives
i. To assess agrodealers’ perception of the main competitive forces in the industry in
Nakuru East Sub-County.
ii. To determine the influence of Porter’s five forces on the choice of competitive
strategies among agrodealer businesses in Nakuru East Sub-County.
iii. To determine the effect of Porter’s five forces and strategies on the market share of
agrodealer businesses in Nakuru East Sub-County.
1.4 Research questions
i. What do agrodealers perceive as their main competitive forces in the industry in
Nakuru East Sub-County?
ii. How does Porter’s five forces influence on the choice of competitive strategies
among agrodealer businesses in Nakuru East Sub-County?
iii. How does Porter’s five forces and competitive strategies affect the market share of
agrodealer businesses in Nakuru East Sub-County?
1.5 Justification of the study
The agribusiness sector plays an important role in the transformation of the
agricultural sector in Kenya. This largely contributes to the economic growth of the country’s
Gross Domestic Product (GDP). With three crucial agribusiness systems in the country
working together to achieve this, the input sector has continuously performed poorly.
Therefore, the focus on the agricultural input sector is an important factor due to its
importance in improving agrodealers’ livelihoods, income, and creation of employment.
Moreover, various interventions have come up to ensure that the agricultural input sector
performs well through establishing strategies such as reducing the prevalence of counterfeit
input products, disoriented relationships along the chain, and improving seed industry
governance and regulations to enhance its sustainability. Also, among the interventions are
policy discussions surrounding how well to improve the agrodealer sector through the
provision of government support services in Kenya.
The agrodealer industry continues to struggle with peak and off-peak seasonal
imbalances and competition. This has heightened competition in the market which has seen
some businesses struggle to survive, some to fail while others exit the market. As a result, by
exploring the influence of Porter’s five forces on the competitiveness of agrodealer
businesses in Nakuru East Sub-County, Kenya, the results of the study are expected to better

5
inform research, development, and policy decisions and further aid to prioritize key
interventions in the agrodealer business sector.
The results detailed the role of Porter’s five forces on the competitiveness of
agrodealer businesses. As such, it outlined the main competitive forces influencing the
performance of the businesses and their strategic choices. Further, it pinpointed strategic
management practices concerning generic strategies that agrodealers have not put into
consideration and provided measures of improving on them. The study findings will be useful
to the input sector players, more especially agrodealers in understanding their market and
devising strategies to remain resilient and competitive in the wake of dynamic and
competitive business environments.
Finally, the results of the study will provide valuable information to policymakers
since the findings will provide information on the influence of competitive forces on the
competitiveness of agrodealer businesses and make recommendations on the possible
measures to be pursued and the implications of those measures. The findings will further
contribute to the body of knowledge on the competitiveness of agrodealer businesses which
will make them have informed decisions on the usage of competitive strategies to improve
their performance and sustainability.
1.6 Scope and limitation of the study
This study was confined to Nakuru East Sub-County within Nakuru County, Kenya
with agrodealer businesses as the target population. It mainly focused on the influence of
Porter’s five forces on the competitiveness of agrodealer businesses. Specifically, the study
looked into the agrodealers perception of their main competitive forces, the influence of
Porter’s five forces on the choice of competitive strategies used by agrodealer businesses, and
the effect of Porter’s five forces on the market share of agrodealer businesses in Nakuru East
Sub-County. The data collected was for the 2018-2019 financial year. The majority of the
agrodealer businesses were reluctant to give out their financial information which was crucial
in calculating their profitability ratios. However, this limitation was addressed through
probing of the respondents to give out information related to their sales on an average
monthly basis. Offpeak and peak seasons were also used as a way of eliciting sales
information from them where they were required to provide an overall estimate of their sales
on peak and off-peak seasons. The study opted to use market share as a measure of
competitiveness instead of profitability.

6
1.7 Operational definition of terms
Agrodealers - Stockists who supply and sell a wide variety of farm inputs including crop
seeds, fertilizers, animal feeds, veterinary products and crop and animal protection
chemicals. This study operationalizes the term agrodealer to refer to agrovets.
Buyers - These come in two variations; the first buyers are farmers who purchase farm
inputs for end consumption while the second buyers are agrodealers who purchase
farm inputs from other agrodealers for retail purposes.
Competitive strategies - These are long-term goals and actions designed to ensure survival
in the market by establishing a sustainable competitive position and profitability
level in the industry.
Competitiveness - This is the ability of agrodealer businesses to sell their products in the
market at a price that will ensure they maximize their market share while increasing
their market share, sales growth and customer retention.
Entrants - These are new entrants into the market or already existing players who want to
diversify into other products within the same industry.
Market share - This is the percentage of the market controlled by a specific business.
Market share is achieved by comparing a business’s sales over the total industry
sales in a given market over a given period of time.
Porter’s five forces - These are competitive forces that determine survival, strategic choices
and business profitability. They include competitive rivalry, bargaining power of
buyers, the threat of entrants, supplier bargaining power and threat of substitutes.
Substitutes - These are products in the market which offer the same value. Agrodealers stock
different products from different manufacturers while in other cases an agrodealer
maybe a stockist of only one manufacturer.
Suppliers - Suppliers in this study come in two variations; manufacturers of the agricultural
inputs in the market and agrodealers who purchase and sell the inputs to other
agrodealers.

7
CHAPTER TWO
LITERATURE REVIEW
2.1 The agrodealer industry in Kenya
Agrodealers are small-scale independent input dealers who play a significant role in
the distribution of farm inputs (Odame & Muange, 2011a). They sell and supply a wide
variety of agricultural inputs including seeds, fertilizers, animal feeds, crop and animal
protection chemicals, farm equipment and machinery, and veterinary products. Despite this,
their contribution to the agribusiness value chain sector has been largely ignored.
Africa remains the only region in the developing world where the agricultural input
market is yet to develop despite its rich agricultural resource endowment (Economic
Commission of Africa [ECA], 2012). The report further states that most African countries are
yet to establish a systematic focus on the development of the agricultural input business.
According to Bayesian Consulting Group (BCG, 2016), the Kenyan input market is
dominated by both formal and informal delivery systems each accounting for 22% and 78%
distribution in the country respectively. The informal input system is characterized by the use
of uncertified seeds, traditional farming technologies, and low rates of fertilizer application
translating to poor yields. On the other hand, a formal input system supplies quality seeds,
improved crop and animal chemicals, training on the use of farm inputs, modern farming
technologies, and fertilizers distributed by agrodealers leading to high production yields.
Efforts to tap agrodealers’ potential in the country have been spearheaded by Alliance
for a Green Revolution in Africa (AGRA) and Kenya Agrodealers Strengthening Program
(KASP). These efforts have been proven to provide training in business management skills
and improved farming methods. The BCG (2016) report further shows that partnerships have
been formed to address challenges faced by agrodealers. These partnerships focus on
increasing and expanding the supply and information on certified seeds to increase access to
and correct use of quality seeds by farmers.
Currently, efforts by GOK to take the country back to food self-sufficiency have been
spearheaded through initiating strategies for a green revolution in the food-producing sectors
which are outlined in SRA. Through this initiative, agrodealers are perceived to hold a central
role in the distribution of farm inputs in a liberalized economy thus centrally placing them in
current policy discussions concerning the future of Kenya’s input sector (GOK, 2004).
Agrodealers have continuously offered a unique business model combining business
activities with those in other agribusiness systems. These models, aim to achieve dual income
strategies for both agrodealers and small-scale farmers through the sale of farm inputs and
8
improved agricultural productivity respectively. Additionally, it offers a means of filling
untapped gaps by the weak-functioning public extension services. The businesses, therefore,
have a great potential of becoming viable businesses for entrepreneurs and sustainable
business models for agricultural development in Kenya (Okello et al., 2012).
Odame and Muange (2011a) noted that most agrodealer businesses are fairly young
with 60% having been in operation for less than 5 years. The industry is largely dominated by
men (70%), with most owners being fairly educated, with an average of 58% having a
college/university degree. Also, most owners do not take charge of their businesses on a full-
time basis and had employed staff to manage them raising a crucial question as to who should
be targeted by agrodealer training organizations. They further noted that most agrodealers
stocked several commodities other than the required agricultural inputs including human
drugs, general merchandise, and building material to cater for their income during off-peak
seasons.
A study by Odame and Muange (2011b), on agrodealers and the political economy of
agricultural biotechnology policy in Kenya, found out that the current agrodealer business
model is faced with several challenges which have continuously raised concerns over its
ability to deliver modern technologies. Agrodealers lack knowledge and necessary
information on current seed varieties, thus, do not offer much help to farmers. Moreover,
most agrodealers operate in small capital bases limiting their meaningful procurement of
stock for technological improvements. With the poor regulatory frameworks, loopholes have
been created leading to the entry of several fake and poor quality seeds and unlicensed
agrodealers in the market. These challenges negatively affect their business performance
forcing some to edge out of business or grow at a stagnant rate.
2.2 Porter’s five forces
Porter’s five force model (Porter, 1985), is based on a microeconomic environment
and has continuously shaped strategic management practices of various businesses in the
corporate world. He further found out that, the external environment significantly influences
the strategic management of businesses through these forces: the threat of new entrants,
competitive rivalry, bargaining power of buyers, the threat of substitutes, and bargaining
power of suppliers. Porter (1980) states that an industry’s competitive state is brought about
by the collective strength of the five forces which interact and determine its ultimate
attractiveness and profit potential. Also, the model focused on the challenges affecting the
9
existence of businesses after their notable growth and the strategies adopted to address the
challenges (Dulčić et al., 2012).
Dälken (2014) in his effort to establish whether or not Porter’s five forces are still
applicable, found out that the model is a strong management tool for analyzing the current
industry’s profitability and attractiveness by use of the outside-in perspective. He pointed out
that the model had received several criticisms due to the significance of three new forces;
digitalization, globalization, and deregulation. However, the study proved that the three new
forces only changed the structure of industries but did not restructure the model, thus the five-
force model cannot be considered outdated. The three forces only influenced the five forces
since businesses operate in a network of suppliers, substitutes, new entrants, buyers, and
competitors making Porter’s five force model valid.
Chege and Bula (2015) conducted a study on the effect of market forces on the
performance of dairy industries in Kenya and found out that various market forces affect the
performance of the industry but it is vital that a business understands the main determinants
of competition in its industry to adopt appropriate strategies to counter them. The type of
market strategies adopted by companies affected their performance in the long run.
Companies need to adopt a strategy that makes a turnaround from the former monopoly
embeddedness to a competitive approach.
2.2.1 Indicators of Porter’s five forces in an industry
Porter’s five forces have a great impact on an industry’s competitiveness. The
knowledge of these forces highlights its strengths, opportunities, threats, and weaknesses
determines it’s positioning and indicates areas of strategic adjustments that eventually yield
higher returns (Porter, 1980). Interaction of the forces further determines the competitive
intensity in an industry and its profitability, however, the strongest force among them
becomes vital during strategic formulation.
Buyer bargaining power is the capability to push down prices of a given product
usually below a supplier’s normal selling price. The main indicators of the buyer power are
the availability of substitutes, well-informed buyers, the concentration of buyers in the
market, buyer switching costs, price sensitivity of buyers and threat of backward integration
(Porter, 2008). Chege and Bula (2015) highlighted that customers are price sensitive and
buyer bargaining power is generally high if they have several products to buy and generally
low if they act independently. From the study, the main potential indicators of buyer power
include the number of buyers in the market, the degree of dependency on available

10
distribution channels, product differential advantage, bargaining leverage, price-sensitive
buyers, buyer switching costs, information availability, availability of substitutes and
customer value analysis.
Supplier bargaining power is the risk of suppliers threatening companies with rising
prices for products (Dälken, 2014). According to Porter (1980), if suppliers are powerful,
they can easily squeeze profitability out of an industry. There are different indicators which
determine the relative strength of suppliers bargaining power; industry supplier
concentration, supplier switching costs, threat of forward integration and the industry is not
the most important customer of the supplier. Powerful suppliers have the ability to create and
add value for themselves by charging high prices, limiting the quality of services and shifting
costs to industry participants (Porter, 2008).
The threat of new entrants poses competition in the sense that existing firms face a
threat from the new businesses that enter into the same market they are operating in. In the
five-force model, it examines how difficult or easy it is for new firms to enter into or exit the
industry. Indicators of this force include entry barriers, switching costs, access to raw
materials, technical standards, economies of scale, loyal customers, expected retaliation from
existing firms and capital investment (Porter, 1980). New entrants into the market can either
be new companies or existing companies that want to diversify their product base (Odame-
Koranteng, 2014). Businesses need to create barriers to prevent new players from venturing
into the market. A profitable industry will attract new entrants into the market that would
only want to benefit from the profits and once the profits are gone, they exit the market.
The threat of substitutes is the availability of an alternative product that can serve the
same purpose as the firm’s products. Kulmia (2014) defines a substitute product as that
which is supplied by different business in the market and gives similar advantages to buyers
as the products offered in that sector. Several indicators determine the level of threat of
substitutes in an industry; buyers switching costs, the relative price performance of the
substitutes, quality of the substitute products and product differentiation. Kulmia further
stated that substitute products may limit an industry’s possible profits by setting an upper
price limit that businesses can set to realize profits. Dobbs (2014), ascertains that, as relative
price performance brought forth by alternative products becomes more appealing, it becomes
hard for existing firms to realize profits.
Rivalry among competitors is a major determinant of competitiveness in an industry
although not all industries report the same case. Existing rivalry in an industry is recognized
through tactics such as price competition, promotional battles like advertising, product

11
differentiation and innovation and increased customer service (Porter, 1980). According to
Dälken (2014), a high level of rivalry between existing competitors has a great influence on
the profitability and attractiveness of an industry. This force is potentially indicated by
various factors such as exit barrier, the number of firms in the industry, switching costs
between competitors, product differentiation, industry growth rate and fixed costs (Hubbard
& Beamish, 2011).
2.3 Competitive strategies
Different strategies have been implemented by businesses to ensure their competitive
enhancement in the industry. Long-term strategies are expected to be derived from an attempt
by businesses’ to seek competitive advantage on one or more competitive strategies (Mwangi
& Ombui, 2013). Businesses need to apply at least one strategy; differentiation, cost
leadership, diversification, promotions, and focus in their bid to gain a competitive
advantage.
Cost leadership strategy allows businesses to be low-cost producers enabling them to
make more returns than their competitors. This is brought about by economies of scale, low
production costs, technology, and preferential access to raw materials (Shao, 2015). If a
business achieves and sustains cost leadership as a strategy, it performs above average in the
industry in as long as it can be able to direct its product prices at or near the market average
price (Porter, 1985). This strategy is efficient especially during price wars as businesses can
be able to maintain their overall profitability and improve on their market share amidst losses
suffered by their competitors. By directing their prices at or near the market price,
agrodealers are assured of acquiring customers thereby improving their profitability and
market share. Achieving a cost advantage, therefore, necessitates the business to continuously
improve its operational processes, increase production efficiency and gain access to lower
production costs. In their bid to achieve this, agrodealers try to keep their prices low. It is
worth mentioning that most studies have found a positive relationship between low-cost
leadership and business performance.
Differentiation strategy aims at creating a unique product for the market. The products
should be unique in such a way that a business’s rivals cannot be able to imitate them. This
strategy is effectively achieved when the business strives to provide a unique value to its
buyers through the quality of products, product features, after-sales support, branding, and
customer service (Arasa & Gathinji, 2014). It is possible for firms using differentiation to
charge higher product prices based on features, quality, delivery systems, and distribution
12
channels. This means that customers need to perceive the product as being unique in the
industry, create loyalty and be willing to purchase the product at a higher price which is a rare
case with most buyers. However, if achieved, differentiation is a viable strategy for
generating above-average returns since it creates a defendable position in the industry for
countering the competitive forces (Porter, 2008).
A successful differentiation strategy ensures low product costs, improved services,
more product features, and flexibility. Additionally, high differentiation features enable a
business to create a defendable position in the industry (Porter, 2008). With the industry
being highly homogenous in nature, agrodealer businesses have a high task of ensuring their
businesses stand out from competitors. Logically, if customers are satisfied with a brand, they
are able to remain loyal to a business in the event that the business rises its product prices.
However, this may not be the case for the agrodealer industry as most farmers would prefer
sourcing a quality product from a lower price bidder. Nevertheless, agrodealers have
mastered the art of differentiating themselves through repackaging products such as seeds and
fertilizers according to the needs of the customers. The strategy reduces the bargaining power
of buyers as they lack a comparable alternative thereby making them less price sensitive.
Focus strategy aims at concentrating on a specific buyer group, product line segment,
specific products, and market (Porter, 2008). It focuses on a narrow competitive scope of
choice within an industry and combines both differentiation and cost-leadership strategies. In
focused differentiation, a business strives to outdo rivals by offering its niche customers
product attributes that will meet their tastes and preferences. Focused low-cost leadership
aims at outcompeting business competitors by offering low-cost prices for its products
compared to its competitors. According to Mumbua (2013), the strategy is based on the
assumption that the needs of a particular segment of customer/s can be best met by entirely
focusing on them. He further stated that businesses that adopted this strategy gained a high
degree of customer loyalty and higher product differentiation which greatly discouraged
competitors from competing directly with them.
Kenya at large has different areas in which different agricultural products do well
hence it is common for agrodealers to focus on stocking inputs that are considered to be in
high demand in that particular region. Additionally, farmers have different tastes and
preferences hence most of these businesses take into consideration this important approach by
stocking brands that farmers familiarize themselves with. Studies done in the industry have
shown that as much as agrodealers may want to deal in a variety of input products, they are
compelled to only stock products that are in high demand in their region of operation and also

13
according to the prevailing season. Odame and Muange (2011a), found out that, crop seed
focus by agrodealer businesses was also evident from the study with most businesses
stocking seeds whose crop was likely to grow in the region in which they operate.
A diversification strategy is the ability of a business to enter into a new market that is
different from its existing market and product line. Unexpected changes in the business
environment have resulted in most businesses trying to look for various ways of coping with
the pressure and enhancing their performance. Diversification has taken a new shape in
businesses with the strategy being a critical element in the survival and growth of companies
(Chirani & Effatdoost, 2013). The strategy aims at increasing sales, expanding the market,
increasing profits, and reducing risks in businesses. According to Wan et al. (2011), a
business that enhances diversification in its daily operations has a high chance of improving
its profitability levels in the long run as compared to businesses that do not.
Agrodealer businesses engage in various businesses other than their core business.
Agrodealers try as much to develop new products that appeal to their customers such as
offering product training and extension services to their customers. However, some of them
decide on vertical diversification whereby they opt to sell farming equipment to their
customers while yet others engage in businesses that are totally unrelated to the agrodealer
industry such as selling of human drugs, cereals, financial agencies, and general shops.
Nonetheless, all these approaches are a major motive for encouraging high sales and risk
coping measures, especially during low seasons. More than half of the stock value held by
agrodealer businesses constituted of non-agricultural inputs which they claimed was a risk
mitigation measure to ensure that they were able to get some income during off-peak planting
seasons when demand for agricultural input was generally low (Odame & Muange, 2011a).
The need for a business to effectively communicate and ensure that customers get the
message appropriately is an attribute of a promotions strategy. The strategy enables
businesses to facilitate the communication of their services and products to customers.
Promotions strategy is part of the larger marketing mix tools that ensures a business competes
favorably in its environment. The strategies come in various variations such as direct and
personal selling, advertising, trade fairs, and sales promotions. According to Adefulu (2015),
three primary tools; consumer, advertising, and trade promotions are commonly used by
businesses to compete for market share in an industry. Promotion strategies work well in new
markets, customer retention, and acquisition as well as the introduction of new products.
These strategies enable businesses to reach out to their target customers, launch new products
which in the long run helps them remain competitive and increase their sales. Most
14
importantly, customers are always sensitive to information concerning their products and they
need to be constantly reminded about their value hence these strategies help increase product
awareness and remind customers of its products’ existence.
Kenyan agrodealers engage in the sale of various commodities which they claim is a
risk coping strategy for their survival (Odame & Muange, 2011a). From this study, more than
half of the stock value held by agrodealer businesses constituted of non-agricultural inputs
which they claimed was a risk mitigation measure to ensure that they were able to get some
income during off-peak planting seasons when demand for agricultural input was generally
low. Crop seed focus by agrodealer businesses was also evident from the study with most
businesses stocking seeds whose crop was likely to grow in the region in which they operate.
2.4 The concept of competitiveness
The concept of competitiveness has evolved over the past years with changes in
economic development and the formulation of different development theories.
Competitiveness is the ability of a company to provide products that are more efficient and
effective than those of its competitors within an industry. According to Keter (2012),
classical economists perceived competitiveness as a condition that arose from market
mechanisms which forced businesses to compare their production and distribution of goods
and services at best possible prices and quality with that of their competitors. He further
states that these mechanisms foster how well businesses operate by promoting survival,
increase in profitability and elimination of less efficient firms in an industry.
Different levels of competitiveness exist in the market; firm-level competitiveness is
the ability of a business to produce and sell products that are of superior quality and lower
costs than those of its rivals. Additionally, the competitiveness of the firm can be measured
using its market share and profitability. Deniz et al. (2013) argue that firms competing in an
open market are subjected to pressure to adjust their product prices to meet the needs and
expectations of their customers as well as enhance their market share. Industry
competitiveness is based on the criterion of maintaining and improving an industry’s position
in both local and global market. An industry is seen to be competitive if it maintains a
sustainable and growing market share and profits for all the firms in the industry (Deniz et
al., 2013). Its indicators range from its profitability, local or global market share, sales
growth, industry attractiveness, and firm export quotient.
15
2.4.1 Market share as a measure of competitiveness
Kiel et al. (2014) asserts that the concept of competitiveness has globally developed
and thus there are rich foundational competitiveness measurements in relation to various
sectors. Some notable measurements identified include total factor productivity, market
share, product cost, profitability, net income, sales growth and customer and employee
growth (Malackanicova, 2016; Sachitra, 2017; Voulgaris et al., 2013). However, profitability
and productivity have had drawbacks when used as measurements due to difficulty in
comparison among firms within an industry, lack of reliability and availability of data and
failure of businesses to measure their quality level and innovation (Voulgaris et al., 2013) as
well as untruthfulness in figures. Following this, there has been an increased growth in using
market share as an index for competitiveness.
Market share has been used by several studies as an index in measuring the
competitive position of a business in a specific industry (Chikan, 2008). Deniz et al. (2013)
argue that firms competing in an open market are subjected to pressure to adjust their product
prices to meet the needs and expectations of their customers as well as enhance their market
share. Competitiveness can further be viewed as a zero-sum game (Porter et al., 2007), where
businesses engage in direct competition hence for a business to sell its products and expand
its market share, the other business must contract its share. According to Nazarpoori et al.
(2014), market share is the percentage of overall total volume of a specific market where a
business sells its products. The possible reason why most businesses use market share as a
metric of competitiveness is to establish their relative position within the industry.
In view of this, the growth of a firm’s market share is relative to its ability to attain a
competitive advantage. Sachitra (2017) argues that, as much as the market share is used as a
competitiveness indicator in various industries, it can also be applied in the agribusiness
sector in line with other indicators such as profitability and revealed comparative advantage.
Studies by Ketels (2016) and Kilonzo (2016) found out that industry attractiveness,
profitability and market share are greatly influenced by the environment (technological,
legal, economical and socio-cultural) in which the businesses operate.
Following this, agrodealers have been more concerned with what figures they achieve
from the market place. These figures measured in terms of market share, has been a key
interest for the businesses to measure how well they perform relative to their rivals in the
industry (Cooper & Nakanishi, 1989). The gains and losses derived from market shares are
key as they powerfully determine the kind of moves the businesses are likely to adopt to
retain their competitive advantage. Nonetheless, in as much as the businesses are at task to

16
ensure they remain competitive, the crucial challenge they face is not only how competitive
they are but as to what drives their competitiveness. With entrepreneurship becoming more
enticing, agrodealers need to ensure their businesses achieve success in the ever dynamic
competitive environment. Some of the notable determinants of market share include;
investment factors, work experience, entrepreneurial experience and skills, education levels
and business culture (Saleem, 2017). Additionally, factors such as investment rates, research
and development expenditures, productivity costs and sales (Ketels, 2016) are some of the
immediate drivers of competitiveness of businesses’ prosperity.
2.5 Empirical review
In determining the competitive strategies applied by small and medium-sized
enterprises, Mumbua (2013) found out that cost-leadership and differentiation strategies were
widely used to create efficiency and overcome operational challenges. The study further
established that lack of access to financial support, credit, and capital influenced the choice
of the strategy adopted due to the financial capabilities and economic factors of the
businesses. Waema (2013) conducted a study on the effects of competitive strategies on the
performance of dairy farms in Kenya. The study explored the relationship that existed
between cost leadership, focus and differentiation strategies and performance. The study
findings indicated that all three strategies had a significant and positive relationship to dairy
firms’ performance. The study further recommended dairy firms to adopt focus strategies to
cost leadership and differentiation strategies since it greatly affects their performance.
Sifuna (2014) investigated the effect of competitive strategies on the performance of
public universities in Kenya, found out that maximum utilization of universities’ resources
greatly determined their overall performance. Product differentiation, promotional
differentiation, operational cost reduction, personnel differentiation, economies of scale and
market focus strategies affected public university performance in Kenya. The study further
concluded that cost leadership affected performance through cost control, operational
efficiency, and production in large quantities, reduction of operational time and formation of
linkages with both suppliers and supplementary institutions. The study recommended public
universities in Kenya to invest more in cost leadership strategy for sustainability
achievement.
Porter’s five forces have been widely used as one of the many factors that influence
the choice of competitive strategies among small-scale businesses. Businesses interact daily
with their customers, suppliers and rivals hence the forces are seen as great determinants of

17
strategic choices. Indiatsy et al. (2014) investigated the application of Porter’s five forces
model on organization performance of Cooperative Bank Kenya Limited and found out that a
strong relationship existed between the performance of Cooperative Bank and Porter’s five
force model. Further, the study revealed that buyer bargaining power is important especially
when it comes to understanding the attributes, tastes, and preference of customers; supplier
bargaining power is critical since an increase in their costs leads to an increase in the banks’
operational costs; threat of substitutes largely interfered with the bank’s performance while
competitive rivalry increased its effectiveness and operational efficiency. Threat of new
entrants did not influence the bank’s performance due to their already established brand in
the industry.
While doing a competitive analysis, most businesses place Porter’s forces as the basis
for their strategic implementation. As such, it is important that a business understands how
the forces lead to competition and how they can effectively design strategies to overcome
them. Shao (2015) investigated the effect of competitive strategies and Porter’s five forces
model by the insurance companies in Kenya. Findings from the study indicated that
companies greatly applied Porter’s five forces model when trying to implement competitive
strategies. Insurance companies using the threat of substitutes were well knowledgeable of
the kind of threat the substitutes pose and strategically aligned themselves to counter it. The
threat of entry was applied to discourage entrants into the industry while supplier force
greatly enabled them to provide buyers with relatively high priced services. Moreover, there
is a great need for companies to do product differentiation to be unique.
Agrodealer businesses play a vital role in the development of the agricultural sector in
Kenya. Through acting as a link between input manufactures and suppliers, the businesses
create an efficient value chain network in the agribusiness system in the country. Their
competitiveness has been compromised due to intense competition in their industry which
has proven to disrupt their sales performance. Following this, their market share performance
has been on the cutting edge with entry of new businesses into the industry driving down
their market share margins. Several factors have contributed to market share performance of
businesses including socio-economic factors, political and technological factors (Tucker &
Miles, 2004).
With entrepreneurship becoming more enticing, entrepreneurs need to ensure their
businesses achieve success in the ever dynamic business environment. Some of the notable
determinants of market share include; investment factors, wok experience, entrepreneurial
experience, education levels and business culture (Saleem, 2017). Buyer bargaining power,

18
strongly affected the competitiveness of organizations and had a strong influence on
purchasing decisions hence affected business profitability (Kung’u, 2017). Additionally, the
intensity of rivalry affected competitive advantage, differentiation of products created value
for consumers while the entrance of new investors in the industry affected pricing strategies.
2.6 Theoretical framework
2.6.1 Resource-based view theory
Resource-based view (RBV) analyses and interprets the resources of a business for a
better understanding of how businesses achieve an overall sustainable competitive advantage
by taking an inside-out view. It was developed by Bierger Wernerfelt in 1984 and Barney in
1986 making it a dominant approach to the analysis of competitive advantage. Wernerfelt
argued that RBV had an intra-organizational focus and that business performance was as a
result of the firm-specific resources (Wernerfelt, 1984). According to Barney (1991),
resources include all abilities, organizational processes, assets, firm attributes, knowledge,
skills and information.
The theory emphasizes that the resources a firm holds are the basic determinants of its
performance and overall competitive advantage. It is based on assumptions that firms are
heterogeneous with respect to resources they control in the industry and heterogeneity of
resources may persist over time since resources used during strategic implementation in
agrodealer businesses may not be perfectly mobile across firms. Agrodealer business
resources need to be heterogeneous in nature and immobile for them to transform from short-
term to sustained competitive advantage. However, these two assumptions are necessary
conditions for RBV but not sufficient enough for a competitive advantage. For agrodealer
businesses to be sustainable, Barney (1991), the resources should be non-substitutable,
valuable, imperfectly imitable and rare. These resources must provide value by exploiting
market opportunities, be rare to find/ unique, be non-feasible to copy or imitate and be non-
substitutable or replaced by another alternative resource (Madhani, 2010).
Maikah (2015) stated that the theory maintains that businesses are well endowed with
adequate resources in the form of assets, competencies, structure, and substitutes that ensure
it gains a competitive advantage. The theory outlines three types of resources; tangible,
intangible and organizational capabilities. Financial, technological, business assets and
physical are tangible resources, intangible resources are difficult to identify include;
strategies adopted by a business over time, innovation, research and human resources while
organizational capabilities are business skills and competencies. Agrodealer businesses

19
operate in an environment controlled by the resources they have including human, financial,
physical and technological. However, for them to stand out and gain a competitive
advantage, they need to ensure that these resources are valuable, rare to find, hard to imitate
and non-substitutable. The theory is relevant to this study as it helps in addressing questions
as to why businesses differ within an industry and how they efficiently achieve and sustain
competitive advantage by use of their resources.
2.7 Conceptual framework
Competition is brought about by the interaction of Porter’s five forces: bargaining
power of buyers, the threat of entrants, bargaining power of suppliers, threat of substitutes
and competitive rivalry (Porter, 1980). Each of these forces has different indicators which
determine the level of competition in the industry and contribute towards its strategic choice
and market share. Knowledge of the main competitive forces is important as they influence
the overall business competitiveness. Through this, businesses can design their strategies for
them to secure survival and competitive advantage.
Competitive strategic choices a business adopts can either lead to its success or
failure and they include cost leadership, differentiation, diversification, promotions and
focus. These strategies further influence business market share. Business characteristics;
business age, location, employee size, and branches have a direct influence on market share.
All these factors put together will determine how competitive agrodealer businesses are in
the industry. Figure 1 shows the interaction of variables under study.
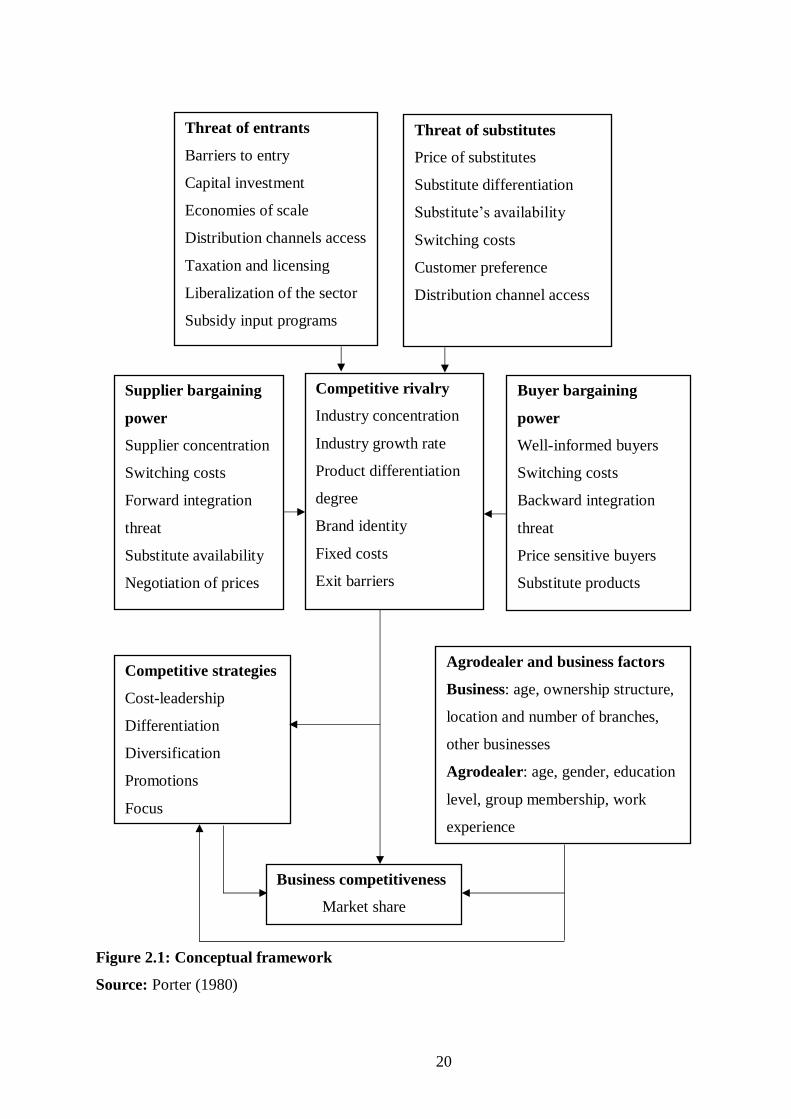
20
Figure 2.1: Conceptual framework
Source: Porter (1980)
Threat of entrants
Barriers to entry
Capital investment
Economies of scale
Distribution channels access
Taxation and licensing
Liberalization of the sector
Subsidy input programs
Threat of substitutes
Price of substitutes
Substitute differentiation
Substitute’s availability
Switching costs
Customer preference
Distribution channel access
Supplier bargaining
power
Supplier concentration
Switching costs
Forward integration
threat
Substitute availability
Negotiation of prices
Buyer bargaining
power
Well-informed buyers
Switching costs
Backward integration
threat
Price sensitive buyers
Substitute products
Competitive rivalry
Industry concentration
Industry growth rate
Product differentiation
degree
Brand identity
Fixed costs
Exit barriers
Agrodealer and business factors
Business: age, ownership structure,
location and number of branches,
other businesses
Agrodealer: age, gender, education
level, group membership, work
experience
Competitive strategies
Cost-leadership
Differentiation
Diversification
Promotions
Focus
Business competitiveness
Market share

21
CHAPTER THREE
RESEARCH METHODOLOGY
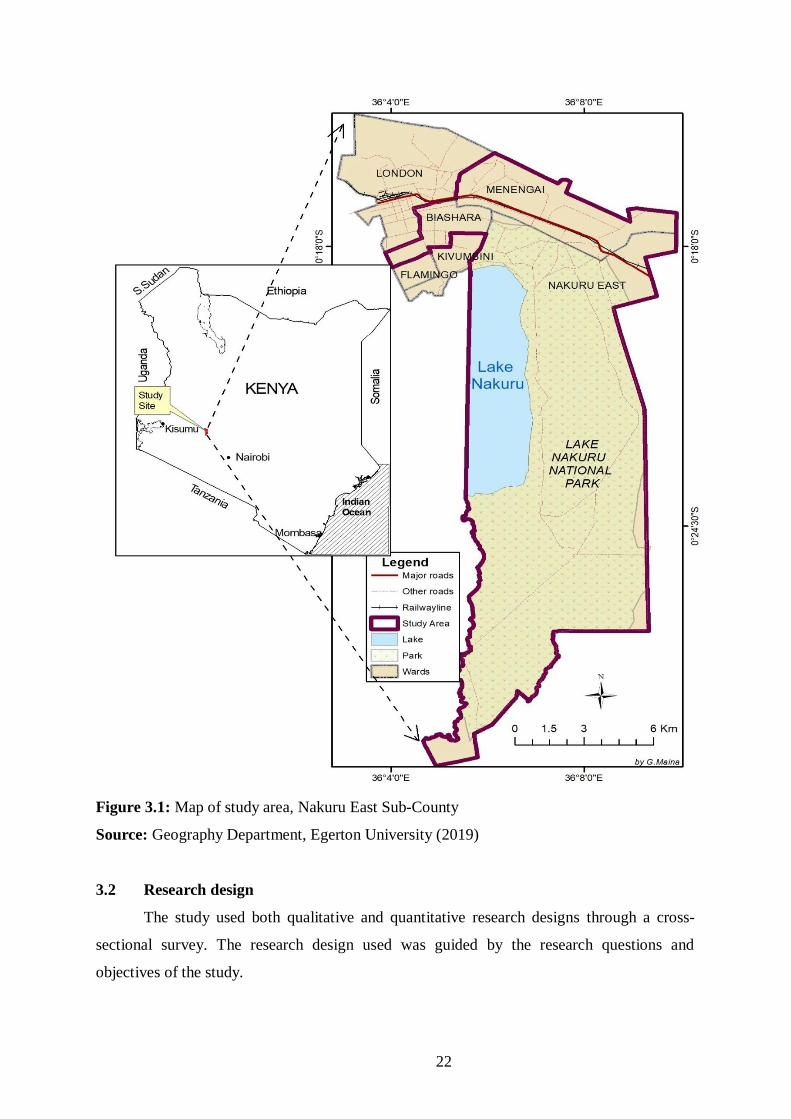
3.1 Study area
The study was conducted in Nakuru East Sub-County located in Nakuru County,
Kenya. The Sub-County is divided into 5 wards namely; Kivumbini, Flamingo, Nakuru East,
Menengai and Biashara and covers a total surface area of 74.3 KM2, hence the smallest sub-
county in area coverage in Nakuru County (KNBS, 2013). The sub-county lies between
longitude 36° 4' and 36° 8′ East and latitude 0° 18'0'' and 0° 24'30'' South of the equator. The
population of Nakuru East Sub-County stands at 157,167 persons with 2017 population
projections being 200,599 persons (KNBS, 2013). The main economic activities in the sub-
county include agriculture, tourism, and manufacturing. The sub-county is largely
agricultural with large-scale and small-scale farming of Irish potatoes, maize, beans, green
peas, varieties of fruits, spices, dairy and fish farming. It receives an annual rainfall of
averagely 895 mm/year. The long rains fall in between May and August while short rains are
received in October and December. Precipitation in the sub-county is lowest in January with
an average of 23mm and highest in April with an average of 133mm. Nakuru East Sub-
County experiences an average temperature of 17.5°C with March being the hottest month of
the year at a temperature of 18.8°C and July being the coldest month at a temperature of
16.8°C.
22
Figure 3.1: Map of study area, Nakuru East Sub-County
Source: Geography Department, Egerton University (2019)
3.2 Research design
The study used both qualitative and quantitative research designs through a cross-
sectional survey. The research design used was guided by the research questions and
objectives of the study.

23
3.3 Data and sampling approach
3.3.1 Target population for the study
The target population for the study were registered agrodealer businesses located
within Nakuru East, Biashara and Menengai wards in Nakuru East Sub-County.
3.3.2 Sampling procedure
Multistage sampling procedures were used to get the study sample units who were
agrodealer businesses. Purposive selection of Nakuru East Sub-County was the first stage
since its main economic activities are business and agriculture. Moreover, due to its
centrality in the County, it has the highest number of agrodealer businesses in the County.
The second stage was a purposive selection of the three wards in the Sub-County; Menengai,
Biashara and Nakuru East. The choice of the wards was justified since the majority of the
farming communities are found towards the east side of the Sub-County explaining the high
number of agrodealer businesses. A census study targeting all the 138 agrodealer businesses
in the three sampling wards; Nakuru East, Menengai and Biashara wards located within
Nakuru East Sub-County was carried out. The study achieved a 79% response rate with 110
questionnaires having been returned answered.
Table 3.1: Total number of agrodealer businesses per sampling ward
Nakuru East Sub-County
sampling wards
Agrodealer businesses per
ward
Sampled businesses per
ward
Biashara 63 51
Nakuru east 51 43
Menengai 24 16
Total 138 110
Source: Business licensing office, County Government of Nakuru, 2018
3.4 Data collection procedures and data sources
The study mainly focused on primary data which was collected using semi-structured
questionnaires to allow for both qualitative and quantitative data. The questionnaire included
socio-economic factors, Porter’s five forces, competitive strategies, sales and performance
content. Secondary information was further used for boosting the discussion of results and
was obtained from government publications, research institutions and journals.
24
3.5 Pilot study
A pilot study was conducted to pretest the data collection instruments for their
validity and reliability before the actual data collection took place. The pilot study was
conducted in Kivumbini and Flamingo wards where 12 agrodealer businesses; 6 from each
ward, were selected for the study. Mugenda and Mugenda (2013) recommends that for a pilot
study to be effective, 10% of the sample size should be used in the pilot study. In total, the
researcher administered 12 questionnaires which was approximately 10% of the target
population. Selection of the two wards was justified since they are part of the larger Nakuru
East Sub-County and they were left out after sampling Menengai, Biashara and Nakuru East
wards. The results obtained from the pilot study were used to adjust and reframe the
questionnaire for the actual data collection process.
3.6 Data analysis
STATA version 15.0 data management tool was used to facilitate data analysis.
3.7 Analytical framework
Objective One: To examine agrodealers perception of the main competitive forces in the
industry in Nakuru East Sub-County.
In analyzing objective one, factor analysis was used. The model aims at describing
the covariance relationships that exist among variables in terms of a few underlying, but
unobservable, random quantities known as factors which are interpreted through factor
loadings (Johnson & Wichern, 2007; Ripley, 2002). The correlations between a set of
observed variables are explained in smaller numbers of unobservable constructs known as
common factors.
Multiple predictor variables made up most of the dataset and hence there was a need
to dimensionally reduce them and only include important variables in the analysis. This
model was used to identify dimensions in which Porter’s five forces (bargaining power of
suppliers, competitive rivalry, the threat of entrants, the bargaining power of buyers and
threat of substitutes) were distributed. The perception of the main competitive forces were in
the form of statements measured using a 5-point Likert scale. The 5-point Likert scale was
justified for analysing this objective since it provided an easy response selection for the
respondents. Moreover, the 5-point Likert Scale has been widely used in past studies (Ahsan,
2011; Gebreegziabher & Tadesse, 2014) hence it was found useful to appropriate to help in
results comparability.
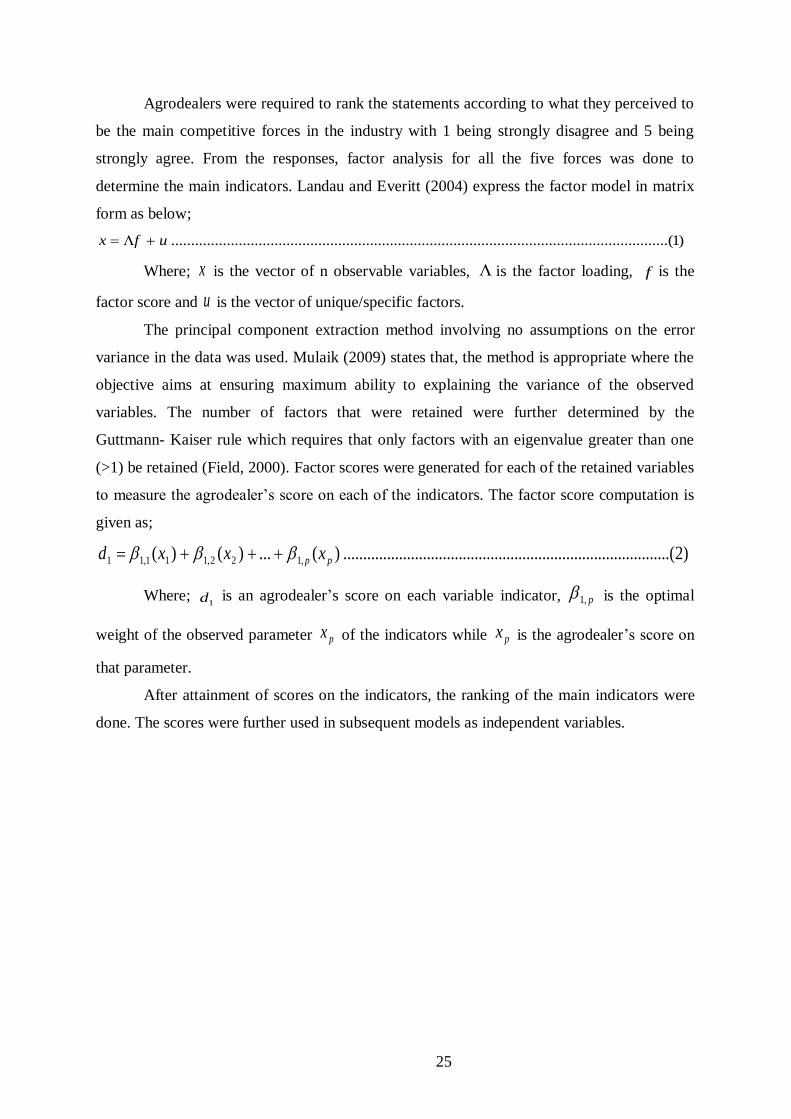
25
Agrodealers were required to rank the statements according to what they perceived to
be the main competitive forces in the industry with 1 being strongly disagree and 5 being
strongly agree. From the responses, factor analysis for all the five forces was done to
determine the main indicators. Landau and Everitt (2004) express the factor model in matrix
form as below;
)1.....(........................................................................................................................ufx
Where; x is the vector of n observable variables, is the factor loading, f is the
factor score and u is the vector of unique/specific factors.
The principal component extraction method involving no assumptions on the error
variance in the data was used. Mulaik (2009) states that, the method is appropriate where the
objective aims at ensuring maximum ability to explaining the variance of the observed
variables. The number of factors that were retained were further determined by the
Guttmann- Kaiser rule which requires that only factors with an eigenvalue greater than one
(>1) be retained (Field, 2000). Factor scores were generated for each of the retained variables
to measure the agrodealer’s score on each of the indicators. The factor score computation is
given as;
)2..(................................................................................)(...)()( ,122,111,11 pp xxxd
Where; 1d is an agrodealer’s score on each variable indicator, p,1 is the optimal
weight of the observed parameter px of the indicators while px is the agrodealer’s score on
that parameter.
After attainment of scores on the indicators, the ranking of the main indicators were
done. The scores were further used in subsequent models as independent variables.

26
Table 3.2: Variables used in factor analysis
Variable Measurement Expected sign
Bbyr1
Bbyr2
Bbyr3
Bbyr4
Bbyr5
Bbyr6
Bbyr7
Tsub1
Tsub2
Tsub3
Tsub4
Tsub5
Tsub6
Bsup1
Bsup2
Bsup3
Bsup4
Bsup5
Bsup6
Bsup7
Tent1
Tent2
Tent3
Tent4
Tent5
Tent6
Bargaining power of buyers
Well-informed buyer
Buyer switching costs
Backward integration threat
Price sensitive buyers
Substitute products
Buyer concentration
Buyer volume
Threat of substitutes
Price of substitutes
Distribution channels of substitutes
Substitute differentiation
Availability of substitutes
Switching costs
Customer preference
Bargaining power of suppliers
Supplier concentration
Supplier switching costs
Forward integration threat
Supplier product differentiation
Availability of substitute products
Negotiation of product prices
Business volume importance
to supplier
Threat of entrants
Barriers to entry
Liberalization of the input sector
Capital investment
Economies of scale
Access to distribution channels
Retaliation from existing businesses
5-point Likert scale
5-point Likert scale
5-point Likert scale
5-point Likert scale
5-point Likert scale
5-point Likert scale
5-point Likert scale
5-point Likert scale
5-point Likert scale
5-point Likert scale
5-point Likert scale
5-point Likert scale
5-point Likert scale
5-point Likert scale
5-point Likert scale
5-point Likert scale
5-point Likert scale
5-point Likert scale
5-point Likert scale
5-point Likert scale
5-point Likert scale
5-point Likert scale
5-point Likert scale
5-point Likert scale
5-point Likert scale
5-point Likert scale
+/-
+/-
+/-
+/-
+/-
+/-
+/-
+/-
+/-
+/-
+/-
+/-
+/-
+/-
+/-
+/-
+/-
+/-
+/-
+/-
+/-
+/-
+/-
+/-
+/-
+/-
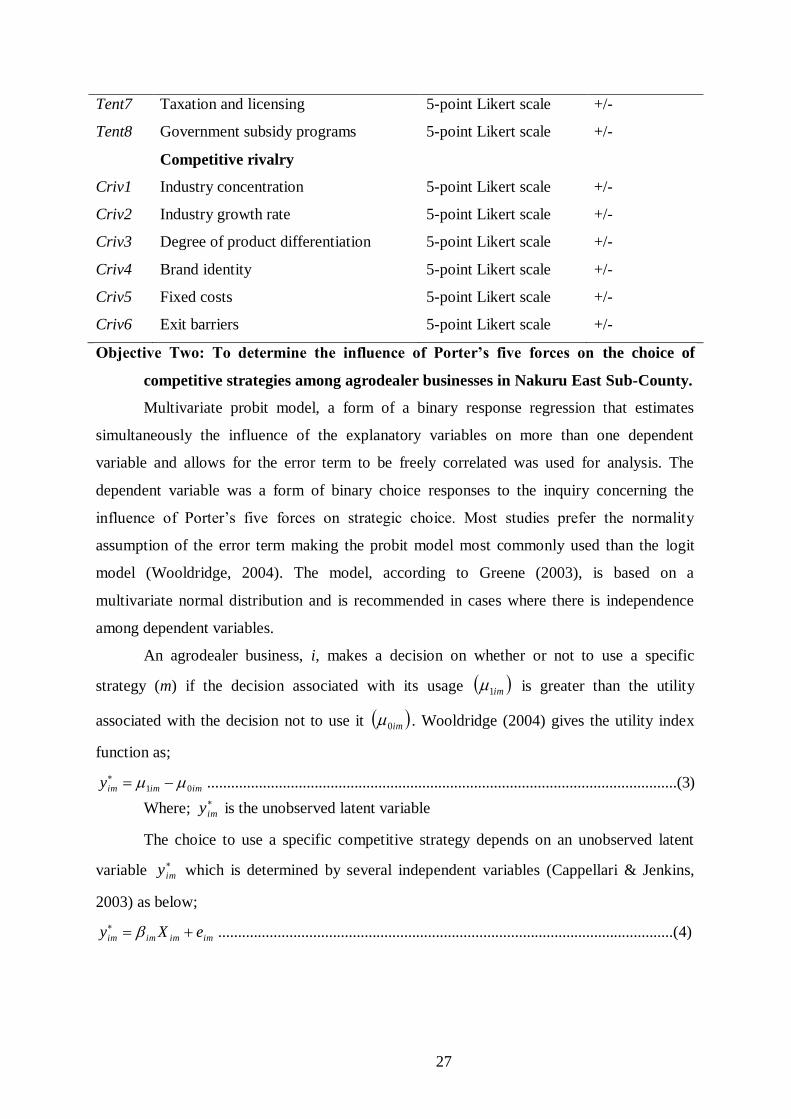
27
Tent7
Tent8
Criv1
Criv2
Criv3
Criv4
Criv5
Criv6
Taxation and licensing
Government subsidy programs
Competitive rivalry
Industry concentration
Industry growth rate
Degree of product differentiation
Brand identity
Fixed costs
Exit barriers
5-point Likert scale
5-point Likert scale
5-point Likert scale
5-point Likert scale
5-point Likert scale
5-point Likert scale
5-point Likert scale
5-point Likert scale
+/-
+/-
+/-
+/-
+/-
+/-
+/-
+/-
Objective Two: To determine the influence of Porter’s five forces on the choice of
competitive strategies among agrodealer businesses in Nakuru East Sub-County.
Multivariate probit model, a form of a binary response regression that estimates
simultaneously the influence of the explanatory variables on more than one dependent
variable and allows for the error term to be freely correlated was used for analysis. The
dependent variable was a form of binary choice responses to the inquiry concerning the
influence of Porter’s five forces on strategic choice. Most studies prefer the normality
assumption of the error term making the probit model most commonly used than the logit
model (Wooldridge, 2004). The model, according to Greene (2003), is based on a
multivariate normal distribution and is recommended in cases where there is independence
among dependent variables.
An agrodealer business, i, makes a decision on whether or not to use a specific
strategy (m) if the decision associated with its usage im1 is greater than the utility
associated with the decision not to use it im0 . Wooldridge (2004) gives the utility index
function as;
)3........(..............................................................................................................01 imimimy
Where;
imy is the unobserved latent variable
The choice to use a specific competitive strategy depends on an unobserved latent
variable
imy which is determined by several independent variables (Cappellari & Jenkins,
2003) as below;
)4.....(..............................................................................................................imimimim eXy

28
Where; imX is a set of independent variables influencing the choice of the agrodealer
to adopt or not to adopt a specific competitive strategy, im is the parameter estimate and ime
is the error term assumed to have a normal distribution.
The relationship between the unobserved
imy and observed variable imy is given
by;
)5......(..............................................................................................................0;0
0;1
im
im
imy
yy
Where imy is the usage of a specific competitive strategy; 1 if yes and 0 if otherwise.
The thi business will use an alternative strategy if imim 01 bringing in the
probability concept of using a competitive strategy estimated in the equation below (Greene,
2003);
)9...(,,...,1,1,1,1,1Pr ''
11554321 imimimimim XXyyPXyyyyyPob
Where: imXyyyyyP 1,1,1,1,1 54321 is the probability that a business, i,
will use a specific competitive strategy given the values of independent variables imX , 5
denotes the multivariate standard normal cumulative distribution function while is the
covariance matrix.
The basic form of multivariate probit model of an agrodealer’s decision is given by;
)6..(................................................................................ imimimoim eXCOMPSTRA
Where; imCOMPSTRA is the decision made by a business, i, whether to adopt a
specific competitive strategy or not, o represents the constant term, im are the coefficients
to be estimated, imX represents the independent variables and ime is the error term.

29
Table 3.3: Variables used in the multivariate probit model
Variables Descriptions Variable
measurements
Expected
sign
Dependent variables
Cstrachoice Choice of a competitive
strategy
1 = adoption
0 = otherwise
Independent Variables
Businesssage
Work_exp
Bs_branch
Educ_years
Ownstructure
Agdlrtraining
Grp_mbrshp
Age
Criv
Bbyrcsts
Branding
Prdctsub
Oprtnlcsts
Operation years of the business
Agrodealer years of experience
Number of business branches
Agrodealer’s level of education
Ownership structure of the
business
Access to agrodealer trainings
Membership to agrodealer
groups
Age of the agrodealer
Competitive rivalry
Buyer switching costs
Branding
Product substitution
Operational costs
Continuous
Continuous
Continuous
0= no-schooling,
1=primary,
2=secondary,
3=certificate/diploma,
4=graduate,
5=postgraduate
1=sole proprietorship,
2=partnership,
3=company
1= yes. 0= no
1=yes, 0= no
Continuous
Continuous
Continuous
Continuous
Continuous
Continuous
+/-
+/-
+/-
+/-
+/-
+/-
+/-
+/-
+/-
+/-
+/-
+/-
+/-

30
Objective Three: To determine the influence of Porter’s five forces and strategies on the
market share of agrodealer businesses in Nakuru East Sub-County.
Given the limited nature of the dependent variable, Tobit model was found
appropriate for analysis. The dependent variable, market share, is a continuous variable thus
logit and probit models were not appropriate for analysis as they require the dependent
variable be a binary choice (Gujarati, 2004). The ordinary least square method was
considered for analysis but due to its biases in parameter estimates (Wooldridge, 2004) and
taking into consideration, that market share could either be zero, it was not sufficient enough
for analysis. Due to this, the study considered the use of Tobit model for analysis. The first
step was the calculation of market share;
)7..(......................................................................%100sin
salesindustryTotal
salesessBushareMarket
Market share was then regressed against the business and agrodealer characteristics,
competitive forces and strategies to determine their influence on it;
)8........(....................................................................................................1
0 i
k
n
inni exy
)9...(..............................................................................................................10
11
isyif
isyify
i
i
i
Where; y is the latent market share margin, iy is the market share margin of the thi
business, i is the thi agrodealer business, 0 is the population intercept, n are parameters
to be estimated, inx are the independent variables (competitive forces and strategies and
socio-economic factors) while ie is the error term which is normally distributed.
The empirical Tobit model for objective three is given as;
)10.....(................................................................................Pr
exp___
__sin
Pr
201918
171615141312
1110987
6543210
DIVSmtnsDIFFS
FSCLSWorkbsOtherreOwnstructubrnchsBs
yearsEducmbrshpGrpGenderesssageBuBslocation
AgeCrivBrndngOprtnlcstsdctsubBbyrcstsshareMrkt

31
Table 3.4: Variables used in the Tobit model
Variables Descriptions Variable
measurement
Expected
sign
Market_share Market share percentage Continuous
Independent variables
Age
Gender
Grp_mbrshp
Educ_years
Work_exp
Businessage
Bs_branch
Ownstructure
Other_bs
Emlytraining
Criv
Bbyrcsts
Branding
Prdctsub
Oprtnlcsts
CLS
DIVS
DIFFS
FS
Prmtns
Bs_expenditures
Entre_skills
Age of the agrodealer
Gender of the agrodealer
Membership to agrodealer groups
Agrodealer’s level of education
Agrodealer years of experience
Operation years of the business
Number of business branches
Business ownership structure
Engagement in other businesses
Trainings of employees by the
business
Competitive rivalry
Buyer switching costs
Branding
Product substitution
Operational costs
Cost leadership strategy
Diversification strategy
Differentiation strategy
Focus strategy
Promotions strategy
Overall business expenditure
Entrepreneurial skills
Continuous
1= male, 2= female
1= yes, 0= no
0= no schooling,
1=primary,
2= secondary,
3=tertiary,
4= graduate,
5= postgraduate
Continuous
Continuous
Continuous
1= sole proprietorship,
2= partnerships, 3=
company
1= yes, 0= no
1= yes, 0= no
Continuous
Continuous
Continuous
Continuous
Continuous
1= yes, 0= no
1= yes, 0= no
1= yes, 0= no
1= yes, 0= no
1= yes, 0= no
Continuous
1=, 2= , 3= , 4
+/-
+/-
+/-
+/-
+/-
+/-
+/-
+/-
+/-
+
+/-
+/-
+/-
+/-
+/-
+
+/-
+/-
+/-
+/-
+
+

32
CHAPTER FOUR
RESULTS AND DISCUSSION
4.0 Introduction
This chapter presents the study findings. The statistical summary of the variables used
in the study is presented in the first part followed by results from factor analysis, where the
main competitive forces in the agrodealer industry are presented. Thereafter, results from the
multivariate probit model where the influence of retained forces and socio-economic factors
on utilization of competitive strategies are presented. Finally, results from the Tobit model are
presented in which the influence of competitive forces and strategies on the market share of
agrodealer businesses are captured. The estimate for all the parameters was obtained through
statistical analysis under the facilitation of STATA 15 data management tool.
4.1 Descriptive statistics
4.1.1 Socio-economic characteristics of agrodealers
The results of the socio-economic characteristics of the agrodealers are presented in
Table 4.1. Study findings indicated a large number of respondents were from Biashara ward
(46.36) followed closely by Nakuru East ward (39.09%) and Menengai ward had the least
number of respondents (14.55%). A large proportion of agrodealers were business managers
(67.3%) while business owners only constituted of 32.7%. This meant that most of the
agrodealer businesses in Nakuru East Sub-County were run by the business managers. Male
respondents accounted for 64% while the remaining portion (46%) were female. These
findings corroborate BCG (2016) observations which indicated that there were more male
respondents (56%) compared to females (44%) implying a case of low participation of women
in management and ownership of the businesses. Gender disparity (technology, access to
credit, trust from farmers and access to information) could be one of the main reasons
contributing to low women participation in the business. Similar results by Misiko (2012)
found out that male gender dominated the agrodealer industry as opposed to females.
The age of the agrodealers revealed the mean age to be 35.14 approximately 35 years
of age with the minimum age being 23 years and the maximum age being 70 years. A greater
percentage of the agrodealer respondents were in their youthful stages accounting for 77.3%
(40 years and below) explaining why majority of the agrodealer industry is enterprising and a
lucrative business among the youth in Kenya. The results further revealed that a high
percentage of agrodealers were graduates (46.4%), followed closely by certificate and
diploma holders at 39.6%, postgraduate 11% and only 4.5 % had managed to complete

33
secondary education. Agrodealers with a higher level of education are more knowledgeable
about the industry compared to their colleagues.
Table 4.1: Socio-economic characteristics of agrodealers
Variables Freq. Percent
Ward Biashara 51 46.36
Nakuru East 43 39.09
Menegai 16 14.55
Position in the business manager 74 67.27
business owner 36 32.73
Gender of the agrodealer male 64 58.18
female 46 41.82
Age of the agrodealer in years 21-30 years 45 40.91
31-40 years 40 36.36
41-50 years 19 17.27
above 50 years 6 5.46
Level of education secondary 5 4.55
certificate/diploma 43 39.09
graduate 51 46.36
postgraduate 11 10.00
Membership to agrodealer groups no 60 54.55
yes 50 45.45
Main reason for joining the group share information 12 10.91
access products 10 9.09
access credit 2 1.82
marketing 5 4.55
receive training 20 18.18
not applicable 61 55.45
The mean working experience years for agrodealers was 9 years implying that with
more years of experience, agrodealers gain adequate knowledge of how the industry operates
and therefore make informed decisions. As concerns membership to agrodealer groups,
majority of the agrodealers did not belong to any group (54.5%) while the remaining 45.5%
were members of groups. Of those (45.5%) who belonged to groups, a great percentage

34
claimed they joined the groups mainly to receive training (18.2%), 10.9 % joined for
purposes of sharing information, 9.1% for accessing products, 4.5% for marketing while only
1.8% joined for sharing credit.
4.1.2 Trainings received by agrodealers
A large proportion of the respondents (73.64%) further revealed that their main
occupation was related to the agrodealer industry with only 26.36% not having their formal
career related it. Agrodealers with careers related to the industry have a high affinity of
performing better and being knowledgeable about the industry compared to their
counterparts. The results indicated that out of those whose career was unrelated to the
industry, 15.45% had gone ahead and received training in the industry while 9.09% had not.
Table 4.2: Trainings received by agrodealers
Variables Freq. Percent
If the main career is related to the
agrodealer /agrovet industry
no
yes
29
81
26.36
73.64
The type of formal training received
related to the agrodealer industry
no yes
not applicable
10
17
83
9.09
15.45
75.45
Type of training received agribusiness management 18 16.37
animal health and production 32 29.09
animal nutrition 9 8.18
crops & horticulture 22 20.00
agricultural extension 13 11.82
veterinary science 7 6.36
other (specify) 9 8.18
Other training forms if not related to
the agricultural industry
business management and IT 21 19.1
beauty and therapy 4 3.64
education 10 9.09
not applicable 74 67.27
On type of training received related to the industry, a large proportion revealed that
they had formal training in animal health and production (29.09%), 20% had training in crops
and horticulture, 16.37% in agribusiness management, 11.82% in agricultural extension
35
while 8.18%, 6.36% had training in animal nutrition and veterinary science respectively. On
the hand, for those who had no training related to the agrodealer industry, a high percentage
(19.1%) trained in business management and IT, 9.1% had trained in education, and 3.6% in
beauty and therapy.
4.1.3 Business characteristics
From the results in Table 4.3, it is clear that the majority of the agrodealer businesses
(73.6%) are sole proprietorships, 13.6% are partnerships while 12.7% are companies. These
results indicate that the industry is mostly dominated by sole proprietorships. These results
are consistent with Misiko (2012) who found out that most of the agrodealer businesses in
Kakamega County were sole proprietorships. Moreover, the mean operation years of the
businesses was approximately 10 years (11.8%) with the least having been in operation for 1
year (0.9%) and the highest for 30 years (1.9%). The more operation years the business has,
the more its chances of survival and greater performance. Past studies, Misiko (2012) and
Odame and Muange (2011a) found out that most of the businesses were fairly young having
been in operation for less than 5 years.
In relation to business branches, a great percentage of the businesses have 0-1 branch
(79.1%), 2-3 branches was at 18.2% while only 2.7% had above 4 branches. Results further
indicated that 32.7% of the businesses engaged in crop inputs, 29.1% engaged in animal
feeds, animal health and crop inputs, 20% in animal health services, 11.8% in animal feeds
only while 6.4% being engaged in both animal feeds and health services. Engagement in other
businesses increased income generation of most businesses. In this case, a great
proportion of the agrodealer businesses (64.5%) did not engage in other businesses.
However, 35.5% carried out other businesses in the same premise with majority of them
(16.4%) claiming it was for income generation, 10.9%, 8.19% and 3.6% claimed it was for
survival/risk coping strategy and customer demands respectively. Of the other businesses
carried out, 12.7% was agency banking and Mpesa, 7.3% pharmacy/chemist, 6.4% general,
cereals and grocery shops, 5.5% farm machinery, 1.8% manufacturing business and the
remaining 0.9% was consultancy and photocopy business. These findings concur with
Odame and Muange (2011a) who found out that most agrodealers diversified into other
agricultural and non-agricultural items with the aim of risk coping for survival during low
seasons.
When asked whether the businesses trained their employees, most of the respondents
disagreed (59.1%) while 40.9% agreed the business provided training to them. Out of the
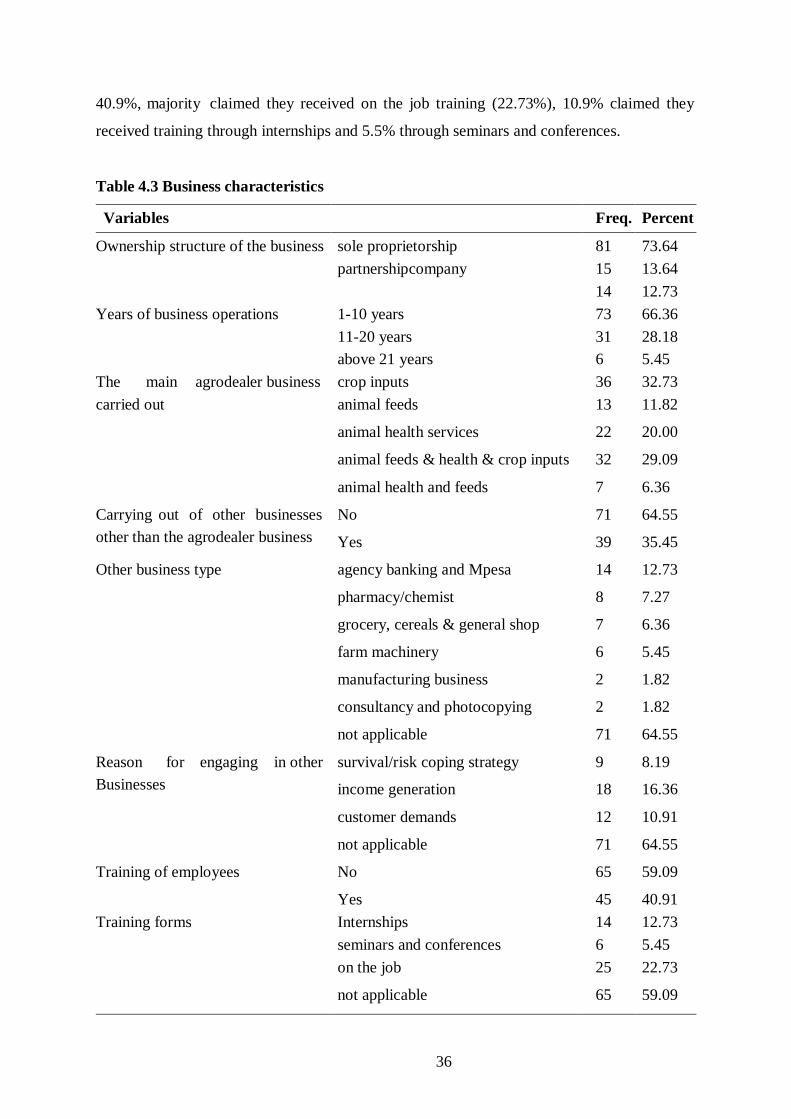
36
40.9%, majority claimed they received on the job training (22.73%), 10.9% claimed they
received training through internships and 5.5% through seminars and conferences.
Table 4.3 Business characteristics
Variables Freq. Percent
Ownership structure of the business sole proprietorship
partnership company
81
15
14
73.64
13.64
12.73
Years of business operations 1-10 years
11-20 years
above 21 years
73
31
6
66.36
28.18
5.45
The main agrodealer business
carried out
crop inputs 36 32.73
animal feeds 13 11.82
animal health services 22 20.00
animal feeds & health & crop inputs 32 29.09
animal health and feeds 7 6.36
Carrying out of other businesses
other than the agrodealer business
No 71 64.55
Yes 39 35.45
Other business type agency banking and Mpesa 14 12.73
pharmacy/chemist 8 7.27
grocery, cereals & general shop 7 6.36
farm machinery 6 5.45
manufacturing business 2 1.82
consultancy and photocopying 2 1.82
not applicable 71 64.55
Reason for engaging in other
Businesses
survival/risk coping strategy 9 8.19
income generation 18 16.36
customer demands 12 10.91
not applicable 71 64.55
Training of employees No 65 59.09
Yes 45 40.91
Training forms Internships 14 12.73
seminars and conferences 6 5.45
on the job 25 22.73
not applicable 65 59.09

37
4.1.4 Porter’s five forces
4.1.4.1 Bargaining power of buyers
The results in Table 4.4 indicate that majority of the respondents (64.55%) agreed
that they negotiate product prices with their customers. Moreover, 60% of the respondents
also agreed that if substitute products were sold at a better price, buyers would easily shift
towards it while 47.27% agreed that their customers are well informed about the market.
Important to note was the fact that 36.36% agreed while at the same time were neutral that
their buyers purchased a large volume of their products. However, 49.09% of the respondents
disagreed that buyer concentration was low in the market with 37.27% further disagreeing
that it was difficult for buyers to switch from their services to that of their rivals.
Table 4.4: Bargaining power of buyers
Opinion statements SD% D% N% A% SA% Std. Dev.
My customers are well-informed 8.18 13.64 30.91 31.82 15.45 1.142
It is difficult for my buyers to switch
from my services to those my rivals’
17.27 20.00 28.18 19.09 15.45 1.309
I negotiate product prices with my
customers
4.55 20.91 10.00 32.73 31.82 1.251
Buyer concentration is low 29.09 20.00 38.18 7.27 5.45 1.142
If substitute products are sold at a
better price, buyers shift towards it
12.73 7.27 20.00 30.91 29.09 1.324
My buyers purchase a large volume
of my products
19.09 8.18 36.36 18.18 18.18 1.328
SD, D, N, A and SA represent strongly disagree, disagree, neutral, agree and strongly agree
respectively
4.1.4.2 Bargaining power of suppliers
Table 4.5 highlights descriptive statistics from the bargaining power of the supplier in
the agrodealer industry. The results indicate that a large proportion (85.45%) of the
respondents agreed that there are numerous suppliers in the agrodealer market. An addition
of 75.42% further agreed that they are well informed about their suppliers’ services in the
market. On the contrary, 67.28% of the respondents disagreed that their suppliers sold farm
inputs directly to their customers meaning they did not face any backward threat. A further
51.82% disagreed that switching costs from one supplier to another was high in the industry

38
with 43.54% and 40.91% willingly agreed that they negotiated product prices with suppliers
and they bought large volumes of their suppliers’ products respectively.
Table 4.5: Bargaining power of suppliers
Opinion statements SD% D% N% A% SA% Std. Dev.
There are numerous suppliers in the
market
4.5 0.00 10.00 30.00 55.45 0.986
At times my suppliers sell farm inputs
directly to my customers
34.55 22.73 14.55 14.55 14.55 1.438
I am well-informed about my
suppliers’ services and market
2.73 7.27 14.55 49.09 26.36 0.971
I negotiate product prices with my
suppliers
11.82 24.55 20.00 20.91 22.73 1.349
Switching costs from one supplier to
another is high
29.09 22.73 20.91 19.09 8.18 1.311
I buy a large volume of my suppliers’
products
6.36 15.45 37.27 24.55 16.36 1.111
SD, D, N, A and SA represent strongly disagree, disagree, neutral, agree and strongly agree
respectively
4.1.4.3 Threat of substitutes
The research findings as shown in Table 4.6 indicate 87.27% of the respondents
agreed that other than the products they offered, there were more substitutes available in the
market. An addition of 61.82%, 60% and 48.18% agreed that customers preferred products
from a specific company, there was no much product difference between their products and
their rivals and prices for substitute products fairly competed with each other in the market
respectively. However, 70% disagreed that they only stocked products from a specific
company with 55.46% further disagreeing that it was costly for their customers to switch to
other businesses.
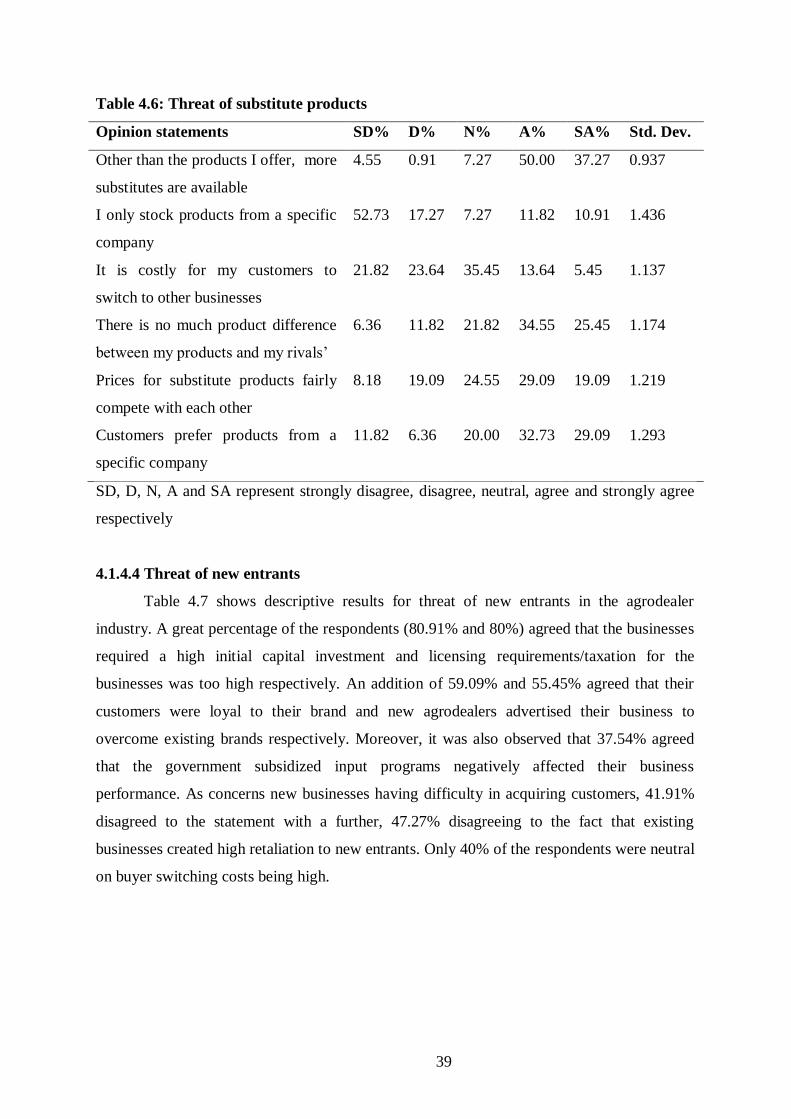
39
Table 4.6: Threat of substitute products
Opinion statements SD% D% N% A% SA% Std. Dev.
Other than the products I offer, more
substitutes are available
4.55 0.91 7.27 50.00 37.27 0.937
I only stock products from a specific
company
52.73 17.27 7.27 11.82 10.91 1.436
It is costly for my customers to
switch to other businesses
21.82 23.64 35.45 13.64 5.45 1.137
There is no much product difference
between my products and my rivals’
6.36 11.82 21.82 34.55 25.45 1.174
Prices for substitute products fairly
compete with each other
8.18 19.09 24.55 29.09 19.09 1.219
Customers prefer products from a
specific company
11.82 6.36 20.00 32.73 29.09 1.293
SD, D, N, A and SA represent strongly disagree, disagree, neutral, agree and strongly agree
respectively
4.1.4.4 Threat of new entrants
Table 4.7 shows descriptive results for threat of new entrants in the agrodealer
industry. A great percentage of the respondents (80.91% and 80%) agreed that the businesses
required a high initial capital investment and licensing requirements/taxation for the
businesses was too high respectively. An addition of 59.09% and 55.45% agreed that their
customers were loyal to their brand and new agrodealers advertised their business to
overcome existing brands respectively. Moreover, it was also observed that 37.54% agreed
that the government subsidized input programs negatively affected their business
performance. As concerns new businesses having difficulty in acquiring customers, 41.91%
disagreed to the statement with a further, 47.27% disagreeing to the fact that existing
businesses created high retaliation to new entrants. Only 40% of the respondents were neutral
on buyer switching costs being high.

40
Table 4.7: Threat of new entrants
Opinion statements SD% D% N% A% SA% Std. Dev.
New agrodealers advertise to
overcome existing brand preferences
10.91 10.00 23.64 29.09 26.36 1.283
My customers are loyal to my brand 1.82 15.45 23.64 32.73 26.36 1.086
The business requires a high initial
capital investment
6.36 2.73 10.00 34.55 46.36 1.114
New businesses have difficulty in
acquiring customers
24.55 17.27 17.27 28.18 12.73 1.395
Buyer switching costs are high 8.18 20.91 40.00 20.00 10.91 1.087
Retaliation from existing firms is
high towards new entrants
30.0 17.27 27.27 19.09 6.36 1.275
Licensing requirements and taxation
are too high
2.73 2.73 14.55 32.73 47.27 0.972
Subsidized inputs have negatively
affected business performance
30.0 7.27 25.45 17.27 20.27 1.502
SD, D, N, A and SA represent strongly disagree, disagree, neutral, agree and strongly agree
respectively
4.1.4.5 Competitive rivalry
The results as shown in Table 4.8 indicate that a great proportion of the respondents
(90%) agreed on there being numerous agrodealer businesses in the Sub-County while the
least proportion (40%) disagreed on their businesses growing at a fast rate. 56.36% agreed on
storage costs of the product being too high, 50% agreed that their pricing strategy had been
affected largely by entry of new players, 46.36% further agreed on the industry having high
fixed costs with only 45.45% agreeing on their being a clear brand identity of businesses in
the market.

41
Table 4.8: Competitive rivalry
Opinion statements SD% D% N% A% SA% Std. Dev.
There are numerous agrodealer
businesses in the Sub-County
4.55 0.00 5.45 30.91 59.09 0.950
Entry of new players affects my
product pricing strategy
14.55 12.73 22.73 28.18 21.82 1.338
Industry has high fixed costs 10.00 10.00 33.64 25.45 20.91 1.210
Storage costs are too high 4.55 14.55 24.55 27.27 29.09 1.181
My business grows at a fast rate 15.45 24.55 36.36 19.09 4.55 1.083
There is a clear brand identity of
businesses in the market
20.00 14.55 20.00 29.09 16.36 1.379
SD, D, N, A and SA represent strongly disagree, disagree, neutral, agree and strongly agree
respectively
4.1.5 Competitive strategies
4.1.5.1 Cost leadership strategy
Results in Table 4.9 indicates that a greater proportion of the respondents (56.4%)
stated that they often offered price discounts on products to their customers. 46.4% of the
businesses often improved their efficiency through cost controls along the existing activity
cost chains, 39.1% always strived to supply a standard of high volume services at the most
competitive prices to their buyers while 38.2% always benchmarked themselves against their
rivals to access their relative cost. Only 35.5% stated that they did not often offer low priced
products.
Table 4.9: Cost leadership strategies
Opinion statements N% NO% O% A% Std. dev.
Offering low priced products 19.09 34.55 33.64 12.73 0.940
Offering price discounts on products 4.55 24.55 56.36 14.55 0.736
Improving efficiency through cost controls
along the existing cost chains
1.82 30.0 46.36 21.82 0.763
Supplying a high volume services at the
most competitive prices to buyers
5.45 19.09 36.36 39.09 0.894
Benchmarking to access relative costs 11.82 22.73 27.27 38.18 1.042
N, NO, O and A represent never, not often, often and always respectively
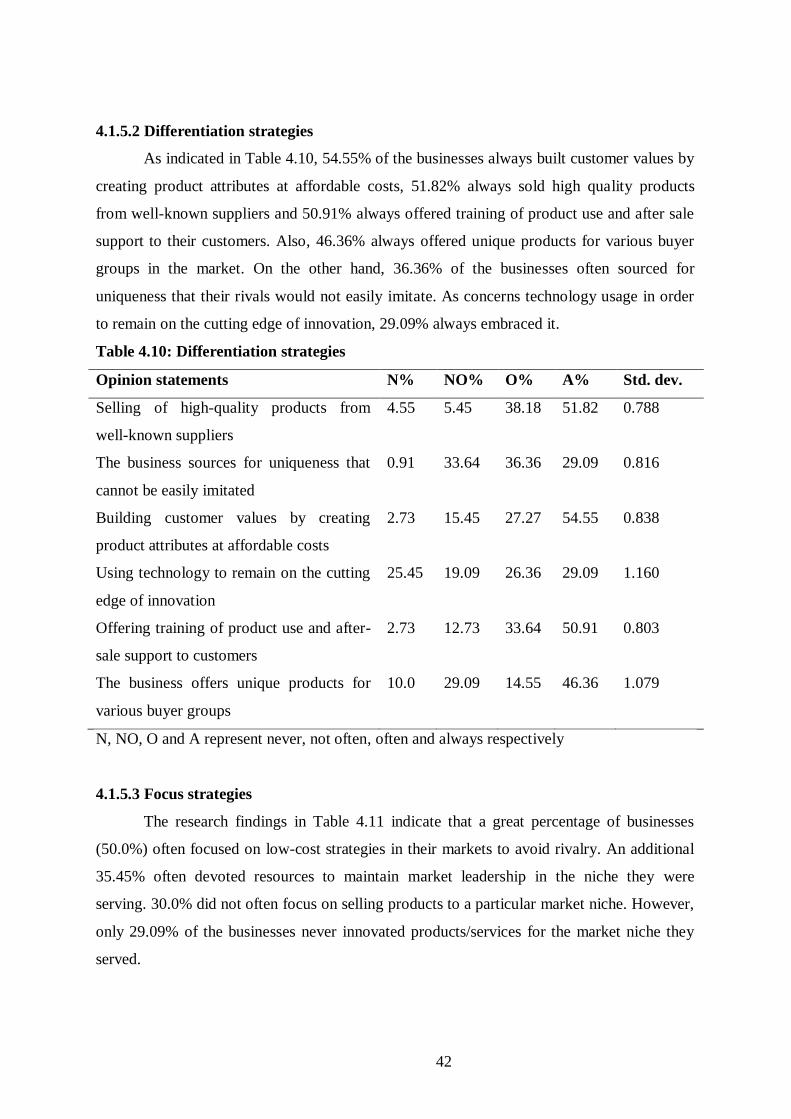
42
4.1.5.2 Differentiation strategies
As indicated in Table 4.10, 54.55% of the businesses always built customer values by
creating product attributes at affordable costs, 51.82% always sold high quality products
from well-known suppliers and 50.91% always offered training of product use and after sale
support to their customers. Also, 46.36% always offered unique products for various buyer
groups in the market. On the other hand, 36.36% of the businesses often sourced for
uniqueness that their rivals would not easily imitate. As concerns technology usage in order
to remain on the cutting edge of innovation, 29.09% always embraced it.
Table 4.10: Differentiation strategies
Opinion statements N% NO% O% A% Std. dev.
Selling of high-quality products from
well-known suppliers
4.55 5.45 38.18 51.82 0.788
The business sources for uniqueness that
cannot be easily imitated
0.91 33.64 36.36 29.09 0.816
Building customer values by creating
product attributes at affordable costs
2.73 15.45 27.27 54.55 0.838
Using technology to remain on the cutting
edge of innovation
25.45 19.09 26.36 29.09 1.160
Offering training of product use and after-
sale support to customers
2.73 12.73 33.64 50.91 0.803
The business offers unique products for
various buyer groups
10.0 29.09 14.55 46.36 1.079
N, NO, O and A represent never, not often, often and always respectively
4.1.5.3 Focus strategies
The research findings in Table 4.11 indicate that a great percentage of businesses
(50.0%) often focused on low-cost strategies in their markets to avoid rivalry. An additional
35.45% often devoted resources to maintain market leadership in the niche they were
serving. 30.0% did not often focus on selling products to a particular market niche. However,
only 29.09% of the businesses never innovated products/services for the market niche they
served.
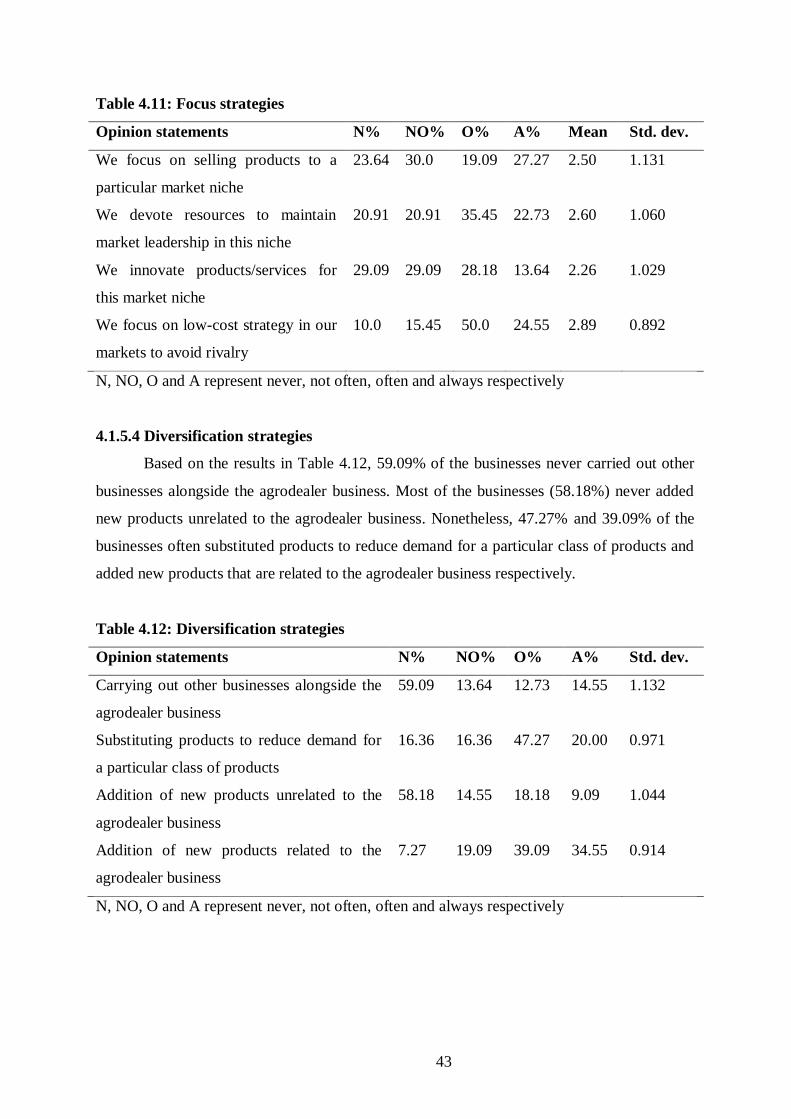
43
Table 4.11: Focus strategies
Opinion statements N% NO% O% A% Mean Std. dev.
We focus on selling products to a
particular market niche
23.64 30.0 19.09 27.27 2.50 1.131
We devote resources to maintain
market leadership in this niche
20.91 20.91 35.45 22.73 2.60 1.060
We innovate products/services for
this market niche
29.09 29.09 28.18 13.64 2.26 1.029
We focus on low-cost strategy in our
markets to avoid rivalry
10.0 15.45 50.0 24.55 2.89 0.892
N, NO, O and A represent never, not often, often and always respectively
4.1.5.4 Diversification strategies
Based on the results in Table 4.12, 59.09% of the businesses never carried out other
businesses alongside the agrodealer business. Most of the businesses (58.18%) never added
new products unrelated to the agrodealer business. Nonetheless, 47.27% and 39.09% of the
businesses often substituted products to reduce demand for a particular class of products and
added new products that are related to the agrodealer business respectively.
Table 4.12: Diversification strategies
Opinion statements N% NO% O% A% Std. dev.
Carrying out other businesses alongside the
agrodealer business
59.09 13.64 12.73 14.55 1.132
Substituting products to reduce demand for
a particular class of products
16.36 16.36 47.27 20.00 0.971
Addition of new products unrelated to the
agrodealer business
58.18 14.55 18.18 9.09 1.044
Addition of new products related to the
agrodealer business
7.27 19.09 39.09 34.55 0.914
N, NO, O and A represent never, not often, often and always respectively

44
4.1.6 Performance measures
A great percentage of the businesses (59.09%) maintained their former/old customers.
50.0% managed to maintain their employee satisfaction and retention while 34.5% had
their profitmargins improve. The results (Table 4.13) further indicates that 30% of the
businesses improved on their acquisition of new customers with 34.5% improved in their
business sales.
Table 4.13: Performance measures
Performance Measures GD% D% M% I% GI% Std. dev.
Business sales 10.9 30.0 20.00 34.50 4.50 1.126
Acquisition of new customers 1.80 27.30 30.00 33.60 7.30 0.975
Retention of old customers 2.70 14.50 59.10 20.00 3.60 0.775
Employee satisfaction and retention 5.50 17.30 50.00 20.90 6.40 0.927
Net profit margins 17.30 16.40 20.90 34.50 10.90 1.284
GD, D, M, I and GI represent greatly dropped, dropped, maintained, improved and greatly
improved respectively
4.2 Agrodealers perception of the main competitive forces in the industry
4.2.1 Validity
Data was first subjected to a validity test to assess its accuracy in the representation of
the study variables. Principal Component Analysis (PCA) was used to conduct the construct
validity test through factor extractions. This criteria of validity test was suggested by Hair et
al. (2010), who argued that, for factor analysis to be valid, factor loadings greater than 0.40
were considered statistically significant for studies that had sample sizes less than 200.
4.2.2 Sampling adequacy
The extracted items were further subjected to a sampling adequacy test to ascertain
the appropriateness of the data for factor analysis. A Bartlett’s test of sphericity which tests
inter-correlation between variables (Bartlett, 1954; Hair et. al., 2010) was conducted. The
results indicated that the test was significant since all the factors’ p-values were less than
0.05 as shown in Table 4.14. This indicated that the correlation matrix was significantly
different from the identity matrix, in which correlations between variables were all zero
demonstrating a strong relationship among the variables hence factor analysis was
appropriate.

45
Kaiser Meyer Olkin (KMO) test was also done to determine the sampling adequacy
of the data. According to Kaiser (2010), a KMO of 0.5 is the minimum required value for
carrying out factor analysis. Results in Table 4.14 showed the KMO for the 32 item variables
extracted to be 0.5685 indicating that the Pearson correlation matrices was appropriate for
factor analysis.
Table 4.14: Sample size adequacy test
Kaiser-Meyer-Olkin Measure of Sampling Adequacy. 0.5685
Bartlett's Test of Sphericity Approx. Chi-Square 435
Df. 797.63
P-value 0.000
H0: variables are not intercorrelated
4.2.3 Factor extraction
Pearson correlation matrix was used to run the factor analysis model. The number of factors
to be extracted from the model was based on Kaiser’s criterion which states that factors with
an eigenvalue greater than 1 to be retained (Kaiser, 1960). Using this criterion, five factors
which had an eigenvalue greater than one were retained. The five factors represented a total
variance of 76.10% among the 32 items as shown in Table 4.15.
Table 4.15: Eigenvalues and their cumulative proportion of total sample variance
Factor Eigenvalue Difference Proportion Cumulative
Factor1 3.152 1.011 0.265 0.265
Factor2 2.140 0.726 0.180 0.444
Factor3 1.415 0.187 0.119 0.564
Factor4 1.228 0.095 0.103 0.666
Factor5 1.133 0.146 0.095 0.761
Orthogonal Varimax rotation with Kaiser Normalization was run to make the factor
solution unique. Table 4.16 presents the results showing the extent to which each item loaded
on a specific factor. Some items loaded highly on some factors while others loaded lowly.
Items with a loading greater than 0.40 (>0.4) were viewed to have loaded sufficiently on a
factor, therefore, were used to explain the factor. Variables excluded from the model failed to
attain a factor loading of 0.4 implying that they did not load highly on any factor.

46
Retained factors were further assigned names according to factors that loaded highly
on them. Factor1 was interpreted as competitive rivalry based on the following factors;
numerous suppliers in the market, new agrodealers advertise to overcome existing brands,
well-informed customers, and the presence of numerous agrodealers in the market in the
market. Competitive rivalry accounted for 26.45% of the total variance. A probable
validation for this is that there are numerous agrodealer businesses due to its centrality in the
county with local agrodealers and farmers from neighboring sub-counties sourcing their
inputs from it. Besides, due to its lucrative nature (Soi, 2016), more investors venture into the
business annually making the market more competitive and consequently increasing rivalry.
Also, the rise of a well-knowledgeable customer has seen most businesses struggle to
advertise themselves to lure more buyers to their premises. Unlike in the past where
agrodealers would sell their inputs to oblivious customers, nowadays, customers have their
demands, tastes, and preferences.
Based on the items that loaded highly on Factor2, it was interpreted as product
substitution and contributed 17.96% to the total variance. The items included; low buyer
concentration in the market, if substitute products are sold at better prices buyers easily shift
towards it, suppliers at times sell farm inputs directly to agrodealer customers, low product
differentiation between the businesses, and supplier switching costs are high. The market is
characterized by high degrees of substitutes that competing in the industry. Given the nature
of inputs, it is difficult for the businesses to differentiate products as customers always have
pre-established notions on a particular brand. Also, agrodealers face stiff competition from
input suppliers who at times forward integrate and sell inputs directly to their customers.
Factor3 was termed as branding based on the following indicators; there is a clear
brand identity of the businesses in the market and businesses grow at a fast rate hence
contributing 11.87% to the total variance. Results further indicated that branding was a force
to reckon with in the agrodealer industry. With the high number of businesses in the sub-
county, there are already established businesses that most customers identify with. These
businesses, have been in the market for a long period of time and have established a wider
customer base hence competing with them proves difficult and challenging for new entrants.
As a result, businesses are devising ways such as vigorous advertising and linking up with
the county government for them to get known and capture the market from the already
established businesses.

47
Table 4.16: Factors and their loadings using Pearson correlation matrix
Variable Factor1 Factor2 Factor3 Factor4 Factor5 Uniqueness
Bsup1 0.708 0.466
Criv1 0.690 0.499
Bsup3 0.513 0.694
Tent1 0.444 0.656
Bbyr1 0.443 0.746
Bbyr5 0.646 0.549
Bbyr4 0.628 0.572
Bsup2 0.600 0.554
Tsub4 0.461 0.731
Bsup5 0.436 0.573
Criv5 0.533 0.699
Criv6 0.429 0.682
Tent5 0.529 0.647
Tent4 0.460 0.711
Bbyr2 0.453 0.729
Tsub3 -0.591 0.622
Tent3 0.513 0.687
Extraction Method: Principal Axis Factoring;
Rotation Method: Varimax with Kaiser Normalization
Blanks represent abs (loading) <.4
Factor4 was interpreted as buyer switching costs contributing 10.31% to the total
variance. The factors that highly loaded on this factor were; buyer switching costs, the
difficulty of new businesses in acquiring customers, and difficulty in buyer switching costs
from one business to another. Agrodealers noted that buyer switching costs were one of the
main competitive forces in the industry. New entrants argued that it was difficult to convince
a buyer to shift from one business to another hence they had a rough time in acquiring
customers. Businesses that have been in the market for a long time were at an advantage.
However, they too were struggling hard to retain there market share due to the competing
nature of the farm input products. Notably, buyers preferred buying their input products from
48
a store they were familiar with and a majority of them argued that most of the inputs were
within the same price range hence saw no need of switching businesses.
Lastly, Factor5 was interpreted as operational costs with two factors; high initial
capital investment and costly for customers to switch to other businesses loaded highly on it.
Operational costs loaded 9.51% to the total variance. A plausible reason for this is that the
industry is coupled with high operational costs that range from storage costs, marketing
costs, research and development into new technologies in the agricultural sector, and
payment of employees. Also, most of the agrodealer businesses have rented out premises
which they are required to remit taxes and county operational permit licenses. These results
conform to those of BCG (2016) and Odame and Muange (2011b) who found out that
agrodealers are faced with several challenges which includes high operational costs that
emanate from salaries, storage, research and development, licensing, taxation, marketing and
transportation costs.
Cronbach’s alpha reliability test was used to measure how well the variables measure
a single latent variable (Hair et al., 2010). The closer the alpha is to 1, the more the variables
measure the factor. According to the test, the Cronbach’s values were found to be 0.7, 0.7,
0.5, 0.5 and 0.4 for factors 1, 2, 3, 4 and 5 respectively demonstrating their reliability
adequacy. The retained factors were further used as independent variables in subsequent
models.
4.3 Influence of Porter’s five forces on the choice of competitive strategies among
agrodealer businesses in Nakuru East Sub-County
To determine the influence of Porter’s five forces on the choice of competitive
strategies adopted by agrodealer businesses, multivariate probit model was used. The study
had five dependent variable and multivariate probit was considered as appropriate for
analysis due to independence of the dependent variables. Fourteen variables were used to
determine the influence on the five competitive strategies adopted by agrodealer businesses.
Diagnostic tests were carried out before running the probit models. Multicollinearity
was tested using the Variance Inflation Factor (VIF) for all the independent variables. All
variables had a VIF of less than 10 with the overall VIF being 1.99 (Appendix v) hence there
was no multicollinearity between the variables. Heteroskedasticity (table 4.17) was tested by
use of the Breusch Pagan test. The null hypothesis for all the five strategies were rejected as
they all had high p-values indicating absence of heteroskedasticity.
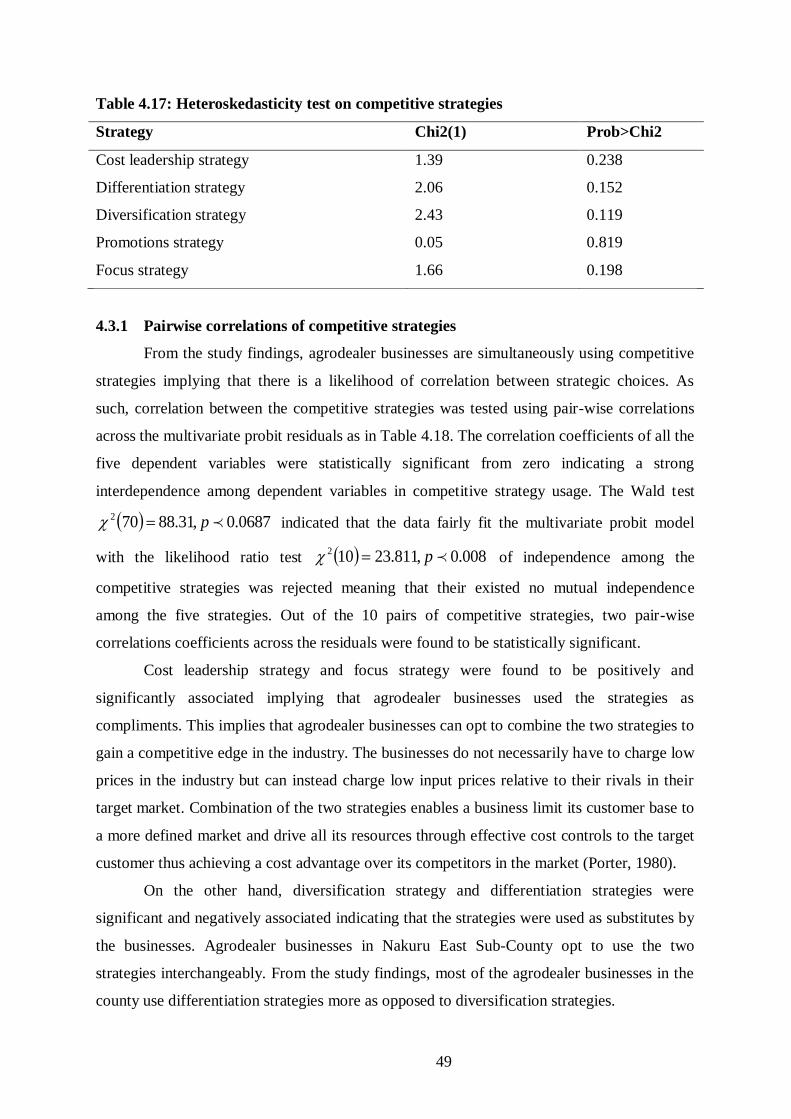
49
Table 4.17: Heteroskedasticity test on competitive strategies
Strategy Chi2(1) Prob>Chi2
Cost leadership strategy 1.39 0.238
Differentiation strategy 2.06 0.152
Diversification strategy 2.43 0.119
Promotions strategy 0.05 0.819
Focus strategy 1.66 0.198
4.3.1 Pairwise correlations of competitive strategies
From the study findings, agrodealer businesses are simultaneously using competitive
strategies implying that there is a likelihood of correlation between strategic choices. As
such, correlation between the competitive strategies was tested using pair-wise correlations
across the multivariate probit residuals as in Table 4.18. The correlation coefficients of all the
five dependent variables were statistically significant from zero indicating a strong
interdependence among dependent variables in competitive strategy usage. The Wald test
0687.0,31.88702 p indicated that the data fairly fit the multivariate probit model
with the likelihood ratio test 008.0,811.23102 p of independence among the
competitive strategies was rejected meaning that their existed no mutual independence
among the five strategies. Out of the 10 pairs of competitive strategies, two pair-wise
correlations coefficients across the residuals were found to be statistically significant.
Cost leadership strategy and focus strategy were found to be positively and
significantly associated implying that agrodealer businesses used the strategies as
compliments. This implies that agrodealer businesses can opt to combine the two strategies to
gain a competitive edge in the industry. The businesses do not necessarily have to charge low
prices in the industry but can instead charge low input prices relative to their rivals in their
target market. Combination of the two strategies enables a business limit its customer base to
a more defined market and drive all its resources through effective cost controls to the target
customer thus achieving a cost advantage over its competitors in the market (Porter, 1980).
On the other hand, diversification strategy and differentiation strategies were
significant and negatively associated indicating that the strategies were used as substitutes by
the businesses. Agrodealer businesses in Nakuru East Sub-County opt to use the two
strategies interchangeably. From the study findings, most of the agrodealer businesses in the
county use differentiation strategies more as opposed to diversification strategies.

50
Table 4.18: Pair-wise correlations of competitive strategies
Strategies CLS DIVS DIFFS FS Prmtns
CLS 1.000
DIVS 0.020 1.000
DIFFS 0.066 -0.187* 1.000
FS 0.207* -0.080 -0.117 1.000
Prmtns 0.010 -0.044 0.157 -0.107 1.000
* indicates significance at 5% significance level
CLS= Cost leadership strategies; DIVS= diversification strategies; DIFFS= differentiation
strategies; FS= focus strategies; Prmtns= promotions strategies
4.3.2 Strategic usage among agrodealer businesses
Study findings (Figure 4.1) revealed that majority of the businesses (30.71%) used
differentiation strategies compared to other strategies. Product packaging according to buyer
preference was the widely used differentiation strategic approach among the businesses.
Majority of the businesses argued that since the industry is highly homogeneous, they had to
actively differentiate themselves in order to appeal to their customers as well as attract new
ones. By differentiating themselves, agrodealer businesses are able to gain a larger customer
base. Cost leadership strategies followed closely at 21.16% as the second most widely used
strategy. However, the strategy did not seem viable for competing in the industry. This is due
to the fact that, most of the products are within the same price range thus lowering their
prices does not impact much as customers always bought inputs from an agrodealer business
they found easier to locate.
Promotions strategies 20.33% and focus strategies 16.6%. Focus strategies was
widely used in Nakuru East ward with a focus on animal feeds as opposed to Menengai and
Flamingo wards. A likely justification for this is that, most of the farmers in Nakuru East
ward engage in livestock keeping hence animal feed products were widely consumed and
sold in the region. Diversification strategies was the least used strategy among agrodealer
businesses with only 27 businesses diversifying to either related or unrelated businesses.

51
Figure 4.1: Usage of competitive strategies among agrodealer businesses in Kenya
4.3.3 Determinants of competitive strategic choices among agrodealer businesses
The results of the multivariate probit model involving identification of determinants
of competitive strategic choices among agrodealer businesses is presented in Table 4.19
below.
11.2%
16.6%
20.33%21.16%
30.71%
Diversification strategies Focus strategies
Promotions strategies Cost leadership strategies
Differentiation strategies
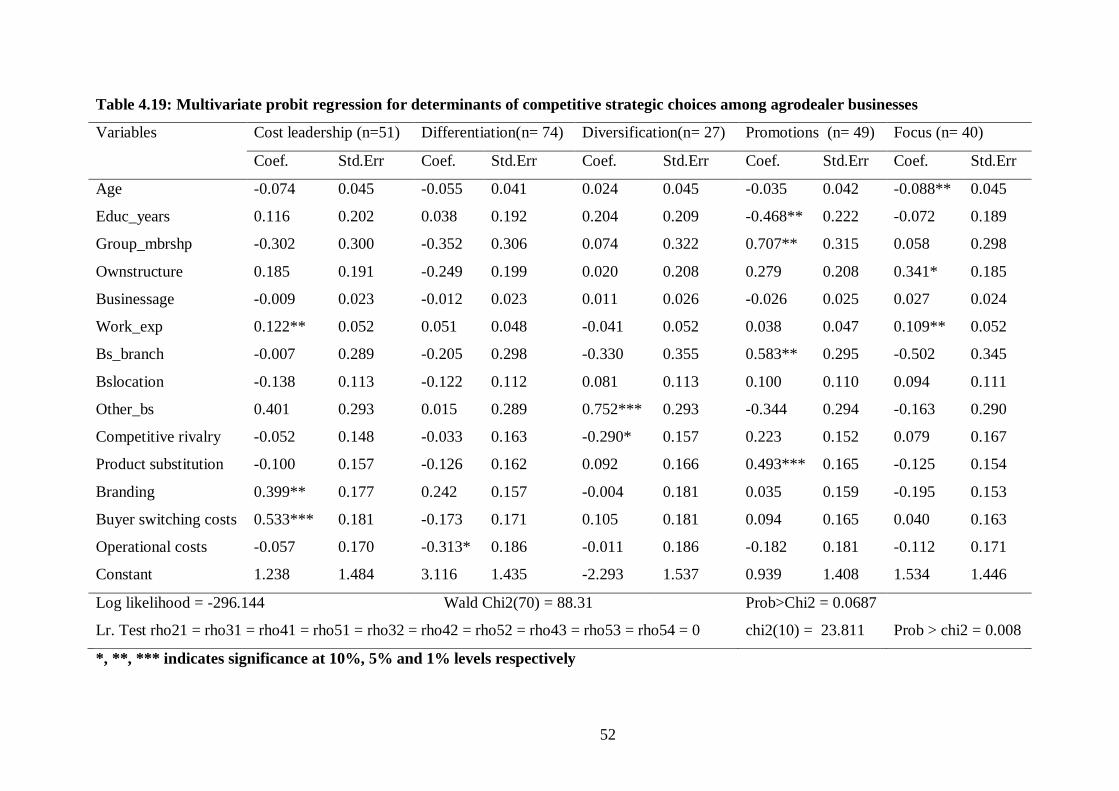
52
Table 4.19: Multivariate probit regression for determinants of competitive strategic choices among agrodealer businesses
Variables Cost leadership (n=51) Differentiation(n= 74) Diversification(n= 27) Promotions (n= 49) Focus (n= 40)
Coef. Std.Err Coef. Std.Err Coef. Std.Err Coef. Std.Err Coef. Std.Err
Age -0.074 0.045 -0.055 0.041 0.024 0.045 -0.035 0.042 -0.088** 0.045
Educ_years 0.116 0.202 0.038 0.192 0.204 0.209 -0.468** 0.222 -0.072 0.189
Group_mbrshp -0.302 0.300 -0.352 0.306 0.074 0.322 0.707** 0.315 0.058 0.298
Ownstructure 0.185 0.191 -0.249 0.199 0.020 0.208 0.279 0.208 0.341* 0.185
Businessage -0.009 0.023 -0.012 0.023 0.011 0.026 -0.026 0.025 0.027 0.024
Work_exp 0.122** 0.052 0.051 0.048 -0.041 0.052 0.038 0.047 0.109** 0.052
Bs_branch -0.007 0.289 -0.205 0.298 -0.330 0.355 0.583** 0.295 -0.502 0.345
Bslocation -0.138 0.113 -0.122 0.112 0.081 0.113 0.100 0.110 0.094 0.111
Other_bs 0.401 0.293 0.015 0.289 0.752*** 0.293 -0.344 0.294 -0.163 0.290
Competitive rivalry -0.052 0.148 -0.033 0.163 -0.290* 0.157 0.223 0.152 0.079 0.167
Product substitution -0.100 0.157 -0.126 0.162 0.092 0.166 0.493*** 0.165 -0.125 0.154
Branding 0.399** 0.177 0.242 0.157 -0.004 0.181 0.035 0.159 -0.195 0.153
Buyer switching costs 0.533*** 0.181 -0.173 0.171 0.105 0.181 0.094 0.165 0.040 0.163
Operational costs -0.057 0.170 -0.313* 0.186 -0.011 0.186 -0.182 0.181 -0.112 0.171
Constant 1.238 1.484 3.116 1.435 -2.293 1.537 0.939 1.408 1.534 1.446
Log likelihood = -296.144 Wald Chi2(70) = 88.31 Prob>Chi2 = 0.0687
Lr. Test rho21 = rho31 = rho41 = rho51 = rho32 = rho42 = rho52 = rho43 = rho53 = rho54 = 0 chi2(10) = 23.811 Prob > chi2 = 0.008
*, **, *** indicates significance at 10%, 5% and 1% levels respectively

53
On the influence of Porter’s five forces on choice of cost leadership strategies, three
variables were found to be statistically significant including; work experience, branding and
buyer switching costs. One factor, operational costs, was found to be statistically significant
on choice of differentiation strategy. On the influence of porter’s five forces on choice of
promotions strategies, five variables were found to be statistically significant including;
agrodealer’s years of education, group membership, number of business branches,
competitive rivalry and product substitution. Engaging in other businesses and competitive
rivalry were found to be statistically significant with choice of diversification strategies.
Finally, three variables; agrodealer’s age, work experience and business ownership structure
were found to be statistically significant with choice of focus strategy.
An increase in age decreases the probability of using focus strategy. The plausible
reason could be because as one becomes older, he gains experience and exposure to the use
of new and innovative strategies hence the low preference for focus strategy. Moreover,
increase in age brings about changes in goal orientation making agrodealers more
unadventurous and less preoccupied with focusing on new product lines and markets. This
conforms to a study by Gielnik et al. (2017) who found out that, as age progresses, business
managers are less oriented towards new opportunities as they have literally attained their
goals and are left with little energy to focus on new opportunities.
As an agrodealer advances in his education, his probability of choosing promotions
strategy decreases. Advancement in education enables an agrodealer to gain more knowledge
and becomes more enlightened on various strategies that can be used to improve performance
hence low preference for promotions strategies. Education provides a wider scope of
exposure positively contributing to strategic choices made by businesses. These findings
concur with Githige (2011) who found out that through education, people are empowered
with knowledge and skills that hastens their will to choose on usage of different strategies.
Agrodealers who belong to a group have a high probability of using promotions
strategy as opposed to their counterparts. A likely justification is that being a member of a
group places an agrodealer at an advantage through access to market information and
promotional avenues for selling their products. These findings corroborate those of Fischer
and Qaim (2012) and Owuor et al. (2006) who found out that information access is greatly
beneficial to group members as they are able to gain access to information, markets, credit
access, and new products in their industry.
Ownership structure positively and significantly influenced the choice of focus
strategy. The plausible justification is that expansion of ownership structures brings about

54
different players in the management hence varied decisions on trading such as concentrating
on one product line in order to satisfy each players’ interests. These results, however, are
inconsistent with those of Faizal et al. (2016) who found out that concentrated ownership
structures (expanded structures) prioritize differentiation strategies over other strategies
claiming that for effective achievement of a larger customer base, businesses need to vary
their products.
Agrodealers with many years of experience have a high probability on adopting the
use of focus and cost leadership strategies. The plausible reason is that due to accrued
knowledge and experience, they are knowledgeable of the business environment thus being
aware of which input sectors have been performing well in the industry. As such, they divert
all their resources to focus on that niche and further engage in cost effective measures,
providing discounts and charging low product prices to retain customers and remain
competitive. These findings are consistent with a study by Wabwile (2016) who found out
that farmers with many years of experience have knowledge of their industry hence it is hard
to make them change their view to take up a different strategy.
Having several branches increases the probability of using promotions strategies by
agrodealers as opposed to having one branch. As agrodealer businesses open more branches
and move into new markets, they have to continuously promote their businesses through
adverts and sales promotions in order to lure customers into their business. These findings
concur with those of Cheruon et al. (2015) who found out that, through various forms of
promotions strategies such as advertising, sales promotions and personal selling, businesses
are able to reach out to more customers.
Engagement in other businesses significantly influenced the usage of diversification
strategies implying that engaging in other businesses necessitates agrodealers to use
diversification strategies in order to sustain their competitiveness. As such, the strategies
provide a wide selling scope for agrodealer businesses which in turn helps cushion them
against off peak seasons and provides an extra income generation to them. Half of the stock
held by agrodealer agripreneurs constitutes of non-agricultural inputs which is a risk
mitigation measure and an income generation strategy during off-peak season (Odame &
Muange, 2011a).
Competitive rivalry had a negative association with diversification strategy. A likely
justification is that intense competition is occasionally accompanied by high trade risks,
hence agrodealers are left with minimal resources to fight for in the market such as customers
thus they wholly concentrate on ensuring they reach out to them. Thus, agrodealers prefer to
55
focus on evading risks associated with rivalry and pay less attention to diversification
strategies. These results are however, inconsistent with Achiro (2016) who found out that,
due to intense rivalry, businesses are actively engaging in diversification strategies to gain
access to new markets and heighten their competitiveness.
Product substitution increased the probability of choosing promotions strategies by
0.493 units. Substitutes create rivalry between products in the market, thus, agrodealers need
to invest highly on promotions strategies to ensure their stock sell otherwise they would only
sell one product line. This, therefore calls for adoption of various promotional strategies such
as advertising, offering price discounts and sales promotions in order to sell all their available
stock. However, Gümüş et al. (2016) argues that, product substitution comes in various
degrees and it does not mean that it will increase the likelihood of using promotions
strategies. The higher the degree of product substitution the higher the chance of utilizing
promotions strategy otherwise businesses rarely use it if the degree is low.
Agrodealers who embrace branding had a high chance of using cost leadership
strategies as opposed to those who do not. A likely justification for this is that branding
enables businesses to stand out amongst competitors. Visual branding such as logos, staff
uniformity and premise branding enables a business attract farmers (Soi, 2016) and once
customer acquisition is done, they can effectively adopt usage of cost leadership strategies by
providing them with the best prices for the quality of their products. Similar results were
established by Erdil et al. (2017) who found out that for Turkish brands, branding is
positively associated with low price sensitivity, customer satisfaction and profitability.
Buyer switching costs was found to have a positive association with usage of cost
leadership strategy. A likely justification for this is that customers are likely to switch to
input products that are less costly, quality and satisfy their needs hence agrodealers need to
ensure they effectively adopt the strategy in order to maintain their customer base. According
to Bhattacharya (2013), if a business wants to remain competitive and maintain its customer
base amidst high buyer switching costs, then it has to ensure it gains a cost leadership
position in the market. Studies by Bhattacharya (2013) and Chen (2016) concur with these
findings arguing that high buyer switching costs helps counterbalance high market focus
compelling businesses to lower their prices in order to remain competitive.
Smallscale agrodealers intending to use differentiation strategy have to aim at
reducing their operational costs as it was found to have a negative impact on the strategy.
High operational costs leave businesses with minimal resources to use on strategic adoption
as majority of the resources are diverted towards operational production. Therefore, costs
56
associated with the strategy such as branding, product packaging and new designs will be left
out as the businesses concentrate more on their operational efficiency. These findings are
consistent with Majukwa and Haddud (2016) who found out that alignment of operational
costs such as business expenses, pricing strategies and ensuring that market demands are
offered at low operational management costs can help cut down on cost usage.
4.4 Effects of Porter’s five forces and strategies on the market share of agrodealer
businesses in Nakuru East Sub-County
4.4.1 Diagnostic tests
Prior to estimation of the Tobit model, two diagnostic tests; multicollinearity and
heteroskedasticity tests. Multicollinearity between the independent variables was tested using
the variance inflation factor (VIF). According to Gujarati (2004), if the VIF is greater than 10
then there is presence of multicollinearity. All the independent variables had a VIF of less
than 10 with a mean of 1.98 hence the presence of multicollinearity was ruled out. To test for
the presence of heteroskedasticity among the variables, the Tobit multiplicative
heteroskedasticity test was used. The results indicated a high p-value of 1.000 hence the null
hypotheses for the variables was rejected indicating absence of heteroskedasticity. The
results were further subjected to a post estimation test using the marginal effect in order to
estimate the trivial change from each of the selected independent variables influencing
market share.
4.2.3 Factors influencing market share of agrodealer businesses
For appropriate policy review analysis, competitiveness was measured using the
market share metric. In the first step, average sales of individual businesses were calculated
by getting the average of peak and off-peak season sales for the year of 2019. Total industry
sales were then summed up from the average sales of the 110 agrodealer businesses in
Nakuru East Sub-County. Market share values fell between 0 and 100% hence making it a
limited dependent variable hence, Tobit model, a form of censored regression model was
applied. Study findings indicated that the business market share mean business market share
percentage was 0.91; the minimum market share value was 0.01 percent while the maximum
was 21.91 percent.
Competitive forces and strategies and selected agrodealer and business specific
characteristics were then regressed against market share of the businesses using the Tobit
model. Left censoring was done at 0 while right censoring was done at less than or equal to
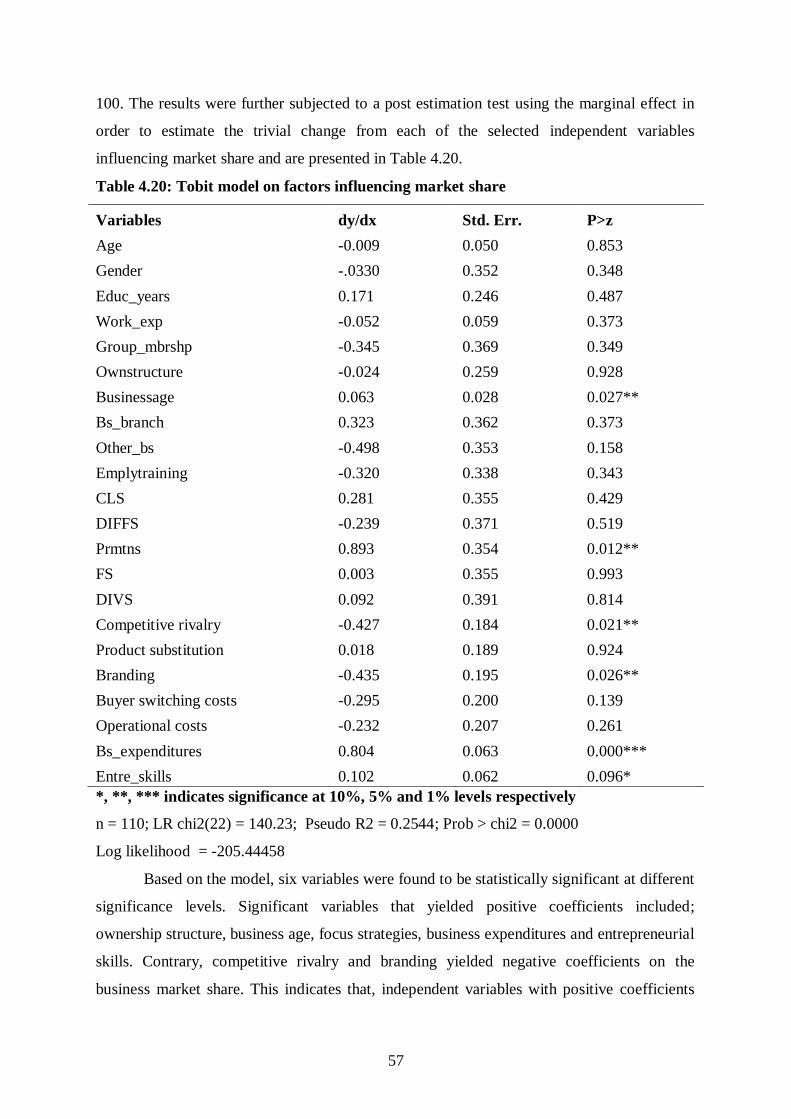
57
100. The results were further subjected to a post estimation test using the marginal effect in
order to estimate the trivial change from each of the selected independent variables
influencing market share and are presented in Table 4.20.
Table 4.20: Tobit model on factors influencing market share
Variables dy/dx Std. Err. P>z
Age -0.009 0.050 0.853
Gender -.0330 0.352 0.348
Educ_years 0.171 0.246 0.487
Work_exp -0.052 0.059 0.373
Group_mbrshp -0.345 0.369 0.349
Ownstructure -0.024 0.259 0.928
Businessage 0.063 0.028 0.027**
Bs_branch 0.323 0.362 0.373
Other_bs -0.498 0.353 0.158
Emplytraining -0.320 0.338 0.343
CLS 0.281 0.355 0.429
DIFFS -0.239 0.371 0.519
Prmtns 0.893 0.354 0.012**
FS 0.003 0.355 0.993
DIVS 0.092 0.391 0.814
Competitive rivalry -0.427 0.184 0.021**
Product substitution 0.018 0.189 0.924
Branding -0.435 0.195 0.026**
Buyer switching costs -0.295 0.200 0.139
Operational costs -0.232 0.207 0.261
Bs_expenditures 0.804 0.063 0.000***
Entre_skills 0.102 0.062 0.096*
*, **, *** indicates significance at 10%, 5% and 1% levels respectively
n = 110; LR chi2(22) = 140.23; Pseudo R2 = 0.2544; Prob > chi2 = 0.0000
Log likelihood = -205.44458
Based on the model, six variables were found to be statistically significant at different
significance levels. Significant variables that yielded positive coefficients included;
ownership structure, business age, focus strategies, business expenditures and entrepreneurial
skills. Contrary, competitive rivalry and branding yielded negative coefficients on the
business market share. This indicates that, independent variables with positive coefficients

58
improved market share while those with negative coefficients decreased market share of the
businesses.
Age of the business had a positive influence on market share implying that an
increase in business age by a unit increases their market share by one unit. Businesses that
have stayed long in the industry and are relatively more proactive to both new and old trends
in the industry and have managed to gain a larger customer base compared to young
businesses hence have a wider market scope. These findings are in line with Abuor (2014)
and Kotey et al. (2020) who found out that business age is a clear indicator of its status in the
market with those that have operated for many years having accumulated economies of scale
implying that younger firms had low market shares while older firms had a high market
share. However, Voulgaris et al. (2013) dismisses this by arguing that young businesses are
more aggressive in using modern promotional tools and technology to gain a larger market
share as opposed to older businesses.
The use of promotional strategies was found to have a positive association with
market share performance of businesses. The plausible reason is that promotions strategies
enable a business reach out to more customers, venture into new markets thus expanding
their operational base. Furthermore, through promotions, agrodealers are able to pass
information to their customers, stimulate product demand, stress on their product value which
will enable them maintain a stable and consistent markets sales which subsequently leads to
market share increase. These results conform to those of Adefulu (2015); Erdil et al. (2017)
and Kilonzo (2012) who found out that through promotions strategies such as branding, sales
promotions and personal selling, businesses are able to expand their market shares.
Competitive rivalry had a negative effect on market share. The likely justification for
this is that, as more and more businesses venture into the industry, existing firms feel the
pressure emanating from competition hence try to find ways to maintain their survival and
competitive edge. However, due to an upsurge in the businesses, the market has become
saturated necessitating them into forced product/ price discounts and sales offers inorder to
keep their stock moving. Additionaly, with increased rivalry, market share of existing
businesses has decreased drastically as they now have to divide the market amongst several
agrodealer businesses. The above findings are in line with those of Chesula and Kiriinya
(2018); Mburu (2015) and Mugo (2020) who found out that competitive rivalry greatly
affects performance of businesses hence they need to establish ways of overcoming it in
order to remain competitive. However, findings by Boafo et al. (2018) and Kulmia (2014)
contrast to the above as they established that intense rivalry had a positive association with

59
business market performance through creating value for their customers hence propelling
them to increase their market share.
Surprisingly, branding was found to be statistically significant at 1% and had a
negative association with market share. A likely justification for this is that, since the
agrodealer business is highly homogeneous, branding does not increase the performance of
businesses. Besides, agrodealers are in the same product line with similar price ranges and
therefore it is presumed that all the businesses appeal equally to customers. Spreading of
sales and profit margins across the industry only makes business achieve low performance in
the industry. Nonetheless, the study noted that most of the agrodealer businesses do not
engage in branding activities citing that they sell products from different manufacturers and
sectors. Interesting enough, most of these businesses premises are branded by their supplies
such as Baraka, MEA Fertilizers and Kenya Seed Company. Hence, it is not surprising that
walking through town, one easily identifies the businesses through their supplier brands. This
is however in contrast with findings of Erdil et al. (2017) and Kilonzo (2012) who
established that branding by businesses goes a long way in helping them increase their
market share and profitability levels.
Entrepreneurial skills if well-articulated enhances the competitiveness of the
businesses through improvement in market share. Through skills development such as
through formal education and on the job trainings, businesses are able to equip its personnel
with skills to specific business activities that enhance their competitiveness through
productivity. With the new trends in agricultural technology, agrodealers need to have high
level skilled personnel and improvement in their skills for them to maintain a competitive
edge in the market otherwise they will be phased out. These findings are consistent with
those of International Tarde Center (ITC), 2019); Onsomu et al. (2010) and Porter (1990)
who noted that skills generally contribute positively towards the competitive growth of
businesses both locally and internationally by incorporating them into their production
processes.
Business expenditure had a positive influence on business market share. Market share
improvement entails a whole lot of activities such as continuous marketing to reach out to a
wider range of customers. Increasing expenditures through promotional activities, research
and development, employee training and marketing activities targets a wider base of
customers. As such, the businesses are able to sell their products to new markets, retain and
acquire new customers thus increasing their market share relative to their rival. These results
concurs to findings by Konak (2015) who found out that increasing marketing, employee

60
training and research expenses enhance business competitiveness to a great extent. However,
Asogwa et al. (2012) and Kiaritha et al. (2014) found out that reduction in business
operational costs enables a business achieve maximum productivity as opposed to increasing
its costs.

61
CHAPTER FIVE
CONCLUSIONS AND RECOMMENDATIONS
5.1 Conclusions
This study aimed at analysing the influence of Porter’s five forces on the
competitiveness of agrodealer businesses in Nakuru East Sub-County. As such, the study sort
to assess the main competitive forces in the agrodealer industry, determine the influence of
Porter’s five forces on choice of competitive strategies and to determine the effects of
Porter’s five forces and strategies on the market share performance of agrodealer businesses.
The study further sort to establish the type of strategy that is commonly used by agrodealer
businesses.
In conclusion therefore, business environments keep chsnging with time. With each
passing day, busineses interact with other businesses in the same market, buyers, suppliers
and government policy makers. Arguably, Porter’s five forces is till important in the day to
day running of business ebnterpriese. It cannot be ruled out but rather it should be
incorporatedinto strategic management of businesses when analysing their competitive
environment. From the study findings, agrodealers noted five important factors from the
various indicators of Porter’s five forces as a force to reckon with in the market. These were;
competitive rivalry, product substitution, branding, buyer switching costs and operational
costs.
The study further sought to determine the influence of Porter’s five forces on
utilization of competitive strategies by agrodealer businesses. Due to the competitive nature
of the agrodealer business, agrodealers need to devise startegies that will make them
competitive and maintain their survival. However, knowledge of competitive forces is
paramount as this will enable agrodelaers make informed decisions on the type of strategies
to use. Study findings indicated that for each competitive strategy adopted by the businesses,
the choice was informed by different factors. Cost leadership strategies were considered
important in making the businesses maintain their customers as well as for new businesses to
acquire customers. This was affected by work experience in the industry, branding and buyer
switching costs. For differentiation strategy, operational costs was found to have a negative
correlation with it. Engagement in other businesses and competitive rivalry were found to be
statistically significant with diversification strategy. Finally, education, group membership,
business branches and product substitution were found to be statistically significant with
choice of promotions strategy. Utilization of focus strategy was found to be while
agrodealer’s age, work experience and ownership structure were found to be significant with
62
choice of focus strategy.
Study findings further indicated that agrodealer businesses need to take into
consideration various factors when trying to remain competitive. Gaining a competitive edge
and a larger market share calls for the businesses to ensure maximum utilization of the
resources that they hold. As much as business expenditure had a positive influence on market
share and a policy for strengthening agro-dealer businesses’ financial systems is an important
measure to promote adoption of new technology that will help cut on their operational costs
while at the same time increase their revenues. The constraining factors in improvement of
performance through market share were found to be competitive rivalry and branding.
Competitive rivalry had a negative correlation with market share in that with mny
businessesin the market, the share margins have to be divided down among the businesses.
This results to lower market share margins for the businesses as more and more businesses
enter the market. The negative effect of branding is justified by the fact that the industry is
highly homogeneous, hence it is presumed that, all businesses equally appeal to buyers.
5.2 Recommendations
Following the rise in demand for agricultural inputs, agrodealer businesses are an
important link between farmers and input manufacturers. As part of their increasing
importance, the study recommends that both the national and county governments to create
an enabling environment by devising strategies that will help curb counterfeit inputs from
accessing the market and selling input subsidies through them in order to minimize
competition.
Efforts geared towards improvement of business competitiveness through effective
adoption of competitive strategies should be reinforced. Encouraging agrodealers to join
groups, engage in other businesses and stocking of different brands will enable them choose
on the right strategy. This study recommends that the businesses should incorporate usage of
more than one strategy in order to improve their efficiency. As such, proper policies are
needed to educate agrodealers on benefits of utilization of competitive strategies.
There is also a need for agrodealer businesses to increase the use of cost leadership
strategies since it was found to have an impact on their market share. Even though the
businesses commonly used differentiation strategy, cost leadership strategies were better due
to their positive impact on market share.

63
5.3 Suggestions for further studies
While this study mainly focused on determining the influence of Porter’s five forces
on competitiveness of agrodealer businesses, other studies can be carried out on the effect of
the three new forces; digitalization, globalization and deregulation on competitiveness
following the increased improvement in technology, communication and globalization. This
will help to gain more knowledge on how competition affects the businesses’ performance not
only locally but also globally. There is also need to undertake further studies on the
agrodealer industry in the wake of new improved genetically modified seeds, new crop
diseases and growing rate of the knowledgeable customer.
This study used multivariate probit model to measure the influence of Porter’s five
forces on choice of competitive strategies among agrodealer businesses. Given the
importance of the forces in influencing competition, an extension of this study can be
conducted using structural equation modelling to measure the visual effect of each of the
forces on competitive strategies by the businesses. Due to study constraints, the study did not
capture profitability of the agrodealer businesses yet it is an important competitive indicator.
Therefore, further studies can be done in the area focusing on how competition affects
competitiveness of the businesses with profitability being a measure of competitiveness.

64
REFERENCES
Abuor, S. N. O. (2014). Application of modified Porters’ five forces model in assessing
attractiveness of insurance industry in Kenya. [MBA Thesis, University of Nairobi,
Kenya]. http://erepository.uonbi.ac.ke/handle/11295/95430
Achiro, O. D. (2016). Diversification and competition among commercial banks in Kenya.
[MBA Thesis, University of Nairobi, Kenya].
Adefulu, A. D. (2015). Promotional strategy impacts on organizational market share and
profitability. Acta Universitatis Danubius. Œconomica, 11(6), 20-33.
https://www.ceeol.com/search/article-detail?id=572621
Ahsan, D. A. (2011). Farmers’ motivations, risk perceptions and risk management strategies
in a developing economy: Bangladesh experience. Journal of Risk Research, 14(3),
325-349. https://doi.org/10.1080/13669877.2010.541558
Akintokunbo, O. O. (2018). Market focus strategy and organizational performance of
telecommunication companies in Port Harcourt. International Journal of Innovative
Research and Advanced Studies, 5(3), 258-263. http://www.ijiras.com/2018/Vol_5-
Issue_3/paper_48.pdf
Arasa, R., & Gathinji, L. (2014). The relationship between competitive strategies and firm
performance: A case of mobile telecommunication companies in Kenya. International
Journal of Economics, Commerce and Management, 2(9), 1–15.
http://ir.mksu.ac.ke/handle/123456780/4669
Asogwa, B. C., Umeh, J. C. & Penda, S. T. (2012). Technical efficiency analysis of small-
holder farmers in rural and peri-urban areas of Nigeria. Journal of Human Ecology,
37(1), 57-66. https://doi.org/10.1080/09709274.2012.11906449
Barney, J. (1991). Firm Resources and sustained competitive advantage. Journal of
Management, 17(1), 99-120. https://doi.org/10.1177/014920639101700108
Bartlett, M. S. (1954). A note on the multiplying factors for various Χ2 approximations.
Journal of the Royal Statistical Society: Series B (Methodological), 16(2), 296-298.
https://doi.org/10.1111/j.2517-6161.1954.tb00174.x
Bayesian Consulting Group. (2016). Agrodealer Baseline Study Final Report prepared by
Bayesian Consulting Group (n.d.). Retrieved October 28, 2021, from
https://www.stak.or.ke/wp-content/uploads/2017/02/Agrodealer-Baseline-Study-Final-
Report.pdf.

65
Bhattacharya, A. (2013). Switching costs and sustained competitive advantage. International
Journal of Business and Management Invention, 2(9), 101–111.
http://www.ijbmi.org/papers/Vol(2)9/Version-1/N029101010111.pdf
Boafo, N. D., Kraa, J. J., & Webu, C. G. (2018). Porter’s five forces impact on the
performance of companies in the banking industry in Ghana. International Journal of
Economics, Commerce and Management, VI(8), 14-28. http://ijecm.co.uk/volume-vi-
issue-8/
Cappellari, L., & Jenkins, S. P. (2003). Multivariate probit regression using simulated
maximum likelihood. The Stata Journal, 3(3), 278-294.
https://doi.org/10.1177/1536867X0300300305
Chege, M. P. & Bula, O. H. (2015). The effect of market forces on performance of dairy
industries in Kenya: a case of Kenya Cooperative Creameries. European Journal of
Business and Management, 7 (35), 196-202.
https://www.iiste.org/Journals/index.php/EJBM/article/view/27511
Chen, J. (2016). How do switching costs affect market concentration and prices in network
industries? The Journal of Industrial Economics, 64(2), 226-254.
https://doi.org/10.1111/joie.12102
Cheruon, R. C., Rongo, K., & Richard, N. (2015). Marketing Strategies for competitive
Advantage: A Survey of Selected Public and Private University in Kenya. European
Journal of Business and Management, 7 (15), 133-138.
https://www.iiste.org/Journals/index.php/EJBM/article/view/22882/23136
Chesula, O. W., & Kiriinya, S. N. (2018). Competitiveness in the telecommunication sector
in Kenya using Porters five forces model. International Journal of Research in
Finance and Marketing (IJRFM), 8(7), 1-10.
https://www.researchgate.net/publication/327350357
Chikán, A. (2008). National and firm competitiveness: A general research model.
Competitiveness Review: An International Business Journal incorporating Journal of
Global Competitiveness, 18(1/2), 20-28. https://doi.org/10.1108/10595420810874583
Chirani, E., & Effatdoost, M. (2013). Diversification strategy: A way toward the competitive
advantage. Arabian Journal of Business and Management Review, 3(1), 23-27.
https://www.arabianjbmr.com/pdfs/KD_VOL_3_1/3.pdf
Cooper, L. G., & Nakanishi, M. (1989). Market-share analysis: Evaluating competitive
marketing effectiveness (Vol. 1). Springer Science & Business Media.
https://www.researchgate.net/publication/259583948

66
County Government of Nakuru. (2018). Nakuru East Sub-County: 2018 Business
register. County Government of Nakuru, Kenya.
Dälken, F. (2014). Are porter’s five competitive forces still applicable? A critical examination
concerning the relevance for today’s business. [MSc Thesis, University of Twente,
Netherlands].
Deniz, M., Seçkin, Ş. N. & Cüreoğlu, M. (2013). Micro-economic competitiveness: a
research on manufacturing firms operating in TRB1 region. Procedia-Social and
Behavioral Sciences, 75(2013), 465-472. https://doi.org/10.1016/j.sbspro.2013.04.050
Dobbs, M. E. (2014). Guidelines for applying Porter's five forces framework: a set of
industry analysis templates. Competitiveness Review, 24(1), 32-45.
Dulčić, Ž., Gnjidić, V., & Alfirević, N. (2012). From five competitive forces to five
collaborative forces: Revised view on industry structure-firm interrelationship.
Procedia-Social and Behavioral Sciences, 58(2012), 1077-1084. https://doi.org/10.
1016/j.sbspro.2012.09.1088
Economic Commission of Africa. (2012). Agricultural Input Business Development in
Africa: Opportunities, Issues and Challenges. Retrieved July 6, 2018, from
http://www.unEconomic-Commission-of-Africa.org/sa/publications/sro-sa-agri-
inputs-business-opportunities.pdf
Erdil, T., Bakir, N., & Ayar, B. (2017). The impact of market and brand orientation on
performance: An empirical study. The European Proceedings of Social and
Behavioral Sciences, 34(5), 50-63. https://doi.org/10.15405/epsbs.2017.12.02.5
Eskandari, M. J., Miri, M., Gholami, S., & Nia, H. R. S. (2015). Factors affecting the
competitiveness of the food industry by using porter's five forces model case study in
Hamadan province, Iran. Journal of Asian Scientific Research, 5(4), 185-197.
https://ideas.repec.org/a/asi/joasrj/2015p185-197.html
Faizal, F., Qosasi, A., Sumarlin, A. W., Permana, E., Prakosa, G. H., Indriana, I., &
Aguzman, G. (2016). Business strategy formulation by shareholders and company
management using The Analytical Network Process (ANP). Binus Business Review,
7(3), 297-305. https://doi.org/10.21512/bbr.v7i3.1494
Field, A. (2000). Statistics using SPSS for Windows. Sage Publication.
Fischer, E., & Qaim, M. (2012). Linking smallholders to markets: Determinants and impacts
of farmer collective action in Kenya. World Development, 40(6), 1255-1268.
https://doi.org/10.1016/j.worlddev.2011.11.018
67
Gebreegziabher, K., & Tadesse, T. (2014). Risk perception and management in smallholder
dairy farming in Tigray, Northern Ethiopia. Journal of Risk Research, 17(3), 367-381.
https://doi.org/10.1080/13669877.2013.815648
Gielnik, M. M., Zacher, H., & Schmitt, A. (2017). How small business managers’ age and
focus on opportunities affect business growth: A mediated moderation growth model.
Journal of Small Business Management, 55(3), 460-483.
https://doi.org/doi:10.1111/jsbm.12253
Githige, R. W. (2011). Factors that influence strategic choices adopted by community based
organizations competing for donor funding in Nairobi, Kenya. [MBA Thesis,
Univesity of Nairobi, Kenya].
Government of Kenya. (2004). Strategy for Revitalizing Agriculture, 2004-2014.
Government Printer, Nairobi.
Government of Kenya. (2012). National Agribusiness Strategy: Making agribusiness sector a
competitive driver of growth. Government Printer, Nairobi.
Greene, W. H. (2003). Econometric analysis (5th ed.). Prentice Hall.
Gujarati, D. M. (2004). Basic Econometrics (4th ed.). Mc-Graw Hill..
Gümüş, M., Kaminsky, P., & Mathur, S. (2016). The impact of product substitution and retail
capacity on the timing and depth of price promotions: Theory and evidence.
International Journal of Production Research, 54(7), 2108-2135.
https://doi.org/10.1080/00207543.2015.1108536
Hair, J.F., Black, W.C., Babin, B. J. & Anderson, R.E. (2010). Multivariate data analysis
(7th ed.). Prentice Hall.
Hubbard, G., Rice, J. & Beamish, P. (2011). Strategic Management: Thinking, Analysis and
Action. Pearson Education.
Indiatsy, C. M., Mucheru, S. M., Mandere, E. N., Bichanga, J. M., & Gongera, E. G. (2014).
The application of Porter’s five forces model on organization performance: A case of
cooperative bank of Kenya Ltd. European Journal of Business and Management,
6(16), 75-85. https://www.iiste.org/Journals/index.php/EJBM/article/view/13364
International trade Center. (2019). Promoting SME Competitiveness in Kenya; Targeted
solutions for inclusive growth. ITC
Johnson, R. A., & Wichern, D. W. (2014). Applied multivariate statistical analysis (Vol. 6).
Pearson.
Ketels, C. (2016). Review of competitiveness frameworks. An analysis conducted for the
Irish National Competitiveness Council. Available online:
68
https://www.researchgate.net/publication/303522738_Review_of_Competitiveness_F
rameworks
Keter, W. C. (2012). An application of Porter’s theory of the competitive advantage of
nations in determination of the competitiveness of the Kenyan tea export industry.
[MBA Thesis, University of Nairobi, Kenya].
Kiaritha, H., Gekara, M., & Mung’atu, J. (2014). Effect of operating costs on the financial
performance of SACCOs in the banking sector in Kenya. Prime Journal of Business
Administration and Management, 4(2), 1359-1363.
https://www.researchgate.net/publication/311395582
Kiel, J., Smith, R., & Ubbels, B. (2014). The impact of transport investments on
competitiveness. Transportation Research Procedia, 1(1), 77-88.
https://doi.org/10.1016/j.trpro.2014.07.009
Kilonzo, B. M. (2016). Analysis of the structural attractiveness of the hotel industry in Kenya
using Porter’s modified model. [MBA Thesis, University of Nairobi, Kenya].
Kilonzo, N. S. (2012). Brand positioning strategies and competitive advantage of the five
star hotels in Nairobi. [MBA Thesis, University of Nairobi, Kenya].
KNBS. (2013). Nakuru County, Kenya: First county integrated development plan,
Kenya. KNBS.
KNBS. (2015). County Statistical Abstract: Nakuru County, Kenya. KNBS.
Konak, F. (2015). The effects of marketing expenses on firm performance: empirical
evidence from the BIST textile, leather index. Journal of Economics, Business and
Management, 3(11), 1068-1071. https://doi.org/10.7763/JOEBM.2015.V3.335.
Korir, D. K. (2016). National and county licensing requirements. A presentation made at the
1st Mazao Forum on Agrodealer and Crop Seed-Vital Links for Food Security in
Kenya on 3rd March 2016 in Kisumu, Kenya.
Kotey, R. A., Kusi, B. & Akomatey, R. (2020). Ownership structure and profitability of listed
firms in an emerging market. Accounting, 6(1), 1-16.
http://dx.doi.org/10.5267/j.ac.2019.6.001
Kulmia, A. M. (2014). A study on competitiveness in the supermarket industry in Kenya using
Porter’s five forces. [Doctoral Thesis, United States International University-Africa].
Kung’u, A. M. U. (2017). Effects of selected Porter’s five forces on competitive advantage in
steel industry: a case of flat-steel segment. [Doctoral Thesis, United States
International University-Africa].

69
Landau, S., & Everitt, B. S. (2003). A handbook of statistical analyses using SPSS. Chapman
and Hall/CRC.
Madhani, P. M. (2010). Resource based view (RBV) of competitive advantage: an overview.
Retrieved September 21, 2018 from https://www.researchgate.net/publication/450725
18.
Maikah, S. J. (2015). Competitive strategies and organizational performance at East African
Portland cement company. [MBA Thesis, University of Nairobi, Kenya].
Majukwa, D., & Haddud, A. (2016). Operations management impact on achieving strategic
fit: A case from the retail sector in Zimbabwe. Cogent Business & Management, 3(1),
1–16. https://doi.org/10.1080/23311975.2016.1189478
Malackanicova, B. (2016). Increasing the competitiveness and profitability of a small and
medium-sized enterprise. [Hame University of Applied Siences].
https://www.theseus.fi/handle/10024/117215
Mburu E. N (2015). Porter’s Five Forces Influence on Competitive Advantage in the Kenyan
Beverage Industry: A Case of Large Multinationals. [Doctoral Thesis, United States
International University-Africa].
McQuarrie, E. F. (2014). Customer Visits: Building a Better Market Focus: Building a Better
Market Focus (3rd Ed.). Routledge.
Misiko, A. A. (2012). An investigation of factor2 v s influencing performance of agro-input
enterprises in Kakamega County, Kenya. [MA Thesis, University of Nairobi, Kenya].
Mugenda, O. M., & Mugenda, A. G. (2013). Research Methods: Qualitative and
Quantitative approaches. African Centre for Technology Studies.
Mugo, P. (2020). Porter’s Five Forces Influence on Competitive Advantage in
Telecommunication Industry in Kenya. European Journal of Business and Strategic
Management, 5(2), 30-49.
https://www.iprjb.org/journals/index.php/EJBSM/article/view/1140/1255
Mulaik, S. A. (2009). Foundations of Factor Analysis. Chapman and Hall/CRC.
Mumbua, S. M. (2013). Competitive strategies applied by small and medium-sized firms in
Mombasa County, Kenya. [Doctoral Thesis, University of Nairobi, Kenya].
Mwangi, E. W., & Ombui, K. (2013). Effects of competitive strategies on the performance of
mission hospitals in Kenya: A case of Kijabe Mission Hospital. International Journal
of Science and Research (IJSR), 2(11), 14-19.
https://www.ijsr.net/archive/v2i11/MjYxMDEzMDE=.pdf

70
Nazarpoori, A. H., Hakkak, M., & Mohammadi, M. (2014). Analysis and identification of
competitive Positions of Companies Operating in Iranian Battery Industry using
Hierarchical analysis. Journal of Asian Scientific Research, 4(12), 741-756.
http://www.aessweb.com/download.php?id=2965
Odame, H. & Muange, E. (2011b). Agrodealers and the political economy of
agricultural biotechnology policy in Kenya. Working Paper 033, Future Agricultures
Consortium. https://www.researchgate.net/publication/233980959
Odame, H., & Muange, E. (2011a). Can agro-dealer deliver the green revolution in Kenya?
Ids Bulletin, 42(4), 78-89. https://doi.org/10.1111/j.1759-5436.2011.00238.x
Odame-Koranteng, J. (2014). An analysis of the office property market in Airport City using
Porter's five forces framework. [Doctoral Thesis, Ashesi University College, Ghana].
Okello, B., Paruzzolo, S., Mehra, R., Shetty, A., & Weiss, E. (2012). Agrodealerships in
Western Kenya: How Promising for Agricultural Development and Women
Farmers?. Assessment report for the International Center for Research on Women,
Washington, DC.
Onsomu, E. N., Ngware, M. W., & Manda, D. K. (2010). The impact of skills development
on competitiveness: empirical evidence from a cross-country analysis. Education
Policy Analysis Archives, 18(7), 1-18. https://doi.org/10.14507/epaa.v18n7.2010
Owuor, G., Mukoya-Wangia, S. M., Onyuma, S. O., Mshenga, P. M., & Gamba, P. (2006).
Self-help groups as a social capital for agricultural productivity: The case of
smallholder maize farmers in Siaya, Kenya. Egerton Journal of Humanities, Social
Sciences and Education, 6(2-3), 159-176.
https://www.africabib.org/rec.php?RID=Q00045804
Pearce, J. A., & Robinson, R. B. (2010). Strategic management: Formulation,
implementation (10th ed.). Irwin/ McGraw-Hill.
Porter, M. E. (1980). Competitive strategy: Techniques for analyzing industries and
competitors. The Free Press.
Porter, M. E. (1985). Competitive advantage: Creating and sustaining superior performance.
The Free Press.
Porter, M. E. (1990). Competitive advantage of nations. The Free Press.
Porter, M. E. (2008). The five competitive forces that shape strategy. Harvard Business
Review, 86(1), 79–93. https://hbr.org/2008/01/the-five-competitive-forces-that-shape-
strategy
71
Porter, M. E., Ketels, C., & Delgado, M. (2007). The microeconomic foundations of
prosperity: findings from the business competitiveness index. The global
competitiveness report, 2008, 51-81.
https://www.researchgate.net/publication/237254147
Sachitra, K. M. V. (2017). Review of competitive advantage measurements: reference on
agribusiness sector. Journal of Scientific Research & Reports, 12(6), 1-11.
https://doi.org/10.9734/JSRR/2016/30850
Saleem, M. A. (2017). The impact of socio-economic factors on small business success.
Malaysian Journal of Society and Space, 8(1), 24-29.
https://ejournal.ukm.my/gmjss/article/view/18161/5696
Shao, S. H. (2015). Competitive strategies and Porter's five forces model by the insurance
companies in Kenya. [MSc Thesis, University of Nairobi, Kenya].
Sheahan, M., Ariga, J., & Jayne, T. S. (2016). Modeling the effects of input market reforms
on fertiliser demand and maize production: A case study from Kenya. Journal of
Agricultural Economics, 67(2), 420-447. https://doi.org/10.1111/1477-9552.12150
Sifuna, I. N. (2014). Effect of competitive strategies on performance of public universities in
Kenya. [MBA Thesis, Kenyatta University, Kenya].
Soi, R. (2016, February 16). Poor branding of agro-vet shops a big turn-off to farmers.
Saturday Nation, 28. https://nation.africa/kenya/business/seeds-of-gold/poor-
branding-of-agro-vet-shops-a-big-turn-off-to-farmers-1169658
Tucker, M. & Miles, G. (2004). Financial performance of microfinance institutions: a
comparison to performance of regional commercial banks by geographic
regions. Journal of Microfinance/ESR Review, 6(1), 41-54.
Voulgaris, F., Papadogonas, P., & Lemonakis, C. (2013). Drivers of competitiveness in the
manufacturing industry: The case of technology sectors in Greece. Journal of
Economics and Development Studies, 1(3), 32-40.
http://www.jedsnet.com/journals/jeds/Vol_1_No_3_December_2013/4.pdf
Wabwile, V. K. (2016). Effect of improved sweet potato varieties on household food security
in Bungoma County, Kenya. [MSc Thesis, Egerton University, Kenya].
https://doi.org/10.22004/ag.econ.243474
Waema, M. (2013). The effects of competitive strategies on performance of dairy firms in
Kenya. Doctoral Thesis, Kenyatta University, Kenya.
Wan, W. P., Hoskisson, R. E., Short, J. C., & Yiu, D. W. (2011). Resource-based theory and
corporate diversification: Accomplishments and opportunities. Journal of

72
Management, 37(5), 1335-1368. https://doi.org/10.1177/0149206310391804
Wernerfelt, B. (1984). A resource based view of the firm. Strategic Management
Journal, 5(2), 171-180. https://doi.org/10.1002/smj.4250050207
Wooldridge, J. M. (2004). Introductory econometrics: A modern approach (5th ed.). Mason.
World Bank. (2013). Growing Africa: Unlocking the Potential of Agribusiness. The World
Bank.

73
APPENDICES
Appendix i: NACOSTI research permit

74
Appendix ii: Questionnaire
My name is Eileen Inyanji, a student at Egerton University currently pursuing a Master of
Science degree in Agribusiness Management at Egerton University. This questionnaire is
developed and issued to you with the aim of collecting information on “The Influence of
Porter’s Five Forces on Competitiveness of Agrodealers Businesses in Nakuru East Sub-
County, Kenya”. The information provided will assist in the formulation of policies that will
contribute towards improving business competitiveness for agrodealers through identification
of the main competitive forces in the industry. Your voluntary participation in this survey
will be appreciated and all the information you provide will be secure, confidential and will
only be used for academic purposes.
Questionnaire
No.
Enumerator’s
name
Date.
Respondents
name
Phone no.
Business
name
Business
contacts.
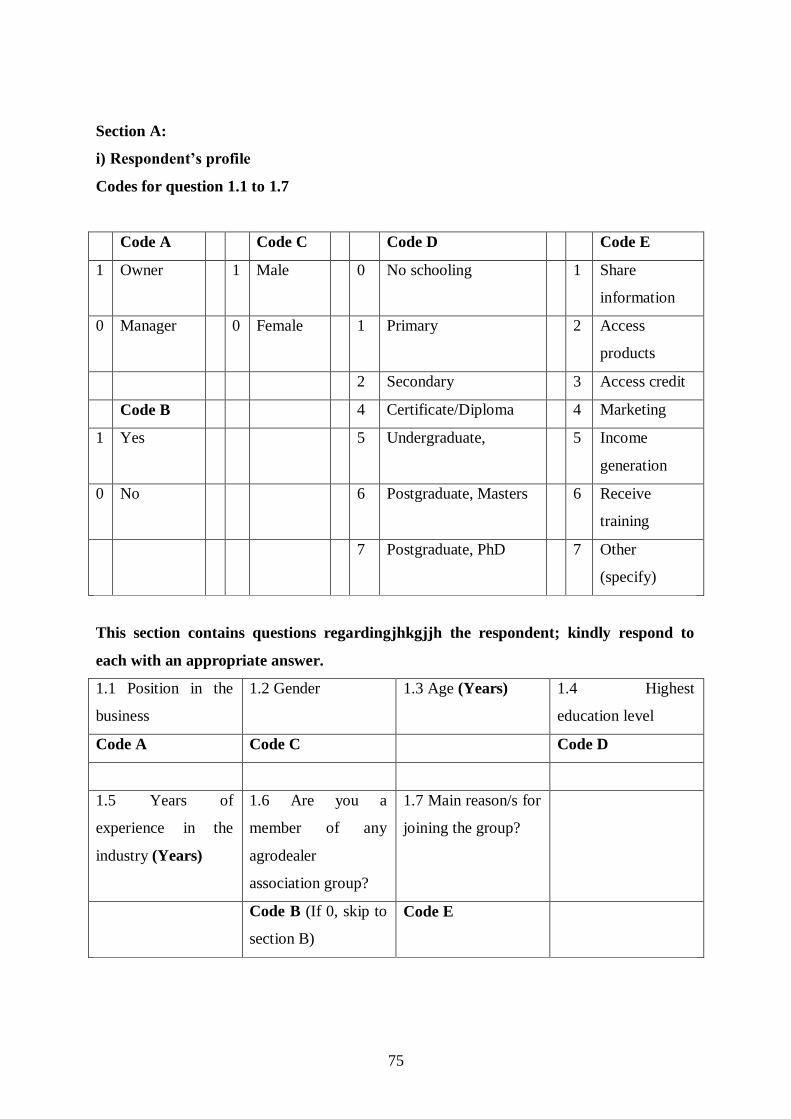
75
Section A:
i) Respondent’s profile
Codes for question 1.1 to 1.7
Code A Code C Code D Code E
1 Owner 1 Male 0 No schooling 1 Share
information
0 Manager 0 Female 1 Primary 2 Access
products
2 Secondary 3 Access credit
Code B 4 Certificate/Diploma 4 Marketing
1 Yes 5 Undergraduate, 5 Income
generation
0 No 6 Postgraduate, Masters 6 Receive
training
7 Postgraduate, PhD 7 Other
(specify)
This section contains questions regardingjhkgjjh the respondent; kindly respond to
each with an appropriate answer.
1.1 Position in the
business
1.2 Gender 1.3 Age (Years) 1.4 Highest
education level
Code A Code C Code D
1.5 Years of
experience in the
industry (Years)
1.6 Are you a
member of any
agrodealer
association group?
1.7 Main reason/s for
joining the group?
Code B (If 0, skip to
section B)
Code E

76
ii) Business description
Codes for questions 1.8 to 1.17
Code F Code G Code H
1 Sole proprietorship 1 Survival 1. Fertilizers
2 Partnership 2 Income generation 2. Crop seeds
3 Company 3 Customer demand 3. Animal chemicals
4 Joint venture 4 Risk coping strategy 4. Crop chemicals
5 Cooperative 5 Other (specify) 5 Animal feeds
6 Veterinary
products
This section contains items regarding information of your business. Please respond with
an appropriate answer.
1.8 What is the ownership
structure of the business?
1.9 How many years has the
business been in operation?
(Years)
1.10 Number of branches
Code F
1.11 Core business activity 1.12 Other businesses in the
same premise other than the
agrodealer business?
1.13 Which other business
do you engage in? State
Code H Code B (If 0, skip to 2.9)
1.14 Main reason for carrying
out other businesses
1.15 Do you usually train your
employees?
1.16 Type of training
mode used. State
Code G Code B (If 0, skip to next
section)

77
Section B: Porter’s five forces and competitive strategies
Codes for Question 2.1 to 2.9
Code J Code K Code L Code P
1 Strongly disagree 1 Not at all 1 Lower than
competitors
1 Marketing
2 Disagree 2 Less extent 2 Equal to competitors 2 Customer relations
3 Neutral 3 Moderate extent 3 Higher than
competitors
3 Record keeping
4 Agree 4 Large extent 4 Financial
5 Strongly agree 5 Very large extent Code O 5 ICT
1 Crop farmers 6 Technical
Code M Code N 2 Livestock farmers 7 Communication
1 Different sizes to cater for all
customers
1 Advertisements 3 Both 8 Managerial
2 Standard pack sizes 2 Sales promotion
3 As per the buyer’s request 3 Direct sales
4 Public relations

78
This section seeks your response to competitive forces and strategies; please respond to
them with an appropriate answer.
a) Porter’s five forces
Statement
Code
J
2.1 Bargaining power
of buyers
My customers are well-informed
It is difficult for my buyers to switch from my services
to those of my rivals
I negotiate product prices with my customers
My customers are price sensitive
Buyer concentration in the market is low
If substitute products are sold at a better price, buyers
easily shift towards it
My products are an important input to my customers’
activities
My buyers purchase a large volume of my products
2.2 Bargaining power
of suppliers
There are numerous suppliers in the market
At times my suppliers sell farm inputs directly to my
customers
I am well-informed about my suppliers’ services and
market
I negotiate product prices with my suppliers
Suppliers’ products are highly differentiated
Switching costs from one supplier to another is high
I buy a large volume of my suppliers’ products
There are numerous suppliers in the market
At times my suppliers sell farm inputs directly to my
customers
2.3 Threat of Other than the products I offer, there are more
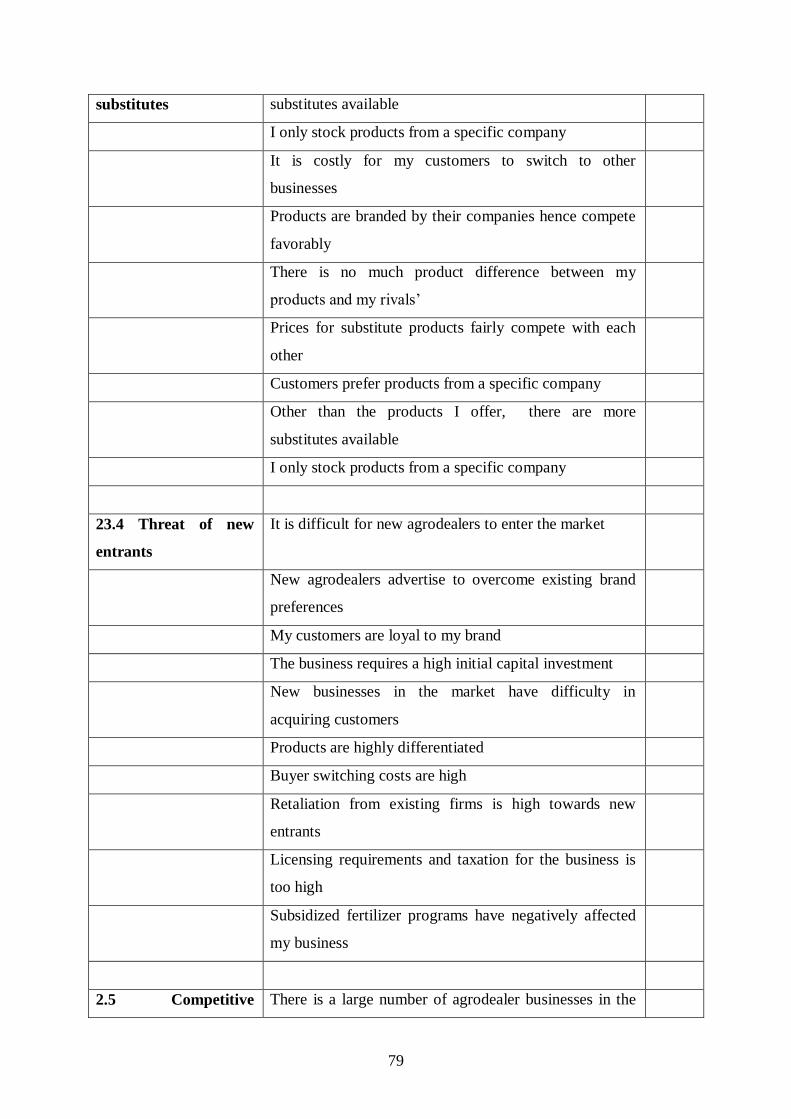
79
substitutes substitutes available
I only stock products from a specific company
It is costly for my customers to switch to other
businesses
Products are branded by their companies hence compete
favorably
There is no much product difference between my
products and my rivals’
Prices for substitute products fairly compete with each
other
Customers prefer products from a specific company
Other than the products I offer, there are more
substitutes available
I only stock products from a specific company
23.4 Threat of new
entrants
It is difficult for new agrodealers to enter the market
New agrodealers advertise to overcome existing brand
preferences
My customers are loyal to my brand
The business requires a high initial capital investment
New businesses in the market have difficulty in
acquiring customers
Products are highly differentiated
Buyer switching costs are high
Retaliation from existing firms is high towards new
entrants
Licensing requirements and taxation for the business is
too high
Subsidized fertilizer programs have negatively affected
my business
2.5 Competitive There is a large number of agrodealer businesses in the
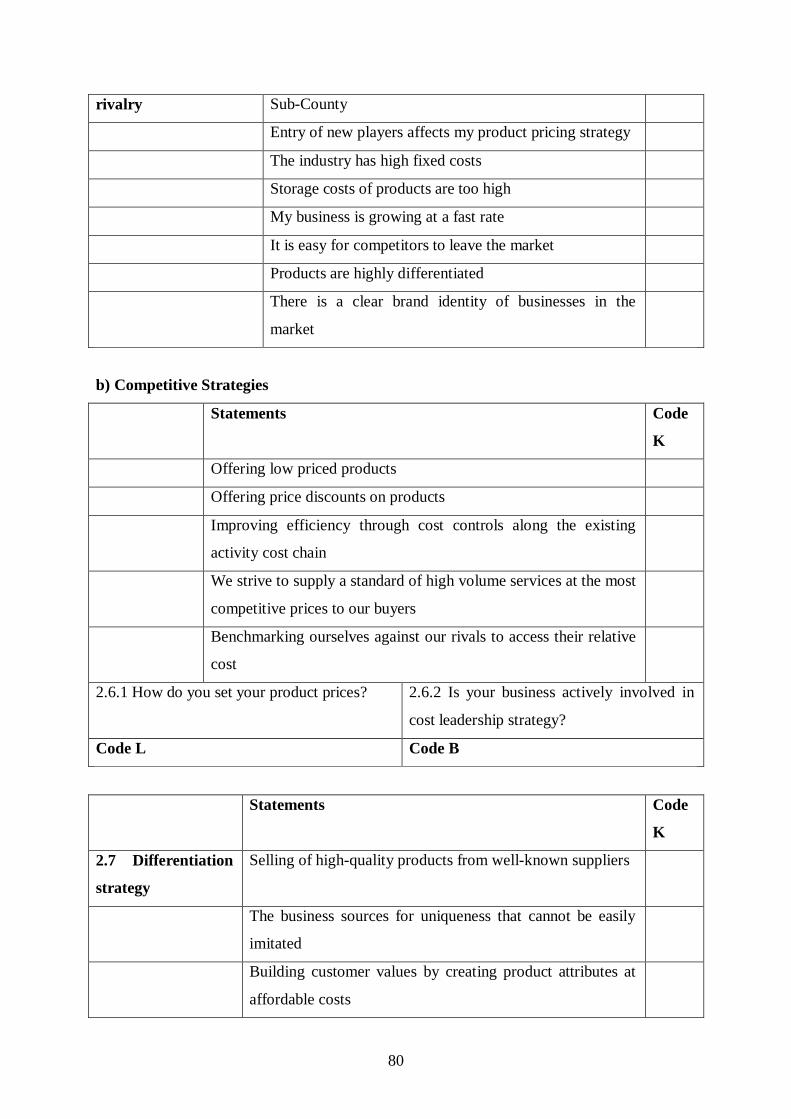
80
rivalry Sub-County
Entry of new players affects my product pricing strategy
The industry has high fixed costs
Storage costs of products are too high
My business is growing at a fast rate
It is easy for competitors to leave the market
Products are highly differentiated
There is a clear brand identity of businesses in the
market
b) Competitive Strategies
Statements Code
K
Offering low priced products
Offering price discounts on products
Improving efficiency through cost controls along the existing
activity cost chain
We strive to supply a standard of high volume services at the most
competitive prices to our buyers
Benchmarking ourselves against our rivals to access their relative
cost
2.6.1 How do you set your product prices? 2.6.2 Is your business actively involved in
cost leadership strategy?
Code L Code B
Statements Code
K
2.7 Differentiation
strategy
Selling of high-quality products from well-known suppliers
The business sources for uniqueness that cannot be easily
imitated
Building customer values by creating product attributes at
affordable costs

81
The business uses technology to remain on the cutting edge
of innovation
Offering training of product use and after-sale support to
customers
The business offers unique products for various buyer
groups
2.7.1 Product
packaging by
business
2.7.2 Is your business actively involved in differentiation strategy?
Code M Code B
Statements Code
K
2.8 Promotions
strategy
Direct selling to customers through messages
Personal selling to customers
Adverstising of the business through flyers, branding, social
media platforms etc
Engagement in public realtions through giving back to the
society
2.8.1 Is your business actively involved in promotions strategy? Code
B
Statements Code
K
2.9 Focus strategy We focus on selling products to a particular market niche
We devote resources to maintain market leadership in this
niche
We innovate products/services for this market niche
We focus on low-cost strategy in our markets to avoid rivalry
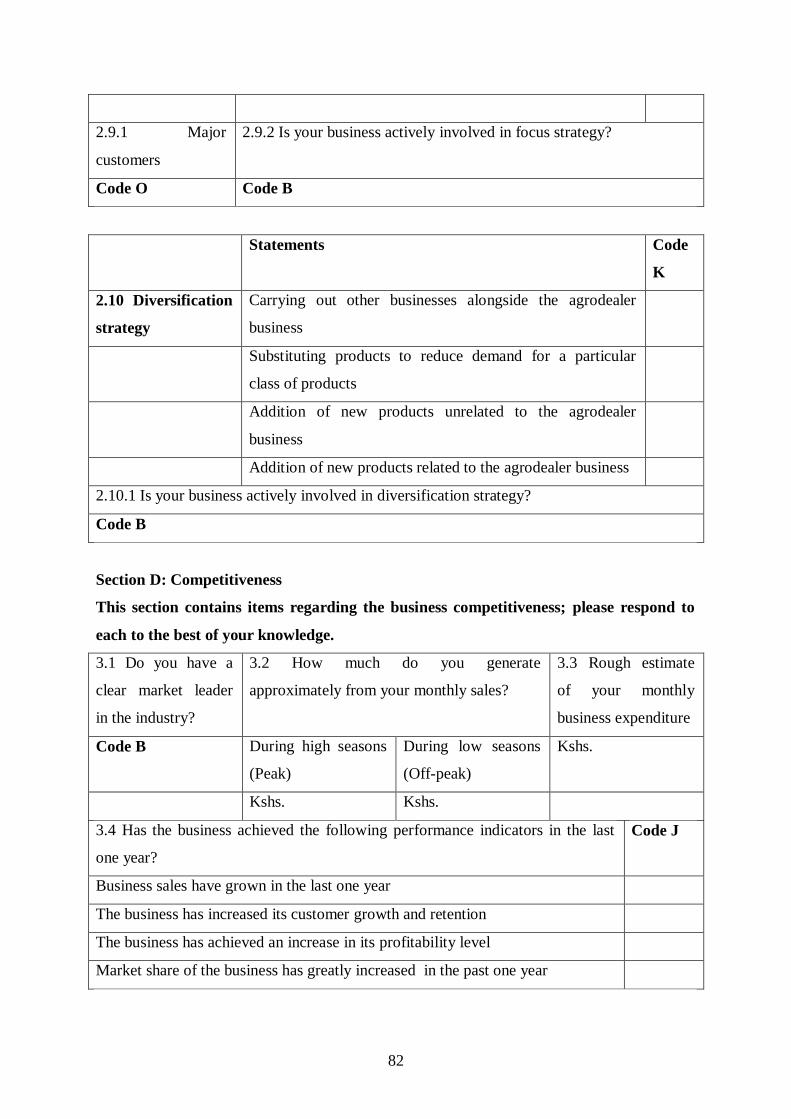
82
2.9.1 Major
customers
2.9.2 Is your business actively involved in focus strategy?
Code O Code B
Statements Code
K
2.10 Diversification
strategy
Carrying out other businesses alongside the agrodealer
business
Substituting products to reduce demand for a particular
class of products
Addition of new products unrelated to the agrodealer
business
Addition of new products related to the agrodealer business
2.10.1 Is your business actively involved in diversification strategy?
Code B
Section D: Competitiveness
This section contains items regarding the business competitiveness; please respond to
each to the best of your knowledge.
3.1 Do you have a
clear market leader
in the industry?
3.2 How much do you generate
approximately from your monthly sales?
3.3 Rough estimate
of your monthly
business expenditure
Code B During high seasons
(Peak)
During low seasons
(Off-peak)
Kshs.
Kshs. Kshs.
3.4 Has the business achieved the following performance indicators in the last
one year?
Code J
Business sales have grown in the last one year
The business has increased its customer growth and retention
The business has achieved an increase in its profitability level
Market share of the business has greatly increased in the past one year

83
3.5 To what extent have the following factors affected your competitive
performance?
Code K
Business location
Number of business branches
Agrodealer training
Agrodealer experience in the industry
Business age
3.6 To what extent have the following forces influenced your competitive
performance?
Code K
Bargaining power of buyers
Bargaining power of suppliers
New entrants
Threat of substitute products
Internal rivalry among agrodealers
3.7 Which types of skills do you think you require to improve on your competitiveness as a
business?
Code Q
Thank You!

84
Appendix iii: Factor analysis
LR test: independent vs. saturated: chi2(435) = 797.63 Prob>chi2 = 0.0000
Factor30 -0.37495 . -0.0315 1.0000
Factor29 -0.34527 0.02969 -0.0290 1.0315
Factor28 -0.30744 0.03783 -0.0258 1.0604
Factor27 -0.28696 0.02047 -0.0241 1.0862
Factor26 -0.24900 0.03796 -0.0209 1.1103
Factor25 -0.23234 0.01666 -0.0195 1.1312
Factor24 -0.19035 0.04199 -0.0160 1.1507
Factor23 -0.16330 0.02706 -0.0137 1.1667
Factor22 -0.12844 0.03485 -0.0108 1.1804
Factor21 -0.09363 0.03481 -0.0079 1.1912
Factor20 -0.06150 0.03213 -0.0052 1.1990
Factor19 -0.04126 0.02024 -0.0035 1.2042
Factor18 0.01352 0.05477 0.0011 1.2077
Factor17 0.03046 0.01694 0.0026 1.2065
Factor16 0.08426 0.05380 0.0071 1.2040
Factor15 0.11915 0.03489 0.0100 1.1969
Factor14 0.17750 0.05835 0.0149 1.1869
Factor13 0.23552 0.05802 0.0198 1.1720
Factor12 0.42814 0.19262 0.0359 1.1522
Factor11 0.52110 0.09296 0.0437 1.1163
Factor10 0.60328 0.08218 0.0506 1.0726
Factor9 0.63019 0.02691 0.0529 1.0219
Factor8 0.73105 0.10086 0.0614 0.9691
Factor7 0.76083 0.02978 0.0639 0.9077
Factor6 0.98705 0.22622 0.0828 0.8439
Factor5 1.13319 0.14614 0.0951 0.7610
Factor4 1.22819 0.09500 0.1031 0.6659
Factor3 1.41473 0.18654 0.1187 0.5628
Factor2 2.14030 0.72558 0.1796 0.4441
Factor1 3.15162 1.01132 0.2645 0.2645
Factor Eigenvalue Difference Proportion Cumulative
Rotation: (unrotated) Number of params = 140
Method: principal factors Retained factors = 5
Factor analysis/correlation Number of obs = 110
Criv6 0.4851 0.1088 -0.2527 -0.0191 0.0783 0.6824
Criv5 0.1758 0.2123 -0.3201 -0.0044 0.3501 0.6990
Criv4 -0.1905 -0.0934 0.1314 0.0641 -0.1769 0.9023
Criv3 0.2596 -0.2945 0.1225 0.0558 -0.1261 0.8119
Criv2 0.2693 0.2010 0.3564 0.1157 0.0847 0.7395
Criv1 0.4408 -0.4692 0.1827 -0.1662 -0.1668 0.4968
Tent8 0.4790 -0.0804 -0.1553 0.2940 -0.0955 0.6444
Tent7 0.2664 -0.2174 0.2725 0.1275 0.1857 0.7568
Tent6 0.3897 -0.0587 0.0113 0.1778 -0.2344 0.7581
Tent5 0.1930 0.2206 0.1581 0.4435 0.2139 0.6467
Tent4 0.2246 0.2541 0.2744 0.3115 -0.0412 0.7110
Tent3 0.0966 -0.0455 0.4583 -0.2271 0.1995 0.6872
Tent2 0.3286 -0.1496 -0.0338 0.2261 0.2056 0.7751
Tent1 0.5469 -0.0407 0.1733 -0.1132 -0.0072 0.6564
Tsub6 0.2589 -0.0754 -0.2495 -0.1529 0.1125 0.8290
Tsub5 0.3306 0.0501 0.0098 -0.0413 0.3568 0.7591
Tsub4 0.1556 0.4031 0.0793 -0.2749 -0.0103 0.7313
Tsub3 -0.0281 -0.1779 -0.2960 0.2526 -0.4408 0.6218
Tsub2 -0.1107 -0.0944 -0.2561 0.0470 0.3775 0.7685
Tsub1 0.0993 -0.2098 0.1783 -0.0013 0.1061 0.9031
Bsup6 0.5236 0.0097 -0.0394 -0.0195 0.1138 0.7109
Bsup5 0.4257 0.4047 -0.2490 0.1395 -0.0221 0.5731
Bsup3 0.4003 -0.3397 -0.1409 -0.0845 -0.0593 0.6938
Bsup2 0.5072 0.3999 -0.0318 -0.0748 -0.1508 0.5535
Bsup1 0.4313 -0.4214 -0.0548 -0.3864 -0.1363 0.4656
Bbyr6 0.0931 0.1082 -0.4597 0.0264 -0.0921 0.7591
Bbyr5 0.2366 0.5351 0.0364 -0.2979 -0.1353 0.5493
Bbyr4 0.2154 0.4883 0.1947 -0.0746 -0.3166 0.5715
Bbyr2 0.1745 -0.1729 0.1167 0.4292 -0.1121 0.7293
Bbyr1 0.3673 -0.3042 -0.1024 -0.0909 0.0910 0.7456
Variable Factor1 Factor2 Factor3 Factor4 Factor5 Uniqueness
Factor loadings (pattern matrix) and unique variances

85
LR test: independent vs. saturated: chi2(435) = 797.63 Prob>chi2 = 0.0000
Factor5 1.27467 . 0.1070 0.7610
Factor4 1.61350 0.33884 0.1354 0.6540
Factor3 1.62161 0.00811 0.1361 0.5186
Factor2 2.10776 0.48615 0.1769 0.3825
Factor1 2.45049 0.34272 0.2057 0.2057
Factor Variance Difference Proportion Cumulative
Rotation: orthogonal varimax (Kaiser off) Number of params = 140
Method: principal factors Retained factors = 5
Factor analysis/correlation Number of obs = 110
(blanks represent abs(loading)<.4)
Criv6 0.4294 0.6824
Criv5 0.5331 0.6990
Criv4 0.9023
Criv3 0.8119
Criv2 0.7395
Criv1 0.6895 0.4968
Tent8 0.6444
Tent7 0.7568
Tent6 0.7581
Tent5 0.5289 0.6467
Tent4 0.4596 0.7110
Tent3 0.5131 0.6872
Tent2 0.7751
Tent1 0.4439 0.6564
Tsub6 0.8290
Tsub5 0.7591
Tsub4 0.4612 0.7313
Tsub3 -0.5914 0.6218
Tsub2 0.7685
Tsub1 0.9031
Bsup6 0.7109
Bsup5 0.4359 0.5731
Bsup3 0.5132 0.6938
Bsup2 0.5999 0.5535
Bsup1 0.7082 0.4656
Bbyr6 0.7591
Bbyr5 0.6463 0.5493
Bbyr4 0.6275 0.5715
Bbyr2 0.4533 0.7293
Bbyr1 0.4434 0.7456
Variable Factor1 Factor2 Factor3 Factor4 Factor5 Uniqueness
Rotated factor loadings (pattern matrix) and unique variances

86
Appendix iv: Pair-wise correlation of competitive strategies
0.9146 0.6506 0.1007 0.2652
Prmtns 0.0103 -0.0437 0.1573 -0.1072 1.0000
0.0303 0.4070 0.2228
FS 0.2067* -0.0798 -0.1172 1.0000
0.4953 0.0499
DIFFS 0.0657 -0.1874* 1.0000
0.8324
DIVS 0.0204 1.0000
CLS 1.0000
CLS DIVS DIFFS FS Prmtns
. pwcorr CLS DIVS DIFFS FS Prmtns, sig star(5)
Mean VIF 1.99
Factor3 1.07 0.933920
Factor2 1.11 0.897888
Ownstructure 1.11 0.897321
Factor1 1.12 0.890503
Factor4 1.13 0.883520
Other_bs 1.14 0.874785
Bslocation 1.17 0.852419
Factor5 1.17 0.851843
Bs_branch 1.21 0.826732
Educ_years 1.34 0.747130
Businessage 1.34 0.745636
Group_mbrshp 1.36 0.735148
Age 6.79 0.147225
Work_exp 6.84 0.146183
Variable VIF 1/VIF
. vif

87
Appendix v: Multivariate regression for determinants of competitive strategic choices
_cons .9394161 1.407769 0.67 0.505 -1.819761 3.698593
Factor5 -.1815979 .1812701 -1.00 0.316 -.5368807 .1736849
Factor4 .0935 .1648858 0.57 0.571 -.2296702 .4166703
Factor3 .0345123 .158683 0.22 0.828 -.2765007 .3455253
Factor2 .4930573 .1647571 2.99 0.003 .1701393 .8159754
Factor1 .2232519 .1522748 1.47 0.143 -.0752013 .521705
Other_bs -.3436808 .2937254 -1.17 0.242 -.9193719 .2320103
Bslocation .0999669 .1101894 0.91 0.364 -.1160003 .3159341
Bs_branch .5832703 .2954325 1.97 0.048 .0042333 1.162307
Work_exp .0381795 .0473709 0.81 0.420 -.0546657 .1310248
Businessage -.0258356 .0253585 -1.02 0.308 -.0755373 .0238662
Ownstructure .279173 .2077805 1.34 0.179 -.1280694 .6864153
Group_mbrshp .7073063 .3147485 2.25 0.025 .0904105 1.324202
Educ_years -.4678026 .2215442 -2.11 0.035 -.9020212 -.0335839
Age -.0348966 .0419689 -0.83 0.406 -.1171542 .0473611
Prmtns
_cons -2.293016 1.537072 -1.49 0.136 -5.305622 .7195901
Factor5 -.0114849 .1857874 -0.06 0.951 -.3756214 .3526516
Factor4 .1047955 .1806311 0.58 0.562 -.2492349 .4588259
Factor3 -.0041933 .1814858 -0.02 0.982 -.359899 .3515124
Factor2 .0916348 .1663391 0.55 0.582 -.2343837 .4176534
Factor1 -.2899015 .1571052 -1.85 0.065 -.5978222 .0180191
Other_bs .7519784 .293243 2.56 0.010 .1772327 1.326724
Bslocation .0812307 .1132273 0.72 0.473 -.1406908 .3031521
Bs_branch -.3300793 .3545055 -0.93 0.352 -1.024897 .3647387
Work_exp -.0411152 .0516842 -0.80 0.426 -.1424143 .0601839
Businessage .0111978 .0258255 0.43 0.665 -.0394193 .0618149
Ownstructure .0195638 .2084185 0.09 0.925 -.388929 .4280567
Group_mbrshp .0744256 .3222209 0.23 0.817 -.5571157 .7059669
Educ_years .2037939 .2090701 0.97 0.330 -.205976 .6135639
Age .0241268 .0449331 0.54 0.591 -.0639405 .1121941
DIVS
_cons 1.533963 1.445602 1.06 0.289 -1.299365 4.367291
Factor5 -.1120378 .1707131 -0.66 0.512 -.4466293 .2225537
Factor4 .0399554 .1629765 0.25 0.806 -.2794726 .3593834
Factor3 -.1947306 .1547416 -1.26 0.208 -.4980184 .1085573
Factor2 -.1246466 .1541054 -0.81 0.419 -.4266878 .1773945
Factor1 .078712 .1673969 0.47 0.638 -.24938 .4068039
Other_bs -.163026 .2895285 -0.56 0.573 -.7304915 .4044395
Bslocation .0937702 .1110492 0.84 0.398 -.1238823 .3114227
Bs_branch -.5020885 .3445533 -1.46 0.145 -1.177401 .1732237
Work_exp .109248 .0519493 2.10 0.035 .0074293 .2110667
Businessage .0265557 .0244501 1.09 0.277 -.0213656 .0744769
Ownstructure .3409961 .1854427 1.84 0.066 -.0224649 .7044571
Group_mbrshp .0582446 .297616 0.20 0.845 -.5250721 .6415613
Educ_years -.0720891 .188791 -0.38 0.703 -.4421128 .2979345
Age -.088229 .0452979 -1.95 0.051 -.1770112 .0005532
FS
_cons 3.1158 1.434591 2.17 0.030 .3040537 5.927546
Factor5 -.3127766 .1860861 -1.68 0.093 -.6774987 .0519455
Factor4 -.1730372 .1711136 -1.01 0.312 -.5084137 .1623393
Factor3 .2424127 .157293 1.54 0.123 -.0658759 .5507013
Factor2 -.1262129 .1620722 -0.78 0.436 -.4438685 .1914427
Factor1 -.0330784 .1632994 -0.20 0.839 -.3531394 .2869826
Other_bs .0145681 .2888481 0.05 0.960 -.5515637 .5806999
Bslocation -.1215505 .1121637 -1.08 0.279 -.3413873 .0982862
Bs_branch -.2046143 .2977304 -0.69 0.492 -.7881552 .3789267
Work_exp .0514372 .0483412 1.06 0.287 -.0433099 .1461843
Businessage -.0121176 .0229214 -0.53 0.597 -.0570426 .0328075
Ownstructure -.2493482 .1989259 -1.25 0.210 -.6392358 .1405394
Group_mbrshp -.3517991 .3060717 -1.15 0.250 -.9516886 .2480905
Educ_years .0378358 .1918725 0.20 0.844 -.3382273 .413899
Age -.0552975 .041325 -1.34 0.181 -.136293 .0256981
DIFFS
_cons 1.23831 1.484488 0.83 0.404 -1.671234 4.147853
Factor5 -.0570009 .1695079 -0.34 0.737 -.3892302 .2752283
Factor4 .5325192 .181089 2.94 0.003 .1775913 .8874472
Factor3 .3992039 .1765852 2.26 0.024 .0531033 .7453044
Factor2 -.1004839 .1573565 -0.64 0.523 -.4088971 .2079292
Factor1 -.0524086 .1479331 -0.35 0.723 -.3423521 .2375349
Other_bs .4011546 .2933429 1.37 0.171 -.1737869 .9760962
Bslocation -.1378629 .1127283 -1.22 0.221 -.3588062 .0830804
Bs_branch -.0069819 .2888807 -0.02 0.981 -.5731776 .5592138
Work_exp .1222769 .0524852 2.33 0.020 .0194078 .2251459
Businessage -.0092146 .0226009 -0.41 0.683 -.0535115 .0350824
Ownstructure .1845479 .1905024 0.97 0.333 -.1888299 .5579256
Group_mbrshp -.3022061 .2998991 -1.01 0.314 -.8899976 .2855853
Educ_years .1158236 .2015676 0.57 0.566 -.2792416 .5108888
Age -.0735097 .0449437 -1.64 0.102 -.1615977 .0145783
CLS
Coef. Std. Err. z P>|z| [95% Conf. Interval]
Log likelihood = -296.14442 Prob > chi2 = 0.0687
Wald chi2(70) = 88.31
Multivariate probit (MSL, # draws = 5) Number of obs = 110

88
Appendix vi: Tobit regression for factors influencing the market share of agrodealer
businesses
0 right-censored observations
110 uncensored observations
0 left-censored observations
/sigma 1.566 0.106 1.356 1.776
_cons -0.719 1.779 -0.404 0.687 -4.254 2.817
Entre_skills 0.102 0.062 1.665 0.099 -0.020 0.225
Bs_expenditures 0.804 0.063 12.739 0.000 0.679 0.930
Factor5 -0.232 0.207 -1.123 0.264 -0.643 0.179
Factor4 -0.295 0.200 -1.479 0.143 -0.692 0.101
Factor3 -0.435 0.195 -2.227 0.029 -0.823 -0.047
Factor2 0.018 0.189 0.095 0.925 -0.358 0.394
Factor1 -0.427 0.184 -2.316 0.023 -0.793 -0.061
DIVS 0.092 0.391 0.235 0.815 -0.684 0.868
FS 0.003 0.355 0.009 0.993 -0.703 0.709
Prmtns 0.893 0.354 2.522 0.013 0.189 1.597
DIFFS -0.239 0.371 -0.644 0.521 -0.976 0.498
CLS 0.281 0.355 0.791 0.431 -0.425 0.986
Emplytraining -0.320 0.338 -0.948 0.346 -0.992 0.351
Other_bs -0.498 0.353 -1.412 0.161 -1.199 0.203
Bs_branch 0.323 0.362 0.890 0.376 -0.398 1.043
Businessage 0.063 0.028 2.208 0.030 0.006 0.119
Ownstructure -0.024 0.259 -0.091 0.928 -0.538 0.491
Group_mbrshp -0.345 0.369 -0.936 0.352 -1.078 0.388
Work_exp -0.052 0.059 -0.890 0.376 -0.169 0.064
Educ_years 0.171 0.246 0.695 0.489 -0.317 0.659
Gender -0.330 0.352 -0.939 0.350 -1.029 0.369
Age -0.009 0.050 -0.186 0.853 -0.109 0.091
Bs_Marketshare Coef. Std. Err. t P>|t| [95% Conf. Interval]
Log likelihood = -205.44458 Pseudo R2 = 0.2544
Prob > chi2 = 0.0000
LR chi2(22) = 140.23
Tobit regression Number of obs = 110
.
Mean VIF 1.96
Factor3 1.18 0.850580
Factor1 1.20 0.835169
Ownstructure 1.21 0.829117
DIVS 1.21 0.828001
FS 1.21 0.824199
Bslocation 1.22 0.821628
Gender 1.24 0.805945
Factor5 1.24 0.805718
Other_bs 1.24 0.804992
Factor2 1.24 0.803852
DIFFS 1.25 0.801990
Businessage 1.27 0.789373
Factor4 1.27 0.787656
CLS 1.32 0.756247
Prmtns 1.32 0.756152
Educ_years 1.42 0.706048
Group_mbrshp 1.48 0.674054
Age 7.55 0.132469
Work_exp 8.13 0.122929
Variable VIF 1/VIF
. vif

89
Appendix vii: Marginal effects of the Tobit regression model
.
Entre_skills .1024718 .0615454 1.66 0.096 -.0181549 .2230986
Bs_expenditures .804155 .0631272 12.74 0.000 .680428 .927882
Factor5 -.2321158 .2066727 -1.12 0.261 -.6371869 .1729552
Factor4 -.295143 .1995292 -1.48 0.139 -.686213 .095927
Factor3 -.4346772 .1951975 -2.23 0.026 -.8172572 -.0520972
Factor2 .0179655 .1893279 0.09 0.924 -.3531104 .3890413
Factor1 -.4269596 .1843726 -2.32 0.021 -.7883233 -.0655959
DIVS .0918876 .3905906 0.24 0.814 -.673656 .8574311
FS .0031566 .3551447 0.01 0.993 -.6929142 .6992273
Prmtns .8931574 .35415 2.52 0.012 .1990361 1.587279
DIFFS -.2388904 .3707019 -0.64 0.519 -.9654528 .487672
CLS .280831 .3550513 0.79 0.429 -.4150568 .9767188
Emplytraining -.3203265 .3377983 -0.95 0.343 -.982399 .3417459
Other_bs -.4981858 .3528178 -1.41 0.158 -1.189696 .1933243
Bs_branch .3226645 .3624794 0.89 0.373 -.387782 1.033111
Businessage .0626306 .0283623 2.21 0.027 .0070415 .1182196
Ownstructure -.0235017 .258954 -0.09 0.928 -.5310423 .4840389
Group_mbrshp -.3452934 .3688263 -0.94 0.349 -1.06818 .3775929
Work_exp -.0521608 .058595 -0.89 0.373 -.1670049 .0626833
Educ_years .1705851 .2455948 0.69 0.487 -.3107719 .651942
Gender -.3303014 .3518341 -0.94 0.348 -1.019884 .3592809
Age -.0093555 .0503255 -0.19 0.853 -.1079917 .0892808
dy/dx Std. Err. z P>|z| [95% Conf. Interval]
Delta-method
Factor2 Factor3 Factor4 Factor5 Bs_expenditures Entre_skills
dy/dx w.r.t. : Age Gender Educ_years Work_exp Group_mbrshp Ownstructure Businessage Bs_branch Other_bs Emplytraining CLS DIFFS Prmtns FS DIVS Factor1
Expression : Linear prediction, predict()
Model VCE : OIM
Average marginal effects Number of obs = 110
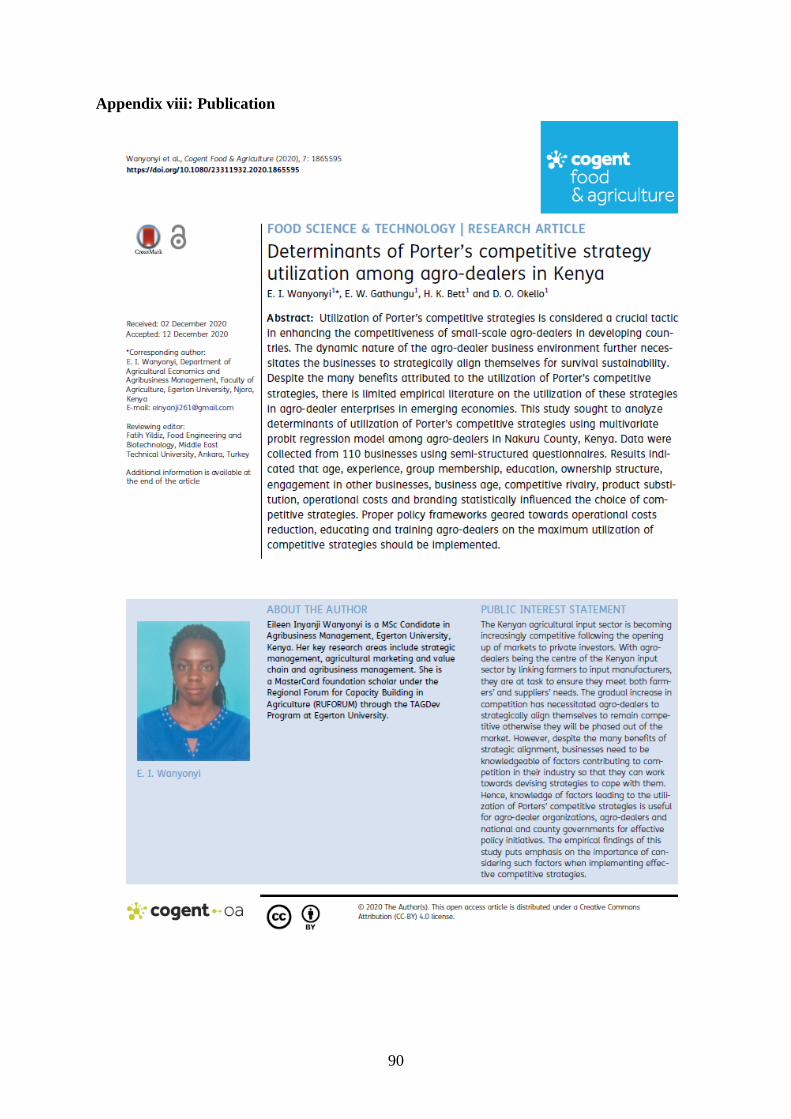
90
Appendix viii: Publication
Related Documents