Influence of Overloads on Dwell Time Fatigue Crack Growth in Inconel 718 Jonas Saarimäki, Johan Moverare, Robert Eriksson and Sten Johansson Linköping University Post Print N.B.: When citing this work, cite the original article. Original Publication: Jonas Saarimäki, Johan Moverare, Robert Eriksson and Sten Johansson, Influence of Overloads on Dwell Time Fatigue Crack Growth in Inconel 718, 2014, Materials Science and Engineering: A, (612), 398-405. http://dx.doi.org/10.1016/j.msea.2014.06.068 Copyright: Elsevier http://www.elsevier.com/ Postprint available at: Linköping University Electronic Press http://urn.kb.se/resolve?urn=urn:nbn:se:liu:diva-109348

Welcome message from author
This document is posted to help you gain knowledge. Please leave a comment to let me know what you think about it! Share it to your friends and learn new things together.
Transcript

Influence of Overloads on Dwell Time Fatigue
Crack Growth in Inconel 718
Jonas Saarimäki, Johan Moverare, Robert Eriksson and Sten Johansson
Linköping University Post Print
N.B.: When citing this work, cite the original article.
Original Publication:
Jonas Saarimäki, Johan Moverare, Robert Eriksson and Sten Johansson, Influence of Overloads
on Dwell Time Fatigue Crack Growth in Inconel 718, 2014, Materials Science and Engineering:
A, (612), 398-405.
http://dx.doi.org/10.1016/j.msea.2014.06.068
Copyright: Elsevier
http://www.elsevier.com/
Postprint available at: Linköping University Electronic Press
http://urn.kb.se/resolve?urn=urn:nbn:se:liu:diva-109348

Influence of overloads on dwell time fatigue crack
growth in Inconel 718
Jonas Saarimakia,∗, Johan Moverarea,b,∗, Robert Erikssona,∗, StenJohanssona,∗
aDivision of Engineering Materials, Department of Management and Engineering,Linkoping University, SE-58183 Linkoping, Sweden
bSiemens Industrial Turbomachinery AB, Materials Technology, SE-61283 Finspang,Sweden
Abstract
Inconel 718 is one of the most commonly used superalloys for high temper-
ature applications in gasturbines and aeroengines and is for example used
for components such as turbine discs. Turbine discs can be subjected to
temperatures up to ∼ 700 ◦C towards the outer radius of the disc. During
service, the discs might start to develop cracks due to fatigue and long dwell
times. Additionally, temperature variations during use can lead to large
thermal transients during start-up and shutdown which can lead to overload
peaks in the normal dwell time cycle. In this study, tests at 550 ◦C with
an overload prior to the start of each dwell time, have been performed. The
aim of the investigation was to get a better understanding of the effects of
overloads on the microstructure and crack mechanisms. The microstructure
was studied using electron channelling contrast imaging (ECCI). The image
analysis toolbox in Matlab was used on cross sections of the cracks to quan-
tify: crack length, branch length, and the number of braches in each crack.
∗[email protected] +46 13 28 11 93
Preprint submitted to Material Science & Engineering A June 2, 2014

It was found that the amount of crack branching increases with an increasing
overload and that the branch length decreases with an increasing overload.
When the higher overloads were applied, the dwell time effect was almost
cancelled out. There is a strong tendency for an increased roughness of the
crack path with an increasing crack growth rate.
Keywords: Nickel based superalloys, Fatigue, Fracture, Mechanical
characterization, Electron microscopy
1. Introduction
In gas turbine development, engineers and manufacturers strive to opti-
mize performance and efficiency. This is achieved through the use of super-
alloys, which enable high operating temperatures which can result in better
efficiency.
Inconel 718 belongs to the more commonly used superalloys and is a
polycrystalline Ni-Fe-base superalloy. Inconel 718 derives its strength from
solid solution alloying elements and, more so, from gamma prime (γ′) and
gamma double prime, (γ′′), precipitates. Other beneficial properties are good
corrosion resistance and weldability.
The alloy is frequently used for high temperature components subjected
to cyclic loading, particularly when there is a risk for fatigue and creep
deformation, such as turbine discs for land based gas turbine engines. Turbine
discs can be subjected to temperatures up to ∼ 550 ◦C in land-based gas
turbines and up to∼ 700 ◦C in jet engines at which the mechanical properties
starts to degrade [1].
Aircraft turbine engines can be exposed to overloads caused by unusual
2

service conditions, e.g. harsh weather, turbulence or rough landings; whilst
land-based gas turbines may be exposed to overloads initiated by the mal-
functioning of other components that leads to unexpected stops. Primary
overloads can also occur on a more regular basis, these are ordinarily de-
tected in gas turbine components due to strong thermal transients during
turbine start-up. Aircraft turbine engines, on the other hand, are pushed to
their limits for shorter periods of time during take-off and landing while, at
cruising speed, the loading is considerably lower.
The turbine is subjected to several different damage and fracture modes
such as fatigue, creep, and oxidation. These fracture modes can be tested
with different cycles that are often simplified in lab-tests when used for life
assessment. One of these cycle types is the overload dwell time cycle [2],
which is the focus of this paper.
Previous studies [3–5] have shown that Inconel 718 mainly cracks trans-
granularly during cyclic testing in the lower temperature range and inter-
granularly during fatigue at higher temperatures and with dwell times. The
same behaviour has been observed in other superalloys such as Waspalloy [6].
Grain boundary embrittlement has been studied by Ref. [6–8] where it was
shown that the crack growth per cycle during unloading-reloading is much
higher after a dwell time period compared to pure cyclic loading. Similar ob-
servations has been reported to occur during thermomechanical fatigue crack
growth tests [9]. Other crack growth mechanisms, such as dynamic recrys-
tallization, strain localization in persistent slip bands, deformation bands,
and vacancy diffusion, have also been proposed in references [10–14]. The
purpose of this study is to examine the effects of dwell times and overloads on
3

the crack growth mechanisms in Inconel 718. This is important and needed
to enable more reliable fatigue life calculations for structures subjected to
complex loadings.
2. Experimental procedure
The material used in this study was standard heat-treated Inconel 718
according to AMS 5663; solution anneling for 1 hour at 945 ◦C, followed
by aging for 8 hours at 718 ◦C and 8 hours at 621 ◦C. It had a chemical
composition as shown in Table 1 and an average grain size of 10 µm.
2.1. Fatigue testing
2.1.1. Specimens
Fig. 2, shows an instrumented Kb-type test specimen that was used for
all tests with a rectangular cross-section of 4.3 × 10.2 mm and an electro-
discharge machined starter notch measuring: depth 0.075 mm, width 0.15
mm, and length 0.3 mm. One specimen was used for each test condition.
2.1.2. Experimental details
A fatigue pre-crack was propagated at room temperature by using a load
ratio of R = σmin/σdwell = 0.05, and a cyclic frequency of 10 Hz which
resulted in a semi-circular crack with a depth of approximately 0.2 mm before
the high temperature was applied and cycling was started. After which, the
specimens were subjected to: 1) pure fatigue at 0.5 Hz, 2) fatigue with a
high-temperature dwell time and 3) fatigue with a high-temperature dwell
time and overloads. The overload was always applied before the dwell time
4

part of each cycle as illustrated in Fig. 1. The overload level, OL, was
calculated as
OL =∆Punloading
Pdwell
(1)
with ∆Punloading and Pdwell defined in Fig. 1.
All overload tests were done in laboratory air at 550 ◦C with overloads of
2.5, 5.0, and 15 % followed by a 2160 s dwell time using Kb-type specimens
with a semi-cirkular crack.
Crack growth was measured according to ASTM E 647 using a 12 A chan-
nel pulsed DCPD (Direct Current Potential Drop) system. Crack length was
calculated by dividing the potential drop (PD) over the crack by the PD
on the opposite side as a reference. This ratio was then converted to crack
length assuming a semi-circular crack front via an experimentally acquired
calibration curve for Inconel 718 which showed the PD ratio as a function
of crack length based on the initial and final crack lengths measured on
the fracture surface as well as by measured induced beach marks [15]. The
analytical solution for the stress intensity factor, K, was obtained using a
pre-solved case for a semi-elliptic surface crack according to ASTM E740-03.
When a crack length of 2.5 mm was reached, according to the PD value, the
test was interrupted. Testing was done using a 160 kN MTS servo hydraulic
tensile/compression testing machine, equipped with a three zone high tem-
perature furnace. The nominal load during the dwell time was σdwell = 650
MPa and all tests were conducted with the load ratio R=0.05, as given by
equation 2.
5

R = σmin/σdwell = 0.05. (2)
2.2. Microscopy and image analysis
After fatigue testing, some specimens were cross-sectioned and mounted
as-is, so that the crack path could be studied, while others were tensiled until
fracture and used for studying the fracture surfaces. The cross-sectioned
specimens were cut roughly at the center line of the semicircular crack. A
Hitachi SU70 FEG analytical scanning electron microscope (SEM), operating
at 1.5-20 kV was used together with Electron Channelling Contrast Imaging
(ECCI) [16] to get high quality, high contrast pictures of the crack growth
appearance and the microstructure.
On the cross-sectioned specimens, the crack path was identified through
image analysis and characterized by a number of parameters such as crack
path length, mean crack branch length and number of branches; when nec-
essary (i.e. for crack path length and number of branches), the parameters
were normalised by the horizontal crack path length to enable comparison
of cracks of different lengths. Some measurements were performed without
including crack branches, here referred to as the main crack.
In addition, the crack roughness (an Ra-like value), CR, was calculated for
each crack, quantifying the roughness of each crack where high CR indicated
a rough crack path. A reference line was fitted to the crack and the crack
path was then described by its distance from the mean line, z(x), see Fig. 3.
CR was calculated as
CR =1
L
∫ L
0
|z(x)| dx (3)
6

where L is the projected crack path length.
The CR was calculated for an unmodified crack path and, as is common
for Ra, filtered crack paths. The filtering was conducted using a Gaussian
high-pass filter which passes wavelengths shorter than the cut-off wavelength,
λco. Several different λco were tried. Fig. 3 shows an example for λco = 100
µm where Fig. 3 a) shows the longwave component being removed and Fig.
3 b) shows the filtered crack path. The unfiltered crack path gave a CR value
which was influenced by large-scale kinks in the crack path while the filtered
crack path gave a CR value dominated by small-scale kinks in the crack path
(i.e. unaffected by large-scale kinks).
3. Results
3.1. Crack growth rate
In Fig. 4, crack growth rate is plotted versus the stress intensity factor
range ∆K for: 2.5, 5.0, 15 % overloads, 2160 s dwell time, and a baseline test
without dwell time. Overloads had a significant effect on the crack growth
rate, even at low overloads such as 2.5 %. For the 15 % overload test the
crack growth rate decreased by a factor of ∼ 100 compared to the 2160 s
dwell time test and almost cancelled the dwell time effect.
3.2. Cracking behaviour
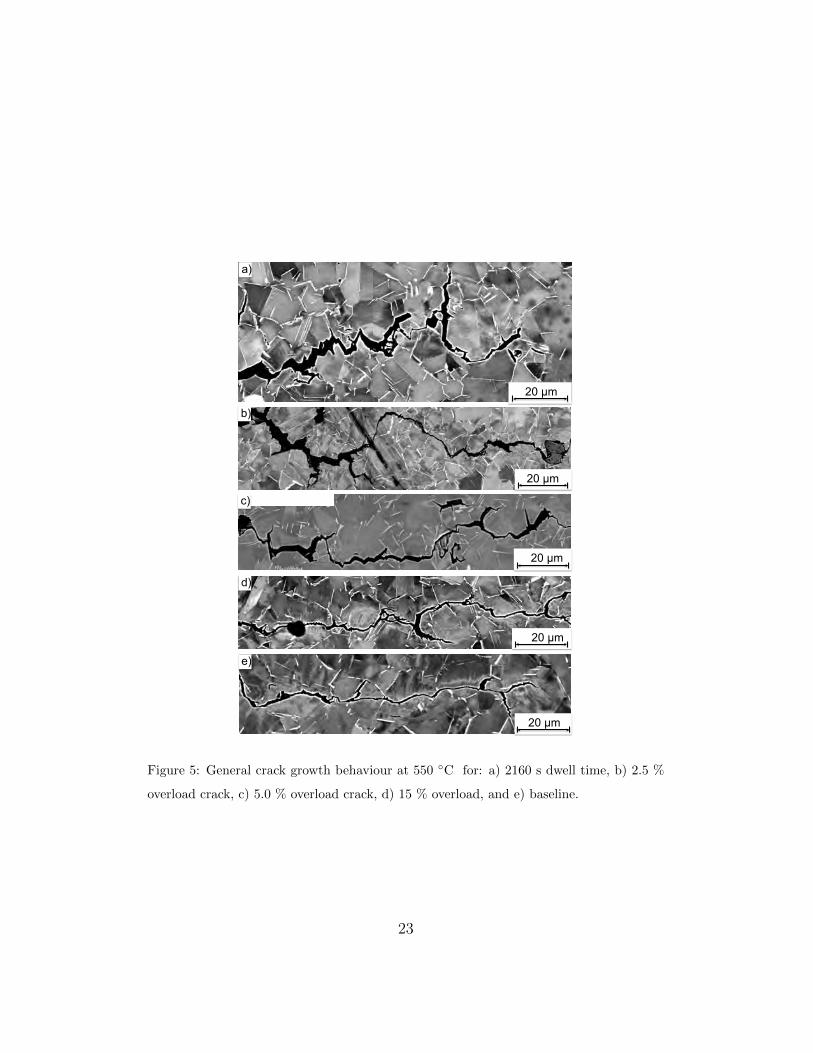
Fig. 5 shows the appearance of the crack path on cross-sectioned spec-
imens for the 2160 s dwell time test, overload tests, and the base-line test.
For the dwell time test and for low overload, the cracking was dominantly in-
tergranular; for the baseline test and the higher overloads, the cracking was
7
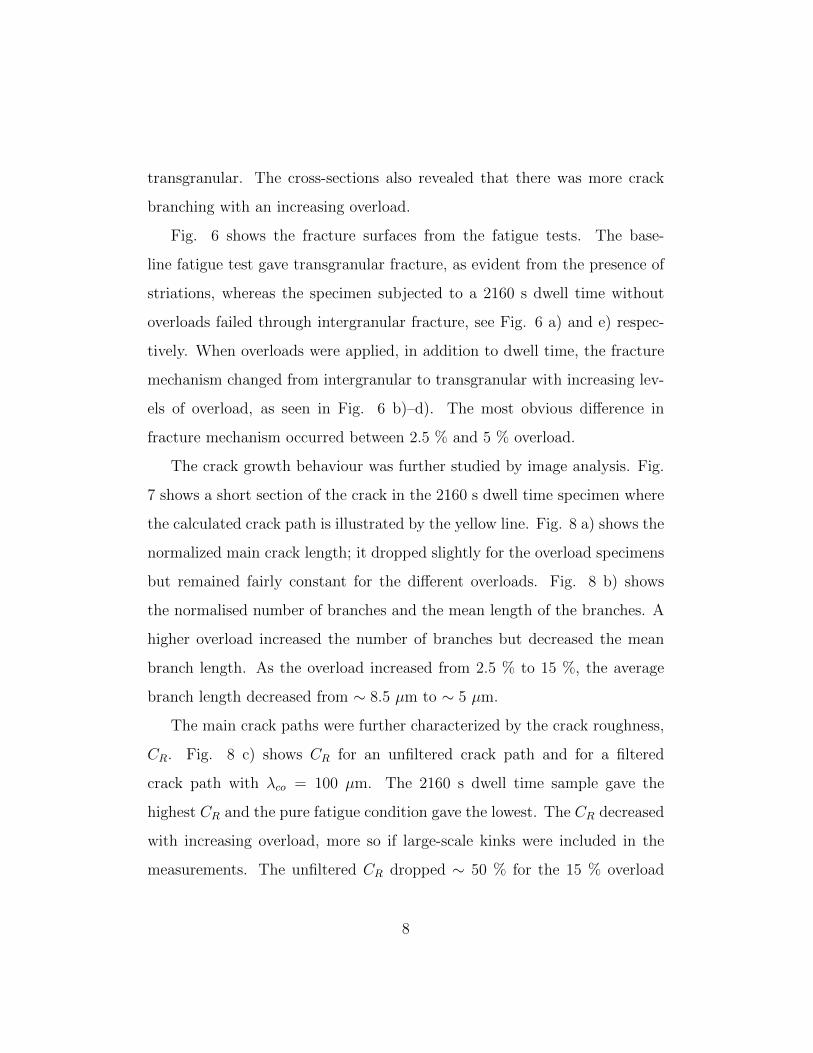
transgranular. The cross-sections also revealed that there was more crack
branching with an increasing overload.
Fig. 6 shows the fracture surfaces from the fatigue tests. The base-
line fatigue test gave transgranular fracture, as evident from the presence of
striations, whereas the specimen subjected to a 2160 s dwell time without
overloads failed through intergranular fracture, see Fig. 6 a) and e) respec-
tively. When overloads were applied, in addition to dwell time, the fracture
mechanism changed from intergranular to transgranular with increasing lev-
els of overload, as seen in Fig. 6 b)–d). The most obvious difference in
fracture mechanism occurred between 2.5 % and 5 % overload.
The crack growth behaviour was further studied by image analysis. Fig.
7 shows a short section of the crack in the 2160 s dwell time specimen where
the calculated crack path is illustrated by the yellow line. Fig. 8 a) shows the
normalized main crack length; it dropped slightly for the overload specimens
but remained fairly constant for the different overloads. Fig. 8 b) shows
the normalised number of branches and the mean length of the branches. A
higher overload increased the number of branches but decreased the mean
branch length. As the overload increased from 2.5 % to 15 %, the average
branch length decreased from ∼ 8.5 µm to ∼ 5 µm.
The main crack paths were further characterized by the crack roughness,
CR. Fig. 8 c) shows CR for an unfiltered crack path and for a filtered
crack path with λco = 100 µm. The 2160 s dwell time sample gave the
highest CR and the pure fatigue condition gave the lowest. The CR decreased
with increasing overload, more so if large-scale kinks were included in the
measurements. The unfiltered CR dropped ∼ 50 % for the 15 % overload
8

compared to the 2160 s dwell time test without overload. For the filtered
CR, where all wavelengths > 100 µm were removed, the drop was 30 %.
3.3. Crack mechanisms
3.3.1. No or low overloads
For no or low overloads, high resolution scanning electron microscopy re-
vealed that microscopic crack growth in Inconel 718 at high temperature took
place as intergranular crack growth along grain boundaries due to oxidation
and the creation of nanometric voids. The growth of pores in grainbound-
aries and intergranular fracture by growth of nano-sized pores can be seen
in Fig. 9 a and b. Another observed growth mechanism was crack advance
along δ phase boundaries with subsequent severe oxidation of the δ phase,
see Fig. 10. Sometimes it was also possible to observe unbroken ligaments
behind the crack front. At such locations, the crack eventually grew along
the substructures created by severe local plastic deformation and the high
temperature. This substructure consisted, of dislocation sub-cells or nano-
sized grains created by embryos to dynamic recrystallization which can be
seen as black dots in Fig. 11.
3.3.2. High overloads and baseline
For high overloads and baseline tests the crack growth was mainly trans-
granular due to severe local deformation in front of the crack tip. For the
test with a 15 % overload, this typically led to a serrated crack path and
crack tip blunting, as seen in Fig. 12 a). The distance between the serra-
tions corresponded very well with the crack growth between two overload
cycles. Thus, there was a tendency for crack branching during each overload
9
cycle. The majority of the crack branches become blunted and only very few
grows longer in the following cycles. The typical appearance of a blunted
crack tip can be seen in Fig. 12 b). When the crack grows transgranularly,
and through δ phases within the grains, the δ phases showed some degree of
plastic deformation as seen in Fig. 13.
4. Discussion
The use of wrought fine grained polycrystalline nickel base superalloys,
such as Inconel 718, are in many situations limited by their susceptibility to
fast intergranular cracking during extended dwell times at high temperatures
and high tensile stresses [9]. It has been well established that time dependent
intergranular cracking of nickel-based superalloys, under both sustained and
cyclic loads, is dominated by environmental interactions with oxygen at the
crack tip [8, 17]. Intergranular cracking is not due to the formation of massive
oxidation products along the grain boundaries. The mechanism is better
described as nano scaled dynamic embrittlement, where oxygen diffuses into
highly stressed grain boundaries at the crack tip and causes decohesion [18,
19].
Previous studies [20, 21] have shown that complex oxides of Ni, Cr, and
Fe, as well as oxides formed from niobium carbides, can be formed at the
crack tip in Inconel 718. This conforms with our observations where it can be
seen that the crack growth rate at 550 ◦C increased by a factor of 100 when
a dwell time of 2160 s was applied at the maximum load, see Fig. 4. When
a dwell time was applied, the crack growth changed from transgranular to
intergranular, see Fig. 6.
10

Introducing an overload prior to the dwell time had a significant influence
on the crack growth rate. For an overload of 15 %, the dwell time effect was
more or less completely extinguished and the crack growth rate was the same
as for pure fatigue loading without a dwell time, see Fig. 4. This can partly
be explained by reversed plasticity and the zone of compressive stress which
is formed at the crack tip after the partial unloading [15]. It is not obvious
whether the decrease in crack growth rate is only due to a reduction of
the crack driving force, or if the embrittlement effect of the material is also
reduced, e.g. by a reduction of the diffusion rate of oxygen at the crack tip.
Our observation that the fracture appearance changed from intergranular
to transgranular with an increasing overload level indicate that the embrit-
tlement effect becomes less prominent when overloads are introduced prior to
the dwell time, see Fig. 6. The general crack growth behaviour is illustrated
in Fig. 5, where the intergranular crack growth of the 2160 s dwell time
sample in Fig. 5 a) can be compared stepwise through the different levels of
overloads 2.5, 5.0, and 15 % in Fig. 5 b)–d) to the more transgranular crack
growth behaviour of the baseline sample in Fig. 5 e).
The CR parameter successfully captured the transition from intergranular
to transgranular fracture with increasing overload. The decrease in CR with
overload indicates a ’smoother’ or ’straighter’ crack path for higher overloads
which would be consistent with an increase in transgranular fracture. The
smoother crack path, caused by overloads, would also mean that the crack
changes from mode II cracking to predominantly mode I. Antunes et al.[22]
have previously reported, for an alloy with 15 µm grain size, that a change
in fracture behaviour, from intergranular to transgranular, was accompanied
11

by a change in Ra on the fracture surface from ∼ 9 µm for intergranular
to 3–5 µm for varying degrees of transgranular fracture. The exact value of
the point of transition depends on the chosen cut-off wavelength; here the
transition occurs around 8–10 µm for the unfiltered CR.
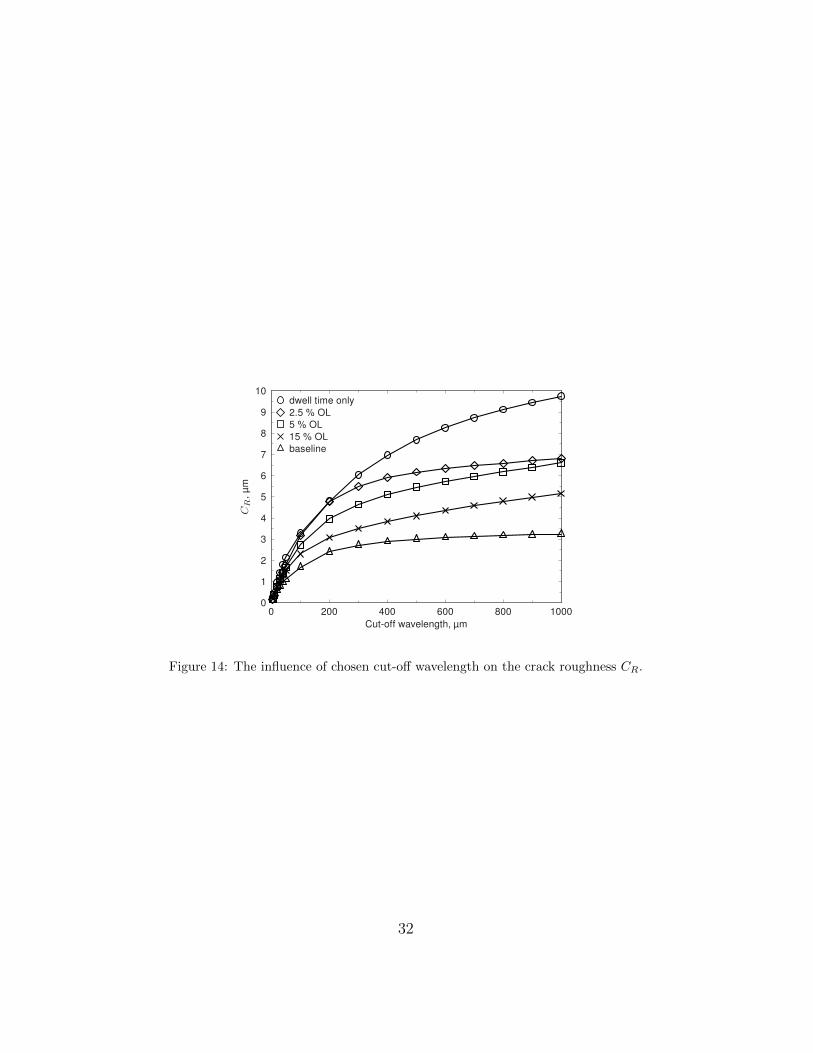
The λco-dependence of CR also provided information about on which
length-scale the studied crack paths differed. Fig. 14 shows how CR de-
pended on the chosen λco. For λco values in the interval 5–50 µm, the CR
values from different testing conditions were similar. λco values ≥ 100 µm, on
the other hand, gave notable differences in CR values between the different
testing conditions. Hence, the major difference in crack path morphology,
between the studied test conditions, was due to features in the crack path in
the order of a few to several hundred microns, which was significantly larger
than the grain size of the material.
Another parameter that showed a correlation with the change in fracture
mechanism was the mean crack branch length which was high for the 2160 s
dwell time and no or low overloads, but decreased ∼ 50 % for the baseline and
high overload tests. An interesting observation would be that the majority
of small braches seem to start in the (δ) phase, since δ is Nb-rich it could be
more prone to oxidation and become more brittle than the (γ) matrix which
could lead to crack branching that both starts and stops within the delta
phases.
The cracks in the baseline and 15 % overload tests mainly grew trans-
granularly due to severe plastic deformation at the crack tip. The severe
plastic deformation also led to significant crack tip blunting and branching
in connection to slip bands as evident by the striations in Fig. 12. Blunting
12

of the crack tip will impede the crack growth rate since the energy needed
to propagate a blunted crack tip is higher compared to a sharp crack tip.
Studying the crack tip from the 15 % overload test in higher magnification
revealed some tendency for environmental assisted cracking also for this load-
ing condition, see Fig. 15. From the blunted crack tip, a small crack has
been formed and small black dots can be seen in front of the crack. Even if
the crack in this case grew transgranularly, it showed some similarity with
intergranular cracks in, e.g., Fig. 9. Thus, it might be possible that time
dependent crack propagation eventually will occur even for higher overloads,
especially if the dwell time would have been longer than the 2160s used in
this study. This will be a topic for further studies.
5. Summary
Fatigue crack growth testing has been performed on Inconel 718 at 550 ◦C with
the purpose of investigating the effect of overloads on the dwell time fatigue
crack growth. The following conclusions can be drawn from this work:
• There is a significant increase in crack growth rate when dwell times
are introduced at the maximum load (0 % overload) in the fatigue
cycle. With a dwell time there is also a shift from transgranular to
intergranular crack growth.
• When an overload is applied prior to the dwell time, the crack growth
rate decreases with increasing overload levels. For an overload of 15 %,
the dwell time effect is essentially extinguished and the crack growth
rate is the same as for pure fatigue loading without dwell time.
13

• The decrease in crack growth rate due to an increasing overload is
also accompanied by a transition from intergranular to transgranular
cracking.
• There is a tendency to develop more, but shorter, crack branches with
an increasing overload level. The branching of the crack is often associ-
ated with slip bands or with the presence of δ phase in the microstruc-
ture. Furthermore, High overloads lead to significant blunting of the
crack tip.
• The roughness of the crack path increases with an increasing crack
growth rate. The smoothest crack paths are found for pure fatigue
loading and dwell time fatigue tests with the highest overloads. With
no or small overloads, there is a significant oscillation of the crack path
and the wavelength is typically on a length scale that is larger than the
grain size of the material.
• There is a tendency for modus II crack growth during dwell fatigue
which is suppressed with the introduction of overloads.
6. Acknowledgements
The authors would like to thank Mr. Bo Skoog, Linkoping University, for
the help with the laboratory work, Agora Materiae, graduate school, Fac-
ulty grant SFO-MAT-LiU#2009-00971, and the project teams at Linkoping
University, Siemens Industrial Turbomachinery AB and GKN Aerospace En-
gine Systems for valuable discussions. This research has been funded by
the Swedish Energy Agency, Siemens Industrial Turbomachinery AB, GKN
14

Aerospace Engine Systems, and the Royal Institute of Technology through
the Swedish research program TURBO POWER, the support of which is
gratefully acknowledged.
[1] D. Leo Prakash, M. Walsh, D. Maclachlan, A. Korsunsky, International
Journal of Fatigue 31 (2009) 1966–1977.
[2] S. Ponnelle, B. Brethes, A. Pineau, European Structural Integrity Soci-
ety 29 (2002) 257–266.
[3] D. Gustafsson, J. Moverare, S. Johansson, M. Hornqvist, K. Simonsson,
S. Sjostrom, B. Sharifimajda, in: Procedia Engineering, volume 2 of
10th International Fatigue Congress, FATIGUE 2010, pp. 1095–1104.
[4] P. Heuler, E. Affeldt, R. J. H. Wanhill, Materialwissenschaft und Werk-
stofftechnik 34 (2003) 790–796.
[5] J. P. Pedron, A. Pineau, J. P. P. I. Dron, Materials Science and Engi-
neering 56 (1982) 143–156.
[6] D. Gustafsson, J. Moverare, K. Simonsson, S. Johansson, M. Hornqvist,
T. Mansson, S. Sjostrom, in: Procedia Engineering, volume 10 of
11th International Conference on the Mechanical Behavior of Materi-
als, ICM11, pp. 2821–2826.
[7] D. Gustafsson, J. J. Moverare, S. Johansson, K. Simonsson,
M. Hornqvist, T. Mansson, S. Sjostrom, International Journal of Fa-
tigue 33 (2011) 1461–1469.
15

[8] K. Wackermann, U. Krupp, H.-J. Christ, in: ASTM Special Technical
Publication, volume 1539 STP of ASTM International Symposium on
Creep-Fatigue Interactions: Test Methods and Models, Siegen, Germany,
pp. 297–312.
[9] J. J. Moverare, D. Gustafsson, Materials Science and Engineering A 528
(2011) 8660–8670.
[10] K. Obergfell, P. Peralta, R. Martinez, J. Michael, L. Llanes, C. Laird,
International Journal of Fatigue 23 (2001) 207–214.
[11] D. J. Morrison, V. Chopra, J. W. Jones, Scripta Metallurgica et Mate-
rialia 25 (1991) 1299–1304.
[12] P. Reed, J. King, Scripta Metallurgica et Materialia 26 (1992) 1829–
1834.
[13] R. Rahouadj, J. Menigault, M. Clavel, Materials Science and Engineer-
ing 93 (1987) 181–190.
[14] S. Chen, G. Gottstein, Acta metall 36 (1988) 3093–3101.
[15] D. Gustafsson, E. Lundstrom, International Journal of Fatigue 48 (2013)
178–186.
[16] I. Gutierrez-Urrutia, S. Zaefferer, D. Raabe, Scripta Materialia 61 (2009)
737–740.
[17] D. A. Woodford, Energy Materials: Materials Science and Engineering
for Energy Systems 1 (2006) 59–79.
16
[18] U. Krupp, International Materials Reviews 50 (2005) 83–97.
[19] E.-G. Wagenhuber, V. B. Trindade, U. Krupp, in: L. E.A. (Ed.), Pro-
ceedings of the International Symposium on Superalloys and Various
Derivatives, 6th International Symposium on Superalloys 718, 625, 706
and Derivatives, Pitsburg, U.S., pp. 591–600.
[20] L. Viskari, M. Hornqvist, K. L. Moore, Y. Cao, K. Stiller, Acta Materi-
alia 61 (2013) 3630–3639.
[21] M. Gao, D. J. Dwyer, R. P. Wei, in: Superalloys 718, 625, 706 and
Various Derivatives, pp. 581–592.
[22] F. V. Antunes, A. Ramalho, J. M. Ferreira, International Journal of
Fatigue 22 (2000) 781–788.
17

Table 1: Composition of elements for Inconel 718.
Alloy Wt % Ni Cr Fe Mo Nb Co C Mn Si S Cu Al Ti
Inconel 718Min. 50 17
balance2.8 4.75 0.2 0.7
Max. 55 21 3.3 5.5 1 0.08 0.35 0.35 0.01 0.3 0.8 1.15
18

ΔPunloading
Poverload
Pdwell
P [N
]
Time [s]
Figure 1: The overload cycle.
19

Figure 2: Instrumented Kb-type test specimen used for all tests.
20

-50
-40
-30
-20
-10
0
10
20
30
40
z,µm
600 700 800 900 1000 1100 1200 1300 1400x, µm
crack pathlongwave component
a)
-50
-40
-30
-20
-10
0
10
20
30
40
z,µm
600 700 800 900 1000 1100 1200 1300 1400x, µm
no filteringfiltered, 100 µm cut-off
b)
Figure 3: Filtering of the crack path. a) The unfiltered crack path and the longwave
component of the crack. b) An unfilltered crack and a filtered using 100 µm cut-off.
21

10−5
10−4
10−3
10−2
10−1
1
Cra
ckgr
owth
rate
,da/
dN,m
m/c
ycle
10 20 30 40 50Stress intensity factor range, ΔK, MPa
√�
550 ◦C, no dwell time550 ◦C 2160 s550 ◦C 2160 s, 2.5 % OL550 ◦C 2160 s, 5 % OL550 ◦C 2160 s, 15 % OL
Figure 4: Crack growth rate for the different fatigue conditions.
22
20 µm
e)
20 µm
a)
20 µm
b)
20 µm
c)
20 µm
d)
Figure 5: General crack growth behaviour at 550 ◦C for: a) 2160 s dwell time, b) 2.5 %
overload crack, c) 5.0 % overload crack, d) 15 % overload, and e) baseline.
23

10 µm
e)
10 µm
a)
10 µm
b)
10 µm
c)
10 µm
d)
Figure 6: Fracture surfaces from fatigue tests: a) 2160 s dwell time, b) 2.5 % overload, c)
5 % overload, d) 15 % overload, and e) baseline.
24
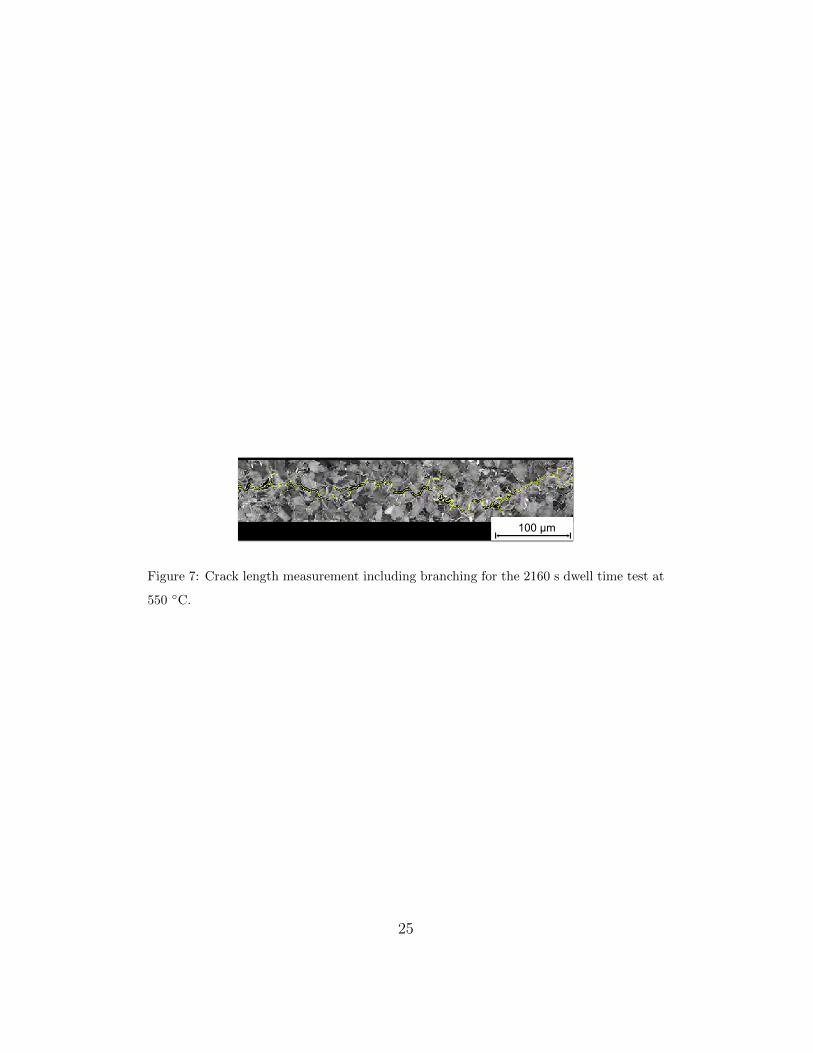
100 µm
Figure 7: Crack length measurement including branching for the 2160 s dwell time test at
550 ◦C.
25

1.0
1.1
1.2
1.3
1.4
1.5
Nor
mal
ized
leng
th,µ
m/µ
m
2160s 2.5% OL 5.0% OL 15% OL BLSpecimen
a)
0.0
0.02
0.04
0.06
0.08
0.1
Nor
mal
ized
num
ber
ofbr
anch
es,1
/µm
0
1
2
3
4
5
6
7
8
9
10
Mea
nbr
anch
leng
th,µ
m
2160s 2.5% OL 5.0% OL 15% OL BLSpecimen
normalized number of branchesmean branch length
b)
0
2
4
6
8
10
12
CR
unfil
tere
d,µm
0.0
0.5
1.0
1.5
2.0
2.5
3.0
3.5
4.0
4.5
5.0
CR
filte
red,
µm
2160s 2.5% OL 5.0% OL 15% OL BLSpecimen
CR, unfilteredCR, filtered, λco = 100 µm
c)
Figure 8: Crack path parameters: a) Normalized main crack length, b) normalized number
of crack branches and mean branch length, and c) crack roughness, CR.
26

a)
b)
400 nm
1 µm
Figure 9: The 2.5 % overload sample showing: a) Growth of pores in grainboundaries and,
b) intergranular fracture by growth of nano-sized pores.
27

a)
b)
300 nm
1 µm
Figure 10: Secondary electron images of 2.5% overload, crack growth in connection to δ
phase with oxidation.
28

2 µm
Figure 11: Crack growth in an area subjected to severe local plastic deformation.
29

a)
b)
~
da dN
~
da dN
5 µm
3 µm
Figure 12: The 15 % overload sample roughly showing the distance corresponding to one
overload cycle and: a) A serrated crack path and, b) the blunted crack tip.
30

~
da dN
2 µm
Figure 13: The 15 % overload sample showing transgranular cracking through δ phases.
31
0
1
2
3
4
5
6
7
8
9
10
CR
,µm
0 200 400 600 800 1000Cut-off wavelength, µm
dwell time only2.5 % OL5 % OL15 % OLbaseline
Figure 14: The influence of chosen cut-off wavelength on the crack roughness CR.
32

1 µm
Figure 15: Crack growth in the severely plasticized material neer the crack tip can be seen
as small black dots in front of the crack.
33
Related Documents