Copyright © 2012. Academy of Knowledge Process Available online at http://www.akpinsight.webs.com 1 Copyright © 2012 IJCBS ISSN 2156-7506 VOLUME 3 - NUMBER 11 - NOVEMBER, 2012 International Journal of Contemporary Business Studies Academy of Knowledge Process www.akpinsight.webs.com An International Journal Published by In this Issue Educational Facilities and School Dropout in Tribal Area: A District Level Analysis in Andhra Pradesh Dr.Murali Vallapureddy Reward management as motivational tool in various industries in Bangladesh: An empirical study Emon Kalyan Chowdhury, Rahima Begum Study of the Relationship between Capital Structure and Tax: Evidence from Iran Jamshid Mohammadzadeh Rostami, Zohreh Akbarpour Influence of Organizational Culture on Employee Work Behavior Olu Ojo

Welcome message from author
This document is posted to help you gain knowledge. Please leave a comment to let me know what you think about it! Share it to your friends and learn new things together.
Transcript
Copyright © 2012. Academy of Knowledge Process
International Journal of Contemporary Business Studies Vol: 3, No: 11. November, 2012 ISSN 2156-7506 Available online at http://www.akpinsight.webs.com
1
Copyright © 2012 IJCBS
ISSN 2156-7506
VOLUME 3 - NUMBER 11 - NOVEMBER, 2012
International Journal of Contemporary Business Studies
Academy of Knowledge Process
w w w . a k p i n s i g h t . w e b s . c o m
An International Journal Published by
In this Issue
Educational Facilities and School Dropout in Tribal Area: A District Level Analysis in Andhra Pradesh
Dr.Murali Vallapureddy
Reward management as motivational tool in various industries in Bangladesh: An empirical study
Emon Kalyan Chowdhury, Rahima Begum
Study of the Relationship between Capital Structure and Tax: Evidence from Iran
Jamshid Mohammadzadeh Rostami, Zohreh Akbarpour
Influence of Organizational Culture on Employee Work Behavior
Olu Ojo
Copyright © 2012. Academy of Knowledge Process
International Journal of Contemporary Business Studies Vol: 3, No: 11. November, 2012 ISSN 2156-7506 Available online at http://www.akpinsight.webs.com
2
One of the largest Research Databases of world Indexed in Proquest
Indexed in CABELL-USA
International journal of Contemporary Business Studies
-publish monthly (one volume per year) fast publication
-is open access to the full text
-has the editorial board & reviewers comprise of renowned scholars across the globe,
-has the quality policy includes indexing according to APA manual and its current status is international.
-is indexed & listed in:
Open Access Policy
This journal provides immediate open access to its content on the principle that making research freely available to the public supports a greater global exchange of knowledge.
Copyright © IJCBS To protect the copyright of the journal enable, IJCBS and the Publisher, authors must assign copyright in their manuscripts to IJCBS. Authors should make sure on submission that the article is original, is not under consideration for publication by another journal, has not previously been published elsewhere and that its content has not been anticipated by previous publication.
E n r i c h K n ow l e d g e t h r o u g h Q u a l i t y R e s e a r c h
w w w . a k p i n s i g h t . w e b s . c o m
Copyright © 2012. Academy of Knowledge Process
International Journal of Contemporary Business Studies Vol: 3, No: 11. November, 2012 ISSN 2156-7506 Available online at http://www.akpinsight.webs.com
3
Saddal H.A Editor-in-Chief
Editorial Board
w w w . a k p i n s i g h t . w e b s . c o m
International journal of Contemporary Business Studies A journal of Academy of Knowledge Process
E n r i c h K n ow l e d g e t h r o u g h Q u a l i t y R e s e a r c h
Copyright © 2012. Academy of Knowledge Process
International Journal of Contemporary Business Studies Vol: 3, No: 11. November, 2012 ISSN 2156-7506 Available online at http://www.akpinsight.webs.com
4
w w w . a k p i n s i g h t . w e b s . c o m
E n r i c h K n ow l e d g e t h r o u g h Q u a l i t y R e s e a r c h
DR.V.MAHALAKSHMI M.L,MBA,Ph.D 7A, CID Quarters, V.K.Iyer Road, Mandaveli
Copyright © 2012. Academy of Knowledge Process
International Journal of Contemporary Business Studies Vol: 3, No: 11. November, 2012 ISSN 2156-7506 Available online at http://www.akpinsight.webs.com
5
VOLUME 3, NUMBER 11 November, 2012
w w w . a k p i n s i g h t . w e b s . c o m
E n r i c h K n ow l e d g e t h r o u g h Q u a l i t y R e s e a r c h
Contents:
Educational Facilities and School Dropout in Tribal Area: A District Level Analysis in Andhra Pradesh Dr.Murali Vallapureddy…………………………………………………………………………….…06 Reward management as motivational tool in various industries in Bangladesh:An empirical study Emon Kalyan Chowdhury ,Rahima Begum……………………………………………………….22 Study of the Relationship between Capital Structure and Tax: Evidence from Iran Jamshid Mohammadzadeh Rostami , Zohreh Akbarpour………………………………..…..35 Influence of Organizational Culture on Employee Work Behavior Olu Ojo…………………………………………………………………………………………………..46
Copyright © 2012. Academy of Knowledge Process
International Journal of Contemporary Business Studies Vol: 3, No: 11. November, 2012 ISSN 2156-7506 Available online at http://www.akpinsight.webs.com
6
Educational Facilities and School Dropout in Tribal Area: A District Level Analysis in
Andhra Pradesh Dr.Murali Vallapureddy
Associate Professor, Mahboobia Panjetan PG College, Warangal, India
ABSTRACT
The present paper is an analysis of school drop-out in Tribal Areas in Andhra Pradesh based on both primary and secondary data at district level. Developing a very good infrastructure is a prerequisite of a good schooling system which will be make more attractive to students and help in increasing the enrolment in schools as well as improving the quality of education. The improvement in the economic status of poor families is the pre-condition for stopping dropouts in school. In the short run, the government may consider the policy option of enrolling all the children of poor families in the residential schools compulsorily. These residential schools should be run on professional excellence.
Key Words: School Dropout, School Enrolment,
INTRODUCTION Education is a key to sustainable development. For peace and stability within and among countries, and effective participation in the economy of the 21st century education is an indispensable means for which is witnessing rapid globalization. While traditionally “Education” has meant children in schools, it is equally important to address the learning needs of adults. Combining these two components of the learning continuum, most countries around the world have enlarged the scope of educational planning to include basic education and adult literacy under the rubric of “Education for All”.
As per the article 21A and 93rd Constitutional Amendments 2009, education has become a fundamental right. This article clearly spells out the responsibility of the state to the extent of providing free and compulsory education to all the children from the age of 6 to 14 years. Government is committed to achieve total literacy by 2015 and in this direction initiated several schemes for both quantitative and qualitative improvement.
Education has a pivotal role to guide and induce the person to the process of self realization. An educated person carries autonomous and authentic ideas and not one who has been conditioned or indoctrinated. Education is direction but in a fashion that does not estrange or alienate oneself but puts one on to the path of meaningful learning and realizing.
International Journal of Contemporary Business Studies Vol: 3, No: 11. November, 2012 pp.6-21 ©Academy of Knowledge Process
Copyright © 2012. Academy of Knowledge Process
International Journal of Contemporary Business Studies Vol: 3, No: 11. November, 2012 ISSN 2156-7506 Available online at http://www.akpinsight.webs.com
7
For educated person we make a positive value judgment. There is an expectation that education will improve the qualities of life of a person and will behave in a better manner than one who is not educated. There is a sense of being let down, disappointment and dismay if an educated person cannot conduct himself in a manner that is rational, morally good and socially responsible. It is clear that by education is meant all-round development of a person, not merely specialization or professional training. Educationists too stress that education is a holistic process and not only a training of the intellect. It is development of moral, social, aesthetic as well as rational capacity. People might differ on the degree of importance that they place on these various dimensions but most would include all these in their notion of an educated person.
Educational facilities definitely promote the prosperity of the society and contribute positively to gross domestic product and create employment opportunity. It has a positive effect on reduction of poverty, population growth, crime rate and better health condition.
The knowledge possessed by the population and their capacity and training to use it effectively is also very important. Expenditure on education, training and research can contribute to the productivity by raising the quality of the workforce, and these outlays yield a counting return in the future. If this expenditure is considered as expenditure on capital then the proportion of capital formation in national income in the rich countries would be much higher. But since poor countries do not make huge investments in the formation of human capital, this broad interpretation of capital would not increase significantly in proportion to their national income spent on capital formation.
While investment on human resources has been witnessing a high growth in advanced countries, the negligible amount of human investment in under developed countries has done little to extend the capacity of the people to meet the challenges of accelerated development. The characteristic of “economic backwardness” is still manifest in several ways like low labour efficiency, factor immobility, limited specialization in occupations and in trade, a deficient supply of entrepreneurship, and customary values and traditional social institutions that minimize the incentives for economic change. It has to be recognized that the wrong kind of education unaccompanied by the required complementary actions can check or reverse the process of development.
To mitigating the contemporary problems of developing countries particularly in India, for the efficient utilization of human resources, education continues to be a neglected part of planning of India. To attract the down trodden such as SCs/STs, minorities communities and women, it is essential to allocate more funds for the establishment, expansion and strengthening of educational facilities like appointment of teachers, infrastructure, equipment, drinking water, sanitation, compound wall, play ground, library etc. which are available to the rural masses. The existing edge of challenge is in rural schools. More than a century ago, Jyothi Rao Phule wrote in his moving appeal to the hunter commission (1984) that conditions in rural schools were terrible.
Government of India quantitatively forced a target of investing 6 per cent of national income on education on the recommendation of the Education Commission (1966) and the Kothari Commission also suggested that a higher (more than 6 per cent ) investment would need to be allocated on education in India(1986). But the goal remains elusive even today. This is one of the glaring promises that continue to remain a goal repeatedly postponed, unfulfilled and often reiterated. The present UPA Government in its Common Minimum Programme (CMP) has laid greatest emphasis on the development of social sectors to achieve a higher economic growth
Copyright © 2012. Academy of Knowledge Process
International Journal of Contemporary Business Studies Vol: 3, No: 11. November, 2012 ISSN 2156-7506 Available online at http://www.akpinsight.webs.com
8
along with social justice and particularly decided to incur more on education and it has to be done in a phased manner”.
The proportion of GNP invested on education in many other developing countries including India are very low as compared to other developed countries of the world. According to Human Development Report, 2004, India’s was ranks 78th out of 137 countries. India was spending 4.1 per cent of her GNP on education (1999-2001). In comparison, a large number of countries spend more than 6-8 per cent and some of them even more than 10 percent on education. Expenditure on education influencing literacy levels (Sharif and Ghosh 2000). The share of elementary education in the total expenditure on education continues to be below 50 per cent as against the required 65-70 per cent to achieve universal literacy.
Literacy Rates in India 1951-2011
In order to fulfill the constitutional obligation, India has lunched the programme of Sarva Shiksha Abhiyam to achieve Universalisation of Elementary Education in the country by the year 2010. It implies that all children in the age group 6 to below 14 years get enrolled in a regular school or an alternative school system and they do not drop out from school before completing the full cycle of elementary education. Efforts are being made on various fronts to ensure that no child in this age group remains out of school. The programme is an effort towards recognition of the need for improving the performance of the school system through a community owned approach and ensuring quality elementary education in a mission mode to all children which also seeks to bridge gender and social gaps.
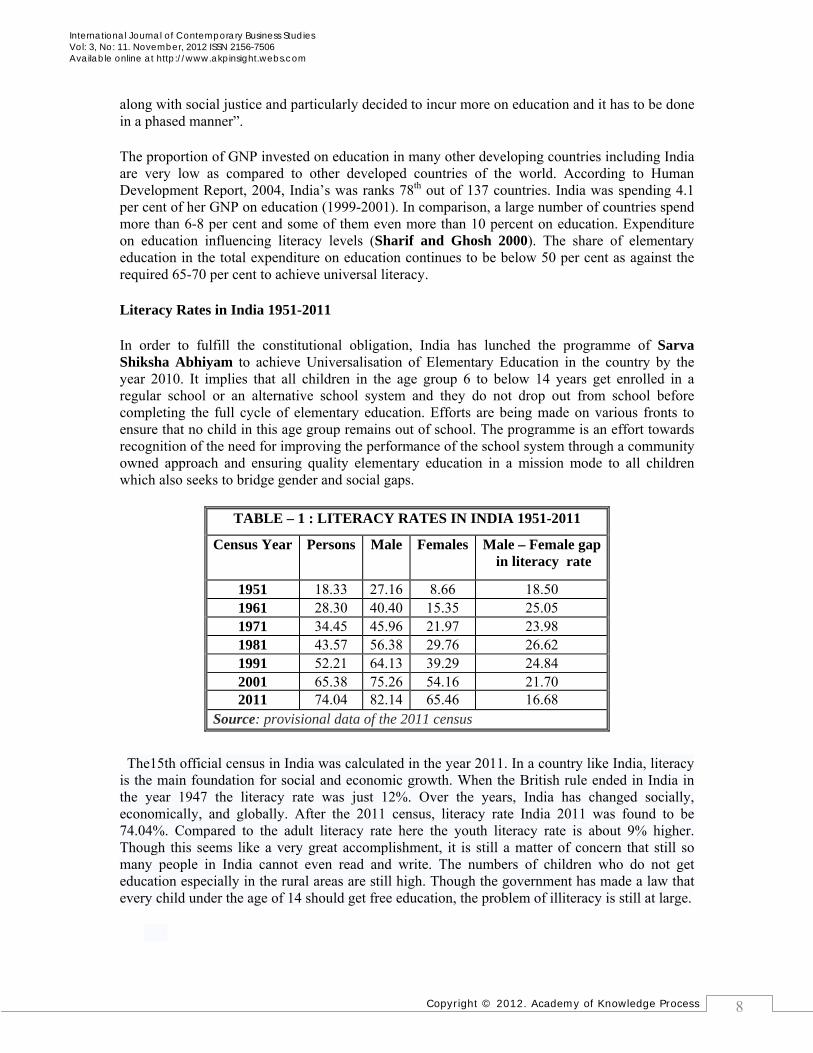
The15th official census in India was calculated in the year 2011. In a country like India, literacy is the main foundation for social and economic growth. When the British rule ended in India in the year 1947 the literacy rate was just 12%. Over the years, India has changed socially, economically, and globally. After the 2011 census, literacy rate India 2011 was found to be 74.04%. Compared to the adult literacy rate here the youth literacy rate is about 9% higher. Though this seems like a very great accomplishment, it is still a matter of concern that still so many people in India cannot even read and write. The numbers of children who do not get education especially in the rural areas are still high. Though the government has made a law that every child under the age of 14 should get free education, the problem of illiteracy is still at large.
TABLE – 1 : LITERACY RATES IN INDIA 1951-2011
Census Year Persons Male Females Male – Female gap in literacy rate
1951 18.33 27.16 8.66 18.50 1961 28.30 40.40 15.35 25.05 1971 34.45 45.96 21.97 23.98 1981 43.57 56.38 29.76 26.62 1991 52.21 64.13 39.29 24.84 2001 65.38 75.26 54.16 21.70 2011 74.04 82.14 65.46 16.68
Source: provisional data of the 2011 census
Copyright © 2012. Academy of Knowledge Process
International Journal of Contemporary Business Studies Vol: 3, No: 11. November, 2012 ISSN 2156-7506 Available online at http://www.akpinsight.webs.com
9
It is clear from the above Table-1 that from 1951 census to 2011 census the literacy rates have shown a substantial improvement. The literacy rate which was only 18.33 per cent in 1951 rose to 52.21 per cent in 1991 and further increased to 74.04.4 per cent in 2011. According to the Census of India, 2011 the literacy rate has gone up to 82.14 per cent for male and 65.46 per cent for females. Interestingly, literacy rate improved sharply among females as compared to males. While the effective literacy rate for males rose from 75.26 to 82.14 per cent marking a rise of 6.9 per cent, it increased by 11.8 per cent for females to go from 53.67 to 65.46 per cent.
Educational Status of Andhra Pradesh
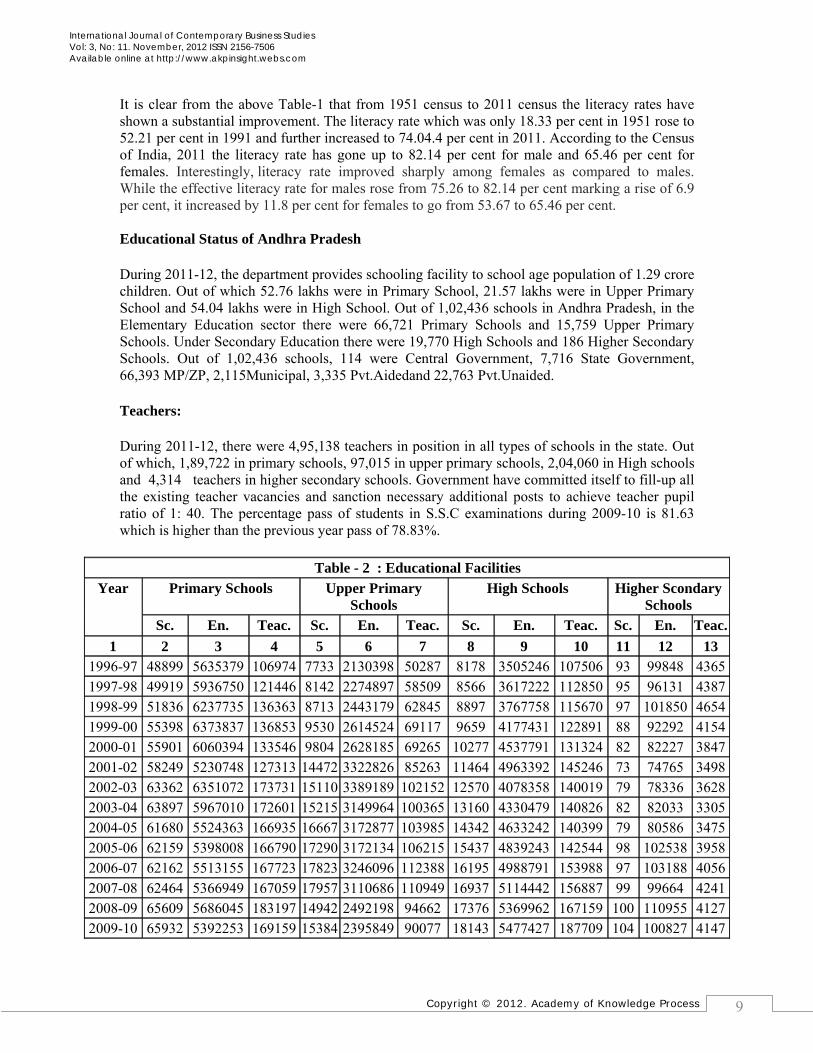
During 2011-12, the department provides schooling facility to school age population of 1.29 crore children. Out of which 52.76 lakhs were in Primary School, 21.57 lakhs were in Upper Primary School and 54.04 lakhs were in High School. Out of 1,02,436 schools in Andhra Pradesh, in the Elementary Education sector there were 66,721 Primary Schools and 15,759 Upper Primary Schools. Under Secondary Education there were 19,770 High Schools and 186 Higher Secondary Schools. Out of 1,02,436 schools, 114 were Central Government, 7,716 State Government, 66,393 MP/ZP, 2,115Municipal, 3,335 Pvt.Aidedand 22,763 Pvt.Unaided.
Teachers:
During 2011-12, there were 4,95,138 teachers in position in all types of schools in the state. Out of which, 1,89,722 in primary schools, 97,015 in upper primary schools, 2,04,060 in High schools and 4,314 teachers in higher secondary schools. Government have committed itself to fill-up all the existing teacher vacancies and sanction necessary additional posts to achieve teacher pupil ratio of 1: 40. The percentage pass of students in S.S.C examinations during 2009-10 is 81.63 which is higher than the previous year pass of 78.83%.
Table - 2 : Educational Facilities Year Primary Schools Upper Primary
Schools High Schools Higher Scondary
Schools Sc. En. Teac. Sc. En. Teac. Sc. En. Teac. Sc. En. Teac.
1 2 3 4 5 6 7 8 9 10 11 12 13 1996-97 48899 5635379 106974 7733 2130398 50287 8178 3505246 107506 93 99848 43651997-98 49919 5936750 121446 8142 2274897 58509 8566 3617222 112850 95 96131 43871998-99 51836 6237735 136363 8713 2443179 62845 8897 3767758 115670 97 101850 46541999-00 55398 6373837 136853 9530 2614524 69117 9659 4177431 122891 88 92292 41542000-01 55901 6060394 133546 9804 2628185 69265 10277 4537791 131324 82 82227 38472001-02 58249 5230748 127313 14472 3322826 85263 11464 4963392 145246 73 74765 34982002-03 63362 6351072 173731 15110 3389189 102152 12570 4078358 140019 79 78336 36282003-04 63897 5967010 172601 15215 3149964 100365 13160 4330479 140826 82 82033 33052004-05 61680 5524363 166935 16667 3172877 103985 14342 4633242 140399 79 80586 34752005-06 62159 5398008 166790 17290 3172134 106215 15437 4839243 142544 98 102538 39582006-07 62162 5513155 167723 17823 3246096 112388 16195 4988791 153988 97 103188 40562007-08 62464 5366949 167059 17957 3110686 110949 16937 5114442 156887 99 99664 42412008-09 65609 5686045 183197 14942 2492198 94662 17376 5369962 167159 100 110955 41272009-10 65932 5392253 169159 15384 2395849 90077 18143 5477427 187709 104 100827 4147
Copyright © 2012. Academy of Knowledge Process
International Journal of Contemporary Business Studies Vol: 3, No: 11. November, 2012 ISSN 2156-7506 Available online at http://www.akpinsight.webs.com
10
2010-11 66834 5463896 174069 15421 2329730 93003 18776 5397690 205179 173 126870 43042011-12 66721 5276876 189722 15759 2157321 97015 19770 5407778 204060 186 138863 4314Source: School Education Department, Note: Sc= No. of Schools; En.No = Enrolment; Teac. = Teachers
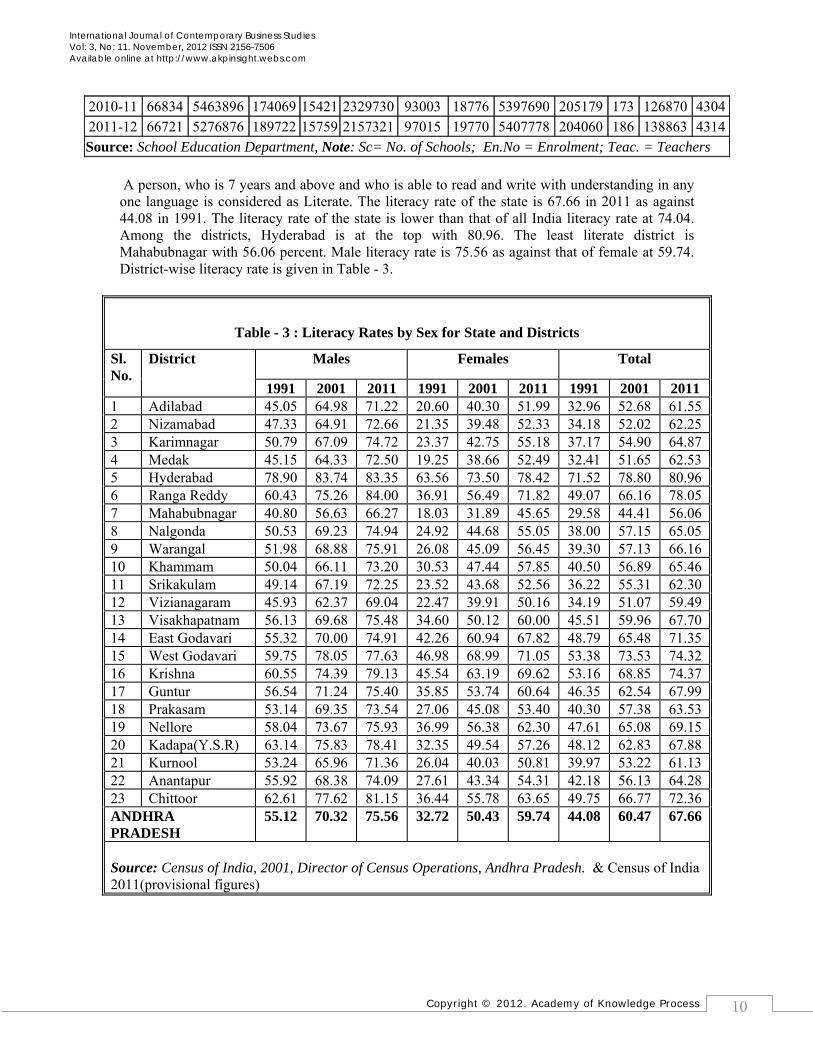
A person, who is 7 years and above and who is able to read and write with understanding in any one language is considered as Literate. The literacy rate of the state is 67.66 in 2011 as against 44.08 in 1991. The literacy rate of the state is lower than that of all India literacy rate at 74.04. Among the districts, Hyderabad is at the top with 80.96. The least literate district is Mahabubnagar with 56.06 percent. Male literacy rate is 75.56 as against that of female at 59.74. District-wise literacy rate is given in Table - 3.
Table - 3 : Literacy Rates by Sex for State and Districts
Sl. No.
District Males Females Total
1991 2001 2011 1991 2001 2011 1991 2001 2011 1 Adilabad 45.05 64.98 71.22 20.60 40.30 51.99 32.96 52.68 61.55 2 Nizamabad 47.33 64.91 72.66 21.35 39.48 52.33 34.18 52.02 62.25 3 Karimnagar 50.79 67.09 74.72 23.37 42.75 55.18 37.17 54.90 64.87 4 Medak 45.15 64.33 72.50 19.25 38.66 52.49 32.41 51.65 62.53 5 Hyderabad 78.90 83.74 83.35 63.56 73.50 78.42 71.52 78.80 80.96 6 Ranga Reddy 60.43 75.26 84.00 36.91 56.49 71.82 49.07 66.16 78.05 7 Mahabubnagar 40.80 56.63 66.27 18.03 31.89 45.65 29.58 44.41 56.06 8 Nalgonda 50.53 69.23 74.94 24.92 44.68 55.05 38.00 57.15 65.05 9 Warangal 51.98 68.88 75.91 26.08 45.09 56.45 39.30 57.13 66.16 10 Khammam 50.04 66.11 73.20 30.53 47.44 57.85 40.50 56.89 65.46 11 Srikakulam 49.14 67.19 72.25 23.52 43.68 52.56 36.22 55.31 62.30 12 Vizianagaram 45.93 62.37 69.04 22.47 39.91 50.16 34.19 51.07 59.49 13 Visakhapatnam 56.13 69.68 75.48 34.60 50.12 60.00 45.51 59.96 67.70 14 East Godavari 55.32 70.00 74.91 42.26 60.94 67.82 48.79 65.48 71.35 15 West Godavari 59.75 78.05 77.63 46.98 68.99 71.05 53.38 73.53 74.32 16 Krishna 60.55 74.39 79.13 45.54 63.19 69.62 53.16 68.85 74.37 17 Guntur 56.54 71.24 75.40 35.85 53.74 60.64 46.35 62.54 67.99 18 Prakasam 53.14 69.35 73.54 27.06 45.08 53.40 40.30 57.38 63.53 19 Nellore 58.04 73.67 75.93 36.99 56.38 62.30 47.61 65.08 69.15 20 Kadapa(Y.S.R) 63.14 75.83 78.41 32.35 49.54 57.26 48.12 62.83 67.88 21 Kurnool 53.24 65.96 71.36 26.04 40.03 50.81 39.97 53.22 61.13 22 Anantapur 55.92 68.38 74.09 27.61 43.34 54.31 42.18 56.13 64.28 23 Chittoor 62.61 77.62 81.15 36.44 55.78 63.65 49.75 66.77 72.36 ANDHRA PRADESH
55.12 70.32 75.56 32.72 50.43 59.74 44.08 60.47 67.66
Source: Census of India, 2001, Director of Census Operations, Andhra Pradesh. & Census of India 2011(provisional figures)

Copyright © 2012. Academy of Knowledge Process
International Journal of Contemporary Business Studies Vol: 3, No: 11. November, 2012 ISSN 2156-7506 Available online at http://www.akpinsight.webs.com
11
The Directorate of School Education deals with School Education catering to the educational needs of children. The pattern of School Education in Andhra Pradesh is 5+2+3 i.e., 5 years of Primary Education, 2 years of Upper Primary Education and 3 years of Secondary Education. Govt. of Andhra Pradesh intends to achieve the goal of universalisation of elementary education by recognizing education as a potential instrument for Human Development. The primary goal of the state is to increase steadily the overall literacy levels. Provision of schooling facilities within a distance of 1 km. of all rural habitations is a pre-requisite for achieving universal access. For this, Primary Schools are started in almost all places within a distance of 1 km. Teacher-Pupil Ratio
A major element of the approach to strengthening education will be to improve current learning levels by lowering the teacher pupil ratio. Government has already committed to fill-up all the existing teacher vacancies and sanctioning the additional posts necessary to achieve teacher-pupil ratio of 1:40. The Teacher Pupil Ratios for Primary, Upper Primary and High Schools are shown in Table- 4.
TABLE - 4 TEACHER PUPIL RATIOS
Year Primary Upper Primary High School
2000-01 45 38 34 2001-02 41 39 34 2002-03 37 33 29 2003-04 35 31 31 2004-05 29 25 30 2005-06 28 25 30 2006-07 29 24 29 2007-08 28 23 28 2008-09 27 22 29 2009-10 28 23 28
Source: School Education Department
Dropout Rates
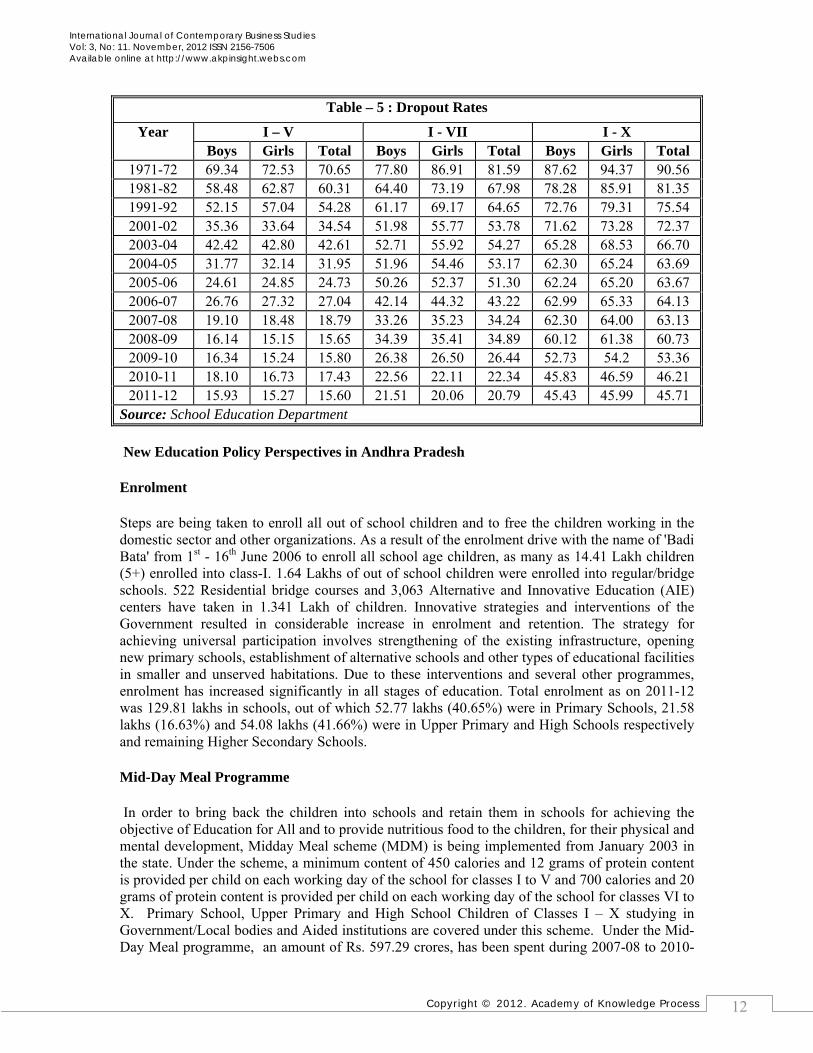
Dropout rate is defined as a percentage of the number of children to total enrolment dropping out of the educational system in a particular year. The ratio does not take into account repeaters and children who enter the system after class-I. It is expected that every child who enters class-1 completes class-VII without discontinuing the school in between. With this view, efforts are being made to tackle the problem of dropouts with the support of School Management Committees. The Dropout Rate during 2011-12 in Primary Stage (Classes I-V) is 15.60, in Upper Primary Stage (Classes I-VII) is 20.79 and in Secondary Schools is 45.71. Details of Dropout rates are shown in Table-5.
Copyright © 2012. Academy of Knowledge Process
International Journal of Contemporary Business Studies Vol: 3, No: 11. November, 2012 ISSN 2156-7506 Available online at http://www.akpinsight.webs.com
12
Table – 5 : Dropout Rates
Year I – V I - VII I - X Boys Girls Total Boys Girls Total Boys Girls Total
1971-72 69.34 72.53 70.65 77.80 86.91 81.59 87.62 94.37 90.56 1981-82 58.48 62.87 60.31 64.40 73.19 67.98 78.28 85.91 81.35 1991-92 52.15 57.04 54.28 61.17 69.17 64.65 72.76 79.31 75.54 2001-02 35.36 33.64 34.54 51.98 55.77 53.78 71.62 73.28 72.37 2003-04 42.42 42.80 42.61 52.71 55.92 54.27 65.28 68.53 66.70 2004-05 31.77 32.14 31.95 51.96 54.46 53.17 62.30 65.24 63.69 2005-06 24.61 24.85 24.73 50.26 52.37 51.30 62.24 65.20 63.67 2006-07 26.76 27.32 27.04 42.14 44.32 43.22 62.99 65.33 64.13 2007-08 19.10 18.48 18.79 33.26 35.23 34.24 62.30 64.00 63.13 2008-09 16.14 15.15 15.65 34.39 35.41 34.89 60.12 61.38 60.73 2009-10 16.34 15.24 15.80 26.38 26.50 26.44 52.73 54.2 53.36 2010-11 18.10 16.73 17.43 22.56 22.11 22.34 45.83 46.59 46.21 2011-12 15.93 15.27 15.60 21.51 20.06 20.79 45.43 45.99 45.71
Source: School Education Department New Education Policy Perspectives in Andhra Pradesh
Enrolment
Steps are being taken to enroll all out of school children and to free the children working in the domestic sector and other organizations. As a result of the enrolment drive with the name of 'Badi Bata' from 1st - 16th June 2006 to enroll all school age children, as many as 14.41 Lakh children (5+) enrolled into class-I. 1.64 Lakhs of out of school children were enrolled into regular/bridge schools. 522 Residential bridge courses and 3,063 Alternative and Innovative Education (AIE) centers have taken in 1.341 Lakh of children. Innovative strategies and interventions of the Government resulted in considerable increase in enrolment and retention. The strategy for achieving universal participation involves strengthening of the existing infrastructure, opening new primary schools, establishment of alternative schools and other types of educational facilities in smaller and unserved habitations. Due to these interventions and several other programmes, enrolment has increased significantly in all stages of education. Total enrolment as on 2011-12 was 129.81 lakhs in schools, out of which 52.77 lakhs (40.65%) were in Primary Schools, 21.58 lakhs (16.63%) and 54.08 lakhs (41.66%) were in Upper Primary and High Schools respectively and remaining Higher Secondary Schools.
Mid-Day Meal Programme
In order to bring back the children into schools and retain them in schools for achieving the objective of Education for All and to provide nutritious food to the children, for their physical and mental development, Midday Meal scheme (MDM) is being implemented from January 2003 in the state. Under the scheme, a minimum content of 450 calories and 12 grams of protein content is provided per child on each working day of the school for classes I to V and 700 calories and 20 grams of protein content is provided per child on each working day of the school for classes VI to X. Primary School, Upper Primary and High School Children of Classes I – X studying in Government/Local bodies and Aided institutions are covered under this scheme. Under the Mid-Day Meal programme, an amount of Rs. 597.29 crores, has been spent during 2007-08 to 2010-
Copyright © 2012. Academy of Knowledge Process
International Journal of Contemporary Business Studies Vol: 3, No: 11. November, 2012 ISSN 2156-7506 Available online at http://www.akpinsight.webs.com
13
11(Till Dec.2011). The amounts include the state contribution besides the Central allocation. Under the scheme, 60.33 lakh students during 2007-08, 70.44 lakh students during 2008-09, 70.43 lakh students during 2009-10 and 74.44 lakhs students during 2010-11 have been covered. Govt. of India is providing rice free of cost @ 100 grams per child per working day. Conversion cost is paid to the identified implementing agencies towards cooking cost.
Sarva Shiksha Abhiyan
Sarva Shiksha Abhiyan (SSA) is a comprehensive and integrated flagship programme of Government of India, to attain Universal Elementary Education (UEE) in the country in a mission mode. Launched in partnership with the State Governments and local self-governments, SSA aims to provide useful and relevant education to all the children in the 6-14 age groups by 2010. Under the SSA programme, an amount of Rs. 3134.68 crores was spent during the last four years 2007-08 to 2010-11(till Dec.2011). Under this scheme, during the 4-year period, 210 new school buildings have been constructed, 170 schools have been made operational. Further, several schools have been provided with adequate drinking water facility and toilet facility. Due to the 221infrastructure facilities and academic support, there has been improvement in enrolment as well as reducing drop out ratios.
Community Participation (School Management Committee)
For the first time in the country, Govt. of Andhra Pradesh has enacted “Community Participation Act 1998” involving the community in school management. Resources are transferred to School Committees empowering them to plan, manage and promote quality education. In terms of 73rd and 74th Constitutional Amendments, Sarpanches/Ward Councilors have been made the Chairpersons of the School Management Committees.
Vidya Volunteers
In view of the large number of representations received from School Management Committees seeking Government support to achieve Universalisation of Primary Education and duly taking into account the inadequate teacher pupil ratio, Government of Andhra Pradesh decided to support School Management Committees to provide “Vidya Volunteers”. Government decided to provide financial assistance on purely temporarily basis to School Management Committees to enlist Vidya Volunteers by them on contract basis. To improve the teacher pupil ratio in Primary Schools, Subject teachers in Upper Primary and High Schools for imparting the quality of education, 59,014 Vidya Volunteers were engaged during 2005-06 with an amount of Rs.263.13 Lakhs
Education for Minorities
Govt. of Andhra Pradesh is committed to the advancement and upliftment of Minorities in the state. With a view to promote Urdu Language in the state, 300 Urdu Teacher Posts were created additionally during 1997-98 are being continued every year. An amount of Rs.291.02 Lakhs is provided during 2006-07. Government is granting de-reservation in respect of Urdu Medium Posts year after year. Vacancies, which could not be filled in due to non-availability, carried forward for selection.
Copyright © 2012. Academy of Knowledge Process
International Journal of Contemporary Business Studies Vol: 3, No: 11. November, 2012 ISSN 2156-7506 Available online at http://www.akpinsight.webs.com
14
District Institute of Education and Training (DIET)
Govt. of Andhra Pradesh has upgraded 23 Teacher Training Institutes as District Institute of Education and Training and one Tribal Teachers Training Institute at Utnoor as Sub-DIET in a phased manner. In 13 DIETs, Urdu medium parallel sections are functioning and 65 lecturer posts have been sanctioned. The Tamil medium parallel section with intake of 50 is functioning at DIET, Chittoor at Karvetinagar.
Improvement of enrolment through various programs:
The Computer Education Programme is being implemented under BOOT Model by seven agencies in 5,000 High schools from 2008-09 for 5 years and in 1,300 high schools from 2010-11 for 5 years.
Tribal Education:
The tribal population of Andhra Pradesh according to 2001 Census is 50.24 lakhs constituting about 6.59% of the total population. Tribal Welfare Department is maintaining 599 Ashram Schools with a strength of 1,41,971, 442 Hostels with a strength of 77,420 and 4,317 Girijana Vidya Vikasa Kendras (Single Teacher Schools) renamed as Government Primary Schools (TW) with a strength of 1,01,852. 81% of students passed SSC exams held in March, 2010. 272 institutions are being run by Gurukulam (APTWREIS). 93% of students in TW Residential Schools passed in SSC Public Examinations held in March, 2010. The lands recognized under RoFR Act are proposed to be developed under ‘RoFR Land Development programme of MGNREGS’ thus providing wage employment to poor tribal farmers as well as giving them an opportunity to develop their own lands. In the first phase, 1.6 lakh acres are proposed to be fully developed at an estimated cost of Rs. 310.00 cr. Under Recognition of Forest Rights Act, 2006 (RoFR) a total of 3,30,143 claims were received to cover 19,65,741 acres, and 1,67,582 certificates of titles were issued to cover 14,44,049 acres so far.
The Scheduled areas extend over 31,485.34 sq.kms which is about 11% of total area of the State with 5,938 villages distributed in Srikakulam, Vizianagaram, Visakhapatnam, East Godavari, West Godavari, Khammam, Warangal, Adilabad and Mahabubnagar districts. There are no scheduled areas in other districts. There are 35 ST communities living in the State. Of the 50.24 lakhs tribal population, 30.47 lakhs are found in the above mentioned 9 districts. The remaining tribal population of 19.77 lakhs is distributed in the other districts. Areas inhabited by primitive tribal groups and remote areas of the ITDAs and MADAs are by and large lacking in necessary infrastructural facilities required for a minimum standard of living. The availability of infrastructure facilities in the tribal areas is far below the State and National averages.
The General Literacy rate is 60.5 as per 2001 Census, while the ST literacy is 37.04. Tribal Welfare Department was established in 1962 with an objective to assist the tribal population in the field of education, economic development and other programs. Tribal development did not get translated into a definite program of action till the 4th Plan period until the socio-economic development of STs was accepted as a general goal. The concept of tribal sub-plan strategy was evolved after a detailed comprehensive review of the tribal problem was taken during V Five Year Plan. For implementation of the strategy, Integrated Tribal Development Agencies (ITDAs) were conceived. During VI Five Year Plan, Modified Area Development Approach (MADA) was adopted to cover smaller areas of tribal concentration and for still smaller areas the cluster
Copyright © 2012. Academy of Knowledge Process
International Journal of Contemporary Business Studies Vol: 3, No: 11. November, 2012 ISSN 2156-7506 Available online at http://www.akpinsight.webs.com
15
approach was adopted. Now there are 41 MADA Pockets and 17 Clusters. During VII Five Year Plan the programs were extended to Dispersed Tribal Groups (DTGs) also.
By the end of IX Plan, the Program priorities of Tribal Welfare Department are provision of incentives to students by way of free boarding and lodging for hostellers and package of incentives like supply of text books, note books, dresses etc. For the first time, 82 Primary Health Centers were sanctioned during 2004 exclusively for tribal areas to improve access to primary health care. All efforts are being made to ensure that all the tribal habitations are provided with safe drinking water. Government accorded high priority for the accelerated development of tribals by implementing socio economic development programs. Major focus is on Education, Health and Land based schemes.
Significance of the study:
In Andhra Pradesh introduced many programmes like Sarva Shiksha Abhiyan, Mid-day Meal programme, Community Participation, Vidhya Volunteers etc., to improvement of enroll all out of school children and to free the children working in the domestic sector and other organizations. To provide minimum basic facilities to schools such as construction of school building, providing accommodation, furniture, library and lab equipment etc., various schemes have been taken up. In spite of the government taking up these various activities the drop out rate has not reduced as per expectations. This studies aspects in Warangal district of Andhra Pradesh.
Methodology
The data for this study were collected from both primary and secondary sources. Primary data were collected for studying causes for dropouts. The secondary data consists of enrollment of students in the district statistics records; causes for dropouts have been analysed by direct interview method with coverage of 78 respondents i.e., teachers, parents and students of Warangal district of Telangana region in Andhra Pradesh, India.
Objectives
• To study the educational facilities available in the sample area • To explore the accessibility of educational facilities to Schedule Tribes and women population. • To find out the problems in getting proper educational services in govt. and private schools. • To examine reasons for the dropouts in the study area. • To suggest some policy measures to achieve the targeted literacy levels in rural areas.
Profile of the Study Area
Warangal, which is one of the ten districts in the Telangana Region of Andhra Pradesh, is considered next to Hyderabad with economic, social education importance. There is a historical significance for Warangal town, served as the seat of power of the Yadava kings in the 8th Century AD and Kakatiya rulers from the 12th century AD onwards. Warangal then came under the influence of first of the Qutubshahi dynasty of Golkonda and then the Nizam of Hyderabad. While the resurgence of Warangal can be traced to the beginning of the 'Modern Age', the last decade has witnessed rapid acceleration of economic growth.
Copyright © 2012. Academy of Knowledge Process
International Journal of Contemporary Business Studies Vol: 3, No: 11. November, 2012 ISSN 2156-7506 Available online at http://www.akpinsight.webs.com
16
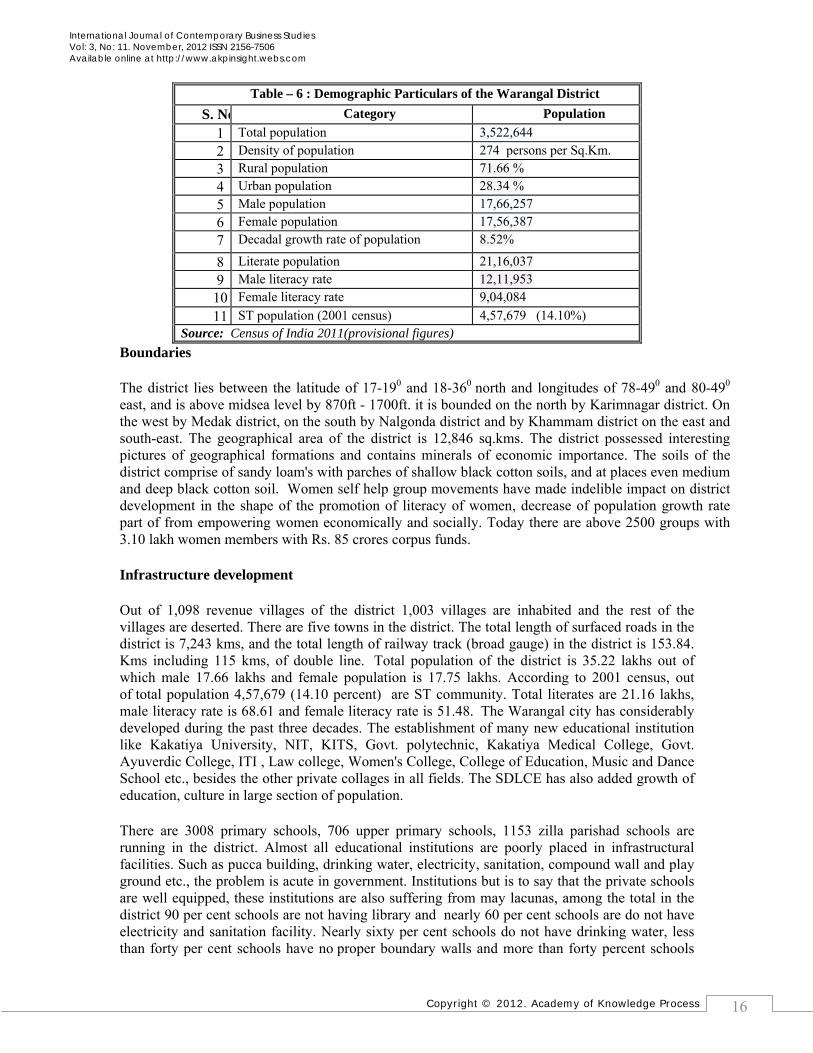
Boundaries
The district lies between the latitude of 17-190 and 18-360 north and longitudes of 78-490 and 80-490 east, and is above midsea level by 870ft - 1700ft. it is bounded on the north by Karimnagar district. On the west by Medak district, on the south by Nalgonda district and by Khammam district on the east and south-east. The geographical area of the district is 12,846 sq.kms. The district possessed interesting pictures of geographical formations and contains minerals of economic importance. The soils of the district comprise of sandy loam's with parches of shallow black cotton soils, and at places even medium and deep black cotton soil. Women self help group movements have made indelible impact on district development in the shape of the promotion of literacy of women, decrease of population growth rate part of from empowering women economically and socially. Today there are above 2500 groups with 3.10 lakh women members with Rs. 85 crores corpus funds.
Infrastructure development
Out of 1,098 revenue villages of the district 1,003 villages are inhabited and the rest of the villages are deserted. There are five towns in the district. The total length of surfaced roads in the district is 7,243 kms, and the total length of railway track (broad gauge) in the district is 153.84. Kms including 115 kms, of double line. Total population of the district is 35.22 lakhs out of which male 17.66 lakhs and female population is 17.75 lakhs. According to 2001 census, out of total population 4,57,679 (14.10 percent) are ST community. Total literates are 21.16 lakhs, male literacy rate is 68.61 and female literacy rate is 51.48. The Warangal city has considerably developed during the past three decades. The establishment of many new educational institution like Kakatiya University, NIT, KITS, Govt. polytechnic, Kakatiya Medical College, Govt. Ayuverdic College, ITI , Law college, Women's College, College of Education, Music and Dance School etc., besides the other private collages in all fields. The SDLCE has also added growth of education, culture in large section of population.
There are 3008 primary schools, 706 upper primary schools, 1153 zilla parishad schools are running in the district. Almost all educational institutions are poorly placed in infrastructural facilities. Such as pucca building, drinking water, electricity, sanitation, compound wall and play ground etc., the problem is acute in government. Institutions but is to say that the private schools are well equipped, these institutions are also suffering from may lacunas, among the total in the district 90 per cent schools are not having library and nearly 60 per cent schools are do not have electricity and sanitation facility. Nearly sixty per cent schools do not have drinking water, less than forty per cent schools have no proper boundary walls and more than forty percent schools
Table – 6 : Demographic Particulars of the Warangal District S. No Category Population
1 Total population 3,522,644 2 Density of population 274 persons per Sq.Km. 3 Rural population 71.66 % 4 Urban population 28.34 % 5 Male population 17,66,257 6 Female population 17,56,387 7 Decadal growth rate of population 8.52%
8 Literate population 21,16,037 9 Male literacy rate 12,11,953
10 Female literacy rate 9,04,084 11 ST population (2001 census) 4,57,679 (14.10%)
Source: Census of India 2011(provisional figures)
Copyright © 2012. Academy of Knowledge Process
International Journal of Contemporary Business Studies Vol: 3, No: 11. November, 2012 ISSN 2156-7506 Available online at http://www.akpinsight.webs.com
17
have no play ground. Even today we can find that classes are running under shade of the threes here and there in the district.
As far as quality aspects of school education is considered in general and particularly in this district much has to be done to improve the quality of education. The poor infrastructure facilities will have a direct bearence on the qualitative output from the schools. When the learning atmosphere is not conducive to the students it gives ample scope for dropouts at various stages. It is high among the backward class community with 45-55 percent.. There is 52.56 per cent dropout found in the scheduled caste children. This has to be checked toughly to realize the dream universal education the government with the cooperation of NGOs, local philanthropists and elderly person establish working communities to mobilize funds to strengthen infrastructural facilities and to monitor the academic activity, proper accountability has to be fixed at various levels to the teachers and heads of the institutions to maintain and upgrade the standard of the institutions and to prepare the students in such a manner to face the emerging challenges of new socio-economic environment .
Education has become even more important today than before. An illiterate and low quality educated person cannot participate in the new knowledge based society driven by information technology. His /her exclusion will be total. Thus there is every need to bring about total literacy and to and process of learning at various levels and particularly in schools educations is should be made more qualitative such process should not confine only to the town a cities but should reach the rural neglected lot.
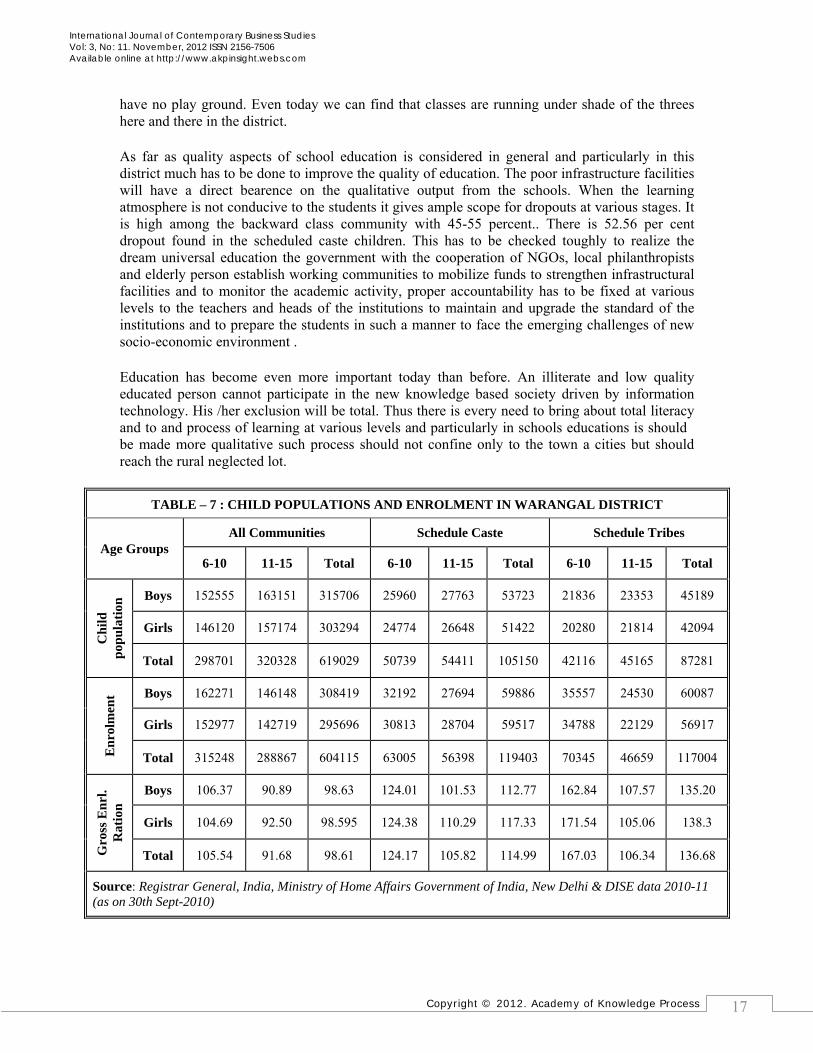
TABLE – 7 : CHILD POPULATIONS AND ENROLMENT IN WARANGAL DISTRICT
Age Groups All Communities Schedule Caste Schedule Tribes
6-10 11-15 Total 6-10 11-15 Total 6-10 11-15 Total
Chi
ld
popu
latio
n Boys 152555 163151 315706 25960 27763 53723 21836 23353 45189
Girls 146120 157174 303294 24774 26648 51422 20280 21814 42094
Total 298701 320328 619029 50739 54411 105150 42116 45165 87281
Enr
olm
ent Boys 162271 146148 308419 32192 27694 59886 35557 24530 60087
Girls 152977 142719 295696 30813 28704 59517 34788 22129 56917
Total 315248 288867 604115 63005 56398 119403 70345 46659 117004
Gro
ss E
nrl.
Rat
ion
Boys 106.37 90.89 98.63 124.01 101.53 112.77 162.84 107.57 135.20
Girls 104.69 92.50 98.595 124.38 110.29 117.33 171.54 105.06 138.3
Total 105.54 91.68 98.61 124.17 105.82 114.99 167.03 106.34 136.68
Source: Registrar General, India, Ministry of Home Affairs Government of India, New Delhi & DISE data 2010-11 (as on 30th Sept-2010)
Copyright © 2012. Academy of Knowledge Process
International Journal of Contemporary Business Studies Vol: 3, No: 11. November, 2012 ISSN 2156-7506 Available online at http://www.akpinsight.webs.com
18
An analysis of Table - 7 reveals that total child population of the Warangal district. Out of 6, 19,029 child populations in Warangal district, a majority of the child population 51.00 per cent are boys and 49.00 per cent girls. 16.98 per cent i.e., 1,05,1506 are Scheduled Caste (SC), 14.09 per cent i.e, 87,281 are Scheduled Tribe (ST) and remaining other communities. The ST and SC child population are almost equal. The observation showed that ST boys are higher compared to SC community. It is interesting to note that, out of total child population more than 51.75 per cent belong to 11-15 age group and less than 28.25 per cent belong to 6-10 age group.
The total enrolment students i.e., 6, 04,115, a majority of the children age group belong to 6-10 years and remaining were 11-15 age group. It is interesting to note that in Schedule Tribes total enrolment students i.e, 1,17,004 of which 60.12 per cent were belong to 6-10 age group in which 35,557 students are boys and 34,788 are girls remaining 59.88 per cent are belong to 11-15 age group in which 24,530 are boys and 22,129 are girls.
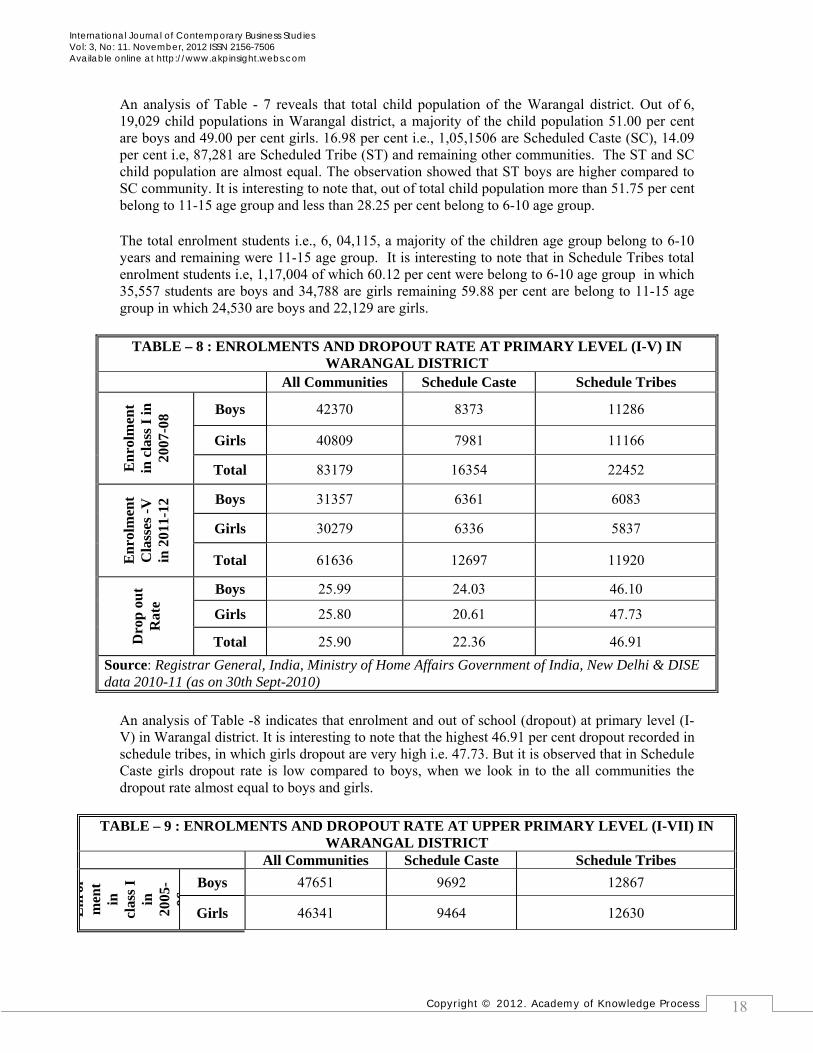
TABLE – 8 : ENROLMENTS AND DROPOUT RATE AT PRIMARY LEVEL (I-V) IN WARANGAL DISTRICT
All Communities Schedule Caste Schedule Tribes
Enr
olm
ent
in c
lass
I in
20
07-0
8 Boys 42370 8373 11286
Girls 40809 7981 11166
Total 83179 16354 22452
Enr
olm
ent
Cla
sses
-V
in 2
011-
12 Boys 31357 6361 6083
Girls 30279 6336 5837
Total 61636 12697 11920
Dro
p ou
t R
ate
Boys 25.99 24.03 46.10
Girls 25.80 20.61 47.73
Total 25.90 22.36 46.91 Source: Registrar General, India, Ministry of Home Affairs Government of India, New Delhi & DISE data 2010-11 (as on 30th Sept-2010)
An analysis of Table -8 indicates that enrolment and out of school (dropout) at primary level (I-V) in Warangal district. It is interesting to note that the highest 46.91 per cent dropout recorded in schedule tribes, in which girls dropout are very high i.e. 47.73. But it is observed that in Schedule Caste girls dropout rate is low compared to boys, when we look in to the all communities the dropout rate almost equal to boys and girls.
TABLE – 9 : ENROLMENTS AND DROPOUT RATE AT UPPER PRIMARY LEVEL (I-VII) IN WARANGAL DISTRICT
All Communities Schedule Caste Schedule Tribes
Enr
olm
ent
in
clas
s I
in
2005
-06
Boys 47651 9692 12867
Girls 46341 9464 12630
Copyright © 2012. Academy of Knowledge Process
International Journal of Contemporary Business Studies Vol: 3, No: 11. November, 2012 ISSN 2156-7506 Available online at http://www.akpinsight.webs.com
19
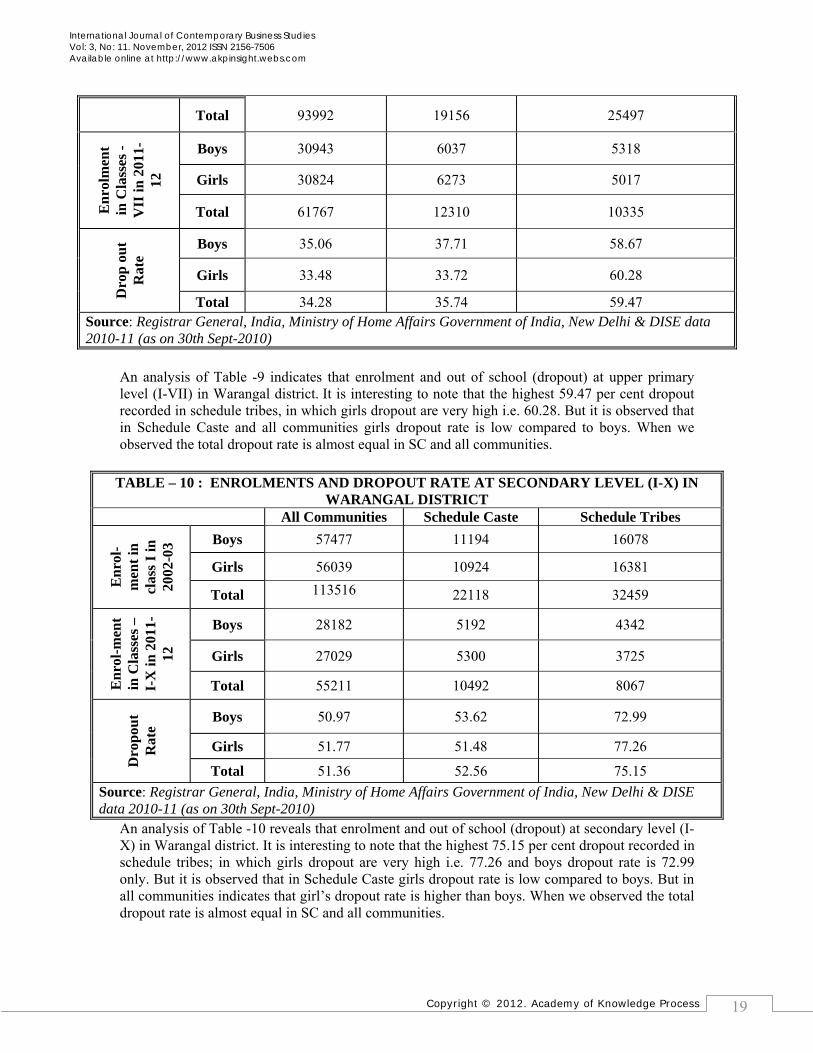
Total 93992 19156 25497 E
nrol
men
t in
Cla
sses
-V
II in
201
1-12
Boys 30943 6037 5318
Girls 30824 6273 5017
Total 61767 12310 10335
Dro
p ou
t R
ate
Boys 35.06 37.71 58.67
Girls 33.48 33.72 60.28
Total 34.28 35.74 59.47 Source: Registrar General, India, Ministry of Home Affairs Government of India, New Delhi & DISE data 2010-11 (as on 30th Sept-2010)
An analysis of Table -9 indicates that enrolment and out of school (dropout) at upper primary level (I-VII) in Warangal district. It is interesting to note that the highest 59.47 per cent dropout recorded in schedule tribes, in which girls dropout are very high i.e. 60.28. But it is observed that in Schedule Caste and all communities girls dropout rate is low compared to boys. When we observed the total dropout rate is almost equal in SC and all communities.
TABLE – 10 : ENROLMENTS AND DROPOUT RATE AT SECONDARY LEVEL (I-X) IN WARANGAL DISTRICT
All Communities Schedule Caste Schedule Tribes
Enr
ol-
men
t in
clas
s I in
20
02-0
3 Boys 57477 11194 16078
Girls 56039 10924 16381
Total 113516 22118 32459
Enr
ol-m
ent
in C
lass
es –
I-X
in 2
011-
12
Boys 28182 5192 4342
Girls 27029 5300 3725
Total 55211 10492 8067
Dro
pout
R
ate
Boys 50.97 53.62 72.99
Girls 51.77 51.48 77.26
Total 51.36 52.56 75.15 Source: Registrar General, India, Ministry of Home Affairs Government of India, New Delhi & DISE data 2010-11 (as on 30th Sept-2010)
An analysis of Table -10 reveals that enrolment and out of school (dropout) at secondary level (I-X) in Warangal district. It is interesting to note that the highest 75.15 per cent dropout recorded in schedule tribes; in which girls dropout are very high i.e. 77.26 and boys dropout rate is 72.99 only. But it is observed that in Schedule Caste girls dropout rate is low compared to boys. But in all communities indicates that girl’s dropout rate is higher than boys. When we observed the total dropout rate is almost equal in SC and all communities.
Copyright © 2012. Academy of Knowledge Process
International Journal of Contemporary Business Studies Vol: 3, No: 11. November, 2012 ISSN 2156-7506 Available online at http://www.akpinsight.webs.com
20
Reasons for Dropouts:
The preceding analysis shows the existence of high dropout rates at schools in Andhra Pradesh. In order to understand the causes for dropouts and non-enrollment of children and also to identify the socio-economic barriers at the primary and secondary education a sample survey of 60 respondents i.e., teachers, parents and students was undertaken to elicit their opinion on the causes for dropouts in study area. Since local teacher's posses greater knowledge about the children, their parents and also about the local problems, we had selected then purposefully. The sample area also selected purposively representing different situations. This district represents urban and tribal conditions and presents a situation with low dropout rates. As may as 78 respondents were randomly selected from this district. The sample is drawn from aided, unaided, government and private school teachers giving weightage to the experience and / or service of the teachers concerned, place of work etc., dropout students and parents the opinions of these 60 respondents are tabulated and their views are presented below.
• Educational background of the parents • Poor economic conditions of the family : • Excessive involvement of children in domestic work: • Negligence of parents : • Caste factor • Frequent shifting of the families, for seasonal work, from one place to other place for
seeking livelihood, may also influence the dropout rate. • Due to ill health, like incidence of malaria fever, some of the student's dropout from the
schools. • According to the teachers some of the students discontinued their studies due to lack of
hostel facilities. • Child marriages are also infecting the dropout rate.
Conclusion and Suggestions The above analysis envisages that education is one of the most important social indicators, which are directly linked with economic development. To increase the literacy levels in India in general and AP in particular, the state should concentrate on retention rather than enrolment especially schedule caste and schedule tribe communities to reduce social disparities. In addition to universal facilities, universal enrolment and universal retention, the availability of a universally high quality of teaching and learning should also be provided. Further, investment in education at all India level needs to be more than doubled from the present level 3.1 per cent of the GDP.
As a whole, the highest dropout rate is recorded in the tribal community, As per the opinions elicited from the local teachers literacy levels of parents and poor economic conditions of the families are found to be the major reasons for dropouts. Excessive involvement of children in domestic work, household chores, etc., and negligence of parents towards early marriages of girls children are the other causes for the higher dropout rates. The policy implication of this study is obviously that the improvement in the economic status of poor families is the pre-condition far stopping dropouts. In the short run, the government may consider the policy option of enrolling all the children of poor families in the residential schools compulsorily. These residential schools should be run on professional excellence.
Developing a very good infrastructure is a prerequisite of a good schooling system. This will make more attractive to students (Schools should be such were students like to spend more time instead of running away from it. Good infrastructure helps in making schools more interesting)
Copyright © 2012. Academy of Knowledge Process
International Journal of Contemporary Business Studies Vol: 3, No: 11. November, 2012 ISSN 2156-7506 Available online at http://www.akpinsight.webs.com
21
which will help in increasing the enrolment in schools as well as improving the quality of education (Good infrastructure facilities like a well equipped computer laboratory with internet connection will help enormously in improving the quality of education)
References:
Banerji, R. (2000), “Poverty and Primary Schooling: Field Studies from Mumbai and Delhi, Economic and Political Weekly, March.
Hanushek, E. A. (2000). Schooling, Labour Force Quality and Growth of Nations. The American Economic Review, 90(5), 1184-1208.
Murali V, et. al,(2005), “Educational opportunities in a village economy - a micro level study”, published in AP Economic Association XXIII Annual Conference Volume, 2005
Murali V (2010) : “School Dropout and Educational Facilities – A District Level Analysis in AP” in South Indian Journal of Social Science, Vol. VIII No.1 June, PP.39-55.
Sury, M. M. (2004), Indian Economy in the 21st century, New Century Publications, New Delhi. Tilak, Jandhya B.G(2004), “Education in the UPA Government Common Minimum
Programme, Economic and Political Weekly, 23rd Oct, 2004. ----------- (1996), “How Free is 'Free' Primary Education in India?, Economic and Political
Weekly, Part-1 and Part-2(31), 257-282 and 355-366. Rao, D. P, (2005), “Dropouts in primary education in east Godavari district of Andhra Pradesh -
mandal level analysis”, published in AP Economic Association XXIII Annual Conference Volume, 2005.
Census reports, Director of Census Operations, Andhra Pradesh reports, various year School Education Department reports 2011-12 Economic Survey of India, 2011 Outcome Budget 2009-10, Department of Tribal Welfare, Andhra Pradesh. Also available online
at http://www.aptribes.gov.in/ Performance Appraisal System of Tribal Welfare, Andhra Pradesh, January, 2003 Performance Appraisal System, Tribal Welfare Department, Andhra Pradesh: Guidelines for
Preparation of Action Plans, January, 2002 Performance Appraisal System, Tribal Welfare Department, Andhra Pradesh: Guidelines for
Preparation of Department Action Plans at Unit Level, January, 2002
Copyright © 2012. Academy of Knowledge Process
International Journal of Contemporary Business Studies Vol: 3, No: 11. November, 2012 ISSN 2156-7506 Available online at http://www.akpinsight.webs.com
22
Reward management as motivational tool in various industries in Bangladesh:
An empirical study
Emon Kalyan Chowdhury Lecturer, Department of Accounting,
Faculty of Business Studies, Premier University
Rahima Begum Lecturer, Faculty of Business Studies,
Department of Management, Premier University
ABSTRACT
This research deals with the study on reward management as motivational tool in various industries in Bangladesh. The primary data has been collected from employees working in different industries having zero to thirty years of professional experience through survey method. The objective is to find the relative strength of the monetary and non- monetary rewards being offered with respect to motivation of the employees in the various organizations and to understand the employee perspective about rewards. And after analyzing the data collected from the respondents appropriate recommendations have been made to determine a package of monetary and non-monetary rewards to help in increasing employee motivation. Keywords: Reward system, Performance, Motivation, Recognition.
INRODUCTION An employee reward system consists of organizations integrated policies, processes and practices for rewarding its employees in accordance with their contribution, skill and competence and their market worth. It is developed within the framework of an organization’s reward philosophy, strategies and policies, and contains arrangements in the form of processes, practices, structures and procedures which will provide and maintain appropriate types and levels of pay, benefits and other forms of reward (Armstrong M, 2000). Any reward system consists of financial rewards (fixed and variable pay) and employee benefits, which together comprise total remuneration. The
reward system also incorporates non-financial rewards (recognition, praise, achievement responsibility and personal growth). From the organization’s point of view, the aim of employee reward are to communicate organization’s values, performance, standards and expectations and encourage behavior that will contribute to the achievement of the organization’s objective. The basic questions to be answered when developing reward systems are “What kind of rewards do employees actually get motivated to work better?” and ‘What sort of behavior do we want?’ and ‘How can reward processes promote that behavior?’ and ‘No reward initiative should be undertaken unless it has been established that it will add value, and no reward practice should be retained if it does not result in added value. From the employees’ point of
International Journal of Contemporary Business Studies Vol: 3, No: 11. November, 2012 pp.22-34 ©Academy of Knowledge Process
Copyright © 2012. Academy of Knowledge Process
International Journal of Contemporary Business Studies Vol: 3, No: 11. November, 2012 ISSN 2156-7506 Available online at http://www.akpinsight.webs.com
23
view the reward system should treat them as stakeholders who have the right to be involved in the development of the reward policies that affect them, meet their expectations that they will be treated equitably, fairly, and consistently more over they have to be transparent. They should know what the reward policies of the organization are and how they are affected by them. Conceptual frame work of reward management: 1. Reward management: Procedures, rules, and standards associated with allocation of
benefits and compensation to employees. It is developed within the framework of the organizations reward philosophy, strategies and policies, and contains arrangements in the form of processes, practices, structure and procedures which will provide and maintain appropriate types and levels of pay, benefits and other forms of reward (Nelson, B, "1001 Ways to Reward Employees", 2004).
The elements of employee reward: a. Basic pay: Basic pay is the level of pay (the fixed salary or wage) that constitutes the rate
for the job. b. Additions to base pay: Additional financial rewards may be provided that are related to
performance, skill, competence or experience. Special allowances may also be paid. c. Individual performance -related pay in which increase in base pay or cash bonuses are
determined by performance assessment and ratings. d. Bonuses - rewards for successful performance which are paid as lump sums related to
the results obtained by individuals, teams or the organization. e. Incentives - payments linked with the achievement of previously set targets which are
designed to motivate people to achieve higher levels of performance f. Commission - a special form of incentive in which sales representatives are paid on the
basis of a percentage of the sales value they generate g. Service -related pay which increases by fixed increments on a scale or pay spine
depending on service in the job. There may sometimes be scope for varying the rate of progress up the scale according to performance.
h. Skill - based pay (sometimes called knowledge based pay) which varies according to the level of skill the individual achieves
i. Competence - related pay which varies according to the level of competence achieved by the individual.
j. Career - development pay which rewards people for taking on additional responsibilities as their career develops laterally within a broad grade (a broad branded pay structure)
k. Allowances - elements of pay in the form of a separate sum of money for such aspects of employment as overtime, shift working, call-outs and living in other large cities.
l. Total earnings are calculated as the sum of the base pay and any additional payments. m. Employee benefits, also known as indirect pay, include pension, sick pay, insurance
cover and company cars. They comprise elements of remuneration additional to the various forms of cash pay and also include provisions for employees that are not strictly remuneration, such as annual holidays.
n. Total remuneration is the value of all cash payments (total earnings) and benefits received by employees.
Performance based pay as a tool for motivation: It is an effective element of compensation strategy. It is a quick-fix solution for many organizational issues ranging from poor productivity to below par performance. It is a tool to drive performance through increased motivation and creating a direct linkage between employee performance and rewards. It is also used a powerful tool to attract
Copyright © 2012. Academy of Knowledge Process
International Journal of Contemporary Business Studies Vol: 3, No: 11. November, 2012 ISSN 2156-7506 Available online at http://www.akpinsight.webs.com
24
retain, recognize and reward best talent i.e., high performing employees (Suri GK et., “Rethinking incentives and reward management 2003). This system has four elements:
1. Base pay matched close to competition, according to the company’s ability to pay and attract quality talent. Base pay serves as a platform for variable pay 2. Variable pay is the centerpiece of the total compensation approach. 3. Methods include gain sharing; win sharing, lump-sum bonuses, individual variable pay and so forth. It is flexible and links the future of the firm and employees in a positive manner. 4. Indirect pay adds cost-effective benefits keyed to supporting the goals of the company and sharing costs.
Impact of reward on the performance: Research suggests that the positive consequences or rewards, whether they be internal, external, tangible, or intangible, are most effective when they occur immediately following the specific action being rewarded and when the reward occurs at a high frequency. In other words, small awards received immediately and frequently seem to have more effect on performance than larger rewards delivered long after performance and infrequently. The only reward managers’ control that meets these high-frequency requirements is the manager's specific verbal compliments about performance. These compliments can be delivered at a high frequency, immediately following performance, and are very inexpensive. "Significant other" is a clinical term used to identify the relative importance of one person in another person's life. Acceptance or rejection of a person from the significant other has a lot more value than the same response from anyone else. So the verbal or e-mail compliments about performance do influence performance. Analysis of the work environment reveals that employees' rewards come from only three sources: the work itself, fellow employees, and the boss. (Source: navis.gr) Objectives:
1. To find the relative strength of the monetary and non- monetary rewards being offered with respect to motivation of the employees in different organizations.
2. To understand the employee perspective about rewards. 3. To make appropriate recommendations to determine a package of monetary and non-
monetary rewards to help in increasing employee motivation. Hypothesis H� = reward does not influence the motivation of employees. H₁ = reward influences the motivation of employees.
METHODOLOGY: Sample size: 300 corporate respondents from different organizations. Sample description: Face to face interview and questionnaire to collect information Tools used: Percentage analysis Software: SPSS, MS Excel Sources of data: Construction companies, Commercial banks, RMG, Manufacturing Concerns, Stock exchange, MNCs, Private Universities, Steel companies, NGOs, etc. Limitations:
I. The research investigation is confined to limited sources. II. The response could be subjected to prejudice/bias/reticence of the respondents.
Copyright © 2012. Academy of Knowledge Process
International Journal of Contemporary Business Studies Vol: 3, No: 11. November, 2012 ISSN 2156-7506 Available online at http://www.akpinsight.webs.com
25
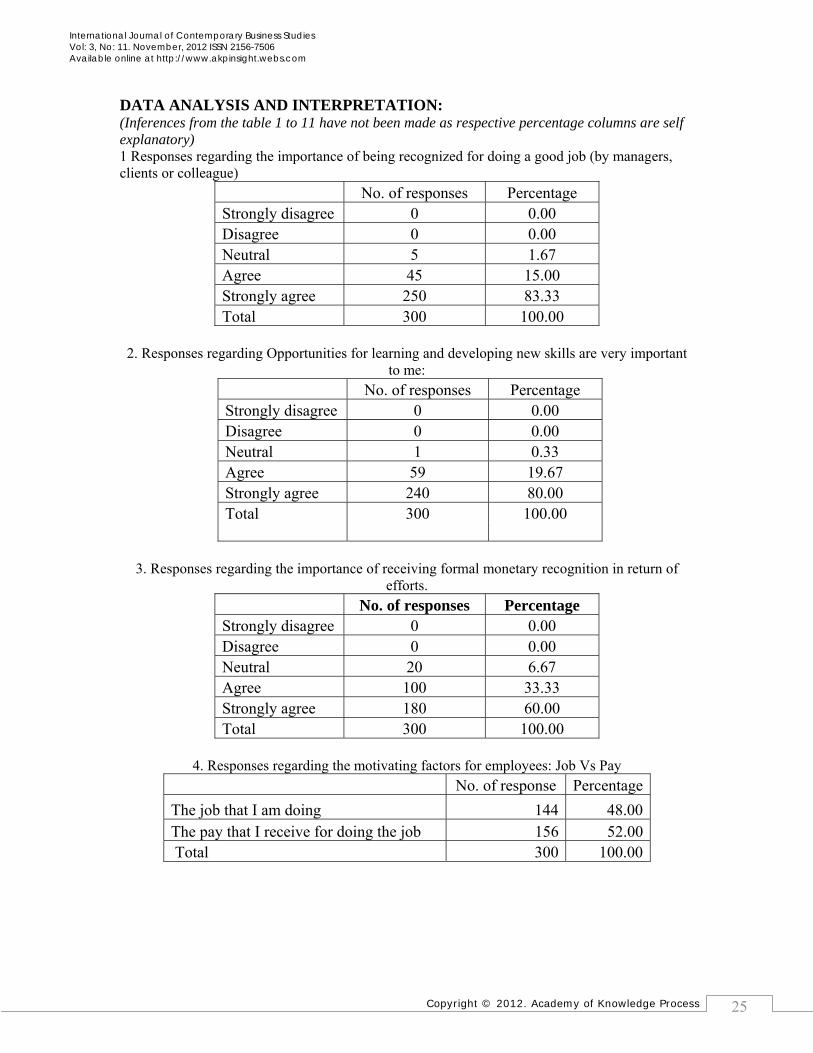
DATA ANALYSIS AND INTERPRETATION: (Inferences from the table 1 to 11 have not been made as respective percentage columns are self explanatory) 1 Responses regarding the importance of being recognized for doing a good job (by managers, clients or colleague)
No. of responses Percentage Strongly disagree 0 0.00 Disagree 0 0.00 Neutral 5 1.67 Agree 45 15.00 Strongly agree 250 83.33 Total 300 100.00
2. Responses regarding Opportunities for learning and developing new skills are very important
to me:
3. Responses regarding the importance of receiving formal monetary recognition in return of
efforts. No. of responses Percentage Strongly disagree 0 0.00 Disagree 0 0.00 Neutral 20 6.67 Agree 100 33.33 Strongly agree 180 60.00 Total 300 100.00
4. Responses regarding the motivating factors for employees: Job Vs Pay
No. of response Percentage The job that I am doing 144 48.00 The pay that I receive for doing the job 156 52.00 Total 300 100.00
No. of responses Percentage Strongly disagree 0 0.00 Disagree 0 0.00 Neutral 1 0.33 Agree 59 19.67 Strongly agree 240 80.00 Total 300 100.00
Copyright © 2012. Academy of Knowledge Process
International Journal of Contemporary Business Studies Vol: 3, No: 11. November, 2012 ISSN 2156-7506 Available online at http://www.akpinsight.webs.com
26
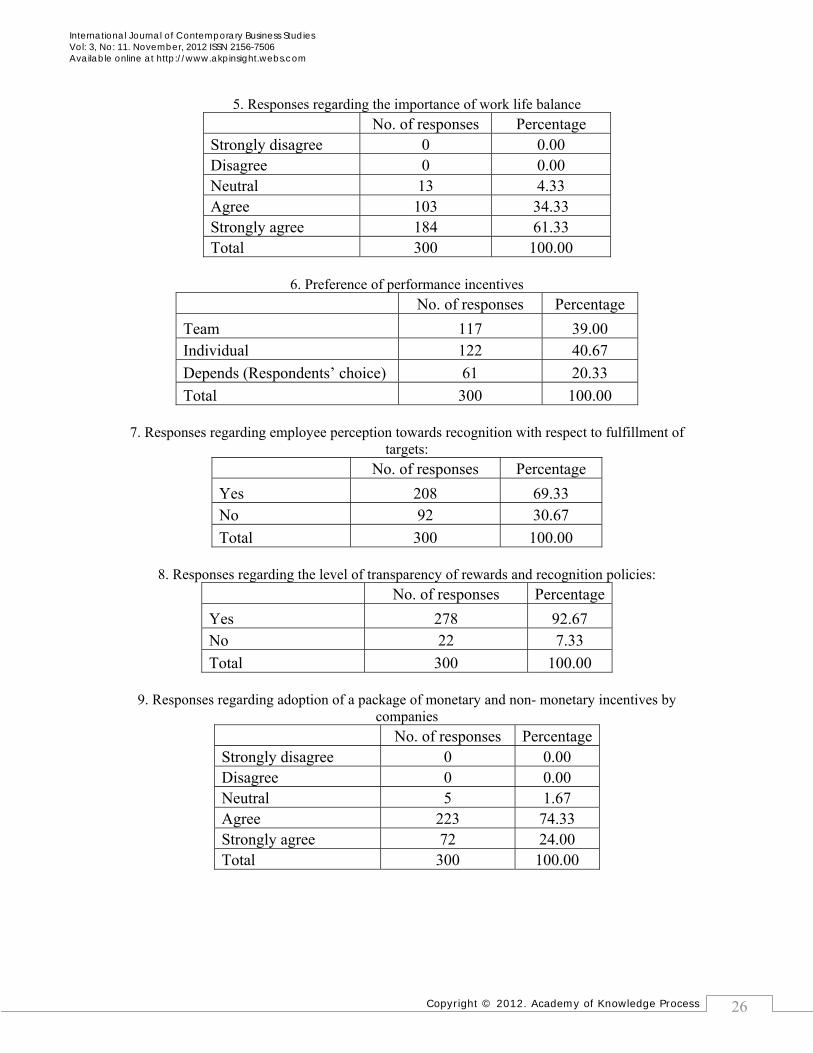
5. Responses regarding the importance of work life balance No. of responses Percentage Strongly disagree 0 0.00 Disagree 0 0.00 Neutral 13 4.33 Agree 103 34.33 Strongly agree 184 61.33 Total 300 100.00
6. Preference of performance incentives
No. of responses Percentage Team 117 39.00 Individual 122 40.67 Depends (Respondents’ choice) 61 20.33 Total 300 100.00
7. Responses regarding employee perception towards recognition with respect to fulfillment of
targets: No. of responses Percentage Yes 208 69.33 No 92 30.67 Total 300 100.00
8. Responses regarding the level of transparency of rewards and recognition policies:
No. of responses Percentage Yes 278 92.67 No 22 7.33 Total 300 100.00
9. Responses regarding adoption of a package of monetary and non- monetary incentives by
companies No. of responses Percentage Strongly disagree 0 0.00 Disagree 0 0.00 Neutral 5 1.67 Agree 223 74.33 Strongly agree 72 24.00 Total 300 100.00
Copyright © 2012. Academy of Knowledge Process
International Journal of Contemporary Business Studies Vol: 3, No: 11. November, 2012 ISSN 2156-7506 Available online at http://www.akpinsight.webs.com
27
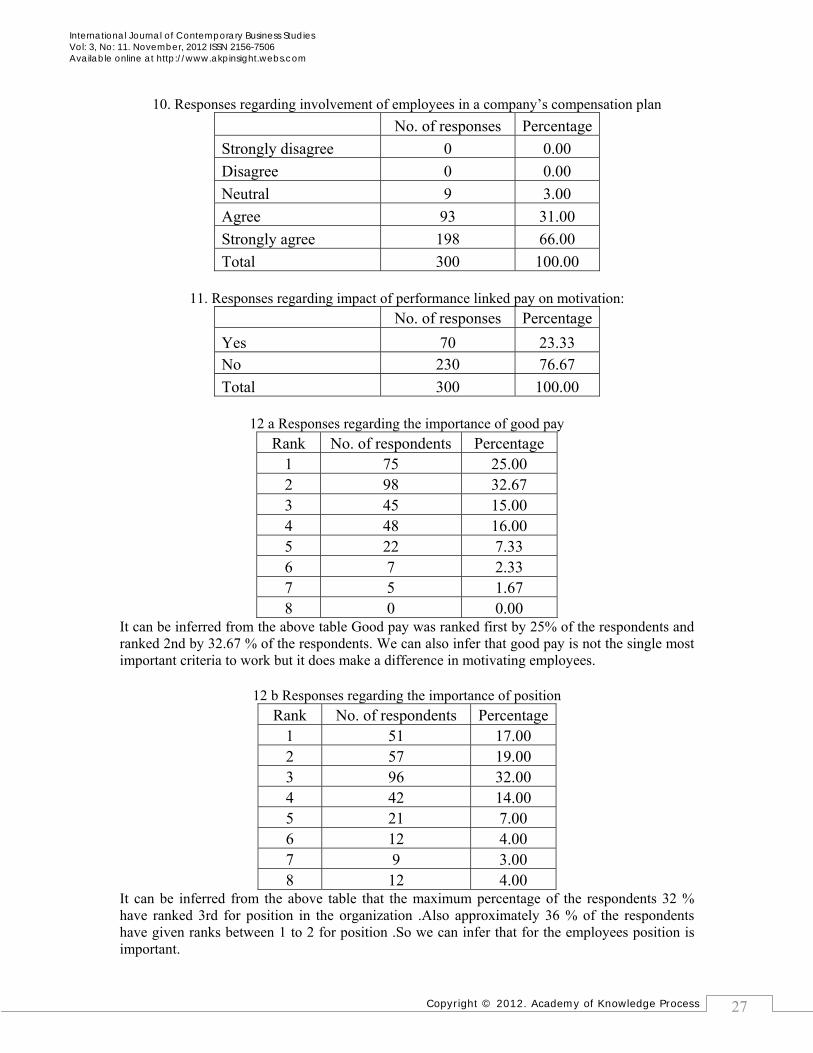
10. Responses regarding involvement of employees in a company’s compensation plan No. of responses Percentage Strongly disagree 0 0.00 Disagree 0 0.00 Neutral 9 3.00 Agree 93 31.00 Strongly agree 198 66.00 Total 300 100.00
11. Responses regarding impact of performance linked pay on motivation:
No. of responses Percentage Yes 70 23.33 No 230 76.67 Total 300 100.00
12 a Responses regarding the importance of good pay
Rank No. of respondents Percentage 1 75 25.00 2 98 32.67 3 45 15.00 4 48 16.00 5 22 7.33 6 7 2.33 7 5 1.67 8 0 0.00
It can be inferred from the above table Good pay was ranked first by 25% of the respondents and ranked 2nd by 32.67 % of the respondents. We can also infer that good pay is not the single most important criteria to work but it does make a difference in motivating employees.
12 b Responses regarding the importance of position Rank No. of respondents Percentage
1 51 17.00 2 57 19.00 3 96 32.00 4 42 14.00 5 21 7.00 6 12 4.00 7 9 3.00 8 12 4.00
It can be inferred from the above table that the maximum percentage of the respondents 32 % have ranked 3rd for position in the organization .Also approximately 36 % of the respondents have given ranks between 1 to 2 for position .So we can infer that for the employees position is important.
Copyright © 2012. Academy of Knowledge Process
International Journal of Contemporary Business Studies Vol: 3, No: 11. November, 2012 ISSN 2156-7506 Available online at http://www.akpinsight.webs.com
28
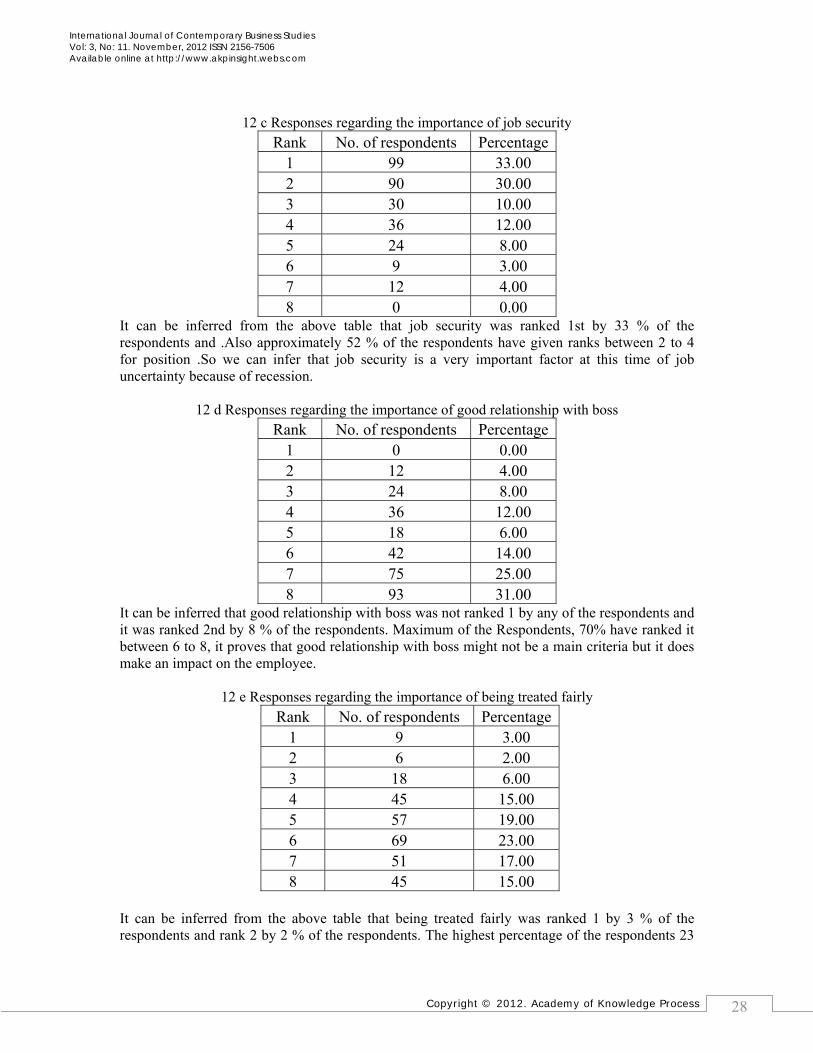
12 c Responses regarding the importance of job security
Rank No. of respondents Percentage1 99 33.00 2 90 30.00 3 30 10.00 4 36 12.00 5 24 8.00 6 9 3.00 7 12 4.00 8 0 0.00
It can be inferred from the above table that job security was ranked 1st by 33 % of the respondents and .Also approximately 52 % of the respondents have given ranks between 2 to 4 for position .So we can infer that job security is a very important factor at this time of job uncertainty because of recession.
12 d Responses regarding the importance of good relationship with boss Rank No. of respondents Percentage
1 0 0.00 2 12 4.00 3 24 8.00 4 36 12.00 5 18 6.00 6 42 14.00 7 75 25.00 8 93 31.00
It can be inferred that good relationship with boss was not ranked 1 by any of the respondents and it was ranked 2nd by 8 % of the respondents. Maximum of the Respondents, 70% have ranked it between 6 to 8, it proves that good relationship with boss might not be a main criteria but it does make an impact on the employee.
12 e Responses regarding the importance of being treated fairly
It can be inferred from the above table that being treated fairly was ranked 1 by 3 % of the respondents and rank 2 by 2 % of the respondents. The highest percentage of the respondents 23
Rank No. of respondents Percentage1 9 3.00 2 6 2.00 3 18 6.00 4 45 15.00 5 57 19.00 6 69 23.00 7 51 17.00 8 45 15.00
Copyright © 2012. Academy of Knowledge Process
International Journal of Contemporary Business Studies Vol: 3, No: 11. November, 2012 ISSN 2156-7506 Available online at http://www.akpinsight.webs.com
29
% ranked it 6, while most of them have ranked it around 4 to 8.This proves that it important for the employees to perceive that they are being treated fairly or the treatment is equitable.
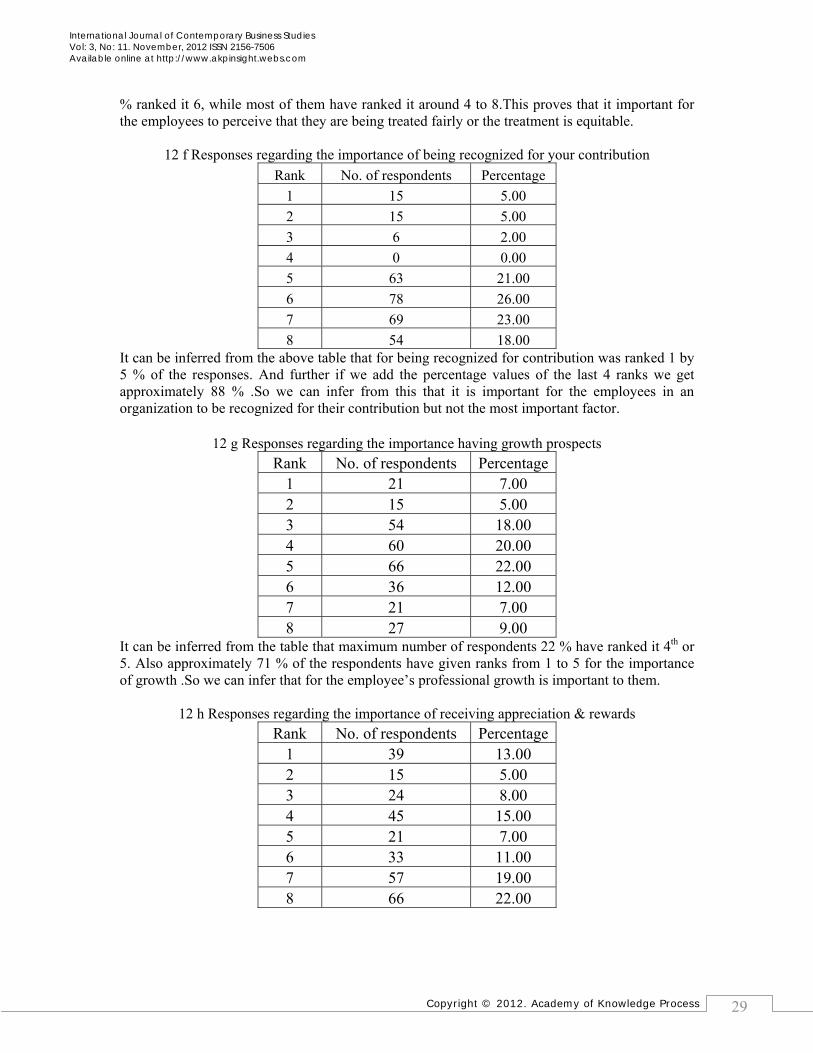
12 f Responses regarding the importance of being recognized for your contribution Rank No. of respondents Percentage
1 15 5.00 2 15 5.00 3 6 2.00 4 0 0.00 5 63 21.00 6 78 26.00 7 69 23.00 8 54 18.00
It can be inferred from the above table that for being recognized for contribution was ranked 1 by 5 % of the responses. And further if we add the percentage values of the last 4 ranks we get approximately 88 % .So we can infer from this that it is important for the employees in an organization to be recognized for their contribution but not the most important factor.
12 g Responses regarding the importance having growth prospects Rank No. of respondents Percentage
1 21 7.00 2 15 5.00 3 54 18.00 4 60 20.00 5 66 22.00 6 36 12.00 7 21 7.00 8 27 9.00
It can be inferred from the table that maximum number of respondents 22 % have ranked it 4th or 5. Also approximately 71 % of the respondents have given ranks from 1 to 5 for the importance of growth .So we can infer that for the employee’s professional growth is important to them.
12 h Responses regarding the importance of receiving appreciation & rewards Rank No. of respondents Percentage
1 39 13.00 2 15 5.00 3 24 8.00 4 45 15.00 5 21 7.00 6 33 11.00 7 57 19.00 8 66 22.00
Copyright © 2012. Academy of Knowledge Process
International Journal of Contemporary Business Studies Vol: 3, No: 11. November, 2012 ISSN 2156-7506 Available online at http://www.akpinsight.webs.com
30
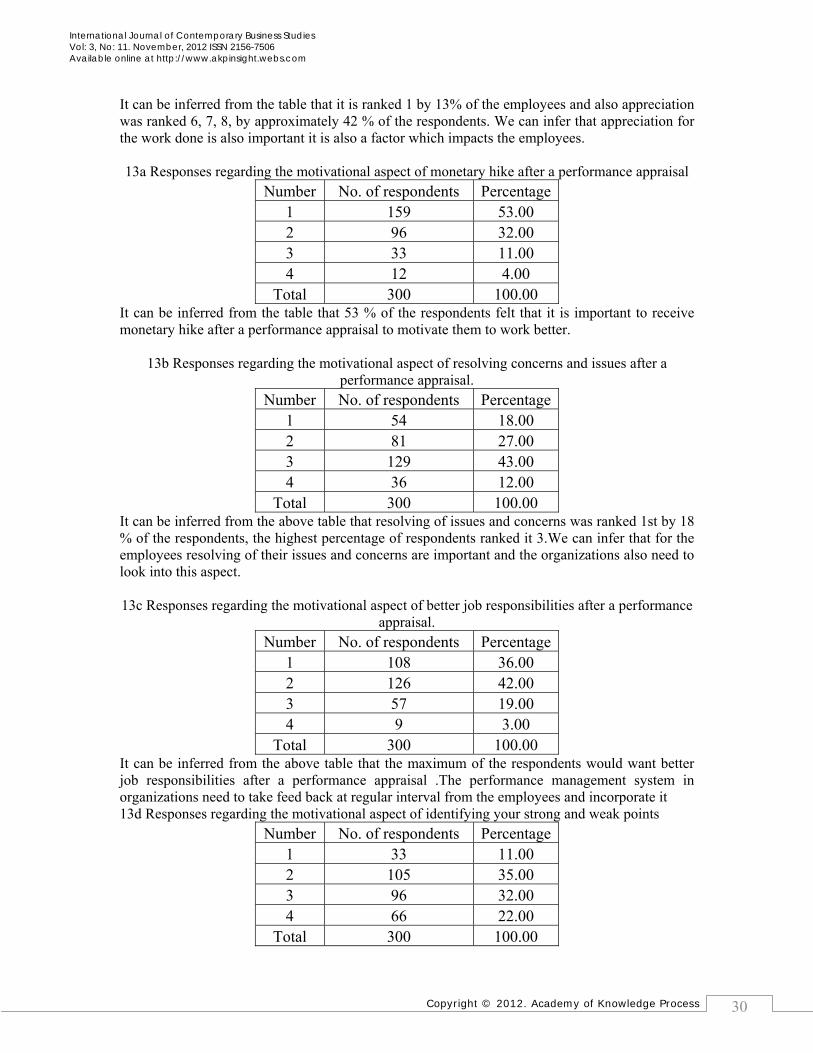
It can be inferred from the table that it is ranked 1 by 13% of the employees and also appreciation was ranked 6, 7, 8, by approximately 42 % of the respondents. We can infer that appreciation for the work done is also important it is also a factor which impacts the employees. 13a Responses regarding the motivational aspect of monetary hike after a performance appraisal
Number No. of respondents Percentage1 159 53.00 2 96 32.00 3 33 11.00 4 12 4.00
Total 300 100.00 It can be inferred from the table that 53 % of the respondents felt that it is important to receive monetary hike after a performance appraisal to motivate them to work better.
13b Responses regarding the motivational aspect of resolving concerns and issues after a performance appraisal.
Number No. of respondents Percentage1 54 18.00 2 81 27.00 3 129 43.00 4 36 12.00
Total 300 100.00 It can be inferred from the above table that resolving of issues and concerns was ranked 1st by 18 % of the respondents, the highest percentage of respondents ranked it 3.We can infer that for the employees resolving of their issues and concerns are important and the organizations also need to look into this aspect. 13c Responses regarding the motivational aspect of better job responsibilities after a performance
appraisal. Number No. of respondents Percentage
1 108 36.00 2 126 42.00 3 57 19.00 4 9 3.00
Total 300 100.00 It can be inferred from the above table that the maximum of the respondents would want better job responsibilities after a performance appraisal .The performance management system in organizations need to take feed back at regular interval from the employees and incorporate it 13d Responses regarding the motivational aspect of identifying your strong and weak points
Number No. of respondents Percentage1 33 11.00 2 105 35.00 3 96 32.00 4 66 22.00
Total 300 100.00
Copyright © 2012. Academy of Knowledge Process
International Journal of Contemporary Business Studies Vol: 3, No: 11. November, 2012 ISSN 2156-7506 Available online at http://www.akpinsight.webs.com
31
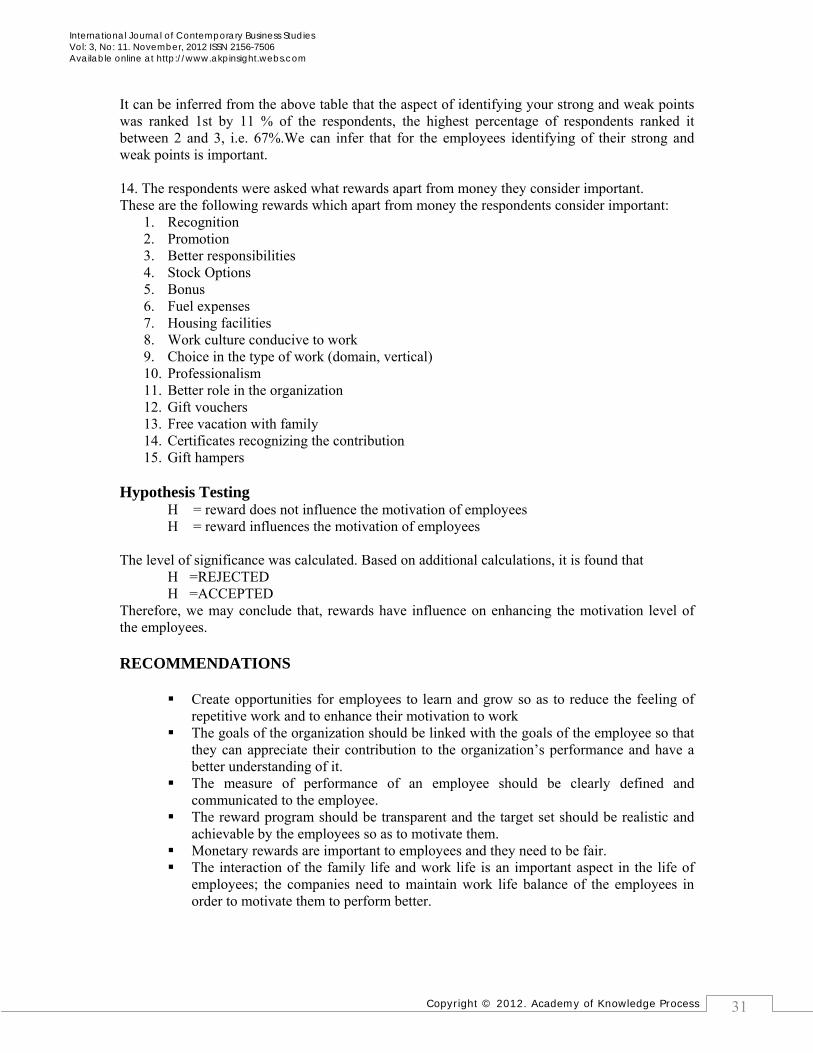
It can be inferred from the above table that the aspect of identifying your strong and weak points was ranked 1st by 11 % of the respondents, the highest percentage of respondents ranked it between 2 and 3, i.e. 67%.We can infer that for the employees identifying of their strong and weak points is important. 14. The respondents were asked what rewards apart from money they consider important. These are the following rewards which apart from money the respondents consider important:
1. Recognition 2. Promotion 3. Better responsibilities 4. Stock Options 5. Bonus 6. Fuel expenses 7. Housing facilities 8. Work culture conducive to work 9. Choice in the type of work (domain, vertical) 10. Professionalism 11. Better role in the organization 12. Gift vouchers 13. Free vacation with family 14. Certificates recognizing the contribution 15. Gift hampers
Hypothesis Testing
H� = reward does not influence the motivation of employees H� = reward influences the motivation of employees
The level of significance was calculated. Based on additional calculations, it is found that
H�=REJECTED H�=ACCEPTED
Therefore, we may conclude that, rewards have influence on enhancing the motivation level of the employees. RECOMMENDATIONS
Create opportunities for employees to learn and grow so as to reduce the feeling of repetitive work and to enhance their motivation to work
The goals of the organization should be linked with the goals of the employee so that they can appreciate their contribution to the organization’s performance and have a better understanding of it.
The measure of performance of an employee should be clearly defined and communicated to the employee.
The reward program should be transparent and the target set should be realistic and achievable by the employees so as to motivate them.
Monetary rewards are important to employees and they need to be fair. The interaction of the family life and work life is an important aspect in the life of
employees; the companies need to maintain work life balance of the employees in order to motivate them to perform better.
Copyright © 2012. Academy of Knowledge Process
International Journal of Contemporary Business Studies Vol: 3, No: 11. November, 2012 ISSN 2156-7506 Available online at http://www.akpinsight.webs.com
32
Since recession is going on, company should take steps to reduce uncertainties about the jobs positions and communicate the same to the employees, so that employees feel more secure and motivated in their work.
The top performance should be rewarded and it must be clearly defined to the employees as what is considered top performance.
Any effort by the employee should be acknowledged, and average performers should be motivated to strive to do better.
Should provide a variety of non-monetary rewards to the employees like certificates, gift vouchers, vacations and holidays, etc.
Involve the employees in deciding their compensation so that they get to choose because different people have different motivational needs.
The organizations must offer a package of monetary and non-monetary rewards to its employees.
Employees need to know that their contributions are noticed, valued and part of expanding the enterprise.
It might seem logical for companies to offer team rewards instead of individual to foster team spirit, but they should not emphasize on team achievement at the cost of individual achievement. Therefore it should be done both ways covering the individuals and the team as a whole too.
Employees concerns and issues need to be listened to and addressed. Verbal praises and recognition for the work done should never be denied to the
employees.
CONCLUSION The organizations need to develop a reward strategy that is how its reward policies and processes should be developed so that it is mutually beneficial to the employees and the organization. And the rewards should succeed in motivating the employees according to their needs and the reward policy is driven by the business needs. From this research we can infer that the employees in any organization need to be constantly provided opportunities for learning new skills so that they do not feel monotonous and they are motivated to use the acquired skills on their job. We can also infer that it is not just one factor for example it is not just monetary rewards which motivate an employees, though monetary compensation is important the job that they are doing also motivates them. This essentially says that the employees need to be motivated with the content of their job. The organizations need to provide challenging opportunities to the employee’s. The organizations also should emphasize on work life balance, and should provide options to employees like flexi time, work from home access. The employees would appreciate these initiatives. We can also say that linking pay to performance is an effective motivator when people know what they are going to get in return for certain efforts or achievements, and when they feel that what they may get is worth having. This is possible only if it is completely transparent. It can drive performance through increased motivation and if there is a direct linkage between employee performance and rewards. It can also be used to attract, retain, recognize and reward high performing employees. Recognition is one of the most powerful motivators. People need to know not only how well they have achieved their objectives or performed their task but also that their achievements are appreciated. Non monetary rewards can motivate employees better if it is integrated with financial rewards, in the total reward system. However, it is important to note that needs of the individuals varies from individual to Individual and depends on his or her psychological makeup. So it cannot be generalized but what the organizations can do is increase the employee participation in deciding their overall compensation. The organizations should treat the employees as stakeholders who should be involved in the development of the reward policies that
Copyright © 2012. Academy of Knowledge Process
International Journal of Contemporary Business Studies Vol: 3, No: 11. November, 2012 ISSN 2156-7506 Available online at http://www.akpinsight.webs.com
33
affect them. More over meet their expectations that they will be treated equitably, fairly, and consistently and are transparent. They should know what the reward policies of the organization are and how they are affected by them. Some of the rewards apart from money which are considered important by the employees to enhance their motivation to work are recognition, promoting to the next level enhanced responsibilities, stock options and bonuses, free vacation with family and choice in the type of projects they would want to work on. We can also infer that the employees prefer increased involvement in policies and systems in the organizations that affect them. REFERENCES Armstrong M, “Employee Reward”,University Press,Hyderabad, 2000. Bowen R.B, “Recognizing and rewarding employees” Tata McGraw Hill publications,
New Delhi, 2007. Dessler G, "Human Resource Management “Pearson Education publications, Indian
Edition, 2006. Kerr, Steven, “Ultimate Rewards What Really Motivates People To Achieve” Nelson, B, "1001 Ways to Reward Employees" Workman Publishing, New York, 2004 Price. N, “Human Resource Management in a Business Context”, 3rd edition Suri GK et., “Rethinking incentives and reward management “ Excel books, New Delhi,
2003. Annexure: Data collected from the following organizations:
1. Unilever (Bangladesh) Limited 2. One Bank Limited, Jubilee road branch 3. Chittagong Stock Exchange 4. KDS Group of Industries, Bayazid Bostami road, Chittagong 5. Sanmar Group, Chittagong 6. Baizid Group of Industries 7. Chittagong Hill Tracts Development Board 8. Premier University 9. Chittagong International School 10. Transcom Electronic Limited 11. Padma Oil Company Limited
QUESTIONNAIRE “Reward Management as Motivational tool in Organizations”
Name of the respondent: Designation: Company: 1. It is very important for me to be recognized when I am doing a good job (by managers, clients or colleague)
( ) Strongly disagree ( ) Disagree ( ) Neutral ( ) Agree ( ) strongly agree 2. Opportunities for learning more and developing new skills is very important to me:
( ) Strongly disagree ( ) Disagree ( ) Neutral ( ) Agree ( ) strongly agree 3. Receiving formal monetary recognition for my efforts is important to me:
( ) Strongly disagree ( ) Disagree ( ) Neutral ( ) Agree ( ) strongly agree 4. What does motivate me most?
( ) The job that I am doing
Copyright © 2012. Academy of Knowledge Process
International Journal of Contemporary Business Studies Vol: 3, No: 11. November, 2012 ISSN 2156-7506 Available online at http://www.akpinsight.webs.com
34
( ) The pay that I receive for doing the job 5. Work life balance is very important to me (an environment that encourages me to work my agreed hours and still have time for my personal life)
( ) Strongly disagree ( ) Disagree ( ) Neutral ( ) Agree ( ) strongly agree 6. Do you prefer team based performance incentives or individual incentives?
( ) Team ( ) Individual 7. Do you feel that if you meet your expected targets you will be recognized?
( ) Yes ( ) No 8. Is reward and recognition policy transparent (communicated clearly) in your organization?
( ) Yes ( ) No 9. Do you feel that companies should consider a package of monetary and nonmonetary incentives?
( ) Strongly disagree ( ) Disagree ( ) Neutral ( ) Agree ( ) strongly agree 10. Do you feel that company should involve you more in deciding your compensation?
( ) Strongly disagree ( ) Disagree ( ) Neutral ( ) Agree ( ) strongly agree 11. Do you feel that performance based compensation motivates you to perform better?
( ) Yes ( ) No 12. Which of the is important according to you; please rank the following on a scale of 1 to 8 with 1 being the highest and 8 lowest?
a. Good pay ( ) b. Position ( ) c. Job security ( ) d. Good relationship with boss ( ) e. Being treated fairly ( ) f. Being recognized for your contribution ( ) g Growth ( ) h. Appreciation, rewards and awards ( )
13. After a performance appraisal, rank the following in the order (1) that is most important (4) that is least important, which would motivate you to work better:
a. ( ) Monetary hike b. ( ) Resolving of your concerns and issues c. ( ) Better job responsibilities d. ( ) Identification of your strong and weak points
14. What rewards apart from money do you consider important? Comment …………………………………………………………………………………
Copyright © 2012. Academy of Knowledge Process
International Journal of Contemporary Business Studies Vol: 3, No: 11. November, 2012 ISSN 2156-7506 Available online at http://www.akpinsight.webs.com
35
Study of the Relationship between Capital Structure and Tax: Evidence from Iran
Jamshid Mohammadzadeh Rostami
Corresponding Author Master of Arts (M.A),
Department of Business Management, Science and Research branch, Islamic Azad University, Tehran, Iran
Zohreh Akbarpour
Master of Arts (M.A), Department of Business Management, Science and Research branch, Islamic Azad
University, Tehran, Iran
ABSTRACT The capital structure of a firm plays an important role in its investment decision-making and, as result, in its overall performance outcome. The effect of taxes on the capital structure has already been studied by some researchers. The present paper is aimed at studying the relationship between the capital structure and taxes imposed on the Iranian companies listed on Tehran Stock Exchange. A sample of 45 companies whose data of a ten-year period 2001-2010 was available has been selected. Cross-sectional and panel data regressions have been used in order to test the research hypotheses. A distributed-lag model, too, has been used for hypothesis-testing purposes. The signification level of the model has been calculated through T and F statistics. The results from the whole industries as well as each single industry showed that there is a significant relationship between capital structure and taxes. Keywords: Capital structure, Tax, Financial leverage, Cross sectional regression, Panel data regression, Tehran Stock Exchange.
JEL classification: G35; H25
INTRODUCTION
Nowadays managers are acting in such competitive and advantage environment, that determining correct goal and having appropriate understanding from method of obtaining them is regarded as vital issue. By increasing size of companies and developing technology, requirement to great
capital and supplying financial resources of firm has great importance. Under this condition the capital budget decisions and financial supply are regarded as most important field for making decision of financial managers of public joint stock companies. These decisions shall be make in the way of maximizing profitability of firm. Financial decisions are necessary for welfare of firm. Making an incorrect decision in relation to capital structure results in; losing properties of firm, facing
International Journal of Contemporary Business Studies Vol: 3, No: 11. November, 2012 pp.35-45 ©Academy of Knowledge Process
Copyright © 2012. Academy of Knowledge Process
International Journal of Contemporary Business Studies Vol: 3, No: 11. November, 2012 ISSN 2156-7506 Available online at http://www.akpinsight.webs.com
36
with debit and finally bankruptcy. Firm managers shall select the capital structure so that to increase value of firm (Eriotis et al 2007). Classical capital structure theories (e.g., Modigliani and Miller, 1958, 1963) suggest that corporate tax affects capital structure. Because interest expenses are deducted before tax, debt has a tax advantage over equity, and this tax advantage increases with the corporate tax rate. In a perfect world with no transaction costs, firms would finance with 100% debt. When there are bankruptcy costs or other costs, firms have an optimal capital structure that trades o the costs and benefits of debt. Firms with higher tax rates use more debt1. Empirical studies on the relationship between tax rates and capital structure are voluminous. Earlier studies (e.g., Bradley et al., 1984; Titman and Wessels, 1988) find no evidence to support theoretical predictions that leverage levels and firms’ non-debt tax shields are substituted. Recent studies, such as Scholes et al. (1990) and Graham (1996, 1999), find that marginal tax rates and leverage are simultaneously determined. However, these studies do not answer the question of how an exogenous change in the tax rate affects firms’ leverage decisions. To examine the effect of an exogenous change in the tax rate on leverage, researchers need to examine a circumstance in which the corporate tax rate has been changed exogenously. Suitable circumstances are rare and are often accompanied by other events that could potentially affect firms’ capital structure. Givoly et al. (1992) examined the 1986 US Tax Reform Act. They find that after the tax reform, firms that had experienced larger drops in the corporate tax rate reduced their use of debt. However, the 1986 Tax Reform Act affected personal tax at the same time, which will also affect capital structure (Graham, 2003). This severely complicates the research design. Although Givoly et al. (1992) use lagged dividend yield as a control variable for the personal tax effect, Rajan and Zingales (1995) indicate that different measurements of personal tax will substantially affect the conclusions2. Miller and Modilani in year 1985 have offered some theories as follows: competitive market and incomplete income tax, absence of bankruptcy costs, symmetrical information among market activists and replacing domestic and foreign financial resources, may not change value of firm due to change in structure financial resources i.e. value of firm is independent from capital structure. Miller & Modigliani (1963) according to income tax of firms have revised in their first theory and offered new theory. In their new theory they inferred that whereas receiving loan for firm results in tax benefit, logical it is expected to use receive loan for supplying financial resource; since, higher loan results in increasing value of firm. Gordon (1982) noted that tax incentives to use debt are proportional to the product of the difference between corporate vs. personal tax rates and nominal interest rates. While tax rates may not have changed much over time, interest rates have. Variation in nominal interest rates, however, can proxy for business cycle factors that may have important independent effects on financial policy. In fact, any time-series study faces the problem that many nontax factors that affect financial policy change over time, e.g. business cycles and financial regulations, as well as inflation. Unless these other factors are controlled for directly or are uncorrelated with tax rates, the estimated effects of taxes on financial behavior will be biased. These inherent difficulties in making use of either cross-section or time-series evidence to identify the effects of taxes on financial policy led Myers (1984) to argue: “I know of no study clearly demonstrating that a
1 For more details on theories of the relationship between tax and capital structure, please refer to Graham (2003). 2 Specifically, they find that if top personal tax rates are assumed, then the 1986 Tax Reform Act significantly affects the capital structure, whereas if the average personal tax rates are assumed, then the 1986 Tax Reform Act does not significantly affect the capital structure.
Copyright © 2012. Academy of Knowledge Process
International Journal of Contemporary Business Studies Vol: 3, No: 11. November, 2012 ISSN 2156-7506 Available online at http://www.akpinsight.webs.com
37
firm’s tax status has predictable, material effects on its debt policy. I think the wait for such a study will be protracted.” Plesco (1994) in his research has insisted on tax saving as a result of increasing leverage and has studied effect of change in tax rate on capital structure of American companies. Amending tax structure in America in year 1986 resulted in creation practical condition to test effect of tax on leverage decisions of firms. The principal section was related to amending tax structure and decreasing tax rate from 46% to 34% in tax basis of companies. Results of research show that amending tax structure in year 1986; resulted in average 5% decrease in tax rate and distribution of tax between different industries and influences on decision of financial supply of firms. Evidences show positive relationship between tax rate and leverage i.e. amending tax structure results in decreasing leverage of firms. Shih (1996) indicated that tax liabilities affects on the corporate capital structure. He tests effect of tax liabilities that deals with corporate finance leverage. His results show that the tax liabilities with corporate’s financial leverage is related inversely. Risk will reduce tax liabilities associated with the use of financial leverage.Gropp (1997) by using integrated data attempted to study effective rate of expected tax on financial supply of American firms. His selected sample was 1300 industrial companies attended at New York stock exchange for time period of 1979 to 1991 i.e. 16930 year-firms. He concluded that effective tax rate has positive significant relationship with financial supply through creation of debit . Results of research by Gordon & Lee (2001) show that tax has significant relationship with level of firm’s debt; specially when difference between tax rate of great companies and small companies (34% against 15%) results in higher tax rate of great firms in comparison to small firms that more use from their assets for financial supply through creation of debt. Campello (2001) assumes that a given firm’s debt and equity are held by a particular clientele of investors (with the clienteles based on investor tax rates). He investigates the capital structure response to the large reduction in personal taxes (relative to the smaller reduction in corporate tax rates) after the Tax Reform Act of 1986. Campello finds that zero-dividend firms (which presumably have high-tax-rate investors and therefore experienced the largest reduction in the personal tax penalty) increased debt ratios in response to tax reform, while high-dividend payout firms (which presumably have low-tax-rate investors and therefore experienced a small reduction in the personal tax penalty) reduced debt usage relative to peer firms. Kahle & Shastri (2002) in article attempted to study capital structure and tax benefit as a result of option exercise. They found out that ratio short term and long term debt has negative relationship with tax benefit as a result of option exercise. In addition change at annual leverage has negative relationship with change in option exercise of transaction. Finally they found out that firms prefer to publish stock in transactions related to tax benefit that net price of published stock is an ascending function for tax benefits as a result of option exercise . Wu & Yue (2009) investigate whether listed firms in China adjust their capital structure in response to an increase in the corporate tax rate. In addition they have studied increase of tax rate and its effect on capital structure of firms that China government had already observed tax discount. Results of their study showed that these firms by increase in their tax rate have increased their financial lever. Evidences show that the highest increase in lever relates to firms receiving bank loan.
Copyright © 2012. Academy of Knowledge Process
International Journal of Contemporary Business Studies Vol: 3, No: 11. November, 2012 ISSN 2156-7506 Available online at http://www.akpinsight.webs.com
38
Different theories have been offered in relation to capital structure of firms. Some of these theories have referred that firm is the reason for increasing their value and other referred that firm is factor for decreasing their value. Theoretically, it seems that managers have grounds to increase structure of firm. Therefore, according to role of capital structure in creation of wealth for firm, studying its effective factors has great importance. Several researches have introduced some effective factors on capital structure of firms including tax. The present research attempts to answer the following question: Is there significant relationship between capital structure and tax among firms accepted at Tehran stock exchange? The remainder of the paper proceeds as follows. The next section introduces the Goals and Importance of Research. Section 3 presents Theoretical Basics. Section 4 describes our research methodology. Section 5 presents empirical results, and Section 6 concludes the paper. GOAL AND IMPORTANT RESEARCH Tax is amount that government on the strength of law and in order to improve structure of its system and supplying its costs, receive from persons and firms and institutes. Tax is in fact one of the most important economic infrastructure that plays key role at permanent growth of social justice through redistribution of income and wealth and their optimum allocation to all groups of society. In addition by receiving fair tax it is possible to solve important social and economic problems of government including: budget shortage, unemployment and decreasing investment at productive sector. Goal of the present research is studying relationship between capital structure and tax of firms accepted at Tehran stock exchange.
THEORETICAL BASICS The relationship between tax and capital structure of firms is very considerable issue that has received attention by many researchers during previous decades.
Static Trade-Off Theory
This theory mentions that financial benefit of debt increases value of firm having debt. On the other hand, costs of financial crisis and possible bankruptcy of firms as a result of not fulfilling their commitments toward debt, decreases value of firm. Therefore, capital structure of firm may results in creation of balance between financial benefit of debt, costs of financial crisis and possible bankruptcy. Thus, 2 neutralizing factors including (balance of benefit and costs as result of debt) results in optimum application of debit in capital structure of firm (Abor 2005). Static Trade-off theory, centers on the repayment and costs of issuing debt, predicts that an attractive target debt ratio is to make the paramount value of the company. The best point can be accomplishes when the marginal value of the payback is linked with debt concerns exactly offsets the raise in the present value of the costs correlated by handing out more debt (Myers, 2001). The main benefit of debt is the tax deductibility of interest payments. The tax deduction of corporate interest payments favors the application of debt. It will be more with the existence of personal taxes (Miller, 1977) and non-debt tax protection (DeAngelo and Masulis, 1980).
Agency Costs Theory
This theory was offered by Jensen and Meckling for the first time in year 1976. Capital structure of firm is determined through creation of agency costs as a result of contradiction in benefit of beneficiaries. Jensen and Meckling within framework of economic unit have identified 2 contradiction of benefits as follows:
A. contradiction between benefit of managers and shareholders. B. contradiction between benefit of shareholders and holders of debt papers to firm.
Copyright © 2012. Academy of Knowledge Process
International Journal of Contemporary Business Studies Vol: 3, No: 11. November, 2012 ISSN 2156-7506 Available online at http://www.akpinsight.webs.com
39
Therefore, Jensen and Meckling by creation of balance between benefit obtained from financial benefit and agency costs may obtain to optimum capital structure. Some feedbacks of this theory are including: firstly, it is expected that persons offering loan shall observe specific limitations in their contracts including keeping specified level of cash flow, not obtaining new asset, not investment on new commercial activities that is irrelevant to current commercial activity and lack of paying profit for lean receivers. Secondly, industries having less opportunity of growth in order to meet their financial resources shall receive loan, thirdly, firms facing with few growth opportunities and having higher free cash flow are expected to have higher debt. Having high free cash flow results in having suitable investment opportunity; since, managers may extravagance for using benefit and even may pay higher salary to their inferior employees. Therefore, increasing level of debt in capital structure results in; decreasing Free Cash Flow and increasing ownership of managers for final ownership rights of firm (Bagherzadeh 2003).
RESEARCH METHODOLOGY
Method
The present research with respect to type is regarded as applied research, with respect to methodology is regarded as descriptive research (semi-empirical) and correlation research by using post event information i.e. information in relation to past.Variables introduced in the present research were studied with respect to 2 aspects. These variables were selected among different firms and other variables were selected from time period 2001-2010. The suggested solution under such case is integrating inner group data and time series and estimating desired pattern based on new set. In case of putting together the sectional data with different time of period, we may find merged data. Method of layout data is performed according to 2 methods. In the first method, data of a section unit is observed for T year and then this operation is repeated for second sectional unit and further units. Type of layout data is called pooled data. In the second method, data for sectional unit of each year is put next together and this procedure is repeated for further years. This type of data is called panel data (Khosravinejad 2001). In order to produce time series pattern, it is required to pay attention to time for determining final effect of independent variable on dependant variable. If time interval between decision and its effect on variable may be long, it is required to add Lag explanatory variable. Under inefficient market, information is invested on capital structure. Whereas Tehran stock exchange is not efficient even at poor level, it is possible to conclude that in Tehran stock exchange, information is reached with Lag . Therefore, in order to test hypothesis, it is required to pay attention to Lag for transferring information into market (Namazi and Rostami, 2006). According to this problem effect of annual tax on capital structure of next year shall be measured; therefore, in order to test hypothesis it is required to use Lag variables and model of
Lag equation is as follows:
FLt = β0 + β1Tt-1 + e (1) H0: β0 = 0 H1: β0 ≠ 0 FL = Financial Leverage T = Tax β0 = Constant coefficient t = Time Period e = Coefficient of error
Copyright © 2012. Academy of Knowledge Process
International Journal of Contemporary Business Studies Vol: 3, No: 11. November, 2012 ISSN 2156-7506 Available online at http://www.akpinsight.webs.com
40
In this pattern it is assumed that there is normal distribution that is independent and there is no continuous correlation and incompatible variance. Since the rejection of H0 entails the acceptance of H1, Indicate the existence significant relationship between capital structure and tax. In order to estimate linear regression model it is used from OLS method. This method applies from suitable statistical properties including best linear estimator without BLUE. Statistical method applied in the present research is integrating time data and sectional data. In order to perform statistical test, it was used from Eviews software. Method of collecting data is library method i.e. required data and information were collected from financial statement of sample firms i.e. balance sheet, profit and loss statement, cash flow and other information published from firms’ member at stock exchange. Information related to theoretical issues was collected from library resources including: books, journals and specialty accounting websites
Sample
All firms accepted at Tehran stock exchange during year 2001 to 2010 were selected as statistical universe by paying attention to accessibility of information and also clarity of accounting information. Obligation of stock exchange for on time publishing financial statements resulted in creation of suitable information for researchers. In order to select sample it was used from classification sampling and simple random method. In classification sample method the statistical universe was divided into homogenous and heterogonous group and then number of sample toward each group is determined. By using simple random sampling method the number of required elements for each heterogeneous group is selected. In the present research, first of all firms accepted at Tehran stock exchange were divided to different groups and industries according to the following 8 classes as follows: 1. Group of basic and fabric metals. 2. Group of non metal inorganic products. 3. Group of manufacturing machines and communication equipments and electric apparatus. 4. Group of pharmacy. 5. Group of machineries and motorized vehicles spare parts. 6. Group of oil by-products, producing materials and chemical products. 7. Group of foods, sugar and hard sugar. 8. Group of lime, plaster, tile and ceramics. Therefore among all of the firms accepted at Tehran stock firm, all of the companies having following qualifications were selected: 1. Firm shall accepted by stock exchange before year 2001. 2. Firm shall not be among investment, holding, bank and broker companies; since, type of their activity is different with other industry firms. 3. Firm shall not have record of stop for its transactions. 4. Firm shall not have change in its fiscal year during period of being studies. 5. Termination of fiscal year shall be end to Mar 30 of each year to have ability to compare for increase. 6. Complete information of firm shall be available. According to the aforesaid terms and conditions, 45 firms were selected. In the present research, first of all the entire firms were tested and then each group of firms was separately tested.
Variables
Carrying out any research entails defining each of its variables. Variables are divided into two groups depending on the role they play in the research:
Copyright © 2012. Academy of Knowledge Process
International Journal of Contemporary Business Studies Vol: 3, No: 11. November, 2012 ISSN 2156-7506 Available online at http://www.akpinsight.webs.com
41
• Dependent Variable
In the present research the dependant variable is financial leverage that is obtained from dividing total liabilities of firm on total assets of firm. FL = (2)
• Independent Variable
In the present research the independent variable is tax that is obtained from natural logarithm of firm’s tax.
EMPIRICAL RESULT
Results of Hypothesis Test for all Firms
In order to study significance of regression model, it was used from relations between independent and dependant variable and F statistics. By comparing F and F statistics and table (F(α,k-1, N-K)) at error level of 5% total hypothesis model was studied. In order to study significance of independent variables it was used from t statistics and in order to study self correlation it was used from Durbin-Watson statistics. Results of statistical analysis were performed by assumptions of H0 and H1. H0: There is no significant relationship between capital structure (financial leverage) and tax of firm accepted in Tehran stock exchange. H1: There is significant relationship between capital structure (financial leverage) and tax of firm accepted in Tehran stock exchange. The results of hypothesis test among total firms in Table 1 indicated that there are significant values for total firms (p=0.000 <0.05). F statistics at significant level as 0.05 indicates significance of regression model at certainty level of 95%. In order to study independence of error it was used from Durbin-Watson test; in which level of these variables as 1.894 at distance of 1.5 to 2.5 shows absence of self correlation.
Results of Hypothesis Test for Industry Group
The results of hypothesis test at basic and fabric metals in Table 2 indicated that there are significant values for total firms (p=0.000 <0.05). F statistics at significant level as 0.05 indicates significance of regression model at certainty level of 95%. In order to study independence of error it was used from Durbin-Watson test; in which level of these variables as 1.821 at distance of 1.5 to 2.5 shows absence of self correlation. The results of hypothesis test at non-metal inorganic products in Table 3 indicated that there are significant values for total firms (p=0.000 <0.05). F statistics at significant level as 0.05 indicates significance of regression model at certainty level of 95%. In order to study independence of error it was used from Durbin-Watson test; in which level of these variables as 1.745 at distance of 1.5 to 2.5 shows absence of self correlation. The results of hypothesis test at manufacturing machines, communication equipments, electric appliances and transportation means in Table 4 indicated that there are significant values for total firms (p=0.034 <0.05). F statistics at significant level as 0.05 indicates significance of regression model at certainty level of 95%. In order to study independence of error it was used from Durbin-
Total Assets
Total Liabilities
Copyright © 2012. Academy of Knowledge Process
International Journal of Contemporary Business Studies Vol: 3, No: 11. November, 2012 ISSN 2156-7506 Available online at http://www.akpinsight.webs.com
42
Watson test; in which level of these variables as 1.631 at distance of 1.5 to 2.5 shows absence of self correlation. The results of hypothesis test at non pharmacy industry in Table 5 indicated that there are significant values for total firms (p=0.001 <0.05). F statistics at significant level as 0.05 indicates significance of regression model at certainty level of 95%. In order to study independence of error it was used from Durbin-Watson test; in which level of these variables as 1.699 at distance of 1.5 to 2.5 shows absence of self correlation. The results of hypothesis test at machineries and motorized vehicles in Table 6 indicated that there are significant values for total firms (p=0.000 <0.05). F statistics at significant level as 0.05 indicates significance of regression model at certainty level of 95%. In order to study independence of error it was used from Durbin-Watson test; in which level of these variables as 1.549 at distance of 1.5 to 2.5 shows absence of self correlation. The results of hypothesis test at oil by-products, producing chemical material in Table 7 indicated that there are significant values for total firms (p=0.000 <0.05). F statistics at significant level as 0.05 indicates significance of regression model at certainty level of 95%. In order to study independence of error it was used from Durbin-Watson test; in which level of these variables as 1.883 at distance of 1.5 to 2.5 shows absence of self correlation. The results of hypothesis test at food, sugar and hard sugar in Table 8 indicated that there are significant values for total firms (p=0.000 <0.05). F statistics at significant level as 0.05 indicates significance of regression model at certainty level of 95%. In order to study independence of error it was used from Durbin-Watson test; in which level of these variables as 1.647 at distance of 1.5 to 2.5 shows absence of self correlation. The results of hypothesis test at lime, plaster, tile and ceramics in Table 9 indicated that there are significant values for total firms (p=0.000 <0.05). F statistics at significant level as 0.05 indicates significance of regression model at certainty level of 95%. In order to study independence of error it was used from Durbin-Watson test; in which level of these variables as 2.184 at distance of 1.5 to 2.5 shows absence of self correlation.
CONCLUSION
Classical capital structure theory predicts that corporate tax affects firms’ choice of capital structure. Firms with higher tax rates use more debt. Previous studies have mainly examined the relationship between marginal tax rates and leverage simultaneously. The present research attempts to study this assumption: there is significance relationship between financial leverage and tax of firms accepted in Tehran stock exchange. Results hypothesis test is offered in table I to IX which show that there is significant relationship between financial leverage and tax of all companies regardless to their industry and also relationship between all group of industries is significant. This result is compatible with result of research of Plesko (1994) and Shih (1996) and Graham (1996) and Gropp (1997) and Gordon and Lee (2001) and Kahle and Shastri (2002) Wu and Yu (2007) i.e. changing tax structure of firms accepted at Tehran stock exchange has influence on capital structure of firms accepted at Tehran stock exchange. Our study sheds additional light on the relationship between corporate tax rates and capital structure. It also deepens our understanding of the determinants of capital structure in a fast-growing emerging economy. Our study suggests that the accessibility of financing sources can be a determinant of capital structure.
Copyright © 2012. Academy of Knowledge Process
International Journal of Contemporary Business Studies Vol: 3, No: 11. November, 2012 ISSN 2156-7506 Available online at http://www.akpinsight.webs.com
43
REFERENCES
Abor, J. (2005). The effect of capital structure on profitability: an empirical analysis of listed firms in Ghana, The Journal of Risk Finance, 6, 438-445.
Bagherzadeh, S. (2003). The Determinants of Capital Structure Choice: Iranian Evidence, The Iranian Journal of Financial Research, 5, 23-47.
Bradley, M., Jarrell, G. and Kim, E.H. (1984). On the existence of an optimal capital structure: Theory and evidence, The Journal of Finance, 39, 857-878.
Campello, M., 2001, Taxes and Capital Structure: Do Investors’ Taxes Matter? Evidence from the Tax Reform Act of 1986, working Paper, Arizona State University.
DeAngelo, H. and Masulis, R. W., (1980). Optimal capital structure under corporate and personal taxation, Journal of Financial Economics, 8, 3-29.
Eriotis, N., Vasiliou, D. and Neokosmidi, Z.V. (2007). How firm characteristics affect capital structure: an empirical study, Managerial Finance, 33, 321-331.
Givoly, D., Hahn, C., Ofer, A.R. and Sarig, O. (1992). Taxes and capital structure: Evidence from firms response to the Tax Reform Act of 1986, The Review of Financial Studies, 5, 331-355.
Gordon, R.H., (1982). Interest Rates, Inflation, and Corporate Financial Policy, Brookings Papers on Economic Activity, 2, 461-491.
Gordon, R.H. and Lee, Y. (2001). Do taxes affect corporate debt policy? Evidence from U.S. corporate tax return data, Journal of Public Economics, 82, 195-224.
Graham, J.R. (1996). Debt and the marginal tax rate, Journal of Financial Economics, 41, 41-74.
Graham, J.R. (1999). Do personal taxes affect corporate financing decisions?, Journal of Public Economics, 73, 147-185.
Graham, J.R. (2003). Taxes and corporate finance: A review, The Review of Financial Studies, 16, 1075-1129.
Gropp, R.E. (1997). The Effect of Expected Effective Corporate Tax Rates on Incremental Financing Decisions, International Monetary Fund, 44, 485-503.
Kahle, K.M. and Shastri, K. (2002). Firm Performance, Capital Structure and the Tax Benefits of Employee Stock Options, Social Science Research Network, 33, 1-37.
Khosravinejad, A.A. (2001). Estimating bread demand for urban Iranian families (application of model with merged information), Journal of Economic Research and Policies, 1, 117-138.
Miller, M.H. (1977). Debt and Taxes. The Journal of Finance, 32, 261-276.
Modigliani, F. and Miller, M. (1958). The cost of capital, corporation finance and the theory of investment, American Economic Review, 48, 261-297.
Modigliani, F. and Miller, M. (1963). Corporate income taxes and the cost of capital: A correction, American Economic Review, 53, 433-443.
Myers, S.C. (2001). Capital Structure. Journal of Economic Perspectives, 15, 81- 102.
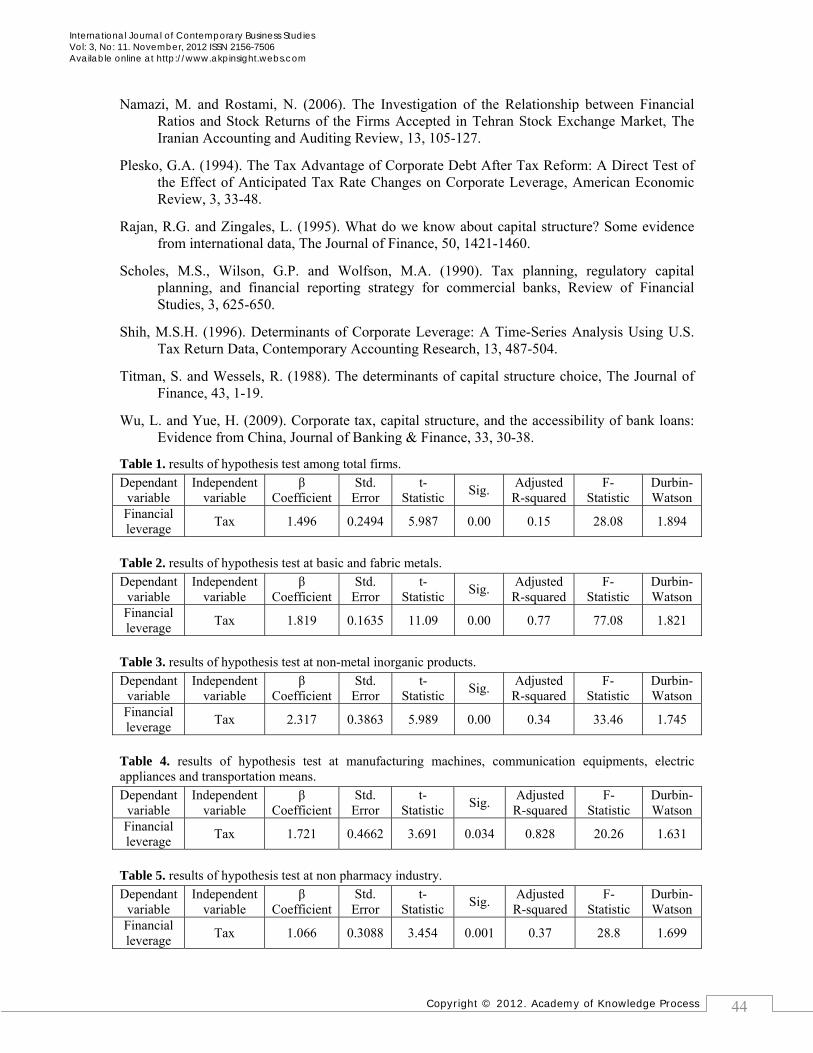
Copyright © 2012. Academy of Knowledge Process
International Journal of Contemporary Business Studies Vol: 3, No: 11. November, 2012 ISSN 2156-7506 Available online at http://www.akpinsight.webs.com
44
Namazi, M. and Rostami, N. (2006). The Investigation of the Relationship between Financial Ratios and Stock Returns of the Firms Accepted in Tehran Stock Exchange Market, The Iranian Accounting and Auditing Review, 13, 105-127.
Plesko, G.A. (1994). The Tax Advantage of Corporate Debt After Tax Reform: A Direct Test of the Effect of Anticipated Tax Rate Changes on Corporate Leverage, American Economic Review, 3, 33-48.
Rajan, R.G. and Zingales, L. (1995). What do we know about capital structure? Some evidence from international data, The Journal of Finance, 50, 1421-1460.
Scholes, M.S., Wilson, G.P. and Wolfson, M.A. (1990). Tax planning, regulatory capital planning, and financial reporting strategy for commercial banks, Review of Financial Studies, 3, 625-650.
Shih, M.S.H. (1996). Determinants of Corporate Leverage: A Time-Series Analysis Using U.S. Tax Return Data, Contemporary Accounting Research, 13, 487-504.
Titman, S. and Wessels, R. (1988). The determinants of capital structure choice, The Journal of Finance, 43, 1-19.
Wu, L. and Yue, H. (2009). Corporate tax, capital structure, and the accessibility of bank loans: Evidence from China, Journal of Banking & Finance, 33, 30-38.
Table 1. results of hypothesis test among total firms. Dependant
variable Independent
variable β
Coefficient Std.
Error t-
Statistic Sig. Adjusted R-squared
F-Statistic
Durbin-Watson
Financial leverage Tax 1.496 0.2494 5.987 0.00 0.15 28.08 1.894
Table 2. results of hypothesis test at basic and fabric metals. Dependant
variable Independent
variable β
Coefficient Std.
Error t-
Statistic Sig. Adjusted R-squared
F-Statistic
Durbin-Watson
Financial leverage Tax 1.819 0.1635 11.09 0.00 0.77 77.08 1.821
Table 3. results of hypothesis test at non-metal inorganic products. Dependant
variable Independent
variable β
Coefficient Std.
Error t-
Statistic Sig. Adjusted R-squared
F-Statistic
Durbin-Watson
Financial leverage Tax 2.317 0.3863 5.989 0.00 0.34 33.46 1.745
Table 4. results of hypothesis test at manufacturing machines, communication equipments, electric appliances and transportation means. Dependant
variable Independent
variable β
Coefficient Std.
Error t-
Statistic Sig. Adjusted R-squared
F-Statistic
Durbin-Watson
Financial leverage Tax 1.721 0.4662 3.691 0.034 0.828 20.26 1.631
Table 5. results of hypothesis test at non pharmacy industry. Dependant
variable Independent
variable β
Coefficient Std.
Error t-
Statistic Sig. Adjusted R-squared
F-Statistic
Durbin-Watson
Financial leverage Tax 1.066 0.3088 3.454 0.001 0.37 28.8 1.699
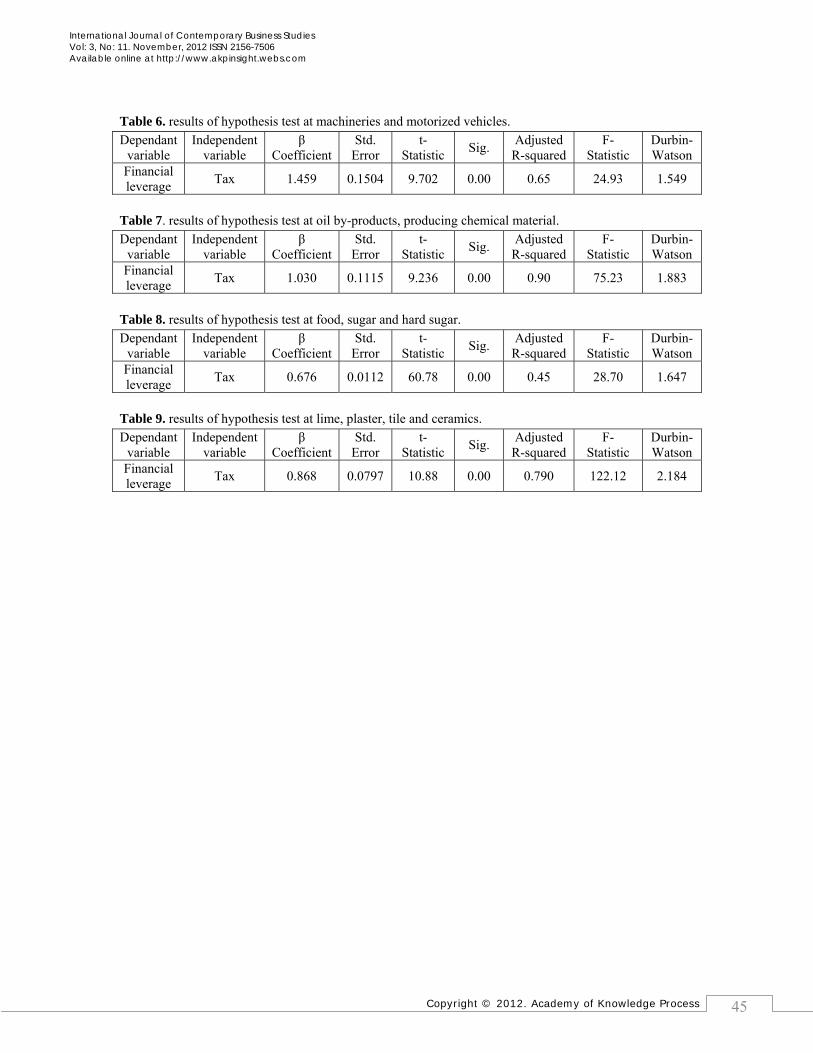
Copyright © 2012. Academy of Knowledge Process
International Journal of Contemporary Business Studies Vol: 3, No: 11. November, 2012 ISSN 2156-7506 Available online at http://www.akpinsight.webs.com
45
Table 6. results of hypothesis test at machineries and motorized vehicles. Dependant
variable Independent
variable β
Coefficient Std.
Error t-
Statistic Sig. Adjusted R-squared
F-Statistic
Durbin-Watson
Financial leverage Tax 1.459 0.1504 9.702 0.00 0.65 24.93 1.549
Table 7. results of hypothesis test at oil by-products, producing chemical material. Dependant
variable Independent
variable β
Coefficient Std.
Error t-
Statistic Sig. Adjusted R-squared
F-Statistic
Durbin-Watson
Financial leverage Tax 1.030 0.1115 9.236 0.00 0.90 75.23 1.883
Table 8. results of hypothesis test at food, sugar and hard sugar. Dependant
variable Independent
variable β
Coefficient Std.
Error t-
Statistic Sig. Adjusted R-squared
F-Statistic
Durbin-Watson
Financial leverage Tax 0.676 0.0112 60.78 0.00 0.45 28.70 1.647
Table 9. results of hypothesis test at lime, plaster, tile and ceramics. Dependant
variable Independent
variable β
Coefficient Std.
Error t-
Statistic Sig. Adjusted R-squared
F-Statistic
Durbin-Watson
Financial leverage Tax 0.868 0.0797 10.88 0.00 0.790 122.12 2.184
Copyright © 2012. Academy of Knowledge Process
International Journal of Contemporary Business Studies Vol: 3, No: 11. November, 2012 ISSN 2156-7506 Available online at http://www.akpinsight.webs.com
46
Influence of Organizational Culture on Employee Work Behavior
OLU OJO
Department Of Business Administration College Of Management And Social Sciences
OSUN State University P. M. B. 2008, Okuku Osun State, Nigeria
ABSTRACT
This research work tries to examine the influence of organisational culture on employee work behaviour. We try to ascertain the influence that organisational culture has on employee work behaviour, and to formulate recommendations regarding organisational culture and employee work behaviour. In order to achieve the above objectives, the following research questions were asked: (i) Does organisational culture have any influence on employee work behaviour? (ii) In what way does organisational culture affect employee work behaviour? (iii) Does organisational culture affects organisational productivity? (iv) Will a change in organisational culture affects employee work behaviour? Three hypotheses were advanced: (i) Organisational culture have a significant influence on employee work behaviour. (ii) Organisational culture has a significant influence on organisational productivity. (iii) A change in organisational culture will cause a change in employee work behaviour. The study uses survey research method. Our respondents were selected by using stratified and simple random sampling techniques. Primary data were collected through questionnaire. Data were presented and analysed by means of simple percentage and our hypotheses were tested by chi-square test statistics. The findings of the study are: (i) That a large number of respondents 84.0% of the respondents agree that organisational culture influence employee work behaviour. (ii) 72.0% of the respondents agree that organisational culture is a determinant of productivity level of the organisation. (iii) 84.0% of the respondents agree that a change in culture will cause a change in employee work behaviour. In addition, the result of the findings shows that organisational culture i.e. norms, artefacts, values, traditions, assumptions and belief influences employee work behaviour. Recommendations were also made to the organisations that will find this study relevant to their course to make their culture simple and easy to grasp and adhere to so that their employees can be free to put in their best. Key Words: Organisational Culture, Employees, Employee Behaviour, Organisational Productivity.
International Journal of Contemporary Business Studies Vol: 3, No: 11. November, 2012 pp.46-57 ©Academy of Knowledge Process
Copyright © 2012. Academy of Knowledge Process
International Journal of Contemporary Business Studies Vol: 3, No: 11. November, 2012 ISSN 2156-7506 Available online at http://www.akpinsight.webs.com
47
INTRODUCTION An organisation is a collectivity with a relatively identifiable boundary, a normative order (rules), ranks of authority (hierarchy), communications system, and membership coordinating systems (procedures); this collectivity exists, on a relatively continuous basis in an environment, and engages in activities that are usually related to set of goals; the activities have outcomes for organisational members, the organisation itself, and for the society (Hall, 1999). The essence of organisations revolves around the development of shared meanings, beliefs, values and assumptions that guide and are reinforced by organisational behaviour. Employees are important asset to the organisation. They serve as human capital to the organisation. Organisations make use of their employees’ skills, knowledge and abilities in carrying out and fulfilling their objectives. Culture is the environment that surrounds employees at work all of the time. Culture is a powerful element that shapes employees work enjoyment, work relationships, and work processes. However, culture is something that one cannot actually see, except through its physical manifestations in work place. The culture of the organisation should be developed to support continuous improvement, improve employees’ style of performing their job and thus develop quality awareness. Organisational culture has influenced employee work behaviour as a result of the acceptable behaviours and attitudes to various jobs in the organisation. Organisational culture is a major determinant of an employee’s efficiency and effectiveness in carrying out their jobs. That is, organisational culture is one of the major key determinants of how employees perform or behaves in his job. Academic interest in organisational culture is evidenced by the level of attention it has received over the last few decades. The relationship between organisational culture and employee work behaviour has been the subject of abundant research in several fields. While this topic is rich in studies, many researchers concur on the fact that there is no agreement on the precise nature of the relationship between organisational culture and employee work behaviour. Despite the plethora of studies on organisational culture in the last few decades, there is no widely accepted causal relationship between organisational culture and employee work behaviour. The empirical evidences emerging from various studies about the effect of organisational culture on employee work behaviour have so far yielded mixed results that are inconclusive and contradictory. Because of these contradictory results, the question of whether organisational culture improves or worsens employee’s work behaviour is still worthy of further research such as the one being undertaken in this study. In addition, despite the existence of these studies, very little attention has been given to developing countries. This means that the impact of organisational culture on employee’s work behaviour has not received adequate research attention in Nigeria. Thus, there is a major gap in the relevant literature on Nigeria, which has to be covered by research. This research attempts to fill this gap by studying the situation of the Nigerian service industry and providing more empirical evidence on the effects of organisational culture on employee work behaviour in Nigeria. The explicit objectives of this study are: (i) to ascertain if organisational culture influence employee work behaviour. (ii) to find out if organisational culture affects organisational productivity. (iii) to disclose whether a change in organisational culture could lead to a change in employee work behaviour. Three hypotheses were also put forward. They are: (i) Organisational culture have a significant influence on employee work behaviour. (ii) Organisational culture has a significant influence on organisational productivity. (iii) A change in organisational culture will cause a change in employee work behaviour. These objectives and hypotheses guide the researcher in his study. Organisational culture is based on the history and
Copyright © 2012. Academy of Knowledge Process
International Journal of Contemporary Business Studies Vol: 3, No: 11. November, 2012 ISSN 2156-7506 Available online at http://www.akpinsight.webs.com
48
tradition of the organisation or what an organisation has been identified with to be consistent in doing from time past. It is the ability of the employee to adapt to this organisation tradition and systems that will enable him perform well in his job and thus boost organisational productivity. Therefore, this study will concentrate on organisational culture as a major factor that influences employee work behaviour. LITERATURE REVIEW Conceptual Framework of Organisational Culture The subject of organisational behaviour has been studied from a variety of perspectives ranging from disciplines such as anthropology and sociology, to the applied disciplines of organisational behaviour, management science, social sciences and organisational communication. The study of organisational culture has been widely accepted and explained by different scholars but there is no one definition of organisational culture that is generally accepted (Ojo, 2008). Organisational culture permeates organisational life in such a way as to influence every aspect of the organisation (Hallett, 2003). Organisational culture also has effect on the productivity level of the organisation in the sense that it influences employee’s behaviour to work and it is the input of the employees to the organisation that determines the organisational productivity level. It has been suggested that organizational culture affects such outcomes as productivity, performance, commitment, self confidence, and ethical behaviour (Buchanan and Huczynski, 2004; Shani and Lau, 2005; and Ojo, 2009). Organisational culture is one of the core determinants of every organisation’s success as it influences employee work behaviour. Organisational culture is one of the metaphors used for organisational analysis (Morgan, 1997). In this metaphor, the essence of organisation revolves around the development of shared meanings, beliefs, norms, values and assumptions that guide and are reinforced by organisational behaviour. Organisational values are important because they have effects on important individual and organisational outcomes. Organisational values are expected to produce higher levels of productivity (Jehn, 1994; Hall, 1999), job satisfaction (Jehn 1994), and commitment (Pettinger, 2000). Organisational values are also important because the fit between organisational and individual values affects important individual and organisational outcomes. Values-fit has been shown to affect application decisions (Cable and Judge, 1996; Cable and Judge, 1997; Scott, 2000a), job satisfaction (Bretz and Judge, 1994), and job tenure (Bretz and Judge, 1994; Ritchie, 2000). Organisational culture has been seen as the pattern or way a given group has invented, discovered or developed in carrying out a particular task or solving a particular problem or useful and effective in learning. This pattern must have worked well enough for the group to be considered valid and therefore must be taught to new members or entrants as the correct way to perceive, think and feel in relation to those problems. Organisation culture is a set of values that help organisational members know that which is acceptable and that which is unacceptable within the organisation (Ojo, 2010). How Organisational Culture Develops The values and norms which are the basis of culture are formed through the following four ways (Finegan, 2000).
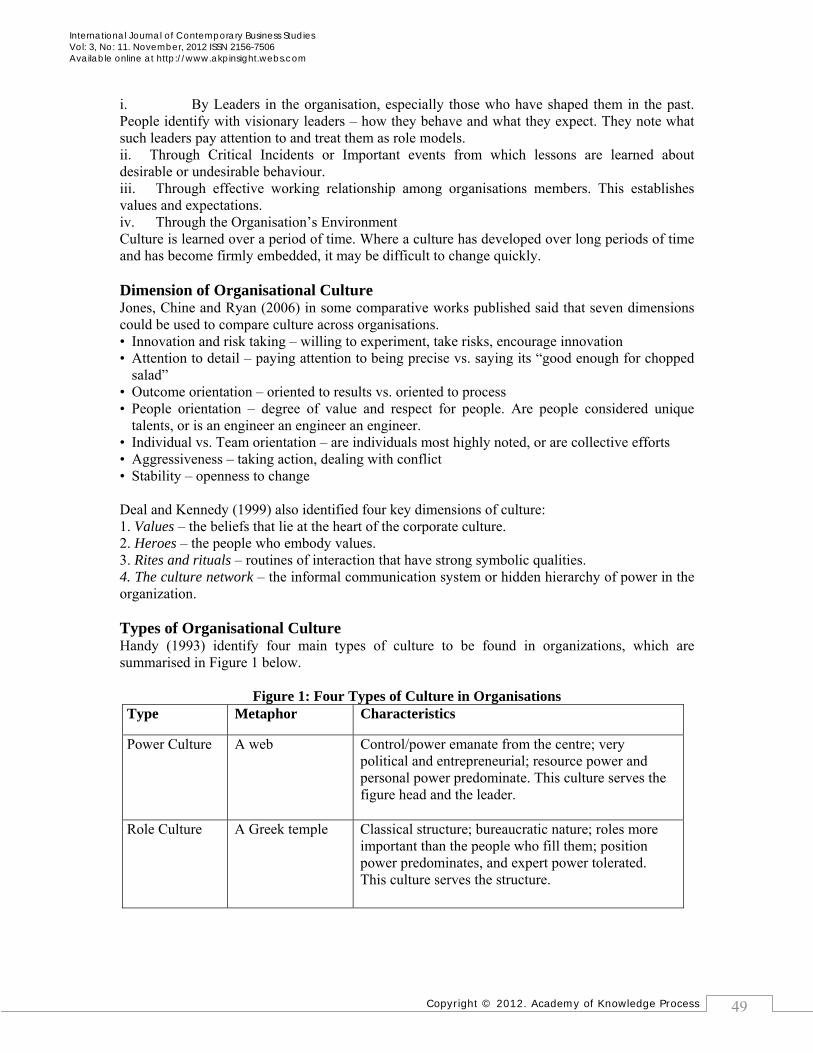
Copyright © 2012. Academy of Knowledge Process
International Journal of Contemporary Business Studies Vol: 3, No: 11. November, 2012 ISSN 2156-7506 Available online at http://www.akpinsight.webs.com
49
i. By Leaders in the organisation, especially those who have shaped them in the past. People identify with visionary leaders – how they behave and what they expect. They note what such leaders pay attention to and treat them as role models. ii. Through Critical Incidents or Important events from which lessons are learned about desirable or undesirable behaviour. iii. Through effective working relationship among organisations members. This establishes values and expectations. iv. Through the Organisation’s Environment Culture is learned over a period of time. Where a culture has developed over long periods of time and has become firmly embedded, it may be difficult to change quickly. Dimension of Organisational Culture Jones, Chine and Ryan (2006) in some comparative works published said that seven dimensions could be used to compare culture across organisations. • Innovation and risk taking – willing to experiment, take risks, encourage innovation • Attention to detail – paying attention to being precise vs. saying its “good enough for chopped
salad” • Outcome orientation – oriented to results vs. oriented to process • People orientation – degree of value and respect for people. Are people considered unique
talents, or is an engineer an engineer an engineer. • Individual vs. Team orientation – are individuals most highly noted, or are collective efforts • Aggressiveness – taking action, dealing with conflict • Stability – openness to change Deal and Kennedy (1999) also identified four key dimensions of culture: 1. Values – the beliefs that lie at the heart of the corporate culture. 2. Heroes – the people who embody values. 3. Rites and rituals – routines of interaction that have strong symbolic qualities. 4. The culture network – the informal communication system or hidden hierarchy of power in the organization. Types of Organisational Culture Handy (1993) identify four main types of culture to be found in organizations, which are summarised in Figure 1 below.
Figure 1: Four Types of Culture in Organisations Type Metaphor Characteristics
Power Culture
A web Control/power emanate from the centre; very political and entrepreneurial; resource power and personal power predominate. This culture serves the figure head and the leader.
Role Culture A Greek temple Classical structure; bureaucratic nature; roles more important than the people who fill them; position power predominates, and expert power tolerated. This culture serves the structure.
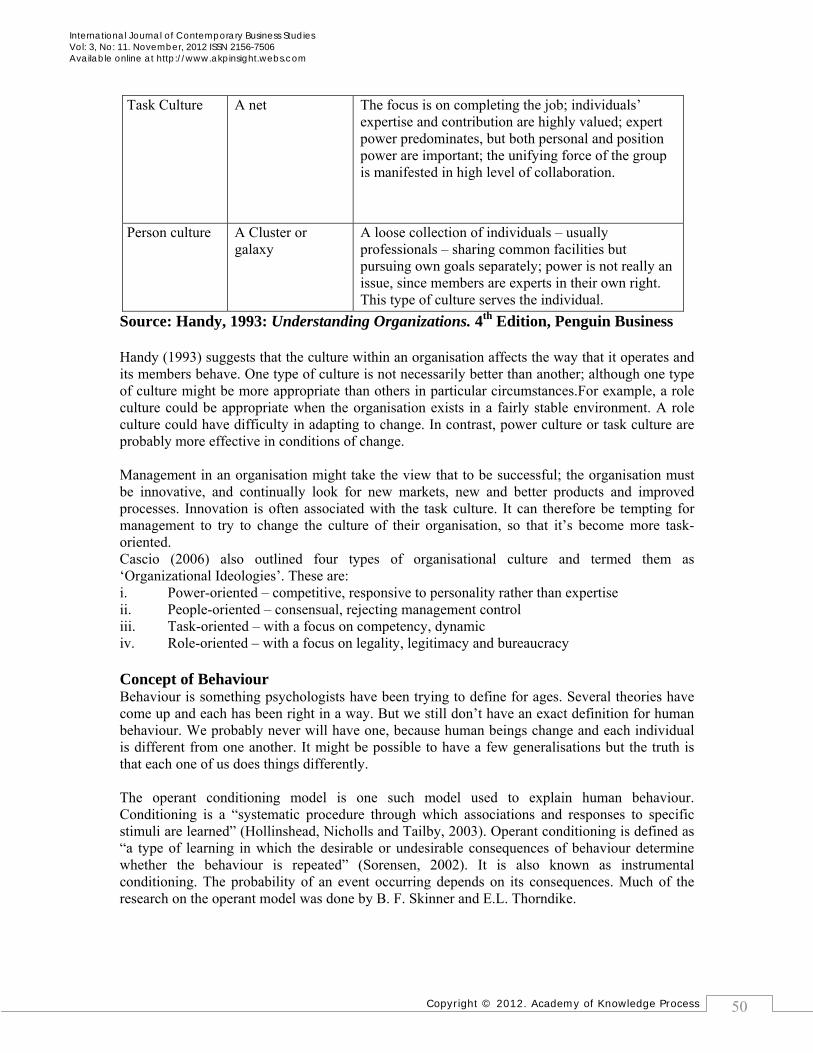
Copyright © 2012. Academy of Knowledge Process
International Journal of Contemporary Business Studies Vol: 3, No: 11. November, 2012 ISSN 2156-7506 Available online at http://www.akpinsight.webs.com
50
Task Culture A net The focus is on completing the job; individuals’ expertise and contribution are highly valued; expert power predominates, but both personal and position power are important; the unifying force of the group is manifested in high level of collaboration.
Person culture A Cluster or galaxy
A loose collection of individuals – usually professionals – sharing common facilities but pursuing own goals separately; power is not really an issue, since members are experts in their own right. This type of culture serves the individual.
Source: Handy, 1993: Understanding Organizations. 4th Edition, Penguin Business Handy (1993) suggests that the culture within an organisation affects the way that it operates and its members behave. One type of culture is not necessarily better than another; although one type of culture might be more appropriate than others in particular circumstances.For example, a role culture could be appropriate when the organisation exists in a fairly stable environment. A role culture could have difficulty in adapting to change. In contrast, power culture or task culture are probably more effective in conditions of change. Management in an organisation might take the view that to be successful; the organisation must be innovative, and continually look for new markets, new and better products and improved processes. Innovation is often associated with the task culture. It can therefore be tempting for management to try to change the culture of their organisation, so that it’s become more task-oriented. Cascio (2006) also outlined four types of organisational culture and termed them as ‘Organizational Ideologies’. These are: i. Power-oriented – competitive, responsive to personality rather than expertise ii. People-oriented – consensual, rejecting management control iii. Task-oriented – with a focus on competency, dynamic iv. Role-oriented – with a focus on legality, legitimacy and bureaucracy Concept of Behaviour Behaviour is something psychologists have been trying to define for ages. Several theories have come up and each has been right in a way. But we still don’t have an exact definition for human behaviour. We probably never will have one, because human beings change and each individual is different from one another. It might be possible to have a few generalisations but the truth is that each one of us does things differently. The operant conditioning model is one such model used to explain human behaviour. Conditioning is a “systematic procedure through which associations and responses to specific stimuli are learned” (Hollinshead, Nicholls and Tailby, 2003). Operant conditioning is defined as “a type of learning in which the desirable or undesirable consequences of behaviour determine whether the behaviour is repeated” (Sorensen, 2002). It is also known as instrumental conditioning. The probability of an event occurring depends on its consequences. Much of the research on the operant model was done by B. F. Skinner and E.L. Thorndike.
Copyright © 2012. Academy of Knowledge Process
International Journal of Contemporary Business Studies Vol: 3, No: 11. November, 2012 ISSN 2156-7506 Available online at http://www.akpinsight.webs.com
51
But the basic principle that governs operant conditioning is known as the law of effect. The law states that behaviours followed by desirable outcomes are more likely to recur than behaviours with unpleasant outcomes and vice versa. Rewards and punishments do affect our behaviour.Shaping is an operant conditioning procedure in which “closer and closer approximations of the desired behaviours are reinforced, as a way of eventually producing the desired behaviour” (Osland, Kold and Rubin 2001; McShane and von Glinow, 2008). METHODOLOGY In this section, the researcher detailed the research methodology used to achieve the purpose of the study. The survey research design was used in this study. Survey research design was chosen because the sampled elements and the variables that are being studied are simply being observed as they are without making any attempt to control or manipulate them (Ojo, 2003). The theoretical population of the study consists of the entire workers of Nestle Nigeria PLC, Ikeja, Lagos State, Nigeria. For effective coverage and lower cost, stratified sampling technique was used to select the participating respondents. The workers were stratified into junior, intermediate, and senior cadres. Thereafter, a total of 55 employees were selected using simple random sampling method. However, only 50 out of 55 respondents returned filled questionnaire and were used for final analysis in this study. It is the believe of the researcher that the sampled elements for the study have significant understanding of the concepts and terminologies used in the study and contained in the questionnaire they completed. This premise was based on the educational background of the respondents in which only 8% of them have General Certificate of Education “Ordinary Level” while the remaining 92% of the respondents possessed higher educational qualification. Primary data collected through the administration of questionnaire were used for this study. The questionnaire was titled “Organisational Culture and Employee Work Behaviour Questionnaire” One important way of ensuring that we have used the right instrument and have taken correct measurement is that our outcome must be in consonance with two major criteria for measuring quality known as validity and reliability (Ojo, 2003). To ensure the validity and reliability of the questionnaire used for the study, even number of experts were consulted to look at the questionnaire items in relation to its ability to achieve the stated objectives of the research, level of coverage, comprehensibility, logicality and suitability for prospective respondents. Data collected from the questionnaire were analysed, summarised, and interpreted accordingly with the aid of descriptive statistical techniques such as total score and simple percentage. Chi-square was used to measure the discrepancies existing between the observed and expected frequency and to proof the level of significance in testing stated hypotheses.
TESTING OF HYPOTHESES AND DISCUSSION OF RESULTS In this section we shall be concerned with two things; hypotheses testing and discussion of results. There are various statistical tools that can be use for testing of hypotheses but this research work will be limited to the use of chi-square (x2) statistical tool. Hypothesis 1 H0 Organisational culture has no significant influence on employee work behaviour H1 Organisational culture has a significant influence on employee work behaviour
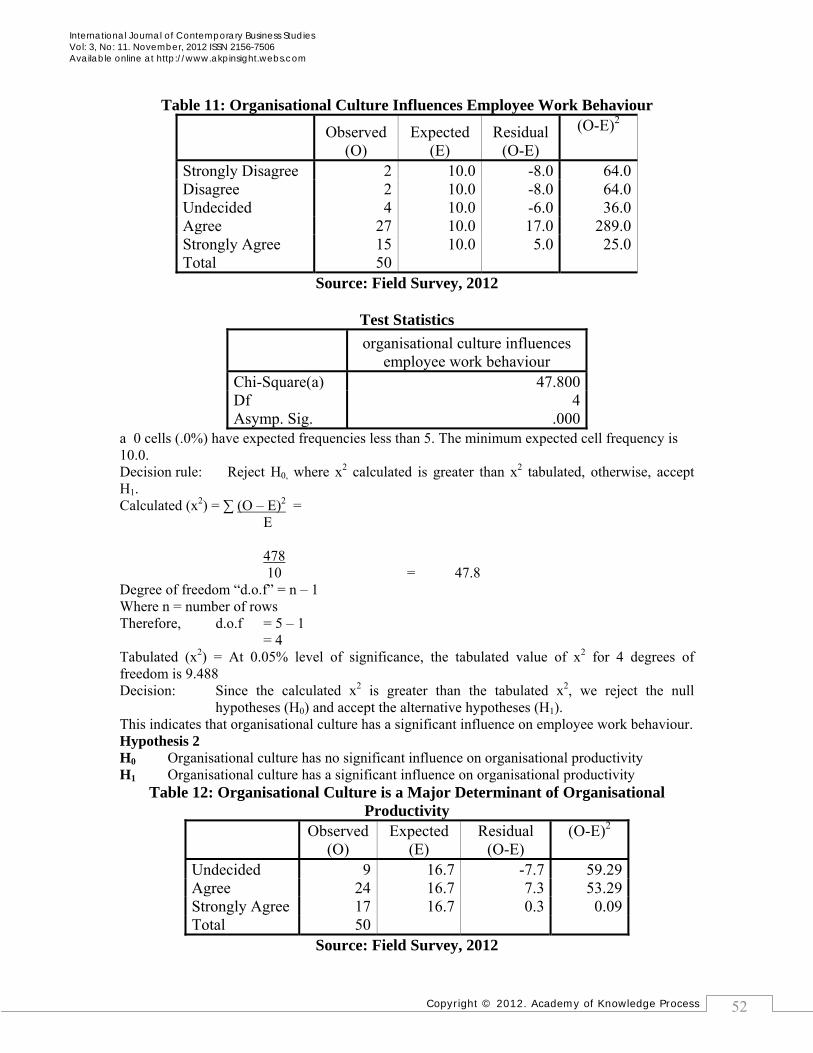
Copyright © 2012. Academy of Knowledge Process
International Journal of Contemporary Business Studies Vol: 3, No: 11. November, 2012 ISSN 2156-7506 Available online at http://www.akpinsight.webs.com
52
Table 11: Organisational Culture Influences Employee Work Behaviour
Observed
(O) Expected
(E) Residual
(O-E) (O-E)2
Strongly Disagree 2 10.0 -8.0 64.0 Disagree 2 10.0 -8.0 64.0 Undecided 4 10.0 -6.0 36.0 Agree 27 10.0 17.0 289.0 Strongly Agree 15 10.0 5.0 25.0 Total 50
Source: Field Survey, 2012
Test Statistics
organisational culture influences
employee work behaviour Chi-Square(a) 47.800 Df 4 Asymp. Sig. .000
a 0 cells (.0%) have expected frequencies less than 5. The minimum expected cell frequency is 10.0. Decision rule: Reject H0, where x2 calculated is greater than x2 tabulated, otherwise, accept H1. Calculated (x2) = ∑ (O – E)2 = E
478
10 = 47.8 Degree of freedom “d.o.f” = n – 1 Where n = number of rows Therefore, d.o.f = 5 – 1 = 4 Tabulated (x2) = At 0.05% level of significance, the tabulated value of x2 for 4 degrees of freedom is 9.488 Decision: Since the calculated x2 is greater than the tabulated x2, we reject the null
hypotheses (H0) and accept the alternative hypotheses (H1). This indicates that organisational culture has a significant influence on employee work behaviour. Hypothesis 2 H0 Organisational culture has no significant influence on organisational productivity H1 Organisational culture has a significant influence on organisational productivity
Table 12: Organisational Culture is a Major Determinant of Organisational Productivity
Observed
(O) Expected
(E) Residual
(O-E) (O-E)2
Undecided 9 16.7 -7.7 59.29 Agree 24 16.7 7.3 53.29 Strongly Agree 17 16.7 0.3 0.09 Total 50
Source: Field Survey, 2012
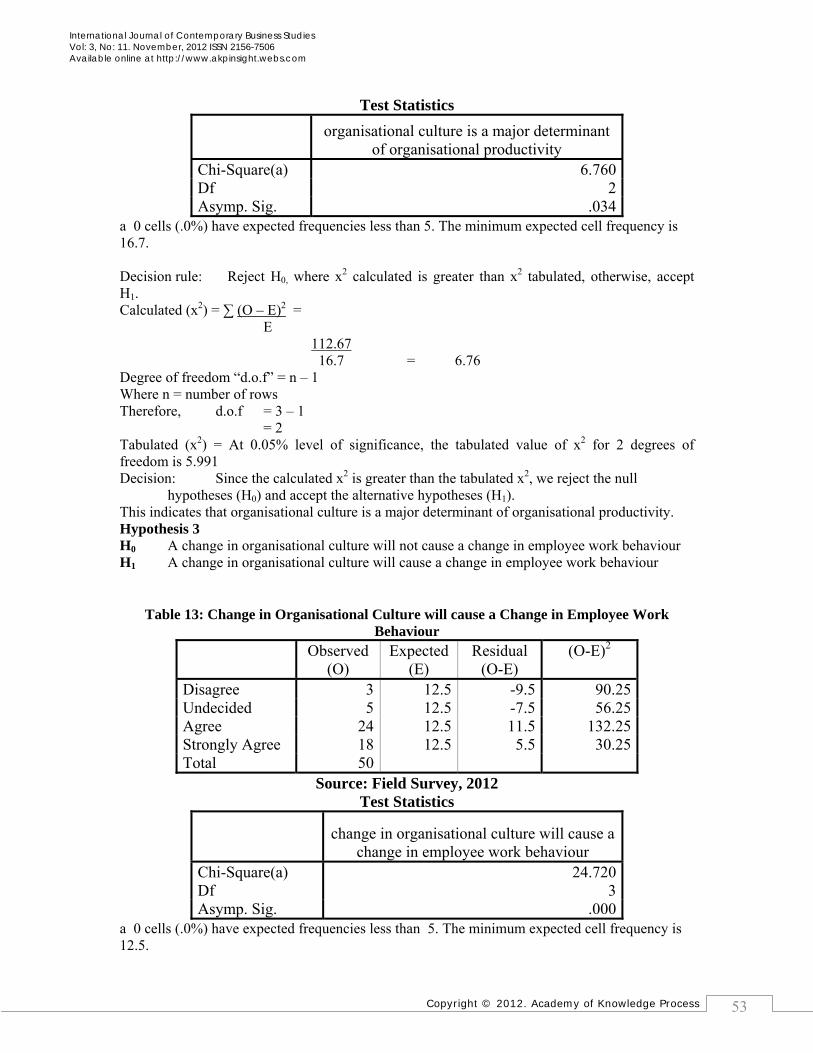
Copyright © 2012. Academy of Knowledge Process
International Journal of Contemporary Business Studies Vol: 3, No: 11. November, 2012 ISSN 2156-7506 Available online at http://www.akpinsight.webs.com
53
Test Statistics
organisational culture is a major determinant
of organisational productivity Chi-Square(a) 6.760 Df 2 Asymp. Sig. .034
a 0 cells (.0%) have expected frequencies less than 5. The minimum expected cell frequency is 16.7. Decision rule: Reject H0, where x2 calculated is greater than x2 tabulated, otherwise, accept H1. Calculated (x2) = ∑ (O – E)2 = E 112.67 16.7 = 6.76 Degree of freedom “d.o.f” = n – 1 Where n = number of rows Therefore, d.o.f = 3 – 1 = 2 Tabulated (x2) = At 0.05% level of significance, the tabulated value of x2 for 2 degrees of freedom is 5.991 Decision: Since the calculated x2 is greater than the tabulated x2, we reject the null hypotheses (H0) and accept the alternative hypotheses (H1). This indicates that organisational culture is a major determinant of organisational productivity. Hypothesis 3 H0 A change in organisational culture will not cause a change in employee work behaviour H1 A change in organisational culture will cause a change in employee work behaviour
Table 13: Change in Organisational Culture will cause a Change in Employee Work Behaviour
Observed
(O) Expected
(E) Residual
(O-E) (O-E)2
Disagree 3 12.5 -9.5 90.25 Undecided 5 12.5 -7.5 56.25 Agree 24 12.5 11.5 132.25 Strongly Agree 18 12.5 5.5 30.25 Total 50
Source: Field Survey, 2012 Test Statistics
change in organisational culture will cause a
change in employee work behaviour Chi-Square(a) 24.720 Df 3 Asymp. Sig. .000
a 0 cells (.0%) have expected frequencies less than 5. The minimum expected cell frequency is 12.5.
Copyright © 2012. Academy of Knowledge Process
International Journal of Contemporary Business Studies Vol: 3, No: 11. November, 2012 ISSN 2156-7506 Available online at http://www.akpinsight.webs.com
54
Decision rule: Reject H0, where x2 calculated is greater than x2 tabulated, otherwise, accept H1. Calculated (x2) = ∑ (O – E)2 E 309 12.5 = 24.72 Degree of freedom “d.o.f” = n – 1 Where n = number of rows Therefore, d.o.f = 4 – 1 = 3 Tabulated (x2) = At 0.05% level of significance, the tabulated value of x2 for 3 degrees of freedom is 7.815 Decision: Since the calculated x2 is greater than the tabulated x2, we reject the null
hypotheses (H0) and accept the alternative hypotheses (H1). This implies that a change in organisational culture will cause a change in employee work behaviour. Based on analysed data, the findings in this study include the followings: (i) A large number of respondents 84.0% of the respondents agree that organisational culture influence employee work behaviour. (ii) 72.0% of the respondents agree that organisational culture is a determinant of productivity level of the organisation. (iii) 84.0% of the respondents agree that a change in culture will cause a change in employee work behaviour. (iv) 54.0% of the respondents agree that organisational norm is a major determinant of organisational culture. (v) Majority of the respondents (56.0%) agree that organisational artefact is a major factor of organisational culture. (vi) Organisational values influence employee work performance as 50.0% of the respondents agree to this. (vii) Adequate motivational factors improve employee work behaviour. 46.0% of the respondents agree to this. From the hypotheses tested, we are able to discover the following: (i) In testing the first hypothesis, the calculated x2 is greater than the tabulated x2, we therefore reject the null hypotheses (H0) and accept the alternative hypotheses (H1). This indicates that organisational culture has a significant influence on employee work behaviour.
(ii) When the second hypothesis was tested, the calculated x2 is greater than the tabulated x2, we therefore reject the null hypotheses (H0) and accept the alternative hypotheses (H1). This indicates that organisational culture is a major determinant of organisational productivity. (iii) Finally, when the third hypothesis was tested it was also discovered that the calculated x2 is greater than the tabulated x2, we reject the null hypotheses (H0) and accept the alternative hypotheses (H1). This implies that a change in organisational culture will cause a change in employee work behaviour. CONCLUSION In this study, the researcher tried to look at the analysis of the influence of organisational culture on employee work behaviour with evidence drawn from Nestle Nigeria Plc.Questionnaires were
Copyright © 2012. Academy of Knowledge Process
International Journal of Contemporary Business Studies Vol: 3, No: 11. November, 2012 ISSN 2156-7506 Available online at http://www.akpinsight.webs.com
55
administered to respondents who are employees at Nestle Nigeria Plc. to find out their opinions and views about organisational culture and its influence on employee work behaviour. The main focus of this study is to make recommendations that will help managements to create, maintain, sustain and otherwise modify culture in a way that it will help improve employee work behaviour. The conclusions we can deduce from the study among other things are that: (i) organisational culture influence employee work behaviour in the organisation. (ii) organisational culture is a determinant of the productivity level of the organisation in the sense that it influences employee’s behaviour to work and it is the input of the employees to the organisation that determines its productivity level. (iii) a change in organisational culture will lead to a change in employee work behaviour in the sense that it is not what has been identified with the organisation from time past. Therefore, organisations should make the changes in their culture easy for their employees to learn and adapt to. (iv) organisational culture has a significant
influence on employee work behaviour. RECOMMENDATIONS The following recommendations are made to the management of Nestle Nigeria Plc. and organisations that are interested in setting up or modifying their culture in order to improve their employee’s work behaviour. (i) Every individual has different culture and beliefs that he works with and when he comes to an organisation that has a completely different culture and beliefs from his own, he must be allow to internalise himself first with the organisation’s culture and beliefs to know whether he can cope with them or not. It is the ability of the employee to cope with the organisations culture that will determine how he behaves at work. It is strongly recommended that Nestle Nigeria Plc. should encourage new entrants to get internalise first with the organisations culture to know whether they can cope with them or not. (ii) Adequate motivational factors must be put in place in the organisation for workers because it improves employee living standard and thus gingers employee towards achieving higher productivity. It is strongly recommended that Nestle Nigeria Plc. should provide adequate motivational factors like housing allowance, car loan, holiday allowance, health allowance, etc that will make their employee feel comfortable with themselves and their job and thus thrive towards higher productivity. Hardworking and productive employees should also be compensated as and when due. (iii) When an organisation culture is unstable and changes from time to time, it makes the employee discourage and tired of learning different culture all the time. It is strongly recommended that Nestle Nigeria Plc. should operate with a strong culture and not weak culture. It is a weak culture that changes from time to time. Strong cultures are cultures that are established by the founders of an organisation to become the organisations way of life. (iv) In cases where an organisational culture must be change, employees must first of all be notified and made to learn the modification of the old culture or otherwise the new culture. Organisations are recommended to always make their workers comfortable with their culture as this will reduce the rate of employee turnover. (v) Finally, organisational culture of Nestle Nigeria Plc. must be binding on all members and staff of the company as this will encourage uniformity among members of the organisation and thus enhance commitment and group efficiency.
Copyright © 2012. Academy of Knowledge Process
International Journal of Contemporary Business Studies Vol: 3, No: 11. November, 2012 ISSN 2156-7506 Available online at http://www.akpinsight.webs.com
56
REFERENCES
Bretz, R. D. and Judge, T. (1994). Person-Organization Fit and the Theory of Work Adjustment: Implications for Satisfaction, Tenure, and Career Success. Journal of Vocational Behavior, 44: 32-54.
Buchanan, D. and Huczynski, A. (2004). Organizational Behaviour: An Introductory Text. (5th ed.). Essex: Prentice Hall Financial Times.
Cable, D. M. and Judge, T. A. (1996). Person-Organization Fit, Job Choice Decisions, and Organizational Entry. Organizational Behavior and Human Decision Processes, 67(3): 294-311.
Cable, D. M. and Judge, T. A. (1997). Interviewers Perceptions of Person-Organization Fit and Organizational Selection Decisions. Journal of Applied Psychology, 82(4): 546-561.
Cascio, W. F. (2006). Managing Human Resources: Productivity, Quality of Life, Profits.7th Edition, Irwin: McGraw-Hill.
Deal, T. and Kennedy, A. (1999). The New Corporate Cultures: Revitalizing the Workplace After Downsizing, Mergers and Reengineering. Perseus.
Finegan, J. E. (2000). The Impact of Person and Organizational Values on Organizational Commitment. Journal of Occupational and Organizational Psychology, 73(2): 149-169.
Hall, R. (1999). Organizations: Structures, Processes and Outcomes. Eaglewood Cliffs, NJ: Prentice Hall.
Hallett, T. (2003). Symbolic Power and Organizational Culture, Sociological Theory, Vol. 21, No. 2. pp. 128-149.
Handy, C. (1993). Understanding Organizations. Penguin Business, 4th Edition.
Hollinshead, G., Nicholls, P. and Tailby, S. (2003). Employee Relations.2nd Edition Eaglewood Cliffs, NJ: Financial Times Prentice Hall.
Jehn, K. A. (1994). Enhancing Effectiveness, An Investigation of Advantages and Disadvantages of Value-Based Intragroup Conflict. The International Journal of Conflict Management, 5(3): 223-238.
Jones, M. C., Cline, M. and Ryan, S. (2006). Exploring Knowledge Sharing in ERP Implementation: An Organizational Culture Framework. Decision Support Systems 41:2, 411-434.
McShane, S. L. and von Glinow, M. A. (2008). Organizational Behaviour. 4th Edition, Irwin: McGraw-Hill.
Morgan, G. (1997). Images of Organizations. Thousand Oaks, CA: Sage Publications
Copyright © 2012. Academy of Knowledge Process
International Journal of Contemporary Business Studies Vol: 3, No: 11. November, 2012 ISSN 2156-7506 Available online at http://www.akpinsight.webs.com
57
Ojo, O. (2003). Fundamentals of Research Methods. Lagos: Standard Publications.
Ojo, O. (2008). Organisational Culture and Performance: Empirical Investigation of Nigerian Insurance Companies, Manager Journal, No. 2, pp. 118-127.
Ojo, O. (2009). Impact Assessment of Corporate Culture on Employee Job Performance, Business Intelligence Journal, Vol. 2, No. 2, pp. 388-397.
Ojo, O. (2010). Organisational Culture and Corporate Performance: Empirical Evidence from Nigeria, Journal of Business Systems, Governance and Ethics, Vol. 5, No. 2, pp.1-12.
Osland, J. S., Kold, D. A. and Rubin, I. M. (2001). Organizational Behaviour: An Experimental Approach. New Jersey: Upper Saddle River.
Pettinger, R. (2000). Mastering Organizational Behaviour. New York: Palgrave.
Ritchie, M. (2000). Organizational Culture: An Examination of Its Effect on the Internalization Process and Member Performance. South Carolina: Southern Business.
Scott, E. D. (2000a). Moral Values Fit: Do Applicants Really Care? Business Ethics, 4: 405-435
Shani, A.B. and Lau, J. B. (2005) Behaviour in Organizations: An Experiential Approach
(8th ed.), New York: McGraw-Hill Irwin. Sorensen, J. B. (2002). The Strength of Corporate Culture and the Reliability of Firm Performance. Administrative Science Quarterly, Vol. 47, No. 1. pp.70-91.

Copyright © 2012. Academy of Knowledge Process
International Journal of Contemporary Business Studies Vol: 3, No: 11. November, 2012 ISSN 2156-7506 Available online at http://www.akpinsight.webs.com
58
Enrich the Knowledge through
Quality Research
An International Journal Published by Academy of Knowledge Process
www.akpinsight.webs.com Copyright © 2012 IJCBS
Related Documents