applied sciences Article Influence of Multiple Openings on Reinforced Concrete Outrigger Walls in a Tall Building Han-Soo Kim * , Yi-Tao Huang and Hui-Jing Jin Department of Architecture, Konkuk University, Seoul 05029, Korea; [email protected] (Y.-T.H.); [email protected] (H.-J.J.) * Correspondence: [email protected]; Tel.: +82-2-2049-6110 Received: 1 October 2019; Accepted: 13 November 2019; Published: 15 November 2019 Featured Application: The reinforced concrete outrigger wall with multiple openings can be used to replace the conventional steel outrigger trusses in tall building structures. Abstract: Outrigger systems have been used to control the lateral displacement of tall buildings. Reinforced concrete (R.C.) outrigger walls with openings can be used to replace conventional steel outrigger trusses. In this paper, a structural model for an R.C. outrigger wall with multiple openings was proposed, and the effects of the multiple openings on the stiffness and strength of the outrigger walls were evaluated. The equivalent bending stiffness of the outrigger wall was derived to predict the lateral displacement at the top of tall buildings and internal shear force developed in the wall. The openings for the passageway in the wall were designed by the strut-and-tie model. The stiffness and strength of the outrigger wall with multiple openings was analyzed by the nonlinear finite element analysis. Taking into consideration the degradation in stiffness and strength, the ratio of the opening area to the outrigger wall area is recommended to be less than 20%. The degradation of stiffness due to openings does not affect the structural performance of the outrigger system when the outrigger has already large stiffness as the case of reinforced concrete outrigger walls. Keywords: outrigger wall; multiple openings; deep beam; stiffness; shear strength; tall building 1. Introduction With the development of tall building structures, the outrigger system has become one of the most popular structural systems that control the lateral displacement of such buildings. Several researchers and engineers have been studying and developing the outrigger system because it performs well in controlling the lateral displacement at the top of a tall building by reducing the overturning moment [1]. For example, the Shanghai Tower, Hong Kong IFC2, and Taipei 101 are successful applications of the system in tall buildings [2]. Most of the previous research studies focused on the optimum location of outriggers and lateral stiffness of the whole structure. Taranath [3] assumed a rigid outrigger beam for single-outrigger structures, and proposed that the optimum location of an outrigger is 0.455 of the total height from the top. McNabb and Muvdi [4] proposed that the optimum locations for two outriggers are 0.312 and 0.685 of the total height from the top based on Taranath’s research. Smith and Nwaka [5] presented generalized results for optimum locations in multi-outrigger structures by assuming rigid outriggers in flexure. Smith and Salim [6] proposed equations for the optimum locations of outriggers by considering their flexibility. Hoenderkamper and Bakker [7] considered the bending and racking shear stiffness of the outrigger truss to determine the optimum location of the outrigger. The research studies on outrigger-braced structures have been summarized and some further studies have been attempted by Wu and Li [8]. Recently, Kim et al. [9] proposed a dual-purpose outrigger system to reduce the lateral displacement and differential column shortening. Appl. Sci. 2019, 9, 4913; doi:10.3390/app9224913 www.mdpi.com/journal/applsci

Welcome message from author
This document is posted to help you gain knowledge. Please leave a comment to let me know what you think about it! Share it to your friends and learn new things together.
Transcript
applied sciences
Article
Influence of Multiple Openings on ReinforcedConcrete Outrigger Walls in a Tall Building
Han-Soo Kim * , Yi-Tao Huang and Hui-Jing Jin
Department of Architecture, Konkuk University, Seoul 05029, Korea; [email protected] (Y.-T.H.);[email protected] (H.-J.J.)* Correspondence: [email protected]; Tel.: +82-2-2049-6110
Received: 1 October 2019; Accepted: 13 November 2019; Published: 15 November 2019�����������������
Featured Application: The reinforced concrete outrigger wall with multiple openings can be usedto replace the conventional steel outrigger trusses in tall building structures.
Abstract: Outrigger systems have been used to control the lateral displacement of tall buildings.Reinforced concrete (R.C.) outrigger walls with openings can be used to replace conventional steeloutrigger trusses. In this paper, a structural model for an R.C. outrigger wall with multiple openingswas proposed, and the effects of the multiple openings on the stiffness and strength of the outriggerwalls were evaluated. The equivalent bending stiffness of the outrigger wall was derived to predictthe lateral displacement at the top of tall buildings and internal shear force developed in the wall.The openings for the passageway in the wall were designed by the strut-and-tie model. The stiffnessand strength of the outrigger wall with multiple openings was analyzed by the nonlinear finiteelement analysis. Taking into consideration the degradation in stiffness and strength, the ratio ofthe opening area to the outrigger wall area is recommended to be less than 20%. The degradation ofstiffness due to openings does not affect the structural performance of the outrigger system when theoutrigger has already large stiffness as the case of reinforced concrete outrigger walls.
Keywords: outrigger wall; multiple openings; deep beam; stiffness; shear strength; tall building
1. Introduction
With the development of tall building structures, the outrigger system has become one of the mostpopular structural systems that control the lateral displacement of such buildings. Several researchersand engineers have been studying and developing the outrigger system because it performs well incontrolling the lateral displacement at the top of a tall building by reducing the overturning moment [1].For example, the Shanghai Tower, Hong Kong IFC2, and Taipei 101 are successful applications of thesystem in tall buildings [2]. Most of the previous research studies focused on the optimum location ofoutriggers and lateral stiffness of the whole structure. Taranath [3] assumed a rigid outrigger beam forsingle-outrigger structures, and proposed that the optimum location of an outrigger is 0.455 of the totalheight from the top. McNabb and Muvdi [4] proposed that the optimum locations for two outriggersare 0.312 and 0.685 of the total height from the top based on Taranath’s research. Smith and Nwaka [5]presented generalized results for optimum locations in multi-outrigger structures by assuming rigidoutriggers in flexure. Smith and Salim [6] proposed equations for the optimum locations of outriggersby considering their flexibility. Hoenderkamper and Bakker [7] considered the bending and rackingshear stiffness of the outrigger truss to determine the optimum location of the outrigger. The researchstudies on outrigger-braced structures have been summarized and some further studies have beenattempted by Wu and Li [8]. Recently, Kim et al. [9] proposed a dual-purpose outrigger system toreduce the lateral displacement and differential column shortening.
Appl. Sci. 2019, 9, 4913; doi:10.3390/app9224913 www.mdpi.com/journal/applsci
Appl. Sci. 2019, 9, 4913 2 of 18
Even though some researchers assumed equivalent beams for the outriggers to derive equationsfor the optimum locations, most of the outriggers built were made of steel trusses. Although thereare a few applications of reinforced concrete outrigger walls, such as Chong Qing Raffles City [10],discussing the walls is not enough. Furthermore, too little attention has been paid to the reinforcedconcrete outrigger walls with openings.
In theory, the deeper the outrigger, the stiffer the structure [11]. It means that a deep outrigger,such as an outrigger wall, can provide more effective lateral load-resistance for high-rise structures.At the same time, reinforced concrete outrigger walls can be cost-effective systems because of thesame construction procedure as reinforced concrete core walls. However, as large concrete structures,the reinforced concrete outrigger walls are heavy and space consuming. As a result, it is necessary tosolve the problems associated with making better use of the space occupied by outrigger walls. In thisstudy, a model for arranging multiple openings on reinforced concrete outrigger walls, as shown inFigure 1, is proposed. Moreover, the study investigates the influence of multiple openings on thestiffness and strength of the outrigger walls and whole tall building structure.
Appl. Sci. 2019, 9, x FOR PEER REVIEW 2 of 18
Recently, Kim et al. [9] proposed a dual-purpose outrigger system to reduce the lateral displacement and differential column shortening.
Even though some researchers assumed equivalent beams for the outriggers to derive equations for the optimum locations, most of the outriggers built were made of steel trusses. Although there are a few applications of reinforced concrete outrigger walls, such as Chong Qing Raffles City [10], discussing the walls is not enough. Furthermore, too little attention has been paid to the reinforced concrete outrigger walls with openings.
In theory, the deeper the outrigger, the stiffer the structure [11]. It means that a deep outrigger, such as an outrigger wall, can provide more effective lateral load-resistance for high-rise structures. At the same time, reinforced concrete outrigger walls can be cost-effective systems because of the same construction procedure as reinforced concrete core walls. However, as large concrete structures, the reinforced concrete outrigger walls are heavy and space consuming. As a result, it is necessary to solve the problems associated with making better use of the space occupied by outrigger walls. In this study, a model for arranging multiple openings on reinforced concrete outrigger walls, as shown in Figure 1, is proposed. Moreover, the study investigates the influence of multiple openings on the stiffness and strength of the outrigger walls and whole tall building structure.
Figure 1. A typical tall building structure with reinforced concrete outriggers walls with multiple openings.
Given the aspect ratio of the outrigger walls, they can be designed as deep beams with openings. Kong and Sharpe [12] proposed a shear strength equation for deep reinforced concrete beams with web openings. Tan et al. [13] have predicted the capacity of deep beams with openings using the strut-and-tie model. Tang and Tan [14] paid more attention in the evaluation of the ultimate shear strength of deep beams, but there was only an opening in every shear region while the opening is placed in the critical load path. Although several studies have been performed on deep beams with web openings, there are still difficulties in predicting the structural behavior of deep beams with
Figure 1. A typical tall building structure with reinforced concrete outriggers walls withmultiple openings.
Given the aspect ratio of the outrigger walls, they can be designed as deep beams with openings.Kong and Sharpe [12] proposed a shear strength equation for deep reinforced concrete beams withweb openings. Tan et al. [13] have predicted the capacity of deep beams with openings using thestrut-and-tie model. Tang and Tan [14] paid more attention in the evaluation of the ultimate shearstrength of deep beams, but there was only an opening in every shear region while the opening is
Appl. Sci. 2019, 9, 4913 3 of 18
placed in the critical load path. Although several studies have been performed on deep beams with webopenings, there are still difficulties in predicting the structural behavior of deep beams with multipleopenings. In this study, analytic equations used to predict the internal shear forces on outrigger wallsdue to the lateral loads are derived and the results are verified through numerical examples. After that,an outrigger wall with four openings was proposed through the strut-and-tie model. Subsequently,the linear and nonlinear finite element method and strut-and-tie model were used to evaluate theinfluence of the size of multiple openings on the stiffness and shear strength of reinforced concreteoutrigger walls. The study ends up investigating the influence of multiple openings on the lateraldisplacement of whole tall building structures by using the proposed analytic equations.
2. Design of Reinforced Concrete Outrigger Wall with Multiple Openings
In this section, analytic equations used to predict the lateral displacement at the top of thebuilding and shear forces developed in each outrigger wall are derived and verified with the result offinite element analysis. Subsequently, a structural model for the outrigger wall with four openingsis proposed.
2.1. Effect and Demand of Outrigger Walls
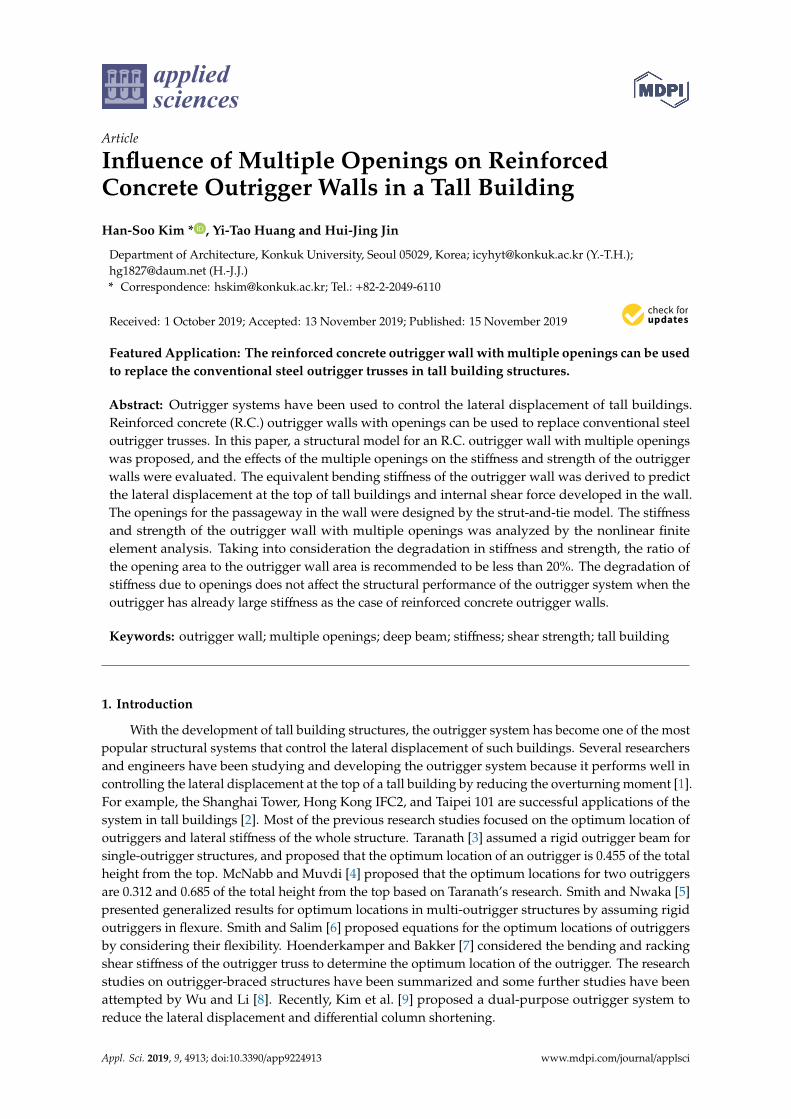
The internal shear force of the outrigger walls due to lateral loads is derived based on thesimplified model of the core wall and outrigger structural system [15]. A simplified model of tallbuilding structures with multiple outriggers is shown in Figure 2. The core wall is connected to theperimeter columns through the outriggers. When lateral loads are applied at the central core wall,the outrigger develops axial forces in the perimeter columns. The limitation of the simplified modelis that only flexural deformation of the outrigger is considered, and the length of the outrigger isassumed as the distance from the center of the core to that of the perimeter column. These assumptionsare different from the actual behavior of outrigger walls. To enhance the accuracy of this simplifiedmodel, an equivalent bending stiffness (EI)O was proposed by considering the shear deformation ofbeams and the clear span of outrigger walls.
Appl. Sci. 2019, 9, x FOR PEER REVIEW 3 of 18
multiple openings. In this study, analytic equations used to predict the internal shear forces on outrigger walls due to the lateral loads are derived and the results are verified through numerical examples. After that, an outrigger wall with four openings was proposed through the strut-and-tie model. Subsequently, the linear and nonlinear finite element method and strut-and-tie model were used to evaluate the influence of the size of multiple openings on the stiffness and shear strength of reinforced concrete outrigger walls. The study ends up investigating the influence of multiple openings on the lateral displacement of whole tall building structures by using the proposed analytic equations.
2. Design of Reinforced Concrete Outrigger Wall with Multiple Openings
In this section, analytic equations used to predict the lateral displacement at the top of the building and shear forces developed in each outrigger wall are derived and verified with the result of finite element analysis. Subsequently, a structural model for the outrigger wall with four openings is proposed.
2.1. Effect and Demand of Outrigger Walls
The internal shear force of the outrigger walls due to lateral loads is derived based on the simplified model of the core wall and outrigger structural system [15]. A simplified model of tall building structures with multiple outriggers is shown in Figure 2. The core wall is connected to the perimeter columns through the outriggers. When lateral loads are applied at the central core wall, the outrigger develops axial forces in the perimeter columns. The limitation of the simplified model is that only flexural deformation of the outrigger is considered, and the length of the outrigger is assumed as the distance from the center of the core to that of the perimeter column. These assumptions are different from the actual behavior of outrigger walls. To enhance the accuracy of this simplified model, an equivalent bending stiffness (𝐸𝐼) was proposed by considering the shear deformation of beams and the clear span of outrigger walls.
Figure 2. Simplified analysis model with multiple outriggers. The core wall is connected to the perimeter columns through the outriggers.
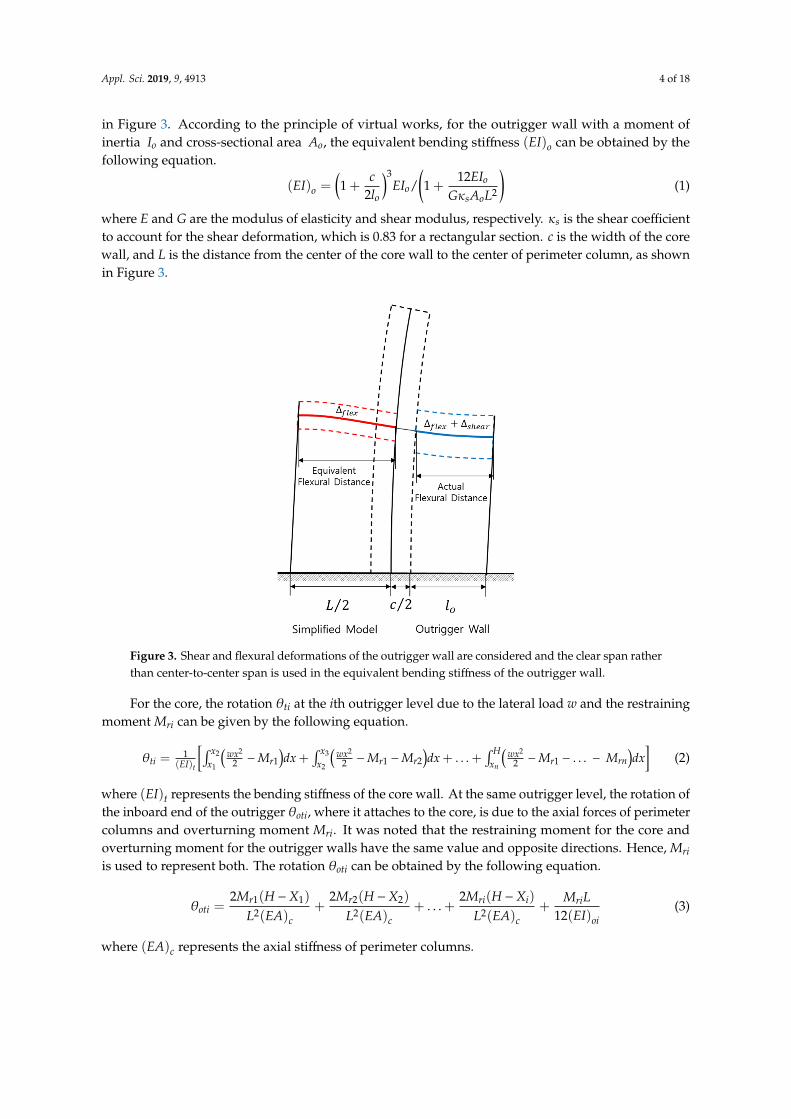
Because the outrigger walls belong to the category of deep beams [16], the total deformation is the sum of flexural and shear deformations, and the actual flexural distance is the clear span 𝑙 , as shown in Figure 3. According to the principle of virtual works, for the outrigger wall with a moment of inertia 𝐼 and cross-sectional area 𝐴 , the equivalent bending stiffness (𝐸𝐼) can be obtained by the following equation.
Figure 2. Simplified analysis model with multiple outriggers. The core wall is connected to theperimeter columns through the outriggers.
Because the outrigger walls belong to the category of deep beams [16], the total deformation is thesum of flexural and shear deformations, and the actual flexural distance is the clear span lo, as shown
Appl. Sci. 2019, 9, 4913 4 of 18
in Figure 3. According to the principle of virtual works, for the outrigger wall with a moment ofinertia Io and cross-sectional area Ao, the equivalent bending stiffness (EI)o can be obtained by thefollowing equation.
(EI)o =(1 +
c2lo
)3EIo/
(1 +
12EIo
GκsAoL2
)(1)
where E and G are the modulus of elasticity and shear modulus, respectively. κs is the shear coefficientto account for the shear deformation, which is 0.83 for a rectangular section. c is the width of the corewall, and L is the distance from the center of the core wall to the center of perimeter column, as shownin Figure 3.
Appl. Sci. 2019, 9, x FOR PEER REVIEW 4 of 18
(𝐸𝐼) = 1 + 𝑐2𝑙 𝐸𝐼 1 + 12𝐸𝐼𝐺𝜅 𝐴 𝐿 (1)
where 𝐸 and 𝐺 are the modulus of elasticity and shear modulus, respectively. 𝜅 is the shear coefficient to account for the shear deformation, which is 0.83 for a rectangular section. 𝑐 is the width of the core wall, and 𝐿 is the distance from the center of the core wall to the center of perimeter column, as shown in Figure 3.
Figure 3. Shear and flexural deformations of the outrigger wall are considered and the clear span rather than center-to-center span is used in the equivalent bending stiffness of the outrigger wall.
For the core, the rotation 𝜃 at the 𝑖 th outrigger level due to the lateral load 𝑤 and the restraining moment 𝑀 can be given by the following equation. 𝜃 = 1(𝐸𝐼) 𝑤𝑥2 − 𝑀 𝑑𝑥 + 𝑤𝑥2 − 𝑀 − 𝑀 𝑑𝑥 + ⋯
+ 𝑤𝑥2 − 𝑀 − ⋯ − 𝑀 𝑑𝑥 (2)
where (𝐸𝐼) represents the bending stiffness of the core wall. At the same outrigger level, the rotation of the inboard end of the outrigger 𝜃 , where it attaches to the core, is due to the axial forces of perimeter columns and overturning moment 𝑀 . It was noted that the restraining moment for the core and overturning moment for the outrigger walls have the same value and opposite directions. Hence, 𝑀 is used to represent both. The rotation 𝜃 can be obtained by the following equation. 𝜃 = 2𝑀 (𝐻 − 𝑋 )𝐿 (𝐸𝐴) + 2𝑀 (𝐻 − 𝑋 )𝐿 (𝐸𝐴) + ⋯ + 2𝑀 (𝐻 − 𝑋 )𝐿 (𝐸𝐴) + 𝑀 𝐿12(𝐸𝐼) (3)
where (𝐸𝐴) represents the axial stiffness of perimeter columns. Because of 𝜃 = 𝜃 , the restraining moment 𝑀 can be obtained in the following matrix form.
⎣⎢⎢⎢⎢⎡𝑀𝑀⋮𝑀⋮𝑀 ⎦⎥⎥
⎥⎥⎤ = 𝑤6(𝐸𝐼) ×⎣⎢⎢⎢⎢⎡
𝐵 + 𝐶(𝐻 − 𝑋 ) 𝐶(𝐻 − 𝑋 ) ⋯ 𝐶(𝐻 − 𝑋 ) ⋯ 𝐶(𝐻 − 𝑋 ) 𝐶(𝐻 − 𝑋 ) 𝐵 + 𝐶(𝐻 − 𝑋 ) ⋯ 𝐶(𝐻 − 𝑋 ) ⋯ 𝐶(𝐻 − 𝑋 ) ⋮ ⋮ ⋮ ⋮ ⋮ ⋮ 𝐶(𝐻 − 𝑋 ) 𝐶(𝑋 − 𝑋 ) ⋯ 𝐵 + 𝐶(𝐻 − 𝑋 ) ⋯ 𝐶(𝐻 − 𝑋 ) ⋮ ⋮ ⋮ ⋮ ⋮ ⋮ 𝐶(𝐻 − 𝑋 ) 𝐶(𝑋 − 𝑋 ) ⋯ 𝐶(𝐻 − 𝑋 ) ⋯ 𝐵 + 𝐶(𝐻 − 𝑋 ) ⎦⎥⎥⎥⎥⎤
⎣⎢⎢⎢⎢⎢⎡𝐻 − 𝑋𝐻 − 𝑋⋮𝐻 − 𝑋⋮𝐻 − 𝑋 ⎦⎥⎥
⎥⎥⎥⎤ (4)
where the parameter 𝐵 and 𝐶 are defined in the following equations.
Figure 3. Shear and flexural deformations of the outrigger wall are considered and the clear span ratherthan center-to-center span is used in the equivalent bending stiffness of the outrigger wall.
For the core, the rotation θti at the ith outrigger level due to the lateral load w and the restrainingmoment Mri can be given by the following equation.
θti =1
(EI)t
[∫ x2
x1
(wx2
2 −Mr1)dx +
∫ x3
x2
(wx2
2 −Mr1 −Mr2)dx + . . .+
∫ Hxn
(wx2
2 −Mr1 − . . . − Mrn)dx
](2)
where (EI)t represents the bending stiffness of the core wall. At the same outrigger level, the rotation ofthe inboard end of the outrigger θoti, where it attaches to the core, is due to the axial forces of perimetercolumns and overturning moment Mri. It was noted that the restraining moment for the core andoverturning moment for the outrigger walls have the same value and opposite directions. Hence, Mriis used to represent both. The rotation θoti can be obtained by the following equation.
θoti =2Mr1(H −X1)
L2(EA)c+
2Mr2(H −X2)
L2(EA)c+ . . .+
2Mri(H −Xi)
L2(EA)c+
MriL12(EI)oi
(3)
where (EA)c represents the axial stiffness of perimeter columns.
Appl. Sci. 2019, 9, 4913 5 of 18
Because of θti = θoti, the restraining moment Mri can be obtained in the following matrix form.
Mr1
Mr2...
Mri...
Mrn
=
[w
6(EI)t
]×
B1 + C(H −X1) C(H −X2) · · · C(H −Xi) · · · C(H −Xn)
C(H −X2) B2 + C(H −X2) · · · C(H −Xi) · · · C(H −Xn)...
......
......
...
C(H −Xi) C(H −Xi) · · · Bi + C(H −Xi) · · ·...
......
......
... C(H −Xn)
C(H −Xn) C(H −Xn) · · · C(H −Xn) · · · Bn + C(H −Xn)
−1
H3−X3
1H3−X3
2...
H3−X3
i...
H3−X3
n
(4)
where the parameter Bi and C are defined in the following equations.
Bi =L
12(EI)oiC =
1(EI)t
+2
L2(EA)c(5)
where (EI)oi represents the equivalent bending stiffness of the ith outrigger wall, as given in Equation (1).Applying the restraining moment Mri on the core, the displacement at the top of the building ∆top
can be obtained by using the following equation.
∆top =wH4
8(EI)t−
12(EI)t
n∑i=1
Mri(H2−Xi
2)
(6)
The outriggers are subjected to the overturning moment Mri and shear forces at the far edge dueto the axial forces of the perimeter columns. According to the resulting rotation θoti, the internal shearforces of the outrigger walls can be calculated by dividing Mri by L as follows.
V1
V2...
Vi...
Vn
=
[w
6(EI)t
]×
B1 + C(H −X1) C(H −X2) · · · C(H −Xi) · · · C(H −Xn)
C(H −X2) B2 + C(H −X2) · · · C(H −Xi) · · · C(H −Xn)...
......
......
...
C(H −Xi) C(H −Xi) · · · Bi + C(H −Xi) · · ·...
......
......
... C(H −Xn)
C(H −Xn) C(H −Xn) · · · C(H −Xn) · · · Bn + C(H −Xn)
−1
H3−X3
1H3−X3
2...
H3−X3
i...
H3−X3
n
(7)
2.2. Verification by Numerical Examples
The accuracy of the proposed equations for lateral displacement at the top of tall buildings andshear forces developed at the outrigger walls are verified by comparing with the results from linearfinite element analysis. MIDAS-Gen [17] was used for the linear finite element analysis because it iswidely used in the structural design practice. The outrigger walls and cores were modeled with thequadrilateral plane stress elements with incompatible modes [17].
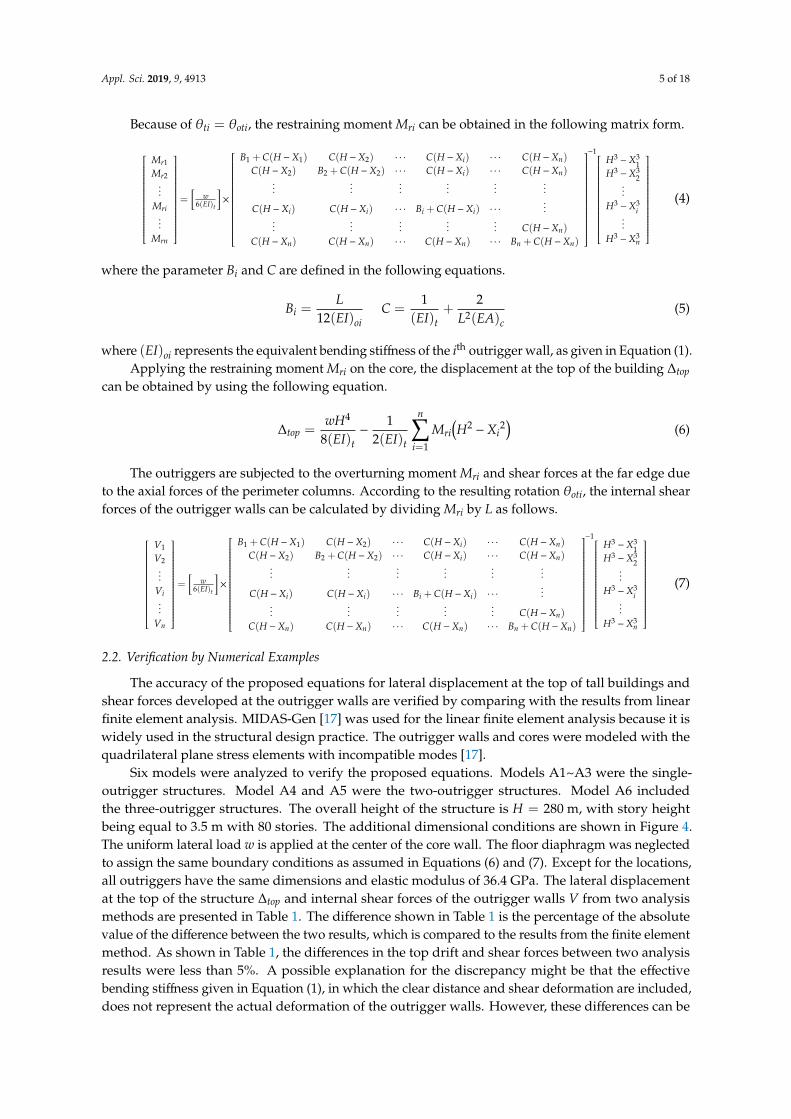
Six models were analyzed to verify the proposed equations. Models A1~A3 were the single-outrigger structures. Model A4 and A5 were the two-outrigger structures. Model A6 includedthe three-outrigger structures. The overall height of the structure is H = 280 m, with story heightbeing equal to 3.5 m with 80 stories. The additional dimensional conditions are shown in Figure 4.The uniform lateral load w is applied at the center of the core wall. The floor diaphragm was neglectedto assign the same boundary conditions as assumed in Equations (6) and (7). Except for the locations,all outriggers have the same dimensions and elastic modulus of 36.4 GPa. The lateral displacementat the top of the structure ∆top and internal shear forces of the outrigger walls V from two analysismethods are presented in Table 1. The difference shown in Table 1 is the percentage of the absolutevalue of the difference between the two results, which is compared to the results from the finite elementmethod. As shown in Table 1, the differences in the top drift and shear forces between two analysisresults were less than 5%. A possible explanation for the discrepancy might be that the effectivebending stiffness given in Equation (1), in which the clear distance and shear deformation are included,does not represent the actual deformation of the outrigger walls. However, these differences can be
Appl. Sci. 2019, 9, 4913 6 of 18
regarded as permitted in a structural design practice. Taken together, these results can hold the viewthat the proposed analytical equations for the outrigger walls that introduce the equivalent bendingstiffness are valid.Appl. Sci. 2019, 9, x FOR PEER REVIEW 6 of 18
Figure 4. Dimensions of the analysis model to verify the proposed analytical equations.
Table 1. Results from Equations (6) and (7) and finite element analysis (FEA).
Model Outrigger X (m) ∆𝒕𝒐𝒑 (𝐦) Diff.
(%) 𝑽 (𝐤𝐍) Diff.
(%) Equation (6) FEA Equation (7) FEA A1 O11 89.25 0.4964 0.5134 3.30 6790 6876 1.25 A2 O21 138.25 0.4715 0.4905 3.87 8267 8331 0.77 A3 O31 183.75 0.5782 0.5985 3.39 9842 9840 0.02
A4 O41 89.25
0.3701 0.3789 2.34 3669 3808 3.65
O42 183.75 6273 6225 0.77
A5 O51 68.25
0.3831 0.3908 1.96 3908 4028 2.97
O52 208.25 6967 6890 1.11
A6 O61 68.25
0.3412 0.3429 0.42 2111 2220 4.92
O62 138.25 3597 3528 1.95 O63 208.25 5232 5155 1.51
2.3. Arrangement of Multiple Openings
Outrigger walls behave as cantilever deep beams, which have nonlinear distribution of stresses. It is not easy to analyze and design outrigger walls through design methods and formulas developed for slender beams. In this study, the strut-and-tie model was used to perform a preliminary design of the reinforced concrete outrigger walls. The strut-and-tie model was proven to be a desirable approach for designing reinforced concrete members with discontinuous regions (D-regions). The method is based on a truss analogy, which was first presented to explain the contribution of transverse reinforcement to the shear strength of a beam by Wilhelm Ritter in 1899. Following this, Schlaich et al. [18] developed a strut-and-tie model as a design method for the D-region, and later discussed some designing details [19]. Furthermore, the strut-and-tie model method has been adopted by some design provisions, such as American Concrete Institute (ACI) 318-14 [16] as a design method for structures with D-regions.
By using the strut-and-tie model, which assumes that all the stresses are condensed in struts and ties, horizontal and diagonal reinforcements were placed in the region with high tensile stresses. Meanwhile, in a practical situation, lateral loads coming from different directions lead to the fact that
Figure 4. Dimensions of the analysis model to verify the proposed analytical equations.
Table 1. Results from Equations (6) and (7) and finite element analysis (FEA).
Model Outrigger X (m)∆top (m)
Diff. (%)V (kN)
Diff. (%)Equation (6) FEA Equation (7) FEA
A1 O11 89.25 0.4964 0.5134 3.30 6790 6876 1.25A2 O21 138.25 0.4715 0.4905 3.87 8267 8331 0.77A3 O31 183.75 0.5782 0.5985 3.39 9842 9840 0.02
A4O41 89.25
0.3701 0.3789 2.343669 3808 3.65
O42 183.75 6273 6225 0.77
A5O51 68.25
0.3831 0.3908 1.963908 4028 2.97
O52 208.25 6967 6890 1.11
A6O61 68.25
0.3412 0.3429 0.422111 2220 4.92
O62 138.25 3597 3528 1.95O63 208.25 5232 5155 1.51
2.3. Arrangement of Multiple Openings
Outrigger walls behave as cantilever deep beams, which have nonlinear distribution of stresses.It is not easy to analyze and design outrigger walls through design methods and formulas developed forslender beams. In this study, the strut-and-tie model was used to perform a preliminary design of thereinforced concrete outrigger walls. The strut-and-tie model was proven to be a desirable approach fordesigning reinforced concrete members with discontinuous regions (D-regions). The method is basedon a truss analogy, which was first presented to explain the contribution of transverse reinforcement tothe shear strength of a beam by Wilhelm Ritter in 1899. Following this, Schlaich et al. [18] developed astrut-and-tie model as a design method for the D-region, and later discussed some designing details [19].Furthermore, the strut-and-tie model method has been adopted by some design provisions, such asAmerican Concrete Institute (ACI) 318-14 [16] as a design method for structures with D-regions.
Appl. Sci. 2019, 9, 4913 7 of 18
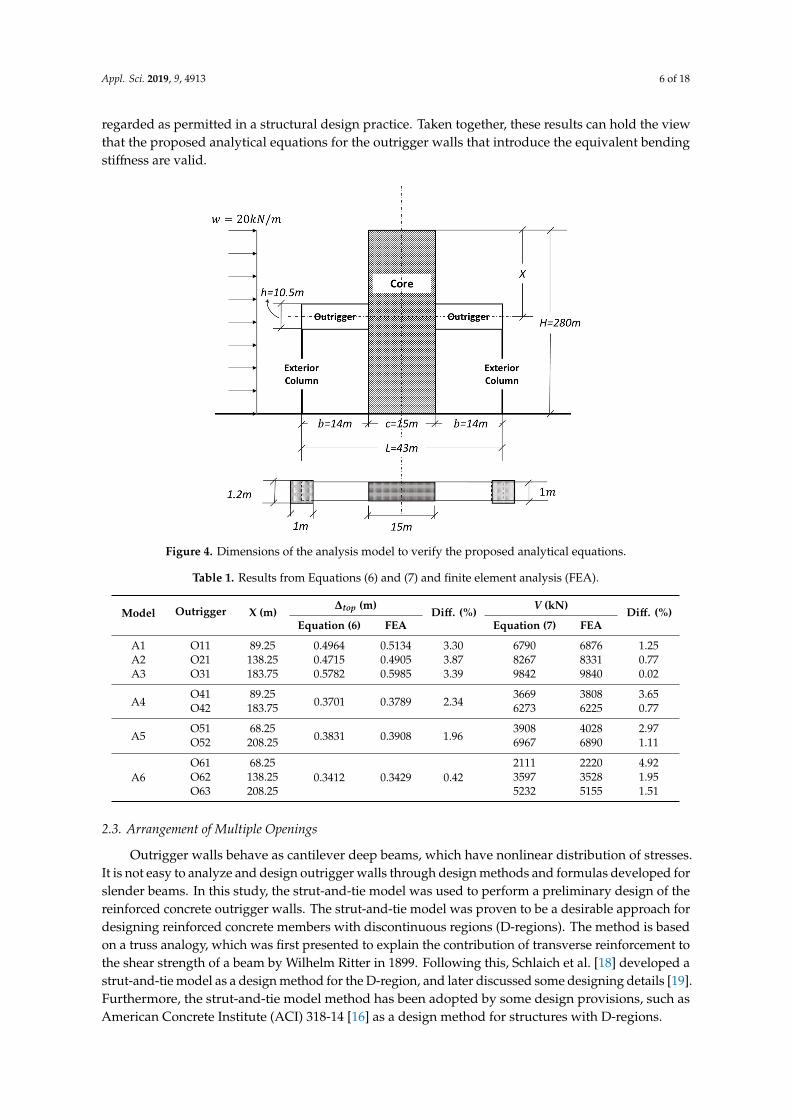
By using the strut-and-tie model, which assumes that all the stresses are condensed in strutsand ties, horizontal and diagonal reinforcements were placed in the region with high tensile stresses.Meanwhile, in a practical situation, lateral loads coming from different directions lead to the factthat every half-side outrigger should be able to support upward and downward forces. This meansthat the tension zones could likely become compressive zones in an outrigger wall, and compressivezones should also be able to resist tension forces. Thus, every half-side of an outrigger wall withfour reinforcements can be obtained by a symmetric superposition of the side supported upwardforces and side supported downward forces, as shown in Figure 5 in which the blue lines representsteel reinforcements.
Appl. Sci. 2019, 9, x FOR PEER REVIEW 7 of 18
every half-side outrigger should be able to support upward and downward forces. This means that the tension zones could likely become compressive zones in an outrigger wall, and compressive zones should also be able to resist tension forces. Thus, every half-side of an outrigger wall with four reinforcements can be obtained by a symmetric superposition of the side supported upward forces and side supported downward forces, as shown in Figure 5 in which the blue lines represent steel reinforcements.
Figure 5. Outrigger walls with multiple openings. The blue lines represent the steel reinforcements to resist tension forces.
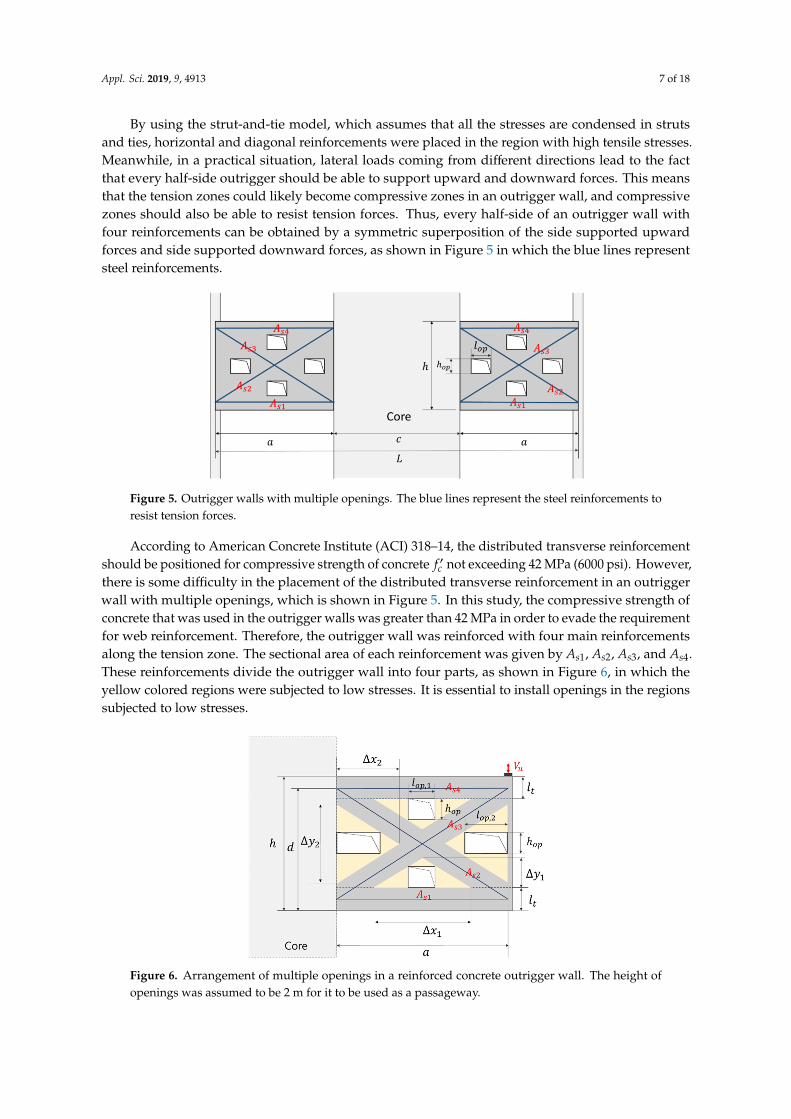
According to American Concrete Institute (ACI) 318–14, the distributed transverse reinforcement should be positioned for compressive strength of concrete 𝑓 not exceeding 42 MPa (6000 psi). However, there is some difficulty in the placement of the distributed transverse reinforcement in an outrigger wall with multiple openings, which is shown in Figure 5. In this study, the compressive strength of concrete that was used in the outrigger walls was greater than 42 MPa in order to evade the requirement for web reinforcement. Therefore, the outrigger wall was reinforced with four main reinforcements along the tension zone. The sectional area of each reinforcement was given by 𝐴 , 𝐴 , 𝐴 , and 𝐴 . These reinforcements divide the outrigger wall into four parts, as shown in Figure 6, in which the yellow colored regions were subjected to low stresses. It is essential to install openings in the regions subjected to low stresses.
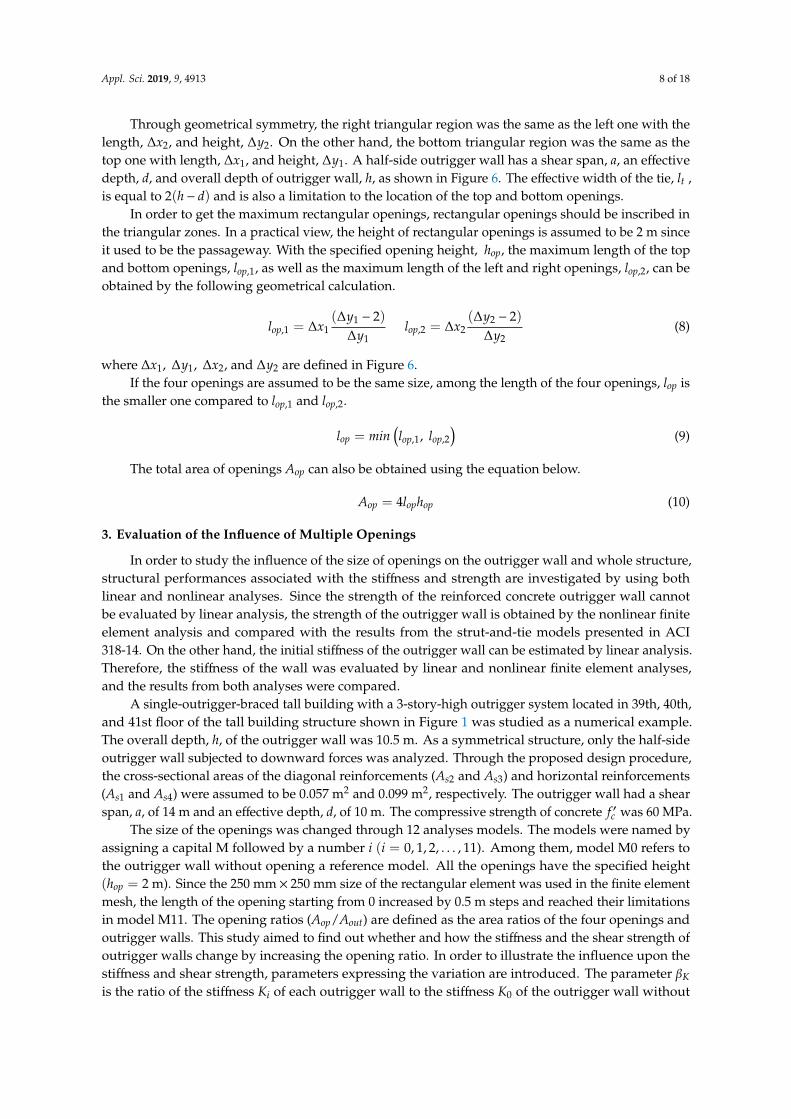
Through geometrical symmetry, the right triangular region was the same as the left one with the length, ∆𝑥 , and height, ∆𝑦 . On the other hand, the bottom triangular region was the same as the top one with length, ∆𝑥 , and height, ∆𝑦 . A half-side outrigger wall has a shear span, 𝑎, an effective depth, 𝑑, and overall depth of outrigger wall, ℎ, as shown in Figure 6. The effective width of the tie, 𝑙 , is equal to 2(ℎ − 𝑑) and is also a limitation to the location of the top and bottom openings.
In order to get the maximum rectangular openings, rectangular openings should be inscribed in the triangular zones. In a practical view, the height of rectangular openings is assumed to be 2 m since it used to be the passageway. With the specified opening height, ℎ , the maximum length of the top and bottom openings, 𝑙 , , as well as the maximum length of the left and right openings, 𝑙 , , can be obtained by the following geometrical calculation. 𝑙 , = ∆𝑥 (∆𝑦 − 2)∆𝑦 𝑙 , = ∆𝑥 (∆𝑦 − 2)∆𝑦 (8)
where ∆𝑥 , ∆𝑦 , ∆𝑥 , and ∆𝑦 are defined in Figure 6.
Figure 5. Outrigger walls with multiple openings. The blue lines represent the steel reinforcements toresist tension forces.
According to American Concrete Institute (ACI) 318–14, the distributed transverse reinforcementshould be positioned for compressive strength of concrete f ′c not exceeding 42 MPa (6000 psi). However,there is some difficulty in the placement of the distributed transverse reinforcement in an outriggerwall with multiple openings, which is shown in Figure 5. In this study, the compressive strength ofconcrete that was used in the outrigger walls was greater than 42 MPa in order to evade the requirementfor web reinforcement. Therefore, the outrigger wall was reinforced with four main reinforcementsalong the tension zone. The sectional area of each reinforcement was given by As1, As2, As3, and As4.These reinforcements divide the outrigger wall into four parts, as shown in Figure 6, in which theyellow colored regions were subjected to low stresses. It is essential to install openings in the regionssubjected to low stresses.Appl. Sci. 2019, 9, x FOR PEER REVIEW 8 of 18
Figure 6. Arrangement of multiple openings in a reinforced concrete outrigger wall. The height of openings was assumed to be 2 m for it to be used as a passageway.
If the four openings are assumed to be the same size, among the length of the four openings, 𝑙 is the smaller one compared to 𝑙 , and 𝑙 , . 𝑙 = 𝑚𝑖𝑛 (𝑙 , , 𝑙 , ) (9)
The total area of openings 𝐴 can also be obtained using the equation below. 𝐴 = 4𝑙 ℎ (10)
3. Evaluation of the Influence of Multiple Openings
In order to study the influence of the size of openings on the outrigger wall and whole structure, structural performances associated with the stiffness and strength are investigated by using both linear and nonlinear analyses. Since the strength of the reinforced concrete outrigger wall cannot be evaluated by linear analysis, the strength of the outrigger wall is obtained by the nonlinear finite element analysis and compared with the results from the strut-and-tie models presented in ACI 318-14. On the other hand, the initial stiffness of the outrigger wall can be estimated by linear analysis. Therefore, the stiffness of the wall was evaluated by linear and nonlinear finite element analyses, and the results from both analyses were compared.
A single-outrigger-braced tall building with a 3-story-high outrigger system located in 39th, 40th, and 41st floor of the tall building structure shown in Figure 1 was studied as a numerical example. The overall depth, ℎ, of the outrigger wall was 10.5 m. As a symmetrical structure, only the half-side outrigger wall subjected to downward forces was analyzed. Through the proposed design procedure, the cross-sectional areas of the diagonal reinforcements (𝐴 and 𝐴 ) and horizontal reinforcements ( 𝐴 and 𝐴 ) were assumed to be 0.057 m and 0.099 m , respectively. The outrigger wall had a shear span, 𝑎, of 14 m and an effective depth, 𝑑, of 10 m. The compressive strength of concrete 𝑓 was 60 MPa.
The size of the openings was changed through 12 analyses models. The models were named by assigning a capital M followed by a number 𝑖 (𝑖 = 0,1,2, … ,11). Among them, model M0 refers to the outrigger wall without opening a reference model. All the openings have the specified height (ℎ =2 m). Since the 250 mm × 250 mm size of the rectangular element was used in the finite element mesh, the length of the opening starting from 0 increased by 0.5 m steps and reached their limitations in model M11. The opening ratios (𝐴 𝐴⁄ ) are defined as the area ratios of the four openings and outrigger walls. This study aimed to find out whether and how the stiffness and the shear strength of outrigger walls change by increasing the opening ratio. In order to illustrate the influence upon the stiffness and shear strength, parameters expressing the variation are introduced. The parameter 𝛽 is the ratio of the stiffness 𝐾 of each outrigger wall to the stiffness 𝐾 of the outrigger wall
Figure 6. Arrangement of multiple openings in a reinforced concrete outrigger wall. The height ofopenings was assumed to be 2 m for it to be used as a passageway.
Appl. Sci. 2019, 9, 4913 8 of 18
Through geometrical symmetry, the right triangular region was the same as the left one with thelength, ∆x2, and height, ∆y2. On the other hand, the bottom triangular region was the same as thetop one with length, ∆x1, and height, ∆y1. A half-side outrigger wall has a shear span, a, an effectivedepth, d, and overall depth of outrigger wall, h, as shown in Figure 6. The effective width of the tie, lt ,is equal to 2(h− d) and is also a limitation to the location of the top and bottom openings.
In order to get the maximum rectangular openings, rectangular openings should be inscribed inthe triangular zones. In a practical view, the height of rectangular openings is assumed to be 2 m sinceit used to be the passageway. With the specified opening height, hop, the maximum length of the topand bottom openings, lop,1, as well as the maximum length of the left and right openings, lop,2, can beobtained by the following geometrical calculation.
lop,1 = ∆x1(∆y1 − 2)
∆y1lop,2 = ∆x2
(∆y2 − 2)∆y2
(8)
where ∆x1, ∆y1, ∆x2, and ∆y2 are defined in Figure 6.If the four openings are assumed to be the same size, among the length of the four openings, lop is
the smaller one compared to lop,1 and lop,2.
lop = min(lop,1, lop,2
)(9)
The total area of openings Aop can also be obtained using the equation below.
Aop = 4lophop (10)
3. Evaluation of the Influence of Multiple Openings
In order to study the influence of the size of openings on the outrigger wall and whole structure,structural performances associated with the stiffness and strength are investigated by using bothlinear and nonlinear analyses. Since the strength of the reinforced concrete outrigger wall cannotbe evaluated by linear analysis, the strength of the outrigger wall is obtained by the nonlinear finiteelement analysis and compared with the results from the strut-and-tie models presented in ACI318-14. On the other hand, the initial stiffness of the outrigger wall can be estimated by linear analysis.Therefore, the stiffness of the wall was evaluated by linear and nonlinear finite element analyses,and the results from both analyses were compared.
A single-outrigger-braced tall building with a 3-story-high outrigger system located in 39th, 40th,and 41st floor of the tall building structure shown in Figure 1 was studied as a numerical example.The overall depth, h, of the outrigger wall was 10.5 m. As a symmetrical structure, only the half-sideoutrigger wall subjected to downward forces was analyzed. Through the proposed design procedure,the cross-sectional areas of the diagonal reinforcements (As2 and As3) and horizontal reinforcements(As1 and As4) were assumed to be 0.057 m2 and 0.099 m2, respectively. The outrigger wall had a shearspan, a, of 14 m and an effective depth, d, of 10 m. The compressive strength of concrete f ′c was 60 MPa.
The size of the openings was changed through 12 analyses models. The models were named byassigning a capital M followed by a number i (i = 0, 1, 2, . . . , 11). Among them, model M0 refers tothe outrigger wall without opening a reference model. All the openings have the specified height(hop = 2 m). Since the 250 mm× 250 mm size of the rectangular element was used in the finite elementmesh, the length of the opening starting from 0 increased by 0.5 m steps and reached their limitationsin model M11. The opening ratios (Aop/Aout) are defined as the area ratios of the four openings andoutrigger walls. This study aimed to find out whether and how the stiffness and the shear strength ofoutrigger walls change by increasing the opening ratio. In order to illustrate the influence upon thestiffness and shear strength, parameters expressing the variation are introduced. The parameter βK
is the ratio of the stiffness Ki of each outrigger wall to the stiffness K0 of the outrigger wall without
Appl. Sci. 2019, 9, 4913 9 of 18
openings. The parameter βV is the ratio of the shear strength Vi to the shear strength V0 of the outriggerwall without openings.
3.1. Finite Element Modelling
In this study, Abaqus [20], which is a commercial nonlinear finite element analysis program,was used. Several researchers have used Abaqus in analyzing the nonlinear behavior of reinforcedconcrete structures [21–24]. The program provides three material models for concrete. These arethe smeared crack concrete, brittle crack concrete, and concrete damaged plasticity models. In thispaper, the concrete damaged plasticity (CDP) model was used because it can represent the completeinelastic behavior of concrete, both in compression and tension [25,26]. The CDP is a continuum,plasticity-based, damage model for concrete. It assumes that the main two failure mechanisms ofconcrete material are tensile cracking and compressive crushing, which are represented by the uniaxialtension and compression behavior. Under uniaxial tension, the stress-strain response follows a linearelastic relationship until the value of the failure stress is reached. The failure stress corresponds to theonset of micro-cracking in concrete material. Beyond the failure stress, the formation of micro-cracks isrepresented macroscopically with a softening stress-strain response, which induces strain localizationin concrete structures. Under uniaxial compression, the response is linear up to the value of the initialyield. In the plastic regime, the response is typically characterized by stress hardening, which isfollowed by strain softening beyond ultimate stress.
The CDP model in Abaqus is a plasticity material model that requires the definition of theyield surface and requires hardening and flow rules. The model makes use of the yield functionproposed by Lee and Fenves [27] to account for varying degrees of evolution of concrete strengthunder tension and compression. The CDP model assumes a non-associated potential plastic flow.The flow potential is the Drucker-Prager hyperbolic function, which requires the dilation angle (ψ),flow potential eccentricity (ε), ratio of the initial biaxial compressive yield stress to the initial uniaxialcompressive yield stress (σb0/σc0), and the ratio of the second stress invariant on the tensile meridianto that on the compressive meridian (Kc). The viscosity parameter should be entered to overcome someof the convergence difficulties caused by material models exhibiting softening behavior and stiffnessdegradation. The values of the parameters for the plasticity model used in this study are shown inTable 2 below.
Table 2. Plasticity parameter of concrete damaged plasticity (CDP) specified for this study.
Parameter Value
ψ 38ε 0.1
σb0/σc0 1.16Kc 0.667
Viscosity parameter 0.0001
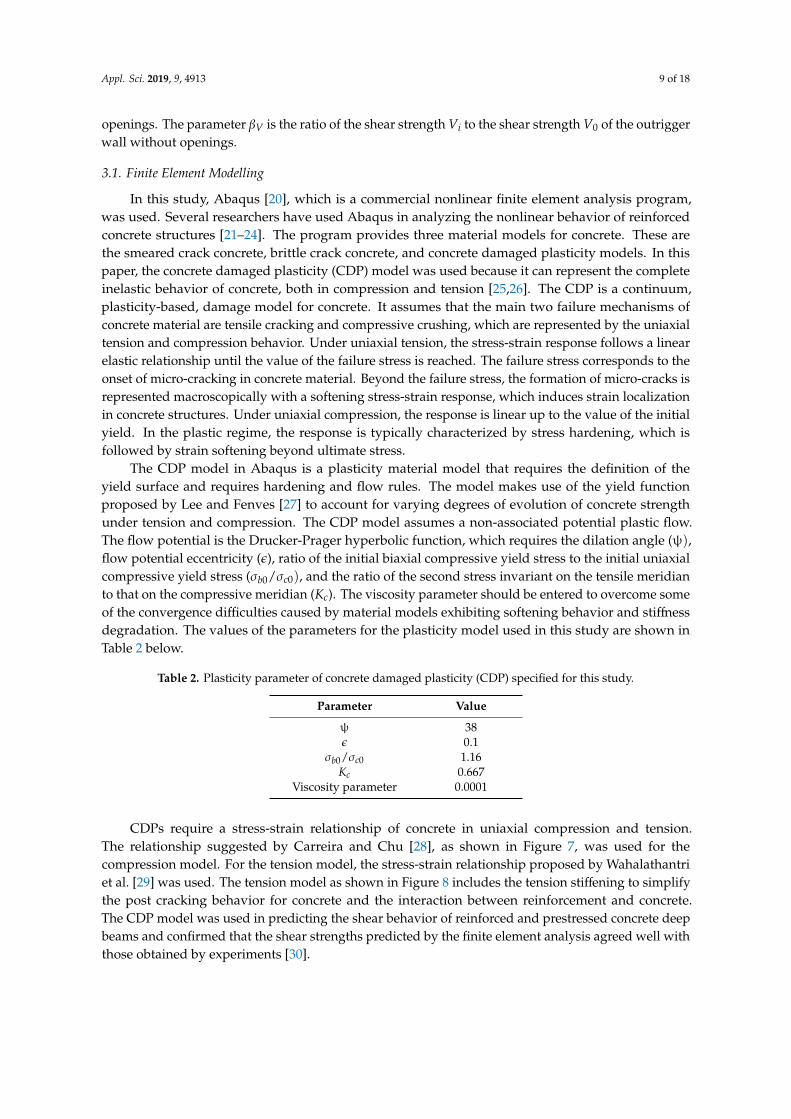
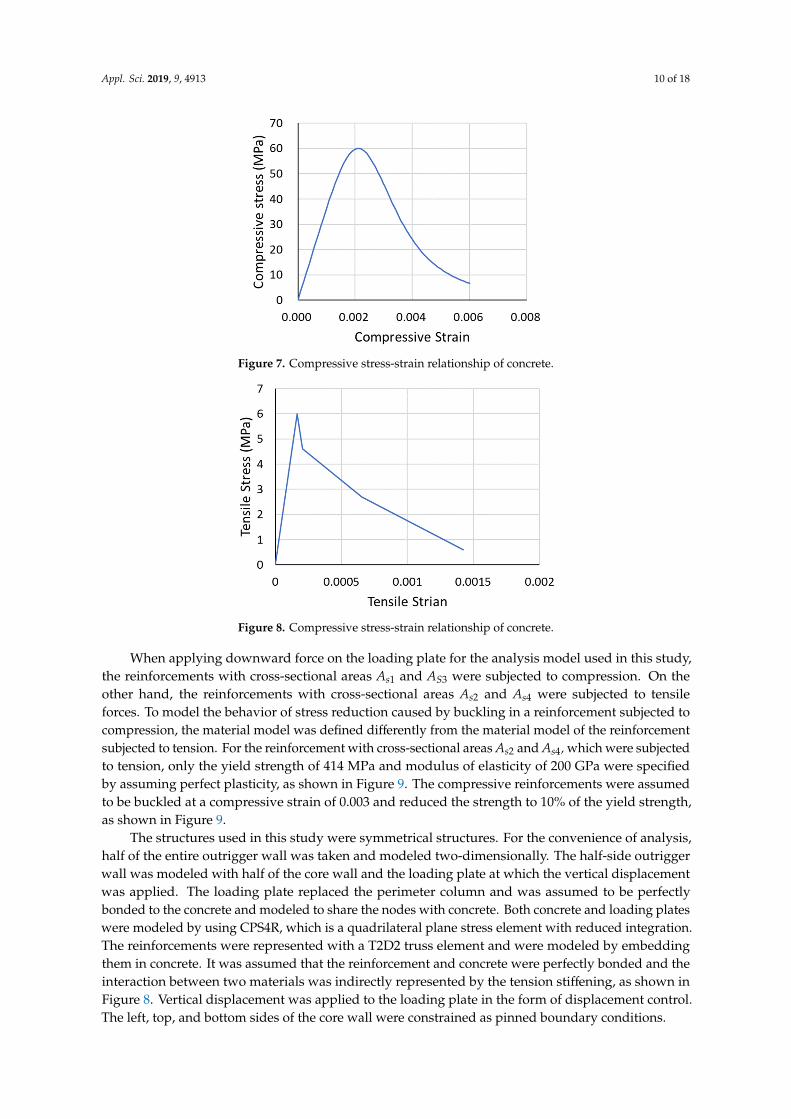
CDPs require a stress-strain relationship of concrete in uniaxial compression and tension.The relationship suggested by Carreira and Chu [28], as shown in Figure 7, was used for thecompression model. For the tension model, the stress-strain relationship proposed by Wahalathantriet al. [29] was used. The tension model as shown in Figure 8 includes the tension stiffening to simplifythe post cracking behavior for concrete and the interaction between reinforcement and concrete.The CDP model was used in predicting the shear behavior of reinforced and prestressed concrete deepbeams and confirmed that the shear strengths predicted by the finite element analysis agreed well withthose obtained by experiments [30].
Appl. Sci. 2019, 9, 4913 10 of 18Appl. Sci. 2019, 9, x FOR PEER REVIEW 10 of 18
Figure 7. Compressive stress-strain relationship of concrete.
Figure 8. Compressive stress-strain relationship of concrete.
When applying downward force on the loading plate for the analysis model used in this study, the reinforcements with cross-sectional areas 𝐴 and 𝐴 were subjected to compression. On the other hand, the reinforcements with cross-sectional areas 𝐴 and 𝐴 were subjected to tensile forces. To model the behavior of stress reduction caused by buckling in a reinforcement subjected to compression, the material model was defined differently from the material model of the reinforcement subjected to tension. For the reinforcement with cross-sectional areas 𝐴 and 𝐴 , which were subjected to tension, only the yield strength of 414 MPa and modulus of elasticity of 200 GPa were specified by assuming perfect plasticity, as shown in Figure 9. The compressive reinforcements were assumed to be buckled at a compressive strain of 0.003 and reduced the strength to 10% of the yield strength, as shown in Figure 9.
The structures used in this study were symmetrical structures. For the convenience of analysis, half of the entire outrigger wall was taken and modeled two-dimensionally. The half-side outrigger wall was modeled with half of the core wall and the loading plate at which the vertical displacement was applied. The loading plate replaced the perimeter column and was assumed to be perfectly bonded to the concrete and modeled to share the nodes with concrete. Both concrete and loading plates were modeled by using CPS4R, which is a quadrilateral plane stress element with reduced integration. The reinforcements were represented with a T2D2 truss element and were modeled by embedding them in concrete. It was assumed that the reinforcement and concrete were perfectly bonded and the interaction between two materials was indirectly represented by the tension stiffening, as shown in Figure 8. Vertical displacement was applied to the loading plate in the form
Figure 7. Compressive stress-strain relationship of concrete.
Appl. Sci. 2019, 9, x FOR PEER REVIEW 10 of 18
Figure 7. Compressive stress-strain relationship of concrete.
Figure 8. Compressive stress-strain relationship of concrete.
When applying downward force on the loading plate for the analysis model used in this study, the reinforcements with cross-sectional areas 𝐴 and 𝐴 were subjected to compression. On the other hand, the reinforcements with cross-sectional areas 𝐴 and 𝐴 were subjected to tensile forces. To model the behavior of stress reduction caused by buckling in a reinforcement subjected to compression, the material model was defined differently from the material model of the reinforcement subjected to tension. For the reinforcement with cross-sectional areas 𝐴 and 𝐴 , which were subjected to tension, only the yield strength of 414 MPa and modulus of elasticity of 200 GPa were specified by assuming perfect plasticity, as shown in Figure 9. The compressive reinforcements were assumed to be buckled at a compressive strain of 0.003 and reduced the strength to 10% of the yield strength, as shown in Figure 9.
The structures used in this study were symmetrical structures. For the convenience of analysis, half of the entire outrigger wall was taken and modeled two-dimensionally. The half-side outrigger wall was modeled with half of the core wall and the loading plate at which the vertical displacement was applied. The loading plate replaced the perimeter column and was assumed to be perfectly bonded to the concrete and modeled to share the nodes with concrete. Both concrete and loading plates were modeled by using CPS4R, which is a quadrilateral plane stress element with reduced integration. The reinforcements were represented with a T2D2 truss element and were modeled by embedding them in concrete. It was assumed that the reinforcement and concrete were perfectly bonded and the interaction between two materials was indirectly represented by the tension stiffening, as shown in Figure 8. Vertical displacement was applied to the loading plate in the form
Figure 8. Compressive stress-strain relationship of concrete.
When applying downward force on the loading plate for the analysis model used in this study,the reinforcements with cross-sectional areas As1 and AS3 were subjected to compression. On theother hand, the reinforcements with cross-sectional areas As2 and As4 were subjected to tensileforces. To model the behavior of stress reduction caused by buckling in a reinforcement subjected tocompression, the material model was defined differently from the material model of the reinforcementsubjected to tension. For the reinforcement with cross-sectional areas As2 and As4, which were subjectedto tension, only the yield strength of 414 MPa and modulus of elasticity of 200 GPa were specifiedby assuming perfect plasticity, as shown in Figure 9. The compressive reinforcements were assumedto be buckled at a compressive strain of 0.003 and reduced the strength to 10% of the yield strength,as shown in Figure 9.
The structures used in this study were symmetrical structures. For the convenience of analysis,half of the entire outrigger wall was taken and modeled two-dimensionally. The half-side outriggerwall was modeled with half of the core wall and the loading plate at which the vertical displacementwas applied. The loading plate replaced the perimeter column and was assumed to be perfectlybonded to the concrete and modeled to share the nodes with concrete. Both concrete and loading plateswere modeled by using CPS4R, which is a quadrilateral plane stress element with reduced integration.The reinforcements were represented with a T2D2 truss element and were modeled by embeddingthem in concrete. It was assumed that the reinforcement and concrete were perfectly bonded and theinteraction between two materials was indirectly represented by the tension stiffening, as shown inFigure 8. Vertical displacement was applied to the loading plate in the form of displacement control.The left, top, and bottom sides of the core wall were constrained as pinned boundary conditions.
Appl. Sci. 2019, 9, 4913 11 of 18
Appl. Sci. 2019, 9, x FOR PEER REVIEW 11 of 18
of displacement control. The left, top, and bottom sides of the core wall were constrained as pinned boundary conditions.
Figure 9. Material model of reinforcement subjected to tension and compression.
3.2. Results of Finite Element Analysis
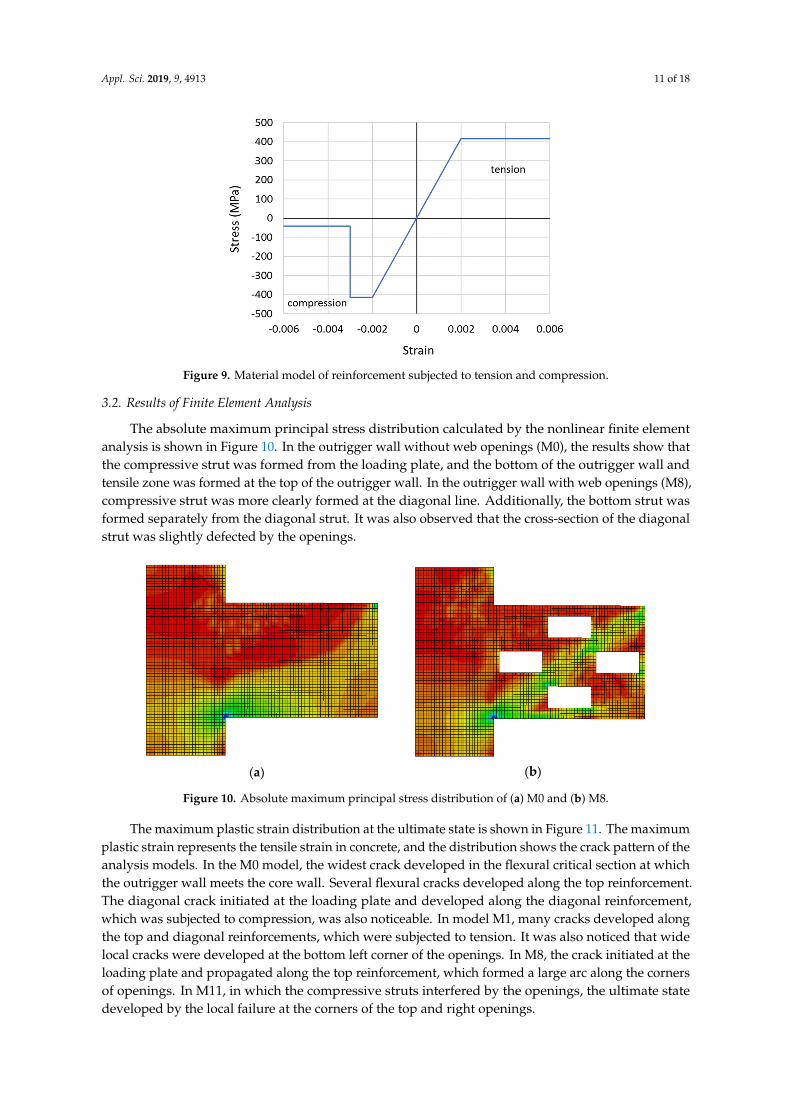
The absolute maximum principal stress distribution calculated by the nonlinear finite element analysis is shown in Figure 10. In the outrigger wall without web openings (M0), the results show that the compressive strut was formed from the loading plate, and the bottom of the outrigger wall and tensile zone was formed at the top of the outrigger wall. In the outrigger wall with web openings (M8), compressive strut was more clearly formed at the diagonal line. Additionally, the bottom strut was formed separately from the diagonal strut. It was also observed that the cross-section of the diagonal strut was slightly defected by the openings.
(a)
(b)
Figure 10. Absolute maximum principal stress distribution of (a) M0 and (b) M8.
The maximum plastic strain distribution at the ultimate state is shown in Figure 11. The maximum plastic strain represents the tensile strain in concrete, and the distribution shows the crack pattern of the analysis models. In the M0 model, the widest crack developed in the flexural critical section at which the outrigger wall meets the core wall. Several flexural cracks developed along the top reinforcement. The diagonal crack initiated at the loading plate and developed along the diagonal reinforcement, which was subjected to compression, was also noticeable. In model M1, many cracks developed along the top and diagonal reinforcements, which were subjected to tension. It was also noticed that wide local cracks were developed at the bottom left corner of the openings. In M8, the
Figure 9. Material model of reinforcement subjected to tension and compression.
3.2. Results of Finite Element Analysis
The absolute maximum principal stress distribution calculated by the nonlinear finite elementanalysis is shown in Figure 10. In the outrigger wall without web openings (M0), the results show thatthe compressive strut was formed from the loading plate, and the bottom of the outrigger wall andtensile zone was formed at the top of the outrigger wall. In the outrigger wall with web openings (M8),compressive strut was more clearly formed at the diagonal line. Additionally, the bottom strut wasformed separately from the diagonal strut. It was also observed that the cross-section of the diagonalstrut was slightly defected by the openings.
Appl. Sci. 2019, 9, x FOR PEER REVIEW 11 of 18
of displacement control. The left, top, and bottom sides of the core wall were constrained as pinned boundary conditions.
Figure 9. Material model of reinforcement subjected to tension and compression.
3.2. Results of Finite Element Analysis
The absolute maximum principal stress distribution calculated by the nonlinear finite element analysis is shown in Figure 10. In the outrigger wall without web openings (M0), the results show that the compressive strut was formed from the loading plate, and the bottom of the outrigger wall and tensile zone was formed at the top of the outrigger wall. In the outrigger wall with web openings (M8), compressive strut was more clearly formed at the diagonal line. Additionally, the bottom strut was formed separately from the diagonal strut. It was also observed that the cross-section of the diagonal strut was slightly defected by the openings.
(a)
(b)
Figure 10. Absolute maximum principal stress distribution of (a) M0 and (b) M8.
The maximum plastic strain distribution at the ultimate state is shown in Figure 11. The maximum plastic strain represents the tensile strain in concrete, and the distribution shows the crack pattern of the analysis models. In the M0 model, the widest crack developed in the flexural critical section at which the outrigger wall meets the core wall. Several flexural cracks developed along the top reinforcement. The diagonal crack initiated at the loading plate and developed along the diagonal reinforcement, which was subjected to compression, was also noticeable. In model M1, many cracks developed along the top and diagonal reinforcements, which were subjected to tension. It was also noticed that wide local cracks were developed at the bottom left corner of the openings. In M8, the
Figure 10. Absolute maximum principal stress distribution of (a) M0 and (b) M8.
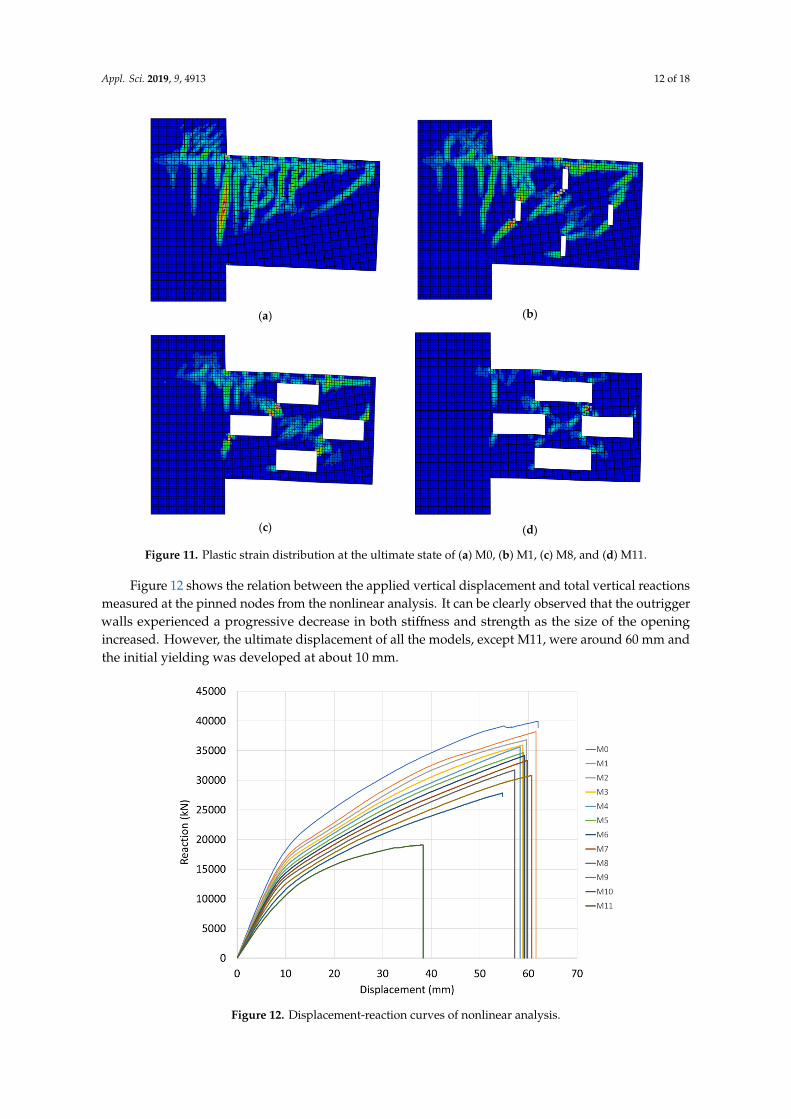
The maximum plastic strain distribution at the ultimate state is shown in Figure 11. The maximumplastic strain represents the tensile strain in concrete, and the distribution shows the crack pattern of theanalysis models. In the M0 model, the widest crack developed in the flexural critical section at whichthe outrigger wall meets the core wall. Several flexural cracks developed along the top reinforcement.The diagonal crack initiated at the loading plate and developed along the diagonal reinforcement,which was subjected to compression, was also noticeable. In model M1, many cracks developed alongthe top and diagonal reinforcements, which were subjected to tension. It was also noticed that widelocal cracks were developed at the bottom left corner of the openings. In M8, the crack initiated at theloading plate and propagated along the top reinforcement, which formed a large arc along the cornersof openings. In M11, in which the compressive struts interfered by the openings, the ultimate statedeveloped by the local failure at the corners of the top and right openings.
Appl. Sci. 2019, 9, 4913 12 of 18
Appl. Sci. 2019, 9, x FOR PEER REVIEW 12 of 18
crack initiated at the loading plate and propagated along the top reinforcement, which formed a large arc along the corners of openings. In M11, in which the compressive struts interfered by the openings, the ultimate state developed by the local failure at the corners of the top and right openings.
(a) (b)
(c) (d)
Figure 11. Plastic strain distribution at the ultimate state of (a) M0, (b) M1, (c) M8, and (d) M11.
Figure 12 shows the relation between the applied vertical displacement and total vertical reactions measured at the pinned nodes from the nonlinear analysis. It can be clearly observed that the outrigger walls experienced a progressive decrease in both stiffness and strength as the size of the opening increased. However, the ultimate displacement of all the models, except M11, were around 60 mm and the initial yielding was developed at about 10 mm.
In order to quantify the degradation in stiffness due to the size of openings, the initial tangential slope, 𝐾 , calculated from the load-displacement curves shown in Figure 12 and compared it with the slope 𝐾 from the linear analysis. In order to evaluate the stiffness of outrigger walls, all the analysis models were constructed as the same as the nonlinear analysis, with an exception of the plastic modeling removed in the linear analysis. The slope of the linear analysis 𝐾 is defined as the vertical force developing a unit deflection at the loading point of the i-th model in the linear analysis. The term 𝐾 can be defined as the tangential stiffness of the outrigger walls. The initial tangential slopes 𝐾 from the nonlinear analysis and stiffness 𝐾 from the linear analysis were identical.
To include the effect of initial cracking in the nonlinear analysis, the secant stiffness, 𝐾 , were defined as the slope from the origin to the point with vertical displacement of 10 mm and are shown in Table 3 with the stiffness 𝐾 from the linear analysis. As mentioned before, 𝛽 is defined as the ratio of 𝐾 to 𝐾 or 𝐾 to 𝐾 of the outrigger wall without openings. 𝛽 is regarded as an index to show the degradation of stiffness of the outrigger walls. It can be observed that, even though the secant stiffness was slightly less than the tangential stiffness, 𝐾 and the degradation ratio 𝛽 were almost identical.
Figure 11. Plastic strain distribution at the ultimate state of (a) M0, (b) M1, (c) M8, and (d) M11.
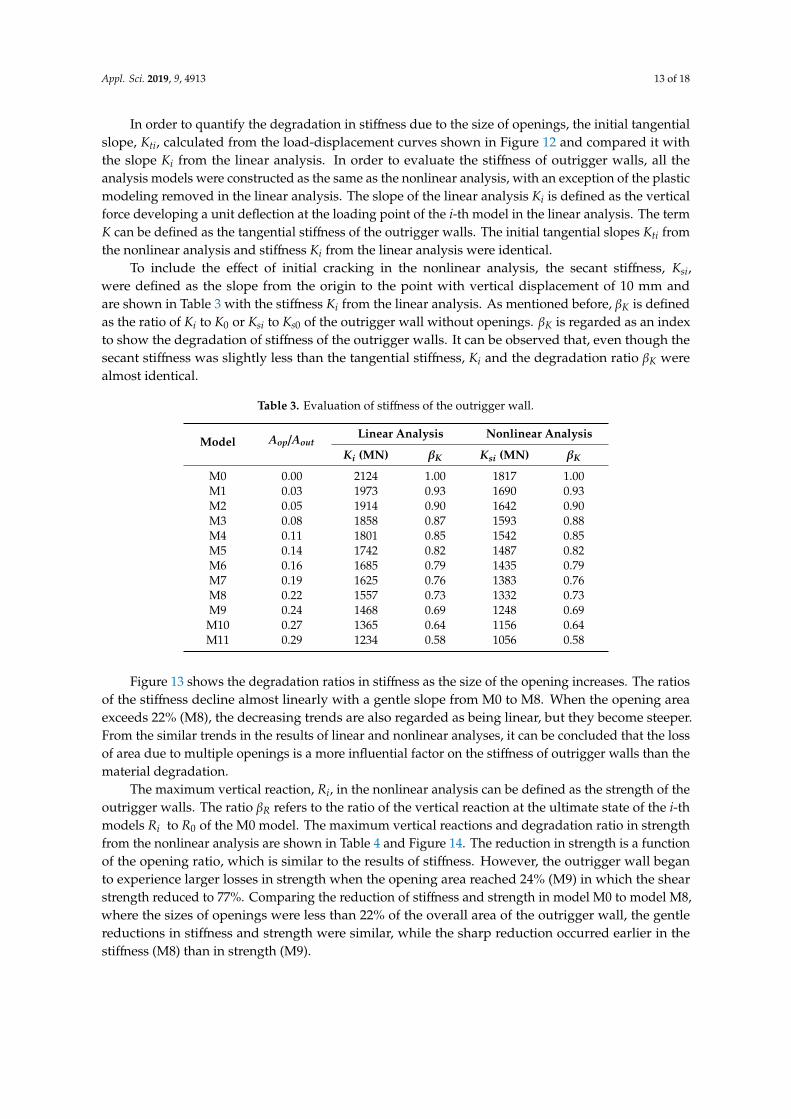
Figure 12 shows the relation between the applied vertical displacement and total vertical reactionsmeasured at the pinned nodes from the nonlinear analysis. It can be clearly observed that the outriggerwalls experienced a progressive decrease in both stiffness and strength as the size of the openingincreased. However, the ultimate displacement of all the models, except M11, were around 60 mm andthe initial yielding was developed at about 10 mm.Appl. Sci. 2019, 9, x FOR PEER REVIEW 13 of 18
Figure 12. Displacement-reaction curves of nonlinear analysis.
Figure 13 shows the degradation ratios in stiffness as the size of the opening increases. The ratios of the stiffness decline almost linearly with a gentle slope from M0 to M8. When the opening area exceeds 22% (M8), the decreasing trends are also regarded as being linear, but they become steeper. From the similar trends in the results of linear and nonlinear analyses, it can be concluded that the loss of area due to multiple openings is a more influential factor on the stiffness of outrigger walls than the material degradation.
Table 3. Evaluation of stiffness of the outrigger wall.
Model 𝑨𝒐𝒑/𝑨𝒐𝒖𝒕 Linear Analysis Nonlinear Analysis 𝑲𝒊 (MN) 𝜷𝑲 𝑲𝒔𝒊 (MN) 𝜷𝑲 M0 0.00 2124 1.00 1817 1.00 M1 0.03 1973 0.93 1690 0.93 M2 0.05 1914 0.90 1642 0.90 M3 0.08 1858 0.87 1593 0.88 M4 0.11 1801 0.85 1542 0.85 M5 0.14 1742 0.82 1487 0.82 M6 0.16 1685 0.79 1435 0.79 M7 0.19 1625 0.76 1383 0.76 M8 0.22 1557 0.73 1332 0.73 M9 0.24 1468 0.69 1248 0.69
M10 0.27 1365 0.64 1156 0.64 M11 0.29 1234 0.58 1056 0.58
The maximum vertical reaction, 𝑅 , in the nonlinear analysis can be defined as the strength of the outrigger walls. The ratio 𝛽 refers to the ratio of the vertical reaction at the ultimate state of the i-th models 𝑅 to 𝑅 of the M0 model. The maximum vertical reactions and degradation ratio in strength from the nonlinear analysis are shown in Table 4 and Figure 14. The reduction in strength is a function of the opening ratio, which is similar to the results of stiffness. However, the outrigger wall began to experience larger losses in strength when the opening area reached 24% (M9) in which the shear strength reduced to 77%. Comparing the reduction of stiffness and strength in model M0 to model M8, where the sizes of openings were less than 22% of the overall area of the outrigger wall,
Figure 12. Displacement-reaction curves of nonlinear analysis.
Appl. Sci. 2019, 9, 4913 13 of 18
In order to quantify the degradation in stiffness due to the size of openings, the initial tangentialslope, Kti, calculated from the load-displacement curves shown in Figure 12 and compared it withthe slope Ki from the linear analysis. In order to evaluate the stiffness of outrigger walls, all theanalysis models were constructed as the same as the nonlinear analysis, with an exception of the plasticmodeling removed in the linear analysis. The slope of the linear analysis Ki is defined as the verticalforce developing a unit deflection at the loading point of the i-th model in the linear analysis. The termK can be defined as the tangential stiffness of the outrigger walls. The initial tangential slopes Kti fromthe nonlinear analysis and stiffness Ki from the linear analysis were identical.
To include the effect of initial cracking in the nonlinear analysis, the secant stiffness, Ksi,were defined as the slope from the origin to the point with vertical displacement of 10 mm andare shown in Table 3 with the stiffness Ki from the linear analysis. As mentioned before, βK is definedas the ratio of Ki to K0 or Ksi to Ks0 of the outrigger wall without openings. βK is regarded as an indexto show the degradation of stiffness of the outrigger walls. It can be observed that, even though thesecant stiffness was slightly less than the tangential stiffness, Ki and the degradation ratio βK werealmost identical.
Table 3. Evaluation of stiffness of the outrigger wall.
Model Aop/AoutLinear Analysis Nonlinear Analysis
Ki (MN) βK Ksi (MN) βK
M0 0.00 2124 1.00 1817 1.00M1 0.03 1973 0.93 1690 0.93M2 0.05 1914 0.90 1642 0.90M3 0.08 1858 0.87 1593 0.88M4 0.11 1801 0.85 1542 0.85M5 0.14 1742 0.82 1487 0.82M6 0.16 1685 0.79 1435 0.79M7 0.19 1625 0.76 1383 0.76M8 0.22 1557 0.73 1332 0.73M9 0.24 1468 0.69 1248 0.69M10 0.27 1365 0.64 1156 0.64M11 0.29 1234 0.58 1056 0.58
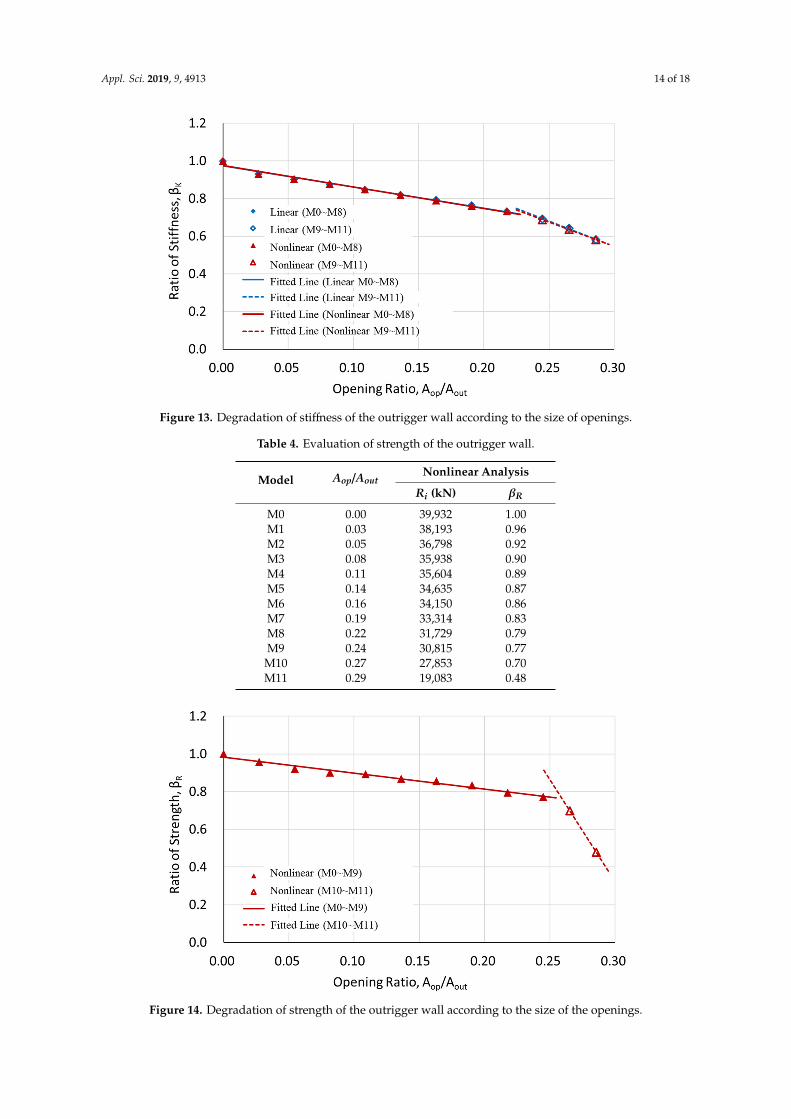
Figure 13 shows the degradation ratios in stiffness as the size of the opening increases. The ratiosof the stiffness decline almost linearly with a gentle slope from M0 to M8. When the opening areaexceeds 22% (M8), the decreasing trends are also regarded as being linear, but they become steeper.From the similar trends in the results of linear and nonlinear analyses, it can be concluded that the lossof area due to multiple openings is a more influential factor on the stiffness of outrigger walls than thematerial degradation.
The maximum vertical reaction, Ri, in the nonlinear analysis can be defined as the strength of theoutrigger walls. The ratio βR refers to the ratio of the vertical reaction at the ultimate state of the i-thmodels Ri to R0 of the M0 model. The maximum vertical reactions and degradation ratio in strengthfrom the nonlinear analysis are shown in Table 4 and Figure 14. The reduction in strength is a functionof the opening ratio, which is similar to the results of stiffness. However, the outrigger wall beganto experience larger losses in strength when the opening area reached 24% (M9) in which the shearstrength reduced to 77%. Comparing the reduction of stiffness and strength in model M0 to model M8,where the sizes of openings were less than 22% of the overall area of the outrigger wall, the gentlereductions in stiffness and strength were similar, while the sharp reduction occurred earlier in thestiffness (M8) than in strength (M9).
Appl. Sci. 2019, 9, 4913 14 of 18
Appl. Sci. 2019, 9, x FOR PEER REVIEW 14 of 18
the gentle reductions in stiffness and strength were similar, while the sharp reduction occurred earlier in the stiffness (M8) than in strength (M9).
From the analysis results, it can be concluded that the reinforced concrete outrigger walls can accommodate four openings without significantly decreasing the stiffness and strength of the outrigger walls if the openings do not severely interfere with the critical load path.
Figure 13. Degradation of stiffness of the outrigger wall according to the size of openings.
Table 4. Evaluation of strength of the outrigger wall.
Model 𝑨𝒐𝒑/𝑨𝒐𝒖𝒕 Nonlinear Analysis 𝑹𝒊 (𝐤𝐍) 𝜷𝑹 M0 0.00 39,932 1.00 M1 0.03 38,193 0.96 M2 0.05 36,798 0.92 M3 0.08 35,938 0.90 M4 0.11 35,604 0.89 M5 0.14 34,635 0.87 M6 0.16 34,150 0.86 M7 0.19 33,314 0.83 M8 0.22 31,729 0.79 M9 0.24 30,815 0.77
M10 0.27 27,853 0.70 M11 0.29 19,083 0.48
Figure 13. Degradation of stiffness of the outrigger wall according to the size of openings.
Table 4. Evaluation of strength of the outrigger wall.
Model Aop/AoutNonlinear Analysis
Ri (kN) βR
M0 0.00 39,932 1.00M1 0.03 38,193 0.96M2 0.05 36,798 0.92M3 0.08 35,938 0.90M4 0.11 35,604 0.89M5 0.14 34,635 0.87M6 0.16 34,150 0.86M7 0.19 33,314 0.83M8 0.22 31,729 0.79M9 0.24 30,815 0.77
M10 0.27 27,853 0.70M11 0.29 19,083 0.48Appl. Sci. 2019, 9, x FOR PEER REVIEW 15 of 18
Figure 14. Degradation of strength of the outrigger wall according to the size of the openings.
3.3. Strength Predicted by Strut-and-Tie Models
According to Chapter 23 of ACI318-14, the nominal shear strength of the outrigger walls can be calculated by using the strut-and-tie model. In this study, the nodal zones are assumed to be stiff enough. Therefore, only the strengths of strut and tie were considered. The diagonal strut in the central zone surrounded by four openings has an angle 𝜃 with the horizontal tie, as shown in Figure 15.
Figure 15. The strut-and-tie model for the outrigger wall with multiple openings.
The shear strength of the outrigger wall by the strut-and-tie model 𝑉 was the smaller one of the shear strengths provided by the strut and the tie, as shown by the following equations. 𝑉 = 𝐹 𝑠𝑖𝑛𝜃 0.85𝛽 𝑓 𝑏 𝑤 (11)𝑉 = 𝐹 𝑠𝑖𝑛𝜃 + 𝐹 𝑡𝑎𝑛𝜃 𝐴 𝑓 𝑠𝑖𝑛𝜃 + 𝐴 𝑓 𝑡𝑎𝑛𝜃 (12)
where 𝐹 is the nominal compressive strength of a strut. 𝛽 is the reduction factor to account for the bottle-shaped strut. For a strut of a uniform cross-sectional area, 𝛽 = 1.0 and 𝑤 is the width of strut. 𝐹 and 𝐹 are the nominal tensile strengths of the top and diagonal reinforcements, respectively.
Figure 14. Degradation of strength of the outrigger wall according to the size of the openings.
Appl. Sci. 2019, 9, 4913 15 of 18
From the analysis results, it can be concluded that the reinforced concrete outrigger walls canaccommodate four openings without significantly decreasing the stiffness and strength of the outriggerwalls if the openings do not severely interfere with the critical load path.
3.3. Strength Predicted by Strut-and-Tie Models
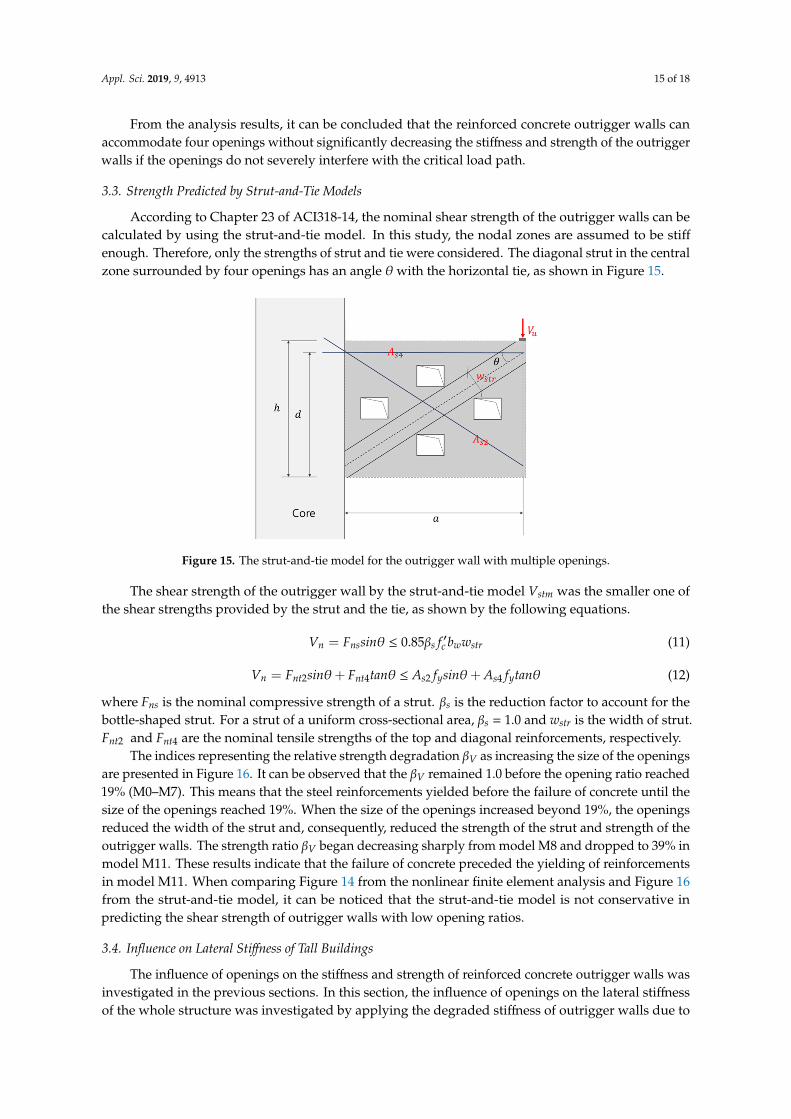
According to Chapter 23 of ACI318-14, the nominal shear strength of the outrigger walls can becalculated by using the strut-and-tie model. In this study, the nodal zones are assumed to be stiffenough. Therefore, only the strengths of strut and tie were considered. The diagonal strut in the centralzone surrounded by four openings has an angle θ with the horizontal tie, as shown in Figure 15.
Appl. Sci. 2019, 9, x FOR PEER REVIEW 15 of 18
Figure 14. Degradation of strength of the outrigger wall according to the size of the openings.
3.3. Strength Predicted by Strut-and-Tie Models
According to Chapter 23 of ACI318-14, the nominal shear strength of the outrigger walls can be calculated by using the strut-and-tie model. In this study, the nodal zones are assumed to be stiff enough. Therefore, only the strengths of strut and tie were considered. The diagonal strut in the central zone surrounded by four openings has an angle 𝜃 with the horizontal tie, as shown in Figure 15.
Figure 15. The strut-and-tie model for the outrigger wall with multiple openings.
The shear strength of the outrigger wall by the strut-and-tie model 𝑉 was the smaller one of the shear strengths provided by the strut and the tie, as shown by the following equations. 𝑉 = 𝐹 𝑠𝑖𝑛𝜃 0.85𝛽 𝑓 𝑏 𝑤 (11)𝑉 = 𝐹 𝑠𝑖𝑛𝜃 + 𝐹 𝑡𝑎𝑛𝜃 𝐴 𝑓 𝑠𝑖𝑛𝜃 + 𝐴 𝑓 𝑡𝑎𝑛𝜃 (12)
where 𝐹 is the nominal compressive strength of a strut. 𝛽 is the reduction factor to account for the bottle-shaped strut. For a strut of a uniform cross-sectional area, 𝛽 = 1.0 and 𝑤 is the width of strut. 𝐹 and 𝐹 are the nominal tensile strengths of the top and diagonal reinforcements, respectively.
Figure 15. The strut-and-tie model for the outrigger wall with multiple openings.
The shear strength of the outrigger wall by the strut-and-tie model Vstm was the smaller one ofthe shear strengths provided by the strut and the tie, as shown by the following equations.
Vn = Fnssinθ ≤ 0.85βs f ′c bwwstr (11)
Vn = Fnt2sinθ+ Fnt4tanθ ≤ As2 fysinθ+ As4 fytanθ (12)
where Fns is the nominal compressive strength of a strut. βs is the reduction factor to account for thebottle-shaped strut. For a strut of a uniform cross-sectional area, βs = 1.0 and wstr is the width of strut.Fnt2 and Fnt4 are the nominal tensile strengths of the top and diagonal reinforcements, respectively.
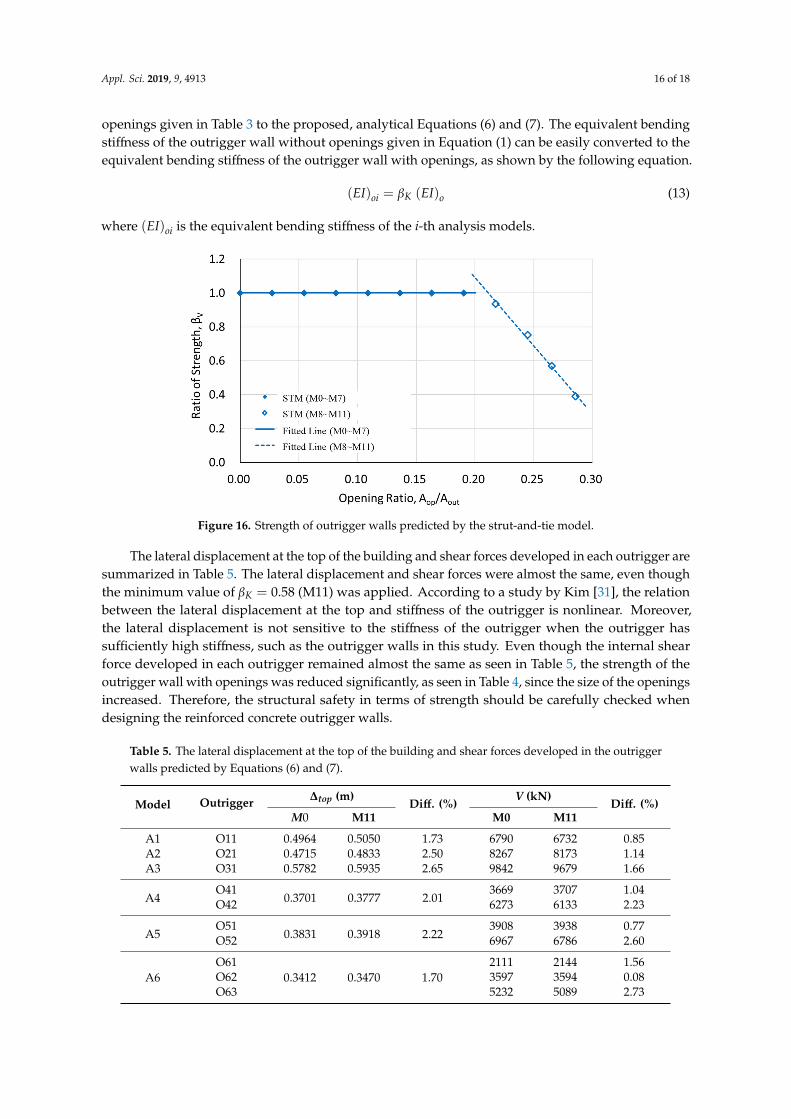
The indices representing the relative strength degradation βV as increasing the size of the openingsare presented in Figure 16. It can be observed that the βV remained 1.0 before the opening ratio reached19% (M0–M7). This means that the steel reinforcements yielded before the failure of concrete until thesize of the openings reached 19%. When the size of the openings increased beyond 19%, the openingsreduced the width of the strut and, consequently, reduced the strength of the strut and strength of theoutrigger walls. The strength ratio βV began decreasing sharply from model M8 and dropped to 39% inmodel M11. These results indicate that the failure of concrete preceded the yielding of reinforcementsin model M11. When comparing Figure 14 from the nonlinear finite element analysis and Figure 16from the strut-and-tie model, it can be noticed that the strut-and-tie model is not conservative inpredicting the shear strength of outrigger walls with low opening ratios.
3.4. Influence on Lateral Stiffness of Tall Buildings
The influence of openings on the stiffness and strength of reinforced concrete outrigger walls wasinvestigated in the previous sections. In this section, the influence of openings on the lateral stiffnessof the whole structure was investigated by applying the degraded stiffness of outrigger walls due to
Appl. Sci. 2019, 9, 4913 16 of 18
openings given in Table 3 to the proposed, analytical Equations (6) and (7). The equivalent bendingstiffness of the outrigger wall without openings given in Equation (1) can be easily converted to theequivalent bending stiffness of the outrigger wall with openings, as shown by the following equation.
(EI)oi = βK (EI)o (13)
where (EI)oi is the equivalent bending stiffness of the i-th analysis models.
Appl. Sci. 2019, 9, x FOR PEER REVIEW 16 of 18
The indices representing the relative strength degradation 𝛽 as increasing the size of the openings are presented in Figure 16. It can be observed that the 𝛽 remained 1.0 before the opening ratio reached 19% (M0–M7). This means that the steel reinforcements yielded before the failure of concrete until the size of the openings reached 19%. When the size of the openings increased beyond 19%, the openings reduced the width of the strut and, consequently, reduced the strength of the strut and strength of the outrigger walls. The strength ratio 𝛽 began decreasing sharply from model M8 and dropped to 39% in model M11. These results indicate that the failure of concrete preceded the yielding of reinforcements in model M11. When comparing Figure 14 from the nonlinear finite element analysis and Figure 16 from the strut-and-tie model, it can be noticed that the strut-and-tie model is not conservative in predicting the shear strength of outrigger walls with low opening ratios.
Figure 16. Strength of outrigger walls predicted by the strut-and-tie model.
3.4. Influence on Lateral Stiffness of Tall Buildings
The influence of openings on the stiffness and strength of reinforced concrete outrigger walls was investigated in the previous sections. In this section, the influence of openings on the lateral stiffness of the whole structure was investigated by applying the degraded stiffness of outrigger walls due to openings given in Table 3 to the proposed, analytical Equations (6) and (7). The equivalent bending stiffness of the outrigger wall without openings given in Equation (1) can be easily converted to the equivalent bending stiffness of the outrigger wall with openings, as shown by the following equation. (𝐸𝐼) = 𝛽 (𝐸𝐼) (13)
where (𝐸𝐼) is the equivalent bending stiffness of the i-th analysis models. The lateral displacement at the top of the building and shear forces developed in each outrigger
are summarized in Table 5. The lateral displacement and shear forces were almost the same, even though the minimum value of 𝛽 = 0.58 (M11) was applied. According to a study by Kim [31], the relation between the lateral displacement at the top and stiffness of the outrigger is nonlinear. Moreover, the lateral displacement is not sensitive to the stiffness of the outrigger when the outrigger has sufficiently high stiffness, such as the outrigger walls in this study. Even though the internal shear force developed in each outrigger remained almost the same as seen in Table 5, the strength of the outrigger wall with openings was reduced significantly, as seen in Table 4, since the size of the openings increased. Therefore, the structural safety in terms of strength should be carefully checked when designing the reinforced concrete outrigger walls.
Figure 16. Strength of outrigger walls predicted by the strut-and-tie model.
The lateral displacement at the top of the building and shear forces developed in each outrigger aresummarized in Table 5. The lateral displacement and shear forces were almost the same, even thoughthe minimum value of βK = 0.58 (M11) was applied. According to a study by Kim [31], the relationbetween the lateral displacement at the top and stiffness of the outrigger is nonlinear. Moreover,the lateral displacement is not sensitive to the stiffness of the outrigger when the outrigger hassufficiently high stiffness, such as the outrigger walls in this study. Even though the internal shearforce developed in each outrigger remained almost the same as seen in Table 5, the strength of theoutrigger wall with openings was reduced significantly, as seen in Table 4, since the size of the openingsincreased. Therefore, the structural safety in terms of strength should be carefully checked whendesigning the reinforced concrete outrigger walls.
Table 5. The lateral displacement at the top of the building and shear forces developed in the outriggerwalls predicted by Equations (6) and (7).
Model Outrigger ∆top (m)Diff. (%)
V (kN)Diff. (%)
M0 M11 M0 M11
A1 O11 0.4964 0.5050 1.73 6790 6732 0.85A2 O21 0.4715 0.4833 2.50 8267 8173 1.14A3 O31 0.5782 0.5935 2.65 9842 9679 1.66
A4O41
0.3701 0.3777 2.013669 3707 1.04
O42 6273 6133 2.23
A5O51
0.3831 0.3918 2.223908 3938 0.77
O52 6967 6786 2.60
A6O61
0.3412 0.3470 1.702111 2144 1.56
O62 3597 3594 0.08O63 5232 5089 2.73
Appl. Sci. 2019, 9, 4913 17 of 18
4. Conclusions
After studying outrigger systems, designing multiple openings on outrigger walls and evaluatingthe influence of the size of openings on outrigger walls, several conclusions can be summarizedas follows.
The introduction of equivalent bending stiffness allows for the derivation of internal shear forceson the outriggers. The proposed equations include the effect of clear span and shear deformation ofoutrigger walls. In comparison with the results from the numerical analysis, the errors between theresults of developed equations and results of finite element analysis were less than 5%. This provesthat the shear reaction on outrigger walls due to lateral loads derived from a simplified model can beused for the preliminary design of outrigger walls.
To use the space occupied by the outrigger walls more efficiently, a development of an outriggerwall with four reinforcements and four openings was proposed through the strut-and-tie model.The stiffness and strength of outrigger walls experience reductions in different levels since the size ofopenings increases. The decrease in trends can be represented by two linear functions of the openingratios, which are the gentle and steep linear functions. The linear finite element analysis can replacethe time-consuming nonlinear finite element analysis when evaluating the stiffness degradation ofoutrigger walls with multiple openings. Taking into consideration the degradation in stiffness andstrength, the ratio of the opening area is recommended to be less than 20%. The degradation of stiffnessdue to openings does not significantly affect the global behavior of the whole structure when theoutrigger already has a large stiffness, as the case of reinforced concrete outrigger walls.
Author Contributions: Conceptualization, methodology, validation, writing—review and editing, supervision,H.-S.K. Formal analysis, data curation, writing—original draft preparation, Y.-T.H. Formal analysis, investigation,H.-J.J.
Funding: This work was supported by Konkuk University in 2017.
Conflicts of Interest: The authors declared no conflict of interest.
References
1. Choi, H.S.; Joseph, L. Outrigger system design considerations. Int. J. High-Rise Build. 2012, 1, 237–246.2. Ali, M.M.; Moon, K.S. Structural developments in tall buildings: Current trends and future prospects.
Archit. Sci. Rev. 2007, 50, 205–223. [CrossRef]3. Taranath, B.S. Optimum belt truss location for high-rise structures. Struct. Eng. 1975, 53, 18–21.4. McNabb, J.W.; Muvdi, B.B. Drift reduction factors for belt high-rise structures. Eng. J. AISC 1975, 12, 88–91.5. Smith, B.S.; Nwaka, I.O. The behaviour of multi-outrigger braced tall buildings. ACI SP-63 1980, 515–541.6. Smith, B.S.; Salim, I. Parameter study of outrigger-braced tall building structures. J. Str. Div. ASCE 1981, 107,
2001–2014.7. Hoenderkamp, J.C.D.; Bakker, M.C.M. Analysis of high-rise braced frames with outriggers. Struct. Des. Tall
Spec. Build. 2003, 12, 335–350. [CrossRef]8. Wu, J.R.; Li, Q.S. Structural performance of multi-outrigger-braced tall buildings. Struct. Des. Tall Spec. Build.
2003, 12, 155–176. [CrossRef]9. Kim, H.S.; Lee, H.L.; Lim, Y.J. Multi-objective optimization of dual-purpose outriggers in tall buildings to
reduce lateral displacement and differential axial shortening. Eng. Struct. 2019, 189, 296–308. [CrossRef]10. Wang, A. Multi-dimensional hybrid design and construction of skyscraper cluster-innovative engineering of
Raffles City. Int. J. High-Rise Build. 2017, 6, 261–269. [CrossRef]11. Ho, G.W.M. The evolution of outrigger system in tall buildings. Int. J. High-Rise Build. 2016, 5, 21–30.
[CrossRef]12. Kong, F.K.; Sharp, G.R. Structural idealization for deep beams with web openings. Mag. Concr. Res. 1977, 29,
81–91. [CrossRef]13. Tan, K.H.; Tong, K.; Tang, C.Y. Consistent strut-and-tie modeling of deep beams with web openings.
Mag. Concr. Res. 2003, 55, 65–75. [CrossRef]
Appl. Sci. 2019, 9, 4913 18 of 18
14. Tang, C.Y.; Tan, K.H. Interactive mechanical model for shear strength of deep beams. J. Struct. Eng. 2004,130, 1534–1544. [CrossRef]
15. Smith, B.S.; Coull, A. Tall Building Structures: Analysis and Design; John Wiley & Sons: New York, NY,USA, 1991.
16. ACI Committee 318. Building Code Requirements for Structural Concrete (ACI 318-14) and Commentary (318R-14);American Concrete Institute: Farmington Hills, MI, USA, 2014.
17. Midas-Gen On-Line Manual; MIDAS Information Technology Co. Ltd. Available online: http://manual.midasuser.com/EN_Common/Gen/855/whnjs.htm. (accessed on 10 September 2019).
18. Schlaich, J.; Schäfer, K.; Jennewein, M. Towards a consistent design of structural concrete. PCI J. 1987, 32,74–150. [CrossRef]
19. Schlaich, J.; Schäfer, K. Design and detailing of structural concrete using strut-and-tie models. Struct. Eng.1991, 69, 113–125.
20. Abaqus. Abaqus Analysis User’s Guide; Dassault Systems Simulia Corp. Available online: http://130.149.89.49:2080/v2016/books/usb/default.htm, (accessed on 10 September 2019).
21. Wosatko, A.; Pamin, J.; Polak, M.A. Application of damage-plasticity models in finite element analysis ofpunching shear. Comput. Struct. 2015, 151, 73–85. [CrossRef]
22. Tao, Y.; Chen, J.F. Concrete damage plasticity model for modeling FRP-to-concrete bond behavior. J. Compos.Const. 2015, 19. [CrossRef]
23. Mohamed, K.; Farghaly, A.S.; Benmokrane, B.; Neale, K.W. Nonlinear finite-element analysis for the behaviorprediction and strut efficiency factor of GFRP-reinforced concrete deep beams. Eng. Struct. 2017, 137,145–161. [CrossRef]
24. Genikomsou, A.S.; Polak, M.A. Finite element analysis of punching shear of concrete slabs using damagedplasticity model in ABAQUS. Eng. Struct. 2015, 98, 38–48. [CrossRef]
25. Ombres, L.; Verre, S. Flexural strengthening of RC beams with steel-reinforced grout: Experimental andnumerical investigation. J. Compos. Const. 2019, 23. [CrossRef]
26. Fortunato, G.; Funari, M.F.; Lonetti, P. Survey and seismic vulnerability assessment of the Baptistery of SanGiovanni in Tumba (Italy). J. Cult. Herit. 2017, 26, 64–78. [CrossRef]
27. Lee, J.; Fenves, G.L. Plastic-damage model for cyclic loading of concrete structures. J. Eng. Mech. 1998, 124,892–900. [CrossRef]
28. Carreira, D.J.; Chu, K.H. Stress-strain relationship for plain concrete in compression. ACI Struct. J. 1985,82, 797–804.
29. Wahalathantri, B.L.; Thambiratnam, D.P.; Chan, T.H.T.; Fawzia, S. A material model for flexural cracksimulation in reinforced concrete elements using Abaqus. In Proceedings of the First International Conferenceon Engineering, Designing and Developing the Built Environment for Sustainable Wellbeing, Brisbane,Australia, 28 April 2011; pp. 260–264.
30. Kim, H.J.; Kim, H.S. Finite element analysis to determine shear behavior of prestressed concrete deep beams.J. Comput. Struct. Eng. Inst. Korea 2019, 32, 165–172. [CrossRef]
31. Kim, H.S. Optimum design of outriggers in a tall building by alternating nonlinear programming. Eng. Struct.2017, 150, 91–97. [CrossRef]
© 2019 by the authors. Licensee MDPI, Basel, Switzerland. This article is an open accessarticle distributed under the terms and conditions of the Creative Commons Attribution(CC BY) license (http://creativecommons.org/licenses/by/4.0/).
Related Documents