Atmospheric Environment 36 (2002) 3473–3484 Influence of meteorological conditions on PM 2.5 and PM 2.510 concentrations during the monsoon season in Hanoi, Vietnam P.D. Hien a, *, V.T. Bac b , H.C. Tham b , D.D. Nhan b , L.D. Vinh c a Vietnam Atomic Energy Agency, 59 Ly Thuong Kiet, Hanoi, Viet Nam b Institute for Nuclear Science and Technology, Cau giay, Hanoi 5T-160, Viet Nam c Upper Air Meteorology Station, Hanoi, Viet Nam Received 21 January 2002; accepted 10 April 2002 Abstract Twenty-four hour samples of air particulate matter with aerodynamic diameters from 2 to 10 mm (PM 10 ) and o2.5 mm (PM 2.5 ) were collected in Hanoi throughout 1 year since August 1998. The air sampler was located in a meteorological garden where routine surface observations and upper air radiosoundings were conducted. Very high PM 2.5 and PM 2.510 concentrations were observed in conjunction with the occurrence of nocturnal radiation inversions from October to December and subsidence temperature inversions (STI) from January to March. In the first case, the PM 2.510 fraction was much enhanced and particulate pollution was significantly higher at night than in daytime. During the occurence of STIs particulate mass was almost evenly distributed among the two fractions and no significant diurnal variations in concentrations were observed. In summer (May–September) particulate pollution was much lower than in winter. The multiple regression of 24-h particulate concentrations against meteorological parameters for both the winter and summer monsoon periods shows that the most important determinants of PM 2.5 are wind speed and air temperature, while rainfall and relative humidity largely control the daily variations of PM 2.510 , indicating the high abundance of soil dust in this fraction. As to turbulence parameters, among the determinants of 24-h particulate concentrations are the vertical gradients of potential temperature and wind speed recorded at 06.30 and 18.30, respectively. Meteorological parameters could explain from 60% to 74% of the day-to-day variations of particulate concentrations. r 2002 Elsevier Science Ltd. All rights reserved. Keywords: Coarse and fine particulate matter; Temperature inversions; Meteorology; Diurnal variations; Regression analysis 1. Introduction The rapid economic development since the introduc- tion of a market orientation reform in the late 1980s has dramatically changed the face of the 3.5 million Vietnam’s capital, Hanoi. In the meantime, uncontrolled growth of construction works, traffic and small manu- facturing activities has resulted in an increasing number of air pollution sources. Dusty atmosphere is visible, especially during the dry winter season. A systematic air particulate pollution study has begun in Hanoi since 1998. The 24-h PM 10 (particulate matter with aerodynamic diameters o10 mm) concentration varies substantially, from as low as 10 mgm 3 in the rainy monsoon months (June–August) to over 300 mgm 3 in the winter (October–March). The devel- opment of appropriate pollution abatement measures requires a thorough understanding of the nature of major emission sources and atmospheric conditions governing the variations of air particulate concentra- tions, particularly those relevant to pollution episodes. The variations of atmospheric conditions in Hanoi are governed by large-scale air circulations which are *Corresponding author. Fax: +84-4-9424133. E-mail address: [email protected] (P.D. Hien). 1352-2310/02/$ - see front matter r 2002 Elsevier Science Ltd. All rights reserved. PII:S1352-2310(02)00295-9

Welcome message from author
This document is posted to help you gain knowledge. Please leave a comment to let me know what you think about it! Share it to your friends and learn new things together.
Transcript
Atmospheric Environment 36 (2002) 3473–3484
Influence of meteorological conditions on PM2.5 and PM2.5�10
concentrations during the monsoon season in Hanoi, Vietnam
P.D. Hiena,*, V.T. Bacb, H.C. Thamb, D.D. Nhanb, L.D. Vinhc
aVietnam Atomic Energy Agency, 59 Ly Thuong Kiet, Hanoi, Viet Namb Institute for Nuclear Science and Technology, Cau giay, Hanoi 5T-160, Viet Nam
cUpper Air Meteorology Station, Hanoi, Viet Nam
Received 21 January 2002; accepted 10 April 2002
Abstract
Twenty-four hour samples of air particulate matter with aerodynamic diameters from 2 to 10 mm (PM10) and
o2.5mm (PM2.5) were collected in Hanoi throughout 1 year since August 1998. The air sampler was located in a
meteorological garden where routine surface observations and upper air radiosoundings were conducted. Very high
PM2.5 and PM2.5�10 concentrations were observed in conjunction with the occurrence of nocturnal radiation inversions
from October to December and subsidence temperature inversions (STI) from January to March. In the first case, the
PM2.5�10 fraction was much enhanced and particulate pollution was significantly higher at night than in daytime.
During the occurence of STIs particulate mass was almost evenly distributed among the two fractions and no significant
diurnal variations in concentrations were observed. In summer (May–September) particulate pollution was much lower
than in winter.
The multiple regression of 24-h particulate concentrations against meteorological parameters for both the winter and
summer monsoon periods shows that the most important determinants of PM2.5 are wind speed and air temperature,
while rainfall and relative humidity largely control the daily variations of PM2.5�10, indicating the high abundance of
soil dust in this fraction. As to turbulence parameters, among the determinants of 24-h particulate concentrations are
the vertical gradients of potential temperature and wind speed recorded at 06.30 and 18.30, respectively. Meteorological
parameters could explain from 60% to 74% of the day-to-day variations of particulate concentrations.r 2002 Elsevier
Science Ltd. All rights reserved.
Keywords: Coarse and fine particulate matter; Temperature inversions; Meteorology; Diurnal variations; Regression analysis
1. Introduction
The rapid economic development since the introduc-
tion of a market orientation reform in the late 1980s has
dramatically changed the face of the 3.5 million
Vietnam’s capital, Hanoi. In the meantime, uncontrolled
growth of construction works, traffic and small manu-
facturing activities has resulted in an increasing number
of air pollution sources. Dusty atmosphere is visible,
especially during the dry winter season.
A systematic air particulate pollution study has begun
in Hanoi since 1998. The 24-h PM10 (particulate matter
with aerodynamic diameters o10mm) concentration
varies substantially, from as low as 10 mgm�3 in the
rainy monsoon months (June–August) to over
300 mgm�3 in the winter (October–March). The devel-
opment of appropriate pollution abatement measures
requires a thorough understanding of the nature of
major emission sources and atmospheric conditions
governing the variations of air particulate concentra-
tions, particularly those relevant to pollution episodes.
The variations of atmospheric conditions in Hanoi
are governed by large-scale air circulations which are*Corresponding author. Fax: +84-4-9424133.
E-mail address: [email protected] (P.D. Hien).
1352-2310/02/$ - see front matter r 2002 Elsevier Science Ltd. All rights reserved.
PII: S 1 3 5 2 - 2 3 1 0 ( 0 2 ) 0 0 2 9 5 - 9
driving the monsoon regime in East and Southeast Asia.
Relatively few investigations have been conducted on
the relationships between air pollution and the monsoon
regime in this region. These include the works of Chung
et al. (1999), Cheng and Lam (2000) and Wang et al.
(2001) on the responses of pollutant gases to synoptic
conditions in Hong Kong; Hien et al. (1999) on the
seasonal variations of the impact of major emission
sources on a receptor site in Ho Chi Minh City; and
Pochanart et al. (2001) on the long-range transport of
O3 under Asian monsoon regime.
To investigate the impact of monsoon conditions on
air pollution in Hanoi, a year-round monitoring study
was carried out for air particulate matter with aero-
dynamic diameters o2.5mm (PM2.5) and from 2.5 to
10mm (PM2.5�10). Based on daily synoptic weather maps
and meteorological data provided by surface observa-
tions and upper air radiosoundings, atmospheric condi-
tions and air masses relevant to pollution episodes could
be identified. Multiple regression analysis was applied to
derive statistical relationships between air particulate
pollution and meteorological parameters for the winter
and summer monsoon periods. For characterisation of
major emission sources, chemical compositions of
particulate matter were determined by instrumental
neutron activation analysis and ion chromatography
methods. This topic, however, will be reported elsewhere.
2. Meteorological conditions
Hanoi is located in the Red River delta in North
Vietnam (21.021N, 105.851E), about 100 km west of the
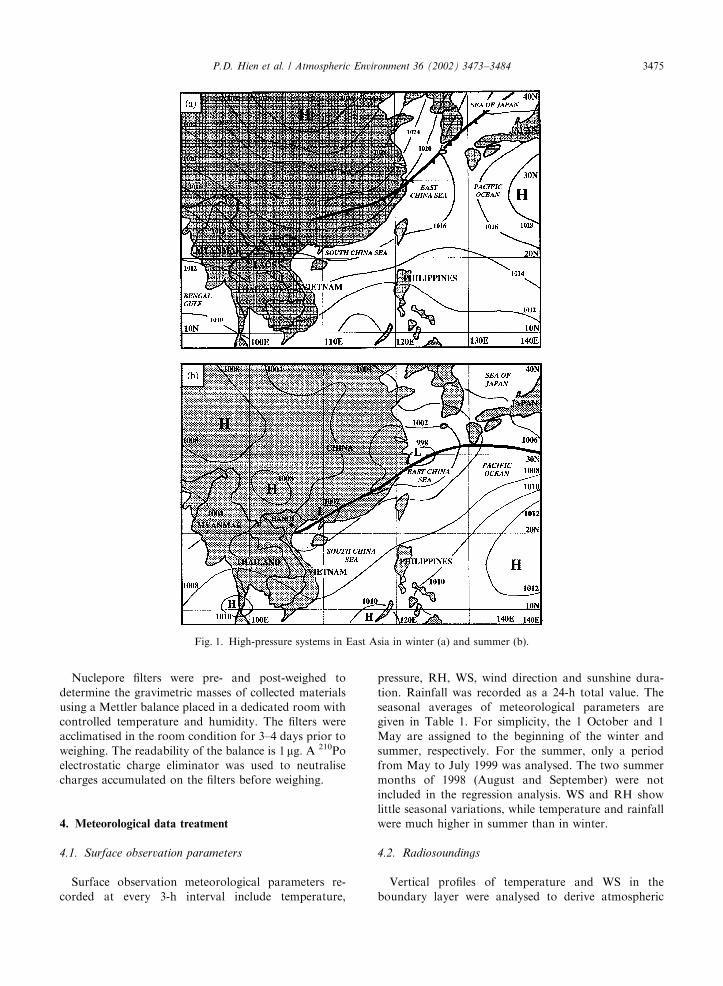
South China Sea (Figs. 1a and b). Being influenced by
the Southeast Asia monsoon regime, the climate is
basically tropical and humid. There are two monsoon
seasons, i.e. the northeast monsoon in winter and the
southeast monsoon in summer.
During winter, atmospheric conditions are alternately
affected by air masses from the Highs over Siberia and
East China Sea (Fig. 1a) (Toan and Dac, 1993). Con-
tinental air from the Siberia High yields low temperature
and stable atmospheric conditions. As to air humidity, it
depends on the trajectory (continental or marine) of air
masses from the source origin to North Vietnam.
From October to December, northerly to north-
easterly flow coming from the inland of China brings
dry and cold air. Nocturnal radiation inversions (NRI)
usually occur on clear and calm nights favouring the
accumulation of dust and air particles in the layer just
above the ground. Conversely, from January to March/
April, with the Siberia High system frequently shifted to
the East, air masses have to travel a long way over the
Pacific Ocean before reaching North Vietnam via the
Gulf of Tonkin. Northeasterly flow of moist-laden air
results in smog, low stratus cloudiness and drizzle. Poor
atmospheric dispersion conditions are associated with
anticyclone’s subsidence temperature inversions (STI) in
the near ground layer.
Maritime air from the High over East China Sea
prevailing during the transition period between cycles of
continental air intrusion brings warm, humid and better
dispersion conditions. Toward the winter end, north-
easterly flow of continental air is getting less frequent
and southeasterly flow of maritime air becomes domi-
nant in March–April.
In summer, high-pressure systems are expanded
northward from the Southern Hemisphere (Fig. 1b).
Atmospheric conditions in North Vietnam are governed
by air masses coming from the Highs over Indian Ocean
and the subtropical High over the South China Sea. The
two systems bring moist air and monsoon rains.
However, heavy rains mainly occur in July and August
in association with tropical depressions, highly unstable
conditions around the Intertropical Convergence Zone
and cyclones, which frequently appear in the South
China Sea and move westward striking the West Pacific
coast. The mean annual rainfall in Hanoi is 1800mm,
80% of which are recorded from May to September.
3. Sampling
Coarse (PM2.5�10) and fine (PM2.5) particulates were
collected on two separate 47mm diameter Nuclepore
polycarbonate filters using a Gent stack filter unit (SFU)
following the instruction manual by Maenhaut et al.
(1992). The air sampler head was mounted at 1.6m
above the ground. The flow rate was kept between 18
and 14 lmin�1. To mitigate filter clogging an on–off
regime was set for the SFU.
The air sampler is located in the Hanoi meteorological
garden. The expansion of the city over the last two
decades had completely transformed this originally
semi-rural area into a new urban residential setting.
Surface observation parameters were recorded at every
3-hour interval. Balloon radiosondes using a RS80-15G
DigiCORA system were launched twice per day at 06.30
(23:30 GMT) and 18.30 (11:30 GMT), providing
information on vertical profiles of air temperature,
relative humidity (RH), dew point, wind speed (WS)
and wind direction. Balloon ascent rate was approxi-
mately 5m s�1 with data retrieved every 2 s, yielding a
vertical resolution of about 10m.
From September 1998 to August 1999, 24-h samples
were taken continuously for the study of the pollution–
meteorology relationships. Daytime and nighttime
samples were taken on more than 100 days in winter
1998–99, providing information on diurnal variations of
particulate pollution. Since September 1999, 24-h
samples were taken twice a week. These samples are
not included in this study.
P.D. Hien et al. / Atmospheric Environment 36 (2002) 3473–34843474
Nuclepore filters were pre- and post-weighed to
determine the gravimetric masses of collected materials
using a Mettler balance placed in a dedicated room with
controlled temperature and humidity. The filters were
acclimatised in the room condition for 3–4 days prior to
weighing. The readability of the balance is 1mg. A 210Po
electrostatic charge eliminator was used to neutralise
charges accumulated on the filters before weighing.
4. Meteorological data treatment
4.1. Surface observation parameters
Surface observation meteorological parameters re-
corded at every 3-h interval include temperature,
pressure, RH, WS, wind direction and sunshine dura-
tion. Rainfall was recorded as a 24-h total value. The
seasonal averages of meteorological parameters are
given in Table 1. For simplicity, the 1 October and 1
May are assigned to the beginning of the winter and
summer, respectively. For the summer, only a period
from May to July 1999 was analysed. The two summer
months of 1998 (August and September) were not
included in the regression analysis. WS and RH show
little seasonal variations, while temperature and rainfall
were much higher in summer than in winter.
4.2. Radiosoundings
Vertical profiles of temperature and WS in the
boundary layer were analysed to derive atmospheric
Fig. 1. High-pressure systems in East Asia in winter (a) and summer (b).
P.D. Hien et al. / Atmospheric Environment 36 (2002) 3473–3484 3475
turbulence parameters. For this purpose, the actual
temperature (T) was converted into potential tempera-
ture (y), thus enabling us to easily distinguish three typesof buoyancy according to the gradient Dy=Dz; namelystable (Dy=Dz > 0), neutral (Dy=Dz ¼ 0) and unstable
(Dy=Dzo0). It was found that high particulate levels
were recorded in conjunction with the occurrence of
NRIs in the first winter period (October–December) and
STIs in the second winter period (January–March). The
criteria adopted for these temperature inversions were
taken as in Heffter (1983), Marsik et al. (1995) and
Calori and Carmichael (1999), namely
Dy=DzX0:005 Km�1;
yT � yBX2K; ð1Þ
where Dy=Dz is the potential temperature gradient in the
inversion layer and yT and yB refer to the potential
temperatures at the top and the base of the inversion
layer.
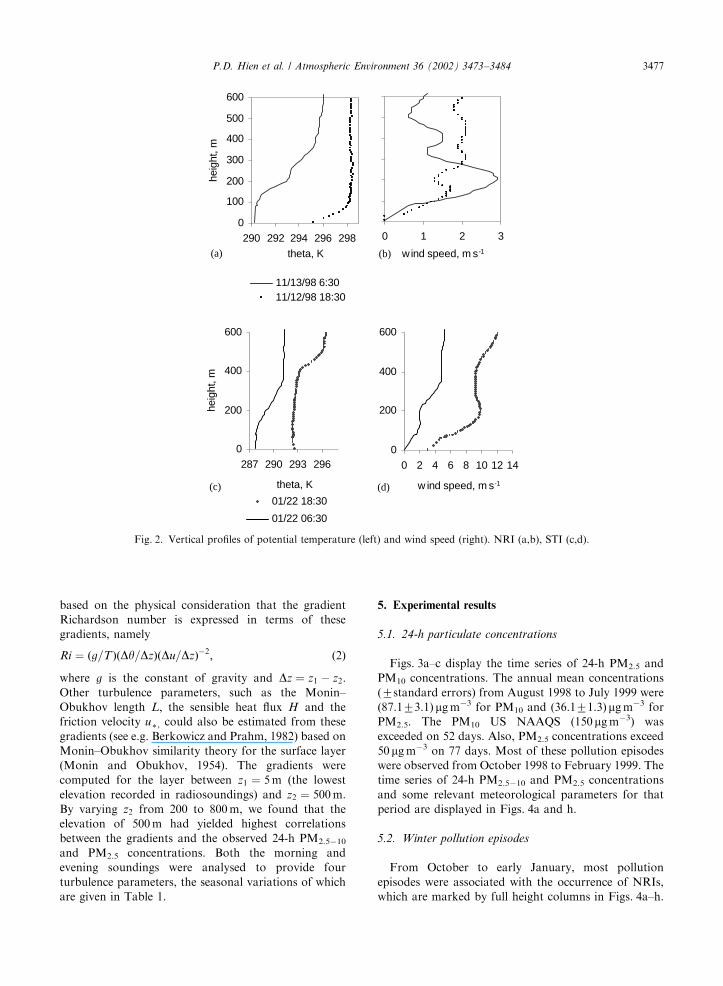
NRI appears at dawn, extending from the ground to
about 100–150m. Over the night the NRI layer moves
up to a higher and higher elevation, reaching a few
hundred meters in the early morning (Fig. 2a), and
presumably disappears thereafter as the sunlight warms
the ground. STI usually persists for days during which it
can be observed in both the morning and evening
soundings with the inversion layer height varying within
several hundred meters above the ground (Fig. 2c).
The WS profiles are illustrated in Figs. 2b and d. WS
increases with height reaching the first maximum at
some elevation below 1000m. No significant relation-
ship exists between the height of this maximum and the
top or bottom of temperature inversions. The profiles of
RH and dew point have good correlations with that of
potential temperature. For this reason upper air data on
these parameters were not included in the regression
analysis.
4.3. Atmospheric turbulence
To characterise atmospheric turbulence, the mixing
depth is usually derived from the vertical profile of
temperature. A literature survey, however, did not find
an overall acceptable definition and criteria for the
practical determination of the mixing depth that could
encompass a wide range of atmospheric stability and a
variety of its governing physical processes (Beyrich,
1997). For daytime convective conditions the mixing
depth was estimated by using a temperature profile
intersection scheme developed by Holzworth (1967). For
nighttime stable conditions, several profile-derived
heights have been proposed, e.g. the height of the NRI
or the first WS maximum. (Mahrt et al., 1982; Baxter,
1991; Berman et al., 1999; Lena and Desiato, 1998;
Seibert et al., 2000). However, several researchers e.g.
Aron (1983), Lena and Desiato (1998) and Seibert et al.
(2000) noted that the mixing depth estimated by the
above methods in general poorly correlate with air
pollutant concentrations.
In our work, the gradients of potential temperature
Dy=Dz and WS Du=Dz between two elevations z1 and z2in the surface layer were used for characterising atmo-
spheric turbulence. Such a simple empirical method is
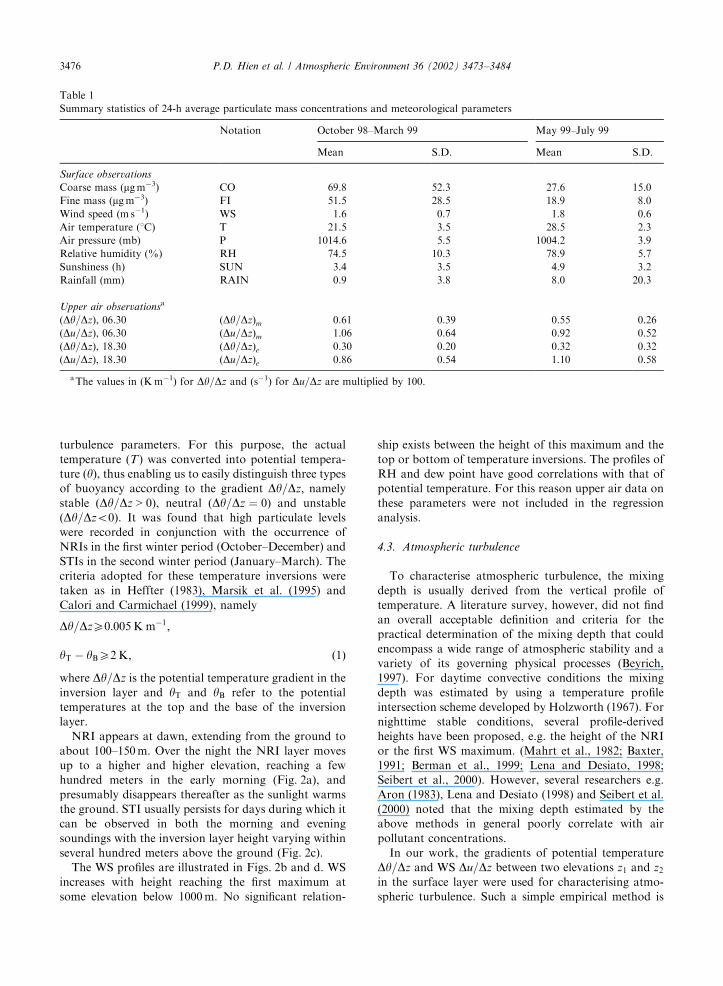
Table 1
Summary statistics of 24-h average particulate mass concentrations and meteorological parameters
Notation October 98–March 99 May 99–July 99
Mean S.D. Mean S.D.
Surface observations
Coarse mass (mgm�3) CO 69.8 52.3 27.6 15.0
Fine mass (mgm�3) FI 51.5 28.5 18.9 8.0
Wind speed (m s�1) WS 1.6 0.7 1.8 0.6
Air temperature (1C) T 21.5 3.5 28.5 2.3
Air pressure (mb) P 1014.6 5.5 1004.2 3.9
Relative humidity (%) RH 74.5 10.3 78.9 5.7
Sunshiness (h) SUN 3.4 3.5 4.9 3.2
Rainfall (mm) RAIN 0.9 3.8 8.0 20.3
Upper air observationsa
(Dy=Dz), 06.30 ðDy=DzÞm 0.61 0.39 0.55 0.26
(Du=Dz), 06.30 ðDu=DzÞm 1.06 0.64 0.92 0.52
(Dy=Dz), 18.30 ðDy=DzÞe 0.30 0.20 0.32 0.32
(Du=Dz), 18.30 ðDu=DzÞe 0.86 0.54 1.10 0.58
aThe values in (Km�1) for Dy=Dz and (s�1) for Du=Dz are multiplied by 100.
P.D. Hien et al. / Atmospheric Environment 36 (2002) 3473–34843476
based on the physical consideration that the gradient
Richardson number is expressed in terms of these
gradients, namely
Ri ¼ ðg=TÞðDy=DzÞðDu=DzÞ�2; ð2Þ
where g is the constant of gravity and Dz ¼ z1 � z2:Other turbulence parameters, such as the Monin–
Obukhov length L; the sensible heat flux H and the
friction velocity u* ;could also be estimated from these
gradients (see e.g. Berkowicz and Prahm, 1982) based on
Monin–Obukhov similarity theory for the surface layer
(Monin and Obukhov, 1954). The gradients were
computed for the layer between z1 ¼ 5m (the lowest
elevation recorded in radiosoundings) and z2 ¼ 500m.
By varying z2 from 200 to 800m, we found that the
elevation of 500m had yielded highest correlations
between the gradients and the observed 24-h PM2.5�10
and PM2.5 concentrations. Both the morning and
evening soundings were analysed to provide four
turbulence parameters, the seasonal variations of which
are given in Table 1.
5. Experimental results
5.1. 24-h particulate concentrations
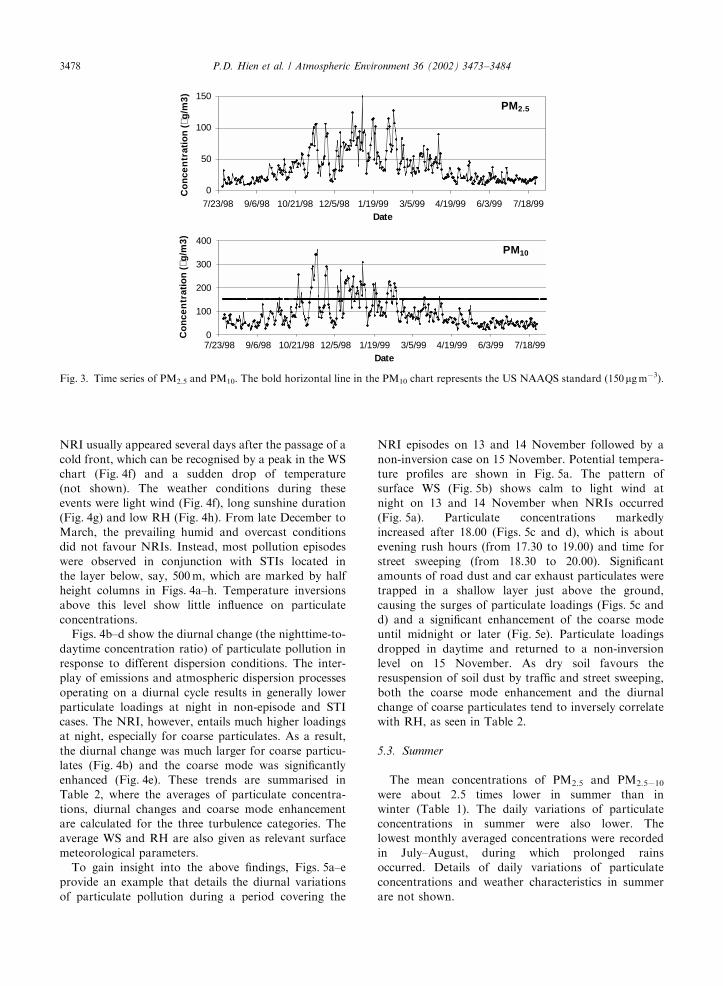
Figs. 3a–c display the time series of 24-h PM2.5 and
PM10 concentrations. The annual mean concentrations
(7standard errors) from August 1998 to July 1999 were
(87.173.1) mgm�3 for PM10 and (36.171.3) mgm�3 for
PM2.5. The PM10 US NAAQS (150mgm�3) was
exceeded on 52 days. Also, PM2.5 concentrations exceed
50 mgm�3 on 77 days. Most of these pollution episodes
were observed from October 1998 to February 1999. The
time series of 24-h PM2.5�10 and PM2.5 concentrations
and some relevant meteorological parameters for that
period are displayed in Figs. 4a and h.
5.2. Winter pollution episodes
From October to early January, most pollution
episodes were associated with the occurrence of NRIs,
which are marked by full height columns in Figs. 4a–h.
0
100
200
300
400
500
600
290 292 294 296 298
theta, K
heig
ht, m
11/13/98 6:3011/12/98 18:30
(a) (b)
(c) (d)
0 1 2 3
wind speed, m s-1
0
200
400
600
287 290 293 296
theta, K
heig
ht, m
01/22 18:30
01/22 06:30
0
200
400
600
0 2 4 6 8 10 12 14
w ind speed, m s-1
Fig. 2. Vertical profiles of potential temperature (left) and wind speed (right). NRI (a,b), STI (c,d).
P.D. Hien et al. / Atmospheric Environment 36 (2002) 3473–3484 3477
NRI usually appeared several days after the passage of a
cold front, which can be recognised by a peak in the WS
chart (Fig. 4f) and a sudden drop of temperature
(not shown). The weather conditions during these
events were light wind (Fig. 4f), long sunshine duration
(Fig. 4g) and low RH (Fig. 4h). From late December to
March, the prevailing humid and overcast conditions
did not favour NRIs. Instead, most pollution episodes
were observed in conjunction with STIs located in
the layer below, say, 500m, which are marked by half
height columns in Figs. 4a–h. Temperature inversions
above this level show little influence on particulate
concentrations.
Figs. 4b–d show the diurnal change (the nighttime-to-
daytime concentration ratio) of particulate pollution in
response to different dispersion conditions. The inter-
play of emissions and atmospheric dispersion processes
operating on a diurnal cycle results in generally lower
particulate loadings at night in non-episode and STI
cases. The NRI, however, entails much higher loadings
at night, especially for coarse particulates. As a result,
the diurnal change was much larger for coarse particu-
lates (Fig. 4b) and the coarse mode was significantly
enhanced (Fig. 4e). These trends are summarised in
Table 2, where the averages of particulate concentra-
tions, diurnal changes and coarse mode enhancement
are calculated for the three turbulence categories. The
average WS and RH are also given as relevant surface
meteorological parameters.
To gain insight into the above findings, Figs. 5a–e
provide an example that details the diurnal variations
of particulate pollution during a period covering the
NRI episodes on 13 and 14 November followed by a
non-inversion case on 15 November. Potential tempera-
ture profiles are shown in Fig. 5a. The pattern of
surface WS (Fig. 5b) shows calm to light wind at
night on 13 and 14 November when NRIs occurred
(Fig. 5a). Particulate concentrations markedly
increased after 18.00 (Figs. 5c and d), which is about
evening rush hours (from 17.30 to 19.00) and time for
street sweeping (from 18.30 to 20.00). Significant
amounts of road dust and car exhaust particulates were
trapped in a shallow layer just above the ground,
causing the surges of particulate loadings (Figs. 5c and
d) and a significant enhancement of the coarse mode
until midnight or later (Fig. 5e). Particulate loadings
dropped in daytime and returned to a non-inversion
level on 15 November. As dry soil favours the
resuspension of soil dust by traffic and street sweeping,
both the coarse mode enhancement and the diurnal
change of coarse particulates tend to inversely correlate
with RH, as seen in Table 2.
5.3. Summer
The mean concentrations of PM2.5 and PM2.5�10
were about 2.5 times lower in summer than in
winter (Table 1). The daily variations of particulate
concentrations in summer were also lower. The
lowest monthly averaged concentrations were recorded
in July–August, during which prolonged rains
occurred. Details of daily variations of particulate
concentrations and weather characteristics in summer
are not shown.
PM10
0
50
100
150
0
300
200
100
400
7/23/98 9/6/98 10/21/98 12/5/98 1/19/99 3/5/99 4/19/99 6/3/99 7/18/99Date
7/23/98 9/6/98 10/21/98 12/5/98 1/19/99 3/5/99 4/19/99 6/3/99 7/18/99Date
Co
nce
ntr
atio
n (µ
g/m
3)C
on
cen
trat
ion
(µg
/m3)
PM2.5
Fig. 3. Time series of PM2.5 and PM10. The bold horizontal line in the PM10 chart represents the US NAAQS standard (150mgm�3).
P.D. Hien et al. / Atmospheric Environment 36 (2002) 3473–34843478
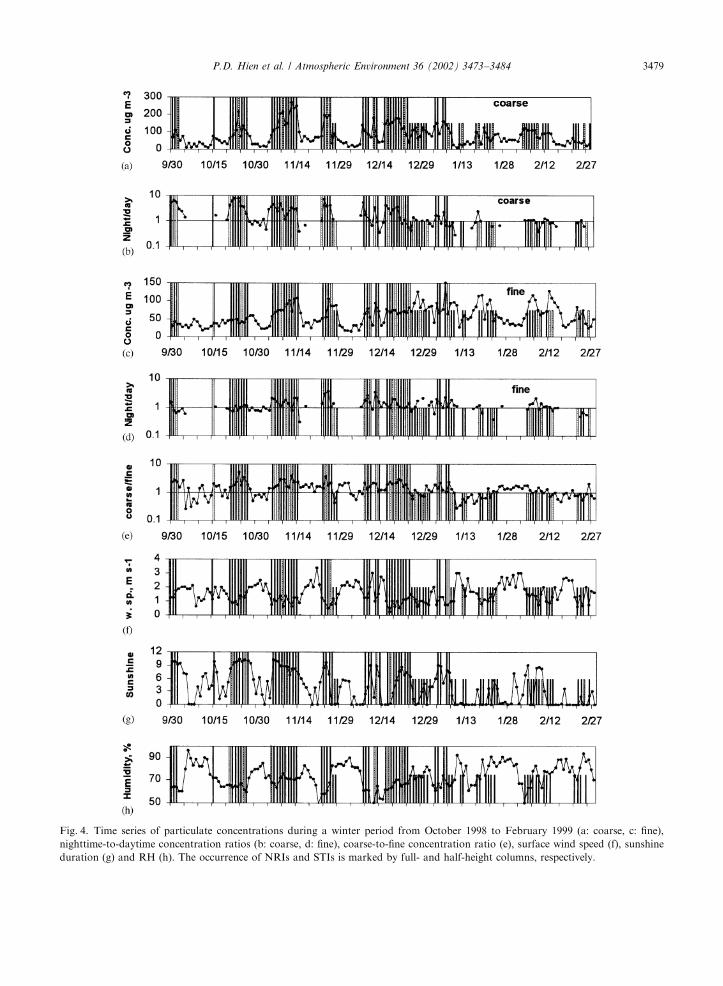
Fig. 4. Time series of particulate concentrations during a winter period from October 1998 to February 1999 (a: coarse, c: fine),
nighttime-to-daytime concentration ratios (b: coarse, d: fine), coarse-to-fine concentration ratio (e), surface wind speed (f), sunshine
duration (g) and RH (h). The occurrence of NRIs and STIs is marked by full- and half-height columns, respectively.
P.D. Hien et al. / Atmospheric Environment 36 (2002) 3473–3484 3479
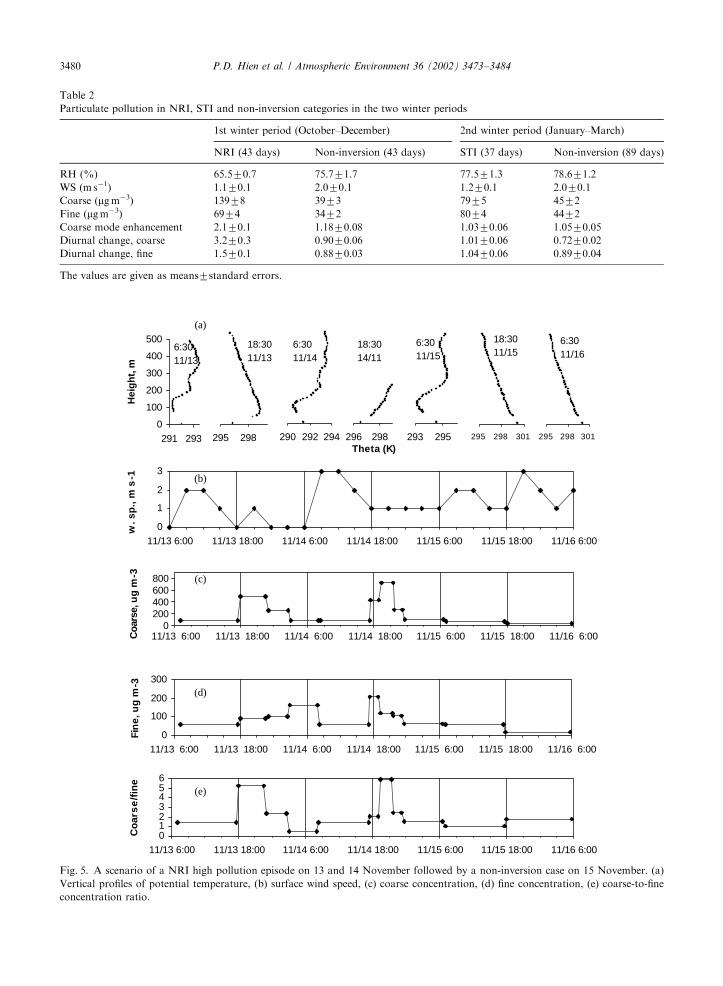
Table 2
Particulate pollution in NRI, STI and non-inversion categories in the two winter periods
1st winter period (October–December) 2nd winter period (January–March)
NRI (43 days) Non-inversion (43 days) STI (37 days) Non-inversion (89 days)
RH (%) 65.570.7 75.771.7 77.571.3 78.671.2
WS (m s�1) 1.170.1 2.070.1 1.270.1 2.070.1
Coarse (mgm�3) 13978 3973 7975 4572
Fine (mgm�3) 6974 3472 8074 4472
Coarse mode enhancement 2.170.1 1.1870.08 1.0370.06 1.0570.05
Diurnal change, coarse 3.270.3 0.9070.06 1.0170.06 0.7270.02
Diurnal change, fine 1.570.1 0.8870.03 1.0470.06 0.8970.04
The values are given as means7standard errors.
0
100
200
300
11/13 6:00 11/13 18:00 11/14 6:00 11/14 18:00 11/15 6:00 11/15 18:00 11/16 6:00
0200400
800600
11/13 6:00 11/13 18:00 11/14 6:00 11/14 18:00 11/15 6:00 11/15 18:00 11/16 6:00
Fin
e, u
g m
-3C
oars
e, u
g m
-3
0
1
2
3
11/13 6:00 11/13 18:00 11/14 6:00 11/14 18:00 11/15 6:00 11/15 18:00 11/16 6:00
w. s
p.,
m s
-1
0
100
200
300
400
500
291 293
Hei
gh
t, m
6:3011/13
(a)
(b)
(c)
(d)
(e)
295 298
18:3011/13
290 292 294
6:3011/14
293 295
6:3011/15
295 298 301
18:3011/15
295 298 301
6:3011/16
Theta (K)
0123456
11/13 6:00 11/13 18:00 11/14 6:00 11/14 18:00 11/15 6:00 11/15 18:00 11/16 6:00
Co
ars
e/f
ine
296 298
18:3014/11
Fig. 5. A scenario of a NRI high pollution episode on 13 and 14 November followed by a non-inversion case on 15 November. (a)
Vertical profiles of potential temperature, (b) surface wind speed, (c) coarse concentration, (d) fine concentration, (e) coarse-to-fine
concentration ratio.
P.D. Hien et al. / Atmospheric Environment 36 (2002) 3473–34843480
6. Relationships between particulate pollution and
meteorological parameters
6.1. Multiple regression analysis method
Meteorological parameters governing the day-to-day
variations of PM2.5 and PM2.5�10 for the two monsoon
periods were studied by multiple regression analysis. In
the regression analysis dependent and independent
variables were constructed by logarithmically transform-
ing observation values. The logarithm transformation
was necessary because atmospheric dispersion equations
suggest that the relationship between particulate con-
centration (C) and meteorological parameters (Pi) is
multiplicative rather than additive (Elsom and Chand-
ler, 1978), i.e.,
C ¼ kY
i
ðPiÞai : ð3Þ
The exponent ai measures the response of particulate
concentration C to the rate of change in meteor-
ological parameter Pi; other meteorological parametersbeing constant. Eq. (3) leads to the multi-linear
regression model for logarithmically transformed
variables, i.e.
ln C ¼ ln k þX
i
ailn Pi þ e; ð4Þ
where ln k; ai and e are the intercept, regression
coefficients and the error term, respectively. Note that
the weather condition has a delayed impact on
particulate pollution, e.g. the today’s drop in fugitive
soil dust is a consequence of the previous day’s rain
that made the surface soil humid. To take into account
this effect, the previous day’s meteorological parameters
are also included in the data set as independent
variables.
Thus, 20 independent variables were used in the
regression analysis including 2� 6 surface observation
and 2� 4 turbulence parameters. To reveal the pre-
dictors (determinants) of 24-h particulate concentrations
among these descriptors, a stepwise multiple regression
method (SPSS, version 7.5) was applied and a statistical
significance p ¼ 0:01 was set for the regression coeffi-
cients.
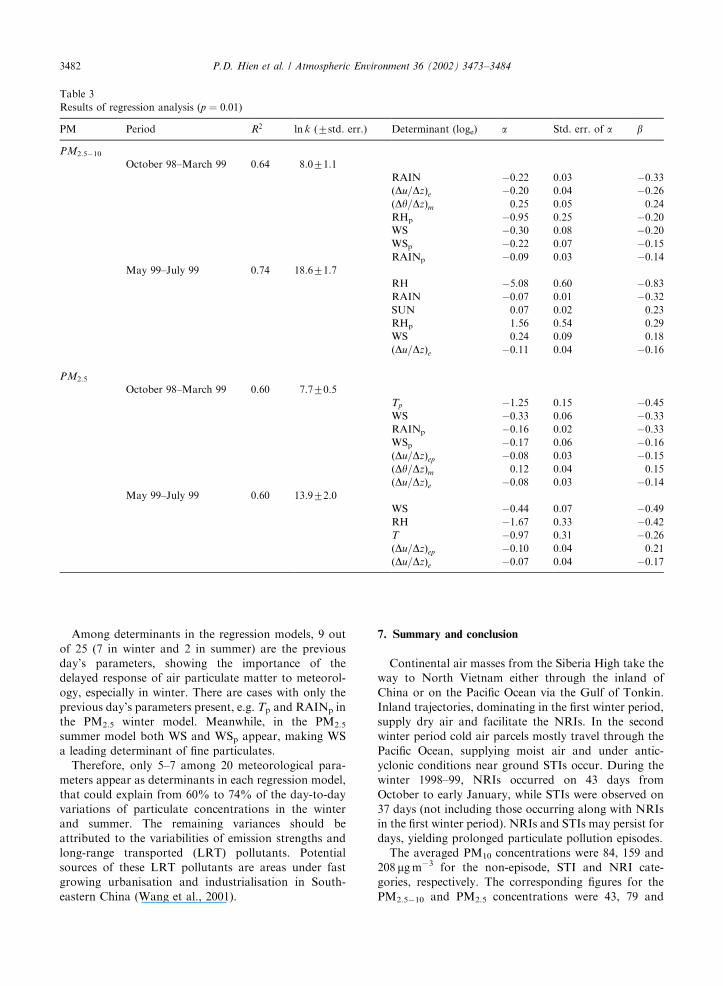
6.2. Regression models
The determinants Pi; coefficients ai and the intercept
ln k of the regression models (5) for the winter and
summer periods are presented in Table 3. The determi-
nant acronyms are listed in Table 1. In addition, a suffix
p is used to denote the previous day’s meteorology. The
standardised regression coefficients b are shown in
column 8. The determinants of 24-h particulate con-
centrations are listed in decreasing order of relative
importance according to the standardised regression
coefficients b: The statistical significance of the determi-nants is po0:01:Among surface observation parameters, rainfall
(RAIN) and RH largely control the daily variations of
PM2.5�10, while WS and air temperature (T) are
most important determinants of PM2.5. As can be
expected, these parameters are inversely related to
particulate concentrations (a; bo0). Rain and moisture
remove atmospheric particulates and diminish the
amount of resuspended soil dust by making the
soil humid. The governing role of rain and humidity
for PM2.5�10 confirms the high abundance of resus-
pended soil dust in the coarse fraction, as suggested in
Section 4.5.
WS plays a leading role in cleansing fine particulates.
In winter both the prompt (WS) and delayed response
(WSp) of WS are observed making it a most important
meteorological parameter in explaining the variations in
fine particulate concentrations. For PM2.5�10, the
relationships with WS are not as significant as with
rainfall. Moreover, PM2.5�10 positively correlates with
WS in summer. Harrison et al. (1997) found a positive
relationship between coarse particulates and WS for the
summer in Birmingham (UK), pointing to the evidence
of resuspension of soil particles.
Air temperature controls PM2.5 but PM2.5�10 and
more significant in winter than in summer. In early
works on air pollution in European cities, the inverse
relationship between air temperature and air pollutant
concentration was attributed to the fuel burning for
space heating of buildings in winter (see Elsom and
Chandler, 1978; and references therein). Space heating is
not a practice in our tropical conditions. The control of
air temperature on PM2.5 in our case reflects a trend that
more favourable atmospheric dispersion conditions are
observed under warm air than cold air masses. In winter,
for example, dispersion conditions are better under
warm maritime air than cold continental air.
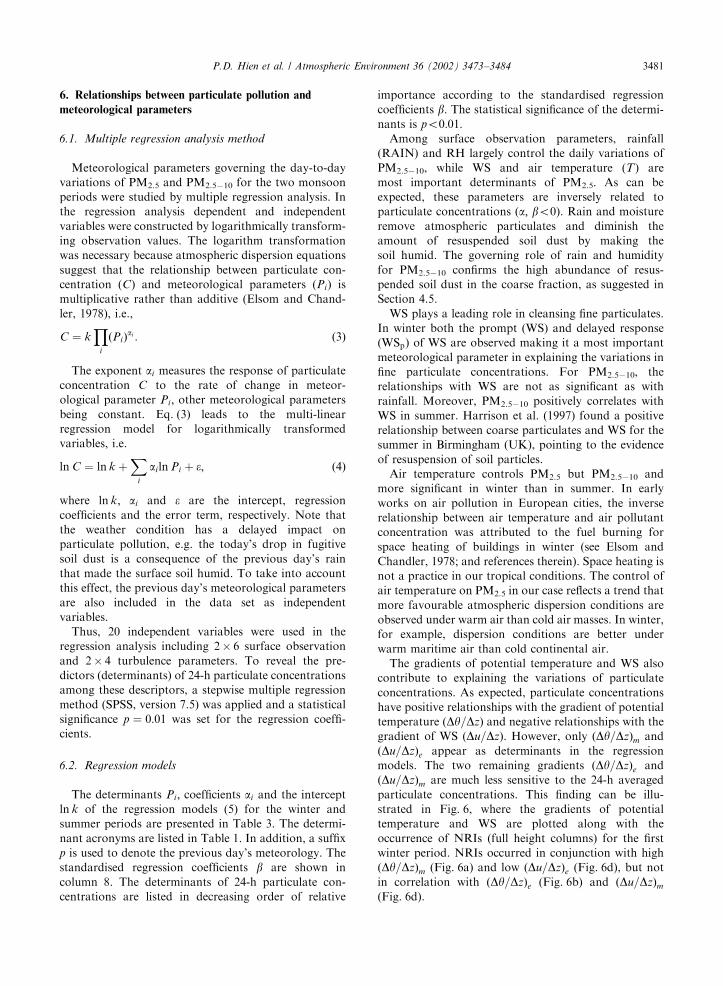
The gradients of potential temperature and WS also
contribute to explaining the variations of particulate
concentrations. As expected, particulate concentrations
have positive relationships with the gradient of potential
temperature (Dy=Dz) and negative relationships with the
gradient of WS (Du=Dz). However, only ðDy=DzÞm and
ðDu=DzÞe appear as determinants in the regression
models. The two remaining gradients ðDy=DzÞe and
ðDu=DzÞm are much less sensitive to the 24-h averaged
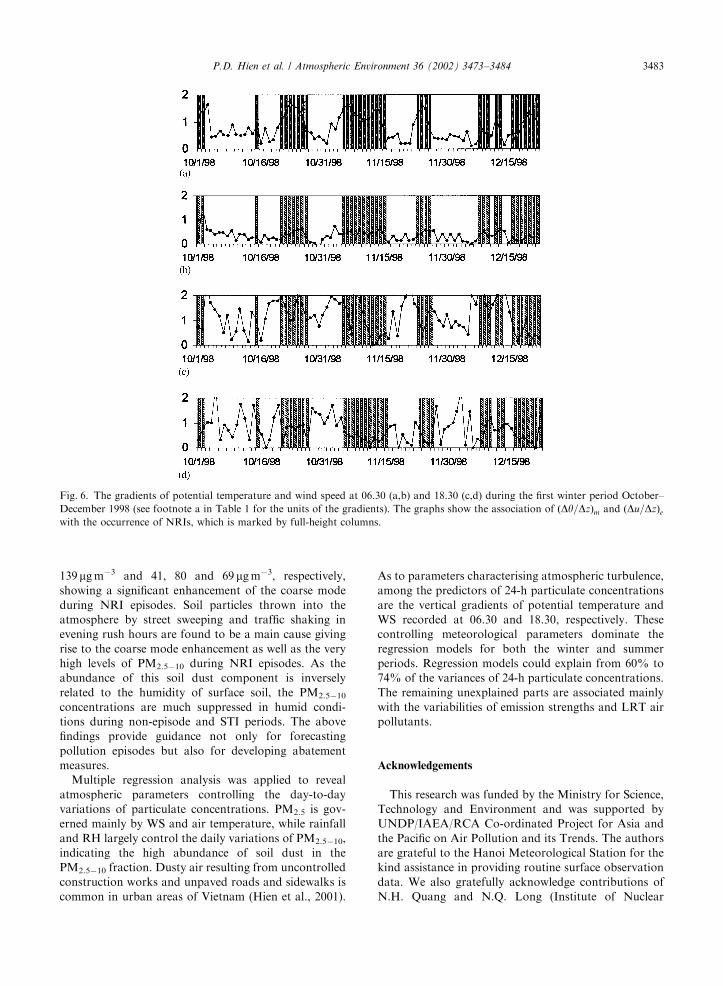
particulate concentrations. This finding can be illu-
strated in Fig. 6, where the gradients of potential
temperature and WS are plotted along with the
occurrence of NRIs (full height columns) for the first
winter period. NRIs occurred in conjunction with high
ðDy=DzÞm (Fig. 6a) and low ðDu=DzÞe (Fig. 6d), but notin correlation with ðDy=DzÞe (Fig. 6b) and ðDu=DzÞm(Fig. 6d).
P.D. Hien et al. / Atmospheric Environment 36 (2002) 3473–3484 3481
Among determinants in the regression models, 9 out
of 25 (7 in winter and 2 in summer) are the previous
day’s parameters, showing the importance of the
delayed response of air particulate matter to meteorol-
ogy, especially in winter. There are cases with only the
previous day’s parameters present, e.g. Tp and RAINp in
the PM2.5 winter model. Meanwhile, in the PM2.5
summer model both WS and WSp appear, making WS
a leading determinant of fine particulates.
Therefore, only 5–7 among 20 meteorological para-
meters appear as determinants in each regression model,
that could explain from 60% to 74% of the day-to-day
variations of particulate concentrations in the winter
and summer. The remaining variances should be
attributed to the variabilities of emission strengths and
long-range transported (LRT) pollutants. Potential
sources of these LRT pollutants are areas under fast
growing urbanisation and industrialisation in South-
eastern China (Wang et al., 2001).
7. Summary and conclusion
Continental air masses from the Siberia High take the
way to North Vietnam either through the inland of
China or on the Pacific Ocean via the Gulf of Tonkin.
Inland trajectories, dominating in the first winter period,
supply dry air and facilitate the NRIs. In the second
winter period cold air parcels mostly travel through the
Pacific Ocean, supplying moist air and under antic-
yclonic conditions near ground STIs occur. During the
winter 1998–99, NRIs occurred on 43 days from
October to early January, while STIs were observed on
37 days (not including those occurring along with NRIs
in the first winter period). NRIs and STIs may persist for
days, yielding prolonged particulate pollution episodes.
The averaged PM10 concentrations were 84, 159 and
208 mgm�3 for the non-episode, STI and NRI cate-
gories, respectively. The corresponding figures for the
PM2.5�10 and PM2.5 concentrations were 43, 79 and
Table 3
Results of regression analysis (p ¼ 0:01)
PM Period R2 ln k (7std. err.) Determinant (loge) a Std. err. of a b
PM2.5�10
October 98–March 99 0.64 8.071.1
RAIN �0.22 0.03 �0.33ðDu=DzÞe �0.20 0.04 �0.26ðDy=DzÞm 0.25 0.05 0.24
RHp �0.95 0.25 �0.20WS �0.30 0.08 �0.20WSp �0.22 0.07 �0.15RAINp �0.09 0.03 �0.14
May 99–July 99 0.74 18.671.7
RH �5.08 0.60 �0.83RAIN �0.07 0.01 �0.32SUN 0.07 0.02 0.23
RHp 1.56 0.54 0.29
WS 0.24 0.09 0.18
ðDu=DzÞe �0.11 0.04 �0.16
PM2.5
October 98–March 99 0.60 7.770.5
Tp �1.25 0.15 �0.45WS �0.33 0.06 �0.33RAINp �0.16 0.02 �0.33WSp �0.17 0.06 �0.16ðDu=DzÞep �0.08 0.03 �0.15ðDy=DzÞm 0.12 0.04 0.15
ðDu=DzÞe �0.08 0.03 �0.14May 99–July 99 0.60 13.972.0
WS �0.44 0.07 �0.49RH �1.67 0.33 �0.42T �0.97 0.31 �0.26ðDu=DzÞep �0.10 0.04 0.21
ðDu=DzÞe �0.07 0.04 �0.17
P.D. Hien et al. / Atmospheric Environment 36 (2002) 3473–34843482
139mgm�3 and 41, 80 and 69 mgm�3, respectively,
showing a significant enhancement of the coarse mode
during NRI episodes. Soil particles thrown into the
atmosphere by street sweeping and traffic shaking in
evening rush hours are found to be a main cause giving
rise to the coarse mode enhancement as well as the very
high levels of PM2.5�10 during NRI episodes. As the
abundance of this soil dust component is inversely
related to the humidity of surface soil, the PM2.5�10
concentrations are much suppressed in humid condi-
tions during non-episode and STI periods. The above
findings provide guidance not only for forecasting
pollution episodes but also for developing abatement
measures.
Multiple regression analysis was applied to reveal
atmospheric parameters controlling the day-to-day
variations of particulate concentrations. PM2.5 is gov-
erned mainly by WS and air temperature, while rainfall
and RH largely control the daily variations of PM2.5�10,
indicating the high abundance of soil dust in the
PM2.5�10 fraction. Dusty air resulting from uncontrolled
construction works and unpaved roads and sidewalks is
common in urban areas of Vietnam (Hien et al., 2001).
As to parameters characterising atmospheric turbulence,
among the predictors of 24-h particulate concentrations
are the vertical gradients of potential temperature and
WS recorded at 06.30 and 18.30, respectively. These
controlling meteorological parameters dominate the
regression models for both the winter and summer
periods. Regression models could explain from 60% to
74% of the variances of 24-h particulate concentrations.
The remaining unexplained parts are associated mainly
with the variabilities of emission strengths and LRT air
pollutants.
Acknowledgements
This research was funded by the Ministry for Science,
Technology and Environment and was supported by
UNDP/IAEA/RCA Co-ordinated Project for Asia and
the Pacific on Air Pollution and its Trends. The authors
are grateful to the Hanoi Meteorological Station for the
kind assistance in providing routine surface observation
data. We also gratefully acknowledge contributions of
N.H. Quang and N.Q. Long (Institute of Nuclear
Fig. 6. The gradients of potential temperature and wind speed at 06.30 (a,b) and 18.30 (c,d) during the first winter period October–
December 1998 (see footnote a in Table 1 for the units of the gradients). The graphs show the association of ðDy=DzÞm and ðDu=DzÞewith the occurrence of NRIs, which is marked by full-height columns.
P.D. Hien et al. / Atmospheric Environment 36 (2002) 3473–3484 3483
Science and Technology) during the implementation of
this research project.
References
Aron, R., 1983. Mixing height—an inconsistent indicator of
potential air pollution concentrations. Atmospheric Envir-
onment 17, 2193–2197.
Baxter, R., 1991. Determination of mixing heights from data
collected during the 1985 SCCCAMP field program.
Journal of Applied Meteorology 30, 598–606.
Berkowicz, R., Prahm, L.P., 1982. Evaluation of the profile
method for estimation of surface fluxes of momentum and
heat. Atmospheric Environment 16, 2809–2819.
Berman, S., Ku, J.Y., Rao, S.T., 1999. Spatial and temporal
variation in the mixing depth over the northeastern United
States during the summer of 1995. Journal of Applied
Meteorology 38, 1661–1673.
Beyrich, F., 1997. Mixing height estimation from sodar data—a
critical discussion. Atmospheric Environment 31, 3941–
3953.
Calori, G., Carmichael, G.R., 1999. An urban trajectory model
for sulfur in Asian megacities: model concepts and
preliminary application. Atmospheric Environment 33,
3109–3117.
Cheng, S., Lam, K.C., 2000. Synoptic typing and its application
to the assessment of climatic impact on concentrations of
sulphur dioxide and nitrogen oxides in Hong Kong.
Atmospheric Environment 34, 585–594.
Chung, K.K., Chan, J.C.L., Ng, C.N., Lam, K.S., Wang, T.,
1999. Synoptic conditions associated with high carbon
monoxide episodes at a coastal station in Hong Kong.
Atmospheric Environment 33, 3087–3095.
Elsom, D.M., Chandler, T.J., 1978. Meteorological controls
upon ground level concentrations of smoke and sulfur
dioxide in two urban areas of the United Kingdom.
Atmospheric Environment 12, 1543–1554.
Harrison, R.M., Deacon, A.R., Jones, M.R., Appleby, R.S.,
1997. Sources and processes affecting concentrations of
PM10 and PM2.5 particulate matter in Birmingham (UK).
Atmospheric Environment 31, 4103–4117.
Heffter, J.L., 1983. Branching atmospheric trajectory (BAT)
model. NOAA Technical Memorandum ERL ARL-121.
Hien, P.D., Binh, N.T., Truong, Y., Ngo, N.T., 1999. Temporal
variations of source impacts at the receptor as derived from
air particulate monitoring data in Ho Chi Minh City,
Vietnam. Atmospheric Environment 31, 1073–1076.
Hien, P.D., Binh, N.T., Truong, Y., Ngo, N.T., Sieu, L.N.,
2001. Comparative receptor modelling study of TSP, PM2
and PM2�10 in Ho Chi Minh City. Atmospheric Environ-
ment 35, 2669–2678.
Holzworth, C.G., 1967. Mixing depths, wind speed and air
pollution potential for selected locations in the United
States. Journal of Applied Meteorology 6, 1039–1044.
Lena, F., Desiato, F., 1998. Intercomparison of nocturnal
mixing height estimate methods for urban air pollution
modelling. Atmospheric Environment 33, 2385–2393.
Mahrt, L., Andre, J.C., Heald, R.C., 1982. On the depth of the
nocturnal boundary layer. Journal of Applied Meteorology
21, 90–97.
Maenhaut, W., Francois, F., Calmayer, J., 1993. The GENT
stacked filter unit sampler for collection of atmospheric
aerosols in two size tractions, IAEA NAHRES-19, Vienna,
pp. 249–263.
Marsik, F.J., Fischer, K.W., McDonald, T.D., Samson, P.J.,
1995. Comparison of methods for estimating mixing height
used during the 1992 Atlanta field intensive. Journal of
Applied Meteorology 34, 1802–1847.
Monin, A.S., Obukhov, A.M., 1954. Dimensionless character-
istics of turbulence in the atmospheric surface layer.
Doklady Academii Nauk Uzbekskoi SSR 93, 223–226.
Pochanart, P., Kreasuwun, J., Sukasem, P., Geeratithada-
niyom, W., Tabukanon, M.S., Hirokawa, J., Kajii, Y.,
Akimoto, H., 2001. Tropical tropospheric ozone observed
in Thailand. Atmospheric Environment 35, 2657–2668.
Seibert, P., Beyrich, F., Gryning, S.E., Joffre, S., Rasmussen,
A., Tercier, P., 2000. Review and intercomparison of
operational methods for the determination of the mixing
height. Atmospheric Environment 34, 1001–1027.
Toan, P.N., Dac, P.T., 1993. The climate of Vietnam. Science
and Technology Publisher, Hanoi (in Vietnamese).
Wang, T., Cheung, V.T.F., Lam, K.S., Kok, G.L., Harris, J.M.,
2001. The characteristics of ozone and related compounds in
the boundary layer of the South China coast: temporal and
vertical variations during autumn season. Atmospheric
Environment 35, 2735–2746.
P.D. Hien et al. / Atmospheric Environment 36 (2002) 3473–34843484
Related Documents