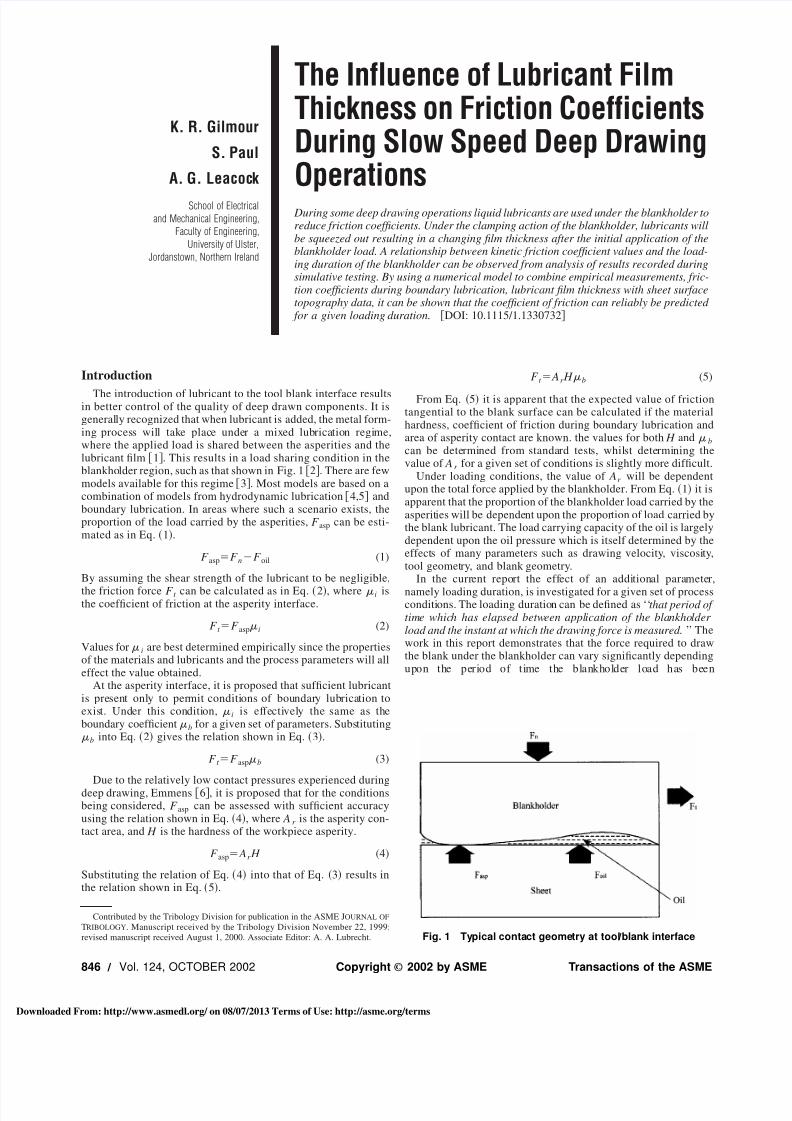
K. R. Gilmour S. Paul A. G. Leacock School of Electrical and Mechanical Engineering, Faculty of Engineering, University of Ulster, Jordanstown, Northern Ireland The Influence of Lubricant Film Thickness on Friction Coefficients During Slow Speed Deep Drawing Operations During some deep drawing operations liquid lubricants are used under the blankholder to reduce friction coefficients. Under the clamping action of the blankholder, lubricants will be squeezed out resulting in a changing film thickness after the initial application of the blankholder load. A relationship between kinetic friction coefficient values and the load- ing duration of the blankholder can be observed from analysis of results recorded during simulative testing. By using a numerical model to combine empirical measurements, fric- tion coefficients during boundary lubrication, lubricant film thickness with sheet surface topography data, it can be shown that the coefficient of friction can reliably be predicted for a given loading duration. DOI: 10.1115/1.1330732 Introduction The introduction of lubricant to the tool blank interface results in better control of the quality of deep drawn components. It is general ly recognized that when lubricant is added, the metal form- ing proces s wil l take plac e unde r a mixed lubrica tion regi me, where the applied load is shared between the asperities and the lubricant film 1. This results in a load sharing condition in the blankho lder region, such as that shown in Fig. 1 2. There are few models available for this regime 3. Most models are based on a combination of models from hydrodynamic lubrication 4,5 and boundary lubrication. In areas where such a scenario exists, the proportion of the load carried by the asperities, F asp can be esti- mated as in Eq. 1. F asp F n F oil (1) By assuming the shear strength of the lubricant to be negligible, the friction force F t can be calculated as in Eq. 2, where i is the coefficient of friction at the asperity interface. F t F asp i (2) Values for i are best determined empirically since the properties of the materials and lubricants and the process parameters will all effect the value obtained. At the asperity interface, it is proposed that sufficient lubricant is pre sent onl y to per mit conditi ons of boundar y lubrica tion to exis t. Under this conditi on, i is ef fecti vel y the same as the boundary coefficient b for a given set of parameters. Subs tituting b into Eq. 2 gives the relation shown in Eq. 3. F t F asp b (3) Due to the relatively low contact pressures experienced during deep drawing, Emmens 6, it is proposed that for the conditions being considered, F asp can be assessed with sufficient accuracy using the relation shown in Eq. 4, where A r is the asperity con- tact area, and H is the hardness of the workpiece asperity. F asp A r H (4) Substituting the relation of Eq. 4 into that of Eq. 3 results in the relation shown in Eq. 5. F t A r H b (5) From Eq. 5 it is apparent that the expected value of friction tangential to the blank surface can be calculated if the material hardness, coefficient of friction during boundary lubrication and area of asperity contact are known. the values for both H and b can be dete rmi ned from standa rd test s, whil st dete rmi ning the value of A r for a given set of conditions is slightly more difficult. Under loading conditions, the value of A r will be dependent upon the total force applied by the blankholder. From Eq. 1 it is apparent that the proportion of the blankholder load carried by the asperit ies will be depende nt upon the propor tion of load carried by the blank lubricant. The load carrying capacity of the oil is largely dependent upon the oil pressure which is itself determined by the effect s of many parameters such as drawing velocity , viscosi ty , tool geomet ry , and blank geometry . In the curr ent repo rt the eff ect of an addi tion al para mete r, namely loading duration, is investigated for a given set of process conditi ons. The loading duratio n can be defined as ‘‘ that period of time whic h has elap sed betw een appl ication of the bla nkho lder load and the instant at which the drawing force is measured. ’ ’ The work in this report demonstrates that the force required to draw the blank under the blankholder can vary significantly depending up on th e pe ri od of ti me th e bl an khol de r lo ad ha s be en Contributed by the Tribology Division for publication in the ASME JOURNAL OF TRIBOLOGY. Manuscript received by the Tribology Division November 22, 1999; revised manuscript received August 1, 2000. Associate Editor: A. A. Lubrecht. Fig. 1 Ty pical conta ct geome try at tool Õblank interface 846 Õ Vol. 124, OCTOBER 2002 Copyright © 2002 by ASME Transactions of the ASME Downloaded From: http://www.asmedl.org/ on 08/07/2013 Terms of Use: http://asme.org/terms

Welcome message from author
This document is posted to help you gain knowledge. Please leave a comment to let me know what you think about it! Share it to your friends and learn new things together.
Transcript
7/27/2019 Influence of Lubrication Film Thickness
http://slidepdf.com/reader/full/influence-of-lubrication-film-thickness 1/6
K. R. Gilmour
S. Paul
A. G. Leacock
School of Electrical
and Mechanical Engineering,
Faculty of Engineering,
University of Ulster,
Jordanstown, Northern Ireland
The Influence of Lubricant FilmThickness on Friction CoefficientsDuring Slow Speed Deep DrawingOperations
During some deep drawing operations liquid lubricants are used under the blankholder toreduce friction coefficients. Under the clamping action of the blankholder, lubricants willbe squeezed out resulting in a changing film thickness after the initial application of theblankholder load. A relationship between kinetic friction coefficient values and the load-ing duration of the blankholder can be observed from analysis of results recorded duringsimulative testing. By using a numerical model to combine empirical measurements, fric-tion coefficients during boundary lubrication, lubricant film thickness with sheet surfacetopography data, it can be shown that the coefficient of friction can reliably be predicted
for a given loading duration. DOI: 10.1115/1.1330732
Introduction
The introduction of lubricant to the tool blank interface resultsin better control of the quality of deep drawn components. It isgenerally recognized that when lubricant is added, the metal form-ing process will take place under a mixed lubrication regime,where the applied load is shared between the asperities and thelubricant film 1. This results in a load sharing condition in theblankholder region, such as that shown in Fig. 1 2. There are fewmodels available for this regime 3. Most models are based on acombination of models from hydrodynamic lubrication 4,5 andboundary lubrication. In areas where such a scenario exists, theproportion of the load carried by the asperities, F asp can be esti-mated as in Eq. 1.
F aspF nF oil (1)
By assuming the shear strength of the lubricant to be negligible,
the friction force F t can be calculated as in Eq. 2, where i isthe coefficient of friction at the asperity interface.
F t F asp i (2)
Values for i are best determined empirically since the propertiesof the materials and lubricants and the process parameters will alleffect the value obtained.
At the asperity interface, it is proposed that sufficient lubricantis present only to permit conditions of boundary lubrication toexist. Under this condition, i is effectively the same as theboundary coefficient b for a given set of parameters. Substituting b into Eq. 2 gives the relation shown in Eq. 3.
F t F asp b (3)
Due to the relatively low contact pressures experienced duringdeep drawing, Emmens 6, it is proposed that for the conditionsbeing considered, F asp can be assessed with sufficient accuracyusing the relation shown in Eq. 4, where A r is the asperity con-tact area, and H is the hardness of the workpiece asperity.
F asp Ar H (4)
Substituting the relation of Eq. 4 into that of Eq. 3 results inthe relation shown in Eq. 5.
F t Ar H b (5)
From Eq. 5 it is apparent that the expected value of frictiontangential to the blank surface can be calculated if the materialhardness, coefficient of friction during boundary lubrication andarea of asperity contact are known. the values for both H and b
can be determined from standard tests, whilst determining thevalue of A r for a given set of conditions is slightly more difficult.
Under loading conditions, the value of Ar will be dependentupon the total force applied by the blankholder. From Eq. 1 it isapparent that the proportion of the blankholder load carried by theasperities will be dependent upon the proportion of load carried bythe blank lubricant. The load carrying capacity of the oil is largelydependent upon the oil pressure which is itself determined by theeffects of many parameters such as drawing velocity, viscosity,tool geometry, and blank geometry.
In the current report the effect of an additional parameter,
namely loading duration, is investigated for a given set of processconditions. The loading duration can be defined as ‘‘that period of time which has elapsed between application of the blankholder load and the instant at which the drawing force is measured.’’ Thework in this report demonstrates that the force required to drawthe blank under the blankholder can vary significantly dependingupon the period of time the blankholder load has been
Contributed by the Tribology Division for publication in the ASME J OURNAL OF
TRIBOLOGY. Manuscript received by the Tribology Division November 22, 1999;
revised manuscript received August 1, 2000. Associate Editor: A. A. Lubrecht. Fig. 1 Typical contact geometry at tool Õblank interface
846 Õ Vol. 124, OCTOBER 2002 Copyright © 2002 by ASME Transactions of the ASME
wnloaded From: http://www.asmedl.org/ on 08/07/2013 Terms of Use: http://asme.org/terms

7/27/2019 Influence of Lubrication Film Thickness
http://slidepdf.com/reader/full/influence-of-lubrication-film-thickness 2/6
applied. the identification of this parameter and explanation of themechanisms causing it will help to reduce inconsistency in themanufacture of deep drawn components.
Theory
When the blankholder load is first applied it causes the blank-holder to move downwards. When the blank has been lubricated,the rate at which the blankholder descends when it has contactedthe lubricant is governed by the action of the squeeze film. Forease of analysis most authors assume that during the approaching
stage the velocity of blankholder descent is accurately describedby simple squeeze film theory 5. For a rectangular interface suchas that shown in Fig. 2 the velocity of closure ‘‘ u’’ can be definedas in Eq. 6,
uF nh3
lb 3k s , (6)
Fig. 2 A rectangular interface
Fig. 3 Friction test machine
Fig. 4 Conventional graph illustrating the effect of prior loading duration on the kinetic fric-tion curve
Journal of Tribology OCTOBER 2002, Vol. 124 Õ 847
wnloaded From: http://www.asmedl.org/ on 08/07/2013 Terms of Use: http://asme.org/terms

7/27/2019 Influence of Lubrication Film Thickness
http://slidepdf.com/reader/full/influence-of-lubrication-film-thickness 3/6
where F s is the normal applied force, h is the gap height, is thelubricant viscosity, l is the gap length, b is the gap breadth, and k sis the shape factor. Correspondingly if the velocity of descent isknown, then the surface separation at any instant can be calculatedrelative to a final penetration height.
The final penetration height will be such that the correspondingasperity contact area will support the applied load F n . As previ-ously shown the value of A r can be estimated as in Eq. 4.
Finding the actual penetration height which corresponds to thevalue of A r requires knowledge of the blank surface geometry. Byexamining a portion of the surface using surface measuring equip-
ment, data can be obtained providing a relationship between bear-ing area and penetration height. This data is derived in a mannersimilar to that first described by Abbott and Firestone 7. Thisdata also allows the contact area to be calculated after a givenperiod of loading duration, provided the applied load, final pen-etration height and rate of descent are known. From this contactarea, the friction force at any instant, F t , can be calculated asshown in Eq. 5.
Unfortunately Eq. 6 is only valid whilst the total separationbetween tool and blank remains large relative to the asperities onthe sheet. It is generally believed that when the total separationreduces to a height of around three times the roughness of thesheet, then the additional effects of leakage in the flow pathsaround asperities must be considered, Boyd 8. CorrespondinglyEq. 6 must be modified as in Eq. 7.
uF nhe
3
lb 3k s (7)
In Eq. 7, he is an effective clearance height value which takesinto account the additional flow paths available due to the surfacegeometry of the sheet. The value of h e will be affected, not onlyby the roughness of the sheet, but also by the waviness. Whilstmethods such as finite difference have been proposed for estimat-ing the theoretical effects of the surface geometry on the value of he , it has previously been shown by the author that the existenceof trapped lubricant pools provide additional complications to the
Fig. 5 New graph illustrating the effect of prior loading duration on the kinetic friction curve
Fig. 6 Graph illustrating the fit of the averaged drawing load growth curve through additionaldata
848 Õ Vol. 124, OCTOBER 2002 Transactions of the ASME
wnloaded From: http://www.asmedl.org/ on 08/07/2013 Terms of Use: http://asme.org/terms
7/27/2019 Influence of Lubrication Film Thickness
http://slidepdf.com/reader/full/influence-of-lubrication-film-thickness 4/6
analysis, Paul 9. Alternatively, the rate of closure, u, can beassessed simply and accurately using empirical tests to obtain
time versus separation data. In this report such an approach hasbeen adopted.
Simulation Equipment and Test Procedure
A friction testing machine which was originally developed byGilmour 10 provided a simulative test facility for empirical mea-surements, see Fig. 3. This apparatus has a range of constantdrawing velocities between 3.4 mm/s and 100 mm/s. Loads of upto 200 kN can be applied to the test specimen under the action of two hydraulic cylinders. Drawing load, blank holding force anddisplacement, can all be measured using transducers and the re-sults recorded using a data acquisition system for analysis using
computer software. Additionally, the prior loading duration pe-riod elapsed between application of the blankholder load and thecommencement of draw can also be recorded.
For the tests discussed, flat tools were manufactured using K. E.970 tool making steel. Tool surfaces were hardened to an averageof 61.1 ‘‘Rockwell C’’ using heat treatment. This permitted mul-tiple draw tests to be carried out with no significant wear or scor-ing occurring on the tool surface.
For all tests, 1.5 mm thick, cold rolled drawing grade mild steelsheet type CR4GP was used. Laser cut specimen strips, nominally50 mm wide 620 mm long were used for all tests carried out.Prior to testing all specimens were checked for imperfections suchas scores, gouges, or edge burrs before being cleaned with a sol-vent based cleaning agent and allowed to dry.
Prior to testing approximately 1.5–2 ml of the commerciallyavailable deep drawing lubricant ‘‘Cindolube,’’ was distributedevenly across each side of the strip. Strips were loaded in themachine with approximately 100 mm of material protruding be-yond the back edge of the tool. This prevented any decrease in the
nominal contact area during testing. During testing the ambienttemperature was maintained relatively constant at a nominal valueof 15.6°C / 0.6°C. The draw velocity was fixed at 5 mm/s andthe blank holding force maintained constant at 36.5 kN.
Experimental Friction Tests
For the set of tests in discussion, nine different prior loadingduration values were used. Two tests were carried out at eachprior loading duration and a new specimen was used each time.The prior loading duration values used were: 2, 5, 10, 15, 20,30, 50, 70, and 90 seconds. The blankholder pressure was 3.5MPa, typical of conditions in many deep drawing operations—itshould be noted that this pressure is sufficient only to cause localdeformation of contacting asperities under the blankholder.
The drawing loads measured during each test are shown collec-tively in the graph of Fig. 4. From these results it is apparent thatthe average drawing load becomes greater as the prior loadingduration is increased. Whilst the practice of plotting results asshown in Fig. 4 is common place, the method used to create thegraph in Fig. 5 is not. In Fig. 5 the x-axis parameter is totalloading duration, a parameter defined by the author as the ‘‘totaltime elapsed since the initial application of the blankholder load.’’
From the graph of Fig. 5, it is apparent that an ‘‘averageddrawing load growth curve’’ relating drawing load to total loadingduration can be extracted from the results. It is also apparent thatfor the parameter values used, the effects of the initial squeeze
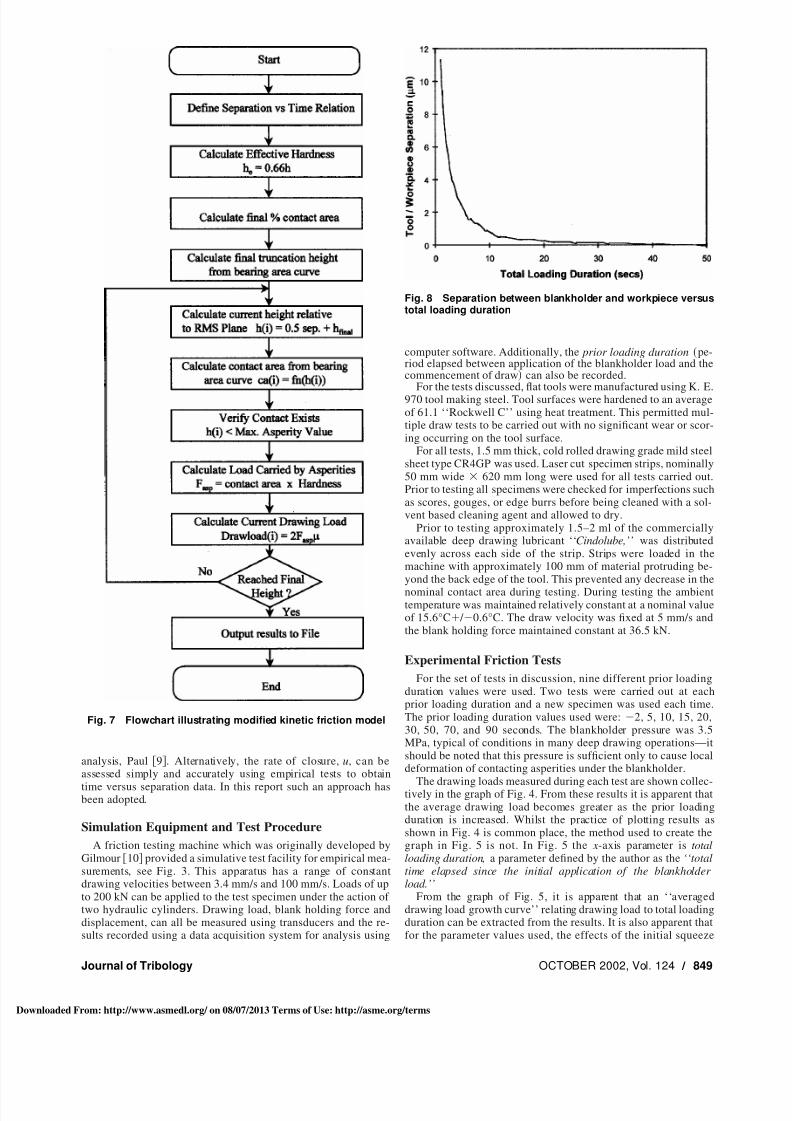
Fig. 7 Flowchart illustrating modified kinetic friction model
Fig. 8 Separation between blankholder and workpiece versustotal loading duration
Journal of Tribology OCTOBER 2002, Vol. 124 Õ 849
wnloaded From: http://www.asmedl.org/ on 08/07/2013 Terms of Use: http://asme.org/terms

7/27/2019 Influence of Lubrication Film Thickness
http://slidepdf.com/reader/full/influence-of-lubrication-film-thickness 5/6
film are almost eliminated after 35 s. Repeating the tests at 2, 5, 7,10, and 12 s, provides more information on the effect of the
squeeze film on the drawing load as shown in Fig. 6. Here again itis apparent that once the initial static friction effects have beenovercome at the commencement of draw, the drawing load returnsto the averaged drawing load growth curve for the rest of thedraw.
Simulation Model
It was earlier proposed that the drawing load could be predictedduring the action of squeeze film, provided that certain processparameters could be reliably calculated or estimated. The flow-chart in Fig. 7 represents a computer based model designed tocarry out such a task. This model neglects the initial effects of static friction and generates values of drawing load for a series of given values of total loading duration. For simplification it hasbeen assumed that the effects of drawing velocity are negligible,
viscous friction is zero and the tool surface is relatively flat,smooth and hard.
In Step 1 the relationship between separation and total loadingduration is defined by completion of a simple static test where thetotal clamps the workpiece but no drawing force is applied. Thiswas achieved by using additional high resolution displacementtransducers located on the tooling arrangement shown in Fig. 3.The change in separation of the top and bottom tool could bemeasured as the total loading duration elapsed. Using transducerswith resolution of 2 m/division, movements of 1 m or lesswere easily detectable. A typical result is shown in Fig. 8 wherethe separation is relative to the final steady state value.
In Step 2 an effective hardness for the asperities is calculatedbased upon earlier work, Boyd 10 and in Step 3, using the rela-tion of Eq. 4, a final contact area is estimated. Surface measure-
ments were carried out using a non-contact laser scanning deviceto allow the final truncation height to be calculated in Step 4.Using the scanning machine a random area of a sample specimenwhich was relatively free from defects was scanned. From theresultant data a bearing area curve was derived as shown in Fig. 9.Over the appropriate contact range this curve can be modeled bythe relation of Eq. 8, where h is the truncation height metresrelative to the surface RMS plane. By rearranging for h, this re-lation can be used in the program to determine the final truncationheight.
Ar
1
1.16eh3.2/0.745 (8)
In Step 5 the separation height is calculated for the current time
increment. The separation between one side of the sheet and one
tool face, can be estimated as half the measured separation, sincethe empirical separation test measured the distance between thetop and bottom tool. The current height relative to the RMS plane
can be calculated as the sum of the final height and the currentseparation.
In Step 6 the height calculated in Step 5 is used in Eq. 8 to
calculate the current contact area. After verifying that contactsactually exists, the load carried by the asperities is calculated inStep 8 using the relation of Eq. 4. In Step 9 the equivalentdrawing load is calculated using an empirically derived coefficientof friction for asperity interactions. For the modeled results a co-efficient of friction of 0.11 is used, based on the results of simu-lative tests where the squeeze film regime has transferred into aboundary lubrication condition.
Finally, the process is repeated for all time increments, result-
ing in a calculated relation between drawing load and total loading
Fig. 9 Graph illustrating partial bearing area curve of specimen surface
Fig. 10 Comparison of simulation model results with empiri-cal data
850 Õ Vol. 124, OCTOBER 2002 Transactions of the ASME
wnloaded From: http://www.asmedl.org/ on 08/07/2013 Terms of Use: http://asme.org/terms

7/27/2019 Influence of Lubrication Film Thickness
http://slidepdf.com/reader/full/influence-of-lubrication-film-thickness 6/6
duration. The graph in Fig. 10 illustrates the results obtained whenusing process parameter values suitable for modeling the empiri-cal tests in discussion.
Discussion
It has earlier been shown that a general curve can be drawnthrough the empirical results obtained. By reconsidering thegraphs in Fig. 5 and Fig. 6 it becomes apparent that the magnitudeof deviations between individual test results and the general curveare also affected by the loading duration. Deviation from the gen-eral curve tend to increase as the prior loading duration increases
until the effects of the initial squeeze film have expired. It is likelythat this is indirectly related to the effect of the forces generated inovercoming the initial static friction acting on the blank surface.Such forces cause the shearing of high asperities in a brief ‘‘wear-ing in’’ period, allowing the tool to descend further which subse-quently pressurizes the lubricant remaining within the tooling/ blank clearance space. This causes a temporary reduction in theload carried by the asperities while the new squeeze film decays.
Boyd 10 has already shown that the value of static frictionwill increase with prior loading duration while the initial squeezefilm decays and this is further supported by the results shown inFig. 5 and Fig. 6. By applying the analysis proposed to the resultsobtained, it becomes apparent that increases in static friction loadscause more damage and a subsequent greater reduction in theinitial drawing load.
An averaged drawing load growth curve drawn through theempirical results of Fig. 6 is again shown in Fig. 10 together withthe results of the simulation model. From the graph it is immedi-ately apparent that there is a marked similarity both in form andmagnitude between both sets of results. Inaccuracies in the modelare most likely to arise from the analysis of the surface interac-tions. In particular, the model assumes that the area scanned isentirely representative of the sheet surface and that the corre-sponding contact area for a given separation can be estimated bysimple truncation of the surface asperities. Ideally, it should bepossible to produce a representative result without the need forempirical time versus separation data. Unfortunately, the addi-tional effects of trapped lubricant pockets have prevented the suc-cessful use of the squeeze film equation in this role.
Conclusions
By plotting drawing loads against a new parameter known astotal known duration, the effects of the lubricant squeeze film
between the tool and blank can be clearly observed. By correlat-
ing the results in this way a clear trend emerges which allows a
general drawing load versus total loading duration curve to be
drawn. From these results it can be concluded that in deep draw-
ing operations, the drawing load will be highly dependent upon
the total loading duration if the initial squeeze film has not ex-
pired. Trends have also been identified in the degree of deviation
from the averaged drawing load growth curve at the commence-
ment of the draw and explanations have been proposed which
require further validation.
Comparison of the results from the model simulation with those
of empirical tests indicates a good degree of similarity, suggesting
that the drawing load is largely dependent upon the degree of
asperity contact. Finally, the use of surface information to esti-
mate the contact area for a measured separation is found to be
reasonably reliable.
References
1 Wilson, W. R. D., 1990, ‘‘Mised Lubrication in Metal Forming Processes,’’
Adv. Technol. Plast., 4, pp. 1667–1676.
2 Emmens, W. C., 1988, ‘‘The Influence of Surface Roughness on Friction,’’
Proc. 15th Biennial I.D.D.R.G. Congress, Detroit, Michigan, May 16–18, pp.
63–70.
3 Schipper, D. J., 1988, ‘‘Transitions in the Lubrication of Concentrated Con-tact,’’ Ph.D. thesis, University of Twente.
4 Hsu, T. C., 1994, ‘‘Refined Models for Hydrodynamic Lubrication in Axisym-
metric Stretch Forming,’’ ASME J. Tribol., 116, pp. 101–109.
5 Mahdavian, S. M., and Shao, Z. M., 1993, ‘‘Isoviscous Hydrodynamic Lubri-
cation of Deep Drawing and Its Comparison with Experiment,’’ ASME J.
Tribol., 115, pp. 111–118.
6 Emmens, W. C., and Monfort, G., 1990, ‘‘The Influence of Process Conditions
and Surface Characteristics on Friction at Low Pressure,’’ 3rd Int. Conf. On
Technology of Plasticity, July.
7 Abbott, E. J., and Firestone, F. A., 1933, ‘‘Specifying Surface Quality, A
Method Based on Accurate Measurement and Comparison,’’ Mech. Eng., 55,
pp. 569–573.
8 Boyd, M. R., 1996, ‘‘An Investigation of the Friction and Lubrication Effects
in the Deep Drawing Process Through Simulative and Empirical Testing,’’
D. Phil. thesis, University of Ulster.
9 Paul, S. J., 1996, ‘‘Kinetic Friction of Lubricated Contacts in the Deep Draw-
ing Process,’’ D.Phil. thesis, University of Ulster, p. 88.
10 Gilmour, K. R., 1989, ‘‘Simulative Testing as an Aid to the Industrial Devel-opment of Deep Drawn Complex Forms,’’ D.Phil. thesis, 1, University of
Ulster, pp. 98–145.
Journal of Tribology OCTOBER 2002, Vol. 124 Õ 851
Related Documents


