Citation: Shi, S.-C.; Wang, W.-C.; Ko, D.-K. Influence of Inclusions on Mechanical Properties in Flash Butt Welding Joint of High-Strength Low-Alloy Steel. Metals 2022, 12, 242. https://doi.org/10.3390/ met12020242 Academic Editors: Víctor H. Baltazar-Hernández, Antonio Riveiro and Aleksander Lisiecki Received: 25 November 2021 Accepted: 25 January 2022 Published: 27 January 2022 Publisher’s Note: MDPI stays neutral with regard to jurisdictional claims in published maps and institutional affil- iations. Copyright: © 2022 by the authors. Licensee MDPI, Basel, Switzerland. This article is an open access article distributed under the terms and conditions of the Creative Commons Attribution (CC BY) license (https:// creativecommons.org/licenses/by/ 4.0/). metals Article Influence of Inclusions on Mechanical Properties in Flash Butt Welding Joint of High-Strength Low-Alloy Steel Shih-Chen Shi * , Wei-Cheng Wang and Dun-Kai Ko Department of Mechanical Engineering, National Cheng Kung University (NCKU), Tainan 70101, Taiwan; [email protected] (W.-C.W.); [email protected] (D.-K.K.) * Correspondence: [email protected] Abstract: Flash butt welding is a high-efficiency welding technology that is widely used in industrial development. However, the inclusions and defects generated during the process are unacceptable. The presence of inclusions is one of the main factors affecting the quality of flash butt welding. Suitable flash butt welding parameters such as the preheating temperature and upset distance are essential to eliminate inclusions. In this study, because the number of inclusions on the end face is greatly affected by the flash welding time and upset distance, the impact of different upset distances on the number of inclusions was studied by fixing the flash welding time. Further observations were conducted using a scanning electron microscope. Image analysis software was used on the obtained photos to quantitatively analyze the inclusions on the welding surface. A statistical analysis of the experimental data showed that the upset distance was related to the number of inclusions, and the total number of inclusions on the welding surface had a negative impact on the strength of the product. Keywords: flash butt welding; upset distance; impurity; strength; HSLA 1. Introduction Flash butt welding (FBW) is a type of resistance welding. In the initial preheating and flashing stages, energy is obtained through the contact resistance of the two surfaces by the application of a voltage, which softens the end face areas. After softening to a certain extent, the upset stage starts, in which the materials are plastically deformed and connected together by applying an axial force. Thus, welding can be completed without the use of filler metal, maintaining the strength of the original base material [1–3]. FBW is a single pass welding process with a simple flat face weld joint. It is unlike the approach used for most arc welding joints. Comparatively, FBW is an extremely efficient welding technique. The ability to weld various materials using this type of welding also provides a significant advantage. In principle, many ferrous alloys can be FBW, including low-carbon steel, medium-carbon steel, and high-strength low-alloy steel (HSLA) [4–6]. Therefore, it is widely used in various industries, playing a pivotal role in industrial development. In previous studies, failure analyses of FBW [7–11] in low-carbon steel have shown that failures are most often the result of excessive heat input. This causes the production of Widmanstatten ferrite at the welding joint, which affects the plasticity of the joint, resulting in low toughness [12–16], as well as the decarburization and softening of the heat-affected zones. In addition, the remaining inclusions in the joint [17,18] become stress concentration points, allowing cracks to be easily produced and grow around them. Therefore, the presence of inclusions significantly affects the mechanical strength. With the improvements in various industries, maintaining a stable flash welding quality has become increasingly important. With this emphasis on the welding quality, it is very important to correctly adjust the welding parameters to obtain accurate and reliable welding methods [1,2,19–22]. Metals 2022, 12, 242. https://doi.org/10.3390/met12020242 https://www.mdpi.com/journal/metals

Welcome message from author
This document is posted to help you gain knowledge. Please leave a comment to let me know what you think about it! Share it to your friends and learn new things together.
Transcript

�����������������
Citation: Shi, S.-C.; Wang, W.-C.; Ko,
D.-K. Influence of Inclusions on
Mechanical Properties in Flash Butt
Welding Joint of High-Strength
Low-Alloy Steel. Metals 2022, 12, 242.
https://doi.org/10.3390/
met12020242
Academic Editors: Víctor H.
Baltazar-Hernández, Antonio Riveiro
and Aleksander Lisiecki
Received: 25 November 2021
Accepted: 25 January 2022
Published: 27 January 2022
Publisher’s Note: MDPI stays neutral
with regard to jurisdictional claims in
published maps and institutional affil-
iations.
Copyright: © 2022 by the authors.
Licensee MDPI, Basel, Switzerland.
This article is an open access article
distributed under the terms and
conditions of the Creative Commons
Attribution (CC BY) license (https://
creativecommons.org/licenses/by/
4.0/).
metals
Article
Influence of Inclusions on Mechanical Properties in Flash ButtWelding Joint of High-Strength Low-Alloy SteelShih-Chen Shi * , Wei-Cheng Wang and Dun-Kai Ko
Department of Mechanical Engineering, National Cheng Kung University (NCKU), Tainan 70101, Taiwan;[email protected] (W.-C.W.); [email protected] (D.-K.K.)* Correspondence: [email protected]
Abstract: Flash butt welding is a high-efficiency welding technology that is widely used in industrialdevelopment. However, the inclusions and defects generated during the process are unacceptable.The presence of inclusions is one of the main factors affecting the quality of flash butt welding.Suitable flash butt welding parameters such as the preheating temperature and upset distance areessential to eliminate inclusions. In this study, because the number of inclusions on the end face isgreatly affected by the flash welding time and upset distance, the impact of different upset distanceson the number of inclusions was studied by fixing the flash welding time. Further observationswere conducted using a scanning electron microscope. Image analysis software was used on theobtained photos to quantitatively analyze the inclusions on the welding surface. A statistical analysisof the experimental data showed that the upset distance was related to the number of inclusions,and the total number of inclusions on the welding surface had a negative impact on the strength ofthe product.
Keywords: flash butt welding; upset distance; impurity; strength; HSLA
1. Introduction
Flash butt welding (FBW) is a type of resistance welding. In the initial preheating andflashing stages, energy is obtained through the contact resistance of the two surfaces bythe application of a voltage, which softens the end face areas. After softening to a certainextent, the upset stage starts, in which the materials are plastically deformed and connectedtogether by applying an axial force. Thus, welding can be completed without the use offiller metal, maintaining the strength of the original base material [1–3].
FBW is a single pass welding process with a simple flat face weld joint. It is unlikethe approach used for most arc welding joints. Comparatively, FBW is an extremelyefficient welding technique. The ability to weld various materials using this type ofwelding also provides a significant advantage. In principle, many ferrous alloys can beFBW, including low-carbon steel, medium-carbon steel, and high-strength low-alloy steel(HSLA) [4–6]. Therefore, it is widely used in various industries, playing a pivotal role inindustrial development.
In previous studies, failure analyses of FBW [7–11] in low-carbon steel have shownthat failures are most often the result of excessive heat input. This causes the production ofWidmanstatten ferrite at the welding joint, which affects the plasticity of the joint, resultingin low toughness [12–16], as well as the decarburization and softening of the heat-affectedzones. In addition, the remaining inclusions in the joint [17,18] become stress concentrationpoints, allowing cracks to be easily produced and grow around them. Therefore, thepresence of inclusions significantly affects the mechanical strength. With the improvementsin various industries, maintaining a stable flash welding quality has become increasinglyimportant. With this emphasis on the welding quality, it is very important to correctlyadjust the welding parameters to obtain accurate and reliable welding methods [1,2,19–22].
Metals 2022, 12, 242. https://doi.org/10.3390/met12020242 https://www.mdpi.com/journal/metals

Metals 2022, 12, 242 2 of 13
Therefore, determining a method to reduce the size and number of inclusions and effectivelyeliminate them has become a significant focus of this processing technique.
2. Materials and Methods2.1. Materials
The material used in this study was HSLA (carbon content 0.25%, Cr and Ni contentswere both 0.7%) with the function of a safety buckle for weightlifting. The buckle wasmade of a metal rod that was bent into an oval shape as shown in Figure 1a. The twoends were connected by flash butt welding. The diameter of the HSLA workpiece was19 mm. The FBW machine used in the experiment was an SU 50 FBW, which could obtainthe flash welding data using monitoring software during the flash welding process. Theflash welding parameters are listed in Table 1.
Metals 2022, 12, x FOR PEER REVIEW 2 of 13
[1,2,19–22]. Therefore, determining a method to reduce the size and number of inclusions and effectively eliminate them has become a significant focus of this processing technique.
2. Materials and Methods 2.1. Materials
The material used in this study was HSLA (carbon content 0.25%, Cr and Ni contents were both 0.7%) with the function of a safety buckle for weightlifting. The buckle was made of a metal rod that was bent into an oval shape as shown in Figure 1a. The two ends were connected by flash butt welding. The diameter of the HSLA workpiece was 19 mm. The FBW machine used in the experiment was an SU 50 FBW, which could obtain the flash welding data using monitoring software during the flash welding process. The flash weld-ing parameters are listed in Table 1.
Figure 1. (a) The geometry of the sample before flash welding; (b) Schematic of sample welding joint processing before tensile test.
Table 1. Parameters of FBW machine.
Welding Machine
Upset Pressure (bar)
Flash Allowance (mm)
Upset Distance (mm)
Flashing Time (s)
Upset Speed (mm/s)
SU50 50 8 2.5, 5, 7.5, 10 10 110
2.2. Flash Butt Welding According to the processing behavior of the welding machine (SU50), the process of
flash welding can be divided into three stages, namely, preheating, flashing, and upset, as shown in Figure 2. In the preheating stage, the flash welding machine undergoes the fix-ture’s reciprocating movement to make contact and separation between the two ends. While through the low voltage, the high current forms a circuit of the junction end, the current through the contact resistance between the ends transforms into thermal energy. The end surface temperature is uniformly increased to make the subsequent flash stage more stable. In the flash stage, the moving end fixture clamps the workpiece forward to continue to contact the two end surfaces. When the current passes, the current contact density is exceptionally high, instantly heated to the molten condition. The molten metal produces a burst splash of sparks outward. During the top forging stage, electrical power is stopped, and sufficient upset pressure is applied on both sides of the workpiece so that the gap between the welding surfaces is rapidly reduced. The primary function of the upset is to extrude the softened metal and inclusions out of the welding surface to obtain a welding joint with better strength than the base metal.
Figure 1. (a) The geometry of the sample before flash welding; (b) Schematic of sample welding jointprocessing before tensile test.
Table 1. Parameters of FBW machine.
WeldingMachine
UpsetPressure
(bar)
FlashAllowance
(mm)
UpsetDistance
(mm)
FlashingTime (s)
Upset Speed(mm/s)
SU50 50 8 2.5, 5, 7.5, 10 10 110
2.2. Flash Butt Welding
According to the processing behavior of the welding machine (SU50), the process offlash welding can be divided into three stages, namely, preheating, flashing, and upset,as shown in Figure 2. In the preheating stage, the flash welding machine undergoes thefixture’s reciprocating movement to make contact and separation between the two ends.While through the low voltage, the high current forms a circuit of the junction end, thecurrent through the contact resistance between the ends transforms into thermal energy.The end surface temperature is uniformly increased to make the subsequent flash stagemore stable. In the flash stage, the moving end fixture clamps the workpiece forward tocontinue to contact the two end surfaces. When the current passes, the current contactdensity is exceptionally high, instantly heated to the molten condition. The molten metalproduces a burst splash of sparks outward. During the top forging stage, electrical power isstopped, and sufficient upset pressure is applied on both sides of the workpiece so that thegap between the welding surfaces is rapidly reduced. The primary function of the upset isto extrude the softened metal and inclusions out of the welding surface to obtain a weldingjoint with better strength than the base metal.
Metals 2022, 12, 242 3 of 13Metals 2022, 12, x FOR PEER REVIEW 3 of 13
Figure 2. Schematic diagram of the three stages of flash welding during the actual welding process.
To understand the relationship between the upset distance and the number of inclu-sions and its influence on the mechanical properties, four different upset distances were used in this experiment: 2.5, 5.0, 7.5, and 10.0 mm. The other parameters were fixed. For each parameter, six samples were produced. The purpose of the experiment was to un-derstand the relationship between the number of inclusions measured in the broken-out section and the mechanical properties under different upset distances. None of the sam-ples in this study underwent post-weld heat treatment.
The sample used in this study is shown in Figure 1a. Breaking testing is used after welding and evaluating its breaking force to meet the requirements of the product (340 kN). The breaking test is performed by the left and right sides of the ellipse and stretching in the X-axis direction after holding the sample. Breaking force and destruction location were recorded.
During the tensile test, a sample failure could occur outside the welding joint, making it impossible to calculate the inclusions for the broken-out section of the welding joint. Therefore, each experimental sample was divided into two parts. Three samples for each parameter were subjected to a tensile test for the first part. If there was a sample with damage in the welding joint, the number of inclusions could be directly analyzed. Then, the welding joints of the remaining three samples were processed before stretching for the second part. Figure 1b shows that a defect was deliberately created at the weld center. Thus, the failure would occur at this point when the sample was stretched. Therefore, the number of inclusions in the sample could be analyzed as the first part when the failure occurred inside the welding joint.
2.3. Characterization The surface morphology and elemental analyses of the welding joint were performed
using SEM (AURIGA, Carl Zeiss AG, Jena, Germany) and energy dispersive X-ray spec-trometry (EDS, AURIGA, Carl Zeiss AG, Jena, Germany), respectively. To analyze the number of inclusions in the sample welding joints, the samples with failures at the weld-ing joint were collected, and EDS was used to analyze and confirm the composition of the inclusions obtained. Then, the EDS mapping function was used to observe their distribu-tion positions. Next, as shown in Figure 3, 50 random images were taken of the broken-out section along the X-axis and Y-axis using the SEM. Finally, the image analysis software Image J was used to calculate the numbers of inclusions under the different parameters.
Figure 2. Schematic diagram of the three stages of flash welding during the actual welding process.
To understand the relationship between the upset distance and the number of inclu-sions and its influence on the mechanical properties, four different upset distances wereused in this experiment: 2.5, 5.0, 7.5, and 10.0 mm. The other parameters were fixed.For each parameter, six samples were produced. The purpose of the experiment was tounderstand the relationship between the number of inclusions measured in the broken-outsection and the mechanical properties under different upset distances. None of the samplesin this study underwent post-weld heat treatment.
The sample used in this study is shown in Figure 1a. Breaking testing is used afterwelding and evaluating its breaking force to meet the requirements of the product (340 kN).The breaking test is performed by the left and right sides of the ellipse and stretchingin the X-axis direction after holding the sample. Breaking force and destruction locationwere recorded.
During the tensile test, a sample failure could occur outside the welding joint, makingit impossible to calculate the inclusions for the broken-out section of the welding joint.Therefore, each experimental sample was divided into two parts. Three samples for eachparameter were subjected to a tensile test for the first part. If there was a sample withdamage in the welding joint, the number of inclusions could be directly analyzed. Then,the welding joints of the remaining three samples were processed before stretching forthe second part. Figure 1b shows that a defect was deliberately created at the weld center.Thus, the failure would occur at this point when the sample was stretched. Therefore, thenumber of inclusions in the sample could be analyzed as the first part when the failureoccurred inside the welding joint.
2.3. Characterization
The surface morphology and elemental analyses of the welding joint were performedusing SEM (AURIGA, Carl Zeiss AG, Jena, Germany) and energy dispersive X-ray spec-trometry (EDS, AURIGA, Carl Zeiss AG, Jena, Germany), respectively. To analyze thenumber of inclusions in the sample welding joints, the samples with failures at the weldingjoint were collected, and EDS was used to analyze and confirm the composition of the in-clusions obtained. Then, the EDS mapping function was used to observe their distributionpositions. Next, as shown in Figure 3, 50 random images were taken of the broken-outsection along the X-axis and Y-axis using the SEM. Finally, the image analysis softwareImage J was used to calculate the numbers of inclusions under the different parameters.
Metals 2022, 12, 242 4 of 13Metals 2022, 12, x FOR PEER REVIEW 4 of 13
Figure 3. SEM imaging directions for impurity analysis.
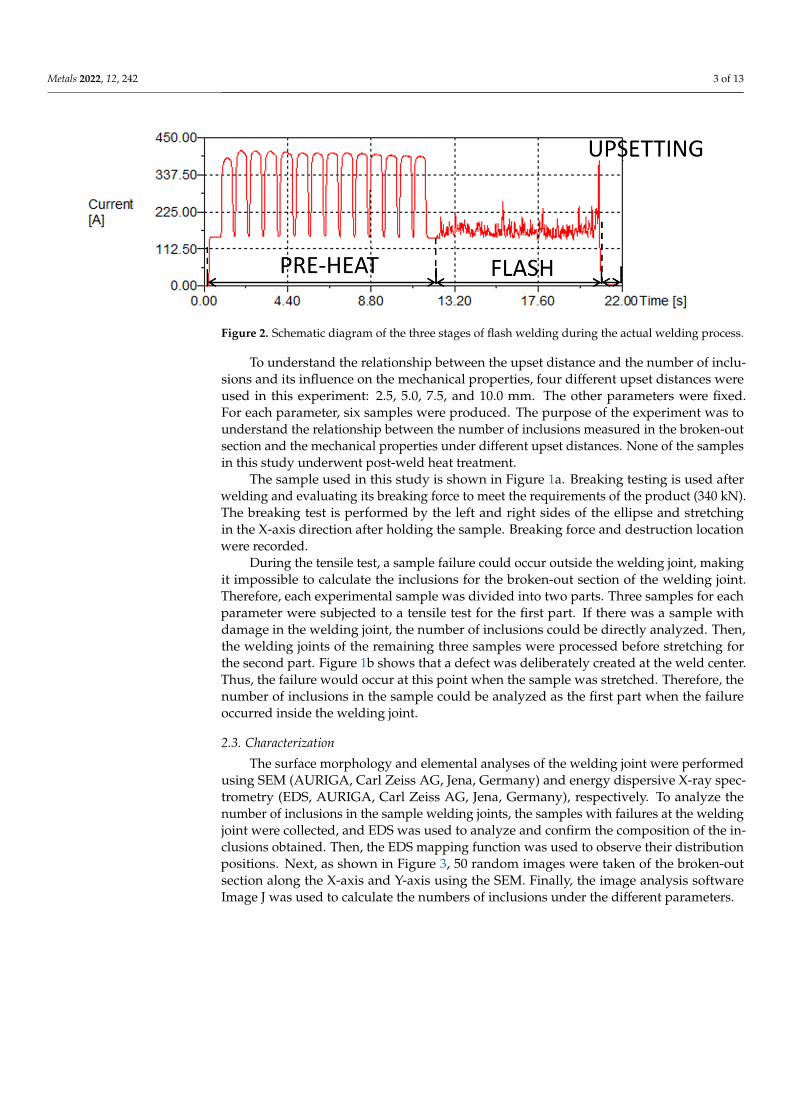
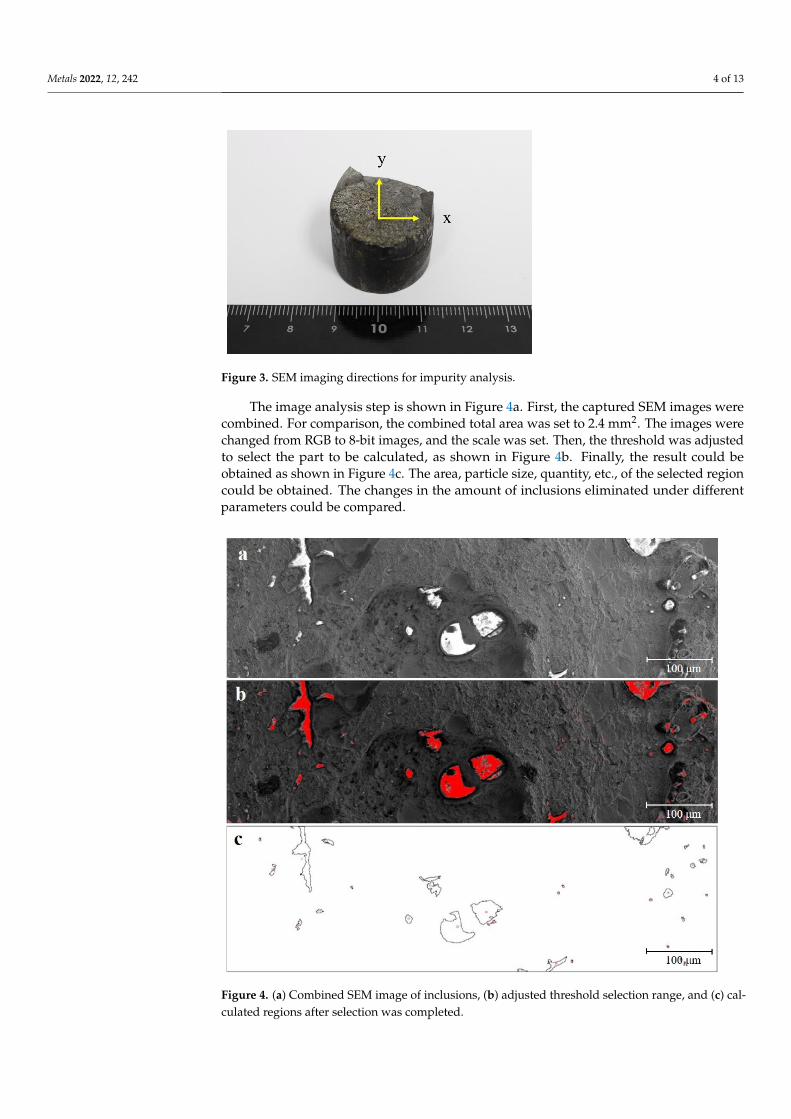
The image analysis step is shown in Figure 4a. First, the captured SEM images were combined. For comparison, the combined total area was set to 2.4 mm2. The images were changed from RGB to 8-bit images, and the scale was set. Then, the threshold was adjusted to select the part to be calculated, as shown in Figure 4b. Finally, the result could be ob-tained as shown in Figure 4c. The area, particle size, quantity, etc., of the selected region could be obtained. The changes in the amount of inclusions eliminated under different parameters could be compared.
Figure 4. (a) Combined SEM image of inclusions, (b) adjusted threshold selection range, and (c) calculated regions after selection was completed.
3. Results and Discussion 3.1. Flash Butt Welding
Figure 5 shows that the sample with an upset distance of 2.5 mm could not be effec-tively joined after the welding. Therefore, there were no data from its tensile test. The test
Figure 3. SEM imaging directions for impurity analysis.
The image analysis step is shown in Figure 4a. First, the captured SEM images werecombined. For comparison, the combined total area was set to 2.4 mm2. The images werechanged from RGB to 8-bit images, and the scale was set. Then, the threshold was adjustedto select the part to be calculated, as shown in Figure 4b. Finally, the result could beobtained as shown in Figure 4c. The area, particle size, quantity, etc., of the selected regioncould be obtained. The changes in the amount of inclusions eliminated under differentparameters could be compared.
Metals 2022, 12, x FOR PEER REVIEW 4 of 13
Figure 3. SEM imaging directions for impurity analysis.
The image analysis step is shown in Figure 4a. First, the captured SEM images were combined. For comparison, the combined total area was set to 2.4 mm2. The images were changed from RGB to 8-bit images, and the scale was set. Then, the threshold was adjusted to select the part to be calculated, as shown in Figure 4b. Finally, the result could be ob-tained as shown in Figure 4c. The area, particle size, quantity, etc., of the selected region could be obtained. The changes in the amount of inclusions eliminated under different parameters could be compared.
Figure 4. (a) Combined SEM image of inclusions, (b) adjusted threshold selection range, and (c) calculated regions after selection was completed.
3. Results and Discussion 3.1. Flash Butt Welding
Figure 5 shows that the sample with an upset distance of 2.5 mm could not be effec-tively joined after the welding. Therefore, there were no data from its tensile test. The test
Figure 4. (a) Combined SEM image of inclusions, (b) adjusted threshold selection range, and (c) cal-culated regions after selection was completed.

Metals 2022, 12, 242 5 of 13
3. Results and Discussion3.1. Flash Butt Welding
Figure 5 shows that the sample with an upset distance of 2.5 mm could not be effec-tively joined after the welding. Therefore, there were no data from its tensile test. The testsamples with upset distances of 5.0 and 7.5 mm had similar test results. Two of the 10.0 mmsamples failed at the welding joint, and the breaking force was obviously insufficient.
Metals 2022, 12, x FOR PEER REVIEW 5 of 13
samples with upset distances of 5.0 and 7.5 mm had similar test results. Two of the 10.0 mm samples failed at the welding joint, and the breaking force was obviously insufficient.
The reason for the welding failure with the 2.5 mm upset distance was that the upset distance was too short, which prevented the two ends from being effectively joined after the upset was completed [23]; however, when the upset distance was 10.0 mm, the ratio of the preheating energy and flash welding time was abnormal [24]. This was because the total production stroke was only 13 mm. After deducting the upset distance, only 3 mm was left for the preheating and flash welding, resulting in an obvious shortage of preheat-ing energy. Continuously provided energy is needed to move the material smoothly dur-ing flash welding. Thus, an increase in the flash welding time caused abnormal propor-tions. It can also be observed from the electric current during different stages of flash welding as shown in Figure 6. The original preheating waveform disappeared as a result of the short stroke, whereas the continuous energy supply of the flash welding produced a large square wave. As shown in Figure 6a, the temperature was insufficient when pre-heated, even though there was continuous heating in the flash stage. The interface tem-perature of the workpiece was still not enough at the upset stage for welding two ends together. As a result, a weld failure in Figure 5 was observed. Because upset uses an in-stantaneous pressure to join the two end faces, the entire production time will be shorter when the upset distance is too long. It can be seen that the production time for the 10.0 mm upset distance was only approximately 6 s. The material could not be heated effec-tively, resulting in inclusions that could not be successfully squeezed out but remained in the welding joint, causing the weld to fail. Table 2 sorts out the ratio of preheating en-ergy/total energy and flash welding time/total time from Figure 6 with the relative break-ing force and failure position under various upset distances. These two indices (preheat-ing energy/total energy and flash welding time/total time) were used to identify the pro-cess window by checking the breaking force (>340 kN) and failure location (outside weld-ing joint).
Figure 5. Welding failure of sample with upset distance of 2.5 mm. Figure 5. Welding failure of sample with upset distance of 2.5 mm.
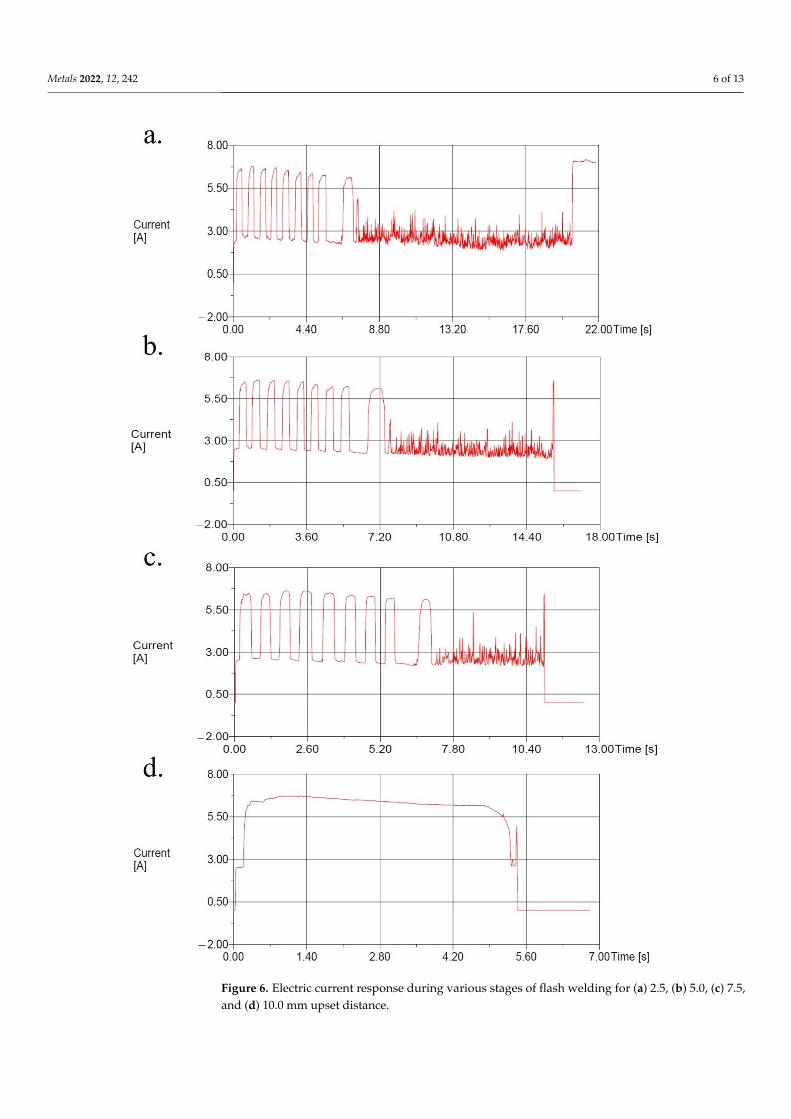
The reason for the welding failure with the 2.5 mm upset distance was that the upsetdistance was too short, which prevented the two ends from being effectively joined after theupset was completed [23]; however, when the upset distance was 10.0 mm, the ratio of thepreheating energy and flash welding time was abnormal [24]. This was because the totalproduction stroke was only 13 mm. After deducting the upset distance, only 3 mm wasleft for the preheating and flash welding, resulting in an obvious shortage of preheatingenergy. Continuously provided energy is needed to move the material smoothly duringflash welding. Thus, an increase in the flash welding time caused abnormal proportions.It can also be observed from the electric current during different stages of flash weldingas shown in Figure 6. The original preheating waveform disappeared as a result of theshort stroke, whereas the continuous energy supply of the flash welding produced a largesquare wave. As shown in Figure 6a, the temperature was insufficient when preheated,even though there was continuous heating in the flash stage. The interface temperatureof the workpiece was still not enough at the upset stage for welding two ends together.As a result, a weld failure in Figure 5 was observed. Because upset uses an instantaneouspressure to join the two end faces, the entire production time will be shorter when theupset distance is too long. It can be seen that the production time for the 10.0 mm upsetdistance was only approximately 6 s. The material could not be heated effectively, resultingin inclusions that could not be successfully squeezed out but remained in the welding joint,causing the weld to fail. Table 2 sorts out the ratio of preheating energy/total energy andflash welding time/total time from Figure 6 with the relative breaking force and failureposition under various upset distances. These two indices (preheating energy/total energyand flash welding time/total time) were used to identify the process window by checkingthe breaking force (>340 kN) and failure location (outside welding joint).
Metals 2022, 12, 242 6 of 13
Metals 2022, 12, x FOR PEER REVIEW 6 of 13
Figure 6. Electric current response during various stages of flash welding for (a) 2.5, (b) 5.0, (c) 7.5, and (d) 10.0 mm upset distance.
Figure 6. Electric current response during various stages of flash welding for (a) 2.5, (b) 5.0, (c) 7.5,and (d) 10.0 mm upset distance.
Metals 2022, 12, 242 7 of 13
Table 2. Energy and time ratio analysis with breaking force and destruction location of variousupset distances.
Upset Distance(mm) 2.5 5 7.5 10
Preheatingenergy/total
energy42% 41% 40% 63% 62% 59% 75% 74% 73% 27% 27% 29%
Flash weldingtime/total time 68% 69% 67% 55% 55% 58% 42% 44% 44% 72% 75% 76%
Breaking force(kN) - - - 456.3 458.8 455.4 453.5 459.1 451.5 235.3 455.6 141.4
Destructionlocation - - -
Outsidewelding
joint
Outsidewelding
joint
Outsidewelding
joint
Outsidewelding
joint
Outsidewelding
joint
Outsidewelding
jointWeldcenter
Outsidewelding
jointWeldcenter
3.2. Characterization
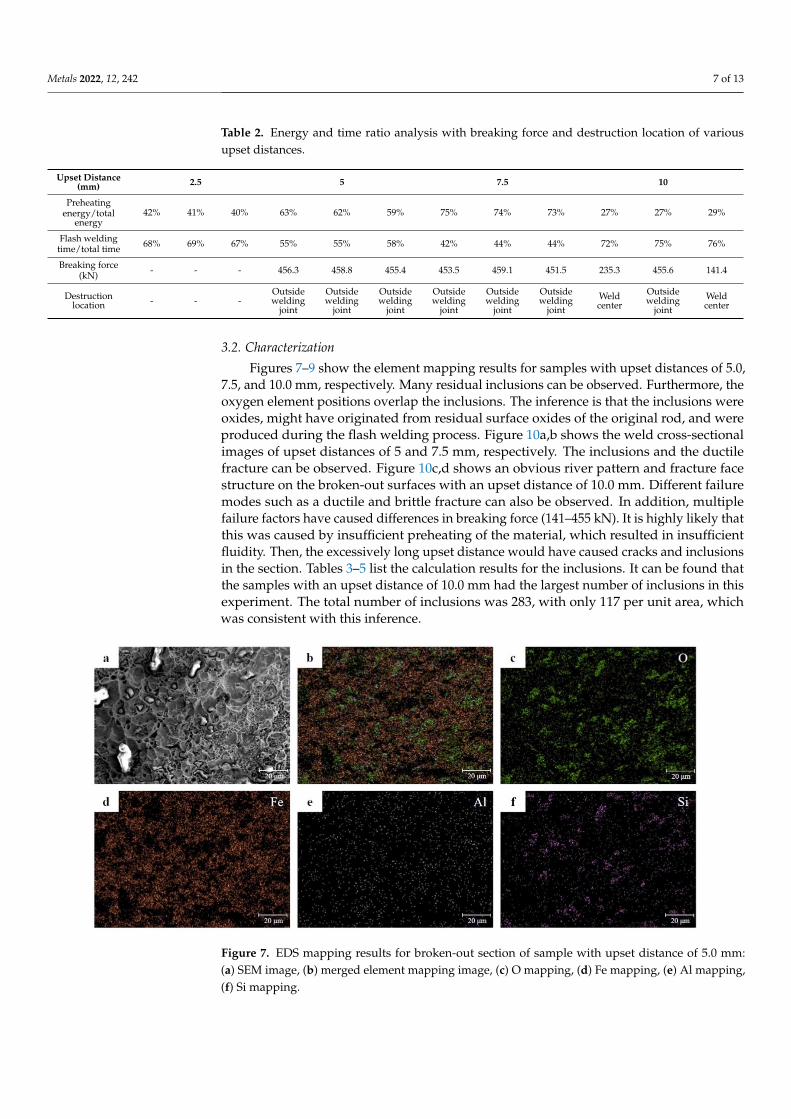
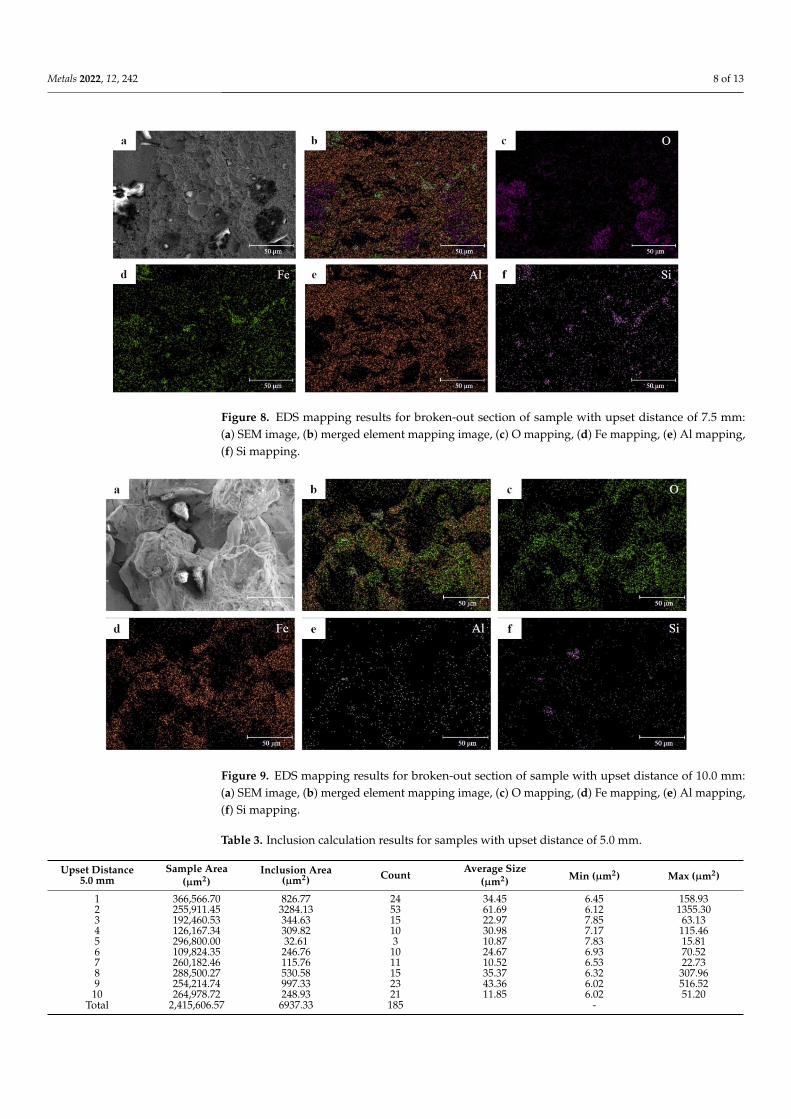
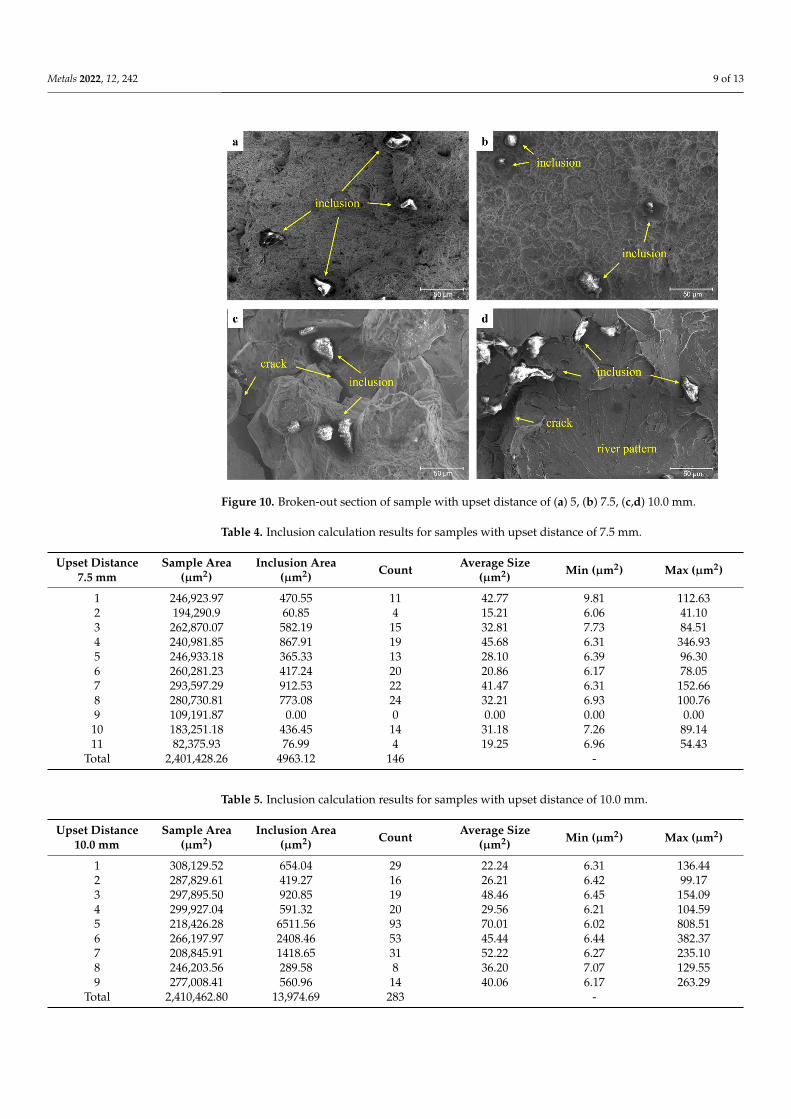
Figures 7–9 show the element mapping results for samples with upset distances of 5.0,7.5, and 10.0 mm, respectively. Many residual inclusions can be observed. Furthermore, theoxygen element positions overlap the inclusions. The inference is that the inclusions wereoxides, might have originated from residual surface oxides of the original rod, and wereproduced during the flash welding process. Figure 10a,b shows the weld cross-sectionalimages of upset distances of 5 and 7.5 mm, respectively. The inclusions and the ductilefracture can be observed. Figure 10c,d shows an obvious river pattern and fracture facestructure on the broken-out surfaces with an upset distance of 10.0 mm. Different failuremodes such as a ductile and brittle fracture can also be observed. In addition, multiplefailure factors have caused differences in breaking force (141–455 kN). It is highly likely thatthis was caused by insufficient preheating of the material, which resulted in insufficientfluidity. Then, the excessively long upset distance would have caused cracks and inclusionsin the section. Tables 3–5 list the calculation results for the inclusions. It can be found thatthe samples with an upset distance of 10.0 mm had the largest number of inclusions in thisexperiment. The total number of inclusions was 283, with only 117 per unit area, whichwas consistent with this inference.
Metals 2022, 12, x FOR PEER REVIEW 7 of 13
Table 2. Energy and time ratio analysis with breaking force and destruction location of various up-set distances.
Upset Distance (mm) 2.5 5 7.5 10 Preheating energy/total energy 42% 41% 40% 63% 62% 59% 75% 74% 73% 27% 27% 29% Flash welding time/total time 68% 69% 67% 55% 55% 58% 42% 44% 44% 72% 75% 76%
Breaking force (kN) - - - 456.3 458.8 455.4 453.5 459.1 451.5 235.3 455.6 141.4
Destruction location - - - Outside welding
joint
Outside welding
joint
Outside welding
joint
Outside welding
joint
Outside welding
joint
Outside welding
joint
Weld center
Outside welding
joint
Weld center
3.2. Characterization Figures 7–9 show the element mapping results for samples with upset distances of
5.0, 7.5, and 10.0 mm, respectively. Many residual inclusions can be observed. Further-more, the oxygen element positions overlap the inclusions. The inference is that the inclu-sions were oxides, might have originated from residual surface oxides of the original rod, and were produced during the flash welding process. Figure 10a,b shows the weld cross-sectional images of upset distances of 5 and 7.5 mm, respectively. The inclusions and the ductile fracture can be observed. Figure 10c,d shows an obvious river pattern and fracture face structure on the broken-out surfaces with an upset distance of 10.0 mm. Different failure modes such as a ductile and brittle fracture can also be observed. In addition, mul-tiple failure factors have caused differences in breaking force (141–455 kN). It is highly likely that this was caused by insufficient preheating of the material, which resulted in insufficient fluidity. Then, the excessively long upset distance would have caused cracks and inclusions in the section. Tables 3–5 list the calculation results for the inclusions. It can be found that the samples with an upset distance of 10.0 mm had the largest number of inclusions in this experiment. The total number of inclusions was 283, with only 117 per unit area, which was consistent with this inference.
Figure 7. EDS mapping results for broken-out section of sample with upset distance of 5.0 mm: (a) SEM image, (b) merged element mapping image, (c) O mapping, (d) Fe mapping, (e) Al mapping, (f) Si mapping.
Figure 7. EDS mapping results for broken-out section of sample with upset distance of 5.0 mm:(a) SEM image, (b) merged element mapping image, (c) O mapping, (d) Fe mapping, (e) Al mapping,(f) Si mapping.
Metals 2022, 12, 242 8 of 13Metals 2022, 12, x FOR PEER REVIEW 8 of 13
Figure 8. EDS mapping results for broken-out section of sample with upset distance of 7.5 mm: (a) SEM image, (b) merged element mapping image, (c) O mapping, (d) Fe mapping, (e) Al mapping, (f) Si mapping.
Figure 9. EDS mapping results for broken-out section of sample with upset distance of 10.0 mm: (a) SEM image, (b) merged element mapping image, (c) O mapping, (d) Fe mapping, (e) Al mapping, (f) Si mapping.
Figure 8. EDS mapping results for broken-out section of sample with upset distance of 7.5 mm:(a) SEM image, (b) merged element mapping image, (c) O mapping, (d) Fe mapping, (e) Al mapping,(f) Si mapping.
Metals 2022, 12, x FOR PEER REVIEW 8 of 13
Figure 8. EDS mapping results for broken-out section of sample with upset distance of 7.5 mm: (a) SEM image, (b) merged element mapping image, (c) O mapping, (d) Fe mapping, (e) Al mapping, (f) Si mapping.
Figure 9. EDS mapping results for broken-out section of sample with upset distance of 10.0 mm: (a) SEM image, (b) merged element mapping image, (c) O mapping, (d) Fe mapping, (e) Al mapping, (f) Si mapping.
Figure 9. EDS mapping results for broken-out section of sample with upset distance of 10.0 mm:(a) SEM image, (b) merged element mapping image, (c) O mapping, (d) Fe mapping, (e) Al mapping,(f) Si mapping.
Table 3. Inclusion calculation results for samples with upset distance of 5.0 mm.
Upset Distance5.0 mm
Sample Area(µm2)
Inclusion Area(µm2) Count
Average Size(µm2) Min (µm2) Max (µm2)
1 366,566.70 826.77 24 34.45 6.45 158.932 255,911.45 3284.13 53 61.69 6.12 1355.303 192,460.53 344.63 15 22.97 7.85 63.134 126,167.34 309.82 10 30.98 7.17 115.465 296,800.00 32.61 3 10.87 7.83 15.816 109,824.35 246.76 10 24.67 6.93 70.527 260,182.46 115.76 11 10.52 6.53 22.738 288,500.27 530.58 15 35.37 6.32 307.969 254,214.74 997.33 23 43.36 6.02 516.52
10 264,978.72 248.93 21 11.85 6.02 51.20Total 2,415,606.57 6937.33 185 -
Metals 2022, 12, 242 9 of 13Metals 2022, 12, x FOR PEER REVIEW 9 of 13
Figure 10. Broken-out section of sample with upset distance of (a) 5, (b) 7.5, (c,d) 10.0 mm.
Table 3. Inclusion calculation results for samples with upset distance of 5.0 mm.
Upset Distance 5.0 mm Sample Area (μm2) Inclusion Area (μm2) Count Average Size (μm2) Min (μm2) Max (μm2) 1 366,566.70 826.77 24 34.45 6.45 158.93 2 255,911.45 3284.13 53 61.69 6.12 1355.30 3 192,460.53 344.63 15 22.97 7.85 63.13 4 126,167.34 309.82 10 30.98 7.17 115.46 5 296,800.00 32.61 3 10.87 7.83 15.81 6 109,824.35 246.76 10 24.67 6.93 70.52 7 260,182.46 115.76 11 10.52 6.53 22.73 8 288,500.27 530.58 15 35.37 6.32 307.96 9 254,214.74 997.33 23 43.36 6.02 516.52 10 264,978.72 248.93 21 11.85 6.02 51.20
Total 2,415,606.57 6937.33 185 -
Table 4. Inclusion calculation results for samples with upset distance of 7.5 mm.
Upset Distance 7.5 mm Sample Area (μm2) Inclusion Area (μm2) Count Average Size (μm2) Min (μm2) Max (μm2) 1 246,923.97 470.55 11 42.77 9.81 112.63 2 194,290.9 60.85 4 15.21 6.06 41.10 3 262,870.07 582.19 15 32.81 7.73 84.51 4 240,981.85 867.91 19 45.68 6.31 346.93 5 246,933.18 365.33 13 28.10 6.39 96.30 6 260,281.23 417.24 20 20.86 6.17 78.05 7 293,597.29 912.53 22 41.47 6.31 152.66 8 280,730.81 773.08 24 32.21 6.93 100.76 9 109,191.87 0.00 0 0.00 0.00 0.00
10 183,251.18 436.45 14 31.18 7.26 89.14 11 82,375.93 76.99 4 19.25 6.96 54.43
Total 2,401,428.26 4963.12 146 -
Figure 10. Broken-out section of sample with upset distance of (a) 5, (b) 7.5, (c,d) 10.0 mm.
Table 4. Inclusion calculation results for samples with upset distance of 7.5 mm.
Upset Distance7.5 mm
Sample Area(µm2)
Inclusion Area(µm2) Count Average Size
(µm2) Min (µm2) Max (µm2)
1 246,923.97 470.55 11 42.77 9.81 112.632 194,290.9 60.85 4 15.21 6.06 41.103 262,870.07 582.19 15 32.81 7.73 84.514 240,981.85 867.91 19 45.68 6.31 346.935 246,933.18 365.33 13 28.10 6.39 96.306 260,281.23 417.24 20 20.86 6.17 78.057 293,597.29 912.53 22 41.47 6.31 152.668 280,730.81 773.08 24 32.21 6.93 100.769 109,191.87 0.00 0 0.00 0.00 0.00
10 183,251.18 436.45 14 31.18 7.26 89.1411 82,375.93 76.99 4 19.25 6.96 54.43
Total 2,401,428.26 4963.12 146 -
Table 5. Inclusion calculation results for samples with upset distance of 10.0 mm.
Upset Distance10.0 mm
Sample Area(µm2)
Inclusion Area(µm2) Count Average Size
(µm2) Min (µm2) Max (µm2)
1 308,129.52 654.04 29 22.24 6.31 136.442 287,829.61 419.27 16 26.21 6.42 99.173 297,895.50 920.85 19 48.46 6.45 154.094 299,927.04 591.32 20 29.56 6.21 104.595 218,426.28 6511.56 93 70.01 6.02 808.516 266,197.97 2408.46 53 45.44 6.44 382.377 208,845.91 1418.65 31 52.22 6.27 235.108 246,203.56 289.58 8 36.20 7.07 129.559 277,008.41 560.96 14 40.06 6.17 263.29
Total 2,410,462.80 13,974.69 283 -
Metals 2022, 12, 242 10 of 13
3.3. Results and Discussion of Image Analysis
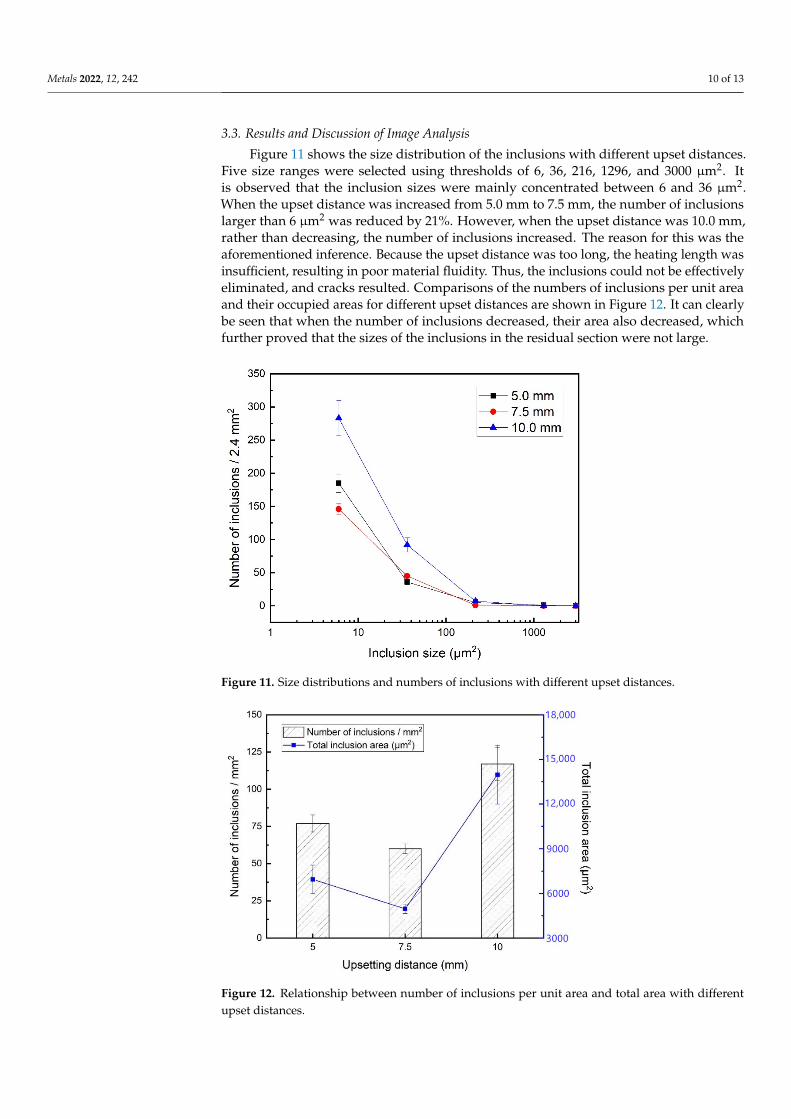
Figure 11 shows the size distribution of the inclusions with different upset distances.Five size ranges were selected using thresholds of 6, 36, 216, 1296, and 3000 µm2. Itis observed that the inclusion sizes were mainly concentrated between 6 and 36 µm2.When the upset distance was increased from 5.0 mm to 7.5 mm, the number of inclusionslarger than 6 µm2 was reduced by 21%. However, when the upset distance was 10.0 mm,rather than decreasing, the number of inclusions increased. The reason for this was theaforementioned inference. Because the upset distance was too long, the heating length wasinsufficient, resulting in poor material fluidity. Thus, the inclusions could not be effectivelyeliminated, and cracks resulted. Comparisons of the numbers of inclusions per unit areaand their occupied areas for different upset distances are shown in Figure 12. It can clearlybe seen that when the number of inclusions decreased, their area also decreased, whichfurther proved that the sizes of the inclusions in the residual section were not large.
Metals 2022, 12, x FOR PEER REVIEW 10 of 13
Table 5. Inclusion calculation results for samples with upset distance of 10.0 mm.
Upset Distance 10.0 mm Sample Area (μm2) Inclusion Area (μm2) Count Average Size (μm2) Min (μm2) Max (μm2) 1 308,129.52 654.04 29 22.24 6.31 136.44 2 287,829.61 419.27 16 26.21 6.42 99.17 3 297,895.50 920.85 19 48.46 6.45 154.09 4 299,927.04 591.32 20 29.56 6.21 104.59 5 218,426.28 6511.56 93 70.01 6.02 808.51 6 266,197.97 2408.46 53 45.44 6.44 382.37 7 208,845.91 1418.65 31 52.22 6.27 235.10 8 246,203.56 289.58 8 36.20 7.07 129.55 9 277,008.41 560.96 14 40.06 6.17 263.29
Total 2,410,462.80 13,974.69 283 -
3.3. Results and Discussion of Image Analysis Figure 11 shows the size distribution of the inclusions with different upset distances.
Five size ranges were selected using thresholds of 6, 36, 216, 1296, and 3000 μm2. It is ob-served that the inclusion sizes were mainly concentrated between 6 and 36 μm2. When the upset distance was increased from 5.0 mm to 7.5 mm, the number of inclusions larger than 6 μm2 was reduced by 21%. However, when the upset distance was 10.0 mm, rather than decreasing, the number of inclusions increased. The reason for this was the aforemen-tioned inference. Because the upset distance was too long, the heating length was insuffi-cient, resulting in poor material fluidity. Thus, the inclusions could not be effectively elim-inated, and cracks resulted. Comparisons of the numbers of inclusions per unit area and their occupied areas for different upset distances are shown in Figure 12. It can clearly be seen that when the number of inclusions decreased, their area also decreased, which fur-ther proved that the sizes of the inclusions in the residual section were not large.
Figure 11. Size distributions and numbers of inclusions with different upset distances. Figure 11. Size distributions and numbers of inclusions with different upset distances.
Metals 2022, 12, x FOR PEER REVIEW 11 of 13
Figure 12. Relationship between number of inclusions per unit area and total area with different upset distances.
The results for the inclusions and breaking force are shown in Figure 13. It can clearly be seen that when the number of inclusions was too large, the breaking force was greatly reduced, causing the failure of the welding joint. This shows that the inclusions indeed affected the mechanical properties of the material. Furthermore, the crack lengths for dif-ferent upset distances were analyzed using the image analysis software. Under each con-dition, 50 SEM images were randomly selected for sampling. The results are shown in Figure 14. It can be proven that when extrusion was performed with insufficient preheat-ing, the cracks in the cross section of the material greatly increased, which further de-creased the strength of the welding joint. Based on the above results, it can be seen that the materials could not be joined when the upset distance was too short, and the preheat-ing of the material was insufficient when the upset distance was too long.
Figure 13. Relationship between number of inclusions and breaking force with different upset dis-tances.
Figure 12. Relationship between number of inclusions per unit area and total area with differentupset distances.
Metals 2022, 12, 242 11 of 13
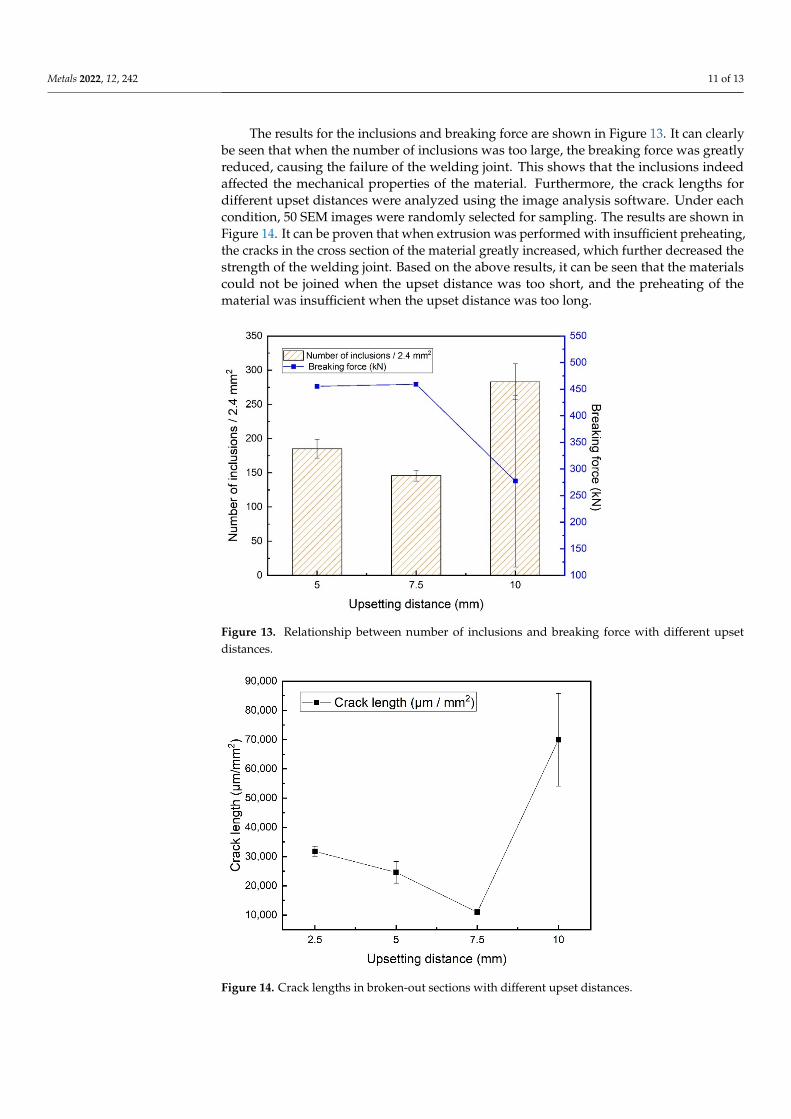
The results for the inclusions and breaking force are shown in Figure 13. It can clearlybe seen that when the number of inclusions was too large, the breaking force was greatlyreduced, causing the failure of the welding joint. This shows that the inclusions indeedaffected the mechanical properties of the material. Furthermore, the crack lengths fordifferent upset distances were analyzed using the image analysis software. Under eachcondition, 50 SEM images were randomly selected for sampling. The results are shown inFigure 14. It can be proven that when extrusion was performed with insufficient preheating,the cracks in the cross section of the material greatly increased, which further decreased thestrength of the welding joint. Based on the above results, it can be seen that the materialscould not be joined when the upset distance was too short, and the preheating of thematerial was insufficient when the upset distance was too long.
Metals 2022, 12, x FOR PEER REVIEW 11 of 13
Figure 12. Relationship between number of inclusions per unit area and total area with different upset distances.
The results for the inclusions and breaking force are shown in Figure 13. It can clearly be seen that when the number of inclusions was too large, the breaking force was greatly reduced, causing the failure of the welding joint. This shows that the inclusions indeed affected the mechanical properties of the material. Furthermore, the crack lengths for dif-ferent upset distances were analyzed using the image analysis software. Under each con-dition, 50 SEM images were randomly selected for sampling. The results are shown in Figure 14. It can be proven that when extrusion was performed with insufficient preheat-ing, the cracks in the cross section of the material greatly increased, which further de-creased the strength of the welding joint. Based on the above results, it can be seen that the materials could not be joined when the upset distance was too short, and the preheat-ing of the material was insufficient when the upset distance was too long.
Figure 13. Relationship between number of inclusions and breaking force with different upset dis-tances.
Figure 13. Relationship between number of inclusions and breaking force with different upsetdistances.
Metals 2022, 12, x FOR PEER REVIEW 12 of 13
Figure 14. Crack lengths in broken-out sections with different upset distances.
4. Conclusions This study investigated the relationship between the inclusions in a welding surface
and the breaking force of a safety buckle. The number of inclusions in the welding joint will directly affect the product’s breaking force. Although the pieces of upset distance at 5 and 7.5 mm can be successfully welded, to reduce the number of inclusions that may be the starting point for fracture/failure is an important topic. Therefore, after reaching the product requirements, it is bound to reduce the internal inclusions, especially the safety requirement. A larger number of inclusions in the welding joint resulted in a lower break-ing force for the product. The breaking force reaches a stable value (>450 kN) at the upset distance window; excessively short and long upset distances produce a significant reduc-tion in the breaking force. In this study, upset distances of 2.5 and 10 mm do not produce sound welds, while upset distances of 5 and 7.5 mm produce sound welds.
Although flash welding is a simple and effective welding technique, its application is limited by many changing factors. The process window discussed in this paper will be helpful in improving the quality of welding joints. The suggested method is to increase the width of the high-temperature preheating zone while using the appropriate upset dis-tance under the premise of not causing excessive transverse deformation of the welding joint. This will be beneficial for eliminating inclusions and will greatly improve the me-chanical properties of the product.
Author Contributions: Conceptualization, S.-C.S. and W.-C.W.; methodology, S.-C.S. and W.-C.W.; validation, S.-C.S. and W.-C.W.; formal analysis, W.-C.W.; investigation, W.-C.W. and D.-K.K.; re-sources, S.-C.S.; data curation, W.-C.W. and D.-K.K.; writing—original draft preparation, W.-C.W.; writing—review and editing, S.-C.S. and D.-K.K.; supervision, S.-C.S.; project administration, S.-C.S.; funding acquisition, S.-C.S. All authors have read and agreed to the published version of the manuscript.
Funding: This research was funded by ministry of science and technology, grant number 110-2221-E-006 -150 and YOKE.
Institutional Review Board Statement: Not applicable
Informed Consent Statement: Not applicable
Data Availability Statement: Not applicable
Acknowledgments: The authors gratefully acknowledge the use of EM000800 of MOST 110-2731-M-006-001 belonging to the Core Facility Center of National Cheng Kung University.
Figure 14. Crack lengths in broken-out sections with different upset distances.

Metals 2022, 12, 242 12 of 13
4. Conclusions
This study investigated the relationship between the inclusions in a welding surfaceand the breaking force of a safety buckle. The number of inclusions in the welding jointwill directly affect the product’s breaking force. Although the pieces of upset distance at5 and 7.5 mm can be successfully welded, to reduce the number of inclusions that maybe the starting point for fracture/failure is an important topic. Therefore, after reachingthe product requirements, it is bound to reduce the internal inclusions, especially thesafety requirement. A larger number of inclusions in the welding joint resulted in a lowerbreaking force for the product. The breaking force reaches a stable value (>450 kN) at theupset distance window; excessively short and long upset distances produce a significantreduction in the breaking force. In this study, upset distances of 2.5 and 10 mm do notproduce sound welds, while upset distances of 5 and 7.5 mm produce sound welds.
Although flash welding is a simple and effective welding technique, its applicationis limited by many changing factors. The process window discussed in this paper will behelpful in improving the quality of welding joints. The suggested method is to increase thewidth of the high-temperature preheating zone while using the appropriate upset distanceunder the premise of not causing excessive transverse deformation of the welding joint.This will be beneficial for eliminating inclusions and will greatly improve the mechanicalproperties of the product.
Author Contributions: Conceptualization, S.-C.S. and W.-C.W.; methodology, S.-C.S. and W.-C.W.;validation, S.-C.S. and W.-C.W.; formal analysis, W.-C.W.; investigation, W.-C.W. and D.-K.K.; re-sources, S.-C.S.; data curation, W.-C.W. and D.-K.K.; writing—original draft preparation, W.-C.W.;writing—review and editing, S.-C.S. and D.-K.K.; supervision, S.-C.S.; project administration, S.-C.S.; funding acquisition, S.-C.S. All authors have read and agreed to the published version ofthe manuscript.
Funding: This research was funded by ministry of science and technology, grant number 110-2221-E-006 -150 and YOKE.
Institutional Review Board Statement: Not applicable.
Informed Consent Statement: Not applicable.
Data Availability Statement: Not applicable.
Acknowledgments: The authors gratefully acknowledge the use of EM000800 of MOST 110-2731-M-006-001 belonging to the Core Facility Center of National Cheng Kung University.
Conflicts of Interest: The authors declare no conflict of interest.
References1. Kim, D.; So, W.; Kang, M. Effect of flash butt welding parameters on weld quality of mooring chain. Arch. Mater. Sci. Eng. 2009,
38, 112–117.2. Fujii, M.; Nakanowatari, H.; Nariai, K. Rail flash-butt welding technology. JFE Steel Corp 2015, 20, 159–163.3. Ichiyama, Y.; Kodama, S. Flash-butt welding of high strength steels. Shinnittetsu Giho 2006, 385, 74.4. Xi, C.; Sun, D.; Xuan, Z.; Wang, J.; Song, G. Microstructures and mechanical properties of flash butt welded high strength steel
joints. Mater. Des. 2016, 96, 506–514. [CrossRef]5. Maurer, W.; Ernst, W.; Rauch, R.; Vallant, R.; Enzinger, N. Evaluation of the factors influencing the strength of HSLA steel weld
joint with softened HAZ. Weld. World 2015, 59, 809–822. [CrossRef]6. Okazaki, Y.; Ishida, H.; Suenaga, K.; Hidaka, T. Influence of oxide inclusion compositions on microstructure and toughness of
weld metal for high-strength steel. Weld. Int. 2012, 26, 593–600. [CrossRef]7. Lu, P.; Xu, Z.; Shu, Y.; Ma, F. Microstructure and failure analysis of flash butt welded HSLA 590CL steel joints in wheel rims. JOM
2017, 69, 135–143. [CrossRef]8. Yu, X.; Feng, L.; Qin, S.; Zhang, Y.; He, Y. Fracture analysis of U71Mn rail flash-butt welding joint. Case Stud. Eng. Fail. Anal. 2015,
4, 20–25. [CrossRef]9. Idapalapati, S.; Akisanya, A.R.; Loh, K.K.; Yeo, S. Failure analysis of a failed anchor chain link. Eng. Fail. Anal. 2018, 89, 258–270.
[CrossRef]10. Al-Fadhalah, K.; Elkholy, A.; Majeed, M. Failure analysis of Grade-80 alloy steel towing chain links. Eng. Fail. Anal. 2010, 17,
1542–1550. [CrossRef]
Metals 2022, 12, 242 13 of 13
11. Yin, N.; Meng, X.T.; Li, F.; Cui, Y.; Zhou, Z.W. Cracking analysis of automobile rim flash butt welding. Adv. Mater. Res. 2014,1004–1005, 1125–1128. [CrossRef]
12. Ichiyama, Y.; Saito, T. Factors affecting flash weldability in high strength steel—A study on toughness improvement of flashwelded joints in high strength steel. Weld. Int. 2004, 18, 436–443. [CrossRef]
13. Hyzak, J.; Bernstein, I. The role of microstructure on the strength and toughness of fully pearlitic steels. Metall. Trans. A 1976, 7,1217–1224. [CrossRef]
14. Neves, J.; Loureiro, A. Fracture toughness of welds—effect of brittle zones and strength mismatch. J. Mater. Processing Technol.2004, 153, 537–543. [CrossRef]
15. Ichiyama, Y.; Asahi, H.; Hudson, R.; Carnes, R.; Hebner, R. Toughness Improvement of Resistance-Butt Welded Joints in Steel.Available online: https://repositories.lib.utexas.edu/handle/2152/33071?show=full (accessed on 12 October 2021).
16. Ichiyama, Y.; Ichikawa, M.; Saito, T. The effect of upsetting conditions on flash weld toughness. Study on toughness improvementof flash welded joints in high strength steel. Weld. Int. 2004, 18, 683–691. [CrossRef]
17. Räsänen, A.; Martikainen, J. Experimental review of metallurgical flash weld defects in welded joints: Essence of flat spots,penetrators and oxide inclusions. Sci. Technol. Weld. Join. 2011, 16, 471–476. [CrossRef]
18. Kuchuk-Yatsenko, S.; Shvets, V.; Didkovsky, A.; Antipin, E.; Kapitanchuk, L. Defects of joints of high-strength rails producedusing flash-butt welding. Avtom. Svarka 2013, 9, 3–9.
19. Chvertko, Y.; Shevchenko, M.; Pirumov, A. Monitoring of the process of Flash-Butt Welding. Soldag. Inspeção 2013, 18, 31–38.[CrossRef]
20. Lu, P.; Xu, Z.; Jiang, K.; Ma, F.; Shu, Y. Influence of flash butt welding parameters on microstructure and mechanical properties ofHSLA 590CL welded joints in wheel rims. J. Mater. Res. 2017, 32, 831–842. [CrossRef]
21. Baracaldo, R.R.; Santos, M.C.; Echeverría, M.A.A. Effect of flash butt welding parameters on mechanical properties of wheel rims.Sci. Et Tech. 2018, 23, 51–57.
22. Skachkov, I.; Chvertko, E. Evaluation of stability of the flashing process in flash-butt welding. Paton Weld. J 2011, 3, 29–31.23. Shajan, N.; Arora, K.S.; Sharma, V.; Shome, M. Effect of upset pressure on texture evolution and its correlation to toughness in
flash butt joints. Sci. Technol. Weld. Join. 2018, 23, 434–440. [CrossRef]24. Ziemian, C.W.; Sharma, M.M.; Whaley, D.E. Effects of flashing and upset sequences on microstructure, hardness, and tensile
properties of welded structural steel joints. Mater. Des. 2012, 33, 175–184. [CrossRef]
Related Documents