ECOSYSTEM STUDIES OF THE ST LAWRENCE RIVER Influence of functional feeding groups and spatiotemporal variables on the d 15 N signature of littoral macroinvertebrates Fabien Cremona Dolors Planas Marc Lucotte Received: 3 February 2009 / Revised: 21 April 2009 / Accepted: 24 April 2009 / Published online: 24 May 2009 Ó Springer Science+Business Media B.V. 2009 Abstract The d 15 N trophic enrichment in littoral food webs is not well known despite the importance of macroinvertebrates in lacustrine energy fluxes. We wanted to assess the influence of functional feeding group (grazer, collector, shredder, predator, predator– hematophagous, predator–sucker) and spatiotemporal variables (year, month, station of sampling) on littoral macroinvertebrate d 15 N signatures. For 2 years, during the plant growth period phytophilous littoral macroinvertebrates were sampled in Lake St. Pierre, a large fluvial lake of the St. Lawrence River, Que ´bec, Canada. The d 15 N analyses showed that station was the most important factor for explaining d 15 N variation, followed by sampling month and functional feeding group. The organisms sampled in the stations of the south shore, which experienced greater macrophyte abundance, slower currents, and stronger NO 3 depletion exhibited higher d 15 N values than those sampled on the north shore. Grazer-to-predator d 15 N enrichment valued 1.6%, which is inferior to the 3.4% generally admitted in food-web research. Shredders exhibited the lowest d 15 N values and predators–hematophagous the high- est. d 15 N signature of invertebrates increased 3% through the summer between May and September. Only samples collected within a short period should be pooled to avoid an error value equivalent to one trophic level (1.6) enrichment. Furthermore, it is recom- mended not to pool macroinvertebrate samples col- lected at stations with differing watershed land uses. Keywords Macroinvertebrates Food webs Littoral zone Stable isotopes St. Lawrence River Introduction Stable isotopes are used widely in studies of food webs (Allen et al., 2005; Walter et al., 2006). They are considered steady, time-integrated tools for taking into account effective assimilation of dietary items in organisms (Post, 2002). These characteristics are important when the stable isotope approach is compared with analyses of gut contents which only provide a snapshot of the feeding habits of an organism (Hart & Lovvorn, 2002; Schindler, 2002). Stable N isotope signature (d 15 N) in particular is used Guest editors: M. Power, J. Marty, M. R. Twiss, J. Ridal, Y. de Lafontaine, J. M. Farrell St. Lawrence River–Great Lakes Ecosystems: An Ecological Overview F. Cremona (&) D. Planas M. Lucotte GE ´ OTOP, Universite ´ du Que ´bec a ` Montre ´al, succursale centre ville, C.P. 8888, Montreal, QC H3C 3P8, Canada e-mail: [email protected]; [email protected] D. Planas e-mail: [email protected] M. Lucotte e-mail: [email protected] 123 Hydrobiologia (2010) 647:51–61 DOI 10.1007/s10750-009-9798-5

Welcome message from author
This document is posted to help you gain knowledge. Please leave a comment to let me know what you think about it! Share it to your friends and learn new things together.
Transcript
ECOSYSTEM STUDIES OF THE ST LAWRENCE RIVER
Influence of functional feeding groups and spatiotemporalvariables on the d15N signature of littoralmacroinvertebrates
Fabien Cremona Æ Dolors Planas Æ Marc Lucotte
Received: 3 February 2009 / Revised: 21 April 2009 / Accepted: 24 April 2009 / Published online: 24 May 2009
� Springer Science+Business Media B.V. 2009
Abstract The d15N trophic enrichment in littoral
food webs is not well known despite the importance
of macroinvertebrates in lacustrine energy fluxes. We
wanted to assess the influence of functional feeding
group (grazer, collector, shredder, predator, predator–
hematophagous, predator–sucker) and spatiotemporal
variables (year, month, station of sampling) on
littoral macroinvertebrate d15N signatures. For
2 years, during the plant growth period phytophilous
littoral macroinvertebrates were sampled in Lake
St. Pierre, a large fluvial lake of the St. Lawrence
River, Quebec, Canada. The d15N analyses showed
that station was the most important factor for
explaining d15N variation, followed by sampling
month and functional feeding group. The organisms
sampled in the stations of the south shore, which
experienced greater macrophyte abundance, slower
currents, and stronger NO3 depletion exhibited higher
d15N values than those sampled on the north shore.
Grazer-to-predator d15N enrichment valued 1.6%,
which is inferior to the 3.4% generally admitted in
food-web research. Shredders exhibited the lowest
d15N values and predators–hematophagous the high-
est. d15N signature of invertebrates increased 3%through the summer between May and September.
Only samples collected within a short period should be
pooled to avoid an error value equivalent to one trophic
level (1.6) enrichment. Furthermore, it is recom-
mended not to pool macroinvertebrate samples col-
lected at stations with differing watershed land uses.
Keywords Macroinvertebrates � Food webs �Littoral zone � Stable isotopes � St. Lawrence River
Introduction
Stable isotopes are used widely in studies of food
webs (Allen et al., 2005; Walter et al., 2006). They
are considered steady, time-integrated tools for taking
into account effective assimilation of dietary items in
organisms (Post, 2002). These characteristics are
important when the stable isotope approach is
compared with analyses of gut contents which only
provide a snapshot of the feeding habits of an
organism (Hart & Lovvorn, 2002; Schindler, 2002).
Stable N isotope signature (d15N) in particular is used
Guest editors: M. Power, J. Marty, M. R. Twiss, J. Ridal, Y. de
Lafontaine, J. M. Farrell
St. Lawrence River–Great Lakes Ecosystems: An Ecological
Overview
F. Cremona (&) � D. Planas � M. Lucotte
GEOTOP, Universite du Quebec a Montreal, succursale
centre ville, C.P. 8888, Montreal, QC H3C 3P8, Canada
e-mail: [email protected];
D. Planas
e-mail: [email protected]
M. Lucotte
e-mail: [email protected]
123
Hydrobiologia (2010) 647:51–61
DOI 10.1007/s10750-009-9798-5
to position the trophic level of an organism or a group
of organisms in a given food web (Minagawa &
Wada, 1984; Vander Zanden & Rasmussen, 2001).
Higher trophic levels exhibit higher d15N values with
respect to lower consumers or producers, with a
typical increase of 3.4% per trophic level (Vander
Zanden & Rasmussen, 2001; Post, 2002). This
approach has been successfully tested in pelagic food
web studies including a large variety of organisms,
ranging from primary producers to top-end consum-
ers (Yoshioka et al., 1994). The d15N signature is
even used as tracer of biomagnifying persistent
pollutants such as PCB or methylmercury in aquatic
pelagic food webs, with the highest trophic levels
also being the most contaminated (Cabana & Ras-
mussen, 1994).
However, not much is known about d15N trophic
enrichment into the aquatic littoral food webs. This
lack of knowledge may be caused by an historical
bias in favour of research conducted in pelagic
systems compared to littoral and benthic ones
(Vadeboncoeur et al., 2002). The majority of studies
of d15N in macroinvertebrate food webs have been so
far mostly focussed on stream benthos (Zah et al.,
2001; Anderson & Cabana, 2005, 2007) or soil
invertebrates (Ponsard & Arditi, 2000). The diversity
of macroinvertebrate feeding groups is especially
great in the vegetated littoral zone of lakes and in
wetlands. These zones support complex food webs,
from first order consumers to top predators (Minshall,
1984; Strayer, 1985; Cyr & Downing, 1988; Cremona
et al., 2008a). Still, even within a given trophic level,
primary consumers for example can host dissimilar
functional groups such as scrapers that eat periphy-
ton, shredders that feed on coarse particulate matter,
and collectors who generally prefer fine particulate
matter or planktonic algae (Cummins, 1973; Vannote
et al., 1980; Cattaneo, 1983) and thus may not be
considered together as a unique baseline (i.e., primary
consumer) signature of the food web. Among preda-
tors, there is also a diversity of feeding modes, from
engulfers swallowing their whole prey to fluid-
feeders such as the predatory Dytiscidae (Coleoptera)
larvae and even ectoparasites. This variety of feeding
modes could lead to important consequences regard-
ing the N transfer and the 15N fractionation in
invertebrate food webs (McCutchan et al., 2003).
In addition to taxonomic variation in d15N frac-
tionation, some external factors could influence
N-isotopic signals. Differences in the origin of N-
loadings from watersheds influence d15N signature of
food webs (Anderson & Cabana, 2005, 2007; De
Brabandere et al., 2007). Manure and fertilizer from
crops are enriched in d15N while sewage water can be
depleted (Van Dover et al., 1992; DeBruyn &
Rasmussen, 2002) or enriched (Leavitt et al., 2006).
During summer episodes of hypoxia, denitrification
can increase the d15N of the remaining inorganic
nitrogen pool (De Brabandere et al., 2007). These
phenomena could affect baseline d15N signature, thus
underrating the importance of d15N variability among
invertebrates and leading to errors in positioning
organisms in food web studies.
Because it has been estimated that littoral produc-
tion might be equal or greater than pelagic production
in shallow lakes and that fish are predominantly
supported by benthic secondary production (Vade-
boncoeur et al., 2002; Vander Zanden et al., 2006), a
better knowledge of littoral macroinvertebrate food
webs is thus necessary for better characterizing whole-
lake food webs. The purpose of this study is to assess
the influence of temporal, spatial, and trophic factors
on the d15N signatures in macroinvertebrate littoral
food webs. More specifically, we focus on inverte-
brates dwelling in littoral beds of aquatic macrophytes.
Materials and methods
Study site
This study was carried out in a fluvial lake of the St.
Lawrence River, Lake St. Pierre located downstream
of Montreal, in Southern Quebec, Canada. This lake
is shallow (mean depth \4 m) and extensively
covered with macrophyte beds (80% of the Lake
area; Vis et al., 2003), and represents 75% of the St.
Lawrence marshes (Jean et al., 2000). Major macro-
phyte species included Nymphaea tuberosa Paine,
Vallisneria americana Michx., Potamogeton spp. and
Scirpus fluviatilis (Torr.). The center of the lake is
dredged to allow commercial boat transportation
from the Great Lakes to the Atlantic Ocean. The
combined effects of the St. Lawrence Seaway and
water velocity prevent mixing of the water masses
which originate from three main inflows. On the
north part of the lake, the water is rich in colored
dissolved organic matter from the Ottawa River and
52 Hydrobiologia (2010) 647:51–61
123
the forested Canadian Shield tributaries. In the central
part flows clear water from the Great Lakes. In the
southern part of the lake the water drains lowlands
devoted to intensive agriculture, resulting in heavy
loads of manure, fertilizers, and organic matter in the
tributaries. Values of nutrient concentrations in Lake
St. Pierre vary between 18 and 210 lg l-1 (mean
62 lg l-1 in north and south shores) for Phosphorus
and between 300 and 900 lg l-1 (mean 525 lg l-1 in
the north shore, 728 lg l-1 in the south shore) for
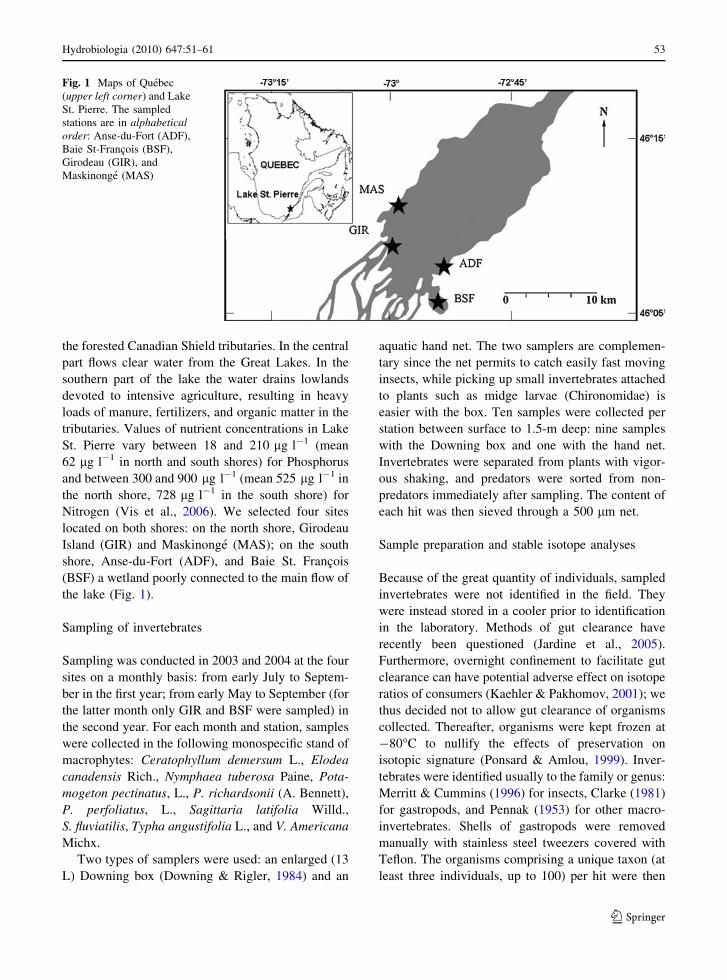
Nitrogen (Vis et al., 2006). We selected four sites
located on both shores: on the north shore, Girodeau
Island (GIR) and Maskinonge (MAS); on the south
shore, Anse-du-Fort (ADF), and Baie St. Francois
(BSF) a wetland poorly connected to the main flow of
the lake (Fig. 1).
Sampling of invertebrates
Sampling was conducted in 2003 and 2004 at the four
sites on a monthly basis: from early July to Septem-
ber in the first year; from early May to September (for
the latter month only GIR and BSF were sampled) in
the second year. For each month and station, samples
were collected in the following monospecific stand of
macrophytes: Ceratophyllum demersum L., Elodea
canadensis Rich., Nymphaea tuberosa Paine, Pota-
mogeton pectinatus, L., P. richardsonii (A. Bennett),
P. perfoliatus, L., Sagittaria latifolia Willd.,
S. fluviatilis, Typha angustifolia L., and V. Americana
Michx.
Two types of samplers were used: an enlarged (13
L) Downing box (Downing & Rigler, 1984) and an
aquatic hand net. The two samplers are complemen-
tary since the net permits to catch easily fast moving
insects, while picking up small invertebrates attached
to plants such as midge larvae (Chironomidae) is
easier with the box. Ten samples were collected per
station between surface to 1.5-m deep: nine samples
with the Downing box and one with the hand net.
Invertebrates were separated from plants with vigor-
ous shaking, and predators were sorted from non-
predators immediately after sampling. The content of
each hit was then sieved through a 500 lm net.
Sample preparation and stable isotope analyses
Because of the great quantity of individuals, sampled
invertebrates were not identified in the field. They
were instead stored in a cooler prior to identification
in the laboratory. Methods of gut clearance have
recently been questioned (Jardine et al., 2005).
Furthermore, overnight confinement to facilitate gut
clearance can have potential adverse effect on isotope
ratios of consumers (Kaehler & Pakhomov, 2001); we
thus decided not to allow gut clearance of organisms
collected. Thereafter, organisms were kept frozen at
-80�C to nullify the effects of preservation on
isotopic signature (Ponsard & Amlou, 1999). Inver-
tebrates were identified usually to the family or genus:
Merritt & Cummins (1996) for insects, Clarke (1981)
for gastropods, and Pennak (1953) for other macro-
invertebrates. Shells of gastropods were removed
manually with stainless steel tweezers covered with
Teflon. The organisms comprising a unique taxon (at
least three individuals, up to 100) per hit were then
Fig. 1 Maps of Quebec
(upper left corner) and Lake
St. Pierre. The sampled
stations are in alphabeticalorder: Anse-du-Fort (ADF),
Baie St-Francois (BSF),
Girodeau (GIR), and
Maskinonge (MAS)
Hydrobiologia (2010) 647:51–61 53
123
counted and sorted in pre-cleaned vials (first soaked
with 10% HCl and then rinsed three times with
Nanopure water). Invertebrates were freeze-dried and
then ground with an acid-cleaned glass rod directly in
the vial. For nitrogen stable isotope analysis, samples
from vials were weighted into tin cups prior to
combustion in a Carlo Erba C/N analyzer NA 1500
series 2, connected to an Isoprim Mass Spectrometer
(Micromass). Isotopic results are given using standard
d notation where
d15N ¼ Rsample=Rreference
� �� 1
� �� 1000 ð1Þ
is expressed in units of per mil (%) and R = 15N/14N
(Verardo et al., 1990). Reference materials were
secondary standard (N1) of known relation to the
international standard of atmospheric N2 (0.43% v.
air). Repeated analyses of an internal standard (n = 3
for each group of 20–50 samples) resulted in typical
precision of ±0.2%.
Data treatment
Taxa were classified into functional feeding groups
according to their organic matter source and feeding
mode (Pennak, 1953; Merritt & Cummins, 1996):
grazers, shredders, collectors, omnivores, predators
(engulfers–chewers), predator–suckers, and finally
hematophagous predators. We used JMP 5.0 for the
statistical analyses. Since many taxa were not found
either at all periods of time or at all the stations, we used
a single linear model with factorial test effect for data
analysis. Adjusted values (i.e., Least Square Means,
LSM) of d15N were used as the response variable. The
LSM are predicted values from the model across the
level of categorical effects where the other model
variables are controlled by being set to neutral values
(SAS Institute Inc., 1991; Uryu et al., 2001). For
example, in a model comprising four categorical
variables, when comparisons are made within one
variable, the weights of other three variables are
neutralized. Categorical explanatory variables were
temporal (year, month), spatial (station), and trophic
(functional feeding group) ones. Tukey Honestly Sig-
nificantly Different (HSD) tests were then performed on
the adjusted values ofd15N to test inter-annual, monthly,
station, and functional group differences.
Simple regression analysis was performed between
d15N of predators (chewers–engulfers, not the other
types) and grazers sampled within the same macro-
phyte species at each station and sampling period to
determine d15N trophic fractionation factor between
primary consumer baseline and secondary consumers.
Predators and grazers were chosen because (1) they
were the most widely distributed group throughout
our samples. Indeed, other functional groups were not
widespread enough to produce data for a simple
regression, (2) primary producer d15N signature is
too variable to constitute a steady baseline (Post,
2002).
Results
On the 436 samples measured for d15N signature, 72
were of collectors, 125 grazers, 142 omnivores, 38
predators, 16 predators–hematophagous, 33 preda-
tors–suckers, and 10 shredders. The average d15N
values ranged from 6.6% in Limnephilidae
(Trichoptera) to over 12% in Hirudinae, a difference
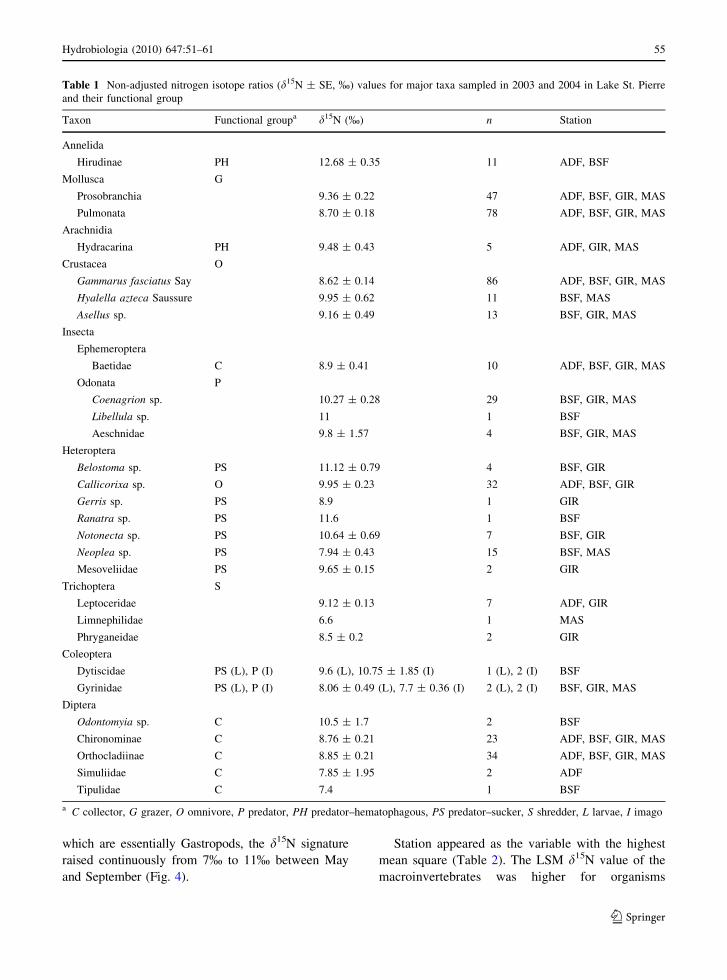
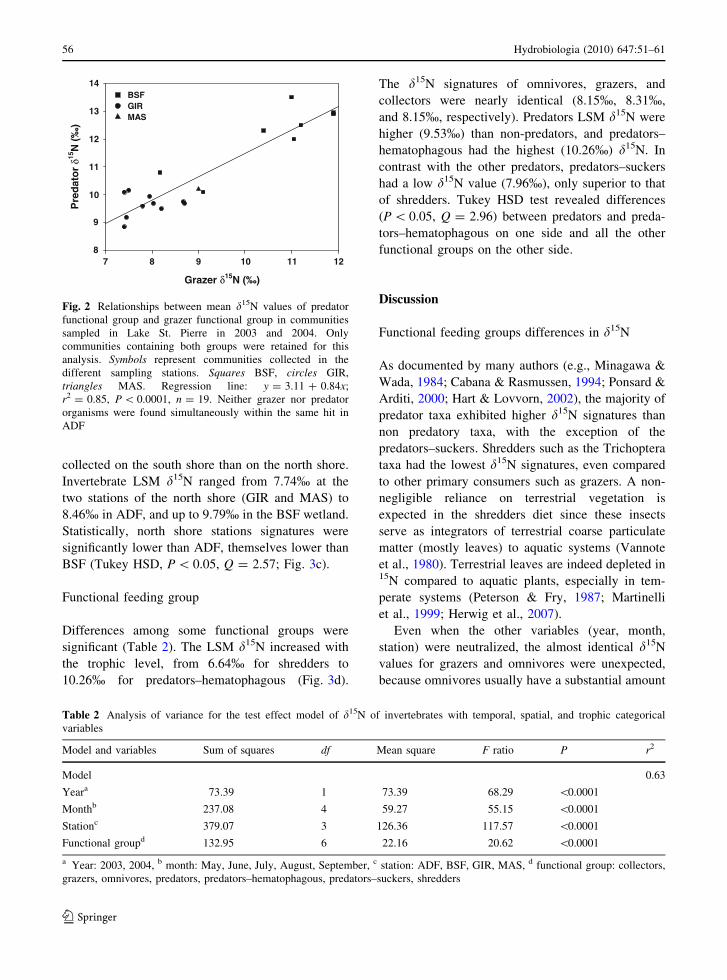
of nearly two trophic levels (Table 1). The d15N
signatures of the most abundant primary consumers
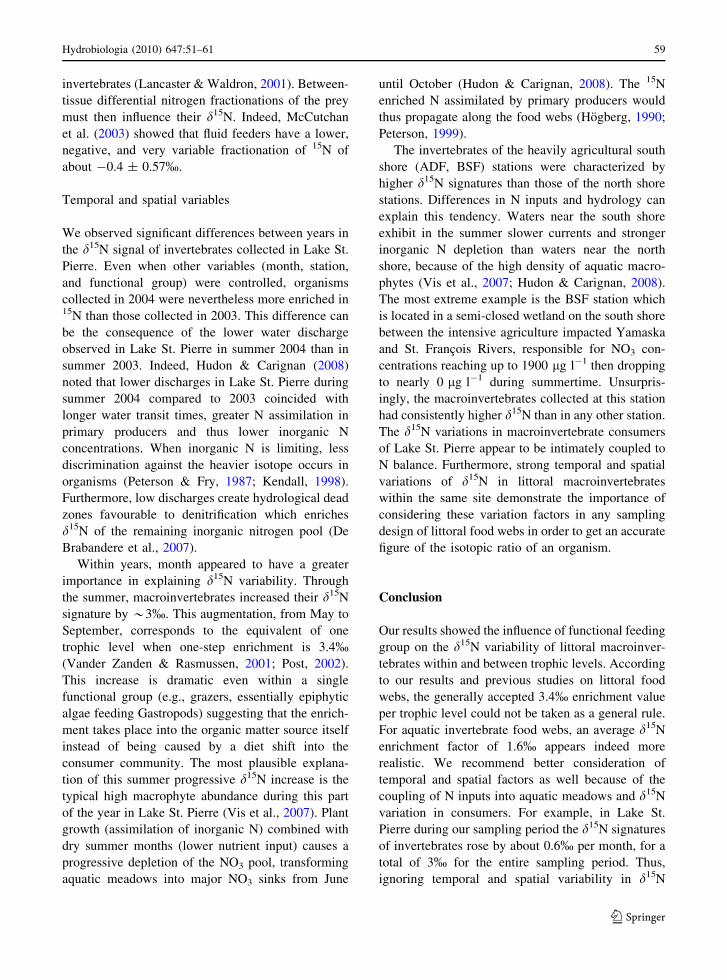
(grazers) and predators were correlated (P \ 0.0001,
r2 = 0.85, n = 19) across sites and periods of
sampling (Fig. 2). Predators were enriched of
d15N = 1.62 ± 0.14% relative to grazers at BSF,
GIR, and MAS stations.
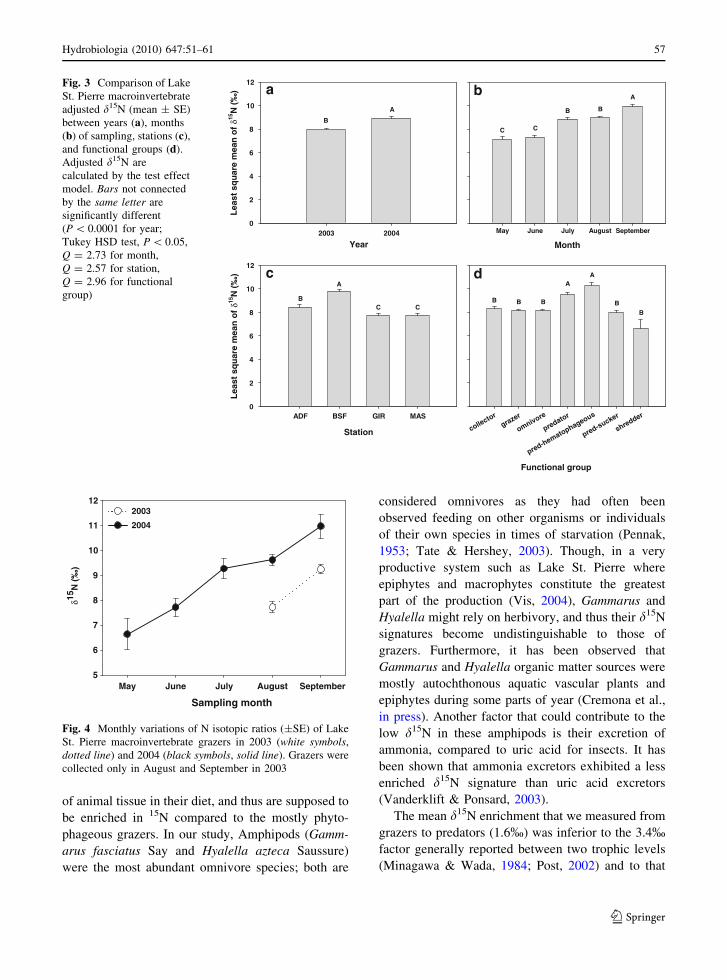
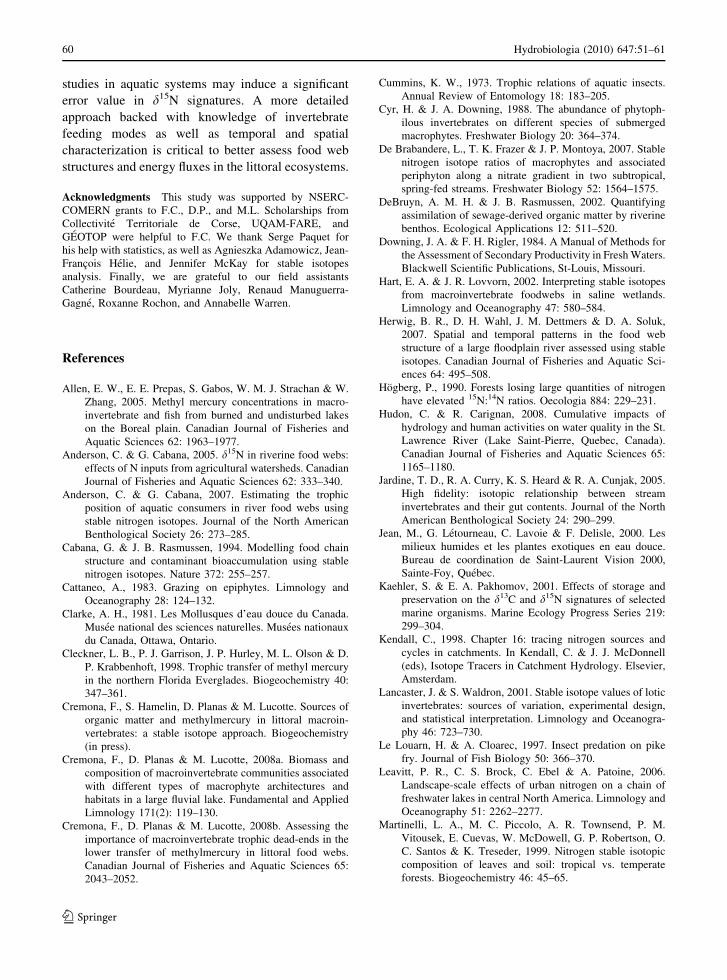
Temporal and spatial heterogeneity
Within the factorial test effect model, both temporal
variables (year and month) were significant (Table 2).
Macroinvertebrates in 2004 had a higher LSM d15N
signature than in 2003 (P \ 0.0001; Fig. 3a). When
the analysis was done considering only months
sampled in both years (July, August, and September)
the LSM d15N signatures were again higher in 2004
than in 2003 (P \ 0.0001). Seasons were significantly
different, with three distinct periods: end of spring
May–June, mid-summer July–August, and end of
summer September (Tukey HSD, P \ 0.05,
Q = 2.73). There was an increase in the macroinver-
tebrate average LSM d15N signatures through the
summer, from an adjusted value of 7.09% in May to
9.95% in September, which corresponds to an
increment roughly equivalent to one trophic level
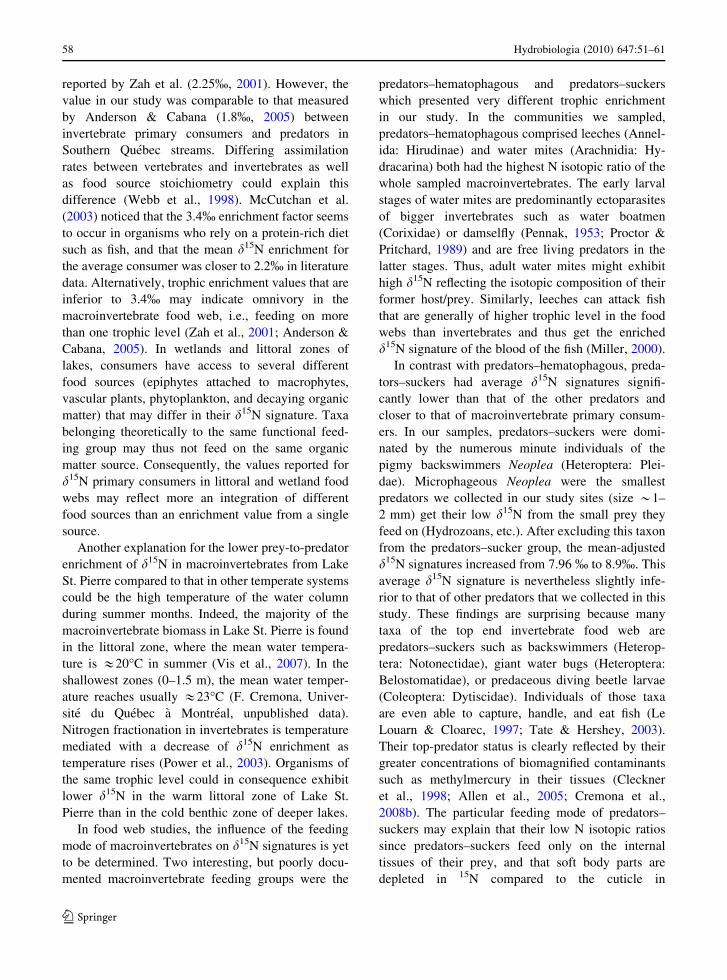
(Fig. 3b). This increase took place even within the
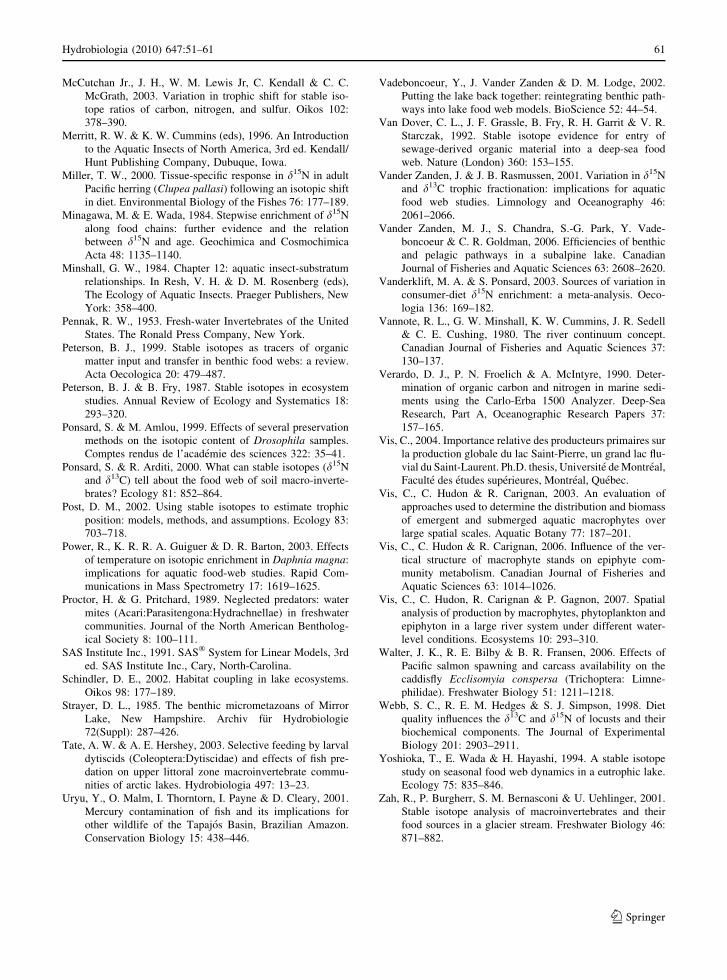
same functional group. For grazers in Lake St. Pierre,
54 Hydrobiologia (2010) 647:51–61
123
which are essentially Gastropods, the d15N signature
raised continuously from 7% to 11% between May
and September (Fig. 4).
Station appeared as the variable with the highest
mean square (Table 2). The LSM d15N value of the
macroinvertebrates was higher for organisms
Table 1 Non-adjusted nitrogen isotope ratios (d15N ± SE, %) values for major taxa sampled in 2003 and 2004 in Lake St. Pierre
and their functional group
Taxon Functional groupa d15N (%) n Station
Annelida
Hirudinae PH 12.68 ± 0.35 11 ADF, BSF
Mollusca G
Prosobranchia 9.36 ± 0.22 47 ADF, BSF, GIR, MAS
Pulmonata 8.70 ± 0.18 78 ADF, BSF, GIR, MAS
Arachnidia
Hydracarina PH 9.48 ± 0.43 5 ADF, GIR, MAS
Crustacea O
Gammarus fasciatus Say 8.62 ± 0.14 86 ADF, BSF, GIR, MAS
Hyalella azteca Saussure 9.95 ± 0.62 11 BSF, MAS
Asellus sp. 9.16 ± 0.49 13 BSF, GIR, MAS
Insecta
Ephemeroptera
Baetidae C 8.9 ± 0.41 10 ADF, BSF, GIR, MAS
Odonata P
Coenagrion sp. 10.27 ± 0.28 29 BSF, GIR, MAS
Libellula sp. 11 1 BSF
Aeschnidae 9.8 ± 1.57 4 BSF, GIR, MAS
Heteroptera
Belostoma sp. PS 11.12 ± 0.79 4 BSF, GIR
Callicorixa sp. O 9.95 ± 0.23 32 ADF, BSF, GIR
Gerris sp. PS 8.9 1 GIR
Ranatra sp. PS 11.6 1 BSF
Notonecta sp. PS 10.64 ± 0.69 7 BSF, GIR
Neoplea sp. PS 7.94 ± 0.43 15 BSF, MAS
Mesoveliidae PS 9.65 ± 0.15 2 GIR
Trichoptera S
Leptoceridae 9.12 ± 0.13 7 ADF, GIR
Limnephilidae 6.6 1 MAS
Phryganeidae 8.5 ± 0.2 2 GIR
Coleoptera
Dytiscidae PS (L), P (I) 9.6 (L), 10.75 ± 1.85 (I) 1 (L), 2 (I) BSF
Gyrinidae PS (L), P (I) 8.06 ± 0.49 (L), 7.7 ± 0.36 (I) 2 (L), 2 (I) BSF, GIR, MAS
Diptera
Odontomyia sp. C 10.5 ± 1.7 2 BSF
Chironominae C 8.76 ± 0.21 23 ADF, BSF, GIR, MAS
Orthocladiinae C 8.85 ± 0.21 34 ADF, BSF, GIR, MAS
Simuliidae C 7.85 ± 1.95 2 ADF
Tipulidae C 7.4 1 BSF
a C collector, G grazer, O omnivore, P predator, PH predator–hematophagous, PS predator–sucker, S shredder, L larvae, I imago
Hydrobiologia (2010) 647:51–61 55
123
collected on the south shore than on the north shore.
Invertebrate LSM d15N ranged from 7.74% at the
two stations of the north shore (GIR and MAS) to
8.46% in ADF, and up to 9.79% in the BSF wetland.
Statistically, north shore stations signatures were
significantly lower than ADF, themselves lower than
BSF (Tukey HSD, P \ 0.05, Q = 2.57; Fig. 3c).
Functional feeding group
Differences among some functional groups were
significant (Table 2). The LSM d15N increased with
the trophic level, from 6.64% for shredders to
10.26% for predators–hematophagous (Fig. 3d).
The d15N signatures of omnivores, grazers, and
collectors were nearly identical (8.15%, 8.31%,
and 8.15%, respectively). Predators LSM d15N were
higher (9.53%) than non-predators, and predators–
hematophagous had the highest (10.26%) d15N. In
contrast with the other predators, predators–suckers
had a low d15N value (7.96%), only superior to that
of shredders. Tukey HSD test revealed differences
(P \ 0.05, Q = 2.96) between predators and preda-
tors–hematophagous on one side and all the other
functional groups on the other side.
Discussion
Functional feeding groups differences in d15N
As documented by many authors (e.g., Minagawa &
Wada, 1984; Cabana & Rasmussen, 1994; Ponsard &
Arditi, 2000; Hart & Lovvorn, 2002), the majority of
predator taxa exhibited higher d15N signatures than
non predatory taxa, with the exception of the
predators–suckers. Shredders such as the Trichoptera
taxa had the lowest d15N signatures, even compared
to other primary consumers such as grazers. A non-
negligible reliance on terrestrial vegetation is
expected in the shredders diet since these insects
serve as integrators of terrestrial coarse particulate
matter (mostly leaves) to aquatic systems (Vannote
et al., 1980). Terrestrial leaves are indeed depleted in15N compared to aquatic plants, especially in tem-
perate systems (Peterson & Fry, 1987; Martinelli
et al., 1999; Herwig et al., 2007).
Even when the other variables (year, month,
station) were neutralized, the almost identical d15N
values for grazers and omnivores were unexpected,
because omnivores usually have a substantial amount
Grazer δ15N (‰)
7 8 9 10 11 12
Pre
dat
or
δ15N
(‰
)
8
9
10
11
12
13
14BSFGIRMAS
Fig. 2 Relationships between mean d15N values of predator
functional group and grazer functional group in communities
sampled in Lake St. Pierre in 2003 and 2004. Only
communities containing both groups were retained for this
analysis. Symbols represent communities collected in the
different sampling stations. Squares BSF, circles GIR,
triangles MAS. Regression line: y = 3.11 ? 0.84x;
r2 = 0.85, P \ 0.0001, n = 19. Neither grazer nor predator
organisms were found simultaneously within the same hit in
ADF
Table 2 Analysis of variance for the test effect model of d15N of invertebrates with temporal, spatial, and trophic categorical
variables
Model and variables Sum of squares df Mean square F ratio P r2
Model 0.63
Yeara 73.39 1 73.39 68.29 \0.0001
Monthb 237.08 4 59.27 55.15 \0.0001
Stationc 379.07 3 126.36 117.57 \0.0001
Functional groupd 132.95 6 22.16 20.62 \0.0001
a Year: 2003, 2004, b month: May, June, July, August, September, c station: ADF, BSF, GIR, MAS, d functional group: collectors,
grazers, omnivores, predators, predators–hematophagous, predators–suckers, shredders
56 Hydrobiologia (2010) 647:51–61
123
of animal tissue in their diet, and thus are supposed to
be enriched in 15N compared to the mostly phyto-
phageous grazers. In our study, Amphipods (Gamm-
arus fasciatus Say and Hyalella azteca Saussure)
were the most abundant omnivore species; both are
considered omnivores as they had often been
observed feeding on other organisms or individuals
of their own species in times of starvation (Pennak,
1953; Tate & Hershey, 2003). Though, in a very
productive system such as Lake St. Pierre where
epiphytes and macrophytes constitute the greatest
part of the production (Vis, 2004), Gammarus and
Hyalella might rely on herbivory, and thus their d15N
signatures become undistinguishable to those of
grazers. Furthermore, it has been observed that
Gammarus and Hyalella organic matter sources were
mostly autochthonous aquatic vascular plants and
epiphytes during some parts of year (Cremona et al.,
in press). Another factor that could contribute to the
low d15N in these amphipods is their excretion of
ammonia, compared to uric acid for insects. It has
been shown that ammonia excretors exhibited a less
enriched d15N signature than uric acid excretors
(Vanderklift & Ponsard, 2003).
The mean d15N enrichment that we measured from
grazers to predators (1.6%) was inferior to the 3.4%factor generally reported between two trophic levels
(Minagawa & Wada, 1984; Post, 2002) and to that
Functional group
collectorgrazer
omnivore
predator
pred-hematophageous
pred-sucker
shredder
AA
B B B BB
Station
ADF BSF GIR MAS
Lea
st s
qu
are
mea
n o
f δ15
N (
‰)
0
2
4
6
8
10
12
A
BC C
Month
May June July August September
A
BB
CC
Year2003 2004
Lea
st s
qu
are
mea
n o
f δ15
N (
‰)
0
2
4
6
8
10
12
A
B
a
c
b
d
Fig. 3 Comparison of Lake
St. Pierre macroinvertebrate
adjusted d15N (mean ± SE)
between years (a), months
(b) of sampling, stations (c),
and functional groups (d).
Adjusted d15N are
calculated by the test effect
model. Bars not connected
by the same letter are
significantly different
(P \ 0.0001 for year;
Tukey HSD test, P \ 0.05,
Q = 2.73 for month,
Q = 2.57 for station,
Q = 2.96 for functional
group)
Sampling month
May June July August September
δ15N
(‰
)
5
6
7
8
9
10
11
122003
2004
Fig. 4 Monthly variations of N isotopic ratios (±SE) of Lake
St. Pierre macroinvertebrate grazers in 2003 (white symbols,
dotted line) and 2004 (black symbols, solid line). Grazers were
collected only in August and September in 2003
Hydrobiologia (2010) 647:51–61 57
123
reported by Zah et al. (2.25%, 2001). However, the
value in our study was comparable to that measured
by Anderson & Cabana (1.8%, 2005) between
invertebrate primary consumers and predators in
Southern Quebec streams. Differing assimilation
rates between vertebrates and invertebrates as well
as food source stoichiometry could explain this
difference (Webb et al., 1998). McCutchan et al.
(2003) noticed that the 3.4% enrichment factor seems
to occur in organisms who rely on a protein-rich diet
such as fish, and that the mean d15N enrichment for
the average consumer was closer to 2.2% in literature
data. Alternatively, trophic enrichment values that are
inferior to 3.4% may indicate omnivory in the
macroinvertebrate food web, i.e., feeding on more
than one trophic level (Zah et al., 2001; Anderson &
Cabana, 2005). In wetlands and littoral zones of
lakes, consumers have access to several different
food sources (epiphytes attached to macrophytes,
vascular plants, phytoplankton, and decaying organic
matter) that may differ in their d15N signature. Taxa
belonging theoretically to the same functional feed-
ing group may thus not feed on the same organic
matter source. Consequently, the values reported for
d15N primary consumers in littoral and wetland food
webs may reflect more an integration of different
food sources than an enrichment value from a single
source.
Another explanation for the lower prey-to-predator
enrichment of d15N in macroinvertebrates from Lake
St. Pierre compared to that in other temperate systems
could be the high temperature of the water column
during summer months. Indeed, the majority of the
macroinvertebrate biomass in Lake St. Pierre is found
in the littoral zone, where the mean water tempera-
ture is &20�C in summer (Vis et al., 2007). In the
shallowest zones (0–1.5 m), the mean water temper-
ature reaches usually &23�C (F. Cremona, Univer-
site du Quebec a Montreal, unpublished data).
Nitrogen fractionation in invertebrates is temperature
mediated with a decrease of d15N enrichment as
temperature rises (Power et al., 2003). Organisms of
the same trophic level could in consequence exhibit
lower d15N in the warm littoral zone of Lake St.
Pierre than in the cold benthic zone of deeper lakes.
In food web studies, the influence of the feeding
mode of macroinvertebrates on d15N signatures is yet
to be determined. Two interesting, but poorly docu-
mented macroinvertebrate feeding groups were the
predators–hematophagous and predators–suckers
which presented very different trophic enrichment
in our study. In the communities we sampled,
predators–hematophagous comprised leeches (Annel-
ida: Hirudinae) and water mites (Arachnidia: Hy-
dracarina) both had the highest N isotopic ratio of the
whole sampled macroinvertebrates. The early larval
stages of water mites are predominantly ectoparasites
of bigger invertebrates such as water boatmen
(Corixidae) or damselfly (Pennak, 1953; Proctor &
Pritchard, 1989) and are free living predators in the
latter stages. Thus, adult water mites might exhibit
high d15N reflecting the isotopic composition of their
former host/prey. Similarly, leeches can attack fish
that are generally of higher trophic level in the food
webs than invertebrates and thus get the enriched
d15N signature of the blood of the fish (Miller, 2000).
In contrast with predators–hematophagous, preda-
tors–suckers had average d15N signatures signifi-
cantly lower than that of the other predators and
closer to that of macroinvertebrate primary consum-
ers. In our samples, predators–suckers were domi-
nated by the numerous minute individuals of the
pigmy backswimmers Neoplea (Heteroptera: Plei-
dae). Microphageous Neoplea were the smallest
predators we collected in our study sites (size *1–
2 mm) get their low d15N from the small prey they
feed on (Hydrozoans, etc.). After excluding this taxon
from the predators–sucker group, the mean-adjusted
d15N signatures increased from 7.96 % to 8.9%. This
average d15N signature is nevertheless slightly infe-
rior to that of other predators that we collected in this
study. These findings are surprising because many
taxa of the top end invertebrate food web are
predators–suckers such as backswimmers (Heterop-
tera: Notonectidae), giant water bugs (Heteroptera:
Belostomatidae), or predaceous diving beetle larvae
(Coleoptera: Dytiscidae). Individuals of those taxa
are even able to capture, handle, and eat fish (Le
Louarn & Cloarec, 1997; Tate & Hershey, 2003).
Their top-predator status is clearly reflected by their
greater concentrations of biomagnified contaminants
such as methylmercury in their tissues (Cleckner
et al., 1998; Allen et al., 2005; Cremona et al.,
2008b). The particular feeding mode of predators–
suckers may explain that their low N isotopic ratios
since predators–suckers feed only on the internal
tissues of their prey, and that soft body parts are
depleted in 15N compared to the cuticle in
58 Hydrobiologia (2010) 647:51–61
123
invertebrates (Lancaster & Waldron, 2001). Between-
tissue differential nitrogen fractionations of the prey
must then influence their d15N. Indeed, McCutchan
et al. (2003) showed that fluid feeders have a lower,
negative, and very variable fractionation of 15N of
about -0.4 ± 0.57%.
Temporal and spatial variables
We observed significant differences between years in
the d15N signal of invertebrates collected in Lake St.
Pierre. Even when other variables (month, station,
and functional group) were controlled, organisms
collected in 2004 were nevertheless more enriched in15N than those collected in 2003. This difference can
be the consequence of the lower water discharge
observed in Lake St. Pierre in summer 2004 than in
summer 2003. Indeed, Hudon & Carignan (2008)
noted that lower discharges in Lake St. Pierre during
summer 2004 compared to 2003 coincided with
longer water transit times, greater N assimilation in
primary producers and thus lower inorganic N
concentrations. When inorganic N is limiting, less
discrimination against the heavier isotope occurs in
organisms (Peterson & Fry, 1987; Kendall, 1998).
Furthermore, low discharges create hydrological dead
zones favourable to denitrification which enriches
d15N of the remaining inorganic nitrogen pool (De
Brabandere et al., 2007).
Within years, month appeared to have a greater
importance in explaining d15N variability. Through
the summer, macroinvertebrates increased their d15N
signature by *3%. This augmentation, from May to
September, corresponds to the equivalent of one
trophic level when one-step enrichment is 3.4%(Vander Zanden & Rasmussen, 2001; Post, 2002).
This increase is dramatic even within a single
functional group (e.g., grazers, essentially epiphytic
algae feeding Gastropods) suggesting that the enrich-
ment takes place into the organic matter source itself
instead of being caused by a diet shift into the
consumer community. The most plausible explana-
tion of this summer progressive d15N increase is the
typical high macrophyte abundance during this part
of the year in Lake St. Pierre (Vis et al., 2007). Plant
growth (assimilation of inorganic N) combined with
dry summer months (lower nutrient input) causes a
progressive depletion of the NO3 pool, transforming
aquatic meadows into major NO3 sinks from June
until October (Hudon & Carignan, 2008). The 15N
enriched N assimilated by primary producers would
thus propagate along the food webs (Hogberg, 1990;
Peterson, 1999).
The invertebrates of the heavily agricultural south
shore (ADF, BSF) stations were characterized by
higher d15N signatures than those of the north shore
stations. Differences in N inputs and hydrology can
explain this tendency. Waters near the south shore
exhibit in the summer slower currents and stronger
inorganic N depletion than waters near the north
shore, because of the high density of aquatic macro-
phytes (Vis et al., 2007; Hudon & Carignan, 2008).
The most extreme example is the BSF station which
is located in a semi-closed wetland on the south shore
between the intensive agriculture impacted Yamaska
and St. Francois Rivers, responsible for NO3 con-
centrations reaching up to 1900 lg l-1 then dropping
to nearly 0 lg l-1 during summertime. Unsurpris-
ingly, the macroinvertebrates collected at this station
had consistently higher d15N than in any other station.
The d15N variations in macroinvertebrate consumers
of Lake St. Pierre appear to be intimately coupled to
N balance. Furthermore, strong temporal and spatial
variations of d15N in littoral macroinvertebrates
within the same site demonstrate the importance of
considering these variation factors in any sampling
design of littoral food webs in order to get an accurate
figure of the isotopic ratio of an organism.
Conclusion
Our results showed the influence of functional feeding
group on the d15N variability of littoral macroinver-
tebrates within and between trophic levels. According
to our results and previous studies on littoral food
webs, the generally accepted 3.4% enrichment value
per trophic level could not be taken as a general rule.
For aquatic invertebrate food webs, an average d15N
enrichment factor of 1.6% appears indeed more
realistic. We recommend better consideration of
temporal and spatial factors as well because of the
coupling of N inputs into aquatic meadows and d15N
variation in consumers. For example, in Lake St.
Pierre during our sampling period the d15N signatures
of invertebrates rose by about 0.6% per month, for a
total of 3% for the entire sampling period. Thus,
ignoring temporal and spatial variability in d15N
Hydrobiologia (2010) 647:51–61 59
123
studies in aquatic systems may induce a significant
error value in d15N signatures. A more detailed
approach backed with knowledge of invertebrate
feeding modes as well as temporal and spatial
characterization is critical to better assess food web
structures and energy fluxes in the littoral ecosystems.
Acknowledgments This study was supported by NSERC-
COMERN grants to F.C., D.P., and M.L. Scholarships from
Collectivite Territoriale de Corse, UQAM-FARE, and
GEOTOP were helpful to F.C. We thank Serge Paquet for
his help with statistics, as well as Agnieszka Adamowicz, Jean-
Francois Helie, and Jennifer McKay for stable isotopes
analysis. Finally, we are grateful to our field assistants
Catherine Bourdeau, Myrianne Joly, Renaud Manuguerra-
Gagne, Roxanne Rochon, and Annabelle Warren.
References
Allen, E. W., E. E. Prepas, S. Gabos, W. M. J. Strachan & W.
Zhang, 2005. Methyl mercury concentrations in macro-
invertebrate and fish from burned and undisturbed lakes
on the Boreal plain. Canadian Journal of Fisheries and
Aquatic Sciences 62: 1963–1977.
Anderson, C. & G. Cabana, 2005. d15N in riverine food webs:
effects of N inputs from agricultural watersheds. Canadian
Journal of Fisheries and Aquatic Sciences 62: 333–340.
Anderson, C. & G. Cabana, 2007. Estimating the trophic
position of aquatic consumers in river food webs using
stable nitrogen isotopes. Journal of the North American
Benthological Society 26: 273–285.
Cabana, G. & J. B. Rasmussen, 1994. Modelling food chain
structure and contaminant bioaccumulation using stable
nitrogen isotopes. Nature 372: 255–257.
Cattaneo, A., 1983. Grazing on epiphytes. Limnology and
Oceanography 28: 124–132.
Clarke, A. H., 1981. Les Mollusques d’eau douce du Canada.
Musee national des sciences naturelles. Musees nationaux
du Canada, Ottawa, Ontario.
Cleckner, L. B., P. J. Garrison, J. P. Hurley, M. L. Olson & D.
P. Krabbenhoft, 1998. Trophic transfer of methyl mercury
in the northern Florida Everglades. Biogeochemistry 40:
347–361.
Cremona, F., S. Hamelin, D. Planas & M. Lucotte. Sources of
organic matter and methylmercury in littoral macroin-
vertebrates: a stable isotope approach. Biogeochemistry
(in press).
Cremona, F., D. Planas & M. Lucotte, 2008a. Biomass and
composition of macroinvertebrate communities associated
with different types of macrophyte architectures and
habitats in a large fluvial lake. Fundamental and Applied
Limnology 171(2): 119–130.
Cremona, F., D. Planas & M. Lucotte, 2008b. Assessing the
importance of macroinvertebrate trophic dead-ends in the
lower transfer of methylmercury in littoral food webs.
Canadian Journal of Fisheries and Aquatic Sciences 65:
2043–2052.
Cummins, K. W., 1973. Trophic relations of aquatic insects.
Annual Review of Entomology 18: 183–205.
Cyr, H. & J. A. Downing, 1988. The abundance of phytoph-
ilous invertebrates on different species of submerged
macrophytes. Freshwater Biology 20: 364–374.
De Brabandere, L., T. K. Frazer & J. P. Montoya, 2007. Stable
nitrogen isotope ratios of macrophytes and associated
periphyton along a nitrate gradient in two subtropical,
spring-fed streams. Freshwater Biology 52: 1564–1575.
DeBruyn, A. M. H. & J. B. Rasmussen, 2002. Quantifying
assimilation of sewage-derived organic matter by riverine
benthos. Ecological Applications 12: 511–520.
Downing, J. A. & F. H. Rigler, 1984. A Manual of Methods for
the Assessment of Secondary Productivity in Fresh Waters.
Blackwell Scientific Publications, St-Louis, Missouri.
Hart, E. A. & J. R. Lovvorn, 2002. Interpreting stable isotopes
from macroinvertebrate foodwebs in saline wetlands.
Limnology and Oceanography 47: 580–584.
Herwig, B. R., D. H. Wahl, J. M. Dettmers & D. A. Soluk,
2007. Spatial and temporal patterns in the food web
structure of a large floodplain river assessed using stable
isotopes. Canadian Journal of Fisheries and Aquatic Sci-
ences 64: 495–508.
Hogberg, P., 1990. Forests losing large quantities of nitrogen
have elevated 15N:14N ratios. Oecologia 884: 229–231.
Hudon, C. & R. Carignan, 2008. Cumulative impacts of
hydrology and human activities on water quality in the St.
Lawrence River (Lake Saint-Pierre, Quebec, Canada).
Canadian Journal of Fisheries and Aquatic Sciences 65:
1165–1180.
Jardine, T. D., R. A. Curry, K. S. Heard & R. A. Cunjak, 2005.
High fidelity: isotopic relationship between stream
invertebrates and their gut contents. Journal of the North
American Benthological Society 24: 290–299.
Jean, M., G. Letourneau, C. Lavoie & F. Delisle, 2000. Les
milieux humides et les plantes exotiques en eau douce.
Bureau de coordination de Saint-Laurent Vision 2000,
Sainte-Foy, Quebec.
Kaehler, S. & E. A. Pakhomov, 2001. Effects of storage and
preservation on the d13C and d15N signatures of selected
marine organisms. Marine Ecology Progress Series 219:
299–304.
Kendall, C., 1998. Chapter 16: tracing nitrogen sources and
cycles in catchments. In Kendall, C. & J. J. McDonnell
(eds), Isotope Tracers in Catchment Hydrology. Elsevier,
Amsterdam.
Lancaster, J. & S. Waldron, 2001. Stable isotope values of lotic
invertebrates: sources of variation, experimental design,
and statistical interpretation. Limnology and Oceanogra-
phy 46: 723–730.
Le Louarn, H. & A. Cloarec, 1997. Insect predation on pike
fry. Journal of Fish Biology 50: 366–370.
Leavitt, P. R., C. S. Brock, C. Ebel & A. Patoine, 2006.
Landscape-scale effects of urban nitrogen on a chain of
freshwater lakes in central North America. Limnology and
Oceanography 51: 2262–2277.
Martinelli, L. A., M. C. Piccolo, A. R. Townsend, P. M.
Vitousek, E. Cuevas, W. McDowell, G. P. Robertson, O.
C. Santos & K. Treseder, 1999. Nitrogen stable isotopic
composition of leaves and soil: tropical vs. temperate
forests. Biogeochemistry 46: 45–65.
60 Hydrobiologia (2010) 647:51–61
123
McCutchan Jr., J. H., W. M. Lewis Jr, C. Kendall & C. C.
McGrath, 2003. Variation in trophic shift for stable iso-
tope ratios of carbon, nitrogen, and sulfur. Oikos 102:
378–390.
Merritt, R. W. & K. W. Cummins (eds), 1996. An Introduction
to the Aquatic Insects of North America, 3rd ed. Kendall/
Hunt Publishing Company, Dubuque, Iowa.
Miller, T. W., 2000. Tissue-specific response in d15N in adult
Pacific herring (Clupea pallasi) following an isotopic shift
in diet. Environmental Biology of the Fishes 76: 177–189.
Minagawa, M. & E. Wada, 1984. Stepwise enrichment of d15N
along food chains: further evidence and the relation
between d15N and age. Geochimica and Cosmochimica
Acta 48: 1135–1140.
Minshall, G. W., 1984. Chapter 12: aquatic insect-substratum
relationships. In Resh, V. H. & D. M. Rosenberg (eds),
The Ecology of Aquatic Insects. Praeger Publishers, New
York: 358–400.
Pennak, R. W., 1953. Fresh-water Invertebrates of the United
States. The Ronald Press Company, New York.
Peterson, B. J., 1999. Stable isotopes as tracers of organic
matter input and transfer in benthic food webs: a review.
Acta Oecologica 20: 479–487.
Peterson, B. J. & B. Fry, 1987. Stable isotopes in ecosystem
studies. Annual Review of Ecology and Systematics 18:
293–320.
Ponsard, S. & M. Amlou, 1999. Effects of several preservation
methods on the isotopic content of Drosophila samples.
Comptes rendus de l’academie des sciences 322: 35–41.
Ponsard, S. & R. Arditi, 2000. What can stable isotopes (d15N
and d13C) tell about the food web of soil macro-inverte-
brates? Ecology 81: 852–864.
Post, D. M., 2002. Using stable isotopes to estimate trophic
position: models, methods, and assumptions. Ecology 83:
703–718.
Power, R., K. R. R. A. Guiguer & D. R. Barton, 2003. Effects
of temperature on isotopic enrichment in Daphnia magna:
implications for aquatic food-web studies. Rapid Com-
munications in Mass Spectrometry 17: 1619–1625.
Proctor, H. & G. Pritchard, 1989. Neglected predators: water
mites (Acari:Parasitengona:Hydrachnellae) in freshwater
communities. Journal of the North American Bentholog-
ical Society 8: 100–111.
SAS Institute Inc., 1991. SAS� System for Linear Models, 3rd
ed. SAS Institute Inc., Cary, North-Carolina.
Schindler, D. E., 2002. Habitat coupling in lake ecosystems.
Oikos 98: 177–189.
Strayer, D. L., 1985. The benthic micrometazoans of Mirror
Lake, New Hampshire. Archiv fur Hydrobiologie
72(Suppl): 287–426.
Tate, A. W. & A. E. Hershey, 2003. Selective feeding by larval
dytiscids (Coleoptera:Dytiscidae) and effects of fish pre-
dation on upper littoral zone macroinvertebrate commu-
nities of arctic lakes. Hydrobiologia 497: 13–23.
Uryu, Y., O. Malm, I. Thorntorn, I. Payne & D. Cleary, 2001.
Mercury contamination of fish and its implications for
other wildlife of the Tapajos Basin, Brazilian Amazon.
Conservation Biology 15: 438–446.
Vadeboncoeur, Y., J. Vander Zanden & D. M. Lodge, 2002.
Putting the lake back together: reintegrating benthic path-
ways into lake food web models. BioScience 52: 44–54.
Van Dover, C. L., J. F. Grassle, B. Fry, R. H. Garrit & V. R.
Starczak, 1992. Stable isotope evidence for entry of
sewage-derived organic material into a deep-sea food
web. Nature (London) 360: 153–155.
Vander Zanden, J. & J. B. Rasmussen, 2001. Variation in d15N
and d13C trophic fractionation: implications for aquatic
food web studies. Limnology and Oceanography 46:
2061–2066.
Vander Zanden, M. J., S. Chandra, S.-G. Park, Y. Vade-
boncoeur & C. R. Goldman, 2006. Efficiencies of benthic
and pelagic pathways in a subalpine lake. Canadian
Journal of Fisheries and Aquatic Sciences 63: 2608–2620.
Vanderklift, M. A. & S. Ponsard, 2003. Sources of variation in
consumer-diet d15N enrichment: a meta-analysis. Oeco-
logia 136: 169–182.
Vannote, R. L., G. W. Minshall, K. W. Cummins, J. R. Sedell
& C. E. Cushing, 1980. The river continuum concept.
Canadian Journal of Fisheries and Aquatic Sciences 37:
130–137.
Verardo, D. J., P. N. Froelich & A. McIntyre, 1990. Deter-
mination of organic carbon and nitrogen in marine sedi-
ments using the Carlo-Erba 1500 Analyzer. Deep-Sea
Research, Part A, Oceanographic Research Papers 37:
157–165.
Vis, C., 2004. Importance relative des producteurs primaires sur
la production globale du lac Saint-Pierre, un grand lac flu-
vial du Saint-Laurent. Ph.D. thesis, Universite de Montreal,
Faculte des etudes superieures, Montreal, Quebec.
Vis, C., C. Hudon & R. Carignan, 2003. An evaluation of
approaches used to determine the distribution and biomass
of emergent and submerged aquatic macrophytes over
large spatial scales. Aquatic Botany 77: 187–201.
Vis, C., C. Hudon & R. Carignan, 2006. Influence of the ver-
tical structure of macrophyte stands on epiphyte com-
munity metabolism. Canadian Journal of Fisheries and
Aquatic Sciences 63: 1014–1026.
Vis, C., C. Hudon, R. Carignan & P. Gagnon, 2007. Spatial
analysis of production by macrophytes, phytoplankton and
epiphyton in a large river system under different water-
level conditions. Ecosystems 10: 293–310.
Walter, J. K., R. E. Bilby & B. R. Fransen, 2006. Effects of
Pacific salmon spawning and carcass availability on the
caddisfly Ecclisomyia conspersa (Trichoptera: Limne-
philidae). Freshwater Biology 51: 1211–1218.
Webb, S. C., R. E. M. Hedges & S. J. Simpson, 1998. Diet
quality influences the d13C and d15N of locusts and their
biochemical components. The Journal of Experimental
Biology 201: 2903–2911.
Yoshioka, T., E. Wada & H. Hayashi, 1994. A stable isotope
study on seasonal food web dynamics in a eutrophic lake.
Ecology 75: 835–846.
Zah, R., P. Burgherr, S. M. Bernasconi & U. Uehlinger, 2001.
Stable isotope analysis of macroinvertebrates and their
food sources in a glacier stream. Freshwater Biology 46:
871–882.
Hydrobiologia (2010) 647:51–61 61
123
Related Documents