Indian Journal of Experimental Biology Vol. 52, July 2014, pp. 728-738 Influence of environmental hypertonicity on the induction of ureogenesis and amino acid metabolism in air-breathing walking catfish (Clarias batrachus, Bloch) Bodhisattwa Banerjee, Gitalee Bhuyan & Nirmalendu Saha* Biochemical Adaptation Lab., Department of Zoology, North-Eastern Hill University, Shillong 793 022, India Received 11 November 2013; revised 28 April 2014 Effect of environmental hypertonicity, due to exposure to 300 mM mannitol solution for 7 days, on the induction of ureogenesis and also on amino acid metabolism was studied in the air-breathing walking catfish, C. batrachus, which is already known to have the capacity to face the problem of osmolarity stress in addition to other environmental stresses in its natural habitats. Exposure to hypertonic mannitol solution led to reduction of ammonia excretion rate by about 2-fold with a concomitant increase of urea-N excretion rate by about 2-fold. This was accompanied by significant increase in the levels of both ammonia and urea in different tissues and also in plasma. Further, the environmental hypertonicity also led to significant accumulation of different non-essential free amino acids (FAAs) and to some extent the essential FAAs, thereby causing a total increase of non-essential FAA pool by 2-3-fold and essential FAA pool by 1.5-2.0-fold in most of the tissues studied including the plasma. The activities of three ornithine-urea cycle (OUC) enzymes such as carbamoyl phosphate synthetase, argininosuccinate synthetase and argininosuccinate lyase in liver and kidney tissues, and four key amino acid metabolism-related enzymes such as glutamine synthetase, glutamate dehydrogenase (reductive amination), alanine aminotransaminase and aspartate aminotransaminase were also significantly up-regulated in different tissues of the fish while exposing to hypertonic environment. Thus, more accumulation and excretion of urea-N observed during hypertonic exposure were probably associated with the induction of ureogenesis through the induced OUC, and the increase of amino acid pool was probably mainly associated with the up-regulation of amino acid synthesizing machineries in this catfish in hypertonic environment. These might have helped the walking catfish in defending the osmotic stress and to acclimatize better under hypertonic environment, which is very much uncommon among freshwater teleosts. Keywords: Amino acid metabolism, Ammonia, Clarias batrachus, Environmental hypertonicity, Mannitol, Ornithine-urea cycle, Urea, Walking catfish The air-breathing walking catfish (Clarias batrachus, Bloch), found predominantly in tropical Southeast Asia, is reported to be more resistant to various environmental challenges such as high environmental ammonia, hypoxic and desiccation stresses 1,2 . Further, it is reported to be euryhaline, inhabiting fresh and brackish waters as well as muddy marshes, thus facing wide variations of external osmolarity changes 3 ; it frequently encounters the problem of osmolarity changes in the same habitat during different seasons of the year, especially in summer when the ponds and lakes dry up, thus compelling this fish to migrate inside the mud peat to avoid total dehydration, and during the monsoon season due to rainfall the water in the same habitat gets diluted. Several unique physiological and biochemical adaptations have already been reported in this air- breathing catfish with relation to nitrogen, carbohydrate and protein metabolism. These include the presence of a unique functional and regulatory ornithine-urea cycle (OUC) with the capacity of induction of ureogenesis during hyper-ammonia and desiccation stresses 4–8 . It has recently been demonstrated that the cell volume changes due to osmotic stress can affect the glycogenesis, glycogenolysis 9 and gluconeogenesis 10 , hexose monophosphate pathway 11 , autophagic proteolysis 12 and also protein synthesis 13 in the perfused liver of this air-breathing catfish. More recently, it has been reported that the walking catfish can survive up to 300 mM mannitol under the laboratory conditions for months without having any mortality, and in situ exposure to higher environmental salinity causes induction of gluconeogenesis 14 . However, no information is available on how the air-breathing —————— *Correspondent author Telephone: +91 364 27722322 (Off); +91 9436100836 (M) Fax: +91 364 2550076 E-mail: [email protected]; [email protected]

Welcome message from author
This document is posted to help you gain knowledge. Please leave a comment to let me know what you think about it! Share it to your friends and learn new things together.
Transcript
Indian Journal of Experimental Biology
Vol. 52, July 2014, pp. 728-738
Influence of environmental hypertonicity on the induction of ureogenesis
and amino acid metabolism in air-breathing walking catfish
(Clarias batrachus, Bloch)
Bodhisattwa Banerjee, Gitalee Bhuyan & Nirmalendu Saha*
Biochemical Adaptation Lab., Department of Zoology, North-Eastern Hill University, Shillong 793 022, India
Received 11 November 2013; revised 28 April 2014
Effect of environmental hypertonicity, due to exposure to 300 mM mannitol solution for 7 days, on the induction of
ureogenesis and also on amino acid metabolism was studied in the air-breathing walking catfish, C. batrachus, which is
already known to have the capacity to face the problem of osmolarity stress in addition to other environmental stresses in its
natural habitats. Exposure to hypertonic mannitol solution led to reduction of ammonia excretion rate by about 2-fold with a
concomitant increase of urea-N excretion rate by about 2-fold. This was accompanied by significant increase in the levels of
both ammonia and urea in different tissues and also in plasma. Further, the environmental hypertonicity also led to
significant accumulation of different non-essential free amino acids (FAAs) and to some extent the essential FAAs, thereby
causing a total increase of non-essential FAA pool by 2-3-fold and essential FAA pool by 1.5-2.0-fold in most of the tissues
studied including the plasma. The activities of three ornithine-urea cycle (OUC) enzymes such as carbamoyl phosphate
synthetase, argininosuccinate synthetase and argininosuccinate lyase in liver and kidney tissues, and four key amino acid
metabolism-related enzymes such as glutamine synthetase, glutamate dehydrogenase (reductive amination), alanine
aminotransaminase and aspartate aminotransaminase were also significantly up-regulated in different tissues of the fish
while exposing to hypertonic environment. Thus, more accumulation and excretion of urea-N observed during hypertonic
exposure were probably associated with the induction of ureogenesis through the induced OUC, and the increase of amino
acid pool was probably mainly associated with the up-regulation of amino acid synthesizing machineries in this catfish in
hypertonic environment. These might have helped the walking catfish in defending the osmotic stress and to acclimatize
better under hypertonic environment, which is very much uncommon among freshwater teleosts.
Keywords: Amino acid metabolism, Ammonia, Clarias batrachus, Environmental hypertonicity, Mannitol, Ornithine-urea
cycle, Urea, Walking catfish
The air-breathing walking catfish (Clarias batrachus, Bloch), found predominantly in tropical Southeast Asia, is reported to be more resistant to various environmental challenges such as high environmental ammonia, hypoxic and desiccation stresses
1,2. Further,
it is reported to be euryhaline, inhabiting fresh and brackish waters as well as muddy marshes, thus facing wide variations of external osmolarity changes
3; it frequently encounters the problem of
osmolarity changes in the same habitat during different seasons of the year, especially in summer when the ponds and lakes dry up, thus compelling this fish to migrate inside the mud peat to avoid total dehydration, and during the monsoon season due to rainfall the water in the same habitat gets diluted.
Several unique physiological and biochemical adaptations have already been reported in this air-breathing catfish with relation to nitrogen, carbohydrate and protein metabolism. These include the presence of a unique functional and regulatory ornithine-urea cycle (OUC) with the capacity of induction of ureogenesis during hyper-ammonia and desiccation stresses
4–8. It has recently been
demonstrated that the cell volume changes due to osmotic stress can affect the glycogenesis, glycogenolysis
9 and gluconeogenesis
10, hexose
monophosphate pathway11
, autophagic proteolysis12
and also protein synthesis
13 in the perfused liver of
this air-breathing catfish. More recently, it has been reported that the walking catfish can survive up to 300 mM mannitol under the laboratory conditions for months without having any mortality, and in situ exposure to higher environmental salinity causes induction of gluconeogenesis
14. However, no
information is available on how the air-breathing
——————
*Correspondent author
Telephone: +91 364 27722322 (Off); +91 9436100836 (M)
Fax: +91 364 2550076
E-mail: [email protected]; [email protected]

BANERJEE et al.: INFLUENCE OF ENVIRONMENTAL HYPERTONICITY
729
catfish osmoregulate during exposure to hypertonic environment. Thus, looking at its enormous capacity in challenging the external osmolarity changes, the present study has been undertaken to elucidate the possible induction of ureogenesis with an intension to synthesize and accumulate more urea as an osmolyte, and also the possible changes of amino acid pool by changing the activities of certain key amino acid metabolism-related enzymes in the walking catfish during exposure to hypertonic environment of 300 mM mannitol (equivalent to 300 mOsmol L
-1)
for 7 days.
Materials and Methods
Chemicals―Enzymes, co-enzymes, substrates
and mixture of physiological FAA standard, and
OPA were purchased from Sigma Chemicals
(St. Louis, USA). Other chemicals were of
analytical grades and obtained from local sources.
Deionized double distilled water was used in
all preparations.
Experimental animals―C. batrachus,
weighing 150±15 g body mass) were purchased from
a single source that are bred and cultured in
selected commercial ponds. Fish were acclimatized
in the laboratory approximately for 1 month at
28±2 ºC with 12 h:12 h light and dark photoperiods
before experiments when food consumption
became normal. No sex differentiation of the fish
was done while performing these studies. Minced
dry fish and rice bran (5% of body wt) were given
as food every day, and the water, collected
from a natural stream, was changed on alternate
days. Food was withdrawn 24 h prior to
experiments.
Experimental set up―Ten fishes (pre-weighed)
were placed individually in plastic buckets containing
2 L of 300 mM mannitol solution prepared in
bacteria-free filtered stream water (pH 7.10 ± 0.05)
for 7 days. Another 10 fishes were kept individually
in plastic buckets containing 2 L of bacteria-free
filtered stream water (pH 7.02±0.06) for 7 days and
served as controls. Both the mannitol solution and
water from each bucket were replaced with a fresh
medium every day at a fixed time after collecting
some samples from each bucket for analysis of
ammonia and urea concentrations. After 3 and 7 days,
five fish each from control and treated buckets were
anesthetized in neutralized 3-aminobenzoic acid ethyl
ester (MS-222, 0.2 g L-1
) for 5 min, blood samples
were collected from the caudal vasculature with a
heparinized syringe, tissues such as liver, kidney,
muscle and brain were dissected out, plunged
into liquid nitrogen and stored at -80 oC. Blood
collected from each fish was centrifuged at 10,000 g
for 10 min, and plasma were processed4 for further
analysis. All analyses were completed within 2 weeks
of collecting the tissues.
Analyses of ammonia, urea-N and free amino acids
(FAAs)―Amounts of ammonia and urea-N excreted
by both control and mannitol-treated fish were
measured enzymatically15
. Ammonia and urea-N
concentrations in different tissues and in blood plasma
were also measured by the same enzymatic methods
after processing the tissue as described by Saha
and Ratha4.
The concentrations of different physiological free
amino acids (FAAs) in tissues and plasma were
analyzed in a Shimadzu HPLC (Model LC 20AD)
with a post-column derivatization method using o-
phthaldehyde (OPA) reagent as a fluorescent dye
following the method of Fujiwara et al.16
with certain
modifications as detailed in Saha et al17
. In brief, a
strong cation-exchange column (Shim-Pack ISC –07
Li, 10 cm long) was used for separation of FAAs. The
detector (Shimadzu RF-535 fluorescent detector) was
set at an excitation of 365 nm and an emission of 455
nm, and coupled to a data integrator (Shimadzu
CR6A) for quantification of the eluted peak areas.
The eluting mobile phase was a gradient of buffer A
(0.16 N lithium citrate containing 7% methyl
cellusolve, pH 2.5) and buffer B (0.32 N lithium
citrate containing 0.62% of boric acid, pH 10.0),
starting with 100% mobile phase A; the flow rate was
0.4 mL min at 0 to 53 min, followed by 0.3 mL/min
until the end of the run; the column temperature was
40 ºC at 0-40 min, and 50 ºC thereafter to 240 min. In
the first 40 min the linear gradient progressed to 4%
mobile phase B, followed by a linear increase to 10%
in 93 min, 30% in 106.7 min, changed to 40% in
106.7 min and was held there until 123 min. The
gradient was then increased linearly to 53% mobile
phase B in 135 min and held there until 170 min, and
finally increased linearly to 100% mobile phase B
from 170 to 190 min and held there until 240 min.
Hypochloride reagent for on-line oxidation was
prepared by adding 0.4 mL of the commercial sodium
hypochlorite solution to 1000 mL of the buffer
solution (pH 10) containing sodium carbonate (0.384
M), boric acid (0.216 M) and potassium sulphate
(0.108 M). The fluorescence reagent was prepared by
INDIAN J EXP BIOL, JULY 2014
730
adding 2.0 g OPA (dissolved in 1 mL of ethanol),
4 mL of 10% aqueous Brij 35, and 2 mL
2-mercaptoethanol to 980 mL of the above alkaline
buffer.
Extraction procedure―For the assay of enzymes,
a 10% homogenate (w/v) of different tissues was
prepared in a homogenizing buffer containing 100 mM
Tris-HCl buffer (pH 7.5), 50 mM KCl, 1 mM ethylene
diamine tetra acetic acid (EDTA), 1 mM dithiothreitol
(DTT) and a cocktail of protease inhibitor (Roche,
Germany) using a motor-driven Potter-Elvehjem glass
homogenizer with a Teflon pestle. The homogenate
was treated with 0.5% Triton X-100 in 1:1 ratio for
30 min. The homogenate was then subjected to mild
sonication for proper breakage of mitochondria and
centrifuged at 10,000 g for 10 min. The supernatant
was used for assaying the enzymes. All steps were
carried out at 4 oC.
For the analysis of FAAs, a 10% homogenate (w/v)
of different tissues was prepared in HPLC grade
water17
. Proteins were immediately precipitated out
from the homogenate by adding 2 M perchloric acid
(PCA) in 1:1 ratio, followed by centrifugation at
10,000 g for 10 min. The plasma was also treated with
2 M PCA in a 1:1 ratio to precipitate out the proteins,
and further processed as above. All these steps were
performed at 4 ºC. The pH of the resultant supernatant
was adjusted to 2.2 by adding a known volume of
0.4 N Li-hydroxide. The supernatant was passed
through a Millipore micro filter (0.45 µM pore size)
before analysis.
Enzyme assay―The enzymes of OUC, viz.,
carbamoyl phosphate synthetase (CPS), ornithine
transcarbamylase (OTC), argininosuccinate synthetase
(ASS), argininosuccinate lyase (ASL), and arginase
(ARG) were assayed following the method described by
Saha et al18
. However, for the assay of OUC-related
CPS activity, 1 mM of uridine-5'-triphosphate (UTP)
was also added in the reaction mixture to inhibit the
pyrimidine synthesis-related CPS II activity19
. It should
be noted that the assay method used here for CPS
activity does not distinguish between the two different
forms of urea synthesis-related enzymes namely CPS I
(ammonia- and N-acetyl-L-glutamate-dependent,
mitochondrial) and CPS III (glutamine- and N-acetyl-L-
glutamate-dependent, mitochondrial). The reaction for
all the enzymes was stopped by adding 0.5 mL of 10%
perchloric acid mL-1
of reaction mixture after a specific
time of reaction, followed by centrifugation to
precipitate out the proteins. Citrulline formed in the
case of CPS and OTC, citrulline used in the case of
ASS, and urea formed in the case of ASL and ARG
were measured spectrophotometrically (Varian, Cary
50) in the supernatant20
and expressed as enzyme
activity. All the enzyme assays were carried out at
30 oC. One unit of enzyme activity was defined as that
amount that catalyzed 1 µmole of product formed or
substrate used h-1 at 30
oC.
Glutamate dehydrogenase (GDH, both reductive
amination and oxidative deamination) activity was
assayed following the method of Olson and
Anfinsen21
with modifications of substrate (optimal)
concentrations17
. The alanine aminotransaminase
(ALT) and aspartate aminotransaminase (AST)
activities were assayed following the method of
Foster and Moon22
with modifications in substrate
(optimal) concentration17
. All these enzymes were
assayed at 30 oC in a UV-visible spectrophotometer
fitted with a peltier temperature-controlled unit
(Varian, Cary 50) at 340 nm (Em M340 = 6.22).
Enzyme activities were expressed as units g-1
wet wt
of tissue and corrected for any non-specific activity in
the absence of substrate. One unit of enzyme activity
was expressed as that amount which oxidized 1 µmole
of NADH or reduced 1 µmole of NAD+ h
-1 at 30
oC.
Glutamine synthetase (GS) was assayed by the γ-
glutamyl transferase reaction as described by Webb
and Brown23
. One unit of GS activity was expressed
as that amount which catalyzed the formation of
1 µmole of γ-glutamyl hydroxamate h-1 at 30
oC.
Blood sampling and osmolarity measurement―The
blood from each fish was collected with a heparinized
syringe from the caudal vein and centrifuged at 10,000 g
for 10 min at 0±2 °C for separating out the plasma from
blood cells and the plasma osmolarity was measured
with a Camlab (Model 200) osmometer using the
freezing point depression method.
Analysis of water content in different tissues―The
water content in cells of different tissues of both
control and mannitol–treated fish was determined by
oven drying method following Goswami and Saha9.
Statistical analyses―The data collected from
different replicates, were statistically analyzed and
presented as mean±SE. Student’s t-test, followed by
multiple comparisons of means by Student-Newman-
Keuls Multiple Range Test was performed to evaluate
differences between means where applicable.
Differences with P<0.05 were regarded as statistically
significant.
BANERJEE et al.: INFLUENCE OF ENVIRONMENTAL HYPERTONICITY
731
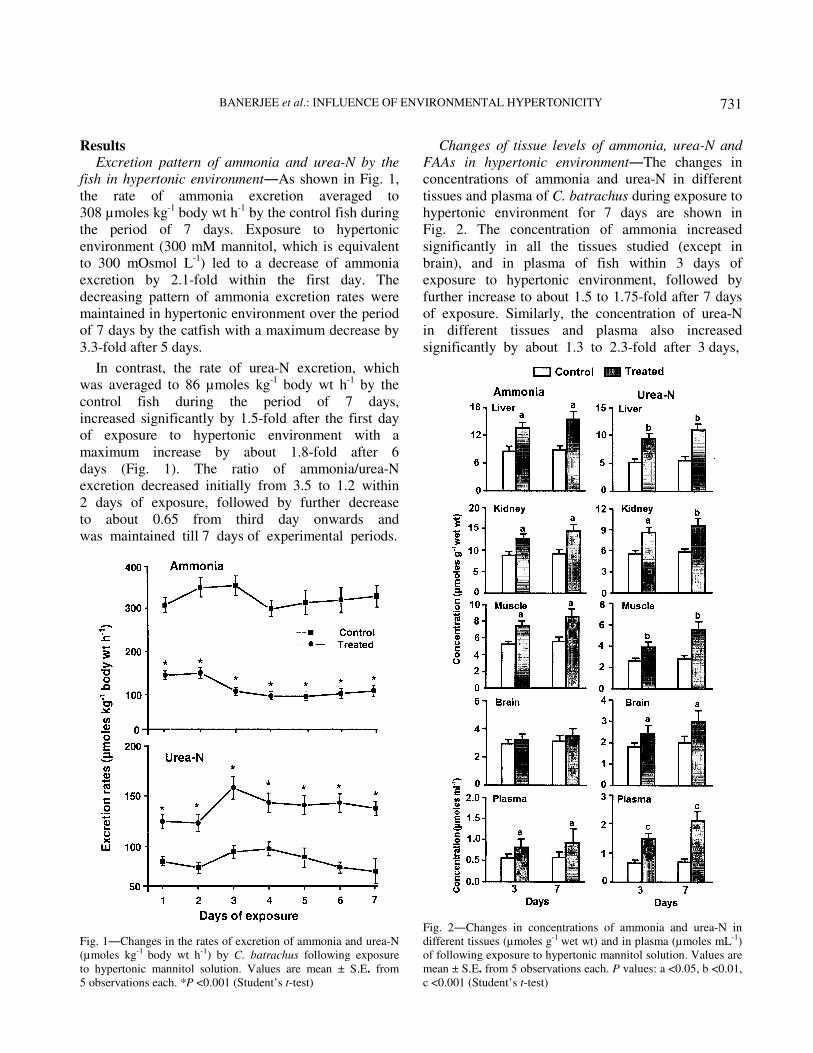
Results Excretion pattern of ammonia and urea-N by the
fish in hypertonic environment―As shown in Fig. 1,
the rate of ammonia excretion averaged to
308 µmoles kg-1 body wt h
-1 by the control fish during
the period of 7 days. Exposure to hypertonic
environment (300 mM mannitol, which is equivalent
to 300 mOsmol L-1
) led to a decrease of ammonia
excretion by 2.1-fold within the first day. The
decreasing pattern of ammonia excretion rates were
maintained in hypertonic environment over the period
of 7 days by the catfish with a maximum decrease by
3.3-fold after 5 days.
In contrast, the rate of urea-N excretion, which
was averaged to 86 µmoles kg-1
body wt h-1 by the
control fish during the period of 7 days,
increased significantly by 1.5-fold after the first day
of exposure to hypertonic environment with a
maximum increase by about 1.8-fold after 6
days (Fig. 1). The ratio of ammonia/urea-N
excretion decreased initially from 3.5 to 1.2 within
2 days of exposure, followed by further decrease
to about 0.65 from third day onwards and
was maintained till 7 days of experimental periods.
Changes of tissue levels of ammonia, urea-N and
FAAs in hypertonic environment―The changes in
concentrations of ammonia and urea-N in different
tissues and plasma of C. batrachus during exposure to
hypertonic environment for 7 days are shown in
Fig. 2. The concentration of ammonia increased
significantly in all the tissues studied (except in
brain), and in plasma of fish within 3 days of
exposure to hypertonic environment, followed by
further increase to about 1.5 to 1.75-fold after 7 days
of exposure. Similarly, the concentration of urea-N
in different tissues and plasma also increased
significantly by about 1.3 to 2.3-fold after 3 days,
Fig. 2―Changes in concentrations of ammonia and urea-N in
different tissues (µmoles g-1 wet wt) and in plasma (µmoles mL-1)
of following exposure to hypertonic mannitol solution. Values are
mean ± S.E. from 5 observations each. P values: a <0.05, b <0.01,
c <0.001 (Student’s t-test)
Fig. 1―Changes in the rates of excretion of ammonia and urea-N
(µmoles kg-1 body wt h-1) by C. batrachus following exposure
to hypertonic mannitol solution. Values are mean ± S.E. from
5 observations each. *P <0.001 (Student’s t-test)
INDIAN J EXP BIOL, JULY 2014
732
followed by further increase by 1.5 to 3.1-fold after 7
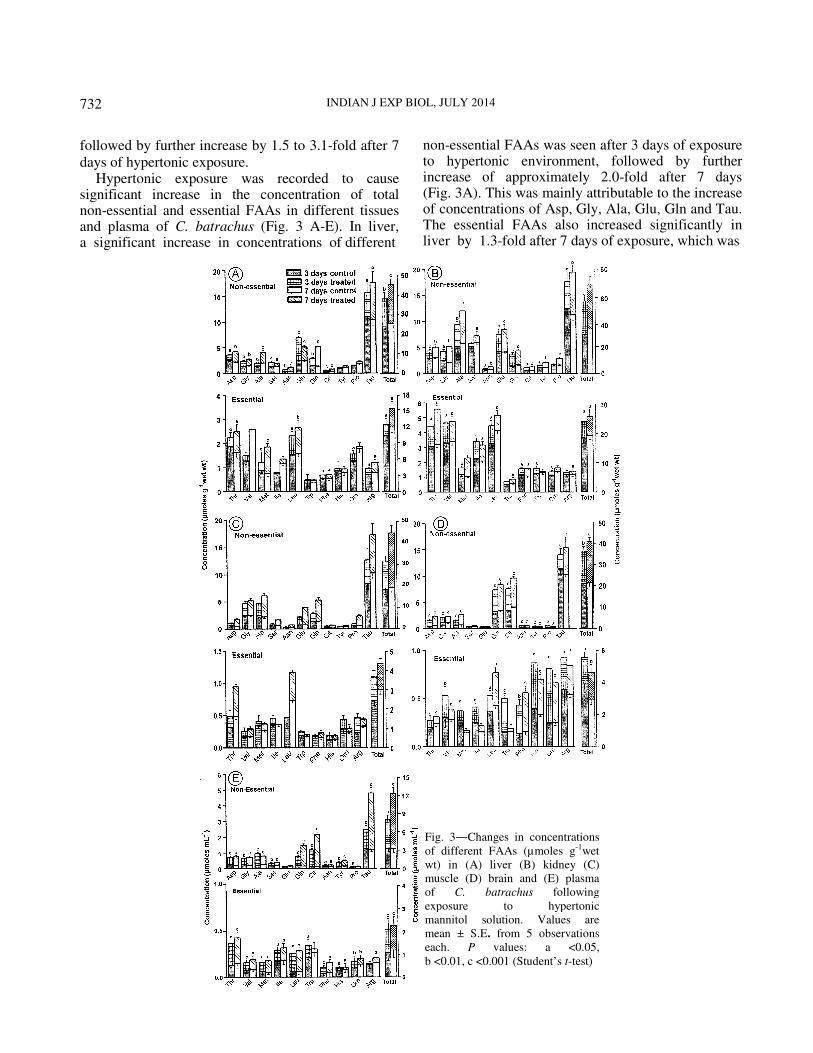
days of hypertonic exposure. Hypertonic exposure was recorded to cause
significant increase in the concentration of total non-essential and essential FAAs in different tissues and plasma of C. batrachus (Fig. 3 A-E). In liver, a significant increase in concentrations of different
non-essential FAAs was seen after 3 days of exposure to hypertonic environment, followed by further increase of approximately 2.0-fold after 7 days (Fig. 3A). This was mainly attributable to the increase of concentrations of Asp, Gly, Ala, Glu, Gln and Tau. The essential FAAs also increased significantly in liver by 1.3-fold after 7 days of exposure, which was
Fig. 3―Changes in concentrations
of different FAAs (µmoles g-1wet
wt) in (A) liver (B) kidney (C)
muscle (D) brain and (E) plasma
of C. batrachus following
exposure to hypertonic
mannitol solution. Values are
mean ± S.E. from 5 observations
each. P values: a <0.05,
b <0.01, c <0.001 (Student’s t-test)
BANERJEE et al.: INFLUENCE OF ENVIRONMENTAL HYPERTONICITY
733
mainly attributable to the increase of Thr, Mat, Leu and Arg.
In kidney, the concentration of total non-essential
FAAs increased significantly by 1.75-fold after 3 days
and by 1.9-fold after 7 days of exposure, which was
mainly attributable to the increase of Asp, Ala and
Glu, Gly and Gln (Fig. 3B). The essential FAAs also
significantly increased by 1.5-fold within 3 days of
exposure but with not much of changes after 7 days.
In muscle, the concentration of total non-essential
FAAs increased by 1.75-fold after 3 days and by
2.3-fold after 7 days of exposure (Fig. 3C). It was
mainly due to increase of Asp, Gly, Ala, Glu, Gln, Pro
and Tau. The essential FAAs also increased significantly
by 1.50-fold after 7 days of exposure, which was mainly
attributable to the increase of Thr, Val, Met and Phe.
In brain, the total non-essential FAAs
concentration significantly increased by 1.7-fold
after 3 days with a further increase by 1.90-fold after
7 days of hypertonic exposure, which was mainly
attributable to the increase of Asp, Gly, Glu, Tau and
Gln (Fig. 3D). Likewise, the levels of essential FAAs
also increased by 1.95-fold after 3 days of exposure
with no further changes after 7 days.
A significant increase in the concentration of total
non-essential FAAs was also seen in plasma by 2.6-
and 3.9-fold after 3 and 7 days of exposure to
hypertonic exposure, respectively (Fig. 3E). This was
mainly attributable to the increase of Asp and Gly,
Ala, Glu, Gln and Tau. The levels of essential FAAs
also increased significantly by 1.90-fold after 3 days
with no further changes after 7 days.
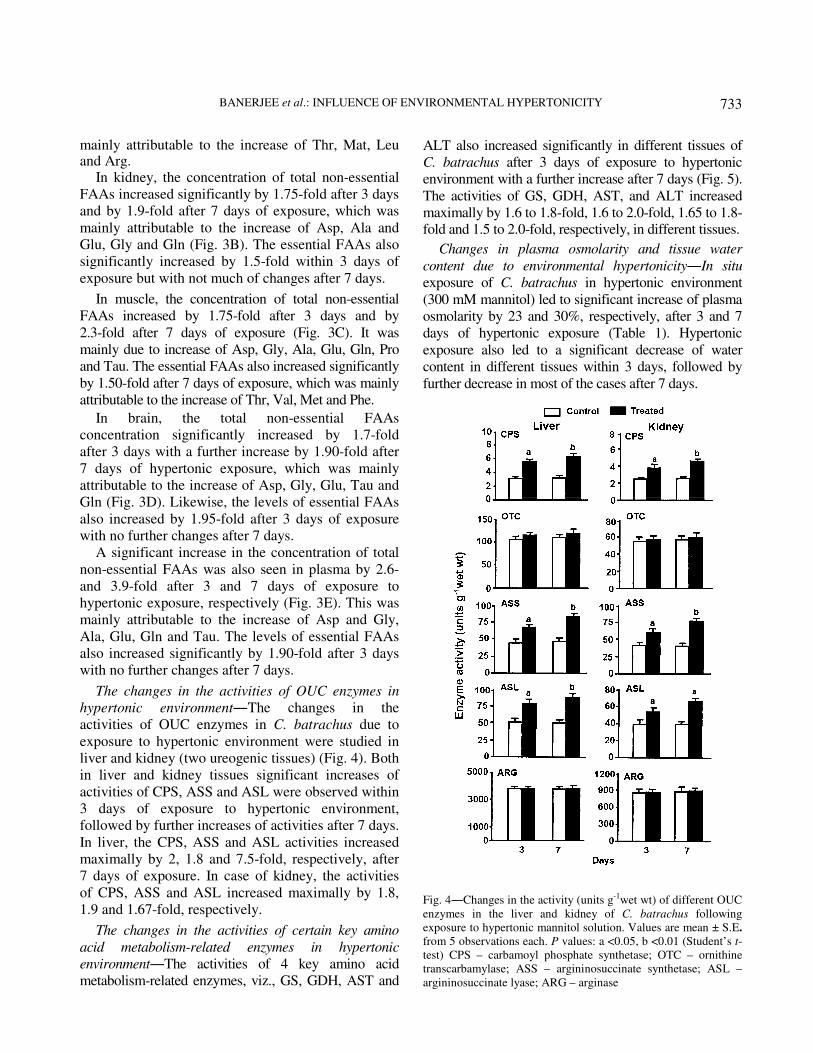
The changes in the activities of OUC enzymes in
hypertonic environment―The changes in the
activities of OUC enzymes in C. batrachus due to
exposure to hypertonic environment were studied in
liver and kidney (two ureogenic tissues) (Fig. 4). Both
in liver and kidney tissues significant increases of
activities of CPS, ASS and ASL were observed within
3 days of exposure to hypertonic environment,
followed by further increases of activities after 7 days.
In liver, the CPS, ASS and ASL activities increased
maximally by 2, 1.8 and 7.5-fold, respectively, after
7 days of exposure. In case of kidney, the activities
of CPS, ASS and ASL increased maximally by 1.8,
1.9 and 1.67-fold, respectively.
The changes in the activities of certain key amino
acid metabolism-related enzymes in hypertonic
environment―The activities of 4 key amino acid
metabolism-related enzymes, viz., GS, GDH, AST and
ALT also increased significantly in different tissues of
C. batrachus after 3 days of exposure to hypertonic
environment with a further increase after 7 days (Fig. 5).
The activities of GS, GDH, AST, and ALT increased
maximally by 1.6 to 1.8-fold, 1.6 to 2.0-fold, 1.65 to 1.8-fold and 1.5 to 2.0-fold, respectively, in different tissues.
Changes in plasma osmolarity and tissue water
content due to environmental hypertonicity―In situ
exposure of C. batrachus in hypertonic environment
(300 mM mannitol) led to significant increase of plasma
osmolarity by 23 and 30%, respectively, after 3 and 7
days of hypertonic exposure (Table 1). Hypertonic
exposure also led to a significant decrease of water
content in different tissues within 3 days, followed by
further decrease in most of the cases after 7 days.
Fig. 4―Changes in the activity (units g-1wet wt) of different OUC
enzymes in the liver and kidney of C. batrachus following
exposure to hypertonic mannitol solution. Values are mean ± S.E.
from 5 observations each. P values: a <0.05, b <0.01 (Student’s t-
test) CPS – carbamoyl phosphate synthetase; OTC – ornithine
transcarbamylase; ASS – argininosuccinate synthetase; ASL –
argininosuccinate lyase; ARG – arginase

INDIAN J EXP BIOL, JULY 2014
734
Discussion The role of urea for osmoregulation is well
established in marine elasmobranchs24
, and to certain
extents in marine teleosts25
. The crab-eating frog
(Rana cancrivora), which is one of only a handful
amphibians worldwide that tolerate saline waters, is
also reported to synthesize and retain urea inside the
body by up-regulating the hepatic urea synthetic
capacity in hypertonic saline environment26
.
However, till date no report is available on the role of
urea for osmoregulation in freshwater teleosts and
more specifically in air-breathing teleosts especially
when they are submerged in brackish or saline waters.
As reported recently, the C. batrachus has a capacity
to acclimatize well in high environmental salinity14
. In
the present study, when C. batrachus was exposed to
hypertonic environment (300 mM mannitol), the
ammonia excretion rate reduced to half with a
concomitant increase of urea-N excretion rate by
2-fold, thus causing a reduction in the ammonia:urea-
N excretion rate from 3.5 to 0.65. The initial decrease
of ammonia excretion in this fish was accompanied
by the increase in concentrations of ammonia in
different tissues. However, the toxic ammonia was not
allowed to accumulate in body tissues to a lethal
concentration in fish exposed to hypertonic
environment possibly due to possessing various
biochemical adaptational strategies to nitrogen
metabolism that have been reported in this fish while
exposing to different environmental constraints2,1
.
One of the unique adaptations that it possesses is the
presence of a functional and regulatory OUC, and
reported to help in detoxification of ammonia to urea
under hyper-ammonia stress4,6,8
. Further, since
mannitol fails to enter into the animal body, it caused
dehydration stress to different tissues by exosmosis,
Fig. 5―Changes in the activity (units g-1wet wt) of certain key
amino acid metabolism-related enzymes in different tissues of
C. batrachus following exposure to hypertonic mannitol solution.
Values are mean ± S.E. from 5 observations each. P values: a
<0.05, b <0.01, c <0.001 (Student’s t-test) GS – glutamine
synthetase; GDH (R.A.) – glutamate dehydrogenase (reductive
amination); GDH (O.D.) – glutamate dehydrogenase (oxidative
deamination); AST – aspartate aminotransaminase; ALT – alanine
aminotransaminase
Table 1—Changes of plasma osmolarity and tissue water content in C. batrachus following exposure to hypertonic environment
(300 mM mannitol). [Values are mean ± S.E. from 5 observations each]
3 days 7 days
Control Treated Control Treated
Plasma osmolarity (mOsmol l-1) 265 ± 3 325 ± 5* (+23) 266 ± 4 345 ± 6* (+30)
Tissue water content
Liver 78 ± 1.5 70 ± 1.2* (-10) 77 ± 1.8 65 ± 1.3* (-15)
Kidney 79 ± 2.0 72 ± 1.8* (-9) 78 ± 2.1 68 ± 1.6* (-13)
Muscle 76 ± 2.1 69 ± 1.7* (-9) 77 ± 1.9 64 ± 1.8* (-14)
Brain 77 ± 1.9 72 ± 1.8 (-6) 77 ± 2.2 70 ± 1.7* (-9)
Tissue water contents are presented as percentage of wet mass weight of individual tissue. Percentage increase (+) and decrease (-)
of values corresponding to respective controls are given in parentheses.
* P value significant at <0.05 level compared to respective controls (Student’s t-test)
BANERJEE et al.: INFLUENCE OF ENVIRONMENTAL HYPERTONICITY
735
thereby resulting in significant decrease of cellular
water content in different tissues. The decrease of cell
volume/hydration status due to hypertonicity has
recently been reported to cause the stimulation of
proteolysis in perfused liver of C. batrachus12
. Thus,
the increase of ammonia levels in body tissues
appeared to be mainly through protein degradation
and amino acid catabolism primarily to meet the high
energy demand for the osmoregulalory acclimation.
Further, the increase of urea excretion rate and higher
accumulation of tissue urea levels, observed in
hypertonically-treated fish, were mostly associated
with the induction of activities of certain key OUC
enzymes, viz., CPS, ASS and ASL in liver and kidney
tissues of this fish. A 5-fold increase of CPS activity
during exposure to 0.9% sodium chloride solution for
14 days27
and during exposure to hypertonic saline
environment28
was reported in the liver of aquatic frog
(Xenopus laevis). Increase of both ammonia and urea
excretion rates were reported in another air-breathing
fish, the climbing perch (Anabas testudineus) while
acclimating to 30% seawater29
. However, the source
of urea in this fish was suggested to be either through
arginolysis and/or purine degradation pathway, since
the functional OUC was reported to be non-functional
in this fish4. Similarly, in swamp eel (Monopterus
albus) decrease of both ammonia and urea excretion
rates have been reported during exposure to brackish
water30
. Increase of urea level has also been reported
in the plasma of carp (Cyprinus carpio)31
and in anura
(Rana cancrivora)32
while exposing to hyper- and
hypotonic mannitol. The decrease in ammonia
excretion rate in C. batrachus, observed during
exposure to hypertonic environment, was probably
associated with the enhanced synthesis of urea from
ammonia via the induced OUC, thereby leading to
stimulation of urea excretion rate and more
accumulation of urea in body tissues. Thus, it appears
that urea, which is also known to be a good osmolyte,
plays a critical role in this fish for cell volume
regulation and also to avoid excessive water loss
under hypertonic stress.
Liver is the most important organ with relation to
nitrogen metabolism and also it is the most important
organ governing amino acid homeostasis in fish33
.
Exposure to hypertonic mannitol solution led to
significant increase in the levels of various non-
essential FAAs (Asp, Gly, Ala, Asn, Glu, Gln and
Tau) and also certain essential FAAs (Met, Leu, Trp,
and Phe) in the liver of walking catfish. Similar
increasing patterns of different FAAs were also
observed with minor variations in kidney, muscle,
brain and plasma of C. batrachus while exposing to
hypertonic mannitol solution. One reason of
increasing the amino acid pool in different tissues
could be associated with the stimulation of protein
degradation, which was suggested earlier at least in
the liver of this fish under hypertonic stress12
.
The adjustment of intracellular FAA concentrations
in response to osmotic stress has widely been
documented among crustaceans as well as other
marine invertebrates34–36
. However, reports on the role
of amino acid pool in osmoregulation in freshwater
teleosts are scanty. More recently, role of FAAs in
osmoregulation has been emphasized in the climbing
perch (A. testudineus)29
, swamp eel (M. albus)30
and
in freshwater marble goby (Oxyeleotris marmorata)37
during acclimation to either sea or brackish water.
The basal levels of activity of some of the key
enzymes related to amino acid metabolism such as the
GS, GDH (reductive amination), AST and ALT were
found to be quite high in C. batrachus compared to
many ammoniotelic teleosts including the gobiid
fish38-43
, which got further stimulated in different
tissues (except for AST in liver and brain) under
hypertonic stress. Thus, the increasing activity of
most of the enzymes, observed in different tissues of
mannitol-exposed fish, might have helped in extra
synthesis of various non-essential FAAs from
ammonia, generated due to protein degradation and
amino acid catabolism through the involvement of
coupled GDH (reductive amination), which
synthesizes Glu by assimilating ammonia with
α-ketoglutarate, and GS enzymes to incorporate
another molecule of ammonia to Glu forming Gln,
and also to other amino acids by transamination
reactions. Stimulation of activity of these enzymes
was probably associated with higher accumulation of
ammonia in different tissues as reported earlier in the
same fish under hyper-ammonia stress17,7
. Thus, it is
very much evident that the up-regulation of
non-essential FAAs synthetic pathways would be
another source of increasing the amino acid pool in
this fish under hypertonic stress. Further, the increase
of amino acid pool along with the increase of urea
concentration, observed in the present study, was
associated with the increase of plasma osmolarity,
thus counteracting the higher external osmolarity to
some extent mainly to avoid the water loss under
hypertonic stress.
INDIAN J EXP BIOL, JULY 2014
736
Interestingly, out of different FAAs, which got
accumulated in different tissues of C. batrachus, Tau
increased maximally during exposure to hypertonic
mannitol solution. Tau is a relatively inert molecule,
which even at high concentration is not only
compatible with the function and organization of
macromolecules, but may in addition act as an
osmoprotectant counteracting the deleterious effects
of denaturing solutes as inorganic ions. The
occurrence of Tau synthetic pathway, which
constitutes the most predominant amine in most
teleosts including C. batrachus, is not very clear in
fish44
. Similar increase of Tau concentration was also
noticed in this fish under hyper-ammonia stress17,7
.
Therefore, it is necessary to investigate the occurrence
of the Tau synthetic pathway with its physiological
significance in this fish.
The mechanism(s) by which different amino acid
metabolism-related enzymes and three key OUC
cycle enzymes are stimulated in this fish under
hypertonic stress is difficult to explain with the
available data. More recently, the increase in the
abundance of GS and GDH enzyme proteins and
mRNA for GDH in mud eel45,30
, and GS and GDH
enzyme proteins in the juvenile of freshwater marble
goby37
have been reported while exposing to
seawater. The more abundance of GS and CPS
enzyme proteins and different isoforms of GS
mRNAs have also been reported in C. batrachus
while adapting to high environmental ammonia46,47
.
Therefore, the transcriptional and translational
regulation of these enzymes cannot be ruled out in
this fish under hypertonic stress. Another strategy of
enzymatic induction could be through changes in the
concentration of various effector molecules, and/or
by changing the phosphorylation status of the
pre-existing enzymes as observed in the case of
glycogen phosphorylase and glycogen synthase
enzymes in C. batrachus9, and glycogen phosphorylase
enzyme in another catfish, Amereiurus nebulosus48
under aniso-osmotic conditions. Numerous protein
kinases have been implicated in metabolic alterations
with volume changes in mammalian hepatocytes49
and
in fish chloride cells50
, and several osmosensing
receptors associated with the activation of various
kinases have been identified51
. Molecular crowding
may also exert long-term effects, such as cAMP-
mediated changes in gene transcription under osmotic
stress52,53
. However, a thorough investigation requires
to be performed to understand better about the
regulation of enzymatic activities under osmotic stress
in this fish.
In conclusion, the capacity of up-regulating the
urea synthesis via the induced OUC resulting to more
accumulation of urea in body tissues to defend the
osmotic stress in hypertonic environment and also
more excretion of urea under hyper-osmotic stress,
observed in C. batrachus, is uncommon among
freshwater teleosts. It resembled more with
some aquatic frogs and elasmobranchs. Further
C. batrachus has the capacity to increase the amino
acid pool, by up-regulating the activities of enzymes
responsible for synthesis of different non-essential
FAAs and probably also by stimulating the protein
degradation, is another unique biochemical adaptation
that has been observed to acclimatize better under
hypertonic environment. Thus, due to possessing
these adaptational capabilities C. batrachus is able to
survive successfully in wide ranges of osmolarity
changes in its natural environment.
Acknowledgement This study was supported by a project sanctioned to
NS by the Department of Biotechnology, New Delhi,
the DSA programme to the Department of Zoology
and the UPE-Bioscience project to the North-Eastern
Hill University, Shillong by the University Grants
Commission, New Delhi.
References 1 Saha N & Ratha B K, Functional ureogenesis and adaptation
to ammonia metabolism in Indian freshwater air-breathing
catfishes, Fish Physiol Biochem, 33 (2007) 283.
2 Saha N & Ratha B K, Ureogenesis in Indian air-breathing
teleosts: adaptation to environmental constraints, Comp
Biochem Physiol A, 120 (1998) 195.
3 Sen T K, The fish fauna of Assam and the neighbouring North-
Eastern States of India; in Records of Zoological Survey of
India, (Miscellaneous Publication, Calcutta) (1985) 217.
4 Saha N & Ratha B K, Comparative study of ureogenesis in
freshwater, air-breathing teleosts, J Exp Zool, 252 (1989) 1.
5 Saha N, Datta S, Biswas K & Kharbuli Z, Role of
ureogenesis in tackling problems of ammonia toxicity during
exposure to higher ambient ammonia in the air-breathing
walking catfish Clarias batrachus, J Biosci, 28 (2003).
6 Saha N, Das L & Dutta S, Types of carbamyl phosphate
synthetases and subcellular localization of urea cycle and
related enzymes in air-breathing walking catfish, Clarias
batrachus, J Exp Zool, 130 (1999) 121.
7 Saha N, Dutta S & Bhattacharjee A, Role of amino acid
metabolism in an air-breathing catfish, Clarias batrachus in
response to exposure to a high concentration of exogenous
ammonia, Comp Biochem Physiol B, 133 (2002) 235.
8 Saha N & Das L, Stimulation of ureogenesis in the perfused
liver of an Indian air-breathing catfish, Clarias batrachus,
BANERJEE et al.: INFLUENCE OF ENVIRONMENTAL HYPERTONICITY
737
infused with different concentrations of ammonium chloride,
Fish Physiol Biochem, (1999) 303.
9 Goswami C & Saha N, Glucose, pyruvate and lactate efflux
by the perfused liver of a teleost, Clarias batrachus during
aniso-osmotic exposure, Comp Biochem Physiol A, 119
(1998) 999.
10 Goswami C, Datta S, Biswas K & Saha N, Cell volume
changes affect gluconeogenesis in the perfused liver of the
catfish Clarias batrachus, J Biosci, 29 (2004) 337.
11 Saha N & Goswami C, Effects of anisotonicity on
pentose-phosphate pathway, oxidized glutathione release and
t-butylhydroperoxide-induced oxidative stress in the perfused
liver of air-breathing catfish, Clarias batrachus, J Biosci, 29
(2004) 179.
12 Biswas K, Khongsngi J L, Häussinger D & Saha N,
Influence of cell volume changes on autophagic proteolysis
in the perfused liver of air-breathing walking catfish (Clarias
batrachus), J Exp Zool A, 311 (2009) 115.
13 Biswas K, Jyrwa L M, Häussinger D & Saha N, Influence of
cell volume changes on protein synthesis in isolated
hepatocytes of air-breathing walking catfish (Clarias
batrachus), Fish Physiol Biochem, 36 (2010) 17.
14 Saha N, Jyrwa L M, Das M & Biswas K, Influence of
increased environmental water salinity on gluconeogenesis in
the air-breathing walking catfish, Clarias batrachus, Fish
Physiol Biochem, 37 (2011) 681.
15 Kun E & Kearney E B, Ammonia, in Methods of enzymatic
analysis, edited by H Bergmeyer (Academic Press, New
York) (1974) 1802.
16 Fujiwara M, Ishida Y, Nimura N, Toyama A & Kinoshita T,
Postcolumn fluorometric detection system for liquid
chromatographic analysis of amino and imino acids using
o-phthalaldehyde/N-acetyl-l-cysteine reagent, Anal Biochem,
166 (1987) 72.
17 Saha N, Dutta S & Häussinger D, Changes in free amino acid
synthesis in the perfused liver of an air-breathing walking
catfish, Clarias batrachus infused with ammonium chloride:
a strategy to adapt under hyperammonia stress, J Exp Zool,
23 (2000) 13.
18 Saha N, Dkhar J & Ratha B K, Induction of ureogenesis in
perfused liver of a freshwater teleost, Heteropneustes fossilis,
infused with different concentrations of ammonium chloride,
Comp Biochem Physiol B, 112 (1995) 733.
19 Saha N, Dkhar J, Anderson P M & Ratha B K, Carbamyl
phosphate synthetase in an air-breathing teleost,
Heteropneustes fossilis, Comp Biochem Physiol B, 116
(1997) 57.
20 Moore R B & Kauffman N J, Simultaneous determination of
citrulline and urea using diacetylmonoxime, Anal Biochem,
33 (1970) 263.
21 Olson J A & Anfinsen C B, The crystallization and
characterization of L-glutamic acid dehydrogenase, J Biol
Chem, 197 (1952) 67.
22 Foster G & Moon T W, Cortisol and liver metabolism of
immature American eels, Anguilla rostrata (LeSueur), Fish
Physiol Biochem, 1 (1986) 113.
23 Webb J T & Brown Jr G W, Some properties and occurrence
of glutamine synthetase in fish, Comp Biochem Physiol B, 54
(1976) 171.
24 Goldstein L & Perlman D F, Nitrogen metabolism, excretion,
osmoregulation, and cell volume regulation, in Animal
physiology: Evolutionary and ecological perspectives, edited by
P J Walsh & P A Wright (CRC press, Boca-Raton) (1995) 91.
25 Wood CM, Ammonia and urea metabolism and excretion, in
The physiology of fishes, edited by D H Evans (CRC press,
Boca Raton) (1993) 379.
26 Wright P, Anderson P, Weng L, Frick N, Wong W P & Ip Y
K, The crab-eating frog, Rana cancrivora, up-regulates
hepatic carbamoyl phosphate synthetase I activity and tissue
osmolyte levels in response to increased salinity, J Exp Zool
A, 301 (2004) 559.
27 Janssens P A & Cohen P P, Biosynthesis of urea in the
estivating African lungfish and in Xenopus laevis under
conditions of water-shortage, Comp Biochem Physiol, 24
(1968) 887.
28 McBean R L & Goldstein L, Accelerated synthesis of urea in
Xenopus laevis during osmotic stress, Am J Physiol, 219
(1970) 1124.
29 Chang E W Y, Loong A M, Wong W P, Chew S F, Wilson J
M & Ip Y K, Changes in tissue free amino acid contents,
branchial Na+/K+-ATPase activity and bimodal breathing
pattern in the freshwater climbing perch, Anabas testudineus
(Bloch), during seawater acclimation, J Exp Zool A, 307
(2007) 708.
30 Tok C Y, Chew S F, Peh W Y X, Loong A M, Wong W P &
Ip Y K, Glutamine accumulation and up-regulation of
glutamine synthetase activity in the swamp eel, Monopterus
albus (Zuiew), exposed to brackish water, J Exp Biol, 212
(2009) 1248.
31 Gupta O P & Hanke W, The effects of osmotic stressors on
the stenohaline carp (Cyprinus carpio), Comp Biochem
Physiol A, 71 (1982) 165.
32 Colley L, Rowe W C, Huggins A K, Elliott A B & Dicker S
E, The effect of short-term changes in the external salinity on
the levels of the non-protein nitrogenous compounds and the
ornithine-urea cycle enzymes in Rana cancrivora, Comp
Biochem Physiol B, 41 (1972) 307.
33 Campbell J W, Excretory nitrogen metabolism, in
Environmental and metabolic animal physiology, edited by C
L Prosser (Wiley, New York) (1991) 277.
34 Gilles R, Mechanisms of ion and osmoregulation, in Marine
ecology, edited by O Kinne (Willey, London) (1975) 259.
35 Schoffeniels E, Adaptations with respect to salinity, in
Biochemical society symposium 1976, 179.
36 Pierce S K, Invertibrate cell volume control mechanisms: A
coordinated use of intracellular amino acids and inorganic
ions as osmotic solute, Biol Bull, 163 (1982) 405.
37 Chew S, Tng Y M, Wee N J, Tok C, Wilson J, & Ip Y K,
Intestinal osmoregulatory acclimation and nitrogen
metabolism in juveniles of the freshwater marble goby
exposed to seawater, J Comp Physiol B, 180 (2010) 511.
38 Waarde A Van & Kesbeke F, Nitrogen metabolism in
goldfish, Carassius auratus (L) activities of amidases and
amide synthetases in goldfish tissues, Comp Biochem Physiol
B, 71 (1982) 599.
39 Chew S F & Ip Y K, Ammoniagenesis in mudskippers
Boleophthalmus boddaerti and Periophthalmodon schlosseri,
Comp Biochem Physiol B, 87 (1987) 941.
40 Iwata K, Nitrogen metabolism in the mudskipper,
Periophthalmus cantonens: Changes in free amino acids and
related compounds in various tissues under conditions of
ammonia loading, with special reference to its high ammonia
tolerance, Comp Biochem Physiol A, 91 (1988) 499.
INDIAN J EXP BIOL, JULY 2014
738
41 Peng K W, Chew S F, Lim C B, Kuah S S L, Kok W K, & Ip
Y K, The mudskippers Periophthalmodon schlosseri and
Boleophthalmus boddaerti can tolerate environmental NH3
concentrations of 446 and 36 µM, respectively, Fish Physiol
Biochem, 19 (1998) 59.
42 Anderson P M, Urea and glutamine synthesis: Environmental
influences on nitrogen excretion, in Fish physiology, edited
by P Wright and P Anderson (Academic Press, New York)
(2001) 239.
43 Lim C B, Chew S F, Anderson P M & Ip Y K, Reduction in
the rates of protein and amino acid catabolism to slow down
the accumulation of endogenous ammonia: A strategy
potentially adopted by mudskippers (Periophthalmodon
schlosseri and Boleophthalmus boddaerti) during aerial
exposure in constant darkness, J Exp Biol, 204 (2001) 1605.
44 Waarde A Van, Biochemistry of non-protein nitrogenous
compounds in fish including the use of amino acids for
anaerobic energy production, Comp Biochem Physiol B, 91
(1988) 207.
45 Tok C Y, Chew S F, & Ip Y K, Gene cloning and mRNA
expression of glutamate dehydrogenase in the liver, brain,
and intestine of the swamp eel, Monopterus albus (Zuiew),
exposed to freshwater, terrestrial conditions, environmental
ammonia, or salinity stress, Front Physiol, 2 (2011) 100.
46 Saha N, Datta S, Kharbuli Z Y, Biswas K & Bhattacharjee A,
Air-breathing catfish, Clarias batrachus upregulates
glutamine synthetase and carbamyl phosphate synthetase III
during exposure to high external ammonia, Comp Biochem
Physiol B, 147 (2007) 520.
47 Bhuyan G, Studies on tissue specific expression and induction
of multiple glutamine synthetase genes under hyper-ammonia
stress, and ammonia-induced nitrotyrosination of glutamine
synthetase in catfish, (Heteropneustes fossilis), Ph.D. thesis,
North-Eastern Hill University, Shillong, 2013.
48 Hallgren N K, Busby E R & Mommsen T P, Cell volume
affects glycogen phosphorylase activity in fish hepatocytes, J
Comp Physiol B, 173 (2003) 591.
49 Weiergräber O & Häussinger D, Hepatocellular hydration:
signal transduction and functional implications, Cell Physiol
Biochem, 10 (2000) 409.
50 Kültz D & Avila K, Mitogen-activated protein kinases are in
vivo transducers of osmosensory signals in fish gill cells,
Comp Biochem Physiol B, 129 (2001) 821–829.
51 Maeda T, Takekawa M, & Saito H, Activation of yeast PBS2
MAPKK by MAPKKKs or by binding of an SH3-containing
osmosensor, Science, 269 (1995) 554.
52 Minton A P, The influence of macromolecular crowding and
macromolecular confinement on biochemical reactions in
physiological media, J Biol Chem, 276 (2001) 10577.
53 Burg M B, Macromolecular crowding as a cell volume
sensor, Cell Physiol Biochem, 10 (2000) 251.
Related Documents


