This article appeared in a journal published by Elsevier. The attached copy is furnished to the author for internal non-commercial research and education use, including for instruction at the authors institution and sharing with colleagues. Other uses, including reproduction and distribution, or selling or licensing copies, or posting to personal, institutional or third party websites are prohibited. In most cases authors are permitted to post their version of the article (e.g. in Word or Tex form) to their personal website or institutional repository. Authors requiring further information regarding Elsevier’s archiving and manuscript policies are encouraged to visit: http://www.elsevier.com/copyright

Welcome message from author
This document is posted to help you gain knowledge. Please leave a comment to let me know what you think about it! Share it to your friends and learn new things together.
Transcript
This article appeared in a journal published by Elsevier. The attachedcopy is furnished to the author for internal non-commercial researchand education use, including for instruction at the authors institution
and sharing with colleagues.
Other uses, including reproduction and distribution, or selling orlicensing copies, or posting to personal, institutional or third party
websites are prohibited.
In most cases authors are permitted to post their version of thearticle (e.g. in Word or Tex form) to their personal website orinstitutional repository. Authors requiring further information
regarding Elsevier’s archiving and manuscript policies areencouraged to visit:
http://www.elsevier.com/copyright
Author's personal copy
Influence of boundary conditions on bi-phased polycrystalmicrostructure calculation
P. Evrard a,b,e, A. El Bartali a,b,e, V. Aubin a,b,e, C. Rey c,e, S. Degallaix a,b,e,*, D. Kondo a,d,e
a Univ Lille Nord de France, F-59000 Lille, Franceb ECLille, LML, F-59650 Villeneuve d’Ascq, Francec Ecole Centrale Paris, LMSSMat, F-92295 Chatenay-Malabry, Franced USTL, LML, F-59650 Villeneuve d’Ascq, Francee CNRS, UMR 8107, UMR 8579, France
a r t i c l e i n f o
Article history:Received 26 May 2009Received in revised form 13 March 2010Available online 20 March 2010
Keywords:Polycrystalline microstructure calculationFinite element methodBoundary conditionsMechanical field measurementDigital image correlation
a b s t r a c t
In this paper, polycrystalline bi-phased microstructure calculations were performed using finite element(FE) method and compared to mechanical fields measured experimentally using a digital image correla-tion (DIC) technique. From scanning electron microscopic (SEM) observations and electron back-scat-tered diffraction (EBSD) crystal orientation measurements performed on an austenitic-ferritic stainlesssteel test specimen, a quasi-2D numerical polycrystalline microstructure was constructed. Mechanicalbehaviors of austenitic (FCC) and ferritic (BCC) grains were modeled by two crystal plasticity laws, basedon crystallographic slips and dislocation densities. FE mechanical fields were calculated using two typesof boundary conditions: the displacements measured by DIC, and the average of the displacements mea-sured by DIC. A better description of intraphase and intragranular strain heterogeneities is obtained usingas boundary conditions the displacements measured instead of the average of the displacementsmeasured.
� 2010 Elsevier Ltd. All rights reserved.
1. Introduction
In polycrystalline materials under mechanical loading, heteroge-neous strains occur, in particular due to macroscopic strain gradi-ents, hardness of individual phases and/or crystals, grain boundaryeffects, and grain to grain interactions. Especially in low-cycle fati-gue, damage and micro-crack initiation and propagation are con-trolled by strains and/or stresses localized in a thin surface layer,inside individual grains, at grain boundaries or at grain boundary tri-ple points. Such localizations depend clearly on the crystallinearrangement at the surface and in the depth. Unfortunately, themean-field homogenization techniques (Lebensohn et al., 2004)cannot predict such localizations. Hence, polycrystalline micro-structure calculation using finite element (FE) method on a limitednumber of grains is an efficient tool to access to mechanical fieldsat the grain scale, especially at the free surface, and then to under-stand and predict the low-cycle fatigue damage phenomena.
In the last decades, many efforts were done in order to constructnumerical microstructures more and more realistic. 2D or 3D Vor-onoï tesselation algorithms (Barbe et al., 2001a,b; Cailletaud et al.,2003) and derived ones as power diagrams (Kühn and Steinhauser,2008) have been extensively used in order to predict stress/strain
fields at the grain scale, and then intergranular and intragranularmechanical heterogeneities. However, although the actual grainsize distribution can be taken into account in such numericalmicrostructure, often the grain morphology is not realistic, notablywhen the grain shape is non-equiaxial. Thus, also the crystallo-graphic texture is not realistic. It can be noted that new Voronoïtesselation algorithms have been developed by Brahme et al.(2006), Bertolino et al. (2007) and St-Pierre et al. (2008) in orderto generate microstructure with non-equiaxial grains. In order toobtain more realistic description of the crystallographic textureand the grain morphology, electron back-scattered diffraction(EBSD) measurements are more and more used to generate eithera quasi-2D numerical microstructure (Hoc et al., 2003) or a 3Dnumerical microstructure (Erieau and Rey, 2004; Musienko et al.,2007). For generating a quasi-2D numerical microstructure, usu-ally the free surface microstructure of the specimen is analyzedby EBSD. The orientation map of the grains and the pattern of grainboundaries at the free surface are obtained. The grain boundarypattern is thus extruded in the out-of-plane direction, and colum-nar grains are obtained. To construct a realistic 3D numericalmicrostructure, the surface must be several times slightly polished(Erieau and Rey, 2004), or milled by focused ion beam (FIB) (Xuet al., 2007), with an EBSD scanning after each step. These tech-niques offer the advantage to give a good description of the grainsizes and shapes at the surface and in the depth, but are long
0020-7683/$ - see front matter � 2010 Elsevier Ltd. All rights reserved.doi:10.1016/j.ijsolstr.2010.03.016
* Corresponding author at: Univ Lille Nord de France, F-59000 Lille, France.E-mail address: [email protected] (S. Degallaix).
International Journal of Solids and Structures 47 (2010) 1979–1986
Contents lists available at ScienceDirect
International Journal of Solids and Structures
journal homepage: www.elsevier .com/locate / i jsols t r

Author's personal copy
and destructive. Therefore, these methods are impracticable in fa-tigue, when the aim is to analyze the surface relief evolution usingmany observations performed at the same free surface during cyc-lic loading.
The recent developments of experimental techniques of dis-placement and strain field measurements at the grain scale (Soppaet al., 2001; Schroeter and McDowell, 2003; Tatschl and Kolednik,2003; El Bartali et al., 2007; Moulart et al., 2009; Efstathiou et al.,2010; Saai et al., 2010) offer an efficient tool to validate a polycrys-talline microstructure calculation by comparison of the mechanicalfields calculated and measured and/or of the macroscopic stress–strain curves (Hoc et al., 2003; Musienko et al., 2007; Saai et al.,2010; Héripré et al., 2007). In other respects, such experimentalmeasurement techniques can be used to identify the parametersof crystal plasticity laws using an inverse procedure (Hoc et al.,2003; Héripré et al., 2007).
This paper is part of a larger work which aims at studying thelow-cycle fatigue behavior of a duplex stainless steel. In order toanalyze crack initiation micromechanisms in low-cycle fatigue,microstructure calculations are necessary. Constitutive laws ofcrystalline plasticity have been used and identified by comparisonof experimental macroscopic stress–strain results and simulationswith a mean-field polycrystalline model (Evrard et al., 2008a,b). Itis first necessary to validate the crystalline constitutive laws usedby comparison of kinematic fields obtained by microstructure cal-culation to experimental ones. The analysis is made on a limitedzone of the surface of a specimen, because the studied zone doesnot have to be a Representative Volume Element, as this functionhas already been allotted to the polycrystalline model for whicha sufficiently large distribution of crystalline orientations has beenchosen (Evrard et al., 2008a). The present paper aims at choosingthe pertinent boundary conditions for this calculation by compar-ison between the grain scale mechanical fields measured by DICand those obtained by microstructure simulation.
2. Material
The material studied is a forged duplex stainless steel type X2Cr Ni Mo N 25-07 alloyed with nitrogen. This bi-phased polycrys-talline steel contains approximately 40% volume of austenite and60% volume of ferrite. Its composition is given in Table 1. It wassupplied in rolled bars of 70 mm in diameter, solution treated foran hour at 1060 �C and then water-quenched before machiningthe specimens. The resulting microstructure (Fig. 1) consists oflong polycrystalline austenitic rods (£ 10 lm � 1 mm) in a poly-crystalline ferritic matrix. The austenitic grains are equiaxial, witha mean grain size of 10 lm. The ferritic grains are elongated in thebar axis direction, with a mean grain size of 10 lm transverselyand 30 lm longitudinally. The crystallographic texture has beenmeasured by X-ray diffraction. Pole figures reveal no texture forthe austenite, and only a very slight texture for the ferrite (El Bar-tali et al., 2007). Tensile tests in both longitudinal and transversedirections of the bar do not show any mechanical anisotropy (Evr-ard et al., 2008a).
3. Experimental mechanical field measurement technique
The displacement and strain fields at the grain scale were mea-sured after a monotonous tension test up to a total macroscopic
deformation of 0.5% performed at room temperature under straincontrol and at the constant total strain rate _E11 ¼ 10�3 s�1, using anoriginal procedure developed by El Bartali et al. (2007). A cylindricalspecimen was taken in the bar, parallel to the bar axis. Its dimensionsare given in El Bartali et al. (2007). The strain was measured by astrain gauge extensometer fixed on the specimen, with a 10 mmgauge length. The surface of the specimen was regularly observedduring the low-cycle fatigue test (El Bartali et al., 2007). The zone ob-served was small enough to reveal the surface damage at the grainscale and large enough to be representative of the two-phased mate-rial. Images, about 120 � 90 lm2 (corresponding to 1368 � 1024pixels), were acquired using a 10-bits CCD camera mounted on thetesting machine through 3D micrometric table (Fig. 2).
The final aim of this study is the analysis of the damage in low-cycle fatigue. As this damage occurs on the surface, it was not pos-sible to mark the surface, because that would have favored an earlydamage, or to paint it, as it would prevent to link kinematic fieldsto grain or phase shape or to slip systems activated. In that context,grid techniques were not considered (Schroeter and McDowell,2003; Moulart et al., 2009; Badulescu et al., 2009) as they needmarks or painting on the surface and a solution by digital imagecorrelation (DIC) was chosen (Besnard et al., 2006; Hild and Roux,2006; Efstathiou et al., 2010). These two techniques have bothbeen used to provide displacement and strain fields at the grainscale (Moulart et al., 2009; Saai et al., 2010; Efstathiou et al.,2010; Héripré et al., 2007; Schroeter and McDowell, 2003; Raabeet al., 2003; El Bartali et al., 2009). The random surface texture nec-essary for the image correlation was obtained by a slightly electro-chemical etching of the specimen.
The principle of the strain field measurement method used con-sisted in taking two images at the grain scale, coded in gray levels,the first image before loading (reference image) and the secondafter loading (deformed image). In-plane displacement and strainfields were obtained using the specific software CorreliQ4 (Hildand Roux, 2006). The correlation procedure consists in subdividingthe reference image into several small squares (l � l pixels), whichdefine the mesh. The position of each of these squares is searchedfor in the deformed image using a correlation method (Hild andRoux, 2006), giving the in-plane displacement field. The strain fieldis then calculated as the gradient of the displacement field.
Performances of the displacement and strain field calculationsin terms of resolution and accuracy were evaluated on images ob-
Table 1Chemical composition of the duplex stainless steel studied (in wt%).
C Cr Ni Mo Mn Si N Cu P S Fe
0.024 24.68 6.54 2.84 0.79 0.62 0.17 0.07 0.021 <0.003 Balance
Fig. 1. Microstructure observed by optical microscopy. Austenite is in white andferrite in gray.
1980 P. Evrard et al. / International Journal of Solids and Structures 47 (2010) 1979–1986

Author's personal copy
tained during this test. The mesh size was optimized in order tolimit uncertainties when keeping a space resolution compatiblewith intragranular strain heterogeneities and the grain size. Meshsize is then 32 pixels, which represents about 3 lm. Displacementuncertainty was evaluated at 2� 10�2 pixel and strain uncertaintyat 8� 10�4 (El Bartali et al., 2009).
The present work is in keeping with a larger study aiming thelow-cycle fatigue life domain, and thus interesting only in the plas-tic but small total deformations (less than 1%). In low-cycle fatigue,the out-of-plane strains result exclusively from surface slip mark-ings, which appear progressively during cycling, and are still rareafter the first cycle. Grain rotations are also very limited. As a con-sequence, the experimental device developed did not aim to mea-sure the out-of-plane deformations, which were very low and thendid not disturb the in-plane strain measures.
4. Quasi-2D numerical microstructure construction
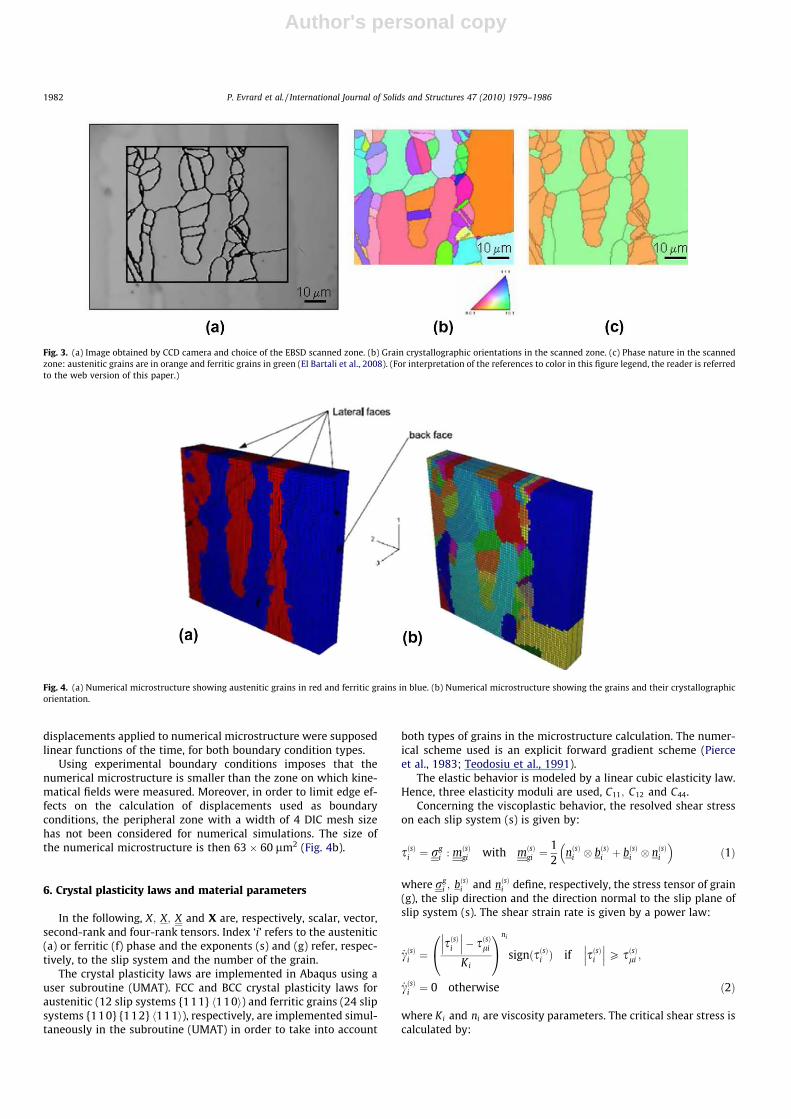
EBSD measurements were performed on the specimen surfacebefore the mechanical test to obtain crystallographic orientationsof surface grains and the grain boundary arrangement (El Bartaliet al., 2008). These measurements were performed using a 6100JEOL SEM equipped with an EBSD system and OIM (OrientationImaging Microscopy) TSL software. EBSD scans were performed inbeam control mode using hexagonal scanning grids with a spatialresolution of 0.5 lm/step. From these EBSD measurements, a qua-si-2D numerical microstructure was generated using Abaqus FEsoftware thanks to specific subroutines.1 Each mesh element corre-sponded to an EBSD measure. As the EBSD grid was hexagonal, everyother line was used for the construction of the numerical microstruc-ture. The pitches of the microstructure mesh were then 1 lm and0.866 lm. In order to avoid edge effects, the numerical simulationwas limited to an area sufficiently far away from the image edges.The size of the zone scanned by EBSD (Fig. 3b and c) was then63 � 60 lm2. This zone contained 52 austenitic grains and 12 ferriticgrains and the surface fractions were 39% of austenite and 61% of fer-rite, which was representative of the phase volume fractions.
For each surface grain, the surface grain boundary shape wasrespected. As the information in the out-of-plane direction wasnot available, we have considered an ideal columnar grain mor-phology, obtained by an extrusion in the out-of-plane direction.The thickness of the extruded mesh recommended, if experimen-tal boundary conditions are used, is approximately one grain size
(Héripré et al., 2007), which corresponds to 10 lm in the DSSstudied. If homogeneous boundary conditions are used, thethickness of the mesh has to be larger, i.e. at least two grainsizes (Zeghadi et al., 2007a,b). Then the crystallographicorientations measured (three Euler angles) were assigned tothe grains. The generated grain boundaries were perpendicularto the surface and only one layer of grains was modeled.Fig. 4a shows the numerical microstructure with austeniticphase in red2 and ferritic phase in blue, and Fig. 4b shows thesame numerical microstructure, where each color represents agrain and its crystallographic orientation. Finally, a three dimen-sional mesh is created with C3D8R reduced integration elements(Fig. 4) in order to limit the calculation time, and three elementsin the thickness.
5. Boundary conditions
For FE microstructure calculation at the grain scale, homoge-neous (displacement or force) boundary conditions are often ap-plied (Cailletaud et al., 2003). The simulated zone is too small tobe a Representative Volume Element and mechanical fields simu-lated with homogeneous boundary conditions or periodic ones willthen highly depend on edge effects (Héripré et al., 2007). The onlysolution is then to use experimental displacements as boundaryconditions in order to simulate realistic local mechanical responseof the numerical microstructure. Moreover, it has been showedthat using experimental boundary conditions allows to limit errorsmade by using a quasi-2D microstructure instead of the real 3Dmicrostructure, as the experimental displacement field used asboundary condition takes into account the influence of the grainsbeneath the surface (Héripré, 2006). The average mechanicalbehavior of this small numerical microstructure can of course notbe representative of the homogeneous material and can then notbe compared to the macroscopic stress–strain curve.
In this paper, the in-plane displacements measured by DIC onthe boundaries of the modeled zone are used as boundary condi-tions applied to the numerical microstructure, and the face behindis blocked in out-of-plane direction (Fig. 4a). Two types of bound-ary conditions have been tested. In both cases, boundary condi-tions were homogeneous in the thickness as no information wasavailable in the depth of the specimen. On the one hand, the aver-ages of displacements measured in directions 1 and 2, respectively,were applied on the lateral faces of the numerical microstructure,conditions called homogeneous experimental boundary conditions.On the other hand, the measured actual displacement distributionswere applied (node to node), conditions called heterogeneous exper-imental boundary conditions. As no information was available inthickness, the actual displacement measured on the surface wasapplied also to nodes in the thickness.
The experimental displacements applied on the boundaries ofthe numerical polycrystalline microstructure were measured be-tween images taken at 0% total strain (virgin material) and aftera monotonous tension test up to 0.5% of macroscopic total strain.At the grain scale, the actual evolution of displacements duringthe loading was probably a non-linear function of the time and de-pended on the point considered. Ideally, it would be necessary totake numerous images of the surface during the loading in orderto properly evaluate the non-linearity of displacement and strainfields when the loading goes beyond the elastic limit. Some authorsproposed to impose boundary conditions as non-linear functions ofthe time, based on the macroscopic stress–strain non-linearity(Gélébart et al., 2004). However, in this study, as a first step,
Fig. 2. In situ microscopy device mounted on the testing machine.
1 These subroutines were developed by the MSSMAT laboratory.
2 For interpretation of the references to color in Fig. 4, the reader is referred to theweb version of this paper.
P. Evrard et al. / International Journal of Solids and Structures 47 (2010) 1979–1986 1981
Author's personal copy
displacements applied to numerical microstructure were supposedlinear functions of the time, for both boundary condition types.
Using experimental boundary conditions imposes that thenumerical microstructure is smaller than the zone on which kine-matical fields were measured. Moreover, in order to limit edge ef-fects on the calculation of displacements used as boundaryconditions, the peripheral zone with a width of 4 DIC mesh sizehas not been considered for numerical simulations. The size ofthe numerical microstructure is then 63 � 60 lm2 (Fig. 4b).
6. Crystal plasticity laws and material parameters
In the following, X; X; X and X are, respectively, scalar, vector,second-rank and four-rank tensors. Index ‘i’ refers to the austenitic(a) or ferritic (f) phase and the exponents (s) and (g) refer, respec-tively, to the slip system and the number of the grain.
The crystal plasticity laws are implemented in Abaqus using auser subroutine (UMAT). FCC and BCC crystal plasticity laws foraustenitic (12 slip systems {111} h110i) and ferritic grains (24 slipsystems {110} {112} h111i), respectively, are implemented simul-taneously in the subroutine (UMAT) in order to take into account
both types of grains in the microstructure calculation. The numer-ical scheme used is an explicit forward gradient scheme (Pierceet al., 1983; Teodosiu et al., 1991).
The elastic behavior is modeled by a linear cubic elasticity law.Hence, three elasticity moduli are used, C11; C12 and C44.
Concerning the viscoplastic behavior, the resolved shear stresson each slip system (s) is given by:
sðsÞi ¼ rgi : mðsÞgi with mðsÞgi ¼
12
nðsÞi � bðsÞi þ bðsÞi � nðsÞi
� �ð1Þ
where rgi ; bðsÞi and nðsÞi define, respectively, the stress tensor of grain
(g), the slip direction and the direction normal to the slip plane ofslip system (s). The shear strain rate is given by a power law:
_cðsÞi ¼sðsÞi
��� ���� sðsÞli
Ki
0@
1A
ni
signðsðsÞi Þ if sðsÞi
��� ���P sðsÞli ;
_cðsÞi ¼ 0 otherwise ð2Þ
where Ki and ni are viscosity parameters. The critical shear stress iscalculated by:
Fig. 3. (a) Image obtained by CCD camera and choice of the EBSD scanned zone. (b) Grain crystallographic orientations in the scanned zone. (c) Phase nature in the scannedzone: austenitic grains are in orange and ferritic grains in green (El Bartali et al., 2008). (For interpretation of the references to color in this figure legend, the reader is referredto the web version of this paper.)
Fig. 4. (a) Numerical microstructure showing austenitic grains in red and ferritic grains in blue. (b) Numerical microstructure showing the grains and their crystallographicorientation.
1982 P. Evrard et al. / International Journal of Solids and Structures 47 (2010) 1979–1986
Author's personal copy
sðsÞli ¼ s0i þ lbi
ffiffiffiffiffiffiffiffiffiffiffiffiffiffiffiffiffiffiffiffiffiXt
htðsÞi qt
i
rð3Þ
where s0i ; bi; l and htðsÞ
i are, respectively, the initial critical shearstress, the Burgers vector, the shear modulus and the interactionmatrix that characterizes interactions between slip system (s) andthe other slip systems. In this model, a simple form of this matrixis chosen. Diagonal terms, associated to the self-hardening, areequal to 1, and non-diagonal terms, associated to the latent harden-ing, are equal to a constant parameter hi. The evolution of the dis-location density on slip system (s) is given by (Esmann andMughrabi, 1979):
_qðsÞi ¼1bi
ffiffiffiffiffiffiffiffiffiffiffiffiffiffiffiffiPt–sqt
i
pLi
� 2yciqðsÞi
!_cðsÞi
��� ��� with qðsÞi cðsÞi ¼ 0� �
¼ q0i
ð4Þ
where Li is a material parameter controlling the dislocation produc-tion and yci is a material parameter proportional to the characteris-tic distance associated to the annihilation process of dislocationdipoles.
Elasticity moduli are obtained from nano-indentation tests(Jaupitre et al., 2005) using the lower bound of Voigt. In addition,it is supposed that the elasticity anisotropy factor is the same forboth phases (Bugat, 2000) and is that of a-iron. Table 2 gives thecubic elasticity moduli for each phase.
In a previous paper (Evrard et al., 2008a), a specific bi-phasedpolycrystalline model has been proposed to model the cyclic plas-tic behavior of the forged duplex stainless steel. The model takesinto account the bi-phased character of the material and the differ-ent mechanical behaviors of austenitic and ferritic grains. Finally,the macroscopic mechanical behavior is obtained using the Caille-
Table 2Cubic elasticity moduli for austenitic and ferritic phases.
Phase C11 ðMPaÞ C12 ðMPaÞ C44 ðMPaÞ
Austenite 197,865 125,254 90,764Ferrite 217,172 137,476 99,620
Table 3Viscoplastic parameters for austenitic and ferritic phases (Evrard et al., 2008a).
Parameters b (m) q0 ðm�2Þ K (MPa s1/n) n L h s0 ðMPaÞ yc ðnmÞ
Austenite 2:5� 10�10 1012 20 10 33 0.6 100 3.2
Ferrite 2:5� 10�10 1012 20 10 143 0.5 214 2
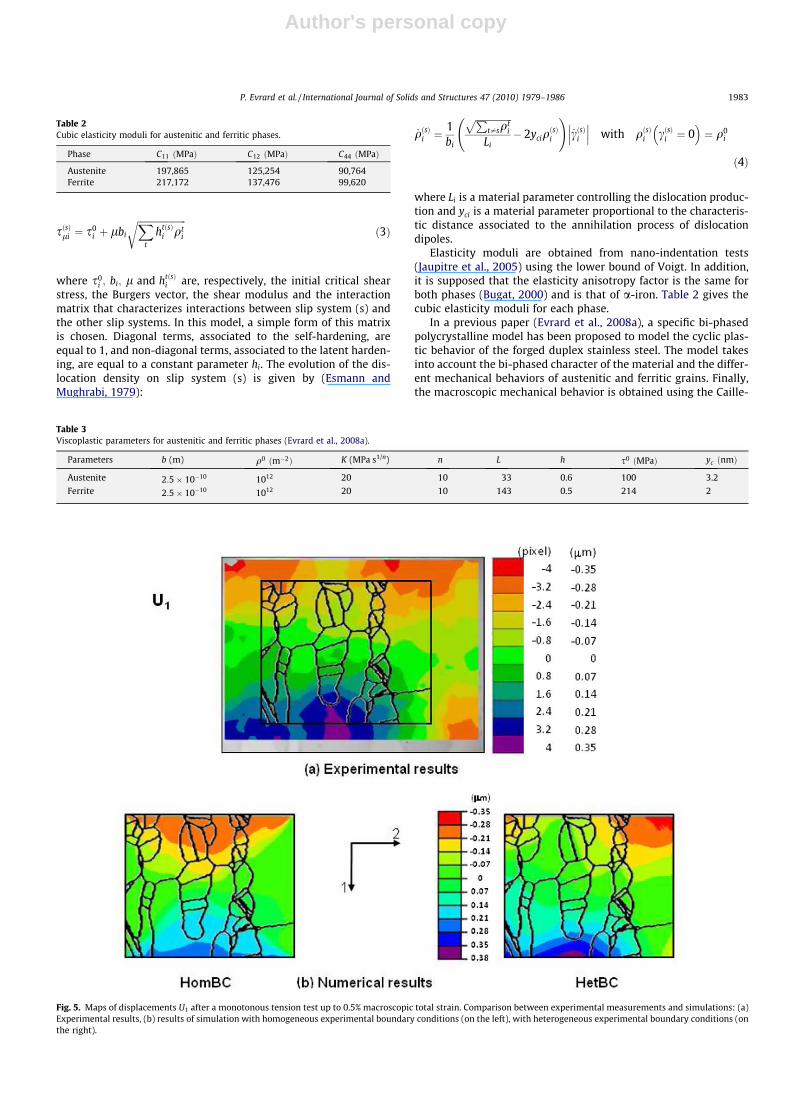
Fig. 5. Maps of displacements U1 after a monotonous tension test up to 0.5% macroscopic total strain. Comparison between experimental measurements and simulations: (a)Experimental results, (b) results of simulation with homogeneous experimental boundary conditions (on the left), with heterogeneous experimental boundary conditions (onthe right).
P. Evrard et al. / International Journal of Solids and Structures 47 (2010) 1979–1986 1983
Author's personal copy
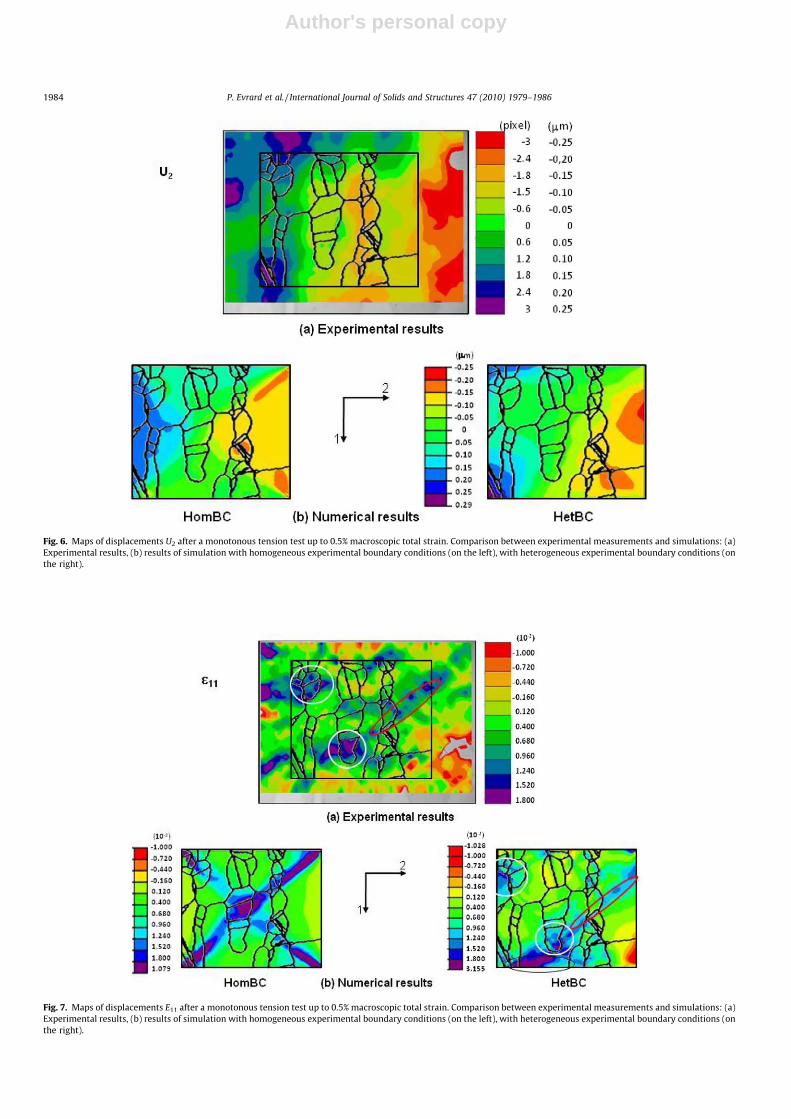
Fig. 6. Maps of displacements U2 after a monotonous tension test up to 0.5% macroscopic total strain. Comparison between experimental measurements and simulations: (a)Experimental results, (b) results of simulation with homogeneous experimental boundary conditions (on the left), with heterogeneous experimental boundary conditions (onthe right).
Fig. 7. Maps of displacements E11 after a monotonous tension test up to 0.5% macroscopic total strain. Comparison between experimental measurements and simulations: (a)Experimental results, (b) results of simulation with homogeneous experimental boundary conditions (on the left), with heterogeneous experimental boundary conditions (onthe right).
1984 P. Evrard et al. / International Journal of Solids and Structures 47 (2010) 1979–1986
Author's personal copy
taud–Pilvin self-consistent model. Viscoplastic parameters for eachphase are evaluated using the literature results and an inverseidentification procedure, which consists of a quantitative compar-ison between simulation with this bi-phased polycrystalline modeland experimental macroscopic stress–strain curves. Table 3 givesthe law parameters obtained in Evrard et al. (2008a).
7. Results
7.1. Comparison of measured and calculated displacement fields
U1 and U2 displacement fields measured experimentally after0.5% macroscopic total strain are given in Figs. 5a and 6a, respec-tively. Intraphase and intragranular heterogeneities on both U1
and U2 displacement fields are observed. U1 and U2 displacements
simulated using homogeneous experimental boundary conditionsare given in Fig. 5b (left) and Fig. 6b (left), respectively. Those sim-ulated using heterogeneous experimental boundary conditions aregiven in Figs. 5c (right) and 6c (right), respectively.
For easy comparison, Figs. 5 and 6 use the same color scale.Clearly, homogeneous experimental boundary conditions do notaccount for the spatial distributions of the displacements mea-sured experimentally. On the contrary, heterogeneous experimen-tal boundary conditions account relatively well for experimentaldisplacement distributions and intensities.
7.2. Comparison of fields of E11 component of the strain tensor
E11 strain field obtained by derivation of U1 displacement fieldmeasured experimentally is given in Fig. 7a. The strongest hetero-geneities are observed in austenitic grains (blank ovals) and in fer-ritic grains near the most deformed austenitic grains (red3 ovals).Locally, strains can reach 2%, about four times the applied macro-scopic strain. Furthermore, strong intraphase and intragranularstrain heterogeneities are observed in both austenite and ferrite.
Fig. 7b gives the simulation results with homogeneous and het-erogenous experimental boundary conditions, respectively, on theleft and on the right. The color scale is the same for both experi-mental and simulation results. With homogeneous experimentalboundary conditions, calculated strains are localized in bands ad-justed at ±45�. These bands cross several grains and do not respectthe experimental strain field. With heterogeneous experimentalboundary conditions, no band can be seen. Zones highly deformedin the simulated strain field (blank ovals in the austenite and redovals in the ferrite) agree in position with the experimental strainfield. It can be noted that strain intensities in these zones are a lit-tle lower in the numerical strain field than in the experimental one.On the contrary, strains calculated in some other zones, as thesmall zone marked by the black oval near the boundary, do not ac-count for the experimental strain measured. In conclusion, onlyheterogeneous experimental boundary conditions allow to accountfor intraphase and intragranular strain heterogeneities.
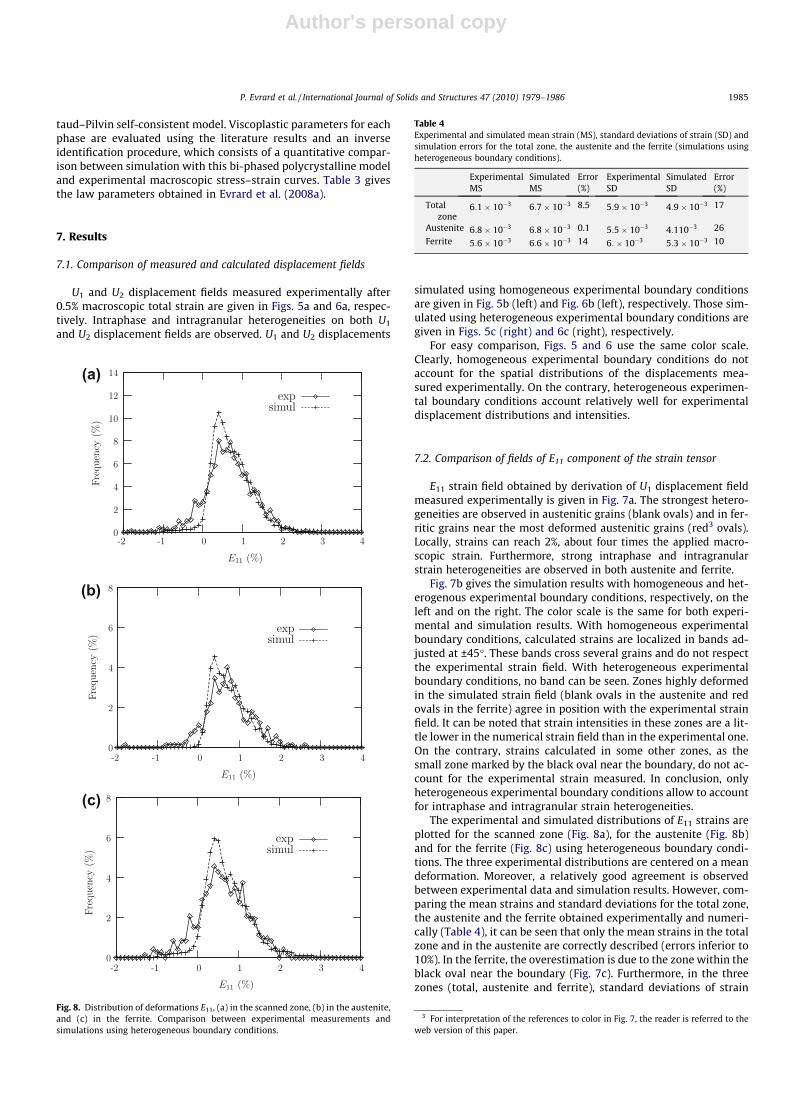
The experimental and simulated distributions of E11 strains areplotted for the scanned zone (Fig. 8a), for the austenite (Fig. 8b)and for the ferrite (Fig. 8c) using heterogeneous boundary condi-tions. The three experimental distributions are centered on a meandeformation. Moreover, a relatively good agreement is observedbetween experimental data and simulation results. However, com-paring the mean strains and standard deviations for the total zone,the austenite and the ferrite obtained experimentally and numeri-cally (Table 4), it can be seen that only the mean strains in the totalzone and in the austenite are correctly described (errors inferior to10%). In the ferrite, the overestimation is due to the zone within theblack oval near the boundary (Fig. 7c). Furthermore, in the threezones (total, austenite and ferrite), standard deviations of strain
Fig. 8. Distribution of deformations E11, (a) in the scanned zone, (b) in the austenite,and (c) in the ferrite. Comparison between experimental measurements andsimulations using heterogeneous boundary conditions.
Table 4Experimental and simulated mean strain (MS), standard deviations of strain (SD) andsimulation errors for the total zone, the austenite and the ferrite (simulations usingheterogeneous boundary conditions).
ExperimentalMS
SimulatedMS
Error(%)
ExperimentalSD
SimulatedSD
Error(%)
Totalzone
6:1� 10�3 6:7� 10�3 8.5 5:9� 10�3 4:9� 10�3 17
Austenite 6:8� 10�3 6:8� 10�3 0.1 5:5� 10�3 4:110�3 26
Ferrite 5:6� 10�3 6:6� 10�3 14 6:� 10�3 5:3� 10�3 10
3 For interpretation of the references to color in Fig. 7, the reader is referred to theweb version of this paper.
P. Evrard et al. / International Journal of Solids and Structures 47 (2010) 1979–1986 1985
Author's personal copy
are not well predicted. The calculation underestimates the intra-phase heterogeneities.
8. Conclusions
Since few years, many efforts have been done in order to con-struct realistic numerical microstructures. In this paper, from EBSDmeasurements, a quasi-2D numerical microstructure of a duplexstainless steel was constructed. A crystal plasticity calculationwas then performed in order to predict strain fields at the grainscale, during a monotonous tension test up to 0.5% of macroscopictotal strain. Simulation results were compared to experimentalkinematic fields measured by DIC at the grain scale. Intraphaseand intergranular heterogeneities were evaluated, and allowed tocompare two types of experimental displacement boundary condi-tions: homogeneous and heterogeneous.
The results show that only heterogeneous boundary conditions,obtained by DIC measurements, are able to account for the spatialdistribution and intensities of displacements and strains observedexperimentally, especially intraphase and intragranular heteroge-neities. Consequently, from a quasi-2D numerical microstructure,much less difficult to generate than a 3D numerical microstructure,a good description of mechanical fields in a duplex stainless steelwas obtained at the grain scale. Strain heterogeneities predictedat the grain scale, which are responsible for plastic activities anddamage, allow then to study and test the influence of variousparameters on damage and crack initiation.
In a future work, the microstructure calculations presented herewill be adapted for cyclic loading in order to study damage and ini-tiation in duplex stainless steel. This requires two specific develop-ments. Firstly, it will be necessary to introduce kinematichardening in the crystal plasticity law in order to take into accountthe Bauschinger effect which is important in this material.Secondly, a specific study has to be done in order to define the bestway to take into account the boundary conditions under cyclicloading, in terms of non-linearity in time and in space.
References
Badulescu, C., Grédiac, M., Mathias, J.D., 2009. Investigation of the grid method foraccurate in-plane strain measurement. Measurement Science and Technology20, 095102.
Barbe, F., Decker, L., Jeulin, D., Cailletaud, G., 2001a. Intergranular and intragranularbehavior of polycrystalline aggregates. Part 1. International Journal of Plasticity17, 513–536.
Barbe, F., Forest, S., Cailletaud, G., 2001b. Intergranular and intragranular behaviorof polycrystalline aggregates. Part 2. International Journal of Plasticity 17, 537–563.
Bertolino, G., Bilger, N., Crépin, J., 2007. Modeling microstructures andmicrostructural effects on macroscopic and intragranular mechanicalbehavior. Computational Material Science 40, 408–416.
Besnard, G., Hild, F., Roux, S., 2006. Finite-element displacement fields analysis fromdigital images: Application to Portevin–Le Châtelier bands. ExperimentalMechanics 46 (6), 789–804.
Brahme, A., Alvi, M.H., Saylor, D., Fridyc, J., Rollett, A.D., 2006. 3D Reconstruction ofmicrostructure in a commercial purity aluminum. Scripta Materialia 55, 75–80.
Bugat, S., 2000. Comportement et endommagement des aciers austéno-ferritiquesvieillis: une approche micromécanique. Ph.D. thesis, Ecole des Mines de Paris.
Cailletaud, G., Forest, S., Jeulin, D., Galliet, I., Mounoury, V., Quilici, S., 2003. Someelements of microstructural mechanics. Computational Materials Science 27,351–374.
Efstathiou, C., Sehitoglu, H., Lambros, J., 2010. Multiscale strain measurements ofplastically deforming polycrystalline titanium: role of deformationheterogeneities. International Journal of Plasticity 26, 93–106.
El Bartali, A., Aubin, V., Degallaix, S., 2007. Fatigue damage analysis in a duplexstainless steel. Fatigue and Fracture of Engineering Materials and Structures 31,137–151.
El Bartali, A., Aubin, V., Sabatier, L., Villechaise, P., Degallaix, S., 2008. Fatiguedamage analysis in a duplex stainless steel. Scripta Materiala 59, 1231–1234.
El Bartali, A., Aubin, V., Degallaix, S., 2009. Surface observation and measurementtechniques to study the fatigue damage micromechanisms in a duplex stainlesssteel. International Journal of Fatigue 31, 2049–2055.
Erieau, P., Rey, C., 2004. Modeling of deformation and rotation bands and ofdeformation induced grain boundaries in IF steel aggregate during large planestrain compression. International Journal of Plasticity 20, 1763–1788.
Esmann, U., Mughrabi, H., 1979. Annihilation of dislocations during tensile andcyclic deformation and limits of dislocations densities. Philosophical Magazine40, 731–756.
Evrard, P., Aubin, V., Pilvin, Ph., Degallaix, S., Kondo, D., 2008a. Implementations andvalidation of a polycrystalline model for a bi-phased steel under non-proportional loadings paths. Mechanics Research Communications 40, 336–343.
Evrard, P., Aubin, V., Degallaix, S., Kondo, D., 2008b. Yield surface and complexloading path simulation of a duplex stainless steel using a bi-phasepolycrystalline model. Materials Science Forum 567–568, 141–144.
Gélébart, L., Dexet, M., Sauzay, M., Crépin, J., Roos, A., 2004. Identification ofcrystalline behaviour on macroscopic response and local strain field analysis.Journal of ASTM International 1 (9), 585–601.
Héripré, E., 2006. Méthode de couplage multi-échelles entre simulationsnumériques polycristallines et mesures de champs pour l’identification desparamétres de lois de comportement et de fissuration des matériauxmétalliques. Application á l’étude des alliages TiAl. Ph.D. thesis, EcolePolytechnique, Palaiseau, France.
Héripré, E., Dexet, M., Crépin, J., Gélébart, L., Roos, A., Bornert, M., Cadelmaison, D.,2007. Coupling between experimental measurements and polycrystal finiteelement calculation for micromechanical study of metallic materials.International Journal of Plasticity 23, 1512–1529.
Hild, F., Roux, S., 2006. Digital image correlation: from displacement measurementto identification of elastic properties. Strain 42, 68–80.
Hoc, T., Crépin, J., Gélébart, L., Zaoui, A., 2003. A procedure for identifying the plasticbehavior of single crystals from the local response of polycrystals. ActaMateriala 51, 5477–5488.
Jaupitre, F., Degallaix, S., Kondo, D., Quaegebeur, P., Forget, F., 2005. Identificationand modelling of the behaviour of a duplex stainless steel by methods of scalechanging. Material Science Forum, 482–485.
Kühn, M., Steinhauser, M.-O., 2008. Modeling and simulation of microstructuresusing power diagrams: proof of the concept. Applied Physics Letters 93, 034102.
Lebensohn, R.A., Liu, Y., Ponte Castaneda, P., 2004. On the accuracy of the self-consistent approximation for polycrystals: comparison with full-field numericalsimulations. Acta Materialia 52, 5347–5361.
Moulart, R., Rotinat, R., Pierron, F., Lerondel, G., 2009. Full-field evaluation of theonset of microplasticity in a steel specimen. Mechanics of Materials 41, 1207–1222.
Musienko, A., Tatschl, A., Schmidegg, K., Kolednik, O., Pippan, R., Cailletaud, G., 2007.Three-dimensional finite element simulation of a polycrystalline copperspecimen. Acta Materiala 55, 4121–4136.
Pierce, D., Asaro, R.J., Needleman, A., 1983. Material rate dependance and localizeddeformation in crystalline solids. Acta Metallurgica 31, 1951–1976.
Raabe, D., Sachtleber, M., Weiland, H., Scheele, G., Zhao, Z., 2003. Grainscalemicromechanics of polycrystal surfaces during plastic staining. Acta Materialia51, 1539–1560.
Saai, A., Louche, H., Tabourot, L., Chang, H.J., 2010. Experimental and numericalstudy of the thermo-mechanical behavior of Al bi-crystal in tension using fullfield measurements and micromechanical modeling. Mechanics of Materials 42,275–292.
Schroeter, B.M., McDowell, D.L., 2003. Measurement of deformation fields inpolycrystalline hc copper. International Journal of Plasticity 19, 1355–1376.
Soppa, E., Doumalin, P., Binkele, P., Wiesendanger, T., Bornert, M., Schmauder, S.,2001. Experimental and numerical characterization of in-plane deformation intwo-phase materials. Computational Materials Science 21, 261–275.
St-Pierre, L., Héripré, E., Dexet, M., Crépin, J., Bertolino, G., Bilger, N., 2008. 3DSimulations of Microstructure and comparison with experimentalmicrostructure coming from OIM analysis. International Journal of Plasticity24, 1516–1532.
Tatschl, A., Kolednik, O., 2003. On the experimental characterization of crystalplasticity in polycrystals. Materials Science and Engineering A 356, 447–463.
Teodosiu, C., Raphanel, J.L., Tabourot, L., 1991. Finite element simulation of the largeelastoplastic deformation of multicrystals. Mecamat’91 49, 353–363.
Xu, W., Ferry, M., Mateescu, N., Caimey, J.M., Humphreys, F.J., 2007. Techniques forgenerating 3-D EBSD microstructures by FIB tomography. MaterialsCharacterization 58, 961–967.
Zeghadi, A., N’Guyen, F., Forest, S., Gourgues, A.-F., Bouaziz, O., 2007a. Ensembleaveraging stress–strain fields in polycrystalline aggregates with a constrainedsurface microstructure. Part 1: anisotropic elastic behaviour. PhilosophicalMagazine 87 (8), 1401–1424.
Zeghadi, A., N’Guyen, F., Forest, S., Gourgues, A.-F., Bouaziz, O., 2007b. Ensembleaveraging stress–strain fields in polycrystalline aggregates with a constrainedsurface microstructure. Part 2: crystal plasticity. Philosophical Magazine 87 (8),1425–1446.
1986 P. Evrard et al. / International Journal of Solids and Structures 47 (2010) 1979–1986
Related Documents