i Influence of biosolid stability, temperature and water potential on nitrogen mineralisation in biosolid amended soils by Laurinda Nobela Submitted in partial fulfillment of the requirements for the degree MSc (Agric) Soil Science In the Faculty of Natural and Agricultural Sciences University of Pretoria Supervisor: P.C. de Jager Co-Supervisor: J.G. Annandale February 2011 © University of Pretoria

Welcome message from author
This document is posted to help you gain knowledge. Please leave a comment to let me know what you think about it! Share it to your friends and learn new things together.
Transcript

i
Influence of biosolid stability, temperature and water potential on nitrogen mineralisation in biosolid amended soils
by
Laurinda Nobela
Submitted in partial fulfillment of the requirements for the degree
MSc (Agric) Soil Science In the Faculty of Natural and Agricultural Sciences
University of Pretoria
Supervisor: P.C. de Jager Co-Supervisor: J.G. Annandale
February 2011
©© UUnniivveerrssiittyy ooff PPrreettoorriiaa

ii
DECLARATION
I hereby certify that this thesis I am submitting to the University of Pretoria for the
degree, MSc. (Agric) Soil Science, is entirely my own work, except where duly acknowledged. I also certify that this thesis has never been submitted to any other
tertiary institution for any degree.
Signature __________________________ Date: ______________________

iii
ACKNOWLEDGMENTS
My sincere acknowledgment goes to the following parties for their supportive role that made it possible to achieve this Master‟s degree:
To the Almighty Father for His power and goodness in providing guidance, wisdom and
courage that made it possible for me to complete this degree;
To the Ford Foundation-International Fellowship Program (IFP) in particular the Africa
America Institute (AAI- Mozambique) for financial support without which my studies at this level would have remained but a dream. My special thanks to Dra. Célia Diniz for the affectionate support and encouragement. To the kind team of AAI-Mozambique who
untiringly knew how to support me when I was in need;
The IIAM-Instituto de Investigação Agrária de Moçambique management for giving me permission to leave my duties as employee and enroll in a Master‟s programme;
The Dept. of Plant Production and Soil Science for the important contribution in all aspects from welcoming me to providing facilities and funds for research;
To Mr. Chris de Jager and Prof. J.G. Annandale for their patient and helpful supervision;
My gratitude also goes to Professor Andries Claassens and the laboratory assistants for their technical support;
To my beloved kids Cátia, Tânia and Dionísio for their understanding and accepting
deprivation of their mother‟s physical presence. To my fleshly and spiritual family for all
their loving encouragement and their time spent looking after my little kids;
At last, but not least, to my colleagues that have been on my side sharing their experience and encouraging me all the way.

iv
DEDICATION
To my Parents Xavier Mundau Nobela and Ellen Thussi in particular my Father‟s Soul, who saw this walk beginning and was unable to celebrate this moment of joy!
Rest in peace in God‟s hands!
v
Summary
Soils with inherently low soil fertility, and nutrient depletion of fertile soils, are the root causes of
declining per capita food production in Africa. On the other hand, demand for better water quality
and strict environmental laws have led to an increase in biosolid production. Accumulation of this
waste poses an increasing environmental pollution risk. Disposal methods like incineration, ocean
dumping and land filling are causing enormous environmental and economic problems.
Therefore, municipal authorities have been challenged with the environmental management of
biosolids, whilst many farmers are facing a problem of soil fertility decline. Biosolids of
“Exceptional quality class A” contain high organic matter, plant nutrients and have few
restrictions on use for land application. Therefore, it is a valuable resource. Beneficiation of
sewage sludge through land application is an optional solution to address both soil fertility and
environmental problems. Scientific management of sewage sludge utilization must be observed to
minimize environmental problems. The study of N release and the rate of nitrification from
biosolids is essential to improve nutrient use efficiency, as well as to prevent environmental
pollution. Mineralization and nitrification processes are influenced by several factors, for
instance, the origin and quality of organic material, and soil environmental conditions, of which
moisture and temperature are the most important factors. The study aims to: (i) evaluate biosolid
stability, temperature and soil water effects on net N release from municipal and industrial sludge
amended soil, and (ii) generate important parameters for modeling N dynamics (rate constants
and half life). This dissertation consists of two major experiments: The first experiment was a
fifty six day laboratory incubation study to assess N release and nitrification rate constants in a
biosolid amended soil, as well as the biosolid‟s half life time. The experiment was conducted
using three types of biosolids originated from three different wastewater treatment processes,
subjected to three levels of temperature and three of soil water potentials. The second experiment
was an investigation on sample handling strategy for accurate nitrate (NO3-) and ammonium
(NH4+) determinations. Different handling procedures: Direct field extraction, Field drying
extraction and Laboratory drying extraction were tested on biosolid amended soils. In conclusion,
biosolid stability, temperature and soil water interaction significantly influence mineralization
and nitrification processes. Unstable sludges had higher N mineralization rate constant and
shorter half life times compared to stable sludge, and the Direct field extraction procedure proved
to be the most representative sample handling strategy for determination of N speciation in soils
and biosolid amended soils to get representative time specific data.
vi
TABLE OF CONTENTS
DECLARATION…………………………………………………………………………………. ii
ACKNOWLEGMENTS…………………………………………………………………………. iii
DEDICATION ………………………………………………………………………………….. iv
SUMMARY ……………………………………………………………………………………… v
TABLE OF CONTENTS ……………………………………………………………………...... vi
LIST OF TABLES ……………………………………………………………………………...... x
LIST OF FIGURES …………………………………………………………………………....... xi
ABREVIATIONS ……………………………………………………………………………… xii
CHAPTER I: GENERAL INTRODUCTION
1.1 Soil fertility decline ……………………………………………………………………... 1
1.2 Trends in sewage sludge disposal ………………………………………………………. 2
1.2.1 Disposal strategies ……………………………………………………………….. 3
1.2.2 Advantages of sewage sludge land application ………………………………...…3
1.2.3 Disadvantages of sewage sludge land application ……………………………….. 4
1.2.4 Sewage sludge use regulations in South Africa ………..………………………… 4
1.3 Sample handling strategy for N determination in sewage sludge amended soils………… 6
1.4 Objectives of the study ……………………………………………………………………7
CHAPTER II: LITERATURE REVIEW
2.1 Introduction ………………………………………………………………………...…… 8
2.2 Nitrogen dynamics in the ecosystem ……………………………………………………10
2.2.1 The nitrogen cycle ................................................................................................. 11
2.2.2 Mineralisation of organic nitrogen ....................................................................... 12
2.2.3 Inorganic nitrogen losses ...................................................................................... 13
2.3 Occurrence and abundance of nitrogen in soils ............................................................... 14
2.3.1 Forms of nitrogen taken up by plants .................................................................... 14
2.3.2 Role of nitrogen in plants ...................................................................................... 14
2.3.3 Oversupply of nitrogen .......................................................................................... 15
2.3.4 Deficiency of nitrogen ........................................................................................... 15
2.4 Factors influencing nitrogen mineralisation .................................................................. 16

vii
2.4.1 Soil microbe biomass (SMB)................................................................................. 16
2.4.2 Soil water content and potential ............................................................................ 16
2.4.3 Temperature ........................................................................................................... 18
2.4.4 Substrate quality .................................................................................................... 19
2.4.5 Time ....................................................................................................................... 20
2.4.6 Soil pH ................................................................................................................... 21
2.4.7 Soil texture ............................................................................................................. 21
2.5 Net nitrogen mineralized .................................................................................................. 22
2.6 Kinetics of nitrogen mineralisation .................................................................................. 22
2.7 Half life time (t 1/2) ...……………………………………………………………….…... 24
2.8 Sewage sludges or biosolids ……………………………………………………………. 24
2.9 References ....................................................................................................................... 26
CHAPTER III: SLUDGE STABILITY, TEMPERATURE AND SOILWATER POTENTIAL
EFFECTS ON NET NITROGEN RELEASE
ABSTRACT .................................................................................................................................. 37
3.1 Introduction ...................................................................................................................... 39
3.2 Materials and methods ..................................................................................................... 41
3.2.1 Materials . .............................................................................................................. 41
3.2.2 Methods ................................................................................................................. 42
3.2.3 Treatments ............................................................................................................. 46
3.2.4 Incubation procedure ..………………………………………………………...... 47
3.2.4.1 Establishing water quantities corresponding to selected water potentials .............47
3.2.4.2 Incubation .................................................................................................…….... 47
3.2.4.3 Monitoring water potential and aeration .............................................................. 48
3.2.5 Calculations ......................................................................................................... 49
3.2.5.1 Mass of sludge used to amend the soil ................................................................. 49
3.2.5.2 Extractable and exchangeable NH4+ and NO3
- plus NO2- determinations ……… 51
3.2.5.3 Net N release from the sludge .............................................................................. 52
3.2.5.4 Potentially available N .......................................................................................... 52
3.2.5.5 Organic N mineralized or potential mineralizable N............................................. 53
3.2.5.6 Partial N mass balance …… ………………………………………………….… 53

viii
3.2.5.7 Mineralization rate constant ..................................................................................55
3.2.5.8 Half life time ….. ................................................................................................... 57
3.3 Results and discussion ..................................................................................................... 58
3.3.1 Net N mineralized after a 56-day incubation …………………………………….58
3.3.2 Vlakplaas amended soil: Effects of temperature and water potential on the mineralization process ....................................................................…………...... 60
3.3.3 Olifantsfontein amended soil: Effects of temperature and water potential on the
mineralization process ................................................................................…….. 65
3.3.4 Sasol amended soil: Effects of temperature and water potential on the
mineralization process …………...…...………………………………………… 71
3.3.5 Nitrogen mass balance ...........................................................................................76
3.3.6 Mineralization rate constant and half lifetime ...………………………………... 82
3.4 General discussion……………………………………………………………………… 85
3.5 Conclusions and recommendations ................................................................................... 87
3.5.1 Conclusions ……………………………..……………………………………………… 87
3.5.2. Recommendations ……………………………………………………………………… 88
3.6 Limitations ......................................................................................................................... 88
3.7 References …………………………………………………………………………….... 89
CHAPTER IV: SAMPLING HANDLING STRATEGY
Handling of sewage sludge amended soil samples for nitrate and ammonium analysis ……….. 95
ABSTRACT ................................................................................................................................. 95
4.1 Introduction and background ........................................................................................... 96
4.1.1 Objectives ……………………………………………………………………………… 98
4.2 Materials and methods ..................................................................................................... 99
4.2.1 Materials ................................................................................................................ 99
4.2.2 Methods ................................................................................................................. 99
4.3 Results and discussion.................................................................................................... 102
4.3.1 Sample handling effect on NH4+ and NO3
- content in sludge amended soil ....... 102
4.3.2 Statistical analysis ............................................................................................... 103
ix
4.4 Conclusions and recommendations ................................................................................ 105
4.4.1 Conclusions ………………………………………………………………………...… 105
4.4.2 Recommendations ……………………………………………………………………..105
4.5 References ...................................................................................................................... 106
5 APPENDICES ………………………………………………………………………… 107
A1 Statistical analysis for temperature and water potential effect on net N release ...……. 108
A1.1 Stable Vlakplaas sewage sludge amended soil…………...…………………………….. 108
A1.2 Unstable Olifantsfontein sewage sludge amended soils…...…………………………… 113
A1.3 Unstable Sasol sludge amended soil …………….…………….……………………… 118
A2 Statistical analysis of temperature and water potential effects on NH4+ and on NO3
-.....123
A2.1 Stable Vlakplaas sewage sludge amended soil ………………………………………....123 A2.2 Unstable Olifantsfontein sewage sludge amended soil ..…………….………….….......138
A2.3 Unstable Sasol sludge amended soil ........................……………………………………154
A3 Incubation time and water potential effects on net N release at T3 ……………………..169
A.3. 1 Effect of incubation time on NO3- release at T 2 ...………...………………….………. 179
x
LIST OF TABLES
Table 1.1 Sewage sludge classification system …………..……………...………...……………. 5
Table 2.1 Approximate N distribution in the ecosystem ........…………...…………..………….10
Table 3.1 Some chemical characteristics of the sludges used .…………..………………...……42
Table 3.2 Sludge N composition ………………………….. ………………………………….. .43
Table 3.3 The percentage distribution of N in sewage sludge ……….…...…………….........… 44
Table 3.4 Selected soil physical and chemical properties ……………………………………… 45
Table 3.5 Stable Vlakplaas sludge moisture content .......………………………........................ 50
Table 3.6 Sludge N-forms contained in 50g of sludge amended soil ………………….......…... 54
Table 3.7 Equivalent amounts of N-forms contained in 1kg of sludge amended soil ……......... 55
Table 3.8 Levels of significance between temperature and water potential interaction on N
mineralisation for Vlakplaas sludge amended soil ...........…...........……................… 63
Table 3.9 Ranking and treatment mean comparison of NH4+, NO3
- and net N release for
Vlakplaas sludge amended soil ……........................................................................... 65
Table 3.10 Levels of significance between temperature and water potential interaction on N
mineralization for Olifantsfontein sludge amended soil …………...…...............…...69
Table 3.11 Ranking and mean comparison of NH4+, NO3
- and net N release for Olifantsfontein
sludge amended soil…………………………………………………………….…….70
Table 3.12 Levels of significance between temperature and water potential interaction on N
mineralization from Sasol sludge amended soil ………….…………...…..……….. 74
Table 3.13 Ranking and mean comparison of NH4+, NO3
- and net N release for Sasol
sludge amended soil ………………………………………………….………….…. 75
Table 3.14 Partial N mass balance for the 56-day laboratory incubation with Vlakplaas sludge 77
Table 3.15 Partial N mass balance for the 56-day laboratory incubation with Olifantsfontein
sludge ……………………………………………………………………………….. 79
Table 3.16 Partial N mass balance for the 56-day laboratory incubation with Sasol sludge ....... 81
Table 3.17 N mineralization rate constants and half life times of the fast cycling “pool”...…….83
Table 3.18 Estimated sizes of N pools of different types of sludge investigated …………….... 84
Table 3.19 Mineralization rate and temperature coefficient …………………………………… 84
Table 4.1 Levels of significance for sample handling strategies ……. …………...…...............103
Table 4.2 Ranking and treatment mean comparison ………………………………………...... 104
xi
LIST OF FIGURES
Figure 2.1 Nitrogen cycle in the ecosystem…………………………………………………..… 11
Figure 2.2 Influence of soil moisture on relative microbial activity ...……………………….... 17
Figure 2.3 Influence of temperature on relative microbial activity …………………………..... 19
Figure 3.1 Schematic representation of treatments …………………………………………...... 46
Figure 3.2 Net N mineralization compared to net N release........................................................ 58
Figure 3.3 Net N release from stable Vlakplaas sewage sludge amended soil ……….………... 62
Figure 3.4 Net N release from unstable Olifantsfontein sewage sludge amended soil …........... 68
Figure 3.5 Net N release from unstable Sasol sludge amended soil …………………................ 73
Figure 3.6 The natural logarithm of organic N decay and estimated rate constants (slope of
graphs) for Sasol and Olifantsfontein sludge (a) compared to that of Vlakplaas (b) ........82
Figure 4.1 Concentration of NH4+ and NO3
- versus sample handling procedures ………….....103

xii
Abbreviations
CIAT- Centro Internacional para Agricultura Tropical/ International Centre for Tropical
Agriculture
DEAT- Department of Environmental Affairs and Tourism
DEF- Direct Field Extraction
DoA- Department of Agriculture
DoH- Department of Health
DWAF- Department of Water Affairs and Forestry
EUUWTD- European Union Urban Wastewater Treatment Directive
ERWAT- East Rand Water Care Company
FC- field capacity
FDE- Field Dried Extraction
ICRAF- International Centre for Agro-forestry research
LDE- Laboratory Dried Extraction
NMIT- Nitrogen mineralization immobilization turnover
SASOL- Suid Afrikaanse Steenkool en Olie Maatskappy / South African Coal and Oil Company
SOM- Soil organic matter
SMB- Soil microbe biomass
TSBF- Tropical Soil Biology and Fertility programme
UK- United Kingdom
USA- United States of America
USEPA- United States Environmental Protection Agency
WWTP- Waste water treatment plant
1
CHAPTER I: GENERAL INTRODUCTION
1.1 Soil fertility decline
Soil fertility is the status of a soil that gives an indication of its potential to supply plant nutrients. Its
evaluation is based on soil physical and chemical properties. It varies with time, place, and
agricultural use. Fertile soil, when located in an agro-ecological region suitable for crop growth, is
considered potentially productive.
Many agricultural lands are continuously losing their productivity as a result of soil fertility decline
and/or as a result of utilization of soils with inherent low soil fertility (Folmer et al., 1998; Dowgill
et al., 2002). Decrease in soil productivity has been observed in more than 10 % of cultivated land
worldwide, since the 1980‟s (Burns et al., 2006; Francavigilia, 2004; CIAT, ICRAF and TSBF,
2002).
Low levels of food production in Africa results from intensive extraction of plant nutrients without
any replenishing measures (Stoorvogel and Smaling, 1990; Buresh et al., 1997; Scoones, 2001). In
Kenya, according to Smaling (1993) most forest and grassland soils showed a significant decline in
fertility after being cleared and cultivated continuously with no replenishment of nutrients.
The removal of soil nutrients by crops was greatly exceeding any inputs as a result of insufficient
fallow period to recycle back plant nutrients, or in areas of continuous cultivation in, sub-Saharan
Africa, (Smaling, 1993). Negative nutrient balance for N, P, and K in several East and Southern
Africa studied soils was evident (Stoorvogel and Smaling, 1990; Stoorvogel et al., 1993; Dowgill et
al., 2002).
The evidence of soil fertility degradation is the manifestation of plant nutrient deficiencies, low soil
organic matter content and higher soil erodibility. Along with erosion, nutrient depletion represents
the major land degradation threats in Southern Africa.
Nitrogen (N) and phosphorus (P) are the essential macro-nutrients often limiting crop production,
and can be supplied through applications of inorganic fertilizers. However, due to economic reasons

2
most farmers cannot afford to purchase mineral fertilizers (Waddington, 2003; Nhemachena et al.,
2003). Therefore the use of locally available organic sources of plant nutrients is a valuable
alternative for the maintenance and recovery of soil fertility.
The Rockefeller Foundation hosted a workshop in March 2002, with the purpose to create a forum to
address issues related to recovery measures of soil fertility decline. Various international institutes
(International center for tropical agriculture-CIAT, International center for agro-forestry research-
ICRAF and Tropical soil biology and fertility programme- TSBF) joined their efforts to find
solutions for combating nutrient depletion.
An integrated natural resource management concept was proposed to steer the research related to soil
fertility recovery. This concept resides in the utilization of locally available natural resources in both
an economical and environmentally sustainable way. In agricultural lands nutrients exported by the
crops need to be replaced through the addition of readily available sources of nutrients (cost
effective) and sustainable agricultural practices management should be implemented (environmental
friendly).
Therefore from an African perspective soil fertility management research should focus on ways to
increase crop production with minimal use of inorganic fertilizers, and supplementing with organic
sources such as animal manure, crop residues, legume based green manure, municipal and industrial
wastes, and etc (CIAT, ICRAF and TSBF, 2002; Rowe and Giller, 2003).
1.2 Trends in sewage sludge disposal
Sewage sludge is a by-product of water care works plants, rich in organic matter and plant nutrients.
It is a possible organic source that can be utilized in urban and peri-urban areas, in South Africa and
other African cities where water care works does exist.
Ever increasing volume of sewage sludge is produced as a result of the growing human population
on earth. Additionally, better water quality is being demanded and stricter environmental laws
prescribed, thereby also contributing to an increase in sewage sludge production.
3
Accumulation of produced sewage sludge is a problem due to its negative sanitary status and
polluting effect. As a result sewage sludge disposal became a global challenge (Peverly, 1996;
Smith, 1996; Walter et al., 2006). The situation in South Africa with regards to sewage sludge
production also reflects this global trend.
1.2.1 Disposal strategies
In the past incineration, ocean dumping and land filling at sacrificial site were common sewage
sludge disposal strategies. Sewage sludge disposal through ocean dumping was banned in the USA
in 1991. This practice was also banned in Europe in 1998 through the implementation of the
EUUWTD- 91/271/EC (European Union Urban Wastewater Treatment Directive. High energy
requirement limits incineration and scarcity of land resource also reduces land filling as a disposal
option. Sewage sludge disposal, through land application is increasingly seen as a viable strategy
(Mc Grath et al., 1994; Peverly, 1996; Snyman et al., 1998; Kelly et al., 1999; Bowler, 1999;
Debosz et al., 2002; IWA, 2003; Bengtsson and Tillman, 2004; Van Niekerk et al., 2005).
More than 60 % of produced sewage sludge in USA is land applied, and is expected to increase up to
80 % by 2010, while landfill disposal is at 34 % and may decrease to 30 % (USEPA, 1999). In UK
sewage sludge land application was estimated to increase from 50 to 66 % and a landfill disposal
reduction from 10 to 6 % between 1995 to 2005 (Bowler, 1999).
1.2.2 Advantages of sewage sludge land application
Sewage sludge is an organic material rich in plant nutrients and potentially could enhance soil
fertility as a supplier of plant nutrients and improver of soil physical properties. Therefore land
application has been considered a better utilization option (Mc Grath et al., 1994; Smith, 1996;
Peverly, 1996; Snyman et al., 1998; Kelly et al., 1999; Bowler, 1999; Debosz et al., 2002; IWA,
2003; Bengtsson and Tillman, 2004; Van Niekerk et al., 2005; Hseu and Huang, 2005).

4
Based on the advantages of the sewage sludge land application strategy, one could consider it as a
solution for both agricultural and environmental problems stated above. Because it can enhance
nutrient status of soil and reduce the level of the pollution risk, however, have some disadvantages.
1.2.3 Disadvantages of sewage sludge land application
Though sewage sludge land application strategy has a beneficial effect on soil fertility recovery and
the maintenance of a safe environment, an excessive application may cause serious human health
and environmental problems, as a result of heavy metal pollution, pathogens and NO3-N pollution of
surface and ground waters (Wortman and Binder, 2002).
Based on the stated disadvantages it is obvious that a comprehensive soil nutrient management plan
is decisive to maintain both the agronomical and environmental sustainability of sewage sludge land
application (Bastian, 2005). Rulkens (2003), Snyman and van der Waals (2004) reported on the
importance of establishing sustainable regulations for sewage sludge use in agriculture.
Characterization of sewage sludge and determination of the breakdown and release of nutrients and
other elements are important considerations when determining suitable application rates (USEPA,
1994; Navas et al., 1997; Wortman and Binder, 2002; Bengtsson and Tillman, 2004).
1.2.4 Sewage sludge use regulations in South Africa
Not all produced sewage sludge are feasible for agricultural use, deciding whether such sewage
sludge meet the legal requirements for use is a conjectural process and a great responsibility
attributed to several government departments. The Department of Water Affairs and Forestry
(DWAF), Department of Environmental Affairs and Tourism (DEAT), Department of Health (DoH)
and Department of Agriculture (DoA), join their efforts on maintaining a sustainable utilization of
sewage sludge. For them to authorize, sewage sludge must go through the South African waste water
sludge classification system.
Sewage sludge classification is based on three classes: the Microbial, the stability and the pollution
classes, with three levels each (Table 1.1). Therefore, sewage sludge is tested for several criterions
in order to be placed on the respective type. For Microbial class the criteria are faecal coliforms and

5
helminth ova content, for pollution are certain heavy metals and elements considered potentially
toxic and for stability the indicator is the vector attraction potential (Snyman and Herselman, 2006).
Table1.1: Sewage sludge classification system
Classes Levels
Microbial A B C
Stability 1 2 3
Pollution a b c
Sewage sludge of microbial class “A”, Stability class “1” and pollutant class “a”, is used for land
application, on the rate established, while all other classes have same restrictions. However, if it falls
to class “B”, “2” no matter if pollutants are at level “a” its use is restricted. When, is sludge of
microbial class “C”, is not allowed for agricultural use (Snyman and Herselman, 2006).
South African guidelines recommend application rates not exceeding crop N requirement to an upper
limit of 10 tons of sewage sludge per ha per year, to prevent NO3-N leaching (Snyman and
Herselman, 2006). Differences in the sewage sludge sources and soil types might exert considerable
influence on sludge N availability, though not considered.
The relative composition of domestic and industrial waste streams contributes to the final nutrient
content of sewage sludge. Sewage sludge stability, which is a function of treatment process, may
influence the way sewage sludge release nutrients. This explains the reason why relative
composition of sewage sludge from different loads in the same treatment plant differs.
The majority of N in sewage sludge is present in an organic form and has to be converted into
inorganic N forms that are available for plants. This conversion process is governed by soil living
organisms, therefore soil environmental factors influencing microbial activity, will greatly influence
the N mineralization rate.
6
Understanding the fate and transformations of nitrogen in sewage sludge amended soils is important
for effective use of sewage sludge as soil amendment, in order to meet crop demand and at the same
time also minimize environmental problems (Serna and Pomares, 1992; Gaines and Gaines, 1994;
Smith et al., 1998; Waddington, 2003).
Furthermore, research on the release of N from sewage sludge amended soils is necessary to
parameterize models in order to predict N and nutrient balance, and gain short, medium and longer
term predictive capability on N dynamics Modeling the movement of N in sewage sludge amended
soils involves various parameters, such as temperature, moisture regime, quality of sewage sludge
and period from application.
1.3 Sample handling strategy for N determination in sewage sludge amended soils
Changes in soil chemical properties „nutrient forms and content‟ occur as a result of pre-treatment
given to soil sample after collection, nitrogen element, is easily transformed within its speciation
forms.
Mineralization and nitrification are ongoing processes. Therefore, the handling of biosolid amended
soil samples will determine how representative the determined nitrate and ammonium speciation is
to what is available in the soil at the time of sampling.
Field validation of mineralization and nitrification rates is essential for accurate prediction and
modeling of the environmental fate of nitrogen entering the soil system through biosolids
application.
Soil nitrate and ammonium levels are temporarily highly variable as the net result of mineralization,
immobilization, leaching, volatilization and denitrification; change with soil water content, soil
temperature, quantity and quality of organic inputs (Follett, et al., 1987; Stenger et al., 1995; Er, et
al., 2004; Hai-Xing and Sheng-Xiu, 2006).
7
Inadequate sample handling procedure after sampling may lead to results that are not representative
to the site situation. Therefore soil sampling and handling procedures should be consistent and
representative.
This dissertation consists of two experiments to investigate: temperature, water potential and sludge
stability effect on N mineralization, and the second was to test three sample handling procedures
(Direct field extraction, Field dried extraction and Laboratory dried extraction) in a sewage sludge
amended soil.
1.4 Objectives of the study
The objectives of the study were to:
i) Determine the net inorganic nitrogen release [(NO3- plus NO2
-) and NH4+] as a function
of temperature and water potential;
ii) Determine the influence of sewage sludge stabilization on N release;
iii) Determine the rate constant, potentially mineralizable N, and half life time ;
iv) Assess the influence of soil sample handling on the dynamic of NO3-N and NH4-N
speciation in sewage sludge amended soils.
To fulfill these objectives, a laboratory incubation study was conducted under different
environmental conditions in terms of temperature and soil water using a sandy clay loam soil. The
soil was amended with sludge, corresponding to 10 t ha-1 on a dry mass basis. Three types of sludge
of different stability, collected from different wastewater care works plants were used. A sample
handling strategy experiment was also conducted, where three different sample handling procedures
were tested based on nitrate and ammonium determinations. This dissertation covers four parts as
follow: General introduction, Literature review, Incubation experiments and Sample handling
strategy experiment.
8
CHAPTER II: LITERATURE REVIEW
2.1 Introduction
Developing countries are faced with low crop production, caused either by the continued utilization
of soils with inherent low soil fertility or soil fertility degradation. Nitrogen and phosphorus are the
common plant nutrients limiting the crop production; supply of these nutrients through inorganic
fertilizers increases the crop production. However, most farmers do not have financial support to
purchase fertilizers (Stoorvogel and Smaling, 1990; Buresh et al., 1997; Folmer et al., 1998;
Scoones, 2001; Waddington, 2003). Organic sources are valuable nutrient sources to supplement
inorganic fertilizers and an alternative for resource poor farmers to increase crop yield.
Organic sources can encompass any remains of plants, animals, microorganisms, animal excreta and
municipal solid wastes. These organic material after being broken down, turns into important
sources of plant nutrients and helps to maintain or build up soil organic matter.
In general soil organic matter has a positive effect on the physical, chemical and biological soil
properties, such as water retention, aeration, erodibility, cation exchange capacity, nutrient
availability and microbe activity. Therefore, soil organic matter is a key component of the soil, “the
foundation of a fertile soil”. Hence the maintenance of sufficient soil organic matter levels is a
prerequisite for sustainable crop yields. For this reasons, research on soil fertility management in
developing countries is currently oriented to increase crop production using organic sources with
minimal use of inorganic fertilizers (Ward et al., 1987; Buresh et al., 1997; Waddington, 2003; Wolf
and Snyder, 2003).
These sources are an economically and environmental viable options, only if well managed.
However, the efficient use and management of organic sources requires a good understanding of
their nutrient release “mineralization processes”.
According to Hseu and Huang (2005) more than 50 % of the total N in sewage sludge is organic,
quoting (Sommers, 1977) therefore, it is necessary to determine N mineralization rate and predict N
availability.

9
Mineralization of organic N in sewage sludge amended soils is a complex process mediated by soil
organisms that are influenced by several factors such as soil type, pH, temperature, moisture, quality
and quantity of applied sewage sludge, (Serna and Pomares, 1992; Sierra et al., 2001; Hernandez et
al., 2002; Wang et al., 2003; Zaman and Chang, 2004; Van Niekerk et al., 2005; Agehara and
Warncke, 2005).
Though mineralization rate is also a function of factors other than climatic ones (temperature and
moisture), the obtained models for nitrogen mineralization considered these two as the dominant soil
environmental factors. Therefore, they are still empirical models and cannot be reliably applied to a
particular soil situation, because they miss factors like soil type (Leiros et al., 1999; Van Niekerk et
al., 2005).
This chapter will focus on nitrogen dynamics in the ecosystem, as well as factors affecting N
transformations among different N-forms; the economical and environmental problems of
production and disposal of sewage sludge; on the importance of sewage sludge use in agricultural
lands, on N mineralization processes occurring in sewage sludge amended soils and also the kinetics
involved on these processes.
10
2.2 Nitrogen dynamics in the ecosystem
Nitrogen is widely distributed in nature and can be found in the atmosphere, the lithosphere, and the
hydrosphere. The atmosphere is the main reservoir of nitrogen with about 78 % of gaseous nitrogen
(N2) which is in equilibrium with all fixed forms of N in soil, seawater, and living and nonliving
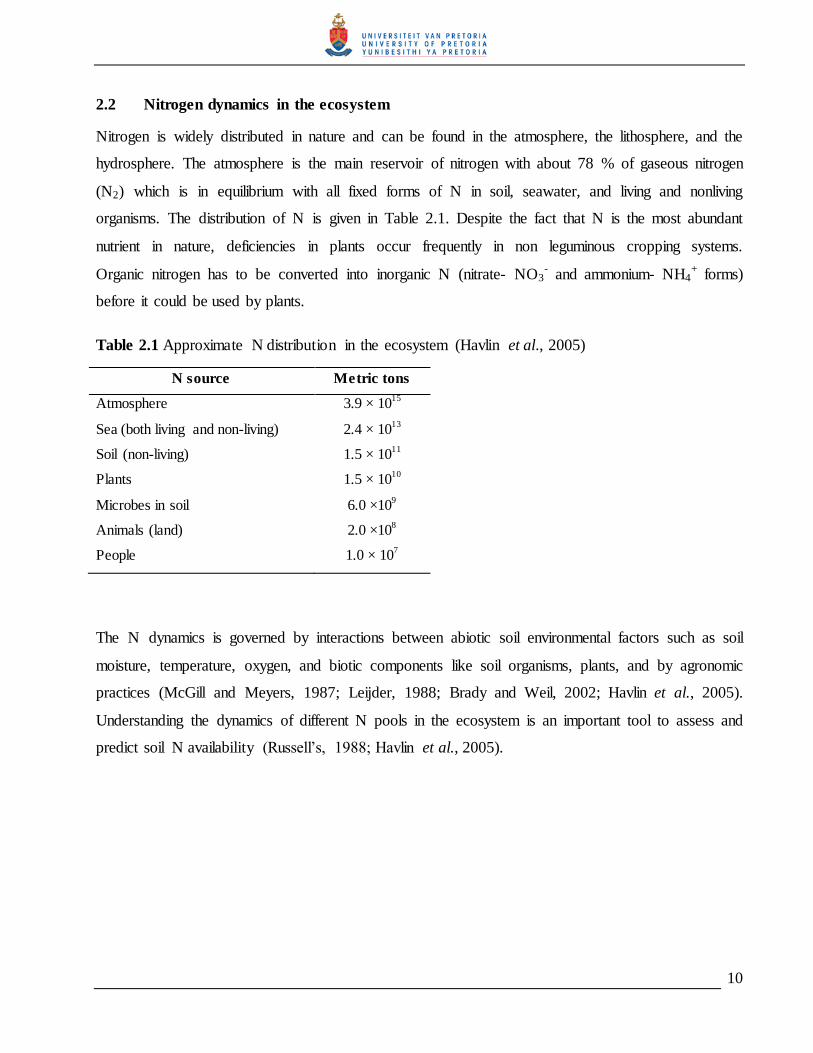
organisms. The distribution of N is given in Table 2.1. Despite the fact that N is the most abundant
nutrient in nature, deficiencies in plants occur frequently in non leguminous cropping systems.
Organic nitrogen has to be converted into inorganic N (nitrate- NO3- and ammonium- NH4
+ forms)
before it could be used by plants.
Table 2.1 Approximate N distribution in the ecosystem (Havlin et al., 2005)
N source Metric tons
Atmosphere 3.9 × 10¹⁵
Sea (both living and non-living) 2.4 × 10¹³
Soil (non-living) 1.5 × 10¹¹
Plants 1.5 × 10¹⁰
Microbes in soil 6.0 ×10⁹
Animals (land) 2.0 ×10⁸
People 1.0 × 10⁷
The N dynamics is governed by interactions between abiotic soil environmental factors such as soil
moisture, temperature, oxygen, and biotic components like soil organisms, plants, and by agronomic
practices (McGill and Meyers, 1987; Leijder, 1988; Brady and Weil, 2002; Havlin et al., 2005).
Understanding the dynamics of different N pools in the ecosystem is an important tool to assess and
predict soil N availability (Russell‟s, 1988; Havlin et al., 2005).

11
2.2.1 The nitrogen cycle
The conceptual idea of the N cycle date back to 1913 when it was first formulated by Lohnis, and
since 1950‟s diagrams have been drawn to illustrate the pathway of N in the ecosystem (Paul and
Clark, 1988). However, its complexity is scientifically challenging (Jarvis, 1996). Cycling of N
involve many transformations between inorganic and organic forms (Fig. 2.1).
Figure 2.1 Nitrogen cycle in the ecosystem (soil/plant/animal/air) (Stevenson, 1982)
The atmosphere is the primary source of N as shown in the above figure, whereby lightning oxidizes
the atmospheric N2 into NO3-- N that is deposited in soils through rain precipitation, fixation through
free living bacteria, and symbiotically leaving bacteria, industrially N-fixation and man application
of organic and inorganic sources. Organic materials in soils undergo decomposition and accumulate
12
as soil organic matter that contains plant nutrients in organic forms, which in turn can transform into
inorganic forms through mineralization.
Inorganic N in the form of NH4+-N and NO3
--N can be taken up by plants, or immobilized by soil
microorganisms. Soil microbial population and plants compete for inorganic N forms. Rapidly
growing microorganisms can immobilize NH4+ and NO3
-, therefore, depleting temporarily the
availability of N to plants. NH4+ can also be adsorbed on the edges of clay particles, or fixed in soil
clay minerals such as illite and vermiculite; meanwhile NO3- can also be lost to the atmosphere
through denitrification or leached below the active root zone (Brady and Weil, 2002; Havlin et al.,
2005).
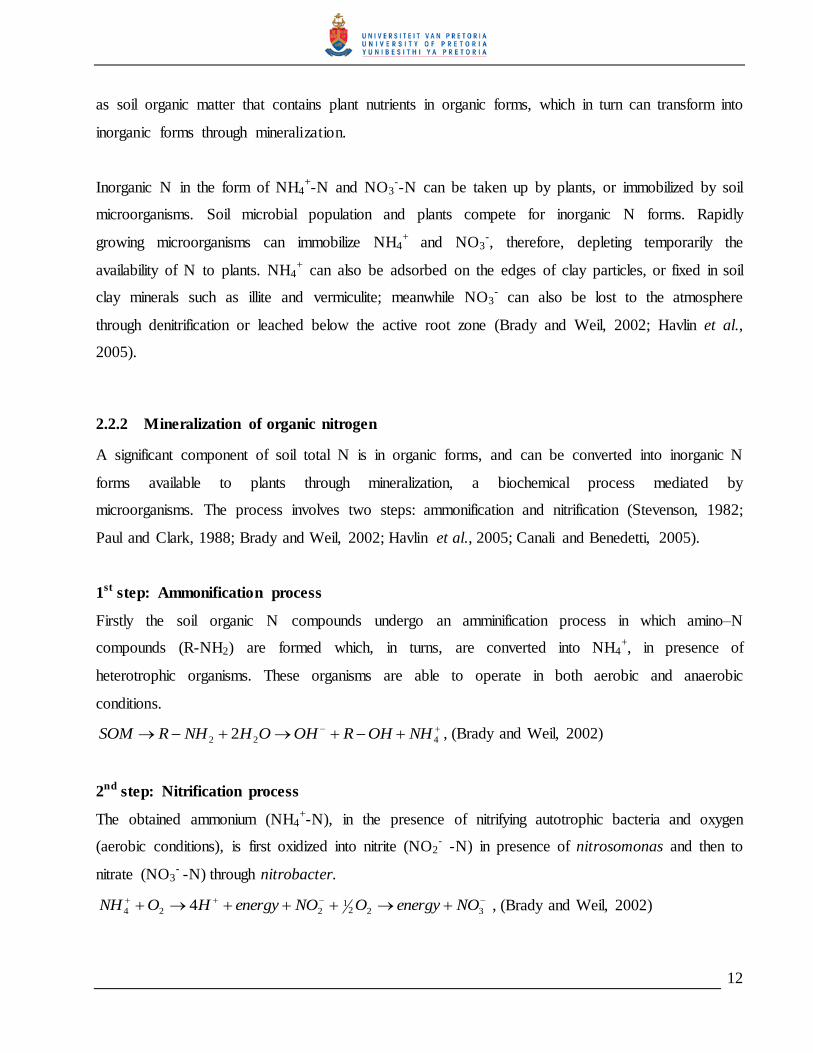
2.2.2 Mineralization of organic nitrogen
A significant component of soil total N is in organic forms, and can be converted into inorganic N
forms available to plants through mineralization, a biochemical process mediated by
microorganisms. The process involves two steps: ammonification and nitrification (Stevenson, 1982;
Paul and Clark, 1988; Brady and Weil, 2002; Havlin et al., 2005; Canali and Benedetti, 2005).
1st step: Ammonification process
Firstly the soil organic N compounds undergo an amminification process in which amino–N
compounds (R-NH2) are formed which, in turns, are converted into NH4+, in presence of
heterotrophic organisms. These organisms are able to operate in both aerobic and anaerobic
conditions.
422 2 NHOHROHOHNHRSOM , (Brady and Weil, 2002)
2nd step: Nitrification process
The obtained ammonium (NH4+-N), in the presence of nitrifying autotrophic bacteria and oxygen
(aerobic conditions), is first oxidized into nitrite (NO2- -N) in presence of nitrosomonas and then to
nitrate (NO3- -N) through nitrobacter.
3221
224 4 NOenergyONOenergyHONH , (Brady and Weil, 2002)
13
2.2.3 Inorganic nitrogen losses
Not all mineralized N is used by plants and microorganisms, a fraction of it can be lost through
volatilization, denitrification and leaching.
2.2.3.1 Volatilization
May occur under alkaline or dry soil conditions, losses can vary from 3 to 50 %; volatilization
increase with increasing temperature up to about 45 oC
OHNHOHNHOHNH 2344
(Brady and Weil, 2002)
In calcareous soils volatilization is given by the equation.
2 CaCONHCaCONH
32434
22323324 2 COOHCOHNHCONH
(Havlin et al., 2005)
2.2.3.2 Denitrification
Occur under anaerobic conditions, and warm environment. The anaerobic organisms obtain their
oxygen from the nitrate and nitrite ions
2221
2221
2223 222 NOONONOONOONO (Brady and Weil, 2002)
2.2.3.3 Leaching
Nitrate ions are very soluble and highly mobile in the soil. Therefore, soil water exceeding the water
holding capacity result in excessive water movement causing losses of NO3- through runoff and
leaching processes (Havlin et al., 2005).
Understanding the gain and loss processes for distinct N-forms, as well as the factors influencing
their changes, forms the basis of an efficient management of N in agricultural land. In general, losses
can range between 40 to 60 % of applied N, however, under poor management losses may reach 80
% (Leijder, 1988).
14
2.3 Occurrence and abundance of nitrogen in soils
Generally a high proportion of the total N in surface soils is organic (about 95 %). N content in
mineral soils may vary between 0.02 to 0.5 %, while organic soils exhibit values up to 2.5 %. In
general soil organic matter (SOM) contains about 5 % of N, therefore, the distribution of N in soils
follows the same pattern as SOM distribution. For instance, aridisols are generally poor in both
organic matter and organic N, on the other hand histosols and mollisols are rich in organic matter
and consequently high in organic N. Andisols are an exception, having higher organic C than any
other mineral soil, the reason is the presence of allophane clays that bind organic matter protecting it
from being oxidized (Mengel and Kirkby, 1987; Brady and Weil, 2002; Havlin et al., 2005).
2.3.1 Forms of nitrogen taken up by plants
Plant roots absorb N in soil solution in the forms of NO3- and NH4
+ ions, the uptake of NO3- implies
an exudation of HCO3- and OH- from the roots increasing the pH of the rhizosphere. NH4
+ uptake is
accompanied by the release of H+ from the root into the soil solution resulting in a decreasing of the
pH of the rhizosphere. In both cases the effect on pH may influence the availability and uptake of
other nutrients. Under field conditions the rate of NH4+ uptake is lower compared to NO3
-, as a result
most crops have higher response to NO3-N applications than to NH4 -N fertilizers due to high
mobility of nitrate and possible fixation of ammonium (Mengel and Kirkby, 1987; Brady and Weil,
2002; Havlin et al., 2005).
2.3.2 Role of nitrogen in plants
Nitrogen is a very important element for plant growth as an integral component of many plant
compounds, such as chlorophyll, and proteins. Therefore, N has an important role in the
photosynthesis process, carbohydrates utilization within the plant as well as in the transferring of
genetic characteristics. N also stimulates the uptake of other plant nutrients, and induces vegetative
growth (Stevenson, 1982; Leijder, 1988; Mengel and Kirkby, 1987; Havlin et al., 2005).
The nitrogen content in plant varies with plant age and depends on the plant part. The removal of
soil N by crops also vary between plant species, being low in root crops 0.5 to 1.0 %, medium in
trees and grain crops 1 to 2.5 %, and high in leguminous crops 3 to 5 % (Leijder, 1988).
15
2.3.3 Oversupply of nitrogen
Excessive N supply decreases the quality of products, because N enhances excessive vegetative
growth, poor flowering and seed formation, and retard maturation. Plants may also grow taller and
be more susceptible to lodging when exposed to wind and rain. Oversupply of N can also weaken
tissue resulting in high susceptibility to pest and fungal diseases, e g. chocolate spot in maize, brown
rust in barley, brown leaf spot in rice and fusarium graminearum in wheat. Undesirable color and
flavor of fruits, lower sugar and vitamin content of certain vegetables and crop roots are also
reported (Leijder, 1988; Mengel and Kirkby, 1987; Brady and Weil, 2002; Havlin et al., 2005).
Another negative effect is that an excess NO3- in soils may lead to environmental degradation of
groundwater due to leaching and surface water due to runoff (Brady and Weil, 2002). Soil NO3-N
exceeding the permissive contaminant level will negatively affect water quality (Sparks, 2003).
Drinking water polluted with NO3--N causes diseases in animals and humans such as
methemoglobinemia or blue baby syndrome (Brady and Weil, 2002).
The department of National Health and Population Development in South Africa established 10 mg
L-1 N in the nitrate form, as the upper standard value for drinking water (Korentajer, 1991); This
value is equal to the limit set by the United States regulatory agency for environmental protection
(Brady and Weil, 2002; Sparks, 2003).
2.3.4 Deficiency of nitrogen
Soil nitrogen deficiency limits crop productivity as it decreases the production level and quality of
products (low protein and high sugar contents), The main symptoms are leaves with pale yellow
green colors (chlorosis), which is first observed in the older leaves due to translocation of proteins
from its chloroplasts to younger leaves. Other symptoms includes die-back from the tip, stunted
plants, thin and spindly stems (low shoot-to-root ratio), and quicker maturity than healthy plants
(Mengel and Kirkby, 1987; Paul and Clark, 1988; Leijder, 1988; Russell‟s, 1988; Brady and Weil,
2002; Havlin et al., 2005).
16
2.4 Factors influencing nitrogen mineralization
Mineralization and immobilization processes are mediated by soil organisms, therefore all factors
influencing the occurrence and activity of soil organisms will affect N mineralization/
immobilization turnover (NMIT). Environmental factors (temperature and moisture), nature, quality
and abundance of organic source, soil type influence mineralization process, as they affect microbial
activity (Terry et al., 1981; Mengel and Kirkby, 1987; Paul and Clark, 1988; Russell, 1988; Jarvis et
al., 1993; Leiros et al., 1999; Brady and Weil, 2002; De Neve et al., 2004; Er, et al., 2004; Snyman
and Van der Waals, 2004; Zaman and Chang, 2004; Havlin et al., 2005).
2.4.1 Soil microbe biomass (SMB)
Soil microbial biomass (SMB) is an important component of soil organic matter (SOM) that
regulates transformation and storage of soil nutrients. It forms part of the labile fraction of SOM, and
contains 1 to 3 % of total carbon and up to 5 % of the total nitrogen. To understand the nutrient
fluxes in natural and agricultural ecosystems, evaluation of the size, diversity and activity of the
SMB are necessary (Hortwath and Paul, 1994). Additions of carbon in the form of sugars leads to an
increase in SMB activity and consequently a higher N released due to the increased N mineralization
(Heal et al., 1997; De Neve et al., 2004).
2.4.2 Soil water content and potential
Soil water content and potential are important factors controlling the microbial activity, and in turn,
soil organic carbon and organic N turnover. Soil water influences the mobility of microbial cells in
soil while water potential determines the ability of microbes to maintain their activity and survival
during periods of water stress. Soil water also affects aeration, and regulates the oxygen supply to
microbes (McInnes et al., 1992).
Both low and high soil water content influence the microbial activity negatively. Sierra et al. (2001)
found nitrifiers more sensitive to changes in water potential, where their activity was inhibited at -
1500 kPa. Low soil water content decreases the mobility of soil microbes thus reducing the
microbial activity, while high soil moisture creates an anaerobic condition. Therefore, limiting the
17
availability of oxygen to SMB thus, limiting the activity of nitrifying bacteria and favor
denitrification process.
It is reasonable to expect that at water potential between –10 to –30 kPa, often used to approximate
field capacity, optimal microbial activity can be expected. At this stage the soil water is available for
plants and also for microbial growth. Soil microbial activity was reported to be optimum at –50 kPa
and decreased as the soil becomes waterlogged (near zero water potential) or more dry (high
negative water potentials). While at reduced soil water potential close to –1500 kPa plants suffer
from water stress and microbial growth and its activity are depressed, (Mengel and Kirkby, 1987;
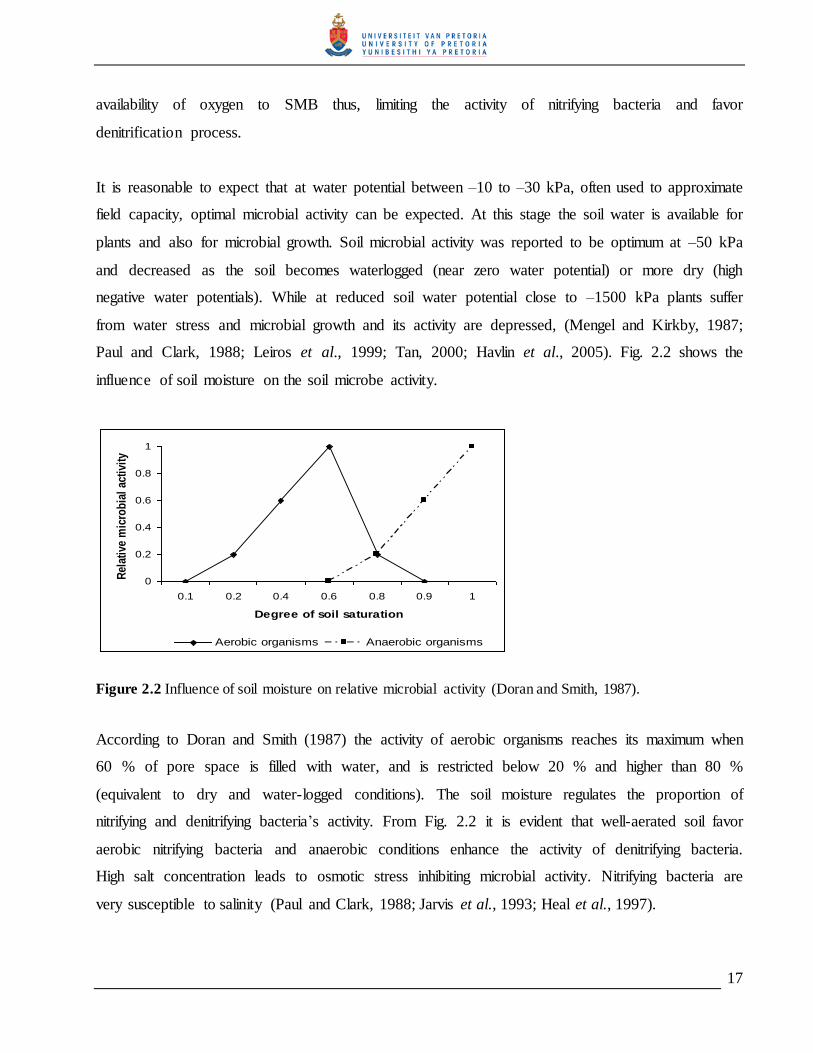
Paul and Clark, 1988; Leiros et al., 1999; Tan, 2000; Havlin et al., 2005). Fig. 2.2 shows the
influence of soil moisture on the soil microbe activity.
Figure 2.2 Influence of soil moisture on relative microbial activity (Doran and Smith, 1987).
According to Doran and Smith (1987) the activity of aerobic organisms reaches its maximum when
60 % of pore space is filled with water, and is restricted below 20 % and higher than 80 %
(equivalent to dry and water-logged conditions). The soil moisture regulates the proportion of
nitrifying and denitrifying bacteria‟s activity. From Fig. 2.2 it is evident that well-aerated soil favor
aerobic nitrifying bacteria and anaerobic conditions enhance the activity of denitrifying bacteria.
High salt concentration leads to osmotic stress inhibiting microbial activity. Nitrifying bacteria are
very susceptible to salinity (Paul and Clark, 1988; Jarvis et al., 1993; Heal et al., 1997).
0
0.2
0.4
0.6
0.8
1
0.1 0.2 0.4 0.6 0.8 0.9 1
Degree of soil saturation
Rel
ativ
e m
icro
bia
l ac
tivi
ty
Aerobic organisms Anaerobic organisms
18
2.4.3 Temperature
Temperature is one of the main environmental factors controlling microbial activity, and therefore
the decomposition and mineralization processes. The influence of temperature on nitrogen
mineralization can be evaluated through the following equations:
i) Arrhenius equation- which assumes the energy of activation for the process to be constant;
TtREaeN/1/1/
Where N is the rate of nitrogen mineralization at temperature t, T is the optimal incubation
temperature, Ea the activation energy expressed in kJ mol-1.
ii) Van‟t Hoff equation, which assumes the exponential relationship between the rate of the
mineralization process and the temperature:
TtbeN ; beQ 10
10
Where N stands for mineralization rate, b a rate constant, t the temperature of mineralization, T the
optimal incubation temperature, and Q10 is the temperature coefficient. This coefficient (Q10) is
equal to 2 over the range of 5 to 35 oC, meaning that change in mineralization and nitrification rate is
twofold when temperature shifts in 10 oC.
Temperature increase accelerates the decomposition of organic matter and the mineralization
process, up to a certain threshold. High temperature (> 45 oC) has a negative effect on these
processes. The optimum temperature ranges between 25 to 35 oC, at extreme temperatures such as
below 5 oC and higher than 40 oC, the microbial activity is depressed or ceases (Mengel and Kirkby,
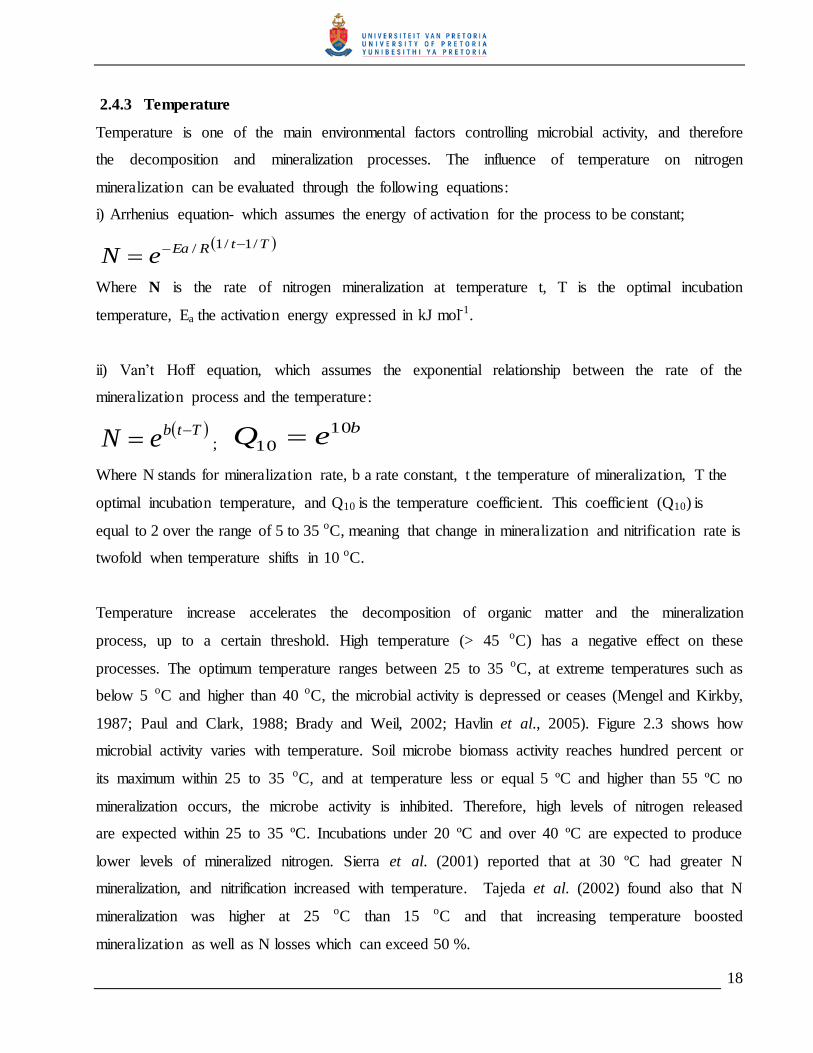
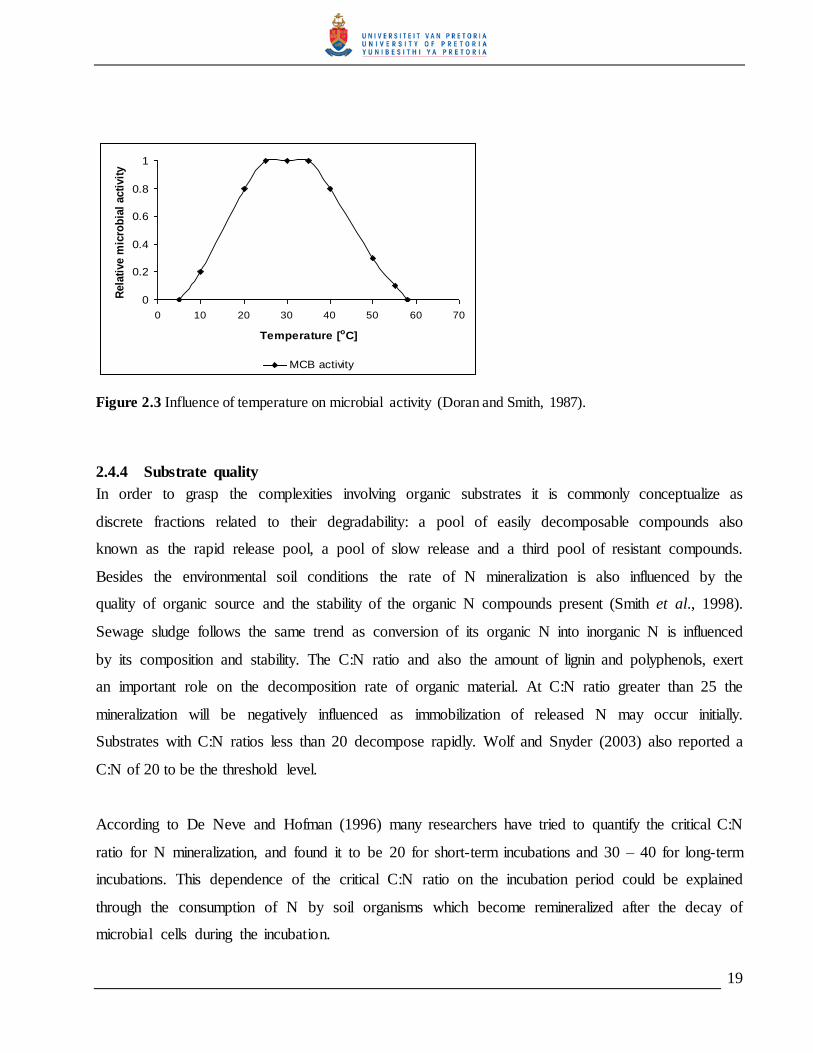
1987; Paul and Clark, 1988; Brady and Weil, 2002; Havlin et al., 2005). Figure 2.3 shows how
microbial activity varies with temperature. Soil microbe biomass activity reaches hundred percent or
its maximum within 25 to 35 oC, and at temperature less or equal 5 ºC and higher than 55 ºC no
mineralization occurs, the microbe activity is inhibited. Therefore, high levels of nitrogen released
are expected within 25 to 35 ºC. Incubations under 20 ºC and over 40 ºC are expected to produce
lower levels of mineralized nitrogen. Sierra et al. (2001) reported that at 30 ºC had greater N
mineralization, and nitrification increased with temperature. Tajeda et al. (2002) found also that N
mineralization was higher at 25 oC than 15 oC and that increasing temperature boosted
mineralization as well as N losses which can exceed 50 %.
19
Figure 2.3 Influence of temperature on microbial activity (Doran and Smith, 1987).
2.4.4 Substrate quality
In order to grasp the complexities involving organic substrates it is commonly conceptualize as
discrete fractions related to their degradability: a pool of easily decomposable compounds also
known as the rapid release pool, a pool of slow release and a third pool of resistant compounds.
Besides the environmental soil conditions the rate of N mineralization is also influenced by the
quality of organic source and the stability of the organic N compounds present (Smith et al., 1998).
Sewage sludge follows the same trend as conversion of its organic N into inorganic N is influenced
by its composition and stability. The C:N ratio and also the amount of lignin and polyphenols, exert
an important role on the decomposition rate of organic material. At C:N ratio greater than 25 the
mineralization will be negatively influenced as immobilization of released N may occur initially.
Substrates with C:N ratios less than 20 decompose rapidly. Wolf and Snyder (2003) also reported a
C:N of 20 to be the threshold level.
According to De Neve and Hofman (1996) many researchers have tried to quantify the critical C:N
ratio for N mineralization, and found it to be 20 for short-term incubations and 30 – 40 for long-term
incubations. This dependence of the critical C:N ratio on the incubation period could be explained
through the consumption of N by soil organisms which become remineralized after the decay of
microbial cells during the incubation.
0
0.2
0.4
0.6
0.8
1
0 10 20 30 40 50 60 70
Temperature [oC]
Rela
tive m
icro
bia
l acti
vit
y
MCB activity

20
According to Whitmore and Handayanto (1997) decomposition and mineralization are related. The
N mineralization can be expressed as a function of decomposable organic carbon as follows:
N mineralized = C decomposed (1/z – E/y),
Where z represents the C:N ratio of the added organic material, E stands for microbiological
efficiency factor “representing the fraction of decomposed C that is transformed into SOM”, 0.4 is
the established value used in APSIM (Agricultural Production Systems Simulation Model) for soil
N, and y the C:N ratio of the recently formed SOM.
Palm and Sanchez (1991) reported that lignin and poliphenols are also determinants of N release
from organic sources. Organic materials with considerable high lignin and poliphenol content, and/or
high ratio poliphenol:N, cannot readily supply N. The existence of poliphenol-N polymers slow
down the decomposition process. However, organic sources with low lignin content and low lignin
to N ratio or low poliphenol to N ratio can be used successfully as a source of available N due to the
relatively fast decomposition and mineralization rates.
It was found that polyphenolic compounds in the organic source influence NMIT in two ways:
i) Polyphenolic compounds have direct toxicity effect on the SMB;
ii) Polyphenolic compounds have high affinity for amide groups and can bind proteins,
preventing N release (Heal et al., 1997; De Neve et al., 2004).
2.4.5 Time
The dynamics of N in soils is governed by mineralization and nitrification processes‟ changing
continuously depending on the environmental conditions at specific time. Since factors controlling
soil microbial activity change with time, therefore the length of incubation period would affect the
quantity of N released and chemical composition of the soil medium. It was observed that this fact
limits the use of mineralization models in predicting the long term N mineralization process (De
Neve and Hoffman, 1996; Maly et al., 2002; Benbi and Richter, 2002).
21
2.4.6 Soil pH
Both microbial diversity and activity are pH dependent. According to Brady and Weil (2002)
decomposition and mineralization processes occur rapidly at near neutral pH and optimum moisture
and aeration conditions. Under extreme acid conditions decomposition is inhibited. Nitrifying
bacteria are more effective under slightly acid to neutral pH (6.6 to 8.0), below pH 6 nitrification rate
declines and is negligible below pH 4.5 (Jenkinson, 1981; Terry et al., 1981; Mengel and Kirby,
1987; Paul and Clark, 1988). Sierra et al. (2001) also found that in a soil with pH 4.9, an
introduction of nitrifiers with fresh sewage sludge had no effect on nitrication rate.
2.4.7 Soil texture
The effect of soil texture is indirect and expressed through soil structure and porosity, thus, regulates
the soil water content for a particular water potential. The effect of soil texture manifests as follow:
i) Influences aeration and moisture status;
ii) Affects physical distribution of organic materials and their potential for degradation
(Thomsen et al., 1999; Thomsen et al., 2003).
Similarly to Thomsen findings, Jarvis et al. (1996) and Hassink et al. (1992) concluded that high
clay content may decrease mineralization by two mechanisms:
i) Physically confining micro-organisms in small pores making them less active;
ii) Physically protecting non-living SOM from decomposition by surface adsorption on clay
minerals.
The majority of mineralization studies have relied on moisture conditions adjusted to water field
capacity (WFC) rather than water potential which makes it difficult, if not impossible, to compare
mineralization rate across different textured soils, since the soil moisture held at WFC of different
textured soils differ (Thomsen et al., 2003).

22
Hassink et al. (1992) found that sieving soils caused a temporary increase in mineralization of
carbon and nitrogen, the increase was larger in loam and clayey soils than in sandy soils. This can be
attributed to an increase in the contact surface between soil organisms and soil organic materials,
which in turn depends on the soil water content. Similarly Stenger et al. (1995) found that nitrogen
mineralization rates were twice as high in sieved soils compared to undisturbed one.
Hernandez et al. (2002) studying N mineralization potential in calcareous soils amended with
sewage sludge concluded that the organic N mineralization of sewage sludge was influenced by soil
type. Greater N mineralization rate was observed in sandy soils (where ranged from 30 % to 41 % of
total N) than clayey soils (where organic N mineralized was about 13 % to 24 %). These results are
confronting the Hassink‟s, (1992) and Stenger et al., (1995) findings.
2.5 Net nitrogen mineralized
Theoretically extractable inorganic N encompasses the three forms of inorganic N (NH4+, NO3
- and
NO2-) extracted with a 1 molar KCl solution at room temperature. The nitrite form is an intermediate
stage of nitrification which in turn is jointly reduced with nitrate during the steam distillation by
Keeney and Nelson, (1982). Therefore, in this study the term nitrate is extensively used to designate
both NO3- and NO2
-.
2.6 Kinetics of nitrogen mineralization
The kinetic of N mineralization is described using first-order equation:
N min = N0 (1- e kt), (Stanford and Smith, 1972)
Where Nmin stands for amount of N mineralized at time t; N0 is the potential mineralizable N; k is the
first-order rate constant and t the incubation time.
23
Several research on N mineralization were based on the first-order equation (Paul and Clark, 1989;
Serna and Pomares, 1992; Smith et al., 1998; Rasiah and Kay, 1998; De Neve et al., 2004; Havlin et
al., 2005). Similarly, De Neve and Hofman (1996) used the first-order kinetics to describe N
mineralization from organic residues:
N(t) = NA (1 - e – kt )
Where Nt is the net N mineralization at time t, NA is the part of total residue N that was mineralized,
k the rate constant and t the incubation time.
Many researchers have studied different kinetic models to describe N mineralization and found
discrepancies within undisturbed and disturbed samples. Some researchers used the single first order
model, described by Stanford and Smith, (1972), and concluded that the model described better the
N mineralization of undisturbed soils. In disturbed soils samples the double first-order model
described by Molina et al., (1980) was appropriate to account for the initial flush of N mineralization
or for the existence of two considered pools of organic N, the rapidly (N1) and slowly (N2)
mineralizable N pools (Dou et al., 1996; Hseu and Huang, 2005; Smith et al., 1998c; Benbi and
Richter, 2002).
N min = N1 (1- e – k1
t) + N2 (1- e –k2
t), (Molina et al., 1980)
No = N1 + N2
Where Nmin represents the net mineralized N at time t, N0 is the potential mineralizable N, estimated
from N1 plus N2 representing the rapid and slow mineralizable pools respectively, and k1 and k2 the
specific rate constants of inorganic N accumulation and t the incubation time.
Smith et al. (1998c) found that potentially mineralizable N was best estimated as 26 % of total
applied N for (N1) and 42 % of total applied N for (N2). However Dou et al. (1996) found that the
goodness of fit of different kinetic models depends on the duration of incubation. For instance, under
short incubation time (≤ 15 weeks) the single first-order model was found to provide good fit of data
and for long incubation period (> 15 weeks) the double first-order model provided better results.

24
2.7 Half life time (t 1/2)
In addition to other parameters for modeling N mineralization the half-life time of the organic
substrate is also of great importance in modeling the persistence of the organic substances in soil
system. The half-life time for a dynamic system is the time required for the substrate to be reduced
by half. For an organic substrate in a soil system it is the time needed to decompose and/or
mineralize 50% of the initial amount added to soil system. Half life time are calculated based on the
exponential decay models (Y = Yo ekt), which gives an image of the half life constant independent of
the initial valor. Where, Yo is the initial quantity and k the decay or growing rate per unit time
(Atkins, 1999; Ansie and Roumen, 2004).
Derivation:
Nt = N0 e –kt ; half life time is when Nt = N0 / 2
N0/2 = N0 e -kt ;
½ ln N0 = ln N0 - kt1/2 = - ln [½N0/N0] = kt1/2 ; - ln ½= ln 2 hence ln2 = kt1/2; Thus half
life time is given by t1/2 = ln2/k
2.8 Sewage sludge or biosolid
Sewage sludge, as commonly called in South Africa, refers to a by-product of the municipal
wastewater treatment company. It contains organic matter rich in essential plant nutrients, and in
some cases also contains liming agents. Demand for better water quality and strict environmental
laws lead to an increase in sewage sludge production, during wastewater treatment. Disposal of
sewage sludge is an economic and environmental problem. Sewage sludge used to be disposed
through land filling, sea dumping, and incineration. However, the incineration practice has been
phased out due to high costs of ash treatment; sea dumping is a threat for aquatic organisms,
decrease in availability of land area and the long term environmental problems restricted land filling.
Therefore, sludge disposal is becoming a serious challenge in the world (Peverly, 1996; Bowler,
1999; IWA, 2003; Sukkariyah, et al., 2005; Walter et al., 2006).
Municipal sludge, therefore, has a value in agriculture as soil conditioner and supplier of plant
nutrients (nitrogen, phosphorus and some micronutrients). The nutrient value of the sewage sludge
25
depends on the source of wastewater and treatment process. For example dewatering of sewage
sludge improves the physical aspect of biosolids, however, reduces its NH4+ content due to removal
of soluble NH4-N with the liquid phase.
Land application and recycling of sewage sludge in agricultural lands is an option that reduces waste
transport costs, prolongs the life span of sanitary landfill and reduces environmental pollution, thus
is considered the most sustainable approach for disposing sewage sludge (Kaseva and Gupta, 1996;
IWA, 2003; Mendoza et al., 2006). In the UK biosolids applications in agricultural lands has been
accepted for more than 40 years (Davis, 1989 as cited in Smith et al., 1998), and in USA more than
60 % of produced sludge is land applied (USEPA, 1994).
Although sewage sludge is a valuable resource it could cause negative environmental impact if used
improperly. Excessive applications at rates higher than plant N demand, or applications at the wrong
time of the year, may increase pollution risk of surface and ground waters (Kaseva and Gupta, 1996;
IWA, 2003; Sukkariyah et al., 2005; Mendoza et al., 2006). Other potential risks of sewage sludge
include presence of heavy metals, pathogens and organic contaminants.
Therefore, in some European countries the practice of sewage sludge use in agriculture has been
debated quite a lot heading for restriction in farmlands because food products are at risk of
contamination which in turn might cause health problems (Mendoza et al., 2006). A better destiny of
sewage sludge is recycling on green fields for e.g. on parks, sporting fields, road embankments, golf
courses (USEPA, 1994). Another strategy is an on-site use as a source of energy (heat, electricity
made from biogas). In South Africa the long term use of sewage sludge in agricultural land still
needs to be studied under several field conditions (Snyman and Van der Waals, 2004). Currently
composting of sewage sludge is an important strategy for use in farmland for food production (IWA,
2003), as many pollutants are reduced.
26
2.9 References
AGEHARA, S. AND WARNCKE, D.D., 2005. Soil moisture and temperature effect on N
release from organic N sources. Soil Science Society of American Journal 69, 1844 –1855
ANSIE, H. AND ROUMEN, A., 2004. The mathematical modeling problem book. Pretoria Spring
field house. 94 pp
ATKINS, P.W., 1999. Physical chemistry. The rates of chemical reactions. 6th Ed. Oxford
University Press, 761 -818
BASTIAN, R.K., 2005. Interpreting science in the real world for sustainable land application.
Journal of Environmental Quality 34, 174 – 183
BENBI, D. K. AND RICHTER, J., 2002. A critical review of some approaches to modeling
nitrogen mineralization. Biology Fertility Soils 35, 168 – 183
BENGTSSON, M. AND TILLMAN, A.M., 2004. Actors and interpretations in an
environmental controversy: the Swedish debate on sewage sludge use in agriculture.
Resources, Conservation and Recycling 42, 65 – 82
BLOEM, J., HOPKINS, D.W. AND BENEDETTI, A., 2006. Microbiological methods for
assessing soil quality. CABI publishing 300 pp
BOWLER, I.R., 1999. Recycling urban waste on farmland: an actor- network interpretation.
Applied Geography 19, 29 – 43
BRADY, N.C. AND WEIL, R.R., 2002. The nature and properties of soils. 13th Ed. Pearson
Education Prentice Hall 935 pp
27
BURESH, R.J., SANCHEZ, P.A. AND CALHOUN, F., 1997. Replenishing soil fertility in
Africa. Proceedings of an International symposium: 88th Annual meeting of ASA and
SSSA held at 6th Nov.1996, Soil Science Society of America, Special publication 51,
251 pp
BURNS, G. R., NANNIPIERI, P., BENEDITTI, A. AND HOPKINS, W. D., 2006. Defining soil
quality. In Bloem et al., 2006. Microbiological methods for assessing soil quality, 15 – 22
CANALI, S. AND BENEDETTI, A., 2005. Soil N mineralization: Factors regulating soil
microbial activity. In Bloem et al., 2006. Microbiological methods for assessing soil quality,
117 – 182
CIAT, ICRAF AND TSBF, 2002. Soil fertility degradation in sub- Saharan Africa: Leveraging
lasting solutions to a long term problem. Conclusions from a workshop held at the
Rockefeller Foundation Bellagio Study and Conference Centre, March 4th – 8th 2002
DEBOSZ, K., PETERSOEN, S.O., KURE, L.K. AND AMBUS, P., 2002. Evaluating effects of
sewage sludge and household compost on soil physical, chemical and microbiological
properties. Applied Soil Ecology 19, 237 – 248
DE NEVE, S. AND HOFMAN, G., 1996. Modeling N mineralization of vegetable crop residues
during laboratory incubations. Soil Biology and Biochemistry 28, 1451 – 1457
DE NEVE, S., SAEZ, S.G., DAUGULAR, B.C., SLEUTEL, S. AND HOFMAN, G., 2004.
Manipulating N mineralization from high N crop residues using on- and off- farm organic
materials. Soil Biology and Biochemistry 36, 127 – 134
DORAN, J.W. AND SMITH, M.S., 1987. Organic matter management and utilization of soil
and fertilizer nutrients. Soil Science Society of America, Special publication 19, 53 – 72

28
DOU, Z., TOTH, J.D., JABRO, J.D., FOX, R.H. AND FRITTON, D.D., 1996. Soil N
mineralization during laboratory incubation: Dynamics and model fitting. Soil Biology
and Biochemistry 28, 625 – 632
DOWGILL, A.J., TWYMAN, C., THOMAS, D.S.G. AND SPORTN, D., 2002. Soil degradation
assessment in mixed farming systems of Southern Africa: Use of nutrient balance studies
for participatory degradation monitoring. The Geographical journal 163, 195 – 210
ER, F., OGUT, M., MIKAYILOV, F.D. AND MERMUT, A.R., 2004. Important factors
affecting biosolid nitrogen mineralization in soils. Communications in Soil Science and Plant
Analysis 35, 2327 – 2343
FOLLETT, R.F., STEWART, J.W.B. AND COLE, C.V., 1987. Soil fertility and organic
matter as critical components of production systems. Soil Science Society of America, Special
publication 19, 166 pp
FOLMER, E.C.R., GEURTS, P.M.H. AND FRANCISCO, J.R., 1998. Assessment of soil fertility
depletion in Mozambique. Agriculture, Ecosystems and Environment 71, 159 – 167
FRANCAVIGILIA., 2004. Proceedings of the OECD expert meeting on soil erosion and soil
biodiversity indicators. March 25th - 28th (2003). Rome, Italy
GAINS, T.P. AND GAINS, S.T., 1994. Soil texture effect on nitrate leaching in percolates.
Communications Soil Science and Plant Analysis 25, 2561 – 1570
HAI-XING, S.S. AND SHENG-XIU, L.I., 2006. Root function in nutrient uptake and soil water
effect on nitrate and ammonium migration. Agriculture Science in China 5, 377 – 383
HASSINK, J., 1992. Effects of soil texture and structure on carbon and nitrogen mineralization
in grassland soils. Soil Biology and Biochemistry 14, 126 – 134
29
HAVLIN, J.L., BEATON, J.D., TISDALE, S.L. AND NELSON, W.L., 2005. Soil fertility and
fertilizers: An introduction to nutrient management. 7th Ed. Pearson Education, Inc. Prentice
Hall, 502 pp
HEAL, O.W., ANDERSON, J.M. AND SWIFT, M.J., 1997. Plant litter quality and
decomposition. In CADISCH Ed, 1997. Driven by Nature. 3 – 30
HERNANDEZ, T., MORAL, R.,PEREZ-ESPINOSA, A., MORENO-CASELLES, J., PEREZ-
MURCIA, M.D. AND GARCIA, C., 2002. Nitrogen mineralization potential in calcareous
soils amended with sewage sludge. Bioresource technology 83, 213 – 219
HORTWATH, W.R. AND PAUL, E.A., 1994. Microbial biomass. In Weaver et al., 1994.
Methods of soil analysis Part 2: Microbiological and biochemical properties. Soil Science
Society of America, Inc. Book series 5, 754 – 771
HSEU, Z.Y. AND HUANG, C.C., 2005. Nitrogen mineralization potentials in three tropical soil
treated with biosolids. Short communication. Chemosphere 59, 447 – 454
IWA, 2003. Wastewater sludge as a resource: Proceedings of the International Water Association
– Specialist conference Biosolids, 23 – 25 June.
JARVIS, C., 1996. Future trends in nitrogen research. Plant and Soil 181, 47 – 56
JARVIS, S.G., STOCKDALE, E.A., SHEPHERD, M.A. AND POWSON, D.S., 1996. Nitrogen
mineralization in temperate agricultural soils: Processes and measurements. Advances in
Agronomy 57, 187 – 235
KASEVA, M.A. AND GUPTA, S.K., 1996. Recycling – an environmentally friendly and income
generating activity towards sustainable solid waste management. Case study: Dar-es-
Salaam city, Tanzania. Resources, Conservation and Recycling 17, 299 – 309
30
KELLY, J.J., HAGGBLOM AND TATE, L.R., 1999. Effects of the land application of sewage
sludge on soil heavy metals concentrations and soil microbial communities. Soil Biology and
Biochemistry 31, 1467 – 1470
KORENTAJER, L., 1991. A review of the agricultural use of sewage sludge: Benefits and
potential hazards. Water S A 17, 189 – 196
LEIJDER, R.A., 1988. Soil fertility assessment course. Lecture notes, 38 – 48
LEIROS, M.C, CEPEDA, C.T., SEOANE, S. AND GIL-SOTRES, F., 1999. Dependence of
mineralization of soil organic matter on temperature and moisture. Soil Biology and
Biochemistry 31, 327 – 335
MALY, S. SARAPATKA, B. AND KRSKOVA, M., 2002. Seasonal variability in soil N
mineralization and nitrification as influenced by N fertilization. Rostlinna Vyroba 48,
389 – 396
MCGILL, W.B. AND MYERS, R. J.K., 1987. Controls on dynamics of soil and fertilizer
Nitrogen. In special publication Soil Science Society of America 19, 73 – 99
MCGRATH, S.P., CHANG, A.C., PAGE, A.L. AND WITTER, E., 1994. Land application of
sewage sludge: scientific perspectives of heavy metal loading limits in Europe and US.
Environment Rev. 2, 108 – 118
MCINNES, K.J., WEAVER, R.W. AND SAVAGE, M.J., 1994. Soil water potential. In Weaver
et al., 1994. Methods of soil analysis, Part 2: Microbiological and biochemical properties.
Soil Science Society of America, Inc. Book series 5, 53 – 58
MENGEL, K. AND KIRKBY, E.A., 1987. Principles of plant nutrition, 4th Ed., International
Potash Institute. Switzerland, 347 – 384
31
MENDOZA, C., ASSADIAN, N. W. AND LINDEMANN, W., 2006. The fate of nitrogen in
moderately alkaline and calcareous soil amended with biosolids and urea. Chemosphere
63, 1933 – 1941
MOLINA, J.A. E.; CLAPP, C.E. AND LARSON, W.E., 1980. Potentially mineralizable nitrogen
in soils: The single exponential model does not apply for the first 12 weeks of incubation.
Soil Science Society of American Journal 44, 442 – 453
NAVAS, A., BERMUDEZ, F. AND MAVHIN, J., 1997. Influence of sewage sludge application
on physical and chemical properties of gypsisols. Geoderma 87, 123 – 135
NHEMACHENA, C., MURWIRA, H.K., MUTIRO, K. AND CHIVENGE, P., 2003. A
socio- economic analysis of legume production motives and productivity variations
among smallholder farmers of Shurugui communal area, Zimbabwe. In Waddington,
2003, 223 – 226
PALM, C.H. AND SANCHEZ, P.A., 1991. N release from the leaves of some tropical legumes
as affected by their lignin and polyphenol content. Soil Biology and Biochemistry 23, 83 – 85
PAUL, E.A. AND CLARK, F.E., 1988. Soil microbiology and biochemistry. Academic press,
Inc. Harcourt Brace Jovanovich, Publishers, 265 pp
PEVERLY, J., 1996. Production of biosolids /sludge. Cornell Waste Management Institute,
Center for the environment, 1 – 4
PROBERT, M.E., DELVE, R.J., KIMANE, S.K. AND DIMES, J.P., 2005. Modeling N
mineralization from manure: representing quality aspects by varying C:N ratio of sub-
pools. Soil Biology and Biochemistry 37, 279 – 287
32
ROWE, E.D. AND GILLER, K., 2003. Legumes for soil fertility in Southern Africa: Needs,
potential and realities. In Waddington, 2003. Grain legumes and green manures for soil
fertility in Southern Africa: Taking stock of progress, 15 – 19
RULKENS, W.H., 2003. Sustainable sludge management: what are the challenges for the future.
In Hallward, IWA 2003. Wastewater sludge as a resource: Proceedings of the
International Water Association – Specialist conference Biosolids, 13 – 20
RUSSEL, E.W., 1988. Soil conditions and plant growth. 11th Ed. Longman Group UK 951 pp
SANCHEZ, M.E., ESTRADA, I.B., MARTINEZ, O., ALLER, A. AND MORAN, A., 2005.
Influence of the application of sewage sludge and presence of pesticide on the development
of the microbial population of the soil and on the transformation of organic carbon and
nutrient elements. American journal of Environmental Sciences 1, 172 – 178
SCOONES, I., 2001. Dynamics and diversity: Soil fertility and farming livelihoods in Africa.
Earth scan publications Ltd, London, UK 244 pp
SERNA, M.D. AND POMARES, F., 1992. Nitrogen mineralization of sewage sludge amended
soil. Bioresource Technology 39, 285 – 290
SIERRA, J., FONTAINE, S. AND DESFONTAINES, L., 2001. Factors controlling N
mineralization, nitrification and nitrogen losses in an Oxisol amended with sewage
sludge. Australian Journal of Soil Research 39 (3) 519 – 534
SMALING, E., 1993. An agro ecological framework for integrated nutrient management.
With special reference to Kenya. Doctoral thesis, Agricultural University
Wageningen, the Netherlands, 250 pp
33
SMITH, S.R., WOODS, V. AND EVANS, T. D., 1998 a. Nitrate dynamics in biosolids-
treated soils I – Influence of biosolids type and soil type. Bioresource Technology 44,
139 – 149
SMITH, S.R., WOODS, V. AND EVANS, T. D., 1998 b. Nitrate dynamics in biosolids – treated
soils. II Thermal time models of the different N pools. Bioresource Technology 66, 151 – 160
SMITH, S.R., WOODS, V. AND EVANS, T. D., 1998 c. Nitrate dynamics in biosolids – treated
soils. III – Significance of the organic nitrogen. A twin-pool exponential model for
nitrogen management and comparison with the nitrate production from animal wastes.
Bioresource Technology 66, 161 – 174
SNYMAN, H.G. AND HERSELMAN, J.E., 2006. Guidelines for the utilization and disposal
of wastewater sludge. Vol. 2: Requirements for the agricultural use of wastewater
sludge. Water Research Commission - Report no. TT262/06, 34 pp
SNYMAN, H.G. AND VAN DER WAALS, J., 2004. Laboratory and field scale evaluation of
agricultural use of sewage sludge. Water Research Commission - Report no. 1210/1104,
286 pp
SOIL SCIENCE SOCIETY OF AMERICA, 1977. Glossary of soil science terms by the
committee of terminology. In The Non – Affiliated Soil Analysis Work Committee, 1990.
Handbook of standard soil testing methods for advisory purposes. South Africa
SPARKS, D.L., 2003. Environmental soil chemistry. Academic press San Diego, USA and
London, UK 352 pp
STANFORD, G. AND SMITH, S.J., 1972. Nitrogen mineralization potentials of soils. Soil
Science Society of America, Proceedings, 36, 465 – 472

34
STENGER, R., PRIESACK, E. AND BEESE, F., 1995. Rates of net nitrogen mineralization in
disturbed and undisturbed soils. Plant and Soil 171, 323 – 332
STEVENSON, F.J., BREMNER, J.M., HAUCK, R.D. AND KEENEY, D.R., 1982. Nitrogen in
agricultural soils. Agronomy series, 22. Madison, Wisconsin USA 925 pp
STOORVOGEL, J.J. AND SMALING, E.M.A., 1990. Assessment of soil nutrient depletion
in sub-Saharan Africa, 1983-2000. Report 28, Winand Staring Centre for Integrated
Land, Soil and Water Research, 1 – 137
STOORVOGEL, J.J., SMALING, E.M.A. AND JANSSEN, B.H., 1993. Calculating soil
nutrient balances in Africa at different scales. In Smaling, 1993. Doctoral thesis, Agricultural
University Wageningen, the Netherlands, 75 – 120
SUKKARIYAH, B., HAERING, K. AND EVANYLO, G., 2005. Land application of biosolids
to provide plant nutrients, enhance soil properties, and prevent water quality impairment.
CSREES Mid- Atlantic. Regional water quality program, 1 – 6
TAN, K.H., 2000. Environmental Soil Science. 2nd Ed; revised and expanded. Marcel Dekker,
Inc. 452 pp
TEJEDA, M., BENITEZ, C. AND GONZALEZ, J.L., 2002. N mineralization in soil with
conventional and organomineral fertilization practices. Communications in Soil Science
and Plant Analysis 33, 3679 – 3702
TERRY, R.E., NELSON, D.W. AND SOMMERS, L.E., 1981. Nitrogen transformations in
sewage sludge – amended soils as affected by soil environmental factors. Soil Science
Society of American Journal 45, 506 – 513

35
THOMSEN, K.I., SCHJONNING, P., JENSEN, B., KRISTENSEN, K. AND CHRISTENSEN,
B.T., 1999. Turnover of organic matter in differently textured soils. II. Microbial activity
as influenced by soil water regimes. Geoderma 89, 199 – 218
THOMSEN, K.I., SCHJONNING, P., OLESEN, J.E. AND CHRISTENSEN, B.T., 2003.
Carbon and nitrogen turnover in structurally intact soils of different texture. Soil Biology
and Biochemistry 35, 765 – 774
USEPA, 1994. Land application of sewage sludge. A guide for land appliers on the requirements
of the Federal standards for the use or disposal of sewage sludge, 40 CFR Part 503 EPA/ 31-
B- 93- 002b
WADDIGNTON, S.R., 2003. Grain legumes and green manures for soil fertility in Southern
Africa: Taking stock of progress. Proceedings of a conference in Soil Fertility
management and policy network for maize- based cropping systems in Southern
Africa. Held 8th – 11th October 2002 at Leopard Rock Hotel, Vumba, Zimbabwe 246 pp
WALTER, I., MARTINEZ, F. AND CALA, V., 2006. Heavy metal speciation and
phytotoxic effects of three representative sewage sludges for agricultural uses.
Environmental pollution 139; 507 – 514
WANG, H., KIMBERLEY, M.O. AND SCHLEGELMILCH, M., 2003. Biosolids-derived
nitrogen mineralization and transformation in forest soils. Journal of Environmental
Quality 32, 1851 – 1856
WARD, R.C., HALVORSON, A.D. AND WISIOL, K., 1987. Improving crop management
and farm profitability: new approaches for advisory services. In Follet et al., 1987. Soil
fertility and organic matter as critical components of production systems. Soil Science
Society of America, Special publication 19, 135 – 146
36
WHITMORE, A.P. AND HANDAYANTO, E., 1997. Simulating the mineralization of N from
crop residues in relation to residue quality. In CADISCH Ed, 1997. Driven by nature: Plant
litter quality and decomposition, 337 – 348
WOLF, B. AND SNYDER, G. H., 2003. Sustainable soils: The place of organic matter in
sustaining soils and their productivity. Food products press NY 345 pp
WORTMANN, C.S. AND BINDER, D.L., 2002. Sewage sludge utilization for crop production.
University of Nebraska – Lincoln Extension, Institute of Agriculture and Natural
Resources. Soil Resource Management Fertility G1445, 4 pp
VAN NIEKERK, C., CLAASSENS, A. AND SNYMAN, H., 2005. N transformations in
incubated sewage sludge and commercial fertilizer enriched soil. Communications in Soil
Science and Plant Analysis 36, 743 – 757
ZAMAN, M. AND CHANG, S.X., 2004. Substrate type, temperature, and moisture content
affect gross and net mineralization and nitrification rates in agroforestry systems. Biology
Fertility Soils 39, 269 – 279
37
CHAPTER III: SEWAGE SLUDGE STABILITY, TEMPERATURE AND SOIL WATER
POTENTIAL EFFECTS ON NET NITROGEN RELEASE
ABSTRACT
To take advantage of sewage sludge as a soil amendment, and to negate negative environmental
effects, knowledge of N transformation processes in sewage sludge amended soil is required. The
effect of temperature, water potential, and the stability of sewage sludge on sludge-N mineralization
and nitrification rates were assessed during a 56-day laboratory incubation study. A sandy clay loam
soil was amended with sludge from different wastewater treatment processes. Stable anaerobically
digested and paddy dried sewage sludge, collected from Vlakplaas municipal treatment plant,
unstable waste activated, partially digested and belt pressed sewage sludge, collected from
Olifantsfontein municipal treatment plant, and unstable activated, and anaerobically digested sludge
from SASOL a petrochemical industry treatment plant. Sludges were applied at a rate corresponding
to 10 tons ha -1 on a dry mass basis, and incubated at 10, 25 and 45 ºC, and three levels of water
potentials, -10, -100 and -1000 kPa. Treatments including a control were carried out in triplicate.
Extractable and exchangeable inorganic N-forms (NH4+, NO3
- plus NO2-) were determined at six
incubation times 0, 1, 7, 14, 28 and 56 days using the method of Bremner and Keeney (1966),
followed by the steam distillation method of Mulvaney (1996). Mineralization rate constant and half
life time were estimated based on the single first-order kinetics N(t) = No (1- e –kt) by Stanford and
Smith (1972). A general linear model procedure of the SAS statistical program was used to test for
significance of differences between treatments. Soil temperature and water potential interactions as
well as sludge stability, significantly influenced mineralization. Net N release increased with
incubation time and temperature increase. Nitrification was inhibited at 10 ºC for both unstable
sludges, and at 45 ºC for all sludges. However, nitrification was observed at both 10 ºC and 25 ºC for
Vlakplaas sludge and only at 25 ºC for Sasol sludge. Nitrification was negligible for Olifantsfontein
sludge. On average, net N released was higher for unstable sludges. The high quantities of N
released from unstable sludge were not a result of the higher mineralizable N potential, but rather as
a result of the higher N content. Therefore they had higher N loading rates. Of the total N added 41
% and 36 % were mineralized from Sasol and Olifantsfontein sludges respectively, and 50 % from
Vlakplaas sludge. The Sasol sludge yielded a relatively high rate constant (0.093 week -1) and
relatively shorter half life time (58 days) at 25 ºC compared to the approximated rate constants of

38
municipal sludges. The rate constant for Vlakplaas was 0.042 week -1 (half life = 116 days) and
0.049 week -1 (half life = 98 days) for Olifantsfontein.
Sludge-N mineralization rate will vary under uncontrolled field conditions, therefore further field
validation of the sludge stability effect on N release is needed to regulate safe sewage sludge
agricultural use.
Key words: Nitrogen, Sewage sludge, ammonium, nitrate, N mineralization, mineralization rate.

39
3.1 Introduction
Sewage sludge is a by-product from wastewater treatment plants, rich in organic matter and plant
nutrients, which can be used as a soil amendment to enhance the physical, chemical and biological
qualities of soils. Like other organic sources, sewage sludge can have positive influences on the
properties of the amended soils, such as increased organic matter, nitrogen content, porosity, soil
water holding capacity and biological soil quality (Navas et al., 1997; Lopez-Tercedo et al., 2005).
Sewage sludge contains organic forms of nitrogen, which undergo transformation, releasing
inorganic N forms, i.e. ammonium (NH4+) and nitrate (NO3
-) (Er, et al., 2004; Ashok, Paramasivam
and Sajwan, 2006). Under favourable soil conditions (adequate microbial biomass, soil water) and
favourable temperature for microbial activity the NH4+ form is converted rapidly into NO3
-. The
availability of N in soils, as well as in sewage sludge amended soils, depends on the N-forms of the
compounds present in the substrate and the rate at which inorganic N is released (Paul and Clark,
1988; Russel, 1988; Havlin, 2005). Therefore, knowledge of the dynamics and transformations of
different N pools in the ecosystem is an important tool to assess soil N availability.
N mineralization and nitrification rate constants are important parameters in modelling soil N
transformations (Smith et al., 1998 a,c). Predictive capability for N release and potential
mineralizable N are essential in providing support for decision makers on land application rate and
frequency, as well as helping in establishing irrigation intervals that reduce nitrate (NO3-) losses
from agricultural lands to surface and ground waters.
Sewage sludge stability is known to influence N release characteristics (Smith et al., 1998 a,b). The
rate and extent of NO3 release in sewage sludge amended soils was found to be dependent on sewage
sludge type, soil temperature, soil water and quality as well as quantity of applied sewage sludge,
(Terry et al., 1981; Paul and Clark, 1988; Serna and Pomares, 1992; Hernandez et al., 2002; Wang et
al., 2003; De Neve et al., 2004; Zaman and Chang, 2004; Synman and Van der Waals, 2004;
Agehara and Warncke, 2005; Van Niekerk et al., 2005).
Several researchers have conducted incubation studies at field capacity, which is generally accepted
as the optimum matrix potential for microbial activity (Thomsen et al., 1999; Thomsen et al., 2003).
40
Soils are of different textural classes, adjusting soil water to field capacity will not give a
comparable situation like when using the concept of soil water potential, which may give an
advantage to interpolate the N mineralization rate for different textured soils.
In this study, soil water potential and its interaction with temperature were of concern, because one
of the objectives of the study was to find N mineralization and nitrification rates in sewage sludge
amended soil that can be used in modeling the fate of N under different soil types and conditions.
A 56- day laboratory incubation study was conducted, as a factorial experiment with temperature as
main factor and water potential secondary factor. Soil was amended with sewage sludge of different
stability and incubated in a temperature controlled chamber at 10 ºC; in an incubation room at 25 ± 2
ºC and in a temperature controlled chamber at 45 ºC. Samples were extracted with a 1 molar
potassium chloride solution and distilled with a micro-Kjeldahl system NH4+ and [NO3
- + NO2-]
were then determined through titration with a 0.01M hydrochloric acid solution (HCl).
According to Doran and Smith (1987) microbial activity is maximal in a temperature range between
25 – 35 ºC. Therefore, high levels of nitrogen release were expected for treatment combination of 25
ºC and -10 kPa. At temperature below 20 ºC and over 40 ºC, lower nitrogen release rates were
expected.
Sludge stability is expected to affect the N release rate, estimating higher values for unstable sludge,
as the fast release pool of the stable sludge has been partly gone mineralization during the
stabilization process in paddy drier beds.
41
3.2 Materials and methods
A laboratory incubation experiment was conducted at the Soil Science Laboratory of the University
of Pretoria, using a red sandy clay loam soil collected from the Hatfield Experimental Farm
(University of Pretoria located at 25° 45‟ S and 28° 16‟ E).
3.2.1 Materials
i) Sources of sludges
The sludges were collected from three waste-water treatment plants (WWTP), two are branches of
the East Rand Water Care Company (ERWAT), a major waste-water care company in South Africa
located near Kempton Park Pretoria, and the third was from a petrochemical company (SASOL)
located near Secunda. Sasol sludge is not destined for agricultural use, however, it was include to
compare the N release from a sludge that originated from the petrochemical industrial with the N
release from municipal sludge.
i1) Vlakplaas WWTP- was a mixture of domestic and industrial wastewater sewage sludge that was
anaerobically digested and paddy dried. This stable sewage sludge had an initial solid content of 50
%, and contained 1.93 % N.
i2) Olifantsfontein WWTP- was domestic wastewater sewage sludge that was activated, partially
digested and belt pressed. The sewage sludge collected had an initial solids content of 18 %, and
5.33 % N on a dry mass basis.
i3) SASOL WWTP- was a petrochemical wastewater sludge that was activated, anaerobically
digested. It was an unstable sludge, containing 9 % solids and had an N content of 7.91 %.
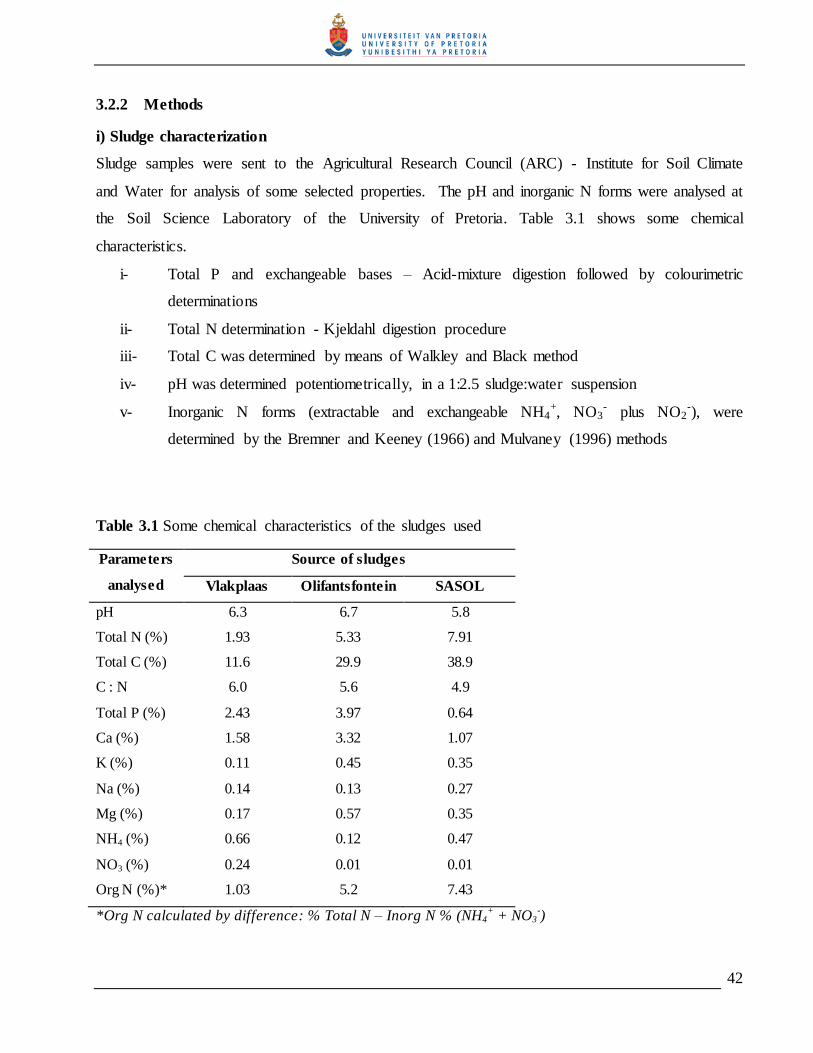
42
3.2.2 Methods
i) Sludge characterization
Sludge samples were sent to the Agricultural Research Council (ARC) - Institute for Soil Climate
and Water for analysis of some selected properties. The pH and inorganic N forms were analysed at
the Soil Science Laboratory of the University of Pretoria. Table 3.1 shows some chemical
characteristics.
i- Total P and exchangeable bases – Acid-mixture digestion followed by colourimetric
determinations
ii- Total N determination - Kjeldahl digestion procedure
iii- Total C was determined by means of Walkley and Black method
iv- pH was determined potentiometrically, in a 1:2.5 sludge:water suspension
v- Inorganic N forms (extractable and exchangeable NH4+, NO3
- plus NO2-), were
determined by the Bremner and Keeney (1966) and Mulvaney (1996) methods
Table 3.1 Some chemical characteristics of the sludges used
Parameters
analysed
Source of sludges
Vlakplaas Olifantsfontein SASOL
pH 6.3 6.7 5.8
Total N (%) 1.93 5.33 7.91
Total C (%) 11.6 29.9 38.9
C : N 6.0 5.6 4.9
Total P (%) 2.43 3.97 0.64
Ca (%) 1.58 3.32 1.07
K (%) 0.11 0.45 0.35
Na (%) 0.14 0.13 0.27
Mg (%) 0.17 0.57 0.35
NH4 (%) 0.66 0.12 0.47
NO3 (%) 0.24 0.01 0.01
Org N (%)* 1.03 5.2 7.43
*Org N calculated by difference: % Total N – Inorg N % (NH4+ + NO3
-)
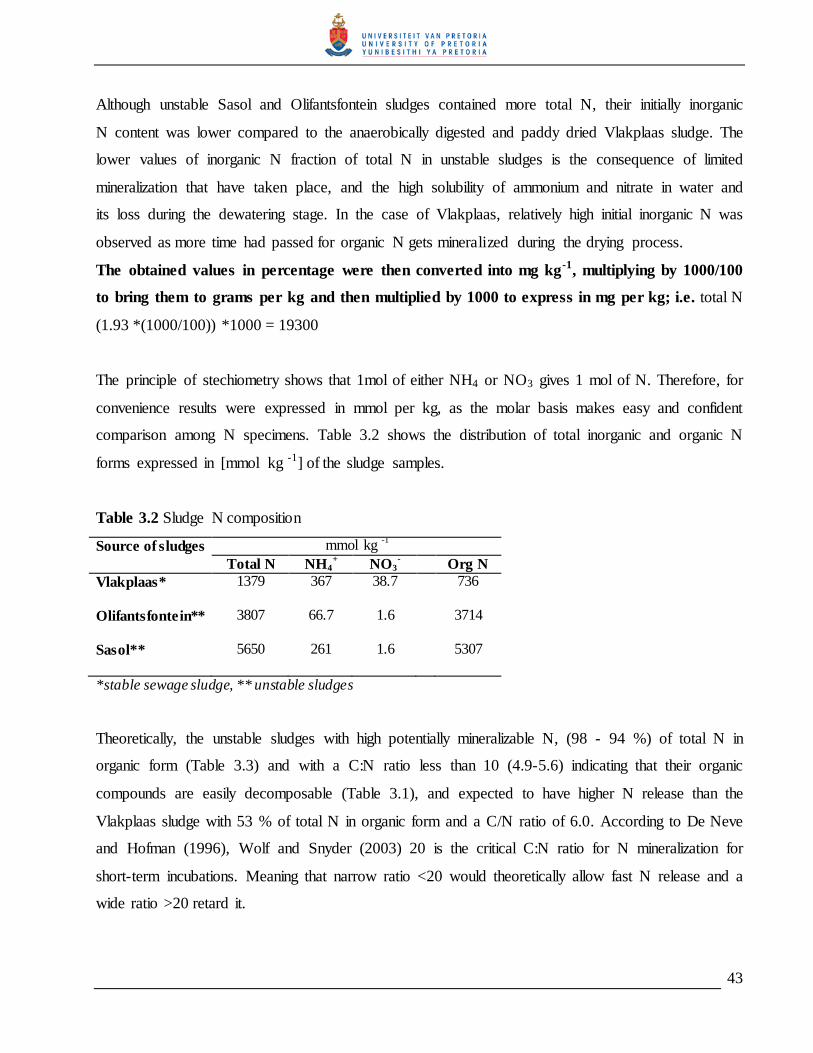
43
Although unstable Sasol and Olifantsfontein sludges contained more total N, their initially inorganic
N content was lower compared to the anaerobically digested and paddy dried Vlakplaas sludge. The
lower values of inorganic N fraction of total N in unstable sludges is the consequence of limited
mineralization that have taken place, and the high solubility of ammonium and nitrate in water and
its loss during the dewatering stage. In the case of Vlakplaas, relatively high initial inorganic N was
observed as more time had passed for organic N gets mineralized during the drying process.
The obtained values in percentage were then converted into mg kg-1, multiplying by 1000/100
to bring them to grams per kg and then multiplied by 1000 to express in mg per kg; i.e. total N
(1.93 *(1000/100)) *1000 = 19300
The principle of stechiometry shows that 1mol of either NH4 or NO3 gives 1 mol of N. Therefore, for
convenience results were expressed in mmol per kg, as the molar basis makes easy and confident
comparison among N specimens. Table 3.2 shows the distribution of total inorganic and organic N
forms expressed in [mmol kg -1] of the sludge samples.
Table 3.2 Sludge N composition
Source of sludges mmol kg -1
Total N NH4+ NO3
- Org N
Vlakplaas* 1379 367 38.7 736
Olifantsfontein** 3807 66.7 1.6 3714
Sasol** 5650 261 1.6 5307
*stable sewage sludge, ** unstable sludges
Theoretically, the unstable sludges with high potentially mineralizable N, (98 - 94 %) of total N in
organic form (Table 3.3) and with a C:N ratio less than 10 (4.9-5.6) indicating that their organic
compounds are easily decomposable (Table 3.1), and expected to have higher N release than the
Vlakplaas sludge with 53 % of total N in organic form and a C/N ratio of 6.0. According to De Neve
and Hofman (1996), Wolf and Snyder (2003) 20 is the critical C:N ratio for N mineralization for
short-term incubations. Meaning that narrow ratio <20 would theoretically allow fast N release and a
wide ratio >20 retard it.
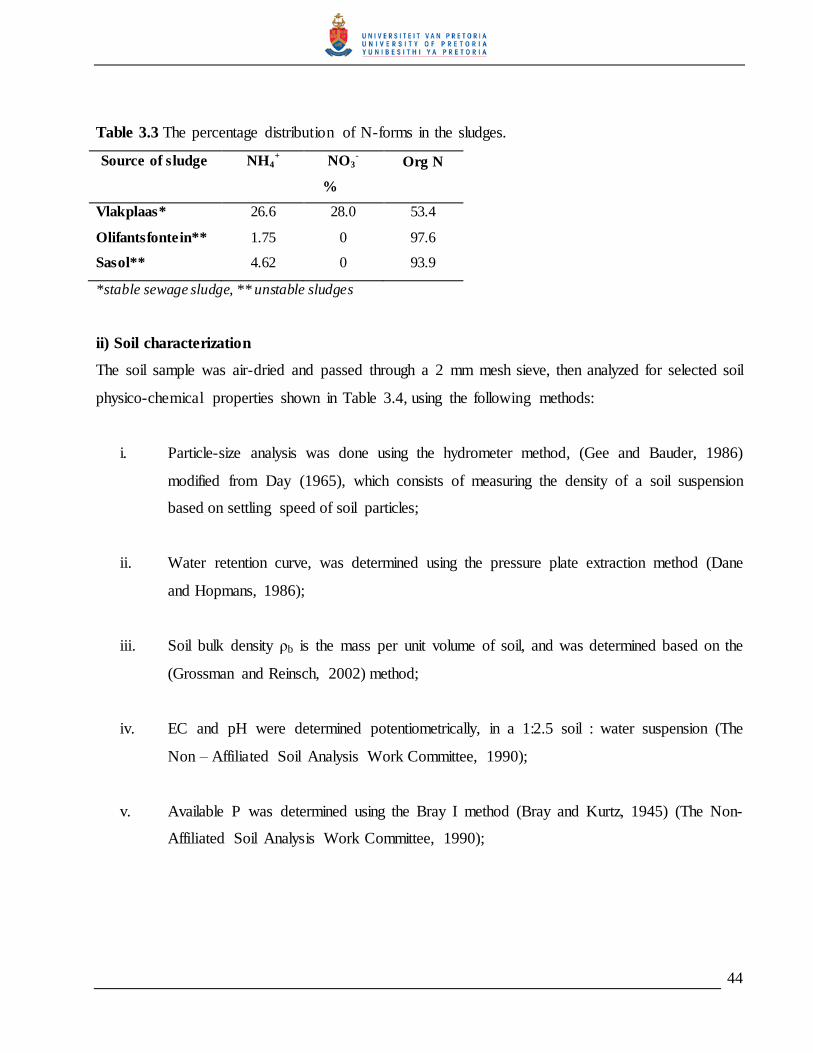
44
Table 3.3 The percentage distribution of N-forms in the sludges.
Source of sludge NH4+
NO3- Org N
%
Vlakplaas* 26.6 28.0 53.4
Olifantsfontein** 1.75 0 97.6
Sasol** 4.62 0 93.9
*stable sewage sludge, ** unstable sludges
ii) Soil characterization
The soil sample was air-dried and passed through a 2 mm mesh sieve, then analyzed for selected soil
physico-chemical properties shown in Table 3.4, using the following methods:
i. Particle-size analysis was done using the hydrometer method, (Gee and Bauder, 1986)
modified from Day (1965), which consists of measuring the density of a soil suspension
based on settling speed of soil particles;
ii. Water retention curve, was determined using the pressure plate extraction method (Dane
and Hopmans, 1986);
iii. Soil bulk density ρb is the mass per unit volume of soil, and was determined based on the
(Grossman and Reinsch, 2002) method;
iv. EC and pH were determined potentiometrically, in a 1:2.5 soil : water suspension (The
Non – Affiliated Soil Analysis Work Committee, 1990);
v. Available P was determined using the Bray I method (Bray and Kurtz, 1945) (The Non-
Affiliated Soil Analysis Work Committee, 1990);
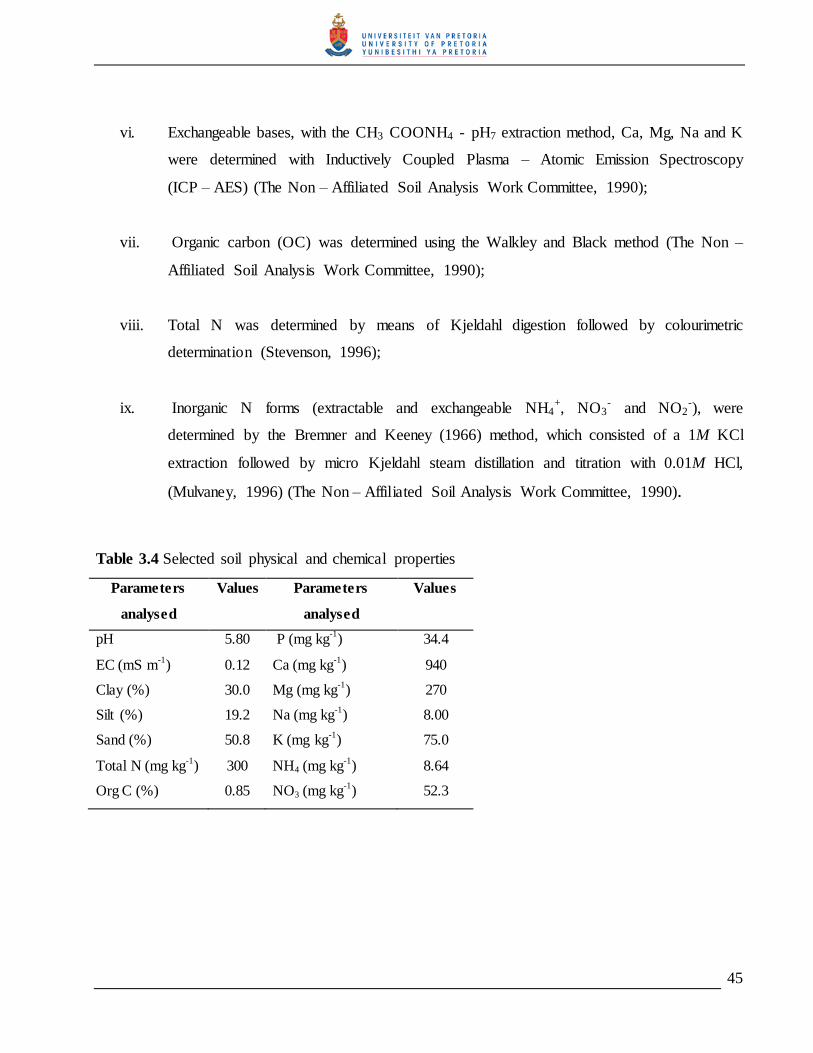
45
vi. Exchangeable bases, with the CH3 COONH4 - pH7 extraction method, Ca, Mg, Na and K
were determined with Inductively Coupled Plasma – Atomic Emission Spectroscopy
(ICP – AES) (The Non – Affiliated Soil Analysis Work Committee, 1990);
vii. Organic carbon (OC) was determined using the Walkley and Black method (The Non –
Affiliated Soil Analysis Work Committee, 1990);
viii. Total N was determined by means of Kjeldahl digestion followed by colourimetric
determination (Stevenson, 1996);
ix. Inorganic N forms (extractable and exchangeable NH4+, NO3
- and NO2-), were
determined by the Bremner and Keeney (1966) method, which consisted of a 1M KCl
extraction followed by micro Kjeldahl steam distillation and titration with 0.01M HCl,
(Mulvaney, 1996) (The Non – Affiliated Soil Analysis Work Committee, 1990).
Table 3.4 Selected soil physical and chemical properties
Parameters
analysed
Values Parameters
analysed
Values
pH 5.80 P (mg kg-1
) 34.4
EC (mS m-1
) 0.12 Ca (mg kg-1
) 940
Clay (%) 30.0 Mg (mg kg-1
) 270
Silt (%) 19.2 Na (mg kg-1
) 8.00
Sand (%) 50.8 K (mg kg-1
) 75.0
Total N (mg kg-1
) 300 NH4 (mg kg-1
) 8.64
Org C (%) 0.85 NO3 (mg kg-1
) 52.3

46
3.2.3 Treatments
Sludge amended soils were incubated at three levels of temperature and three water potentials for a
particular temperature, a schematic representations of treatments is given in Figure 3.1
Treatment selection was based on the established upper limits for sewage sludge land application in
South Africa (Snyman and Herselman, 2006), and also on the environmental soil conditions with
marked influence in microbial activities, thus influencing nitrogen release (Doran and Smith, 1987;
Paul and Clark, 1988; Zaman and Chang, 2004; Leiros et al., 1999; Tan, 2000; Havlin, et al., 2005).
Samples were extracted and tested at six different incubation times (0, 1, 7, 14, 28 and 56 days).
Treatments were replicated three times. A control treatment was included for each temperature and
water potential combination to enable calculation of released N from the sludge. For each sludge 273
samples were analysed for both nitrate and ammonium determination, therefore, in total 719 samples
were incubated. Statistical analysis was done using a general linear model procedure of SAS
statistical program, considering the incubation as a two factorial experiment.
Figure 3.1 Schematic representation of treatments
Where T stands for temperature: T1 = 10 oC, T2 = 25 oC, T3 = 45 oC and W stands for water potential:
W1 = -10 kPa, W2 = -100 kPa, W3 = -1000 kPa. Samples were extracted after 0, 1, 7, 14, 28 and 56
days of incubation.
Soil amended with sludge
T3
T1 T2
W1
W2
W3
W1
W2
W3
W1
W2
W3
47
3.2.4 Procedure
3.2.4.1 Establishing water quantities corresponding to selected water potentials
The quantity of water corresponding to a particular water potential was established gravimetrically
based on the water retention curve determination, using the ceramic pressure plate extractor to obtain the
relationship between the water content held in soil (θm) and matric potential (ψm) (Dane and Hopmans,
1986). Rings were placed on the ceramic plate filled with soil, sufficient water was added to the
plates to ensure conditions to approach saturation and left for 24. Afterwards the ceramic plate was
taken to the extractor and adjusted to specific pressure left the time needed until no more water was
extracted. The plate was then taken out and the content of the rings placed in containers of a know
mass and weighed to obtain the wet sample mass (Mws). The samples were then oven dried for 24
hours at 105 °C to obtain the mass of the soil (Mds). The percentage gravimetric water content was
obtained based on equation 3 (referred below, under calculations step 4) , and was found to be 17.5, 12 and 10
% corresponding to water potentials of -10, -100 and -1000 kPa respectively.
3.2.4.2 Incubation
The amount of sludge added was equivalent to 10 ton ha-1 on a dry mass basis (0.31g, 0.23g and
0.22g) for stable Vlakplaas, unstable Olifantsfontein and Sasol sludges respectively, were added and
thoroughly mixed with 50 g of soil pre-incubated, for seven days, at room temperature (~25°C) and
moistened with 50% of water corresponding to water potential of -10 kPa (4.25g), to stimulate
microbial activity. After mixing the amended soil was weighed and while still on the scale water was
added corresponding to 8.5g, 6.0g, and 5.0g to adjust water potentials equivalent to -10, -100, and -
1000 kPa respectively. The amended soil was then incubated at selected temperature for 56 days. An
incubation chamber with temperature control was used to maintain the temperature of the low
temperature treatment at 10 ºC. The 25 ºC treatment was done in an incubation room, while the high
temperature treatment was subjected to a constant temperature of 45 ºC in a incubation chamber
Water potential and aeration were monitored as described below. After each incubation time (0, 1,
7, 14, 28 and 56 days), samples were extracted with a 1M KCl solution for extractable and
exchangeable inorganic N determination (Bremner and Keeney, 1966).
48
3.2.4.3 Monitoring water potential and aeration
Samples incubated at 10 ºC and 25 ºC were opened and aerated using a small computer cooling fan
for approximately 1 minute, every two days to ensure the aerobic condition needed for nitrification.
At the same time samples were weighed and water added to compensate for evaporation, in order o
maintain conditions as close as possible to the water potential. This was again performed daily for
the higher temperature treatment, however, it proved to be difficult to maintain the various water
potentials at the high temperature treatment because the samples appeared to dry out quickly. It is
more likely that conditions of alternating wetting and drying were simulated for the 45 ºC treatment
rather than conditions of near water content.
49
3.2.5 Calculations
3.2.5.1 Mass of sludge used to amend the soil
The guidelines for sewage sludge application in South Africa established the upper limit application
rate of 10 ton per ha per year. Therefore, to get the mass of sludge to be added to 50 g of soil used
for incubation, the following calculations were made:
1st step – Soil bulk density (ρb), which is the mass of soil per unit volume, was estimated dividing a
mass of oven-dried soil (ms), by the volume occupied by that mass of soil (Vt)
ρb = ms/Vt (equation 1)
For a volume of 10 cm3 the corresponding mass was 11.9 g, therefore the ρb was 1.19 g cm-3
2nd step – Estimation of a mass of soil (M) corresponding to the area of 1 hectare, assuming a
plough layer depth of 20 cm, and the previously estimated bulk density of 1.19 g cm-3.
M = V x ρb = A x d x ρb (equation 2)
M = 10 000 m2 x 0.20 m x 1.19 x 103 kg m-3 = 2.38 x 10⁶ kg
Where A is the area in m2, and d is the ploughing depth
3rd step – The mass of sludge needed to apply to 50 g of soil (Ms) is given by:
Ms = 1 x 104 kg x (5 x 10-2 kg / 2.38 x 10⁶ kg) = 2.1 x 10⁻⁴ kg
To achieve an equivalent sludge loading rate of 10 ton ha-1, in dry mass basis, 0.21 g of dried sludge
was required to amend the 50 g of soil.
Considering that the (Ms) refers to the dry mass basis of sludge and since the collected samples were
not completely dry as oven drying sludge is not recommended (N loss may occur), therefore a
moisture correction factor was required to obtain the air dried sludge mass to be added (Madd).
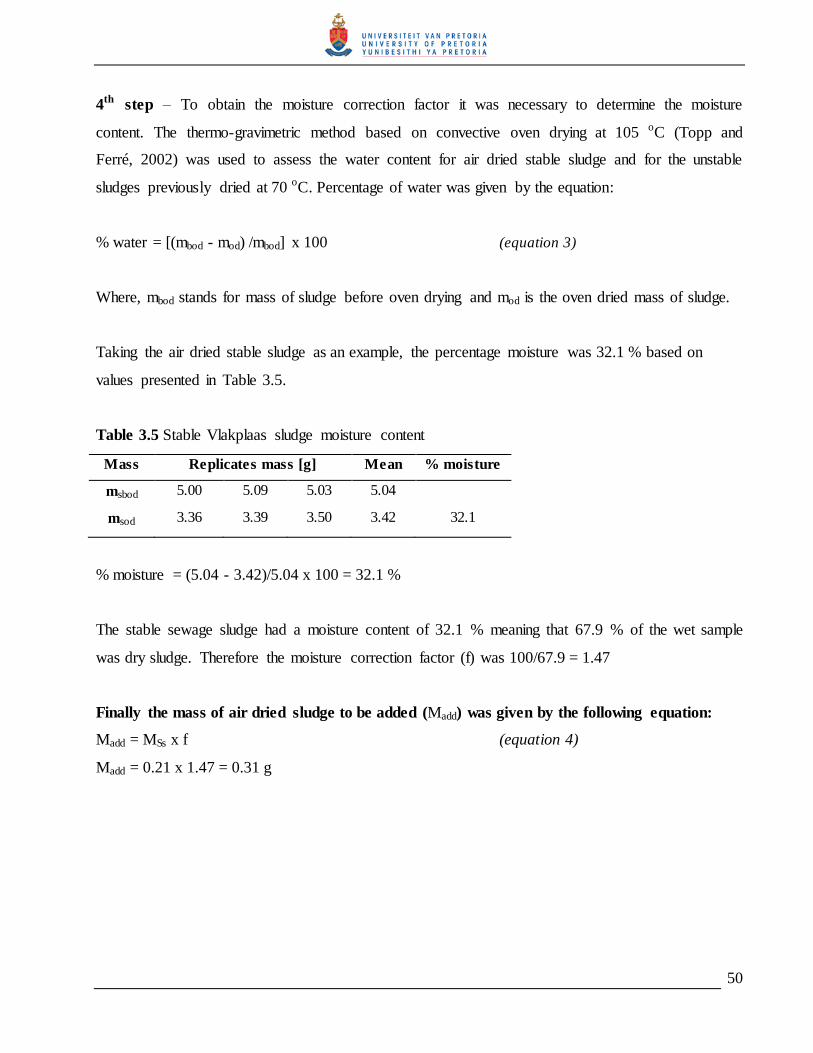
50
4th step – To obtain the moisture correction factor it was necessary to determine the moisture
content. The thermo-gravimetric method based on convective oven drying at 105 oC (Topp and
Ferré, 2002) was used to assess the water content for air dried stable sludge and for the unstable
sludges previously dried at 70 oC. Percentage of water was given by the equation:
% water = [(mbod - mod) /mbod] x 100 (equation 3)
Where, mbod stands for mass of sludge before oven drying and mod is the oven dried mass of sludge.
Taking the air dried stable sludge as an example, the percentage moisture was 32.1 % based on
values presented in Table 3.5.
Table 3.5 Stable Vlakplaas sludge moisture content
Mass Replicates mass [g] Mean % moisture
msbod 5.00 5.09 5.03 5.04
msod 3.36 3.39 3.50 3.42 32.1
% moisture = (5.04 - 3.42)/5.04 x 100 = 32.1 %
The stable sewage sludge had a moisture content of 32.1 % meaning that 67.9 % of the wet sample
was dry sludge. Therefore the moisture correction factor (f) was 100/67.9 = 1.47
Finally the mass of air dried sludge to be added (Madd) was given by the following equation:
Madd = MSs x f (equation 4)
Madd = 0.21 x 1.47 = 0.31 g

51
3.2.5.2 Extractable and exchangeable NH4+ and NO3
- plus NO2- determinations
The NH4+ and NO3
- + NO2- contents in sludge amended soils were determined after each incubation
period using Bremner and Keeney (1966) for extraction and Mulvaney‟s (1996) method for
distillation, as described in Sparks (1996). An aliquot of 50 ml from the 100 mL extract was mixed
with 20 mL of a 12.5 M NaOH solution, which creates conditions for NH4+ conversion into NH3, by
means of pH increase to above 9.2.
NH4+ + OH- NH4 OH NH3 + H2O (equation 5)
The NH3 formed volatilized during distillation and was collected in a mixture of boric acid and
methyl red plus methyl blue indicators which change colour at a specific pH, forming a green
coloured complex (alkaline pH) and purple to slight rose at acid pH
NH3 + H3BO3 / indicator NH4 H2BO3 (equation 6)
(Purple) pH < 4.4 (Green) pH > 6.2
The collected distilled solution was titrated with a 0.01 M HCl solution, and the volume recorded
was used for calculations, to obtain the amount of NH4+ in the sludge amended soil, based on the
neutralization principles.
NH4H2BO3- + HCl NH4Cl + H3BO3 (equation 7)
(Green) (Purple)
A reducing agent, Devarda‟s alloy powder, was added to remaining extract in the distil tube after
cooling, to convert NO3- + NO2
- to NH4+, which in turn, was taken back for distillation to convert
NH4+ into NH3 in presence of the alkali in excess (see equation 5). The process was repeated the
same way as described above. The volume of acid used was recorded for calculations, to obtain the
amount of NH4+ equivalent to the amount of NO3
- + NO2- in the sludge amended soil, because it is an
equimolar displacement reaction. Both NH4+ and (NO3
- + NO2-) amounts were obtained using the
following equation:
52
NH4+ [mmol kg
-1] = (Vacid x Cacid)/ 1000 x (Vextract/valiquot) x 1000/m (amended soil) x 1000 (equation 8)
Where Vextract is the volume of extracting solution, valiquot is the aliquot taken for digestion, Cacid is
the concentration of the acid, Vacid is the volume of the acid used in titration for complete
displacement of ammonium and m(amended soil) the mass of the soil plus sludge added. The first 1000 is
for volume conversion from L to ml, and the second 1000 for mass conversion from g to kg, and the
third 1000 is for converting mol to mmol.
3.2.5.3 Net N release from the sludge
The term net N release in this study encompasses all forms of inorganic N released from the sludge
during incubation processes, plus the initial inorganic N content in the sludge, which are measured in
a 1 M KCl extraction solution. The individual values of extractable and exchangeable inorganic N
forms (NH4+ and NO3
- plus NO2-,) were calculated based on equation 8. Therefore, net N release
was calculated as the difference between extractable and exchangeable NH4+ and NO3
- plus NO2-
obtained in sludge amended soil and in the soil without any sludge (control) equation 9.
Net inorg N released = sludge N amended soil – control N released (equation 9)
Net inorganic N released = [NH4+ + (NO3
- + NO2-)] amended soil - [NH4
+ + (NO3- + NO2
-)] control
3.2.5.4 Potentially available N
This is a very important parameter in soil fertility studies for efficient use of N and for good
environmental management. The potentially available N from sludge amended soil expressed in
percentage can easily be calculated as follows:
Potentially available N = (Net inorganic N released) / Tot N added) *100 (equation 10)
Where Potentially available N is the inorganic N, Net inorganic N released is the initial inorganic
N added through sludge application plus net N mineralized during incubation, and Tot N added is
the amount of total N present in the added sewage sludge.

53
3.2.5.5 Organic N mineralized or potential mineralizable N
Part of organic N was mineralized during incubation period, and was calculated by difference
between total Org N and organic N present at time t. The potential mineralizable N was expressed in
percentage basis and was calculated using equation 11. However, potential organic N was
underestimated as a result of overestimation of Org Nt (having other inorganic N-forms, which were
not captured).
Org N mineralized = Total Org N - Org Nt
Potential mineralized N = Org N mineralized/ Total org N added)]* 100 (equation 11)
3.2.5.6 Partial N mass balance
An assessment of the N mass balance was important for this study, because it gives an insight into
the fate of the different N-forms during the incubation process. Sludge N was reported on a % dry
mass basis (Table 3.1), and therefore, it had to be converted into [mg kg-1] or [mmol kg-1]. For
convenience it is expressed in mmol per kg, as the molar basis makes easy and confident
comparison among N specimens. The mass balance linking different N-forms in sludge amended
soils is presented in Table 3.14 for stable sludge, Table 3.15 for unstable Olifantsfontein and Table
3.16 for unstable Sasol sludge.
An example for calculations is shown below, taking the stable Vlakplaas sludge, which contained
0.66 % NH4+ and 0.24 % NO3
- + NO2-, in dry mass basis.
i) Amount of NH4+ contained in the mass of sludge used for incubation
Based on the percentage NH4+ in the stable sludge (0.66 %), the amount of NH4
+ in the mass of
sludge used for incubation was:
NH4+ = ((0.66 x 0.21g)/ 100) x 1000 = 1.386 mg / 18 = 0.08 mmol
Where, multiplying with a 1000 was to convert grams to milligrams, and to express the amount of
NH4+ in mmol results should be divided by the molar mass of NH4 (1mmol is equal to 18 mg).

54
ii) Amount of NO3- contained in the mass of sludge used for incubation
From Table 3.1, the NO3- in the stable sludge was (0.24 %), therefore, the amount of NO3
- in the
mass of sludge used for incubation was:
NO3- = (0.24 x 0.21g / 100) x 1000 = 0.504 mg /62 = 0.008 mmol
Where, 1000 is to convert grams into milligrams, and to express the amount of NO3- in mmol results
should be divided by the molar mass of NO3
For the other N-forms (Tot N and Org N), calculations were based on the same principle used in i)
and ii) using the molar mass of N (14). However, results from these calculations, shown in Table 3.6,
correspond to the N added to 50 g of soil. Therefore, conversion to a kg of soil was needed, to ensure
uniformity of units with those of the net N, NO3- and NH4
+ released during incubation period.
Table 3.6 Sludge N-forms contained in 50g of soil amended
Sludge source Mass of sludge
added (g)
(mmol / 50 g soil)
NH4 + NO3
- Org- N Tot N
Vlakplaas 0.21*
0.21*
0.21*
0.08 0.01 0.15 0.29
Olifantsfontein 0.01 0.00 0.78 0.80
Sasol 0.05 0.00 1.11 1.19
* Dry mass basis
iii) Amounts of sludge N- forms contained in a kg of soil amended
The amounts of sludge N-forms present in 1kg of soil amended were deduced from Table 3.6
multiplying by a factor of 20 coming from 1000g/50g, and are presented in Table 3.7.
Note: Considering that the 10t per ha are applied to a total mass of soil corresponding to a
volume of soil given by an area of 1ha and a ploughing depth of 0.20 m, therefore the amount
of sludge-N forms should be referred to a 1kg of soil, as shown in Table 3.7.

55
Table 3.7 Equivalent amounts of N-forms contained in 1kg of soil amended
Sludge source mmol kg-1
soil
Tot N NH4 + NO3
- Org- N
Vlakplaas 5.80 1.60 0.20 3.00
Olifantsfontein 16.0 0.20 0.00 15.6
Sasol 23.8 1.00 0.00 22.2
These amounts initially present in the sludge amended soil before incubation took place, were jointly
used with the calculated amounts of net N released during incubation period to obtain the partial N
mass balance after 56 day incubation.
3.2.5.7 Mineralization rate constant
Mineralization rate constant and half life time are important parameters required in modelling for
predicting N fate in soil systems that are obtained from N mineralization kinetics.
Based on literature it was also assumed that first order kinetics model by Stanford and Smith, (1972)
will be the best approach to determine rate constants for N mineralization (Benbi and Richter, 2002;
De Neve et al., 2004). Where data obtained from the incubation study was used to draw a graph
based on natural logarithm (ln N/No) versus incubation time, and the slope gives an estimated
mineralization rate constant (k).
N(t) = No (1- e –kt) (equation 12)
Where N(t) is the net N mineralized at time t; No the potentially mineralizable N; k is the
mineralization rate constant and t the incubation time.
Derivation of equation 12
Nitrogen at instant t (Nt) was modeled assuming that the rate of mineralization was constant (k)
i) dN(t) /dt = k, proportional to the remaining sludge mineralizable N, which is the difference
between potentially mineralizable N (No) and the cumulative already mineralized N at time t
(N(t))
56
ii) dN(t) /dt = k (No - N(t)), not accounting for the initial N or assuming that N content is
zero at the beginning of incubation the solution for equation i) is given by N(t) = kt.
Therefore the solution for equation ii) become N(t) = No (1-e -kt)
Derivation of k from equation 12
The rate constant is calculated as follows, or by plotting a ln N/No graph versus time the slope
represents k:
N(t) = No (1- e –kt)
Nt/No =1 - e -kt
e -kt = 1- Nt/ No
- kt = ln(1 – Nt/No)
-kt = ln (1) – ln (Nt/No) ; ln (1) = 0
-kt = - ln (Nt/No) ; k = ln (Nt/No)/ t equation 13
Considering the fact that the first flush of N mineralization on disturbed samples, during the initial
two weeks of incubation, is an experimental artefact which results from a drying and rewetting of
soil samples. Therefore, the inorganic N measured is not part of true potentially mineralizable N
(Nο) of the substrate and should be modelled separately through the double first order model, by
(Molina et al., 1980) to account for the initial flush of N mineralization.
N min = N1 (1- e – k1
t) + N2 (1- e –k2
t) (equation 14)
N1 represents the fast cycling pool of mineralizable N and k1 the rate constant for this pool; N2
represents the slow mineralizable N pool and k2 the corresponding rate constant.
Theoretically it is assumed that these pools are of definite sizes that should not change with
environmental conditions or with procedures used to fit the models to data (Cabrera et al., 2005).
Based on Smith et al. (1998c) findings potentially mineralizable N was also estimated at 26 % of
total applied N for the fast cycling pool (N1) and 42 % of total applied N for the slow release pool
(N2).

57
3.2.5.8 Half life time
The half-life time for a given exponential decay process indicates how long it would take for 50% of
initial amount added to decompose: Yt = Y0 / 2
The value of t that satisfies the above equation is the half life time and is given by:
t1/2 = ln (2)/k equation 15

58
3.3 Results and discussion
The amounts of NH4+, NO3
- and net N release during incubation are reflected in Figures 3.3, 3.4 and
3.5, illustrating how N mineralization was affected by incubation time, temperature, water potential
and sludge stability. Talking on net N release one should expect the graphs of net inorganic N
release starting from zero at day zero (as initial stage of the incubation), however, considering the
aspect of sludge nitrogen availability for crops, they start from a value representing the inorganic N
already present in the sludge.
3.3.1 Net inorganic N released after a 56-day incubation
Figure 3.2 (a) reflects net N mineralized and 3.2 (b) net N released, that is N liberated as a result of
the mineralization of Organic N as well as inorganic N released from the sludge. As discussed
previously net N mineralized is important in modelling N mineralization, however, net N release is
also important from both a soil fertility and environment management point of view, because sludge
can contain appreciable amounts of inorganic N depending on the stabilisation process it underwent.
-10123456789
101112
0 7 14 21 28 35 42 49 56
mm
ol i
no
rg N
kg
-1
Incubation time [days]
a
Vlkp Olif Sas
0123456789
101112
0 7 14 21 28 35 42 49 56
mm
ol i
org
N k
g -1
Incubation time [days]
b
Vlak Olif Sas
Figure 3.2 Net N mineralized (a) compared to net N released (Mineralization plus N released) from sludges at
25 oC and -10kPa
59
Vlakplaas sludge that was anaerobically digested and then paddy dried for an extended time had
much higher NH4+ and NO3
- levels (366.7 mmol kg -1 and 38.7 mmol kg -1 ) respectively, than sludge
perceived to be less stable. The Olifantsfontein sludge, for example, which was unstable activated
partially digested and belt pressed containing 66.7 mmol kg -1 NH4+ and 1.6 mmol kg -1 NO3
- (Table
3.2). The data suggests that at an equivalent loading rate of 10 ton ha-1 sludge addition elevated
inorganic N levels in the soil between 2 and 5.7 mmol kg-1 (Figure 3.2 b). It was expected that the
amendment with Vlakplaas sludge will result in the highest initial N levels, however, the data does
not reflect this. The reason might have been that KCl extraction have extracted also de dissolved
organic N that was much higher for Olifantsfontein having 3714 mmol kg -1 of organic N while
Vlakplaas had only 735.7 mmol kg -1. The availability of N is closely linked to dissolved organic C,
which is easily extracted with salt extractant (Silveira, 2005; Dijkstra et al., 2007). This is also the
reason why estimated initial inorganic and organic N values differ from the determined values at
time T0.
The net N mineralization was significantly affected by the interaction between temperature and
water potential. Sludge N mineralization increased with temperature, and highest net N release was
observed at 45 ºC. This was also true for Zaman and Chang (2004), who reported greater N
mineralization at 45 ºC and soil moisture around field capacity than at 25 ºC and 5 ºC. These results
contradict the optimum temperature range for mineralization (25 ºC – 35 ºC) stated by Doran and
Smith (1987), in Figure 2.3. In this study 25 ºC was optimum temperature range for nitrification.
However, these results are in agreement with Quemada and Cabrera (1997), who found the effect of
optimal soil water content enhanced with temperature increase. Tajeda et al. (2002) also found that
N mineralization was higher at 25 oC than 15 oC, and that increasing temperature boosted
mineralization as well as N losses which can exceed 50 %.
Figures 3.3, 3.4 and 3.5 show N release from Vlakplaas, Olifantsfontein and Sasol sludges,
respectively. When comparing them net N release had different trends during the initial stage of
incubation. The negative period illustrated in Figure 3.4 and Figure 3.5 was a direct result of the
initial low inorganic N content of less stable sludge. For example, the unstable Olifantsfontein
sludge contained 2 % inorganic and easily metabolizable N, while stable sludge contained 54 % of
60
available inorganic N. Therefore, in order to mineralize the unstable sludge, microorganisms had to
metabolize easily available inorganic N from the soil and that of the sludge as source of energy.
These results are similar to findings of Wang‟s et al., (2003) that mineralization of organic N in soils
amended with bioslids was strongly influenced by its quality and temperature. Probert et al. (2005)
also observed that at the initial stage of incorporation of organic sources, inorganic N was
immobilized even with substrates having C:N ratios less than 20.
3.3.2 Vlakplaas amended soil: Effects of temperature and water potential on the
mineralization process
From Figure 3.3 the effect of incubation time, soil temperature and water content on net N release
from stable sewage sludge amended soil were evident. The amount of NH4+ increased for the first 24
hours of incubation followed by a sharp decrease during the first week for T1, afterward the decrease
was more gradual. This initial increase in the amount of NH4+ might have been due to boosting of
microbial activity and subsequent ammonification, following moistening of sludge amended
samples. At T2, mineralization was insignificant, only nitrification was observed. At high
temperature (45 oC), the amount of NH4+ had increased sharply in the first day of incubation, and
then an irregular increasing trend was observed. Negligible amounts of NO3- were formed indicating
that nitrification was inhibited or the nitrate formed was lost. As a result net released N was mainly
in ammonium form.
Meanwhile NO3- levels increased along the incubation period, as a result of nitrifying bacteria
activity. This occurred for all treatment combinations involving T1 and T2. However, the trend was
different for treatment combinations involving T3. In which NH4+ had increased and no nitrate was
formed. The reason is that high temperatures increase mineralization but are unfavorable to
nitrifying bacteria.
Results from previous research found that nitrifying bacteria are more sensitive to extreme
temperature and moisture conditions than ammonifiers (Sierra et al., 2001; Zaman and Chang,

61
2004). Another suggestion is that the little NO3- which may be formed might have been denitrified
and lost by the time samples were aerated and/or the microbe biomass might have assimilated nitrate
and nitrite under anaerobic warm conditions (Brady and Weil, 2002).
At 10 oC both inorganic N forms (NH4+ and NO3
-) coexisted up to the end of incubation however, at
25 oC, NH4+ was converted to NO3
- after 28 days of incubation complete conversion of NH4+ was
observed. The optimum nitrifying conditions is shown by the complete conversion of NH4+ to NO3
-.
Ashok et al. (2006) found a sharp increase of NH4+ for the first fifteen days of incubation at 25 oC,
followed by a sharp decline indicating rapid transformation into nitrate-N.
Smith and Tibbett (2004) found an increase in NH4+ and decrease in NO3
- and no net nitrate
accumulation, this contradicts with Smith et al., (1998a) results which reported net NO3-
accumulation in soils amended with undigested biolsolids at 25 oC and soil water content at 40 %
FC, however, immobilization of inorganic N was significant during the initial stage of incubation.
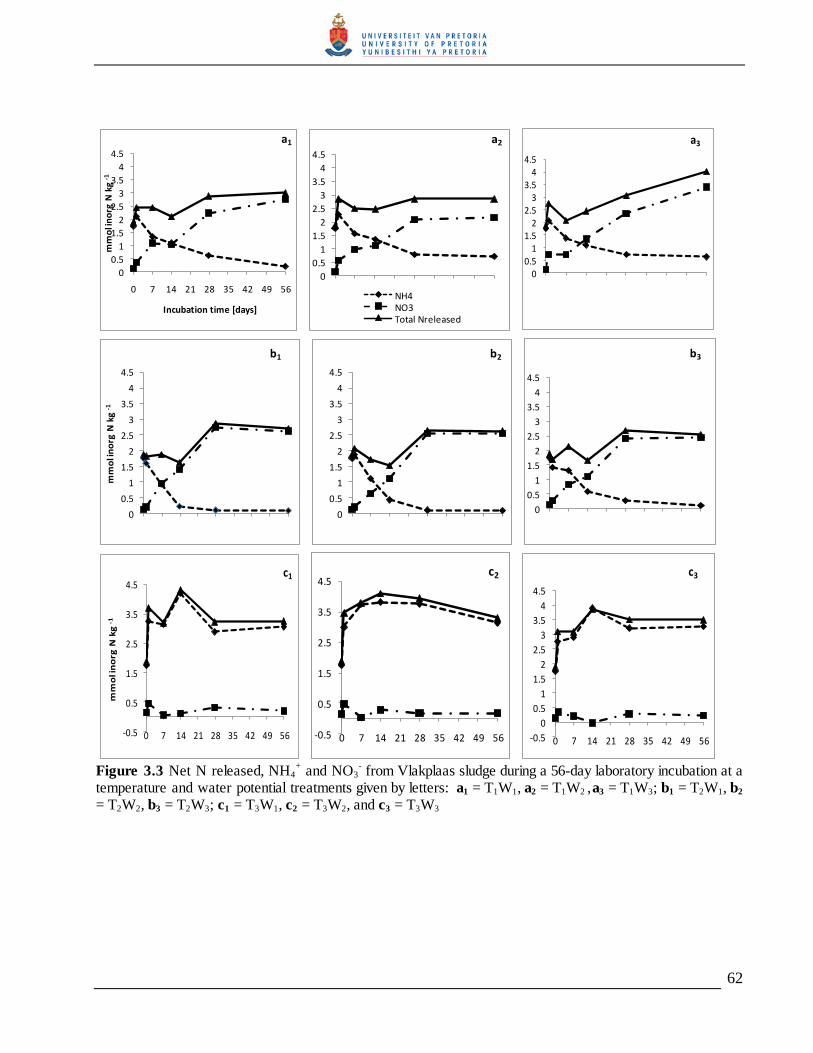
62
0
0.5
1
1.5
2
2.5
3
3.5
4
4.5
0 7 14 21 28 35 42 49 56
mm
ol i
no
rg N
kg
-1
Incubation time [days]
a1
0
0.5
1
1.5
2
2.5
3
3.5
4
4.5
a2
NH4NO3Total Nreleased
00.5
11.5
22.5
33.5
44.5
a3
0
0.5
1
1.5
2
2.5
3
3.5
4
4.5
mm
ol i
no
rg N
kg
-1
b1
0
0.5
1
1.5
2
2.5
3
3.5
4
4.5
b2
0
0.5
1
1.5
2
2.5
3
3.5
4
4.5
b3
-0.5
0.5
1.5
2.5
3.5
4.5
0 7 14 21 28 35 42 49 56
mm
ol i
no
rg N
kg
-1
c1
-0.5
0.5
1.5
2.5
3.5
4.5
0 7 14 21 28 35 42 49 56
c2
-0.5
0
0.5
1
1.5
2
2.5
3
3.5
4
4.5
0 7 14 21 28 35 42 49 56
c3
Figure 3.3 Net N released, NH4
+ and NO3
- from Vlakplaas sludge during a 56-day laboratory incubation at a
temperature and water potential treatments given by letters: a1 = T1W1, a2 = T1W2 , a3 = T1W3; b1 = T2W1, b2 = T2W2, b3 = T2W3; c1 = T3W1, c2 = T3W2, and c3 = T3W3
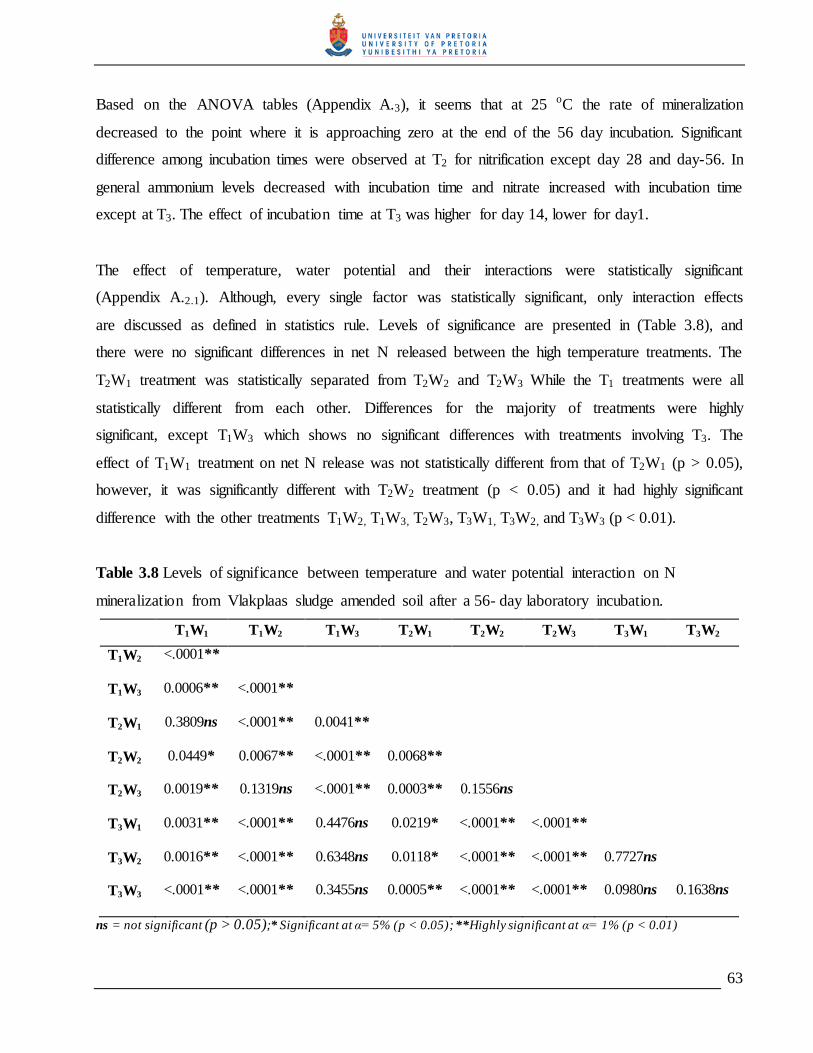
63
Based on the ANOVA tables (Appendix A.3), it seems that at 25 oC the rate of mineralization
decreased to the point where it is approaching zero at the end of the 56 day incubation. Significant
difference among incubation times were observed at T2 for nitrification except day 28 and day-56. In
general ammonium levels decreased with incubation time and nitrate increased with incubation time
except at T3. The effect of incubation time at T3 was higher for day 14, lower for day1.
The effect of temperature, water potential and their interactions were statistically significant
(Appendix A.2.1). Although, every single factor was statistically significant, only interaction effects
are discussed as defined in statistics rule. Levels of significance are presented in (Table 3.8), and
there were no significant differences in net N released between the high temperature treatments. The
T2W1 treatment was statistically separated from T2W2 and T2W3 While the T1 treatments were all
statistically different from each other. Differences for the majority of treatments were highly
significant, except T1W3 which shows no significant differences with treatments involving T3. The
effect of T1W1 treatment on net N release was not statistically different from that of T2W1 (p > 0.05),
however, it was significantly different with T2W2 treatment (p < 0.05) and it had highly significant
difference with the other treatments T1W2, T1W3, T2W3, T3W1, T3W2, and T3W3 (p < 0.01).
Table 3.8 Levels of significance between temperature and water potential interaction on N
mineralization from Vlakplaas sludge amended soil after a 56- day laboratory incubation.
T1W1 T1W2 T1W3 T2W1 T2W2 T2W3 T3W1 T3W2
T1W2
<.0001**
T1W3
0.0006** <.0001**
T2W1
0.3809ns <.0001** 0.0041**
T2W2
0.0449* 0.0067** <.0001** 0.0068**
T2W3
0.0019** 0.1319ns <.0001** 0.0003** 0.1556ns
T3W1
0.0031** <.0001** 0.4476ns 0.0219* <.0001** <.0001**
T3W2
0.0016** <.0001** 0.6348ns 0.0118* <.0001** <.0001** 0.7727ns
T3W3
<.0001** <.0001** 0.3455ns 0.0005** <.0001** <.0001** 0.0980ns 0.1638ns
ns = not significant (p > 0.05);* Significant at α= 5% (p < 0.05); **Highly significant at α= 1% (p < 0.01)
64
At low temperature it seems that water potential significantly influenced net N release, but did not
show a consistent trend. At the high temperature treatment changes in water potential had no
statistical significant effect on the amount of N released, this can be attributed to the difficulty of
maintaining the treatment at the specific water potentials.
The effect of high temperature (45 oC) was superior for NH4+ formation and negatively influenced
NO3- formation (Table 3.9). Net N released increased with temperature (it was 2.77 at T1W1 < 2.90 at
T2W1 < 3.25 at T3W1). The expected trend that net in released will increase as water potentials
approach field capacity was only observed for T2: 2.90 for T2W1, 2.46 for T2W2, and 2.25 for T2W3.
The high temperature treatment showed an opposite trend that was the more negative the water
potential the higher the observed N released, however the differences were not statistically
significant. This could have been an experimental artifact sprouting from the difficulty to maintain
the water content constant during the course of the incubation for this specific temperature treatment
(45 oC). Dependency of N release on water potential was significant at 10 oC treatment.
The effect of treatments with 25 oC was superior for nitrification. In general, nitrifying bacteria were
less active at 45 oC and more active at 25 oC whilst ammonifying bacteria, on the other hand, were
less active at 25 oC and more active at 45 oC. The balance between the proportion of ammonifying
and nitrifying bacteria is temperature dependent (Brady and Weil, 2002). Meaning that both
ammonifying and nitrifying bacteria can operate concurrently, whenever, the environmental
conditions are favorable. However, if the environmental conditions favor one type of bacteria is then
when this unbalance on their activity is seen.
Nitrate levels at 10 oC were comparable with those at 25 oC, the reason is that at low temperature, if
there is a good aeration, nitrifying bacteria might find favorable conditions (oxygen) required for
nitrification.

65
Table 3.9 Ranking and treatment mean comparison of NH4+, NO3
- and net N released, for the
Vlakplaas sludge amended soil after 56-days of laboratory incubation.
Treatment NH4+ Treatment NO3
- Treatment Net N released
[mmol kg-1]
T3W3 3.28 (0.04) A T1W3 2.99 (0.07)
A T3W3 3.50 (0.17)
A
T3W2 3.13 (0.34) AB
T2W1 2.93 (0.07) A T1W3 3.36 0.12)
AB
T3W1 3.05 (0.06) B T2W2 2.63 (0.02)
B T3W2 3.29 (0.40)
AB
T1W3 0. 80 (0.02) C T2W3 2.60 (0.04)
BC T3W1 3.25 (0.07)
B
T1W2 0.70 (0.12) CD
T1W1 2.52 (0.10) C T2W1 2.90 (0.04)
C
T1W1 0.60 (0.05) D T1W2 1.99 (0.06)
D T1W1 2.77 (0.13)
C
T2W3 0.11 (0.00) E T3W3 0.22 (0.04)
E T2W2 2.46 (0.04)
D
T2W1 0.07 (0.00) E T3W1 0.20 (0.12)
E T2W3 2.25 (0.04)
D
T2W2 0.03 (0.00) E T3W2 0.16 (0.02)
E T1W2 2.03 (0.07)
F
Treatments means in column followed by the same letter are not statistically different at α = 5%; LSD for
NH4+ = 0.15; LSD for NO3
- = 0.08 and LSD for Net N released = 0.21; Figures in brackets denote standard
errors.
3.3.3 Olifantsfontein amended soil: Effects of temperature and water potential on the
mineralization process
In general net N mineralization had a similar trend for all water potentials and temperatures;
mineralized N was mainly in ammonium form, with little differences in treatments involving T2.
After two weeks of incubation a decrease in NH4+ and consequent increase in NO3
- was observed
(Figure 3.4). However, the trend of temperature and water potential effect for Olifantsfontein sludge
did differ from the Vlakplaas sludge.
The initial inorganic nitrogen decrease observed after one day of incubation, could be due to
microbial flush following sludge application (N negative period). The Vlakplaas sludge treatment
did not show this, a possible reason for this could be the high initial inorganic N content. The
Olifantsfontein sludge, for example, contained 1.67 % of inorganic N, compared to 55 % for the
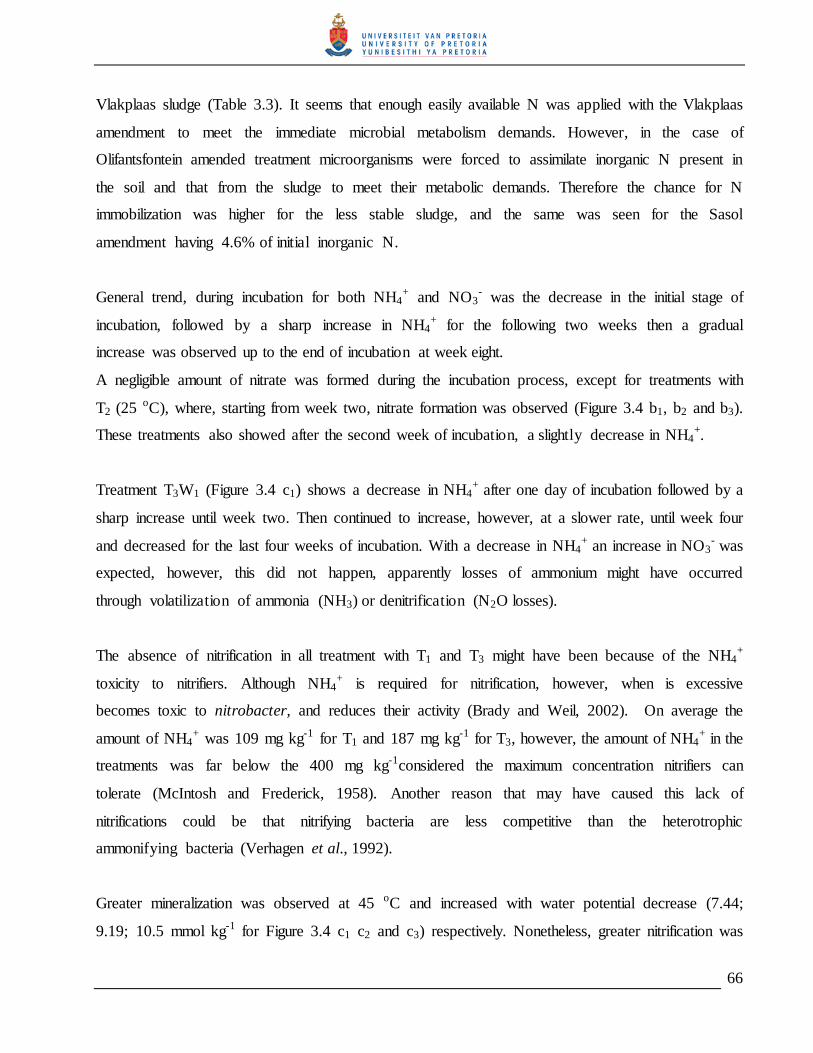
66
Vlakplaas sludge (Table 3.3). It seems that enough easily available N was applied with the Vlakplaas
amendment to meet the immediate microbial metabolism demands. However, in the case of
Olifantsfontein amended treatment microorganisms were forced to assimilate inorganic N present in
the soil and that from the sludge to meet their metabolic demands. Therefore the chance for N
immobilization was higher for the less stable sludge, and the same was seen for the Sasol
amendment having 4.6% of initial inorganic N.
General trend, during incubation for both NH4+ and NO3
- was the decrease in the initial stage of
incubation, followed by a sharp increase in NH4+ for the following two weeks then a gradual
increase was observed up to the end of incubation at week eight.
A negligible amount of nitrate was formed during the incubation process, except for treatments with
T2 (25 oC), where, starting from week two, nitrate formation was observed (Figure 3.4 b1, b2 and b3).
These treatments also showed after the second week of incubation, a slightly decrease in NH4+.
Treatment T3W1 (Figure 3.4 c1) shows a decrease in NH4+ after one day of incubation followed by a
sharp increase until week two. Then continued to increase, however, at a slower rate, until week four
and decreased for the last four weeks of incubation. With a decrease in NH4+ an increase in NO3
- was
expected, however, this did not happen, apparently losses of ammonium might have occurred
through volatilization of ammonia (NH3) or denitrification (N2O losses).
The absence of nitrification in all treatment with T1 and T3 might have been because of the NH4+
toxicity to nitrifiers. Although NH4+ is required for nitrification, however, when is excessive
becomes toxic to nitrobacter, and reduces their activity (Brady and Weil, 2002). On average the
amount of NH4+ was 109 mg kg-1 for T1 and 187 mg kg-1 for T3, however, the amount of NH4
+ in the
treatments was far below the 400 mg kg-1considered the maximum concentration nitrifiers can
tolerate (McIntosh and Frederick, 1958). Another reason that may have caused this lack of
nitrifications could be that nitrifying bacteria are less competitive than the heterotrophic
ammonifying bacteria (Verhagen et al., 1992).
Greater mineralization was observed at 45 oC and increased with water potential decrease (7.44;
9.19; 10.5 mmol kg-1 for Figure 3.4 c1 c2 and c3) respectively. Nonetheless, greater nitrification was

67
observed at 25 oC and decreased with water potential decrease (1.23; 0.44; 0.78 mmol kg-1 for Figure
3.4 b1 b2 and b3) respectively. At 10 oC the net N release increased as soil moisture changed from
high negative to low negative water potential (T1W1 > T1W2 > T1W3). Sierra et al. (2001) found that
nitrifying bacteria was more sensitive to changes in water potential than ammonifying bacteria. This
supports the results found for stable sewage sludge amended soils where nitrification process was
highly temperature dependent.
Theoretically the optimum temperature and water potential combination for mineralization was
expected to be T2W1, as illustrated in Figure 2.2 and Figure 2.3 (Doran and Smith, 1987). However,
in this experiment this combination appeared to be optimum only for nitrification. Zaman and Chang
(2004) found that the effect of soil moisture on mineralization was enhanced at lower temperature
and the effect of soil moisture on mineralization was masked at higher temperature.
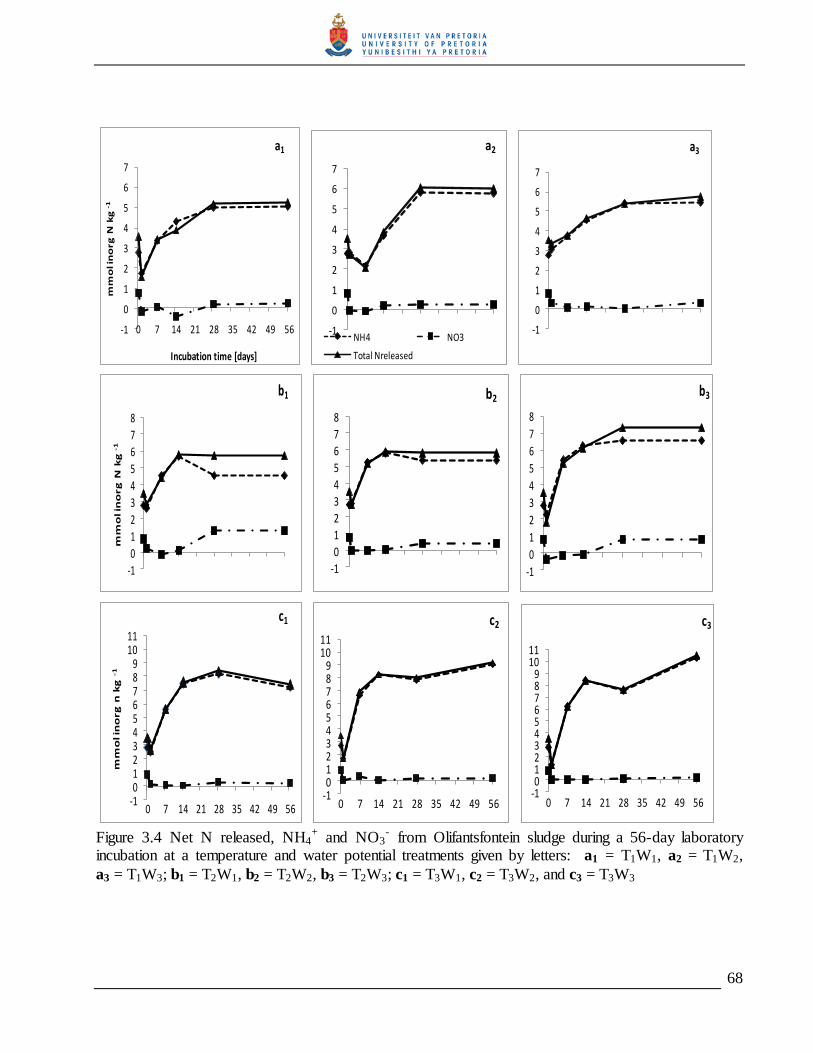
68
-1
0
1
2
3
4
5
6
7
0 7 14 21 28 35 42 49 56
mm
ol in
org
N k
g -
1
Incubation time [days]
a1
-1
0
1
2
3
4
5
6
7
a2
NH4 NO3
Total Nreleased
-1
0
1
2
3
4
5
6
7
a3
-1
0
1
2
3
4
5
6
7
8
mm
ol in
org
N k
g -
1
b1
-1
0
1
2
3
4
5
6
7
8
b2
-1
0
1
2
3
4
5
6
7
8
b3
-10123456789
1011
0 7 14 21 28 35 42 49 56
mm
ol in
org
n k
g -
1
c1
-10123456789
1011
0 7 14 21 28 35 42 49 56
c2
-10123456789
1011
0 7 14 21 28 35 42 49 56
c3
Figure 3.4 Net N released, NH4
+ and NO3- from Olifantsfontein sludge during a 56-day laboratory
incubation at a temperature and water potential treatments given by letters: a1 = T1W1, a2 = T1W2, a3 = T1W3; b1 = T2W1, b2 = T2W2, b3 = T2W3; c1 = T3W1, c2 = T3W2, and c3 = T3W3
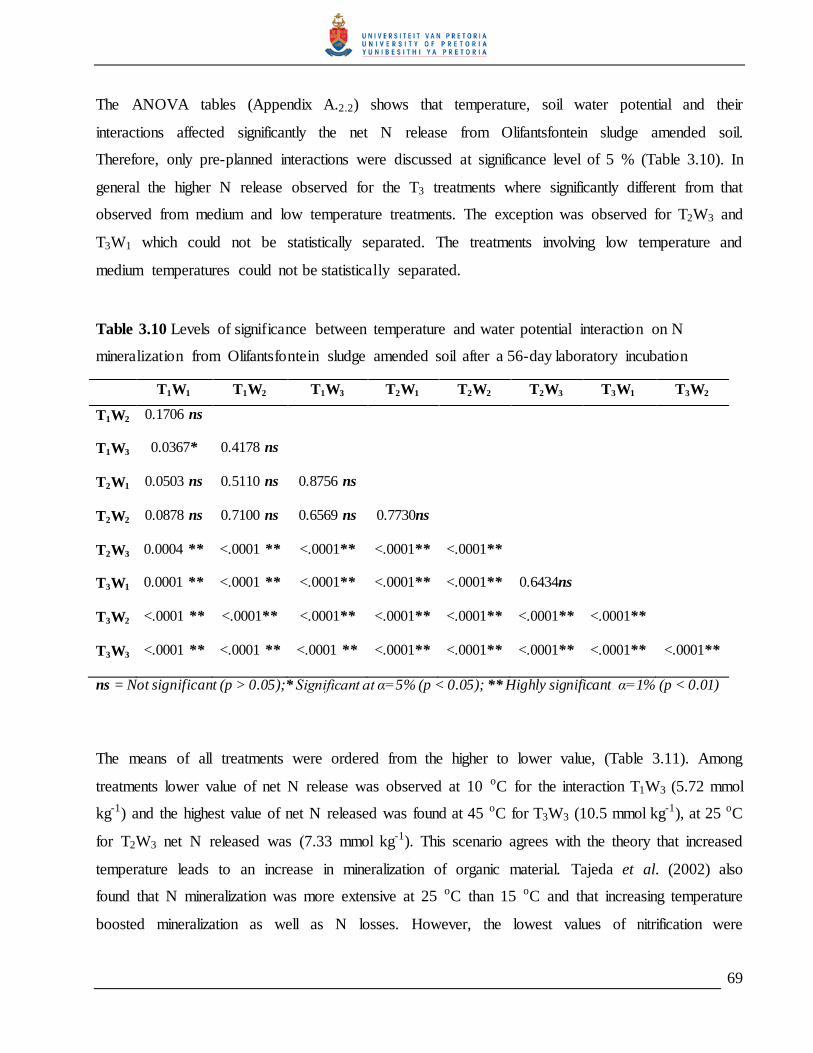
69
The ANOVA tables (Appendix A.2.2) shows that temperature, soil water potential and their
interactions affected significantly the net N release from Olifantsfontein sludge amended soil.
Therefore, only pre-planned interactions were discussed at significance level of 5 % (Table 3.10). In
general the higher N release observed for the T3 treatments where significantly different from that
observed from medium and low temperature treatments. The exception was observed for T2W3 and
T3W1 which could not be statistically separated. The treatments involving low temperature and
medium temperatures could not be statistically separated.
Table 3.10 Levels of significance between temperature and water potential interaction on N
mineralization from Olifantsfontein sludge amended soil after a 56-day laboratory incubation
T1W1 T1W2 T1W3 T2W1 T2W2 T2W3 T3W1 T3W2
T1W2
0.1706 ns
T1W3
0.0367* 0.4178 ns
T2W1
0.0503 ns 0.5110 ns 0.8756 ns
T2W2
0.0878 ns 0.7100 ns 0.6569 ns 0.7730ns
T2W3
0.0004 ** <.0001 ** <.0001** <.0001** <.0001**
T3W1
0.0001 ** <.0001 ** <.0001** <.0001** <.0001** 0.6434ns
T3W2
<.0001 ** <.0001** <.0001** <.0001** <.0001** <.0001** <.0001**
T3W3
<.0001 ** <.0001 ** <.0001 ** <.0001** <.0001** <.0001** <.0001** <.0001**
ns = Not significant (p > 0.05);* Significant at α=5% (p < 0.05); ** Highly significant α=1% (p < 0.01)
The means of all treatments were ordered from the higher to lower value, (Table 3.11). Among
treatments lower value of net N release was observed at 10 oC for the interaction T1W3 (5.72 mmol
kg-1) and the highest value of net N released was found at 45 oC for T3W3 (10.5 mmol kg-1), at 25 oC
for T2W3 net N released was (7.33 mmol kg-1). This scenario agrees with the theory that increased
temperature leads to an increase in mineralization of organic material. Tajeda et al. (2002) also
found that N mineralization was more extensive at 25 oC than 15 oC and that increasing temperature
boosted mineralization as well as N losses. However, the lowest values of nitrification were
70
observed at 45 oC and 10 oC, the highest at 25 oC, for example T1W1 (0.24 mmol kg-1), T2W1 (1.23
mmol kg-1) and T3W1 (0.19 mmol kg-1). Under 25 oC nitrification increased with increase in water
potential T2W1 (1.23 mmol kg-1), T2W2 (0.78 mmol kg-1) and T2W3 (0.44 mmol kg-1). Sierra et al.
(2001) found that nitrifiers were more sensitive to changes in water potential than ammonifiers.
Table 3.11 Ranking and mean comparison of NH4+, NO3
- and net N released, for the unstable
Olifantsfontein sludge amended soil after 56-days of laboratory incubation
Treatment NH4+ Treatment NO3
- Treatment Net N released
[mmol kg-1]
T3W3 10.4 (0.45) A T2W1 1.23 (0.06)
A T3W3 10.5 (0.45)
A
T3W2 9.03 (0.30) B T2W3 0.78 (0.06)
B T3W2 9.19 (0.29)
B
T3W1 7.25 (0.22) C T2W2 0.44 (0.05)
C T3W1 7.44 (0.18)
C
T2W3 6.55 (0.08) D T1W3 0.28 (0.06)
D T2W3 7.33 (0.21)
C
T1W1 6.03 (0.18) E T1W1 0.24 (0.05)
D E T1W1 6.27 (0.24)
D
T1W2 5.78 (0.02) E T3W1 0.19 (0.04)
E T1W2 5.92 (0.09)
DE
T1W3 5.44 (0.05) F T3W2 0.16 (0.02)
EF T2W2 5.83 (0.06)
E
T2W2 5.39 (0.02) F T3W3 0.12 (0.02)
F T2W1 5.76 (0.61)
E
T2W1 4.52 (0.51) G T1W2 0.12 (0.07)
F T1W3 5.72 (0.04)
E
Treatment means in column followed by the same letter are not significantly different at α = 5%; LSD for
NH4+ = 0.32; LSD for NO3
- = 0.06 and LSD for Net N released = 0.36; Figures in brackets denote standard
errors
Again, as was observed, for Vlakplaas sludge, the Olifantsfontein sludge also showed the highest N
mineralization at treatments involving T3. This is out from the range illustrated by Doran and Smith
(Figure 2.3), however, Zaman and Chang, (2004) also found high levels of N mineralized at 40 oC.
71
3.3.4 The SASOL amended soil: Effects of temperature and water potential on the
mineralization process
Figure 3.5 illustrates how inorganic N forms where changing during the 56-day laboratory
incubation, under all treatments. Similarly to other unstable sludge from domestic wastewater both
ammonium and nitrate decreased after first day of incubation. The negative periods of NO3-
previously observed for unstable Olifantsfontein sludge amended soil were also observed during
initial stage of incubation with the unstable Sasol sludge amended soil. This was also attributed to
the initially low inorganic N in unstable Sasol sludge amended soil. Consequently the available NO3-
was assimilated by microbe population to get energy for their metabolism.
After one day incubation, the trend under interactions with T1 (Figure 3.5 a1 – a3) and with T3
(Figure 3.5 c1 – c3) was similar and differed from interactions with T2 (Figure 3.5 b1 – b3). No
nitrification occurred at 10 oC and 45 oC, however, at 25 oC nitrification took place from the second
week onwards until the end of incubation.
The absence of nitrification at 10 oC and 45 oC may be a result of nitrifying bacteria high sensitivity
to extreme temperature and to NH4+ toxicity. The average amount of NH4
+ for 10 oC and 45 oC
ranged between 110 – 131 mg kg-1, however, this range was still far from 400 mg kg-1, (McIntosh
and Frederick, 1958) and the 800 mg kg-1 (Broadbent et al., 1957), found to be the maximum NH4+
in soil tolerated by nitrifiers. Other research conducted with the Sasol sludge involving leaching
studies also revealed that water soluble arsenic, boron and selenium levels of this sludge is quite
high. Especially arsenic is extremely biotoxic and it is reasonable to expect that it will have a
negative effect on microbes involved in the mineralization process especially those involved in
nitrification.
For T1 and T2 interactions with all water potential mineralization decreased from W1 to W3. This was
in accordance with (Doran and Smith, 1987; Leiros, et al., 1999). As soil water potential decreased
(reaching negative levels > - 50 kPa) soil microbe activity was reduced. However, at high
temperature the situation was opposite, net N release increased from W1 to W3, the same for unstable
Olifantsfontein and stable Vlakplaas sludge. Therefore, the effect of water potential on N release was

72
masked at high temperature. Zaman and Chang (2004) support these results, and also found higher
mineralization at 40 oC than at 20 oC and at 5 oC.
Considering what is referred in literature, water potential W1 (- 10 kPa) is close to optimum soil
moisture for mineralization. At this water potential, treatments with T2 (25 oC) resulted in the highest
net N release 9.75 mmol kg-1. This was an exception because for other sludge amended soils, higher
net N release was at 45 oC. A possible explanation was the existence of 5 % of NH4+ in the sludge
initially, which was nitrified and incremented the total net N released. Nevertheless, no nitrification
was observed at 10 oC and 45 oC, since nitrifiers are depressed at cold and hot conditions (Brady and
Weil, 2002). Therefore, greater part of mineralized N remained in NH4 form at 10 oC and 45 oC
treatments.
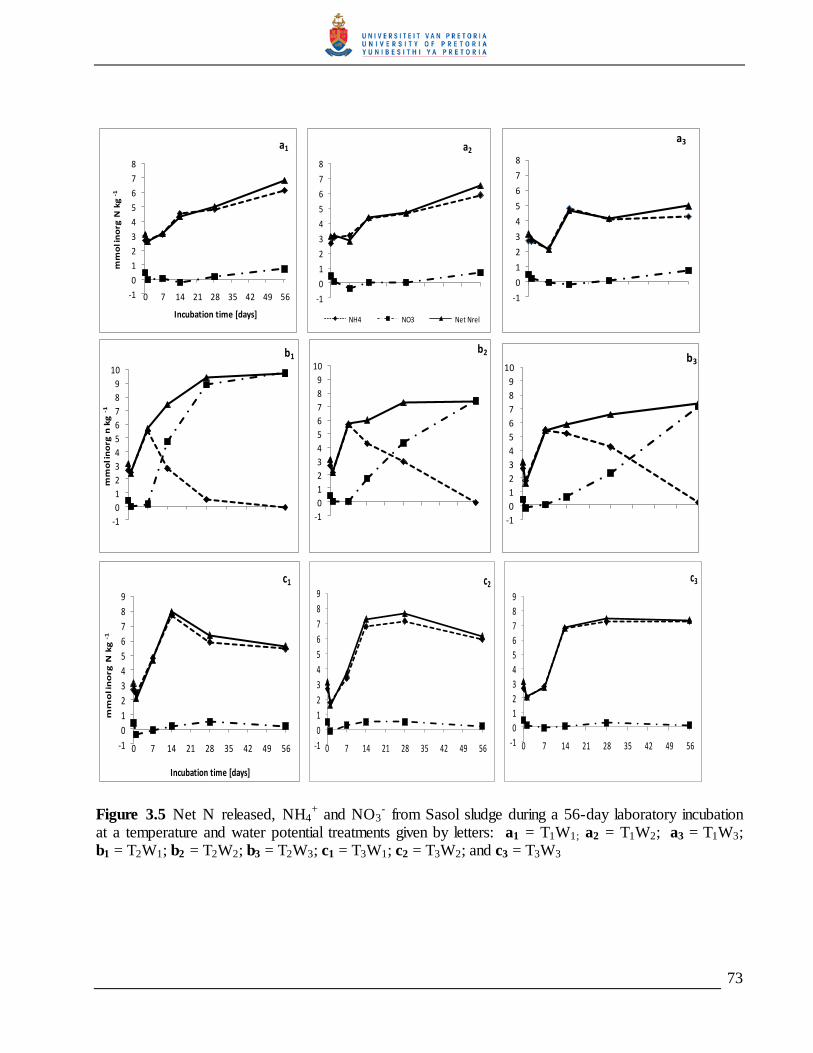
73
-1
0
1
2
3
4
5
6
7
8
0 7 14 21 28 35 42 49 56
mm
ol i
no
rg N
kg
-1
Incubation time [days]
a1
-1
0
1
2
3
4
5
6
7
8
a2
NH4 NO3 Net Nrel
-1
0
1
2
3
4
5
6
7
8
a3
-1
0
1
2
3
4
5
6
7
8
9
10
mm
ol i
no
rg n
kg
-1
b1
-1
0
1
2
3
4
5
6
7
8
9
10
b2
-1
0
1
2
3
4
5
6
7
8
9
10b3
-1
0
1
2
3
4
5
6
7
8
9
0 7 14 21 28 35 42 49 56
mm
ol i
no
rg N
kg
-1
Incubation time [days]
c1
-1
0
1
2
3
4
5
6
7
8
9
0 7 14 21 28 35 42 49 56
c2
-1
0
1
2
3
4
5
6
7
8
9
0 7 14 21 28 35 42 49 56
c3
Figure 3.5 Net N released, NH4+ and NO3
- from Sasol sludge during a 56-day laboratory incubation at a temperature and water potential treatments given by letters: a1 = T1W1; a2 = T1W2; a3 = T1W3; b1 = T2W1; b2 = T2W2; b3 = T2W3; c1 = T3W1; c2 = T3W2; and c3 = T3W3
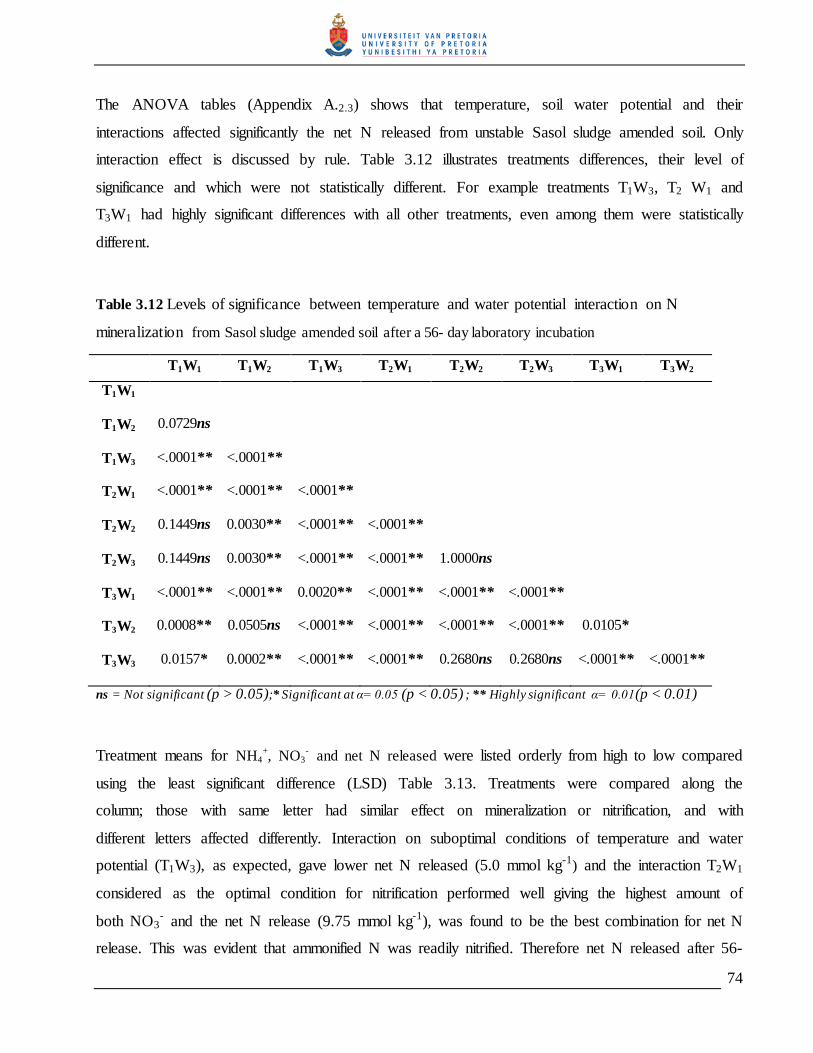
74
The ANOVA tables (Appendix A.2.3) shows that temperature, soil water potential and their
interactions affected significantly the net N released from unstable Sasol sludge amended soil. Only
interaction effect is discussed by rule. Table 3.12 illustrates treatments differences, their level of
significance and which were not statistically different. For example treatments T1W3, T2 W1 and
T3W1 had highly significant differences with all other treatments, even among them were statistically
different.
Table 3.12 Levels of significance between temperature and water potential interaction on N
mineralization from Sasol sludge amended soil after a 56- day laboratory incubation
T1W1 T1W2 T1W3 T2W1 T2W2 T2W3 T3W1 T3W2
T1W1
T1W2
0.0729ns
T1W3
<.0001** <.0001**
T2W1
<.0001** <.0001** <.0001**
T2W2
0.1449ns 0.0030** <.0001** <.0001**
T2W3
0.1449ns 0.0030** <.0001** <.0001** 1.0000ns
T3W1
<.0001** <.0001** 0.0020** <.0001** <.0001** <.0001**
T3W2
0.0008** 0.0505ns <.0001** <.0001** <.0001** <.0001** 0.0105*
T3W3
0.0157* 0.0002** <.0001** <.0001** 0.2680ns 0.2680ns <.0001** <.0001**
ns = Not significant (p > 0.05);* Significant at α= 0.05 (p < 0.05) ; ** Highly significant α= 0.01(p < 0.01)
Treatment means for NH4+, NO3
- and net N released were listed orderly from high to low compared
using the least significant difference (LSD) Table 3.13. Treatments were compared along the
column; those with same letter had similar effect on mineralization or nitrification, and with
different letters affected differently. Interaction on suboptimal conditions of temperature and water
potential (T1W3), as expected, gave lower net N released (5.0 mmol kg-1) and the interaction T2W1
considered as the optimal condition for nitrification performed well giving the highest amount of
both NO3- and the net N release (9.75 mmol kg-1), was found to be the best combination for net N
release. This was evident that ammonified N was readily nitrified. Therefore net N released after 56-
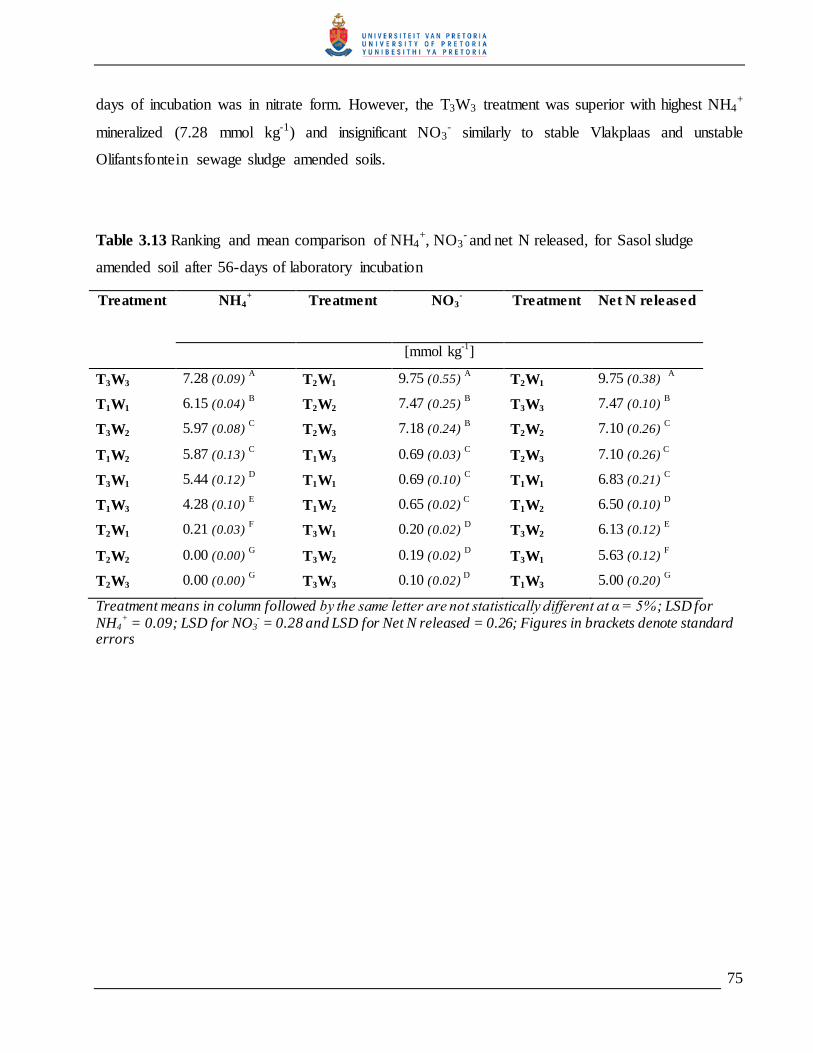
75
days of incubation was in nitrate form. However, the T3W3 treatment was superior with highest NH4+
mineralized (7.28 mmol kg-1) and insignificant NO3- similarly to stable Vlakplaas and unstable
Olifantsfontein sewage sludge amended soils.
Table 3.13 Ranking and mean comparison of NH4+, NO3
- and net N released, for Sasol sludge
amended soil after 56-days of laboratory incubation
Treatment NH4+ Treatment NO3
- Treatment Net N released
[mmol kg-1
]
T3W3 7.28 (0.09) A T2W1 9.75 (0.55)
A T2W1 9.75 (0.38)
A
T1W1 6.15 (0.04) B T2W2 7.47 (0.25)
B T3W3 7.47 (0.10)
B
T3W2 5.97 (0.08) C T2W3 7.18 (0.24)
B T2W2 7.10 (0.26)
C
T1W2 5.87 (0.13) C T1W3 0.69 (0.03)
C T2W3 7.10 (0.26)
C
T3W1 5.44 (0.12) D T1W1 0.69 (0.10)
C T1W1 6.83 (0.21)
C
T1W3 4.28 (0.10) E T1W2 0.65 (0.02)
C T1W2 6.50 (0.10)
D
T2W1 0.21 (0.03) F T3W1 0.20 (0.02)
D T3W2 6.13 (0.12)
E
T2W2 0.00 (0.00) G T3W2 0.19 (0.02)
D T3W1 5.63 (0.12)
F
T2W3 0.00 (0.00) G T3W3 0.10 (0.02)
D T1W3 5.00 (0.20)
G
Treatment means in column followed by the same letter are not statistically different at α = 5%; LSD for NH4
+ = 0.09; LSD for NO3
- = 0.28 and LSD for Net N released = 0.26; Figures in brackets denote standard
errors
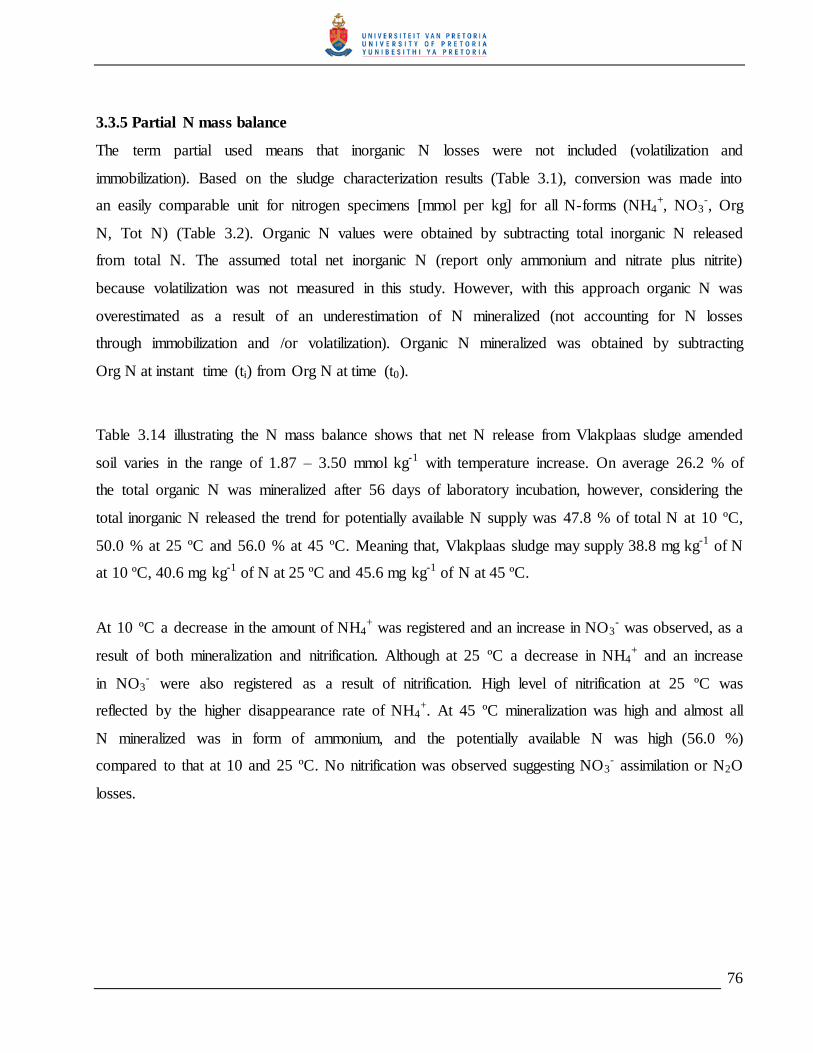
76
3.3.5 Partial N mass balance
The term partial used means that inorganic N losses were not included (volatilization and
immobilization). Based on the sludge characterization results (Table 3.1), conversion was made into
an easily comparable unit for nitrogen specimens [mmol per kg] for all N-forms (NH4+, NO3
-, Org
N, Tot N) (Table 3.2). Organic N values were obtained by subtracting total inorganic N released
from total N. The assumed total net inorganic N (report only ammonium and nitrate plus nitrite)
because volatilization was not measured in this study. However, with this approach organic N was
overestimated as a result of an underestimation of N mineralized (not accounting for N losses
through immobilization and /or volatilization). Organic N mineralized was obtained by subtracting
Org N at instant time (ti) from Org N at time (t0).
Table 3.14 illustrating the N mass balance shows that net N release from Vlakplaas sludge amended
soil varies in the range of 1.87 – 3.50 mmol kg-1 with temperature increase. On average 26.2 % of
the total organic N was mineralized after 56 days of laboratory incubation, however, considering the
total inorganic N released the trend for potentially available N supply was 47.8 % of total N at 10 ºC,
50.0 % at 25 ºC and 56.0 % at 45 ºC. Meaning that, Vlakplaas sludge may supply 38.8 mg kg-1 of N
at 10 ºC, 40.6 mg kg-1 of N at 25 ºC and 45.6 mg kg-1 of N at 45 ºC.
At 10 ºC a decrease in the amount of NH4+ was registered and an increase in NO3
- was observed, as a
result of both mineralization and nitrification. Although at 25 ºC a decrease in NH4+ and an increase
in NO3- were also registered as a result of nitrification. High level of nitrification at 25 ºC was
reflected by the higher disappearance rate of NH4+. At 45 ºC mineralization was high and almost all
N mineralized was in form of ammonium, and the potentially available N was high (56.0 %)
compared to that at 10 and 25 ºC. No nitrification was observed suggesting NO3- assimilation or N2O
losses.
77
Table 3.14 Partial N mass balance for the 56- day laboratory incubation with Vlakplaas sludge
Treatments
[mmol kg-1
] %
Tot N
T0
NH4+ NO3
- net N
released
net N
mineralized
Org N Org N
mineralized
Mineralizable
org N
Potentially
available N
T0 5.8 1.74 0.13 1.87 - 3.93 - - 32.2
T1W1 5.8 0.60 2.17 2.77 0.90 3.03 0.90 22.9 47.8
T1W2 5.8 0.70 1.99 2.69 0.82 3.11 0.82 20.9 46.4
T1W3 5.8 0.79 2.57 3.36 1.49 2.44 1.49 37.9 57.9
T2W1 5.8 0.07 2.83 2.90 1.03 2.90 1.03 26.2 50.0
T2W2 5.8 0.07 2.55 2.62 0.75 3.18 0.75 19.1 45.2
T2W3 5.8 0.06 2.44 2.50 0.63 3.30 0.63 16.0 43.1
T3W1 5.8 3.06 0.20 3.26 1.39 2.54 1.39 35.4 56.2
T3W2 5.8 3.13 0.16 3.29 1.42 2.51 1.42 36.1 56.7
T3W3 5.8 3.28 0.22 3.50 1.63 2.30 1.63 41.5 60.3
78
From Table 3.15 the partial N mass balance shows that net mineralized N from unstable
Olifantsfontein sludge amended soil varied in the range of 3.51 – 10.5 mmol kg-1 with
temperature increase. At higher temperature (45 ºC) and water potential of -10 kPa the total net
mineralized N increased in the order of 46.5 % of total N. At 25 ºC after a 56- day incubation the
potentially available N was 35.9 % of the total N, which is equivalent to 17.9 % of mineralizable
organic N. Meaning that, Olifantsfontein sludge may supply in average 80.4 mg kg-1 of N at 25
ºC and 104.1 mg kg-1 of N at 45 ºC.
At 25 ºC, mineralization seemed to be less compared to all other treatment suggesting
unfavourable condition at first glance. However, this was not the case the low levels of NH4+
indicate that conditions were optimal for the oxidation of it to higher oxidation status of N (N +3
and N+5). What happened is that the NH4+ formed was therefore very effectively nitrified as
indicated by the relatively high amount of NO3- compared to other treatments.

79
Table 3.15 Partial N mass balance for the 56- day laboratory incubation with Olifantsfontein sludge
Treatments [mmol kg-1
] %
Tot N
T0
NH4+ NO3
- Net N
released
Net N
mineralized
Org N Org N
mineralized
Mineralizable
org N
Potentially
available N
(T0) 16.0 2.75 0.76 3.51 - 12.5 - 21.9
T1W1 16.0 6.02 0.24 6.26 2.75 9.74 2.75 22.0 39.1
T1W2 16.0 5.44 0.25 5.69 2.18 10.3 2.18 17.5 35.6
T1W3 16.0 5.79 0.10 5.89 2.38 10.1 2.38 19.1 36.8
T2W1 16.0 4.52 1.23 5.75 2.24 10.3 2.24 17.9 35.9
T2W2 16.0 5.39 0.44 5.83 2.32 10.2 2.32 18.6 36.4
T2W3 16.0 6.55 0.78 7.33 3.82 8.67 3.82 30.6 45.8
T3W1 16.0 7.25 0.19 7.44 3.93 8.56 3.93 31.5 46.5
T3W2 16.0 9.03 0.16 9.19 5.68 6.81 5.68 45.5 57.4
T3W3 16.0 10.4 0.12 10.5 7.01 5.48 7.01 56.1 65.8
80
Table 3.16 shows that net mineralized N from Sasol sludge amended soil ranged from 3.11 – 9.75
mmol kg-1 showing a maximum at 25 ºC. This maximum net N released was not a result of
organic N mineralization only, was also from nitrification of the initially existing NH4+ and the
NH4+ coming from mineralization. Whereas, for 10 ºC and 45 ºC treatments net N mineralized
was a result of N mineralization, as nitrification was insignificant.
The potentially available N at optimal mineralization condition was 41.1 % of the total N which
is equivalent to 32.2 % of the total sludge organic N. The trend observed with potentially
available N in average was 28.8 % at 10 ºC, 41.1 % at 25 ºC and 27.0 % at 45 ºC. Meaning that,
the Sasol sludge amended soil sample may supply 85.4 mg kg-1 of N at 10 ºC, 136 mg kg-1 of N
at 25 ºC and 89.6 mg kg-1 of N at 45 ºC.
N mineralization seemed to be minimum at 25 ºC and higher at 45 ºC, however, the total N
released, as well as the potential available N were higher at 25 ºC. Because at 25 ºC nitrifying
bacteria encountered optimal conditions for their activity, therefore the NH4+ was converted to
NO3- quickly.
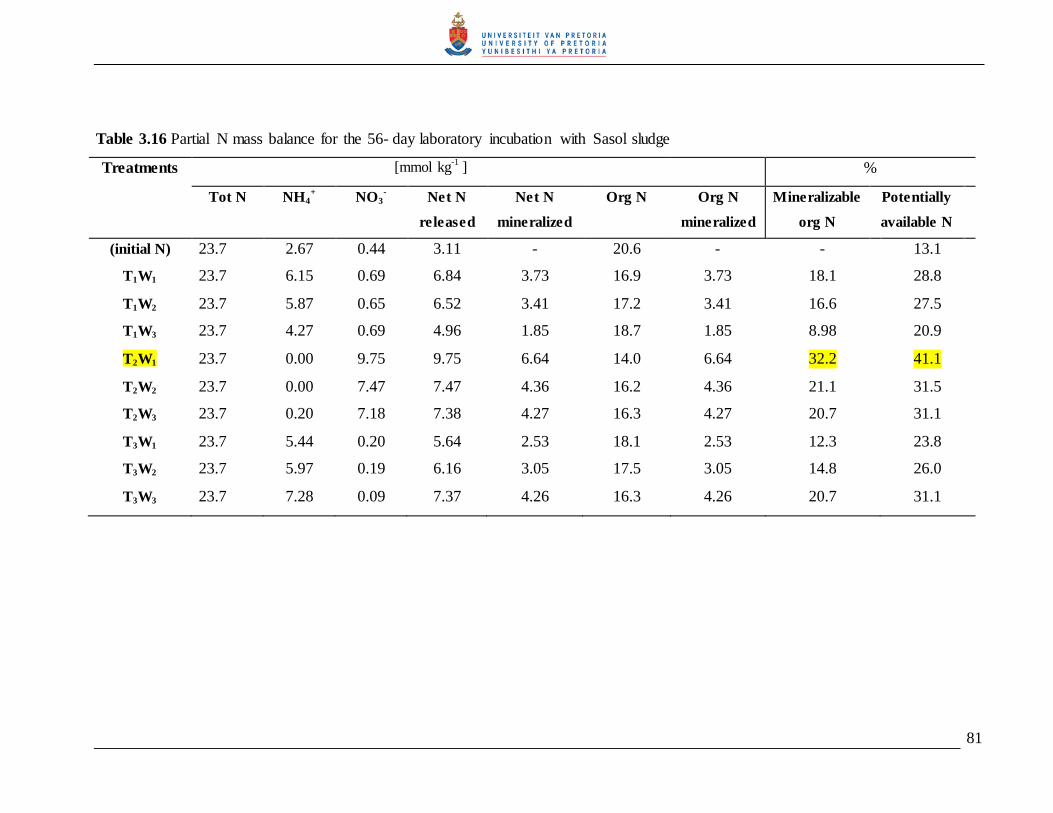
81
Table 3.16 Partial N mass balance for the 56- day laboratory incubation with Sasol sludge
Treatments [mmol kg-1
] %
Tot N NH4+ NO3
- Net N
released
Net N
mineralized
Org N Org N
mineralized
Mineralizable
org N
Potentially
available N
(initial N) 23.7 2.67 0.44 3.11 - 20.6 - - 13.1
T1W1 23.7 6.15 0.69 6.84 3.73 16.9 3.73 18.1 28.8
T1W2 23.7 5.87 0.65 6.52 3.41 17.2 3.41 16.6 27.5
T1W3 23.7 4.27 0.69 4.96 1.85 18.7 1.85 8.98 20.9
T2W1 23.7 0.00 9.75 9.75 6.64 14.0 6.64 32.2 41.1
T2W2 23.7 0.00 7.47 7.47 4.36 16.2 4.36 21.1 31.5
T2W3 23.7 0.20 7.18 7.38 4.27 16.3 4.27 20.7 31.1
T3W1 23.7 5.44 0.20 5.64 2.53 18.1 2.53 12.3 23.8
T3W2 23.7 5.97 0.19 6.16 3.05 17.5 3.05 14.8 26.0
T3W3 23.7 7.28 0.09 7.37 4.26 16.3 4.26 20.7 31.1
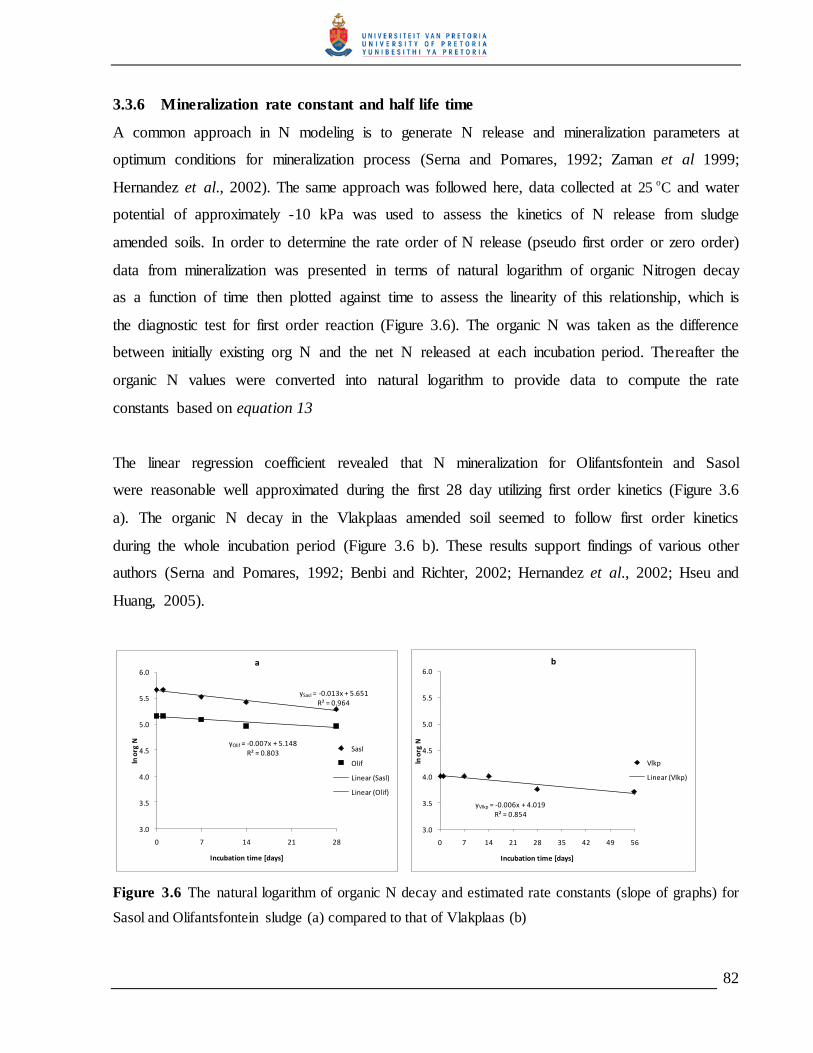
82
3.3.6 Mineralization rate constant and half life time
A common approach in N modeling is to generate N release and mineralization parameters at
optimum conditions for mineralization process (Serna and Pomares, 1992; Zaman et al 1999;
Hernandez et al., 2002). The same approach was followed here, data collected at 25 o
C and water
potential of approximately -10 kPa was used to assess the kinetics of N release from sludge
amended soils. In order to determine the rate order of N release (pseudo first order or zero order)
data from mineralization was presented in terms of natural logarithm of organic Nitrogen decay
as a function of time then plotted against time to assess the linearity of this relationship, which is
the diagnostic test for first order reaction (Figure 3.6). The organic N was taken as the difference
between initially existing org N and the net N released at each incubation period. Thereafter the
organic N values were converted into natural logarithm to provide data to compute the rate
constants based on equation 13
The linear regression coefficient revealed that N mineralization for Olifantsfontein and Sasol
were reasonable well approximated during the first 28 day utilizing first order kinetics (Figure 3.6
a). The organic N decay in the Vlakplaas amended soil seemed to follow first order kinetics
during the whole incubation period (Figure 3.6 b). These results support findings of various other
authors (Serna and Pomares, 1992; Benbi and Richter, 2002; Hernandez et al., 2002; Hseu and
Huang, 2005).
ySasl = -0.013x + 5.651R² = 0.964
yOlif = -0.007x + 5.148R² = 0.803
3.0
3.5
4.0
4.5
5.0
5.5
6.0
0 7 14 21 28
ln o
rg N
Incubation time [days]
a
Sasl
Olif
Linear (Sasl)
Linear (Olif)
yVlkp = -0.006x + 4.019R² = 0.854
3.0
3.5
4.0
4.5
5.0
5.5
6.0
0 7 14 21 28 35 42 49 56
ln o
rg N
Incubation time [days]
b
Vlkp
Linear (Vlkp)
Figure 3.6 The natural logarithm of organic N decay and estimated rate constants (slope of graphs) for
Sasol and Olifantsfontein sludge (a) compared to that of Vlakplaas (b)
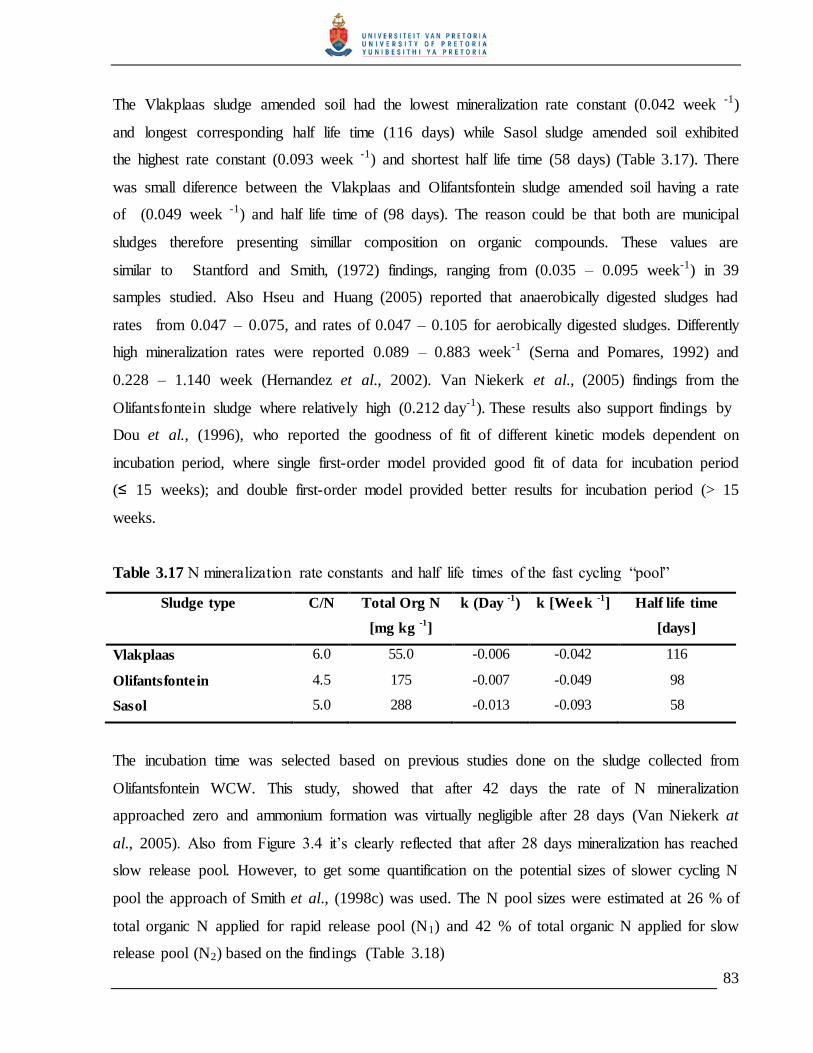
83
The Vlakplaas sludge amended soil had the lowest mineralization rate constant (0.042 week -1)
and longest corresponding half life time (116 days) while Sasol sludge amended soil exhibited
the highest rate constant (0.093 week -1) and shortest half life time (58 days) (Table 3.17). There
was small diference between the Vlakplaas and Olifantsfontein sludge amended soil having a rate
of (0.049 week -1) and half life time of (98 days). The reason could be that both are municipal
sludges therefore presenting simillar composition on organic compounds. These values are
similar to Stantford and Smith, (1972) findings, ranging from (0.035 – 0.095 week-1) in 39
samples studied. Also Hseu and Huang (2005) reported that anaerobically digested sludges had
rates from 0.047 – 0.075, and rates of 0.047 – 0.105 for aerobically digested sludges. Differently
high mineralization rates were reported 0.089 – 0.883 week-1 (Serna and Pomares, 1992) and
0.228 – 1.140 week (Hernandez et al., 2002). Van Niekerk et al., (2005) findings from the
Olifantsfontein sludge where relatively high (0.212 day-1). These results also support findings by
Dou et al., (1996), who reported the goodness of fit of different kinetic models dependent on
incubation period, where single first-order model provided good fit of data for incubation period
(≤ 15 weeks); and double first-order model provided better results for incubation period (> 15
weeks.
Table 3.17 N mineralization rate constants and half life times of the fast cycling “pool”
Sludge type C/N Total Org N
[mg kg -1
]
k (Day -1
) k [Week -1
] Half life time
[days]
Vlakplaas 6.0 55.0 -0.006 -0.042 116
Olifantsfontein 4.5 175 -0.007 -0.049 98
Sasol 5.0 288 -0.013 -0.093 58
The incubation time was selected based on previous studies done on the sludge collected from
Olifantsfontein WCW. This study, showed that after 42 days the rate of N mineralization
approached zero and ammonium formation was virtually negligible after 28 days (Van Niekerk at
al., 2005). Also from Figure 3.4 it‟s clearly reflected that after 28 days mineralization has reached
slow release pool. However, to get some quantification on the potential sizes of slower cycling N
pool the approach of Smith et al., (1998c) was used. The N pool sizes were estimated at 26 % of
total organic N applied for rapid release pool (N1) and 42 % of total organic N applied for slow
release pool (N2) based on the findings (Table 3.18)

84
Table 3.18 Estimated sizes of N pools of different types of sludge investigated
Sludge source Tot Org N
(mmol kg -1
)
(mg kg -1
)
Tot Org N Rapid release
pool
Slow release
pool
Resistant
pool
Vlakplaas 3.93 55.0 14.3 23.1 17.6
Olifantsfontein 12.5 175 45.5 73.5 56.0
Sasol 20.6 288 74.9 121 92.3
It is reasonable to expect that a double first order kinetic model by Molina et al., (1980) would
better estimate the rate constant to account for the existence of different organic N pools, the
rapidly (N1) and slowly (N2) N pools (Dou et al., 1996; Hseu and Huang, 2005; Smith et al.,
1998c; Benbi and Richter, 2002). However, it was not possible from this study to obtain rate
constants of slower cycling pools.
Checking the Van‟t Hoff equation: testing the temperature coefficient (Q10) and mineralization
rate considering 25oC as optimal incubation temperature
TtkeN ;
keQ 10
10
Table 3.19 Mineralization rate and temperature coefficient
Sludge source k Q15=e 15k N=ek(10-25) Q10=e10k Q20=e20k N=ek(45-25)
Vlakplaas -0.006 0.91 1.09 0.94 0.89 0.89
Olifantsfontein -0.007 0.90 1.11 0.93 0.87 0.87
Sasol -0.013 0.82 1.22 0.88 0.77 0.77
N mineralization rate decreases with increase in temperature and increase with decrease in
temperature relative to the optimal temperature, and the temperature coefficient increases with
negative shifting of temperature. These results are not in agreement with Vant‟Hoff‟s
assumptions that mineralization rate is twofold when temperature shifts 10 oC in a temperature
range between 5 to 35 oC.
85
3.4 General discussion
Sewage sludge land application has been recognized as a viable alternative for disposal, because
with this strategy two problems can be solved at once: Soil productivity (soils are restored, soil
fertility enhanced) and environment (potential environmental pollution minimized).
The South Africa‟s guideline establishes an upper application limit of 10 ton per hectare per year
regardless of the type of sludge produced under different process of treatment. What are the
implications of the single application dose?
From the obtained net N release results, sludge stability (physical aspect depending on the
treatment process) and initial N content shows significant differences in N loads. This difference
will continuously be there as a result of different sources of sewage effluent and different
treatment processes.
For instance, with the upper limit of 10 t ha-1 year-1 results from the three tested sludges, total N
loaded based on total N content was 193 kg for Vlakplaas sewage sludge, 533 kg and 791 kg for
unstable Olifantsfontein and Sasol sludges respectively. From which the potential available N
was 96.5, 192, and 324 kg for the same order. Therefore, it‟s important for decision makers to
consider these aspects (stability and total N content) for establishing an effective sludge land
application rate. Future refinements of sludge utilization guidelines in South Africa should
include upper limits for nitrogen application based on potential available N rather than general
sludge loading rates.
The potential for environment nitrate pollution is high for unstable sludges because of their high
levels of N content. Therefore, regulations on disposal management strategy need to be reviewed
and re-established. Although disposal of sludge as land application seems to be safer; monitoring
is important to prevent accumulation of organic pollutants on receiving plots. Site specific
modelling N dynamics is an important tool for strategic sludge land application management.

86
Although, sewage sludge could help in improving soil productivity, its utilization is still limited
to urban and peri-urban areas, where functional sewage system and facilities for waste water
treatment are located. Therefore, many African countries are still far from exploiting the
advantages brought up by sewage sludge land application. For example, in Mozambique, like
many other countries, waste-water streams are still dumping to the sea. Remote rural areas have
no sanitary facilities. Therefore even if a project for establishing a wastewater treatment company
could appear in the big cities to divert the waste streams from dumping into the sea, produced
sewage sludge will not help much for subsistence farmers, practicing their agriculture in rural
areas because transport of high loads of sewage sludge can be costly and not economically viable.
In remote areas a problem of low fertility with consequent decrease in crop yields faced by rural
farmers persists, therefore, other alternatives to counteract soil fertility decline must be found,
such as the use of green manure as cover crop or mulching and animal manure. Results from this
study are of concern to South Africa‟s environment, however, for Mozambique, lacking the high
investments for establishment of municipal wastewater treatment plants; this work serves as a
tool to investigate the dynamic of nutrients from other organic sources in order to recover and
enhance soil productivity.

87
3.5 Conclusions and recommendations
3.5.1 Conclusions
Results from this study, emphasized the importance of sewage sludge as viable soil amendment
as a source of nitrogen, given the fact that, it contains high organic matter with ability to release
inorganic N nutrient (ammonium and nitrate essential for plant growth).
Temperature and soil water interaction as well as sludge stability, had a significant influence on
N release, thus on N availability from sludge amended soils. Greater mineralization was observed
at 45 oC and increased with water potential decrease; nonetheless, greater nitrification was
observed at 25 oC and decreased with water potential decrease. During the incubation period
nitrification was suppressed in the Olifantsfontein amended soil. And the N released at 45 oC was
mainly in the NH4+ form. Although, at 25 oC and -10kPa the potential for N release was high for
Vlakplaas, the amount of N released was less relative do Olifantsfontein, as a result of initial
sludge N content.
Based on the potential N availability Vlakplaas would supply about 96.5 kg inorganic N that
represents 27.5% of organic N, Olifantsfontein 192 kg and Sasol 323 kg that represent
respectively 34.8, and 38 % of organic N mineralized. Results from this study are in agreement
with van Niekerk‟s (2005) findings, who found that organic N mineralizable from Olifantsfontein
was 33.6%. Also according the guidelines for the permissible utilization and disposal of sludge in
South Africa the about 30% of organic N is mineralized during the first year. Hernandez et al.,
2002 also found that sewage sludge organic N mineralized ranges from 30 to 41%.
There was a clear difference between the mineralisation rate of industrial and municipal sludge.
The Vlakplaas sludge amended soil had the lowest mineralization rate constant (0.042 week -1)
and the longest corresponding half life time (116 days) while Sasol sludge amended soil
exhibited the highest rate constant (0.093 week -1) and shortest half life time (58 days). Based on
the half life times it is concluded that the persistence of stable sludges is longer than unstable
Olifantsfontein making it potentially a more efficient source in releasing plant nutrients
gradually. Unstable Sasol sludge easily release its N increasing the potential for contamination of
the ash dumping sites.

88
3.5.2 Recommendations
Mineralization and nitrification rates, rate constants of N mineralization and half-life time of
sludge decay are useful parameters for modeling. Therefore to improve the N use efficiency from
applied sewage sludge and minimize adverse impacts on the environment, it is recommended to
establish specific application rates based on the kinetics of N release form sludge.
Determination of inorganic N released based on KCl extractable ammonium (NH4+) and nitrate
(NO3-) may not reflect the release of inorganic only, because KCl does not necessarily discretely
extract inorganic N. It is quite possible that organic N present in the sludge, that is soluble in a
polar solvent, will also be extracted along with the inorganic N. Therefore determination of
organic N after each incubation time is recommended to refine mineralisation estimates and also
to predict the dynamics of organic N.
Based on the potential N availability, rate constant and half life Vlakplaas sludge is more
effective as it releases N for land application supplying at all temperature range tested amounts
of net N release not exceeding the N requirement of the most common crops and at slower
release rate. The Olifantsfontein sludge has also a lower release rate; however, may easily
exposes the environment to potential nitrate pollution as a result of high levels of total N. It is
recommended that sewage sludge be incorporated in soils at least one month before planting to
assure for available inorganic N at the stage of crop development.
3.6 Limitations
Losses of N were not captured so the N mass balance given in this study was partial; organic N
used for rate constant was an approximation of shorter term N release and longer term predictions
only gives an indication of longer term trends.
The half lifetimes may not reflect the reality because the pool sizes were estimated, it is
suggested that in the next experiments be determined.
89
3.7 Reference
AGEHARA, S. AND WARNCKE, D.D., 2005. Soil moisture and temperature effect on N
release from organic N sources. Soil Science Society of American Journal 69, 1844 –1855
ASHOK, A.K., PARAMASIVAM, S. AND SAJWAN, K.S. 2006. Nitrogen transformation from
three organic amendments in a sandy soil. Communications in Soil Science and Plant
Analysis 52, 1 – 11
ATKINS, P.W., 1999. Physical chemistry. The rates of chemical reactions. 6th Ed. Oxford
University Press, 761 -818
BRADY, N.C. AND WEIL, R.R., 2002. The nature and properties of soils. 13th Ed. Pearson
Education Prentice Hall 935 pp
BREMNER, J.M., 1965. Methods of N determination. In THE NON-AFFILIATED SOIL
ANALYSIS WORK COMMITTEE, 1990. Handbook of standard soil testing methods for
advisory purpose. Soil Science Society of South Africa, Pretoria, South Africa
BROADBENT, F.E., TYLER, K.B. AND HILL, G.N., 1957. Nitrification of ammoniacal
fertilizers in some California soils. In Smith et al., 1998. Nitrate dynamics in biosolids-
treated soils I – Influence of biosolids type and soil type. Bioresource Technology 44,
139 – 149
CABRERA, M.L., KISSEL, D.E. AND VIGIL, M.F., 2005. Nitrogen mineralization from
organic residues: Research opportunities. Journal Environment Quality 34, 75 -79
DANE, J.H. AND HOPMANS, J.W., 1999. Water retention and storage – Pressure Plate
Extractor. In Dane and Topp (ed) Methods of Soil Analysis. Part 4 – Physical Methods.
Soil Science Society of America, Inc Book series 5, 688 – 690
DE NEVE, S. AND HOFMAN, G., 1996. Modeling N mineralization of vegetable crop residues
during laboratory incubations. Soil Biology and Biochemistry 28 (10, 11), 1451 – 1457
90
DE NEVE, S., SAEZ, S.G., DAUGULAR, B.C., SLEUTEL, S. AND HOFMAN, G., 2004.
Manipulating N mineralization from high N crop residues using on- and off- farm organic
materials. Soil Biology and Biochemistry 36, 127 – 134
DIJKSTRA, F.A., WEST, J.B., HOBBIE, S.E., REICH, P.B. AND TROST, J., 2007. Plant
diversity, CO2, and N influence inorganic and organic N leaching in grasslands.
Ecological Society of America. Ecology, 88, 490 – 500
DORAN, J.W. AND SMITH, M.S., 1987. Organic matter management and utilization of soil
and fertilizer nutrients. Soil Science Society of America, Special publication 19, 53 – 72
ER, F., OGUT, M., MIKAYILOV, F.D. AND MERMUT, A.R., 2004. Important factors
affecting biosolid nitrogen mineralization in soils. Communications in Soil Science and
Plant Analysis 35, 2327 – 2343
GEE, G.W. AND BAUDER, J.W., 1986. Particle size analysis. In Dane and Topp
(Ed) Methods of Soil Analysis. Part 4 – Physical Methods. Soil Science Society of
America, Inc Book series 5, 255 – 289
GROSSMAN, R.B. AND REINSCH. Bulk density and linear extensibility. In Dane and Topp,
2002. Methods of soil analysis. Part 4 – Physical methods. Soil Science Society of
America , Inc. Book series 5, 201 – 228
HAVLIN, J.L., BEATON, J.D., TISDALE, S.L. AND NELSON, W.L., 2005. Soil fertility and
fertilizers: An introduction to nutrient management. 7th Ed. Pearson Education, Inc.
Prentice Hall, 502 pp
HERNANDEZ, T., MORAL, R., PEREZ-ESPINOSA, A., MORENO-CASELLES, J., PEREZ-
MURCIA, M.D. AND GARCIA, C., 2002. Nitrogen mineralization potential in
calcareous soils amended with sewage sludge. Bioresource technology 83, 213 – 219
HORTWATH, W.R. AND PAUL, E.A., 1994. Microbial biomass. In Weaver et al., 1994.
Methods of soil analysis Part 2: Microbiological and biochemical properties. Soil Science
Society of America, Inc. Book series 5, 754 – 771
91
LEIROS, M.C, CEPEDA, C.T., SEOANE, S. AND GIL-SOTRES, F., 1999. Dependence of
mineralization of soil organic matter on temperature and moisture. Soil Biology and
Biochemistry 31, 327 – 335
LOPEZ-TORCEDO, A.M., ANDRADE, M.I. AND MARCEL, P., 2005. Organic N
mineralization rate in sewage sludge amended mine soil. Communications in Soil Science
and Plant Analysis 36, 1005 – 1019
MALVENEY, R.L., 1996. Nitrogen inorganic forms. In THE NON-AFFILIATED SOIL
ANALYSIS WORK COMMITTEE, 1990. Handbook of standard soil testing methods for
advisory purpose. Soil Science Society of South Africa, Pretoria, South Africa
MCINTOSH, T.H. AND FREDERIC, L.R., 1958. Distribution and nitrification of anhydrous
ammonia in a Nicollet sand clay loam. In Smith et al., 1998. Nitrate dynamics in
biosolids- treated soils I – Influence of biosolids type and soil type. Bioresource
Technology 44, 139 – 149
MOLINA, J.A. E.; CLAPP, C.E. AND LARSON, W.E., 1980. Potentially mineralizable nitrogen
in soils: The single exponential model does not apply for the first 12 weeks of incubation.
Soil Science Society of American Journal 44, 442 – 453
NAVAS, A., BERMUDEZ, F. AND MAVHIN, J., 1997. Influence of sewage sludge application
on physical and chemical properties of gypsisols. Geoderma 87, 123 – 135
PAUL, E.A. AND CLARK, F.E., 1988. Soil microbiology and biochemistry. Academic press,
Inc. Harcourt Brace Jovanovich, Publishers, 265 pp
PROBERT, M.E., DELVE, R.J., KIMANE, S.K. AND DIMES, J.P., 2005. Modeling N
mineralization from manure: representing quality aspects by varying C: N ratio of sub-
pools. Soil Biology and Biochemistry 37, 279 – 287
QUEMADA, M., AND CABRERA, M.L., 1997. Temperature and moisture effect on C and N
mineralization from surface applied clover residues. Plant and Soil 189, 127 – 137

92
RUSSEL, E.W., 1988. Soil conditions and plant growth. 11th Ed. Longman Group UK 951 pp
SERNA, M.D. AND POMARES, F., 1992. Nitrogen mineralization of sewage sludge amended
soil. Bioresource Technology 39, 285 – 290
SIERRA, J., FONTAINE, S. AND DESFONTAINES, L., 2001. Factors controlling N
mineralization, nitrification and nitrogen losses in an Oxisol amended with sewage
sludge. Australian Journal of Soil Research 39, 519 – 534
SILVEIRA, M.L.A., 2005. Dissolved organic carbon and bioavailability of N and P as indicators
of soil quality. Sci. Agric. (Piracicaba, Braz.) 62, 502 – 508
SMITH, S.R., WOODS, V. AND EVANS, T. D., 1998 a. Nitrate dynamics in biosolids-
treated soils I – Influence of biosolids type and soil type. Bioresource Technology 44,
139 – 149
SMITH, S.R., WOODS, V. AND EVANS, T. D., 1998 b. Nitrate dynamics in biosolids – treated
soils. II Thermal time models of the different N pools. Bioresource Technology 66, 151 –
160
SMITH, S.R., WOODS, V. AND EVANS, T. D., 1998 c. Nitrate dynamics in biosolids – treated
soils. III – Significance of the organic nitrogen. A twin-pool exponential model for
nitrogen management and comparison with the nitrate production from animal wastes.
Bioresource Technology 66, 161 – 174
SNYMAN, H.G. AND HERSELMAN, J.E., 2006. Guidelines for the utilization and disposal
of wastewater sludge. Vol. 2: Requirements for the agricultural use of wastewater
sludge. Water Research Commission - Report no. TT262/06, 34 pp
SNYMAN, H.G. AND VAN DER WAALS, J., 2004. Laboratory and field scale evaluation of
agricultural use of sewage sludge. Water Research Commission - Report no. 1210/1104,
286 pp
STANFORD, G. AND SMITH, S.J., 1972. Nitrogen mineralization potentials of soils. Soil
Science Society of America, Proceedings, 36, 465 – 472

93
TAN, K.H., 2000. Environmental Soil Science. 2nd Ed; revised and expanded. Marcel Dekker,
Inc. 452 pp
TEJEDA, M., BENITEZ, C. AND GONZALEZ, J.L., 2002. N mineralization in soil with
conventional and organomineral fertilization practices. Communications in Soil Science
and Plant Analysis 33, 3679 – 3702
TERRY, R.E., NELSON, D.W. AND SOMMERS, L.E., 1981. Nitrogen transformations in
sewage sludge – amended soils as affected by soil environmental factors. Soil Science
Society of American Journal 45, 506 – 513
THE NON-AFFILIATED SOIL ANALYSIS WORK COMMITTEE, 1990. Handbook of
standard soil testing methods for advisory purpose. Soil Science Society of South Africa,
Pretoria, South Africa
THOMSEN, K.I., SCHJONNING, P., JENSEN, B., KRISTENSEN, K. AND CHRISTENSEN,
B.T., 1999. Turnover of organic matter in differently textured soils. II. Microbial activity
as influenced by soil water regimes. Geoderma 89, 199 – 218
THOMSEN, K.I., SCHJONNING, P., OLESEN, J.E. AND CHRISTENSEN, B.T., 2003.
Carbon and nitrogen turnover in structurally intact soils of different texture. Soil Biology
and Biochemistry 35, 765 – 774
TOPP, G. C. AND FERRÉ, P.A. (TY), 2002. Methods for measurement of soil water content. In
Dane and Clarke Topp, 2002. Methods of Soil Analysis. Part 4 – physical Analysis. Soil
Science Society of America, Inc. Book series 5, 422 – 424
VAN NIEKERK, C., CLAASSENS, A. AND SNYMAN, H., 2005. N transformations in
incubated sewage sludge and commercial fertilizer enriched soil. Communications in Soil
Science and Plant Analysis 36, 743 – 757
VERHAGEN, F.J.M., DUYTS, H. AND LAANBROEK, H.J., 1992. Competition for ammonium
between nitrifying and heterotrophic bacteria in continuous percolated soil columns.
Applied and Environmental Microbiology 58, 3303 – 3311
94
WANG, H., KIMBERLEY, M.O. AND SCHLEGELMILCH, M., 2003. Biosolids-derived
nitrogen mineralization and transformation in forest soils. Journal of Environmental
Quality 32, 1851 – 1856
WOLF, B. AND SNYDER, G.H., 2003. Sustainable soils: The place of organic matter in
sustaining soils and their productivity. Food products press NY 345 pp
ZAMAN, M. AND CHANG, S.X., 2004. Substrate type, temperature, and moisture content affect
gross and net mineralization and nitrification rates in agroforestry systems. Biology
Fertility Soils 39, 269 – 279
ZAMAN, M., DI, H.J., CAMERON, K.C. AND FRAMPTON, C.M., 1999. Gross nitrogen
mineralization and nitrification rates and their relationships to enzyme activities and the
soil microbial biomass in soils treated with dairy shed effluent and ammonium fertilizer at
different water potentials. Biology Fertility Soils 29,178 – 186
95
CHAPTER IV: SAMPLE HANDLING STRATEGY
Handling of sewage sludge amended soil samples for nitrate and ammonium analysis
ABSTRACT
Field validation of mineralization and nitrification rates is essential for accurate prediction and
modeling of environmental fate of nitrogen entering the soil system through sewage sludge
application. Mineralization and nitrification are ongoing processes, therefore sampling and
handling will determine how representative and accurate the determined nitrate and ammonium
speciation is to that in the soil at the point in time of sampling. To establish an acceptable sample
handling procedure for nitrate and ammonium determinations in sewage sludge amended soils
three sample handling strategies (Direct Field Extraction-DFE, Field Drying and Extraction-FDE
and Laboratory Drying and Extraction-LDE) were tested. The amounts of nitrate and ammonium
speciation determined through DFE- procedure was expected to be the best procedure for
equivalent amounts present in soil at the point in time of sampling. Samples were collected from
sewage sludge amended fields that received recently (2 seasons) and long period (> 4 seasons)
sewage sludge applications. Samples were replicated four times. A known soil volume that
passed through a 2 mm sieve was directly transferred to containers with 100 cm3 of 2M KCl
solution just after sampling (DFE). Other sub samples were left to air-dry and immediately
transferred to containers containing extract solution in the field (FDE). These soil suspensions
were transported immediately to the laboratory, extracted and analysed for nitrate and ammonium
using the Kjeldahl method. Other sub samples were taken to the Soil Science Laboratory of
Pretoria University, air dried for 24 hours sieved through a 2 mm sieve, extracted with a100 cm3
2 M KCl solution (LDE) and analysed for nitrate and ammonium. Sample handling procedure
significantly influenced the content of NO3- and NH4
+ speciation. The average NH4+ content for
DFE was 56.4 mg kg-1 (dry land) and 59.5 mg kg-1 for LDE. The average NO3- content for DFE
was 394 mg kg-1 (dry land) and 569 mg kg-1 for LDE. Analytical results showed that laboratory
drying resulted in an overestimation of soil nitrate content and no significant difference for NH4+
content. Artifacts introduced by long drying period resulted in an increase of mineralization as
well as nitrification in sewage sludge amended samples. Therefore DFE procedure revealed to be
the suitable sampling strategy for sewage sludge amended soils.
Keywords: Soil sampling strategy, sewage sludge, nitrate, mineralization, and nitrification.
96
4.1 Introduction and background
The truthfulness of a laboratory soil test results is not only influenced by the methods of analysis
and technician‟s ability but is also influenced by the quality of the soil sample, by means of
representative sample collection (Franzen and Cihacek, 2004; Ferro S., 2004). Inadequate
sampling and sample handling procedure may result on misleading interpretation of laboratory
results. Therefore sampling should be considered seriously as well as soil sample handling to
provide representative, consistent and reliable laboratory results.
The dynamic of soil processes cause continuous changes in the forms, quantities and availability
of plant nutrients over time. On the other hand the inorganic N forms in particular nitrate (NO3-)
which is easily mobile in soil solution, cause modifications in soil nitrate and ammonium
concentrations throughout the time. This mobility brings in difficulties for modeling N fate in
soils especially on soils amended with sewage sludge or other organic source.
To reduce this drawback it is essential to know and understand phenomenon‟s that might cause
soil nutrients value to change between sampling and laboratory testing, as well as, planting time
to avoid misinterpretations of laboratory results (Self and Soltanpour, 1997).
Besides environmental conditions, transformations of nitrogen forms in the soil-plant-
environment systems are time dependent. The soil micro-organisms composition exerts a big
influence on the balance of NH4+ and NO3
- quantities in soil (Verhagen et al., 1992). Nitrifiers
are found to be less competitive than heterotrophic bacteria for ammonium. Therefore, the
amount of NH4+ and NO3
- determined depends on how samples were handled after collection up
until the stage of laboratory analysis.
The ability to extrapolate soil laboratory results to the field conditions depends not only on the
fertility expert experience but on how representative the soil sample is to that of real field
condition (Ferro S., 2004; Franzen and Cihacek, 2004). For that reason sampling and sample
97
handling for a sewage sludge amended soil, where organic compounds are in continuous
mineralization, needs special attention to keep the representativeness of nutrient contents.
Selection of sample handling procedure must be based on the type of species to analyse and the
purpose of the results (Self and Soltanpour, 1997). According to Tack and Verloo (2001) sample
handling guideline is strongly dependent on the ultimate goal of a particular sampling.
According Self and Soltanpour (1997) for nitrate analyses soil samples should be air dried within
12 hours after sampling, to prevent microbial activity from mineralizing organic materials and
causing changes on the ultimate soil ammonium and nitrate contents.
Lack of standard handling procedure for sewage sludge amended soils may lead to wrong
interpretations in terms of N status. A standardized procedure for sample handling is necessary to
ensure representativeness and reliability of laboratory test results (Theocharopoulos et al., 2001).
Standardization of sample handling procedure becomes an urgent need to facilitate interpretation
and comparability of data among different laboratories. Therefore adequate sample handling of
sewage sludge amended soils are crucial for effective recommendations on the management of
sewage sludge land application.
Since the N transformations among organic and inorganic forms are governed by biological soil
environment, there is a need to suppress the microbial activity from the sampling stage to the
instant of laboratory analysis in order to keep the real amount of NH4+ and NO3
- present in soil at
the point in time of sampling (Wollum, 1994).
According the equation NH4+ + OH- = H2O + NH3, ammonium in soil solution is highly
dependent on the pH of the soil. Ammonium may volatilize liberating ammonia as soil dries out
driving the reaction equilibrium to the right stimulating NH4+ decrease. Ammonium and nitrate
content in soil are also time dependent, when the soil environment is adequate for the activity of
Nitrosomonas and Nitrobacter may lead to a decrease of NH4+ and increase of NO3
- (Brady and
Weil, 2002).
98
A trial was conducted to compare the field extractions with conventional sampling and handling
procedures and showed considerable differences in ammonium and nitrate results.
4.1.1 Objectives
The aim of this study was to establish an appropriate sample handling procedure for
determination of nitrate (NO3-) and ammonium (NH4
+) speciation in sewage sludge amended
soils.
To fulfill this objective three sample handling strategies were tested, there are as follows:
i. Direct Field Extraction- DFE
ii. Field Drying and Extraction - FDE
iii. Laboratory Drying and Extraction - LDE
99
4.2 Material and methods
4.2.1 Material
A. Amended soil samples
Samples were collected from an existing crop trial at Harbeesfontein, a waste water
treatment facility of East Rand Water Company near Kempton Park, Gauteng province,
South Africa, with sandy clay loam soils that have received 16 ton per ha of activated
anaerobically digested sewage sludge. Distributed in two seasons, half (8 t ha-1) was
applied in winter season and another half in summer season of the year 2005. Samples
were taken in triplicate.
B. Equipment
Plastic bottles with 200 cm3 capacity, plastic cup with 10 cm3 capacity, aluminum foil tart
plate folder, weighing scale, horizontal shaking, filtration stand, fridge, kjeldhal
distillation apparatus, and titration system.
C. Chemicals
Potassium chloride (KCl) 1 M solution, Sodium hydroxide (NaOH) 12.5M, Devarda‟s
alloy powder, Hydrochloric acid (HCl) 0.01M, ethanol (C2H5OH), Boric acid (H3BO3)
and indicator (methyl blue and methyl red).
4.2.2 Methods
A. Sample handling strategies
Three sample handling strategies were tested in samples collected from the plots that have
received 16 ton of sewage sludge. There are as follow:
Direct Field Extraction (DFE) – samples were collected and immediately extracted in the
field, then taken to the laboratory for analysis.
Field Drying and Extraction (FDE) – samples were collected, air dried immediately,
sieved and extracted in the field, then taken to the laboratory for analysis.
Laboratory Drying Extraction (LDE) – samples were collected, taken to the laboratory air
dried for 24 hours sieved, extracted and then analysed.
100
i) Direct Field Extraction
A known volume of instant collected soil samples that passed through a 2 mm sieve, were
directly transferred to containers with 100 cm3 2 M KCl solution to extract the extractable
and exchangeable ammonium and nitrate and taken to the laboratory within few hours for
subsequent analysis.
ii) Field Drying and Extraction
The collected soil samples were spread out in aluminum foil tart plate left to dry in the
field. Afterwards the samples were sieved through a 2 mm sieve then a known volume of
these air dried soil was directly transferred to containers with 100 cm3 2 M KCl solution
to extract the extractable and exchangeable ammonium and nitrate and taken to the
laboratory for subsequent ammonium and nitrate determinations.
iii) Laboratory Drying and Extraction
Collected samples were taken to the laboratory air dried for 24 hours at room temperature
(~ 22 – 25 oC), sieved to pass a 2 mm sieve, 10 g of soil were extracted in 100 cm3 of 2
M KCl solution and ammonium and nitrate were determined.
NB.1 For field extractions DFE and FDE the used plastic cups for measuring the soil volume
were filled with respective soil samples taken to the laboratory weighed and then oven dried and
weighed again to obtain the mass of soil extracted in dry mass basis, for the final calculations.
NB.2 If there is time constraint after filtration extracts should be kept in the fridge. At the
moment of determination samples are taken out from the fridge left to reach room temperature
and then carry out the analysis.
101
B. Extractable and exchangeable NH4+ and NO3
- determinations
Sample extracts from all handling strategies were kept in the fridge, while waiting to be analysed,
due to time constraint, to stop any possible conversion of N-forms. The temperature in the fridge
was at 1.9 oC, sufficient to prevent any microbial activity. At the moment of determination
samples were taken out from the fridge left until they reached room temperature then NH4+ and
NO3- determined.
Procedure
50 ml of soil extracts was transferred into a distil tube and 20 ml of a 12.5M NaOH solution was
added (sufficient amount to convert all NH4+ present in the soil extract into NH4OH) and distilled
through micro- Kjeldahl steam distil system. The NH3 formed was collected in mixture solution
of H3BO3-indicator with purple colour. Ammonia entering in this solution formed a green
complex with boric acid- indicator and then titrated with HCl 0.01M until the green colour
changes. At the end point of titration volume of hydrochloric acid was recorded. In the remained
extract on the Kjeldahl distil tube approximately 2 mg of devarda‟s alloy powder was added after
cooling to reduce all NO3- and NO2
- into NH4+, which in turn react with the excess of NaOH and
distilled again following the same procedure, and the volume of hydrochloric acid was recorded.
The first step of distillation was for ammonium determination and the second for nitrate.
C. Extractable and exchangeable NH4+ and NO3
- calculation
The concentration of NH4+ and NO3
- in the samples was obtained based on the equi-molar
displacement reaction principle as explained in chapter III– 3.2.6.1 (equation 8).
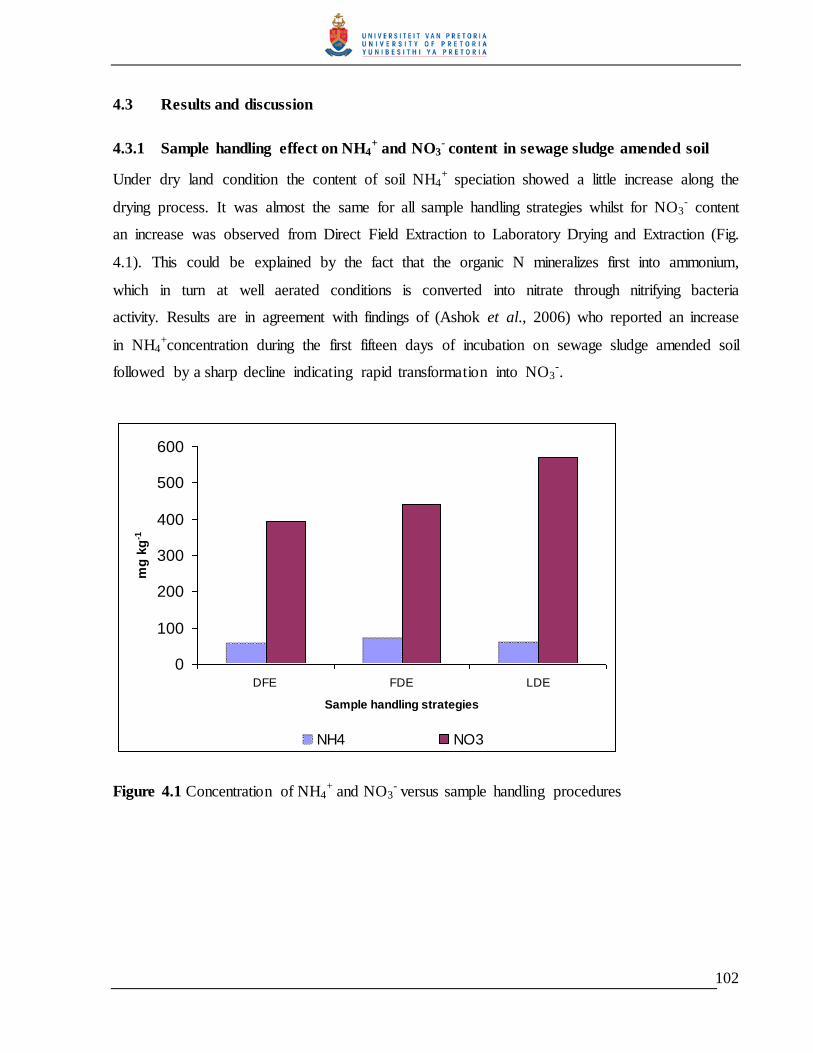
102
4.3 Results and discussion
4.3.1 Sample handling effect on NH4+ and NO3
- content in sewage sludge amended soil
Under dry land condition the content of soil NH4+ speciation showed a little increase along the
drying process. It was almost the same for all sample handling strategies whilst for NO3- content
an increase was observed from Direct Field Extraction to Laboratory Drying and Extraction (Fig.
4.1). This could be explained by the fact that the organic N mineralizes first into ammonium,
which in turn at well aerated conditions is converted into nitrate through nitrifying bacteria
activity. Results are in agreement with findings of (Ashok et al., 2006) who reported an increase
in NH4+concentration during the first fifteen days of incubation on sewage sludge amended soil
followed by a sharp decline indicating rapid transformation into NO3-.
Figure 4.1 Concentration of NH4+ and NO3
- versus sample handling procedures
0
100
200
300
400
500
600
DFE FDE LDE
Sample handling strategies
mg
kg
-1
NH4 NO3

103
4.3.2 Statistical analysis
The general linear model procedure for SAS program and the Tukey‟s test grouping were used.
Based on the ANOVA tables sample handling procedures were significantly different. Difference
between DFE and FDE was highly significant for ammonium, while in relation to nitrate content
these strategies were not statistically different. The effects of DFE and LDE relative to
ammonium content were not significantly different however their effects on nitrate content were
statistically different at 5 % of significance level. Effects of FDE and LDE were significantly
different for both ammonium and nitrate content (Table 4.1).
Table 4.1 Levels of significance for sample handling strategies
Sampling strategy FDE LDE
NH4+
NO3-
NH4+
NO3-
DFE 0.0008 ** 0.3593 ns 0.2191 ns 0.0103*
FDE - - 0.003 ** 0.036 *
ns = Not significant (p > 0.05);* Significant at α=5% (p < 0.05); ** Highly significant α=1% (p < 0.01)
From Table 4.2, ammonium content obtained with DFE was not significantly different from that
of the LDE, The reason is that mineralized NH4+ was being simultaneously converted into NO3
-
and replaced by mineralization of organic N from the system soil/sewage sludge. However the
ammonium content for FDE was significantly higher compared to DFE and LDE. The reason
could be that drying in an open sun increased mineralization as a result of temperature effect. On
the other hand the shortest time from collection-drying and extraction did not give chance for
nitrifying bacteria to perform. The nitrate content for DFE and for FDE samples was significantly
lower from that of the LDE samples as a result of mineralization and nitrification processes
occurring along the period going from sample collection, drying up until the sample extraction in
the laboratory.

104
Table 4.2 Ranking and treatment mean comparison
Treatment NH4+
[mg kg-1
] t grouping Treatment NO3- [mg kg
-1] t grouping
FDE 70.42 a LDE 568.8 a
LDE 59.54 b FDE 441.1 b
DFE 56.43 b DFE 393.9 b
*Treatment means followed with the same letter are not statistically different at = 5% (p < 0.05)

105
4.4 Conclusions and recommendations
4.4.1 Conclusions
The sample handling strategy had greater influence on determined soil nitrate and ammonium
content. Artifacts introduced by drying result in an overestimation of nitrification as well as
mineralization in the sewage sludge amended soils. The evidences were sufficient to conclude
that the Direct Field Extraction strategy was more adequate to figure the soil NH4+ and NO3
-
content at the point in time of sampling.
The results agreed with Franzen and Cihacek (2004) findings who concluded that samples
intended for NO3-N determination should be transported immediately to a soil testing laboratory
in a cold ice chest or air-dried immediately after collection and then taken for immediate
laboratory analysis to prevent alteration of N concentrations through microbial activity.
4.4.2 Recommendations
When developing models to assess nitrate pollution risk and in soil fertility management for an
effective use of sewage sludge nitrogen, the Direct Field Extraction strategy is recommended
Concurrently to application of DFE strategy, samples should be collected closer to planting time
to minimize the gap between the determined soil nitrates NO3- content with the availability of N
at a point in time of sampling.
106
4.5 References
ASHOK, A.K., PARAMASIVAM, S. AND SAJWAN, K.S., 2006. Nitrogen transformation
from three organic amendments in a sandy soil. Communications in Soil Science and
Plant Analysis. 52, 1 – 11
BRADY, N.C. AND WEIL, R.R., 2002. The nature and properties of soils. 13th Ed. Pearson
Education Prentice Hall
SELF, J.R. AND SOLTANPOUR, P.N. 1997. Soil Sampling. Colorado State University
Cooperative Extension 0.500, 1 – 3
TACK, F.M.G. AND VERLOO, M.G., 2001. Guidelines for sampling in Flanders Belgium. The
Science of Total Environment 264, 187 – 191
THEOCHAROPOULOS, S. P., WAGNER, G., SPRENGANT, J., MORH, M-E., DESAULES,
A., MUNTAU, H., CHRISTOU, M. AND QUEVAUVILLER, P., 2001. European soil
sampling guidelines for soil pollution studies. The Science of the Total Environment 264,
51 – 62
VERHAGEN, F.J.M., DUYTS, H. AND LAANBROEK, H.J., 1992. Competition for ammonium
between nitrifying and heterotrophic bacteria in continuous percolated soil columns.
Applied and Environmental Microbiology 58, 3303 – 3311
WEAVER, R. W., ANGLE, S. BOTTOMLEY, P., BEZDICEK, D., SMITH, S., TABATABAI,
A., AND WOLLUM, A., 1994. Methods of Soil Analysis Part 2- Microbiological and
Biochemical Properties. Soil Science Society of America Inc Book Series: 5
WOLLUM, A. G. II, 1994. Soil Sampling for Microbiological Analysis. In Weaver et al., 1994.
Methods of Soil Analysis Part 2- Microbiological and Biochemical Properties. Soil
Science Society of America Inc Book Series: 5, pp 1 – 13

107
5. APPENDICE
A1. Statistical analysis for temperature and water potential effect on net N release

108
A1.1 Stable ‘Vlakplaas’ sewage sludge amended soil 10:45 Monday, March 19, 2007 3
Obs Temp Moist rep V1 1 T1 W1 1 2.681 2 T1 W1 2 2.912 3 T1 W1 3 2.713 4 T1 W2 1 2.075 5 T1 W2 2 2.063 6 T1 W2 3 1.944 7 T1 W3 1 3.224 8 T1 W3 2 3.463 9 T1 W3 3 3.403 10 T2 W1 1 2.700 11 T2 W1 2 3.106 12 T2 W1 3 2.883 13 T2 W2 1 2.477 14 T2 W2 2 2.421 15 T2 W2 3 2.489 16 T2 W3 1 2.211 17 T2 W3 2 2.282 18 T2 W3 3 2.262 19 T3 W1 1 3.213 20 T3 W1 2 3.332 21 T3 W1 3 3.214 22 T3 W2 1 3.069 23 T3 W2 2 3.757 24 T3 W2 3 3.058 25 T3 W3 1 3.528 26 T3 W3 2 3.651 27 T3 W3 3 3.324
Stable sewage sludge ‘Vlakplaas’ 10:45 Monday, March 19, 2007 4
The GLM Procedure Class Level Information Class Levels Values Temp 3 T1 T2 T3 Moist 3 W1 W2 W3 Rep 3 1 2 3 Number of Observations Read 27 Number of Observations Used 27

109
Stable sewage sludge ‘Vlakplaas’ 10:45 Monday, March 19, 2007 5 The GLM Procedure Dependent Variable: V1 Total mineralized N Sum of Source DF Squares Mean Square F Value Pr > F Model 8 6.71439496 0.83929937 27.70 <.0001 Error 18 0.54534667 0.03029704 Corrected Total 26 7.25974163 R-Square Coeff Var Root MSE V1 Mean 0.924881 6.067564 0.174060 2.868704 Source DF Type I SS Mean Square F Value Pr > F Temp 2 3.27215030 1.63607515 54.00 <.0001 Moist 2 1.03258007 0.51629004 17.04 <.0001 Temp*Moist 4 2.40966459 0.60241615 19.88 <.0001 Source DF Type III SS Mean Square F Value Pr > F Temp 2 3.27215030 1.63607515 54.00 <.0001 Moist 2 1.03258007 0.51629004 17.04 <.0001 Temp*Moist 4 2.40966459 0.60241615 19.88 <.0001
Stable sewage sludge ‘Vlakplaas’ 10:45 Monday, March 19, 2007 6
The GLM Procedure Tukey's Studentized Range (HSD) Test for V1 # NOTE: This test controls the Type I experiment wise error rate, but it generally has a higher Type II error rate than REGWQ. Alpha 0.05 Error Degrees of Freedom 18 Error Mean Square 0.030297 Critical Value of Studentized Range 3.60930 Minimum Significant Difference 0.2094 Means with the same letter are not significantly different. Tukey Grouping Mean N Temp A 3.34956 9 T3 B 2.71978 9 T1 B 2.53678 9 T2
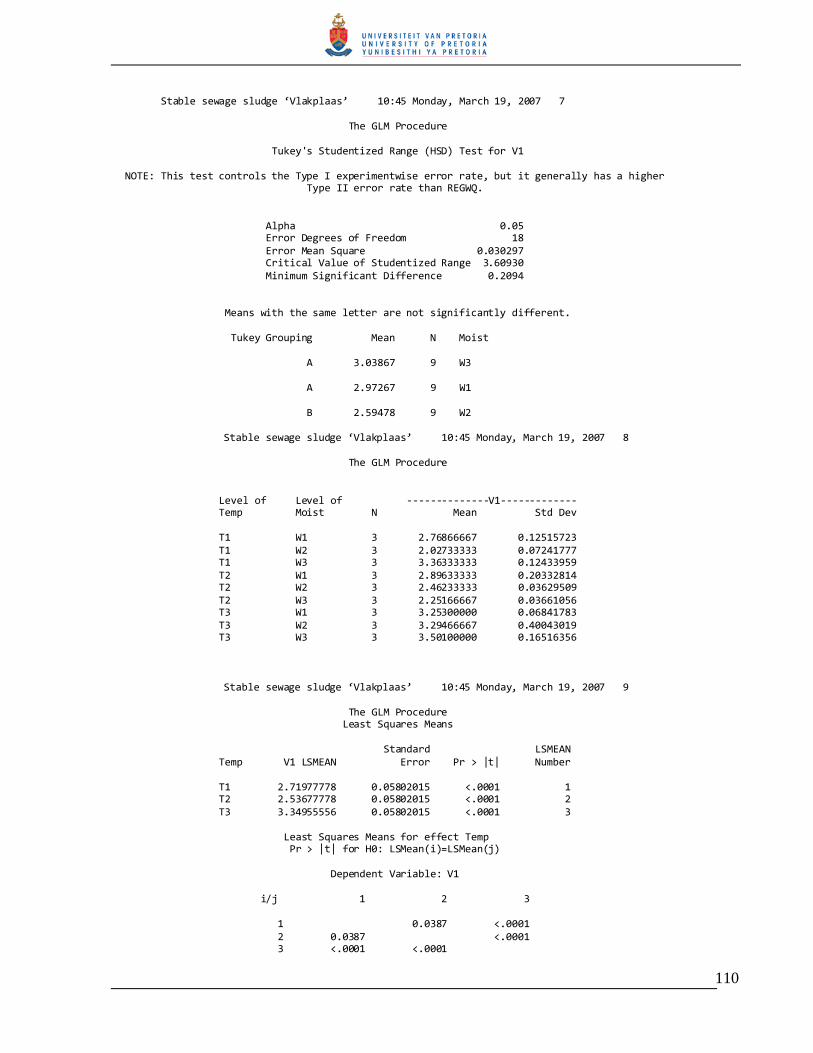
110
Stable sewage sludge ‘Vlakplaas’ 10:45 Monday, March 19, 2007 7 The GLM Procedure Tukey's Studentized Range (HSD) Test for V1 NOTE: This test controls the Type I experimentwise error rate, but it generally has a higher Type II error rate than REGWQ. Alpha 0.05 Error Degrees of Freedom 18 Error Mean Square 0.030297 Critical Value of Studentized Range 3.60930 Minimum Significant Difference 0.2094 Means with the same letter are not significantly different. Tukey Grouping Mean N Moist A 3.03867 9 W3 A 2.97267 9 W1 B 2.59478 9 W2
Stable sewage sludge ‘Vlakplaas’ 10:45 Monday, March 19, 2007 8 The GLM Procedure Level of Level of --------------V1------------- Temp Moist N Mean Std Dev T1 W1 3 2.76866667 0.12515723 T1 W2 3 2.02733333 0.07241777 T1 W3 3 3.36333333 0.12433959 T2 W1 3 2.89633333 0.20332814 T2 W2 3 2.46233333 0.03629509 T2 W3 3 2.25166667 0.03661056 T3 W1 3 3.25300000 0.06841783 T3 W2 3 3.29466667 0.40043019 T3 W3 3 3.50100000 0.16516356
Stable sewage sludge ‘Vlakplaas’ 10:45 Monday, March 19, 2007 9 The GLM Procedure Least Squares Means Standard LSMEAN Temp V1 LSMEAN Error Pr > |t| Number T1 2.71977778 0.05802015 <.0001 1 T2 2.53677778 0.05802015 <.0001 2 T3 3.34955556 0.05802015 <.0001 3 Least Squares Means for effect Temp Pr > |t| for H0: LSMean(i)=LSMean(j) Dependent Variable: V1 i/j 1 2 3 1 0.0387 <.0001 2 0.0387 <.0001 3 <.0001 <.0001
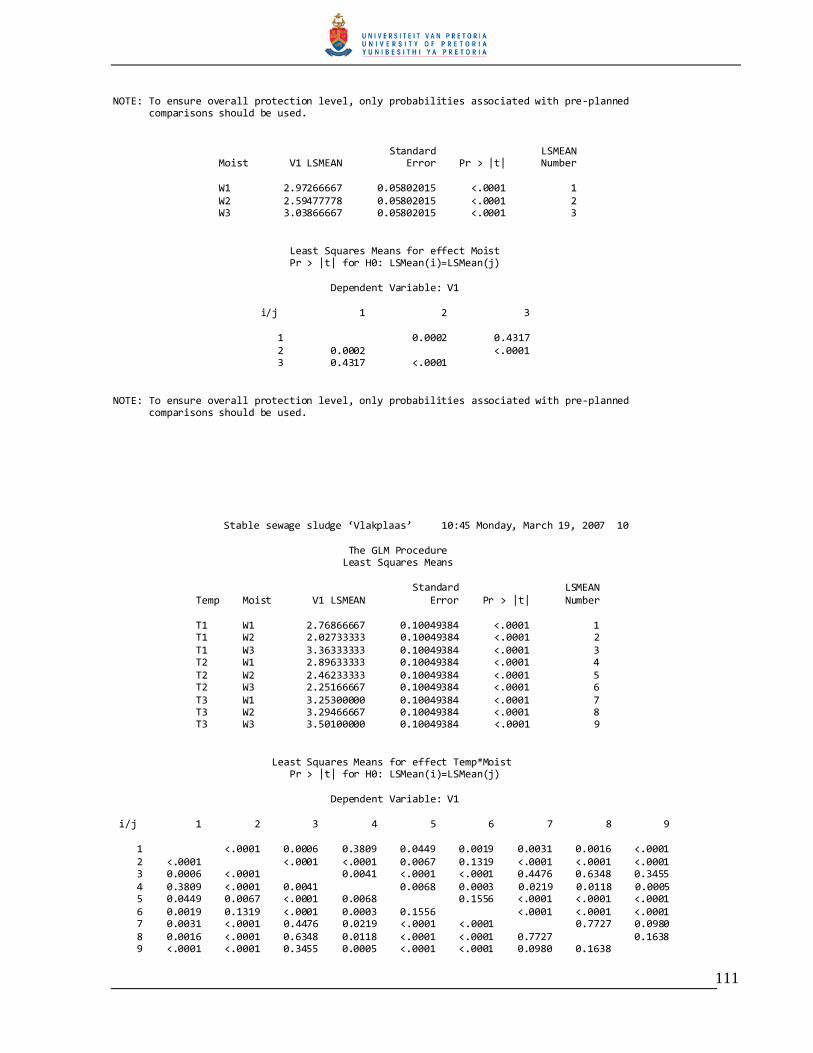
111
NOTE: To ensure overall protection level, only probabilities associated with pre-planned comparisons should be used. Standard LSMEAN Moist V1 LSMEAN Error Pr > |t| Number W1 2.97266667 0.05802015 <.0001 1 W2 2.59477778 0.05802015 <.0001 2 W3 3.03866667 0.05802015 <.0001 3 Least Squares Means for effect Moist Pr > |t| for H0: LSMean(i)=LSMean(j) Dependent Variable: V1 i/j 1 2 3 1 0.0002 0.4317 2 0.0002 <.0001 3 0.4317 <.0001 NOTE: To ensure overall protection level, only probabilities associated with pre-planned comparisons should be used.
Stable sewage sludge ‘Vlakplaas’ 10:45 Monday, March 19, 2007 10 The GLM Procedure Least Squares Means Standard LSMEAN Temp Moist V1 LSMEAN Error Pr > |t| Number T1 W1 2.76866667 0.10049384 <.0001 1 T1 W2 2.02733333 0.10049384 <.0001 2 T1 W3 3.36333333 0.10049384 <.0001 3 T2 W1 2.89633333 0.10049384 <.0001 4 T2 W2 2.46233333 0.10049384 <.0001 5 T2 W3 2.25166667 0.10049384 <.0001 6 T3 W1 3.25300000 0.10049384 <.0001 7 T3 W2 3.29466667 0.10049384 <.0001 8 T3 W3 3.50100000 0.10049384 <.0001 9 Least Squares Means for effect Temp*Moist Pr > |t| for H0: LSMean(i)=LSMean(j) Dependent Variable: V1 i/j 1 2 3 4 5 6 7 8 9 1 <.0001 0.0006 0.3809 0.0449 0.0019 0.0031 0.0016 <.0001 2 <.0001 <.0001 <.0001 0.0067 0.1319 <.0001 <.0001 <.0001 3 0.0006 <.0001 0.0041 <.0001 <.0001 0.4476 0.6348 0.3455 4 0.3809 <.0001 0.0041 0.0068 0.0003 0.0219 0.0118 0.0005 5 0.0449 0.0067 <.0001 0.0068 0.1556 <.0001 <.0001 <.0001 6 0.0019 0.1319 <.0001 0.0003 0.1556 <.0001 <.0001 <.0001 7 0.0031 <.0001 0.4476 0.0219 <.0001 <.0001 0.7727 0.0980 8 0.0016 <.0001 0.6348 0.0118 <.0001 <.0001 0.7727 0.1638 9 <.0001 <.0001 0.3455 0.0005 <.0001 <.0001 0.0980 0.1638
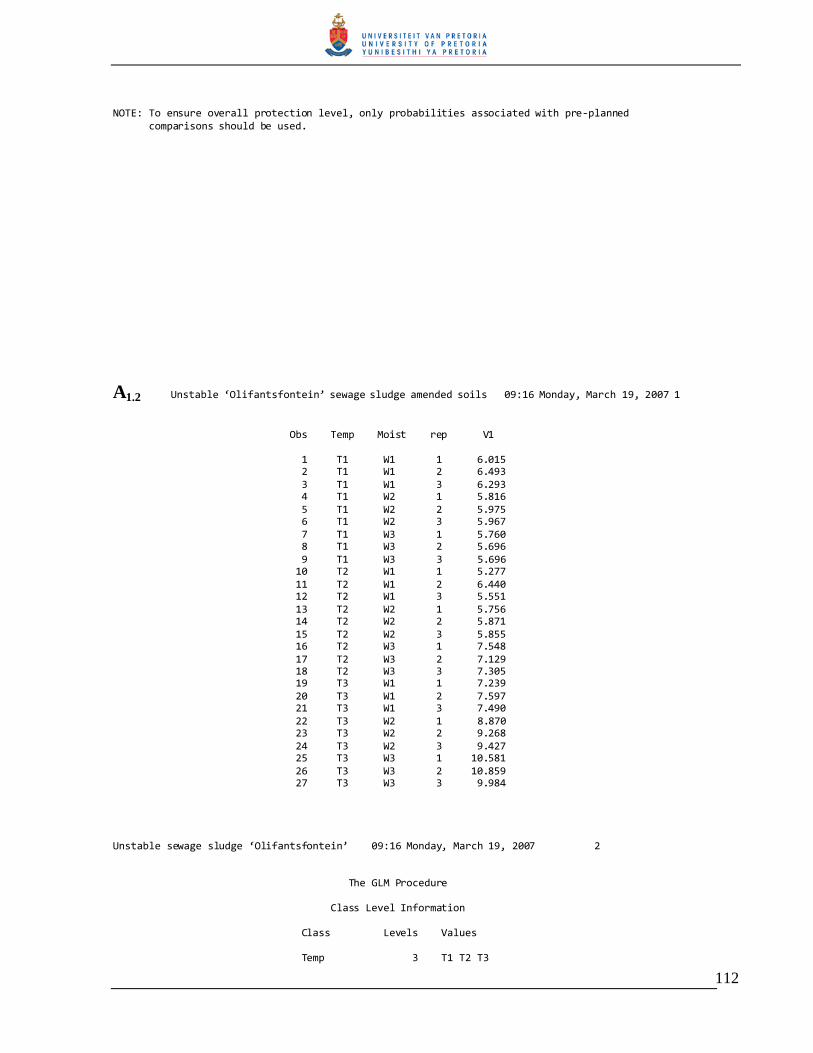
112
NOTE: To ensure overall protection level, only probabilities associated with pre-planned comparisons should be used.
A1.2 Unstable ‘Olifantsfontein’ sewage sludge amended soils 09:16 Monday, March 19, 2007 1
Obs Temp Moist rep V1 1 T1 W1 1 6.015 2 T1 W1 2 6.493 3 T1 W1 3 6.293 4 T1 W2 1 5.816 5 T1 W2 2 5.975 6 T1 W2 3 5.967 7 T1 W3 1 5.760 8 T1 W3 2 5.696 9 T1 W3 3 5.696 10 T2 W1 1 5.277 11 T2 W1 2 6.440 12 T2 W1 3 5.551 13 T2 W2 1 5.756 14 T2 W2 2 5.871 15 T2 W2 3 5.855 16 T2 W3 1 7.548 17 T2 W3 2 7.129 18 T2 W3 3 7.305 19 T3 W1 1 7.239 20 T3 W1 2 7.597 21 T3 W1 3 7.490 22 T3 W2 1 8.870 23 T3 W2 2 9.268 24 T3 W2 3 9.427 25 T3 W3 1 10.581 26 T3 W3 2 10.859 27 T3 W3 3 9.984 Unstable sewage sludge ‘Olifantsfontein’ 09:16 Monday, March 19, 2007 2 The GLM Procedure Class Level Information Class Levels Values Temp 3 T1 T2 T3

113
Moist 3 W1 W2 W3 Rep 3 1 2 3 Number of Observations Read 27 Number of Observations Used 27
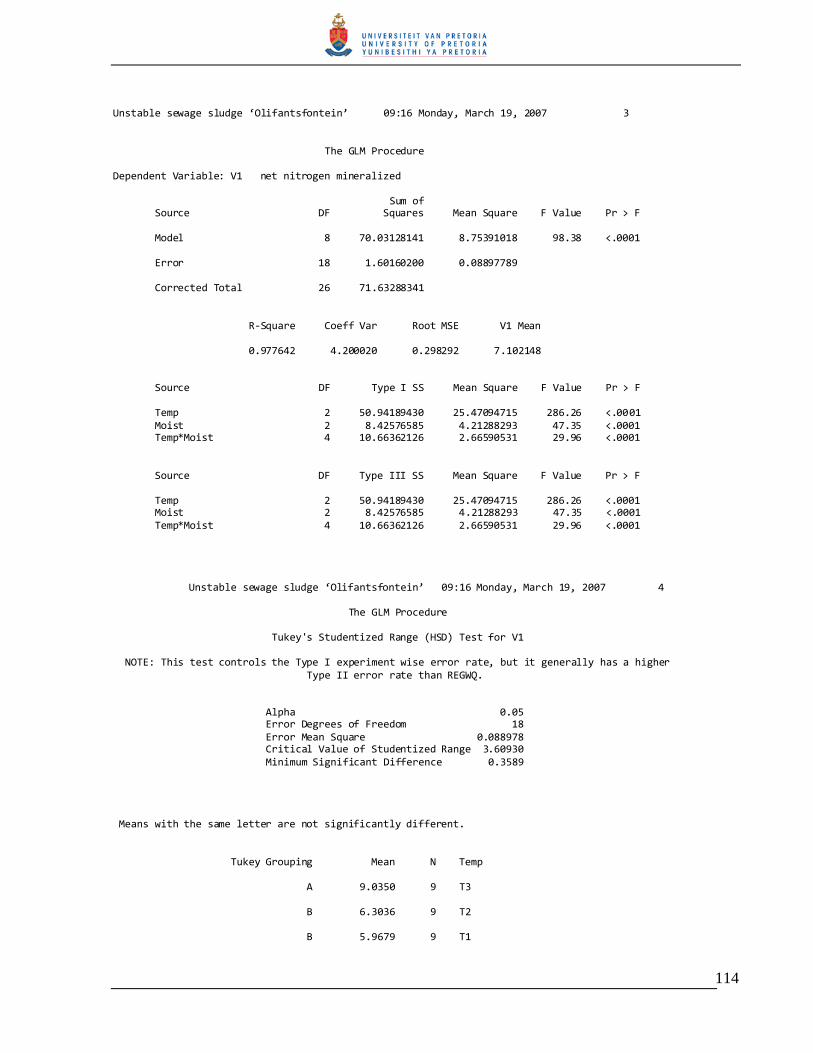
114
Unstable sewage sludge ‘Olifantsfontein’ 09:16 Monday, March 19, 2007 3
The GLM Procedure Dependent Variable: V1 net nitrogen mineralized Sum of Source DF Squares Mean Square F Value Pr > F Model 8 70.03128141 8.75391018 98.38 <.0001 Error 18 1.60160200 0.08897789 Corrected Total 26 71.63288341 R-Square Coeff Var Root MSE V1 Mean 0.977642 4.200020 0.298292 7.102148 Source DF Type I SS Mean Square F Value Pr > F Temp 2 50.94189430 25.47094715 286.26 <.0001 Moist 2 8.42576585 4.21288293 47.35 <.0001 Temp*Moist 4 10.66362126 2.66590531 29.96 <.0001 Source DF Type III SS Mean Square F Value Pr > F Temp 2 50.94189430 25.47094715 286.26 <.0001 Moist 2 8.42576585 4.21288293 47.35 <.0001 Temp*Moist 4 10.66362126 2.66590531 29.96 <.0001
Unstable sewage sludge ‘Olifantsfontein’ 09:16 Monday, March 19, 2007 4 The GLM Procedure Tukey's Studentized Range (HSD) Test for V1 NOTE: This test controls the Type I experiment wise error rate, but it generally has a higher Type II error rate than REGWQ. Alpha 0.05 Error Degrees of Freedom 18 Error Mean Square 0.088978 Critical Value of Studentized Range 3.60930 Minimum Significant Difference 0.3589 Means with the same letter are not significantly different. Tukey Grouping Mean N Temp A 9.0350 9 T3 B 6.3036 9 T2 B 5.9679 9 T1
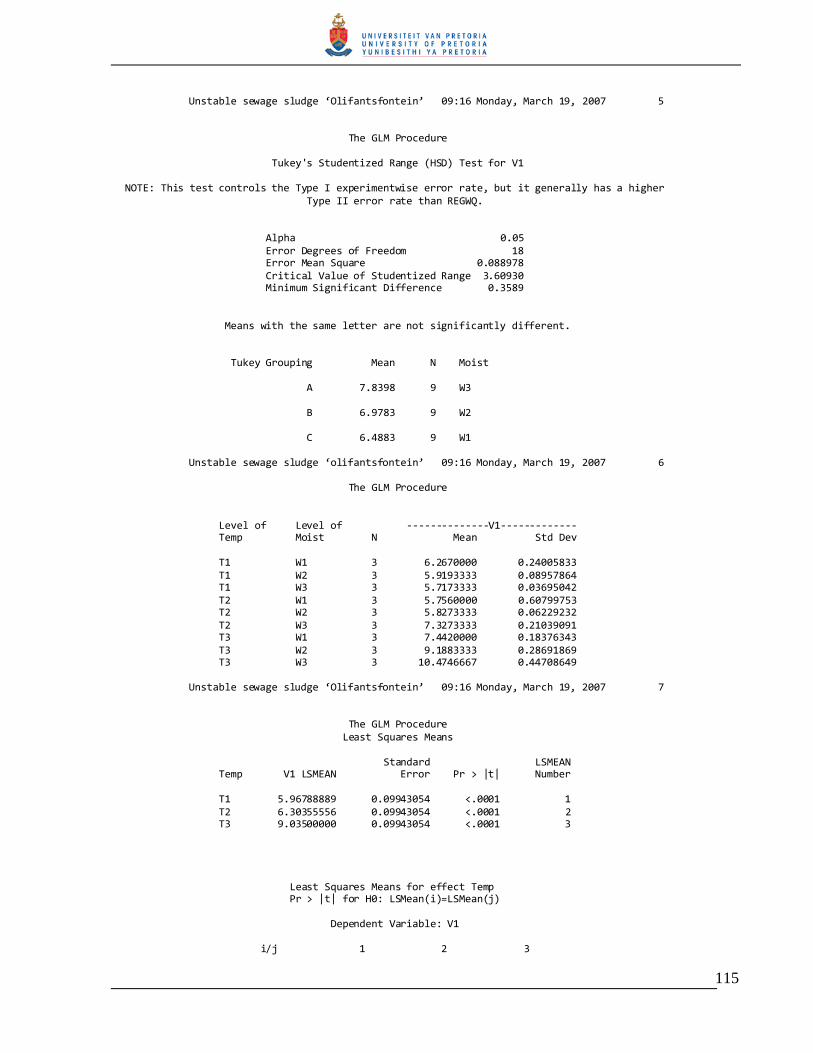
115
Unstable sewage sludge ‘Olifantsfontein’ 09:16 Monday, March 19, 2007 5 The GLM Procedure Tukey's Studentized Range (HSD) Test for V1 NOTE: This test controls the Type I experimentwise error rate, but it generally has a higher Type II error rate than REGWQ. Alpha 0.05 Error Degrees of Freedom 18 Error Mean Square 0.088978 Critical Value of Studentized Range 3.60930 Minimum Significant Difference 0.3589 Means with the same letter are not significantly different. Tukey Grouping Mean N Moist A 7.8398 9 W3 B 6.9783 9 W2 C 6.4883 9 W1
Unstable sewage sludge ‘olifantsfontein’ 09:16 Monday, March 19, 2007 6 The GLM Procedure Level of Level of --------------V1------------- Temp Moist N Mean Std Dev T1 W1 3 6.2670000 0.24005833 T1 W2 3 5.9193333 0.08957864 T1 W3 3 5.7173333 0.03695042 T2 W1 3 5.7560000 0.60799753 T2 W2 3 5.8273333 0.06229232 T2 W3 3 7.3273333 0.21039091 T3 W1 3 7.4420000 0.18376343 T3 W2 3 9.1883333 0.28691869 T3 W3 3 10.4746667 0.44708649
Unstable sewage sludge ‘Olifantsfontein’ 09:16 Monday, March 19, 2007 7 The GLM Procedure Least Squares Means Standard LSMEAN Temp V1 LSMEAN Error Pr > |t| Number T1 5.96788889 0.09943054 <.0001 1 T2 6.30355556 0.09943054 <.0001 2 T3 9.03500000 0.09943054 <.0001 3 Least Squares Means for effect Temp Pr > |t| for H0: LSMean(i)=LSMean(j) Dependent Variable: V1 i/j 1 2 3
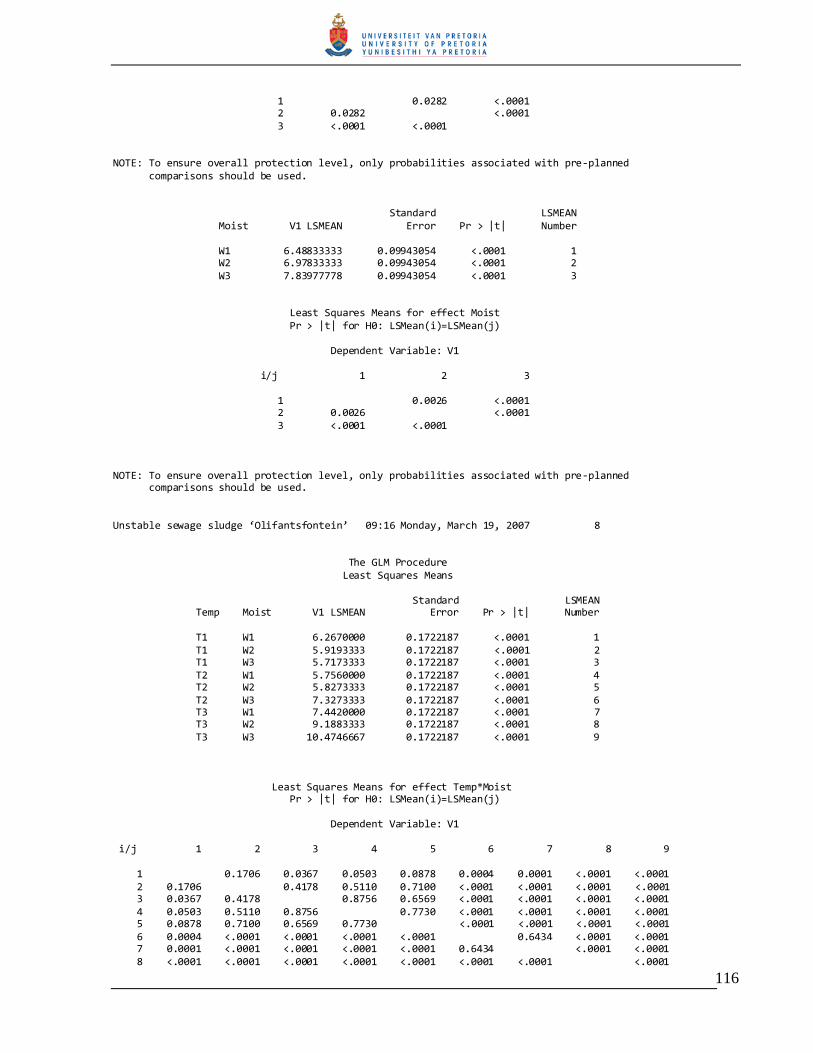
116
1 0.0282 <.0001 2 0.0282 <.0001 3 <.0001 <.0001 NOTE: To ensure overall protection level, only probabilities associated with pre-planned comparisons should be used. Standard LSMEAN Moist V1 LSMEAN Error Pr > |t| Number W1 6.48833333 0.09943054 <.0001 1 W2 6.97833333 0.09943054 <.0001 2 W3 7.83977778 0.09943054 <.0001 3 Least Squares Means for effect Moist Pr > |t| for H0: LSMean(i)=LSMean(j) Dependent Variable: V1 i/j 1 2 3 1 0.0026 <.0001 2 0.0026 <.0001 3 <.0001 <.0001 NOTE: To ensure overall protection level, only probabilities associated with pre-planned comparisons should be used. Unstable sewage sludge ‘Olifantsfontein’ 09:16 Monday, March 19, 2007 8 The GLM Procedure Least Squares Means Standard LSMEAN Temp Moist V1 LSMEAN Error Pr > |t| Number T1 W1 6.2670000 0.1722187 <.0001 1 T1 W2 5.9193333 0.1722187 <.0001 2 T1 W3 5.7173333 0.1722187 <.0001 3 T2 W1 5.7560000 0.1722187 <.0001 4 T2 W2 5.8273333 0.1722187 <.0001 5 T2 W3 7.3273333 0.1722187 <.0001 6 T3 W1 7.4420000 0.1722187 <.0001 7 T3 W2 9.1883333 0.1722187 <.0001 8 T3 W3 10.4746667 0.1722187 <.0001 9 Least Squares Means for effect Temp*Moist Pr > |t| for H0: LSMean(i)=LSMean(j) Dependent Variable: V1 i/j 1 2 3 4 5 6 7 8 9 1 0.1706 0.0367 0.0503 0.0878 0.0004 0.0001 <.0001 <.0001 2 0.1706 0.4178 0.5110 0.7100 <.0001 <.0001 <.0001 <.0001 3 0.0367 0.4178 0.8756 0.6569 <.0001 <.0001 <.0001 <.0001 4 0.0503 0.5110 0.8756 0.7730 <.0001 <.0001 <.0001 <.0001 5 0.0878 0.7100 0.6569 0.7730 <.0001 <.0001 <.0001 <.0001 6 0.0004 <.0001 <.0001 <.0001 <.0001 0.6434 <.0001 <.0001 7 0.0001 <.0001 <.0001 <.0001 <.0001 0.6434 <.0001 <.0001 8 <.0001 <.0001 <.0001 <.0001 <.0001 <.0001 <.0001 <.0001
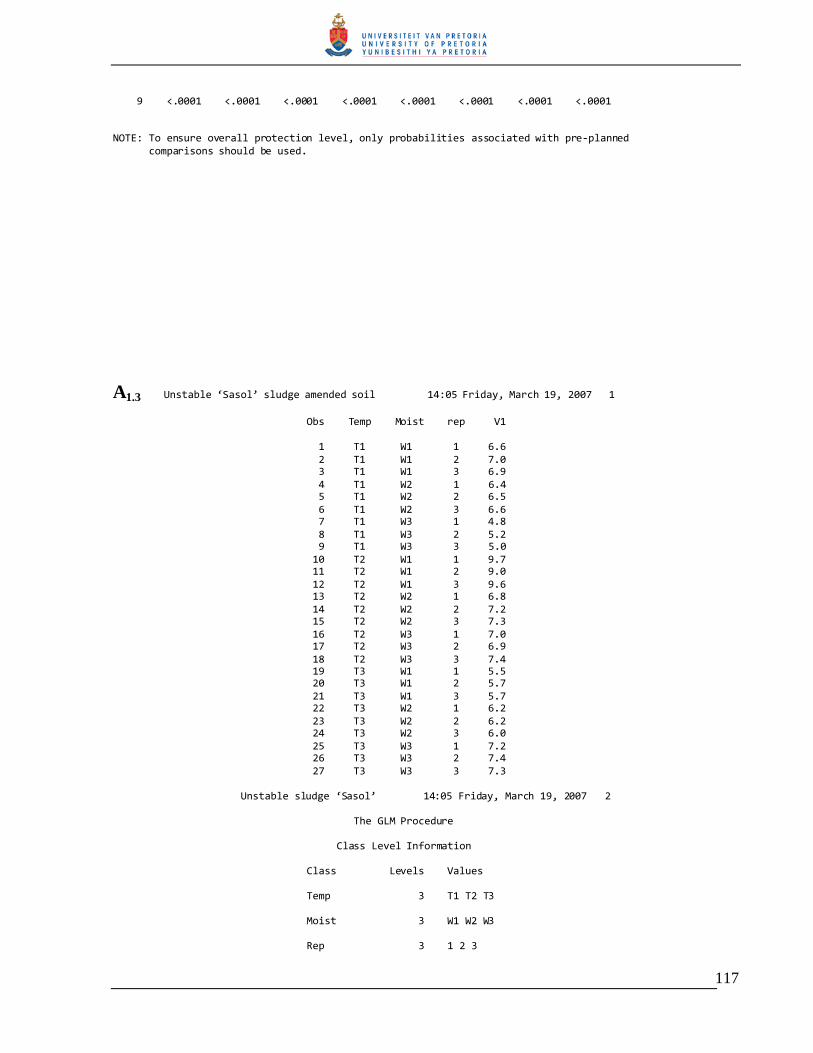
117
9 <.0001 <.0001 <.0001 <.0001 <.0001 <.0001 <.0001 <.0001 NOTE: To ensure overall protection level, only probabilities associated with pre-planned comparisons should be used.
A1.3 Unstable ‘Sasol’ sludge amended soil 14:05 Friday, March 19, 2007 1
Obs Temp Moist rep V1 1 T1 W1 1 6.6 2 T1 W1 2 7.0 3 T1 W1 3 6.9 4 T1 W2 1 6.4 5 T1 W2 2 6.5 6 T1 W2 3 6.6 7 T1 W3 1 4.8 8 T1 W3 2 5.2 9 T1 W3 3 5.0 10 T2 W1 1 9.7 11 T2 W1 2 9.0 12 T2 W1 3 9.6 13 T2 W2 1 6.8 14 T2 W2 2 7.2 15 T2 W2 3 7.3 16 T2 W3 1 7.0 17 T2 W3 2 6.9 18 T2 W3 3 7.4 19 T3 W1 1 5.5 20 T3 W1 2 5.7 21 T3 W1 3 5.7 22 T3 W2 1 6.2 23 T3 W2 2 6.2 24 T3 W2 3 6.0 25 T3 W3 1 7.2 26 T3 W3 2 7.4 27 T3 W3 3 7.3
Unstable sludge ‘Sasol’ 14:05 Friday, March 19, 2007 2 The GLM Procedure Class Level Information Class Levels Values Temp 3 T1 T2 T3 Moist 3 W1 W2 W3 Rep 3 1 2 3
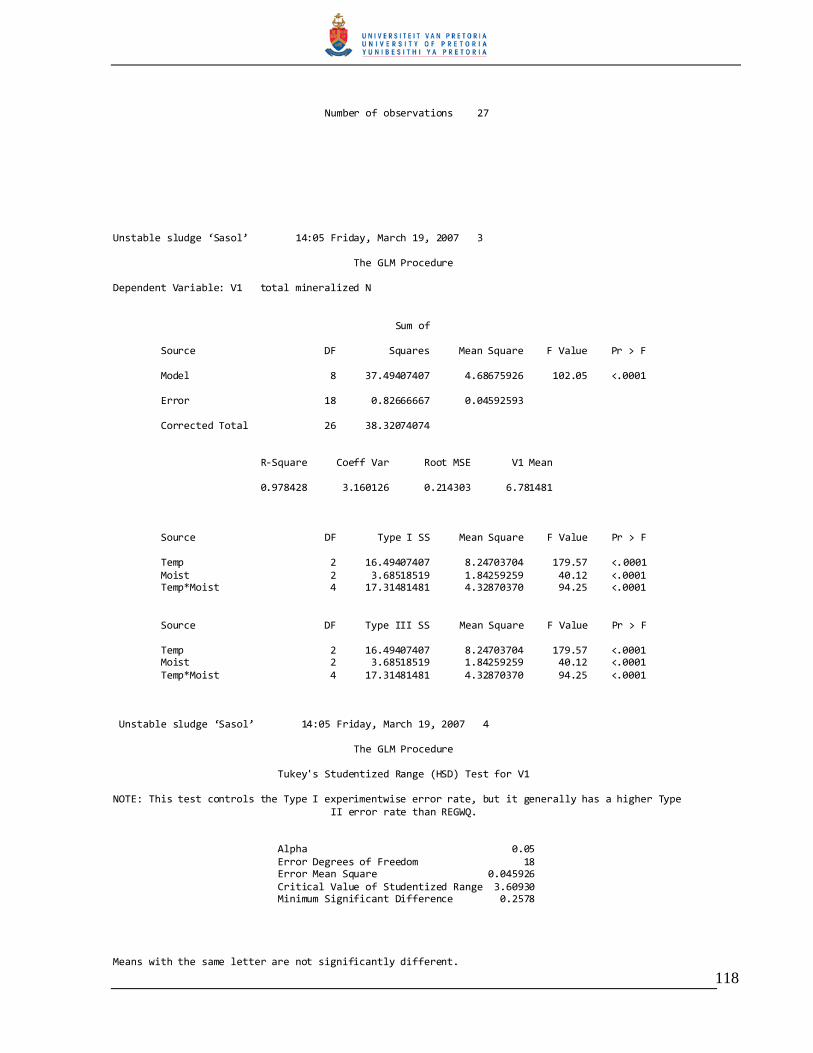
118
Number of observations 27 Unstable sludge ‘Sasol’ 14:05 Friday, March 19, 2007 3 The GLM Procedure Dependent Variable: V1 total mineralized N Sum of Source DF Squares Mean Square F Value Pr > F Model 8 37.49407407 4.68675926 102.05 <.0001 Error 18 0.82666667 0.04592593 Corrected Total 26 38.32074074 R-Square Coeff Var Root MSE V1 Mean 0.978428 3.160126 0.214303 6.781481 Source DF Type I SS Mean Square F Value Pr > F Temp 2 16.49407407 8.24703704 179.57 <.0001 Moist 2 3.68518519 1.84259259 40.12 <.0001 Temp*Moist 4 17.31481481 4.32870370 94.25 <.0001 Source DF Type III SS Mean Square F Value Pr > F Temp 2 16.49407407 8.24703704 179.57 <.0001 Moist 2 3.68518519 1.84259259 40.12 <.0001 Temp*Moist 4 17.31481481 4.32870370 94.25 <.0001 Unstable sludge ‘Sasol’ 14:05 Friday, March 19, 2007 4 The GLM Procedure Tukey's Studentized Range (HSD) Test for V1 NOTE: This test controls the Type I experimentwise error rate, but it generally has a higher Type II error rate than REGWQ. Alpha 0.05 Error Degrees of Freedom 18 Error Mean Square 0.045926 Critical Value of Studentized Range 3.60930 Minimum Significant Difference 0.2578 Means with the same letter are not significantly different.
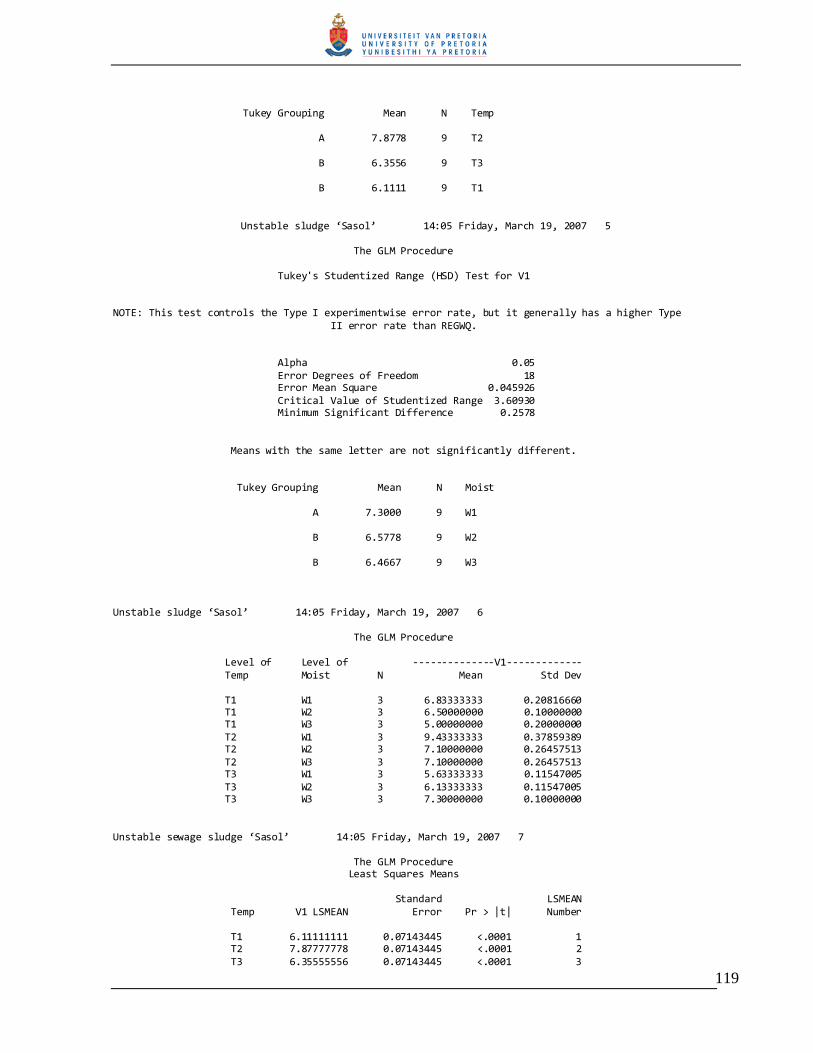
119
Tukey Grouping Mean N Temp A 7.8778 9 T2 B 6.3556 9 T3 B 6.1111 9 T1
Unstable sludge ‘Sasol’ 14:05 Friday, March 19, 2007 5 The GLM Procedure Tukey's Studentized Range (HSD) Test for V1 NOTE: This test controls the Type I experimentwise error rate, but it generally has a higher Type II error rate than REGWQ. Alpha 0.05 Error Degrees of Freedom 18 Error Mean Square 0.045926 Critical Value of Studentized Range 3.60930 Minimum Significant Difference 0.2578 Means with the same letter are not significantly different. Tukey Grouping Mean N Moist A 7.3000 9 W1 B 6.5778 9 W2 B 6.4667 9 W3
Unstable sludge ‘Sasol’ 14:05 Friday, March 19, 2007 6 The GLM Procedure Level of Level of --------------V1------------- Temp Moist N Mean Std Dev T1 W1 3 6.83333333 0.20816660 T1 W2 3 6.50000000 0.10000000 T1 W3 3 5.00000000 0.20000000 T2 W1 3 9.43333333 0.37859389 T2 W2 3 7.10000000 0.26457513 T2 W3 3 7.10000000 0.26457513 T3 W1 3 5.63333333 0.11547005 T3 W2 3 6.13333333 0.11547005 T3 W3 3 7.30000000 0.10000000
Unstable sewage sludge ‘Sasol’ 14:05 Friday, March 19, 2007 7 The GLM Procedure Least Squares Means Standard LSMEAN Temp V1 LSMEAN Error Pr > |t| Number T1 6.11111111 0.07143445 <.0001 1 T2 7.87777778 0.07143445 <.0001 2 T3 6.35555556 0.07143445 <.0001 3

120
Least Squares Means for effect Temp Pr > |t| for H0: LSMean(i)=LSMean(j) Dependent Variable: V1 i/j 1 2 3 1 <.0001 0.0263 2 <.0001 <.0001 3 0.0263 <.0001 NOTE: To ensure overall protection level, only probabilities associated with pre-planned comparisons should be used. Standard LSMEAN Moist V1 LSMEAN Error Pr > |t| Number W1 7.30000000 0.07143445 <.0001 1 W2 6.57777778 0.07143445 <.0001 2 W3 6.46666667 0.07143445 <.0001 3 Least Squares Means for effect Moist Pr > |t| for H0: LSMean(i)=LSMean(j) Dependent Variable: V1 i/j 1 2 3 1 <.0001 <.0001 2 <.0001 0.2859 3 <.0001 0.2859 NOTE: To ensure overall protection level, only probabilities associated with pre-planned comparisons should be used.
Unstable sludge ‘Sasol’ 14:05 Friday, March 19, 2007 8 The GLM Procedure Least Squares Means Standard LSMEAN Temp Moist V1 LSMEAN Error Pr > |t| Number T1 W1 6.83333333 0.12372810 <.0001 1 T1 W2 6.50000000 0.12372810 <.0001 2 T1 W3 5.00000000 0.12372810 <.0001 3 T2 W1 9.43333333 0.12372810 <.0001 4 T2 W2 7.10000000 0.12372810 <.0001 5 T2 W3 7.10000000 0.12372810 <.0001 6 T3 W1 5.63333333 0.12372810 <.0001 7 T3 W2 6.13333333 0.12372810 <.0001 8 T3 W3 7.30000000 0.12372810 <.0001 9 Least Squares Means for effect Temp*Moist Pr > |t| for H0: LSMean(i)=LSMean(j) Dependent Variable: V1 i/j 1 2 3 4 5 6 7 8 9 1 0.0729 <.0001 <.0001 0.1449 0.1449 <.0001 0.0008 0.0157
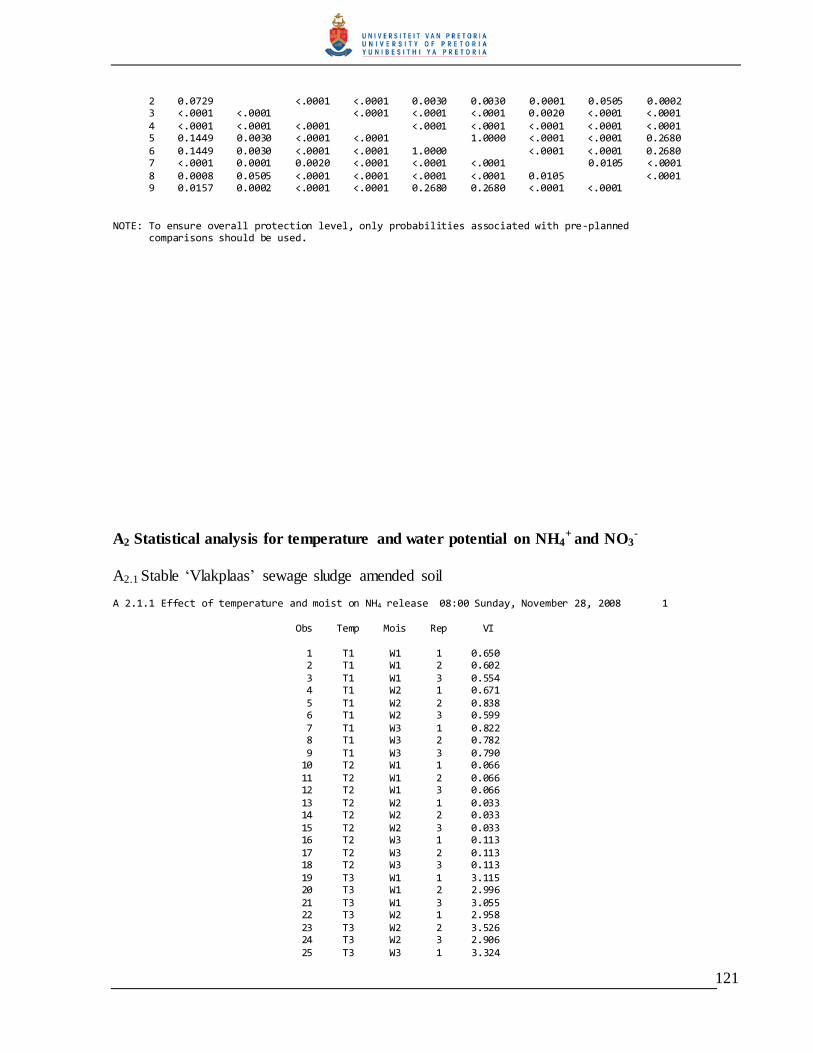
121
2 0.0729 <.0001 <.0001 0.0030 0.0030 0.0001 0.0505 0.0002 3 <.0001 <.0001 <.0001 <.0001 <.0001 0.0020 <.0001 <.0001 4 <.0001 <.0001 <.0001 <.0001 <.0001 <.0001 <.0001 <.0001 5 0.1449 0.0030 <.0001 <.0001 1.0000 <.0001 <.0001 0.2680 6 0.1449 0.0030 <.0001 <.0001 1.0000 <.0001 <.0001 0.2680 7 <.0001 0.0001 0.0020 <.0001 <.0001 <.0001 0.0105 <.0001 8 0.0008 0.0505 <.0001 <.0001 <.0001 <.0001 0.0105 <.0001 9 0.0157 0.0002 <.0001 <.0001 0.2680 0.2680 <.0001 <.0001 NOTE: To ensure overall protection level, only probabilities associated with pre-planned comparisons should be used.
A2 Statistical analysis for temperature and water potential on NH4+ and NO3
-
A2.1 Stable „Vlakplaas‟ sewage sludge amended soil
A 2.1.1 Effect of temperature and moist on NH4 release 08:00 Sunday, November 28, 2008 1 Obs Temp Mois Rep VI 1 T1 W1 1 0.650 2 T1 W1 2 0.602 3 T1 W1 3 0.554 4 T1 W2 1 0.671 5 T1 W2 2 0.838 6 T1 W2 3 0.599 7 T1 W3 1 0.822 8 T1 W3 2 0.782 9 T1 W3 3 0.790 10 T2 W1 1 0.066 11 T2 W1 2 0.066 12 T2 W1 3 0.066 13 T2 W2 1 0.033 14 T2 W2 2 0.033 15 T2 W2 3 0.033 16 T2 W3 1 0.113 17 T2 W3 2 0.113 18 T2 W3 3 0.113 19 T3 W1 1 3.115 20 T3 W1 2 2.996 21 T3 W1 3 3.055 22 T3 W2 1 2.958 23 T3 W2 2 3.526 24 T3 W2 3 2.906 25 T3 W3 1 3.324
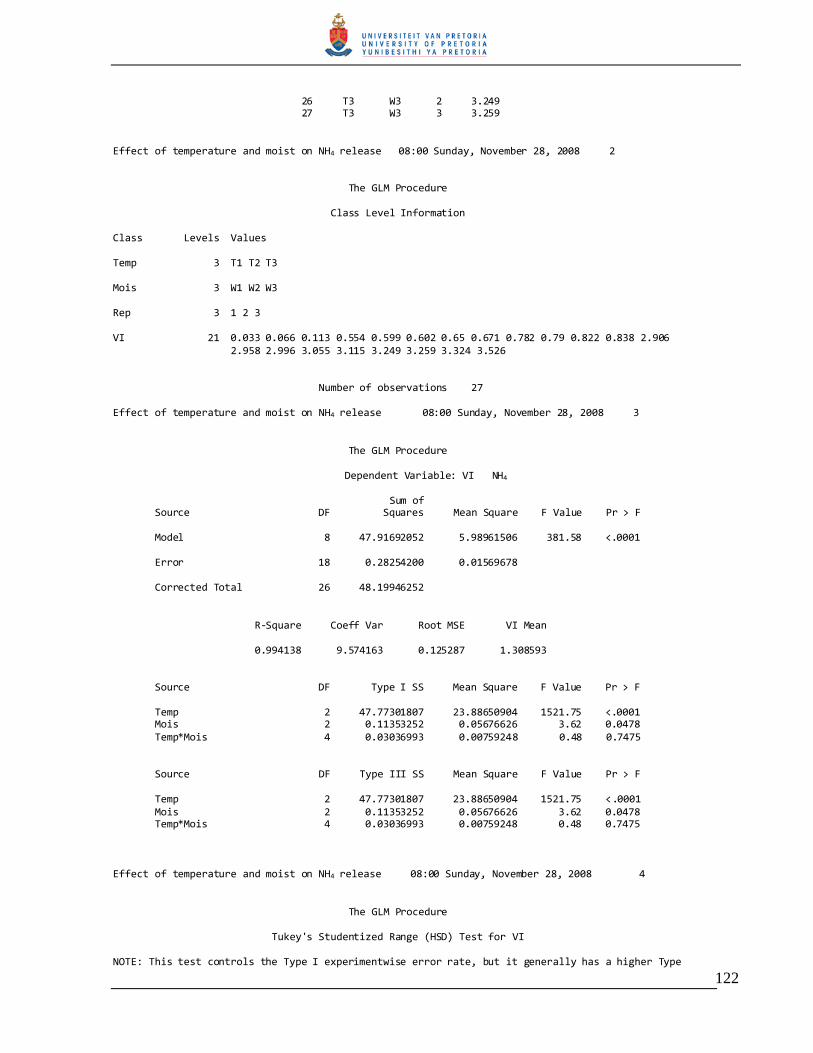
122
26 T3 W3 2 3.249 27 T3 W3 3 3.259 Effect of temperature and moist on NH4 release 08:00 Sunday, November 28, 2008 2 The GLM Procedure Class Level Information Class Levels Values Temp 3 T1 T2 T3 Mois 3 W1 W2 W3 Rep 3 1 2 3 VI 21 0.033 0.066 0.113 0.554 0.599 0.602 0.65 0.671 0.782 0.79 0.822 0.838 2.906 2.958 2.996 3.055 3.115 3.249 3.259 3.324 3.526 Number of observations 27 Effect of temperature and moist on NH4 release 08:00 Sunday, November 28, 2008 3 The GLM Procedure
Dependent Variable: VI NH4 Sum of Source DF Squares Mean Square F Value Pr > F Model 8 47.91692052 5.98961506 381.58 <.0001 Error 18 0.28254200 0.01569678 Corrected Total 26 48.19946252 R-Square Coeff Var Root MSE VI Mean 0.994138 9.574163 0.125287 1.308593 Source DF Type I SS Mean Square F Value Pr > F Temp 2 47.77301807 23.88650904 1521.75 <.0001 Mois 2 0.11353252 0.05676626 3.62 0.0478 Temp*Mois 4 0.03036993 0.00759248 0.48 0.7475 Source DF Type III SS Mean Square F Value Pr > F Temp 2 47.77301807 23.88650904 1521.75 <.0001 Mois 2 0.11353252 0.05676626 3.62 0.0478 Temp*Mois 4 0.03036993 0.00759248 0.48 0.7475 Effect of temperature and moist on NH4 release 08:00 Sunday, November 28, 2008 4 The GLM Procedure Tukey's Studentized Range (HSD) Test for VI NOTE: This test controls the Type I experimentwise error rate, but it generally has a higher Type
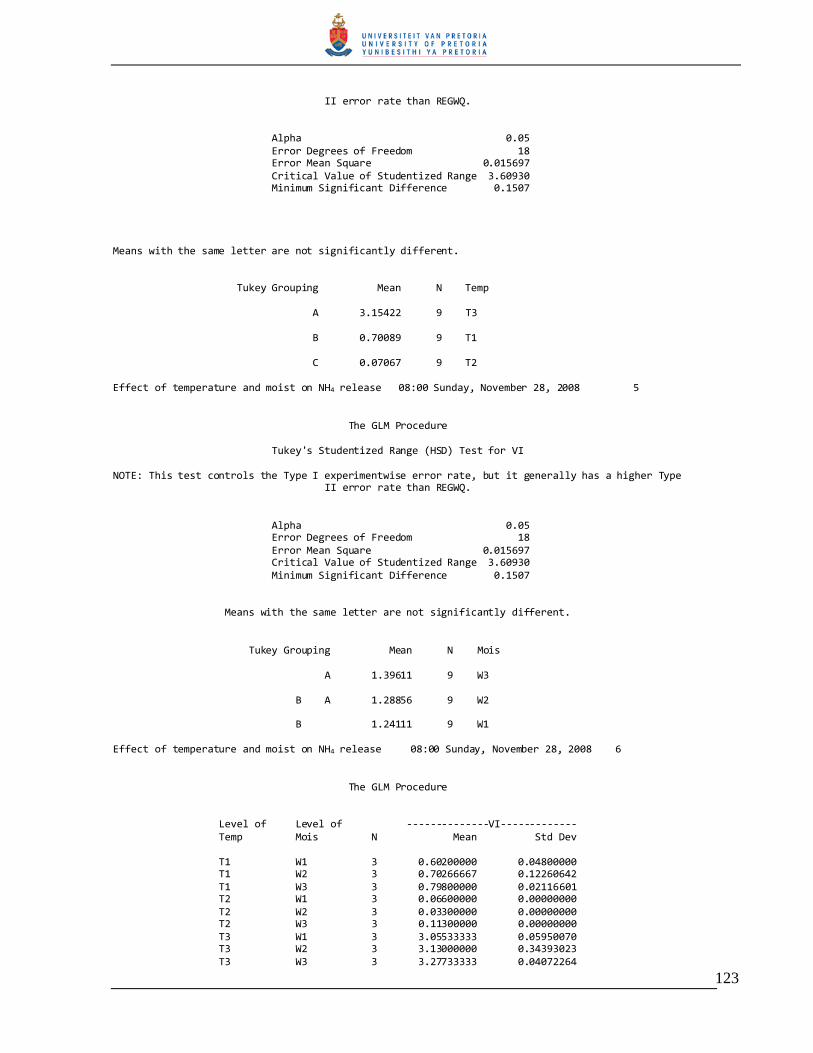
123
II error rate than REGWQ. Alpha 0.05 Error Degrees of Freedom 18 Error Mean Square 0.015697 Critical Value of Studentized Range 3.60930 Minimum Significant Difference 0.1507 Means with the same letter are not significantly different. Tukey Grouping Mean N Temp A 3.15422 9 T3 B 0.70089 9 T1 C 0.07067 9 T2 Effect of temperature and moist on NH4 release 08:00 Sunday, November 28, 2008 5 The GLM Procedure Tukey's Studentized Range (HSD) Test for VI NOTE: This test controls the Type I experimentwise error rate, but it generally has a higher Type II error rate than REGWQ. Alpha 0.05 Error Degrees of Freedom 18 Error Mean Square 0.015697 Critical Value of Studentized Range 3.60930 Minimum Significant Difference 0.1507 Means with the same letter are not significantly different. Tukey Grouping Mean N Mois A 1.39611 9 W3 B A 1.28856 9 W2 B 1.24111 9 W1 Effect of temperature and moist on NH4 release 08:00 Sunday, November 28, 2008 6 The GLM Procedure Level of Level of --------------VI------------- Temp Mois N Mean Std Dev T1 W1 3 0.60200000 0.04800000 T1 W2 3 0.70266667 0.12260642 T1 W3 3 0.79800000 0.02116601 T2 W1 3 0.06600000 0.00000000 T2 W2 3 0.03300000 0.00000000 T2 W3 3 0.11300000 0.00000000 T3 W1 3 3.05533333 0.05950070 T3 W2 3 3.13000000 0.34393023 T3 W3 3 3.27733333 0.04072264
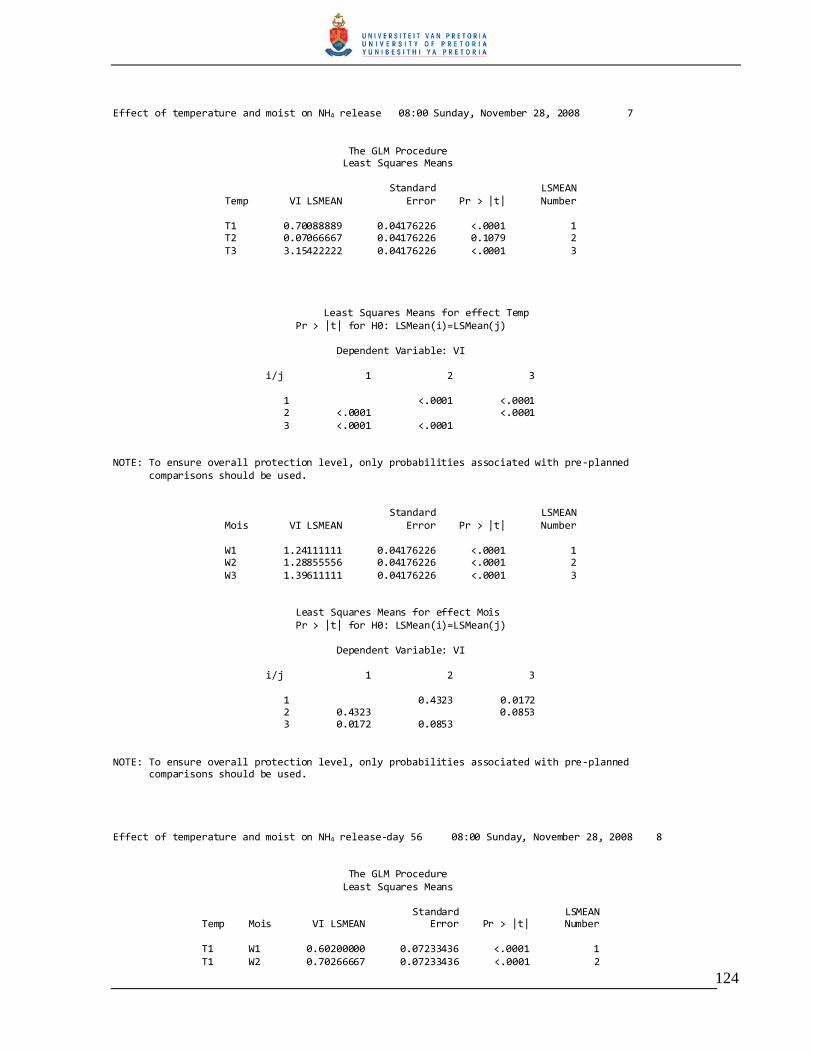
124
Effect of temperature and moist on NH4 release 08:00 Sunday, November 28, 2008 7 The GLM Procedure Least Squares Means Standard LSMEAN Temp VI LSMEAN Error Pr > |t| Number T1 0.70088889 0.04176226 <.0001 1 T2 0.07066667 0.04176226 0.1079 2 T3 3.15422222 0.04176226 <.0001 3
Least Squares Means for effect Temp Pr > |t| for H0: LSMean(i)=LSMean(j) Dependent Variable: VI i/j 1 2 3 1 <.0001 <.0001 2 <.0001 <.0001 3 <.0001 <.0001 NOTE: To ensure overall protection level, only probabilities associated with pre-planned comparisons should be used. Standard LSMEAN Mois VI LSMEAN Error Pr > |t| Number W1 1.24111111 0.04176226 <.0001 1 W2 1.28855556 0.04176226 <.0001 2 W3 1.39611111 0.04176226 <.0001 3 Least Squares Means for effect Mois Pr > |t| for H0: LSMean(i)=LSMean(j) Dependent Variable: VI i/j 1 2 3 1 0.4323 0.0172 2 0.4323 0.0853 3 0.0172 0.0853 NOTE: To ensure overall protection level, only probabilities associated with pre-planned comparisons should be used. Effect of temperature and moist on NH4 release-day 56 08:00 Sunday, November 28, 2008 8 The GLM Procedure Least Squares Means Standard LSMEAN Temp Mois VI LSMEAN Error Pr > |t| Number T1 W1 0.60200000 0.07233436 <.0001 1 T1 W2 0.70266667 0.07233436 <.0001 2
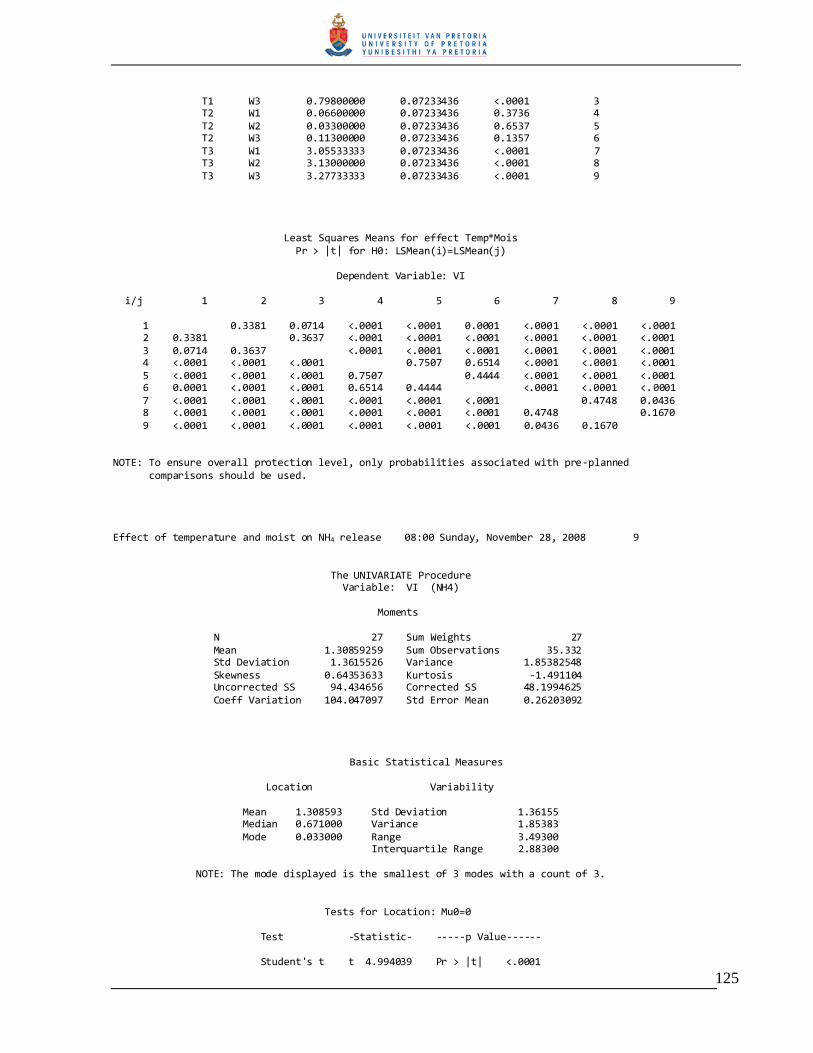
125
T1 W3 0.79800000 0.07233436 <.0001 3 T2 W1 0.06600000 0.07233436 0.3736 4 T2 W2 0.03300000 0.07233436 0.6537 5 T2 W3 0.11300000 0.07233436 0.1357 6 T3 W1 3.05533333 0.07233436 <.0001 7 T3 W2 3.13000000 0.07233436 <.0001 8 T3 W3 3.27733333 0.07233436 <.0001 9 Least Squares Means for effect Temp*Mois Pr > |t| for H0: LSMean(i)=LSMean(j) Dependent Variable: VI i/j 1 2 3 4 5 6 7 8 9 1 0.3381 0.0714 <.0001 <.0001 0.0001 <.0001 <.0001 <.0001 2 0.3381 0.3637 <.0001 <.0001 <.0001 <.0001 <.0001 <.0001 3 0.0714 0.3637 <.0001 <.0001 <.0001 <.0001 <.0001 <.0001 4 <.0001 <.0001 <.0001 0.7507 0.6514 <.0001 <.0001 <.0001 5 <.0001 <.0001 <.0001 0.7507 0.4444 <.0001 <.0001 <.0001 6 0.0001 <.0001 <.0001 0.6514 0.4444 <.0001 <.0001 <.0001 7 <.0001 <.0001 <.0001 <.0001 <.0001 <.0001 0.4748 0.0436 8 <.0001 <.0001 <.0001 <.0001 <.0001 <.0001 0.4748 0.1670 9 <.0001 <.0001 <.0001 <.0001 <.0001 <.0001 0.0436 0.1670 NOTE: To ensure overall protection level, only probabilities associated with pre-planned comparisons should be used. Effect of temperature and moist on NH4 release 08:00 Sunday, November 28, 2008 9 The UNIVARIATE Procedure Variable: VI (NH4) Moments N 27 Sum Weights 27 Mean 1.30859259 Sum Observations 35.332 Std Deviation 1.3615526 Variance 1.85382548 Skewness 0.64353633 Kurtosis -1.491104 Uncorrected SS 94.434656 Corrected SS 48.1994625 Coeff Variation 104.047097 Std Error Mean 0.26203092
Basic Statistical Measures
Location Variability Mean 1.308593 Std Deviation 1.36155 Median 0.671000 Variance 1.85383 Mode 0.033000 Range 3.49300 Interquartile Range 2.88300 NOTE: The mode displayed is the smallest of 3 modes with a count of 3. Tests for Location: Mu0=0 Test -Statistic- -----p Value------ Student's t t 4.994039 Pr > |t| <.0001
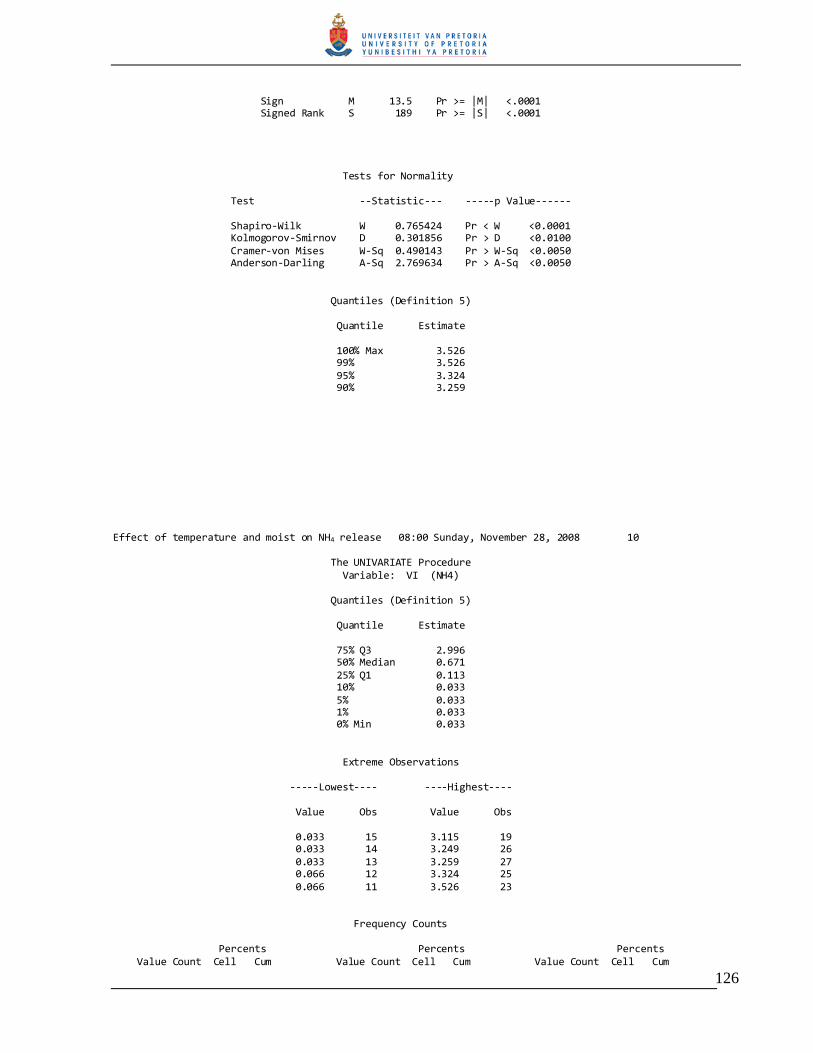
126
Sign M 13.5 Pr >= |M| <.0001 Signed Rank S 189 Pr >= |S| <.0001 Tests for Normality Test --Statistic--- -----p Value------ Shapiro-Wilk W 0.765424 Pr < W <0.0001 Kolmogorov-Smirnov D 0.301856 Pr > D <0.0100 Cramer-von Mises W-Sq 0.490143 Pr > W-Sq <0.0050 Anderson-Darling A-Sq 2.769634 Pr > A-Sq <0.0050 Quantiles (Definition 5) Quantile Estimate 100% Max 3.526 99% 3.526 95% 3.324 90% 3.259 Effect of temperature and moist on NH4 release 08:00 Sunday, November 28, 2008 10 The UNIVARIATE Procedure Variable: VI (NH4) Quantiles (Definition 5) Quantile Estimate 75% Q3 2.996 50% Median 0.671 25% Q1 0.113 10% 0.033 5% 0.033 1% 0.033 0% Min 0.033 Extreme Observations -----Lowest---- ----Highest---- Value Obs Value Obs 0.033 15 3.115 19 0.033 14 3.249 26 0.033 13 3.259 27 0.066 12 3.324 25 0.066 11 3.526 23 Frequency Counts Percents Percents Percents Value Count Cell Cum Value Count Cell Cum Value Count Cell Cum

127
0.033 3 11.1 11.1 0.671 1 3.7 51.9 2.996 1 3.7 77.8 0.066 3 11.1 22.2 0.782 1 3.7 55.6 3.055 1 3.7 81.5 0.113 3 11.1 33.3 0.790 1 3.7 59.3 3.115 1 3.7 85.2 0.554 1 3.7 37.0 0.822 1 3.7 63.0 3.249 1 3.7 88.9 0.599 1 3.7 40.7 0.838 1 3.7 66.7 3.259 1 3.7 92.6 0.602 1 3.7 44.4 2.906 1 3.7 70.4 3.324 1 3.7 96.3 0.650 1 3.7 48.1 2.958 1 3.7 74.1 3.526 1 3.7 100.0

128
Effect of temperature and moist on NH4 release 08:00 Sunday, November 28, 2008 11 The UNIVARIATE Procedure Variable: VI (NH4) Stem Leaf # Boxplot 3 5 1 | 3 0011233 7 +-----+ 2 9 1 | | 2 | | 1 | | 1 | + | 0 666678888 9 *-----* 0 000111111 9 +-----+ ----+----+----+----+ Normal Probability Plot 3.75+ +++* | * ** *++* | *** ++++ | +++ | ++++ | ++++ | +********* 0.25+ * * * * +**+* +----+----+----+----+----+----+----+----+----+----+ -2 -1 0 +1 +2
A 2.1.2 Effect of temperature and moist on NO3 release 08:50 Sunday, November 28, 2008 1 Obs Temp Mois Rep VI 1 T1 W1 1 2.554 2 T1 W1 2 2.634 3 T1 W1 3 2.602 4 T1 W2 1 2.055 5 T1 W2 2 1.956 6 T1 W2 3 1.964 7 T1 W3 1 2.912 8 T1 W3 2 3.031 9 T1 W3 3 3.043 10 T2 W1 1 2.944 11 T2 W1 2 2.992 12 T2 W1 3 2.864 13 T2 W2 1 2.642 14 T2 W2 2 2.602 15 T2 W2 3 2.638 16 T2 W3 1 2.410 17 T2 W3 2 2.609 18 T2 W3 3 2.530 19 T3 W1 1 0.095 20 T3 W1 2 0.334 21 T3 W1 3 0.164 22 T3 W2 1 0.151 23 T3 W2 2 0.191 24 T3 W2 3 0.151 25 T3 W3 1 0.273 26 T3 W3 2 0.193 27 T3 W3 3 0.205

129
Effect of temperature and moist on NO3 08:50 Sunday, November 28, 2008 2 The GLM Procedure Class Level Information Class Levels Values Temp 3 T1 T2 T3 Mois 3 W1 W2 W3 Rep 3 1 2 3 VI 25 0.095 0.151 0.164 0.191 0.193 0.205 0.273 0.334 1.956 1.964 2.055 2.41 2.53 2.554 2.602 2.609 2.634 2.638 2.642 2.864 2.912 2.944 2.992 3.031 3.043 Number of observations 27 Effect of temperature and moist on NO3 release 08:50 Sunday, November 28, 2008 3 The GLM Procedure
Dependent Variable: VI NO3 Sum of Source DF Squares Mean Square F Value Pr > F Model 8 36.92927941 4.61615993 986.31 <.0001 Error 18 0.08424400 0.00468022 Corrected Total 26 37.01352341 R-Square Coeff Var Root MSE VI Mean 0.997724 3.789836 0.068412 1.805148 Source DF Type I SS Mean Square F Value Pr > F Temp 2 35.11181896 17.55590948 3751.08 <.0001 Mois 2 0.59937607 0.29968804 64.03 <.0001 Temp*Mois 4 1.21808437 0.30452109 65.07 <.0001 Source DF Type III SS Mean Square F Value Pr > F Temp 2 35.11181896 17.55590948 3751.08 <.0001 Mois 2 0.59937607 0.29968804 64.03 <.0001 Temp*Mois 4 1.21808437 0.30452109 65.07 <.0001 Effect of temperature and moist on NO3 release 08:50 Sunday, November 28, 2008 The GLM Procedure Tukey's Studentized Range (HSD) Test for VI NOTE: This test controls the Type I experimentwise error rate, but it generally has a higher Type II error rate than REGWQ. Alpha 0.05
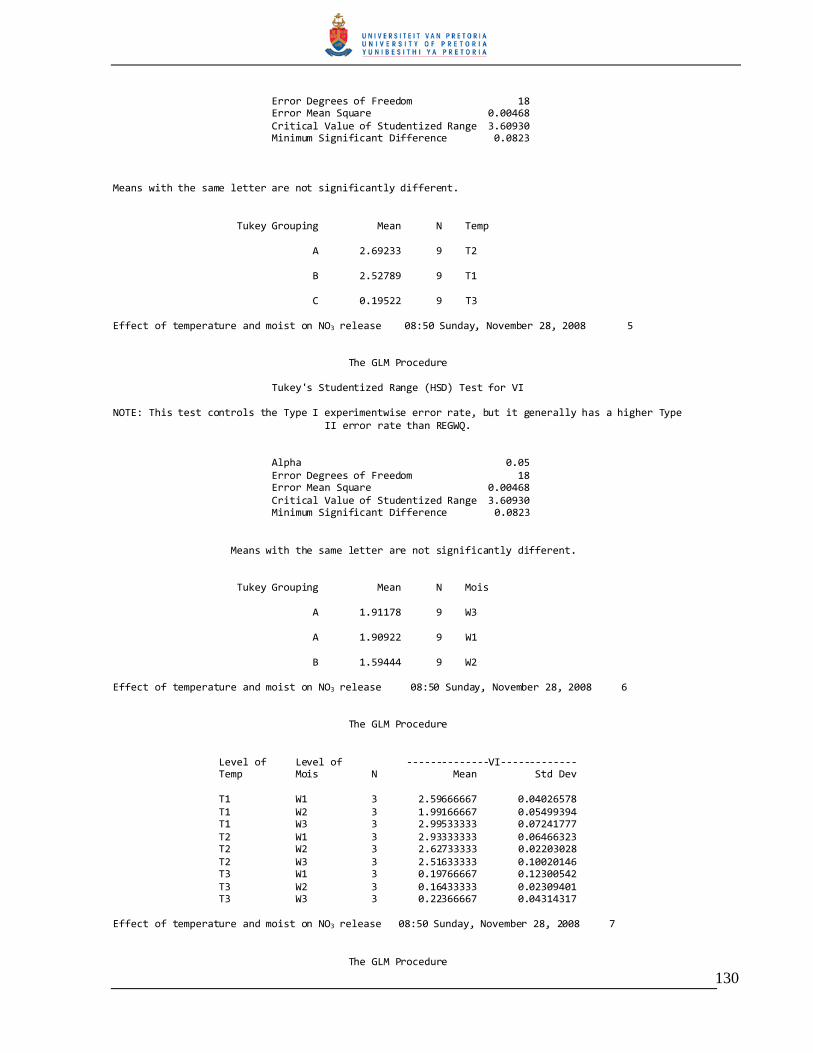
130
Error Degrees of Freedom 18 Error Mean Square 0.00468 Critical Value of Studentized Range 3.60930 Minimum Significant Difference 0.0823 Means with the same letter are not significantly different. Tukey Grouping Mean N Temp A 2.69233 9 T2 B 2.52789 9 T1 C 0.19522 9 T3 Effect of temperature and moist on NO3 release 08:50 Sunday, November 28, 2008 5 The GLM Procedure Tukey's Studentized Range (HSD) Test for VI NOTE: This test controls the Type I experimentwise error rate, but it generally has a higher Type II error rate than REGWQ. Alpha 0.05 Error Degrees of Freedom 18 Error Mean Square 0.00468 Critical Value of Studentized Range 3.60930 Minimum Significant Difference 0.0823 Means with the same letter are not significantly different. Tukey Grouping Mean N Mois A 1.91178 9 W3 A 1.90922 9 W1 B 1.59444 9 W2 Effect of temperature and moist on NO3 release 08:50 Sunday, November 28, 2008 6 The GLM Procedure Level of Level of --------------VI------------- Temp Mois N Mean Std Dev T1 W1 3 2.59666667 0.04026578 T1 W2 3 1.99166667 0.05499394 T1 W3 3 2.99533333 0.07241777 T2 W1 3 2.93333333 0.06466323 T2 W2 3 2.62733333 0.02203028 T2 W3 3 2.51633333 0.10020146 T3 W1 3 0.19766667 0.12300542 T3 W2 3 0.16433333 0.02309401 T3 W3 3 0.22366667 0.04314317 Effect of temperature and moist on NO3 release 08:50 Sunday, November 28, 2008 7 The GLM Procedure
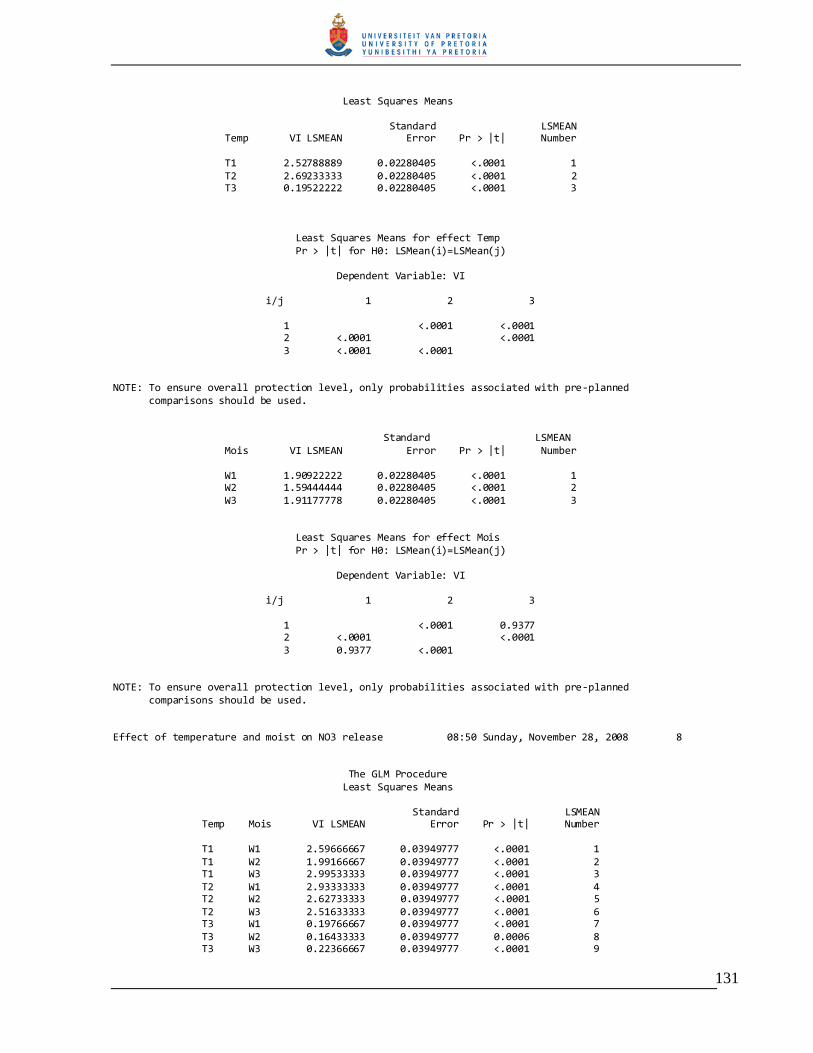
131
Least Squares Means Standard LSMEAN Temp VI LSMEAN Error Pr > |t| Number T1 2.52788889 0.02280405 <.0001 1 T2 2.69233333 0.02280405 <.0001 2 T3 0.19522222 0.02280405 <.0001 3 Least Squares Means for effect Temp Pr > |t| for H0: LSMean(i)=LSMean(j) Dependent Variable: VI i/j 1 2 3 1 <.0001 <.0001 2 <.0001 <.0001 3 <.0001 <.0001 NOTE: To ensure overall protection level, only probabilities associated with pre-planned comparisons should be used. Standard LSMEAN Mois VI LSMEAN Error Pr > |t| Number W1 1.90922222 0.02280405 <.0001 1 W2 1.59444444 0.02280405 <.0001 2 W3 1.91177778 0.02280405 <.0001 3 Least Squares Means for effect Mois Pr > |t| for H0: LSMean(i)=LSMean(j) Dependent Variable: VI i/j 1 2 3 1 <.0001 0.9377 2 <.0001 <.0001 3 0.9377 <.0001 NOTE: To ensure overall protection level, only probabilities associated with pre-planned comparisons should be used. Effect of temperature and moist on NO3 release 08:50 Sunday, November 28, 2008 8 The GLM Procedure Least Squares Means Standard LSMEAN Temp Mois VI LSMEAN Error Pr > |t| Number T1 W1 2.59666667 0.03949777 <.0001 1 T1 W2 1.99166667 0.03949777 <.0001 2 T1 W3 2.99533333 0.03949777 <.0001 3 T2 W1 2.93333333 0.03949777 <.0001 4 T2 W2 2.62733333 0.03949777 <.0001 5 T2 W3 2.51633333 0.03949777 <.0001 6 T3 W1 0.19766667 0.03949777 <.0001 7 T3 W2 0.16433333 0.03949777 0.0006 8 T3 W3 0.22366667 0.03949777 <.0001 9

132
Least Squares Means for effect Temp*Mois Pr > |t| for H0: LSMean(i)=LSMean(j) Dependent Variable: VI i/j 1 2 3 4 5 6 7 8 9 1 <.0001 <.0001 <.0001 0.5897 0.1675 <.0001 <.0001 <.0001 2 <.0001 <.0001 <.0001 <.0001 <.0001 <.0001 <.0001 <.0001 3 <.0001 <.0001 0.2816 <.0001 <.0001 <.0001 <.0001 <.0001 4 <.0001 <.0001 0.2816 <.0001 <.0001 <.0001 <.0001 <.0001 5 0.5897 <.0001 <.0001 <.0001 0.0623 <.0001 <.0001 <.0001 6 0.1675 <.0001 <.0001 <.0001 0.0623 <.0001 <.0001 <.0001 7 <.0001 <.0001 <.0001 <.0001 <.0001 <.0001 0.5581 0.6472 8 <.0001 <.0001 <.0001 <.0001 <.0001 <.0001 0.5581 0.3022 9 <.0001 <.0001 <.0001 <.0001 <.0001 <.0001 0.6472 0.3022 NOTE: To ensure overall protection level, only probabilities associated with pre-planned comparisons should be used. Effect of temperature and moist on NO3 release-day 56 08:50 Sunday, November 28, 2008 9 The UNIVARIATE Procedure Variable: VI (NO3) Moments N 27 Sum Weights 27 Mean 1.80514815 Sum Observations 48.739 Std Deviation 1.19314586 Variance 1.42359705 Skewness -0.5870878 Kurtosis -1.5745519 Uncorrected SS 124.994639 Corrected SS 37.0135234 Coeff Variation 66.096839 Std Error Mean 0.22962103
Basic Statistical Measures Location Variability Mean 1.805148 Std Deviation 1.19315 Median 2.530000 Variance 1.42360 Mode 0.151000 Range 2.94800 Interquartile Range 2.43700 NOTE: The mode displayed is the smallest of 2 modes with a count of 2. Tests for Location: Mu0=0 Test -Statistic- -----p Value------ Student's t t 7.861423 Pr > |t| <.0001 Sign M 13.5 Pr >= |M| <.0001 Signed Rank S 189 Pr >= |S| <.0001 Tests for Normality Test --Statistic--- -----p Value------ Shapiro-Wilk W 0.764426 Pr < W <0.0001 Kolmogorov-Smirnov D 0.249457 Pr > D <0.0100 Cramer-von Mises W-Sq 0.459846 Pr > W-Sq <0.0050 Anderson-Darling A-Sq 2.75771 Pr > A-Sq <0.0050
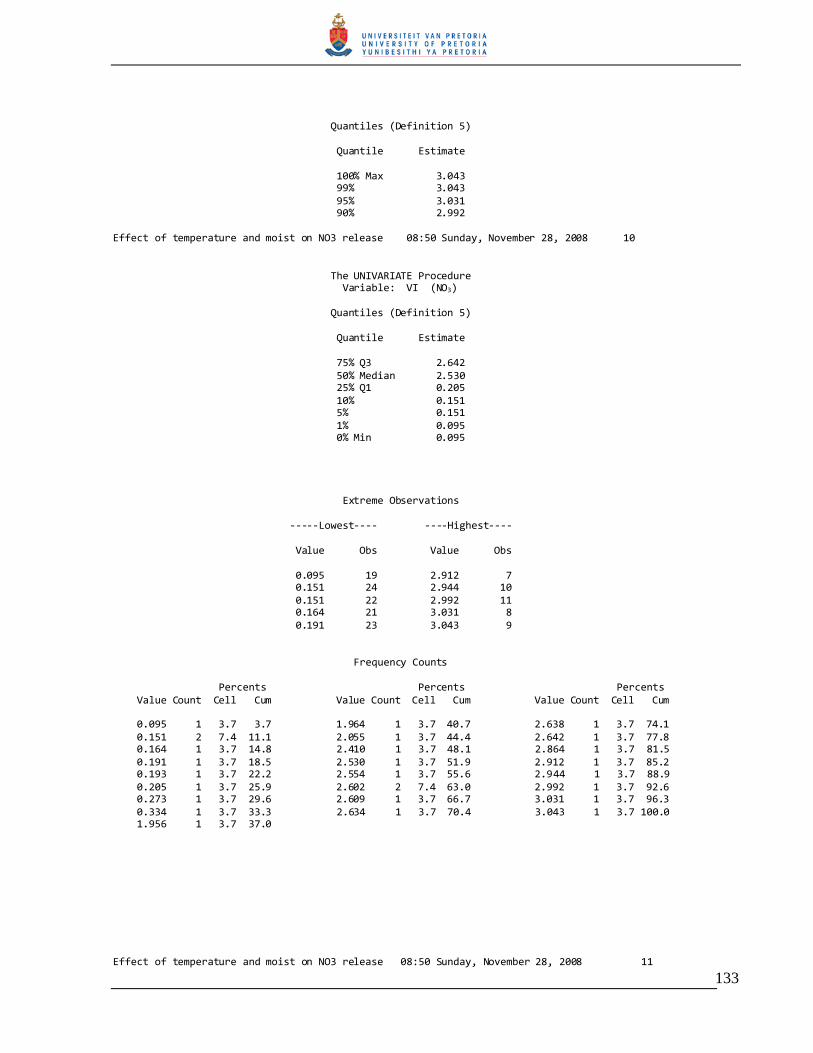
133
Quantiles (Definition 5) Quantile Estimate 100% Max 3.043 99% 3.043 95% 3.031 90% 2.992 Effect of temperature and moist on NO3 release 08:50 Sunday, November 28, 2008 10 The UNIVARIATE Procedure Variable: VI (NO3) Quantiles (Definition 5) Quantile Estimate 75% Q3 2.642 50% Median 2.530 25% Q1 0.205 10% 0.151 5% 0.151 1% 0.095 0% Min 0.095 Extreme Observations -----Lowest---- ----Highest---- Value Obs Value Obs 0.095 19 2.912 7 0.151 24 2.944 10 0.151 22 2.992 11 0.164 21 3.031 8 0.191 23 3.043 9 Frequency Counts Percents Percents Percents Value Count Cell Cum Value Count Cell Cum Value Count Cell Cum 0.095 1 3.7 3.7 1.964 1 3.7 40.7 2.638 1 3.7 74.1 0.151 2 7.4 11.1 2.055 1 3.7 44.4 2.642 1 3.7 77.8 0.164 1 3.7 14.8 2.410 1 3.7 48.1 2.864 1 3.7 81.5 0.191 1 3.7 18.5 2.530 1 3.7 51.9 2.912 1 3.7 85.2 0.193 1 3.7 22.2 2.554 1 3.7 55.6 2.944 1 3.7 88.9 0.205 1 3.7 25.9 2.602 2 7.4 63.0 2.992 1 3.7 92.6 0.273 1 3.7 29.6 2.609 1 3.7 66.7 3.031 1 3.7 96.3 0.334 1 3.7 33.3 2.634 1 3.7 70.4 3.043 1 3.7 100.0 1.956 1 3.7 37.0 Effect of temperature and moist on NO3 release 08:50 Sunday, November 28, 2008 11

134
The UNIVARIATE Procedure Variable: VI (NO3) Stem Leaf # Boxplot 3 000 3 | 2 56666666999 11 +-----+ 2 0014 4 | | 1 | + | 1 | | 0 | | 0 122222233 9 +-----+ ----+----+----+----+ Normal Probability Plot 3.25+ ++++ * * | *** *****+** * | ** ++++ 1.75+ **++++ | ++++ | ++++ 0.25+ * *++++** **** +----+----+----+----+----+----+----+----+----+----+ -2 -1 0 +1 +2
A2.2 Unstable ‘Olifantsfontein’ sewage sludge amended soil NH4+ and NO3
-
Effect of temperature and moist on NH4 and NO3 release 12:58 Sunday, December 12, 2008 1 Obs Temp Moist Rep V1 V2 1 T1 W1 1 5.842 0.265 2 T1 W1 2 6.201 0.186 3 T1 W1 3 6.041 0.265 4 T1 W2 1 5.773 0.040 5 T1 W2 2 5.813 0.159 6 T1 W2 3 5.773 0.159 7 T1 W3 1 5.494 0.345 8 T1 W3 2 5.391 0.225 9 T1 W3 3 5.431 0.265 10 T2 W1 1 4.183 1.300 11 T2 W1 2 5.111 1.180 12 T2 W1 3 4.274 1.220 13 T2 W2 1 5.364 0.383 14 T2 W2 2 5.404 0.483 15 T2 W2 3 5.404 0.443 16 T2 W3 1 6.626 0.848 17 T2 W3 2 6.466 0.728 18 T2 W3 3 6.546 0.768 19 T3 W1 1 7.014 0.223 20 T3 W1 2 7.452 0.143 21 T3 W1 3 7.293 0.203 22 T3 W2 1 8.711 0.172 23 T3 W2 2 9.069 0.133 24 T3 W2 3 9.308 0.172 25 T3 W3 1 10.490 0.146 26 T3 W3 2 10.730 0.106 27 T3 W3 3 9.852 0.106 Effect of temperature and moist on NH4 and NO3 release 12:58 Sunday, December 12, 2008 2 The GLM Procedure
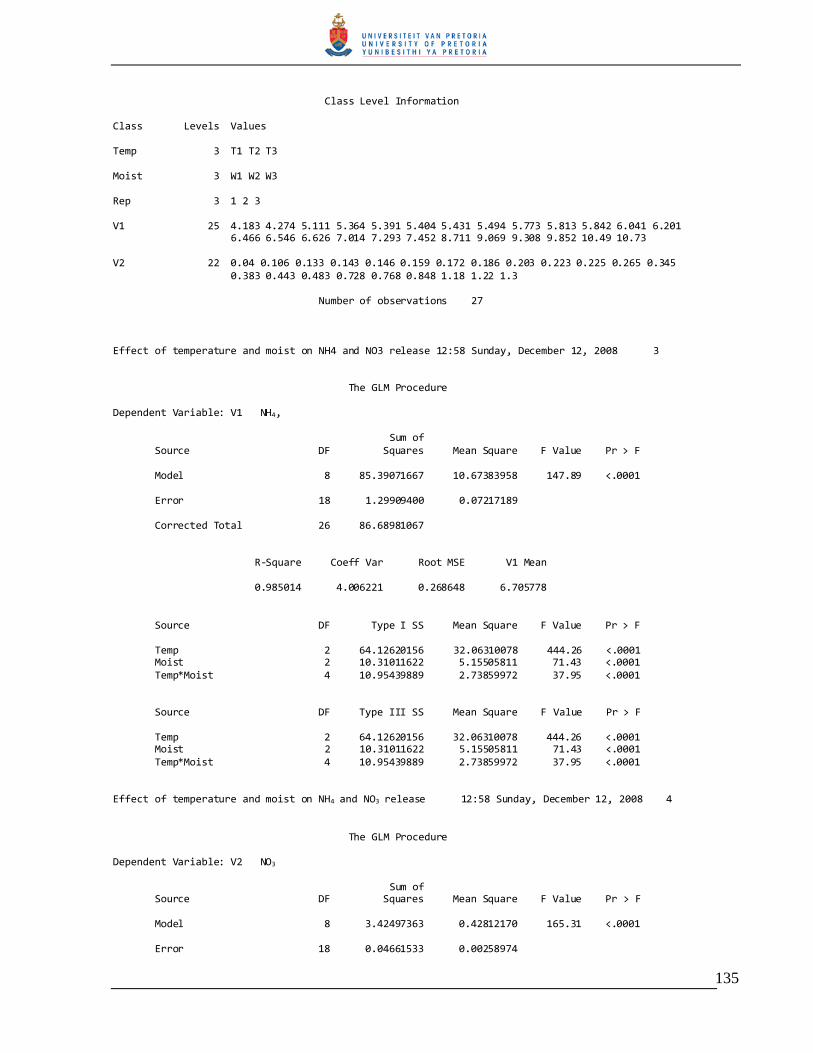
135
Class Level Information Class Levels Values Temp 3 T1 T2 T3 Moist 3 W1 W2 W3 Rep 3 1 2 3 V1 25 4.183 4.274 5.111 5.364 5.391 5.404 5.431 5.494 5.773 5.813 5.842 6.041 6.201 6.466 6.546 6.626 7.014 7.293 7.452 8.711 9.069 9.308 9.852 10.49 10.73 V2 22 0.04 0.106 0.133 0.143 0.146 0.159 0.172 0.186 0.203 0.223 0.225 0.265 0.345 0.383 0.443 0.483 0.728 0.768 0.848 1.18 1.22 1.3 Number of observations 27 Effect of temperature and moist on NH4 and NO3 release 12:58 Sunday, December 12, 2008 3 The GLM Procedure Dependent Variable: V1 NH4, Sum of Source DF Squares Mean Square F Value Pr > F Model 8 85.39071667 10.67383958 147.89 <.0001 Error 18 1.29909400 0.07217189 Corrected Total 26 86.68981067 R-Square Coeff Var Root MSE V1 Mean 0.985014 4.006221 0.268648 6.705778 Source DF Type I SS Mean Square F Value Pr > F Temp 2 64.12620156 32.06310078 444.26 <.0001 Moist 2 10.31011622 5.15505811 71.43 <.0001 Temp*Moist 4 10.95439889 2.73859972 37.95 <.0001 Source DF Type III SS Mean Square F Value Pr > F Temp 2 64.12620156 32.06310078 444.26 <.0001 Moist 2 10.31011622 5.15505811 71.43 <.0001 Temp*Moist 4 10.95439889 2.73859972 37.95 <.0001 Effect of temperature and moist on NH4 and NO3 release 12:58 Sunday, December 12, 2008 4 The GLM Procedure Dependent Variable: V2 NO3 Sum of Source DF Squares Mean Square F Value Pr > F Model 8 3.42497363 0.42812170 165.31 <.0001 Error 18 0.04661533 0.00258974
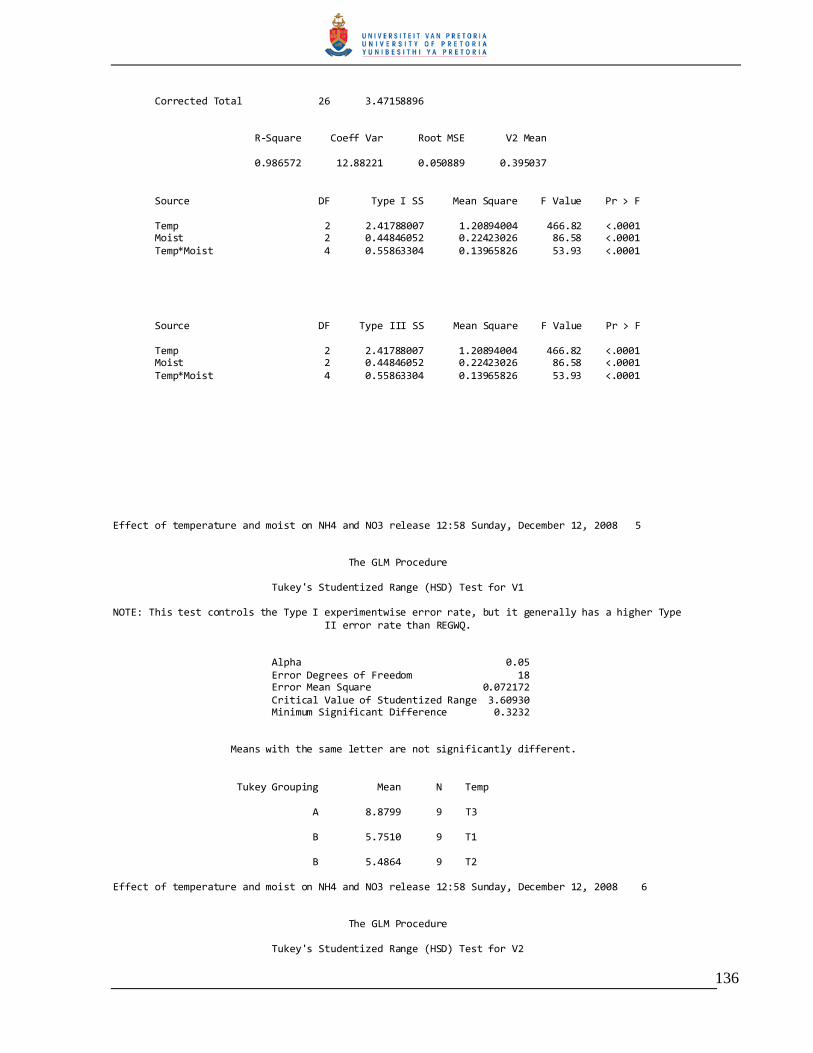
136
Corrected Total 26 3.47158896 R-Square Coeff Var Root MSE V2 Mean 0.986572 12.88221 0.050889 0.395037 Source DF Type I SS Mean Square F Value Pr > F Temp 2 2.41788007 1.20894004 466.82 <.0001 Moist 2 0.44846052 0.22423026 86.58 <.0001 Temp*Moist 4 0.55863304 0.13965826 53.93 <.0001 Source DF Type III SS Mean Square F Value Pr > F Temp 2 2.41788007 1.20894004 466.82 <.0001 Moist 2 0.44846052 0.22423026 86.58 <.0001 Temp*Moist 4 0.55863304 0.13965826 53.93 <.0001 Effect of temperature and moist on NH4 and NO3 release 12:58 Sunday, December 12, 2008 5 The GLM Procedure Tukey's Studentized Range (HSD) Test for V1 NOTE: This test controls the Type I experimentwise error rate, but it generally has a higher Type II error rate than REGWQ. Alpha 0.05 Error Degrees of Freedom 18 Error Mean Square 0.072172 Critical Value of Studentized Range 3.60930 Minimum Significant Difference 0.3232 Means with the same letter are not significantly different. Tukey Grouping Mean N Temp A 8.8799 9 T3 B 5.7510 9 T1 B 5.4864 9 T2 Effect of temperature and moist on NH4 and NO3 release 12:58 Sunday, December 12, 2008 6 The GLM Procedure Tukey's Studentized Range (HSD) Test for V2
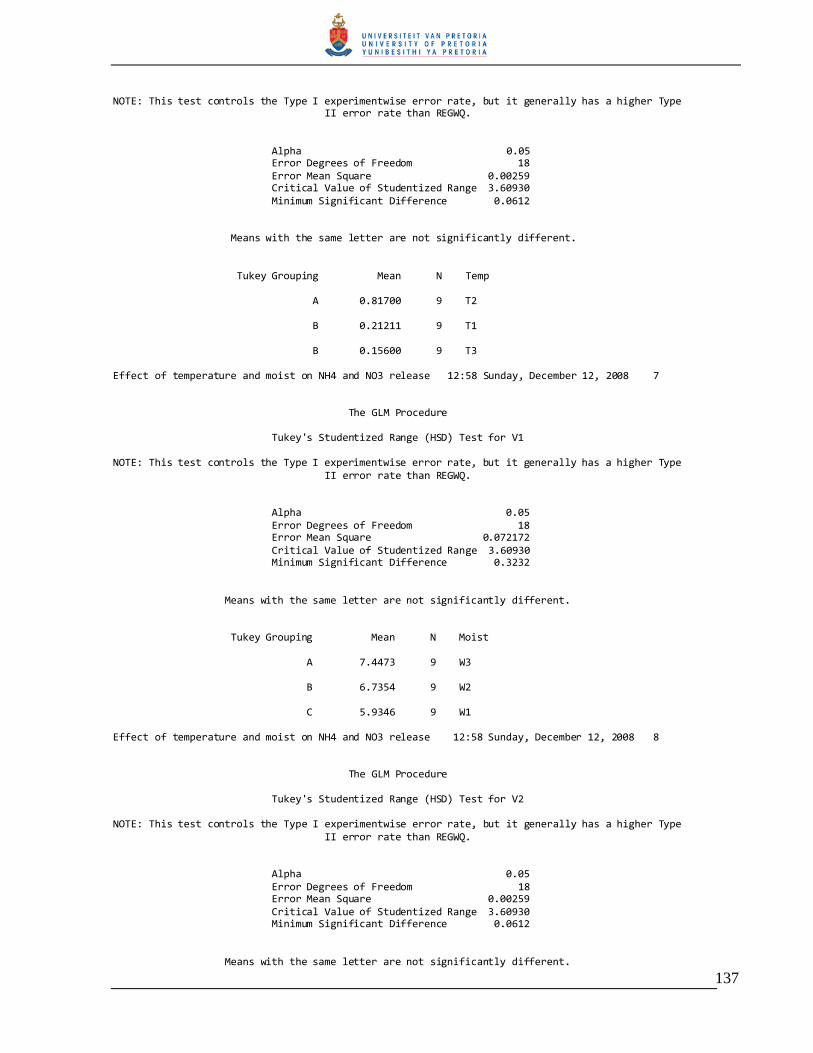
137
NOTE: This test controls the Type I experimentwise error rate, but it generally has a higher Type II error rate than REGWQ. Alpha 0.05 Error Degrees of Freedom 18 Error Mean Square 0.00259 Critical Value of Studentized Range 3.60930 Minimum Significant Difference 0.0612 Means with the same letter are not significantly different. Tukey Grouping Mean N Temp A 0.81700 9 T2 B 0.21211 9 T1 B 0.15600 9 T3 Effect of temperature and moist on NH4 and NO3 release 12:58 Sunday, December 12, 2008 7 The GLM Procedure Tukey's Studentized Range (HSD) Test for V1 NOTE: This test controls the Type I experimentwise error rate, but it generally has a higher Type II error rate than REGWQ. Alpha 0.05 Error Degrees of Freedom 18 Error Mean Square 0.072172 Critical Value of Studentized Range 3.60930 Minimum Significant Difference 0.3232 Means with the same letter are not significantly different. Tukey Grouping Mean N Moist A 7.4473 9 W3 B 6.7354 9 W2 C 5.9346 9 W1 Effect of temperature and moist on NH4 and NO3 release 12:58 Sunday, December 12, 2008 8 The GLM Procedure Tukey's Studentized Range (HSD) Test for V2 NOTE: This test controls the Type I experimentwise error rate, but it generally has a higher Type II error rate than REGWQ. Alpha 0.05 Error Degrees of Freedom 18 Error Mean Square 0.00259 Critical Value of Studentized Range 3.60930 Minimum Significant Difference 0.0612 Means with the same letter are not significantly different.
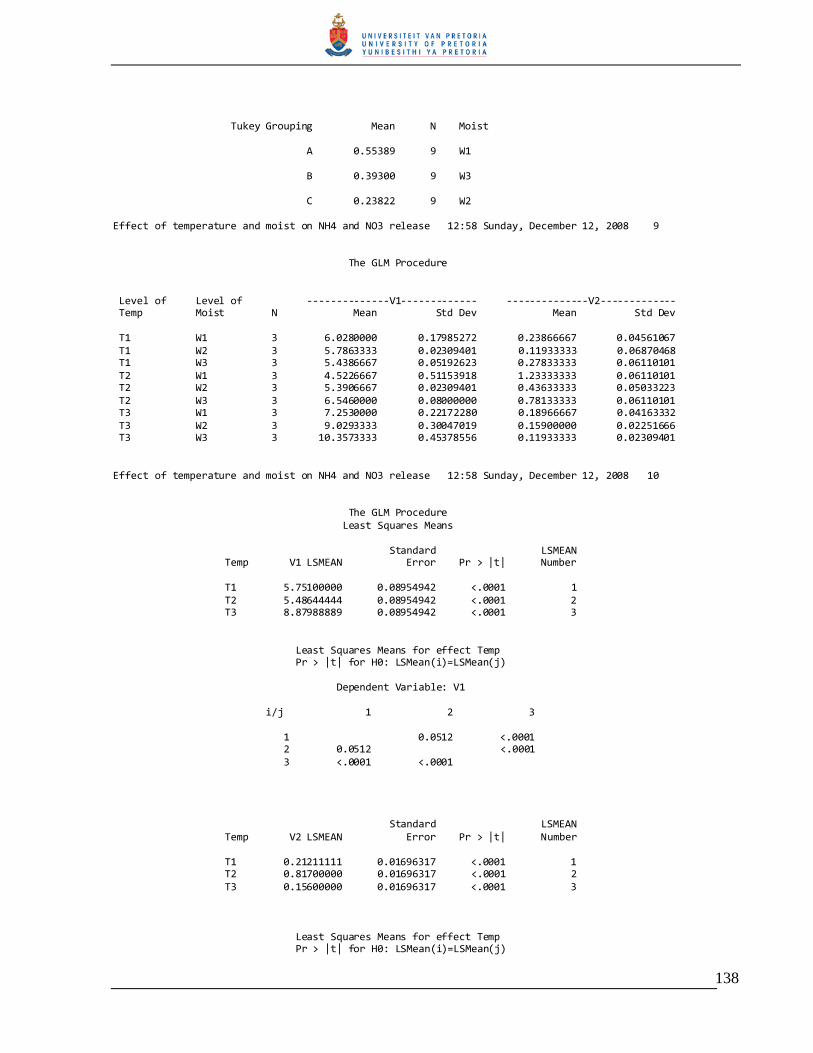
138
Tukey Grouping Mean N Moist A 0.55389 9 W1 B 0.39300 9 W3 C 0.23822 9 W2 Effect of temperature and moist on NH4 and NO3 release 12:58 Sunday, December 12, 2008 9 The GLM Procedure Level of Level of --------------V1------------- --------------V2------------- Temp Moist N Mean Std Dev Mean Std Dev T1 W1 3 6.0280000 0.17985272 0.23866667 0.04561067 T1 W2 3 5.7863333 0.02309401 0.11933333 0.06870468 T1 W3 3 5.4386667 0.05192623 0.27833333 0.06110101 T2 W1 3 4.5226667 0.51153918 1.23333333 0.06110101 T2 W2 3 5.3906667 0.02309401 0.43633333 0.05033223 T2 W3 3 6.5460000 0.08000000 0.78133333 0.06110101 T3 W1 3 7.2530000 0.22172280 0.18966667 0.04163332 T3 W2 3 9.0293333 0.30047019 0.15900000 0.02251666 T3 W3 3 10.3573333 0.45378556 0.11933333 0.02309401 Effect of temperature and moist on NH4 and NO3 release 12:58 Sunday, December 12, 2008 10 The GLM Procedure Least Squares Means Standard LSMEAN Temp V1 LSMEAN Error Pr > |t| Number T1 5.75100000 0.08954942 <.0001 1 T2 5.48644444 0.08954942 <.0001 2 T3 8.87988889 0.08954942 <.0001 3 Least Squares Means for effect Temp Pr > |t| for H0: LSMean(i)=LSMean(j) Dependent Variable: V1 i/j 1 2 3 1 0.0512 <.0001 2 0.0512 <.0001 3 <.0001 <.0001 Standard LSMEAN Temp V2 LSMEAN Error Pr > |t| Number T1 0.21211111 0.01696317 <.0001 1 T2 0.81700000 0.01696317 <.0001 2 T3 0.15600000 0.01696317 <.0001 3 Least Squares Means for effect Temp Pr > |t| for H0: LSMean(i)=LSMean(j)

139
Dependent Variable: V2 i/j 1 2 3 1 <.0001 0.0311 2 <.0001 <.0001 3 0.0311 <.0001 NOTE: To ensure overall protection level, only probabilities associated with pre-planned comparisons should be used. Standard LSMEAN Moist V1 LSMEAN Error Pr > |t| Number W1 5.93455556 0.08954942 <.0001 1 W2 6.73544444 0.08954942 <.0001 2 Effect of temperature and moist on NH4 and NO3 release 12:58 Sunday, December 12, 2008 11 The GLM Procedure Least Squares Means Standard LSMEAN Moist V1 LSMEAN Error Pr > |t| Number W3 7.44733333 0.08954942 <.0001 3 Least Squares Means for effect Moist Pr > |t| for H0: LSMean(i)=LSMean(j) Dependent Variable: V1 i/j 1 2 3 1 <.0001 <.0001 2 <.0001 <.0001 3 <.0001 <.0001 Standard LSMEAN Moist V2 LSMEAN Error Pr > |t| Number W1 0.55388889 0.01696317 <.0001 1 W2 0.23822222 0.01696317 <.0001 2 W3 0.39300000 0.01696317 <.0001 3 Least Squares Means for effect Moist Pr > |t| for H0: LSMean(i)=LSMean(j) Dependent Variable: V2 i/j 1 2 3 1 <.0001 <.0001 2 <.0001 <.0001 3 <.0001 <.0001 NOTE: To ensure overall protection level, only probabilities associated with pre-planned comparisons should be used.
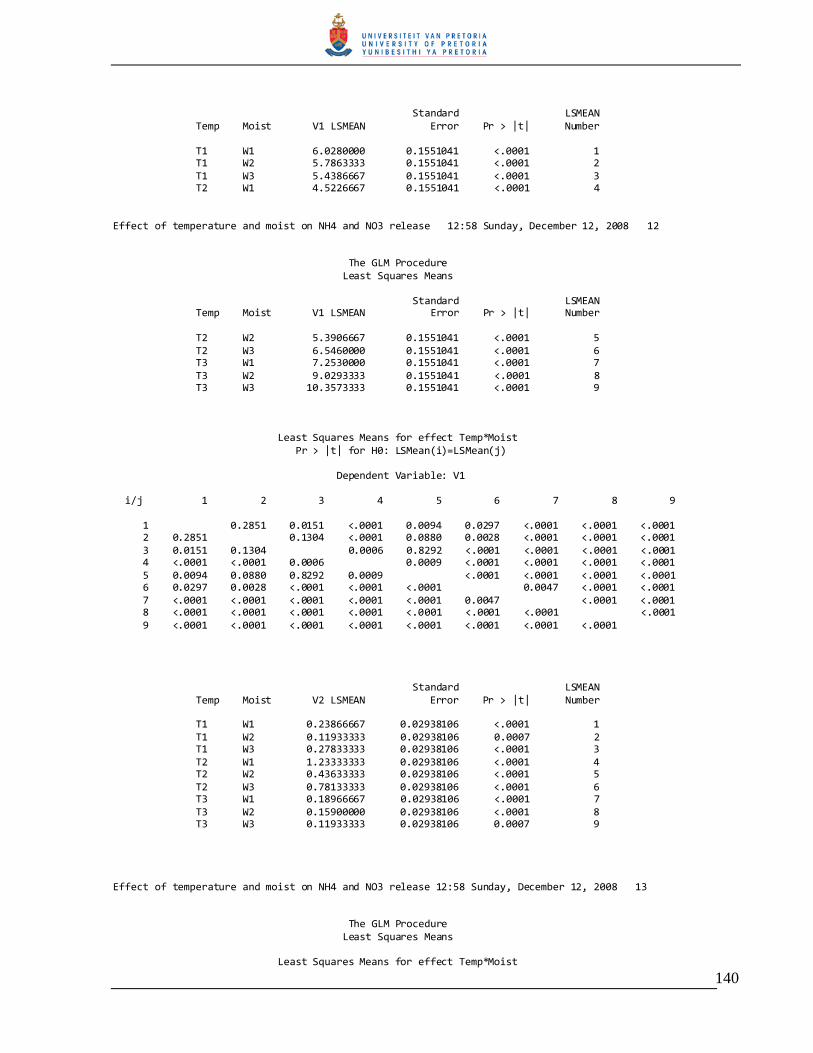
140
Standard LSMEAN Temp Moist V1 LSMEAN Error Pr > |t| Number T1 W1 6.0280000 0.1551041 <.0001 1 T1 W2 5.7863333 0.1551041 <.0001 2 T1 W3 5.4386667 0.1551041 <.0001 3 T2 W1 4.5226667 0.1551041 <.0001 4 Effect of temperature and moist on NH4 and NO3 release 12:58 Sunday, December 12, 2008 12 The GLM Procedure Least Squares Means Standard LSMEAN Temp Moist V1 LSMEAN Error Pr > |t| Number T2 W2 5.3906667 0.1551041 <.0001 5 T2 W3 6.5460000 0.1551041 <.0001 6 T3 W1 7.2530000 0.1551041 <.0001 7 T3 W2 9.0293333 0.1551041 <.0001 8 T3 W3 10.3573333 0.1551041 <.0001 9 Least Squares Means for effect Temp*Moist Pr > |t| for H0: LSMean(i)=LSMean(j) Dependent Variable: V1 i/j 1 2 3 4 5 6 7 8 9 1 0.2851 0.0151 <.0001 0.0094 0.0297 <.0001 <.0001 <.0001 2 0.2851 0.1304 <.0001 0.0880 0.0028 <.0001 <.0001 <.0001 3 0.0151 0.1304 0.0006 0.8292 <.0001 <.0001 <.0001 <.0001 4 <.0001 <.0001 0.0006 0.0009 <.0001 <.0001 <.0001 <.0001 5 0.0094 0.0880 0.8292 0.0009 <.0001 <.0001 <.0001 <.0001 6 0.0297 0.0028 <.0001 <.0001 <.0001 0.0047 <.0001 <.0001 7 <.0001 <.0001 <.0001 <.0001 <.0001 0.0047 <.0001 <.0001 8 <.0001 <.0001 <.0001 <.0001 <.0001 <.0001 <.0001 <.0001 9 <.0001 <.0001 <.0001 <.0001 <.0001 <.0001 <.0001 <.0001 Standard LSMEAN Temp Moist V2 LSMEAN Error Pr > |t| Number T1 W1 0.23866667 0.02938106 <.0001 1 T1 W2 0.11933333 0.02938106 0.0007 2 T1 W3 0.27833333 0.02938106 <.0001 3 T2 W1 1.23333333 0.02938106 <.0001 4 T2 W2 0.43633333 0.02938106 <.0001 5 T2 W3 0.78133333 0.02938106 <.0001 6 T3 W1 0.18966667 0.02938106 <.0001 7 T3 W2 0.15900000 0.02938106 <.0001 8 T3 W3 0.11933333 0.02938106 0.0007 9 Effect of temperature and moist on NH4 and NO3 release 12:58 Sunday, December 12, 2008 13 The GLM Procedure Least Squares Means Least Squares Means for effect Temp*Moist
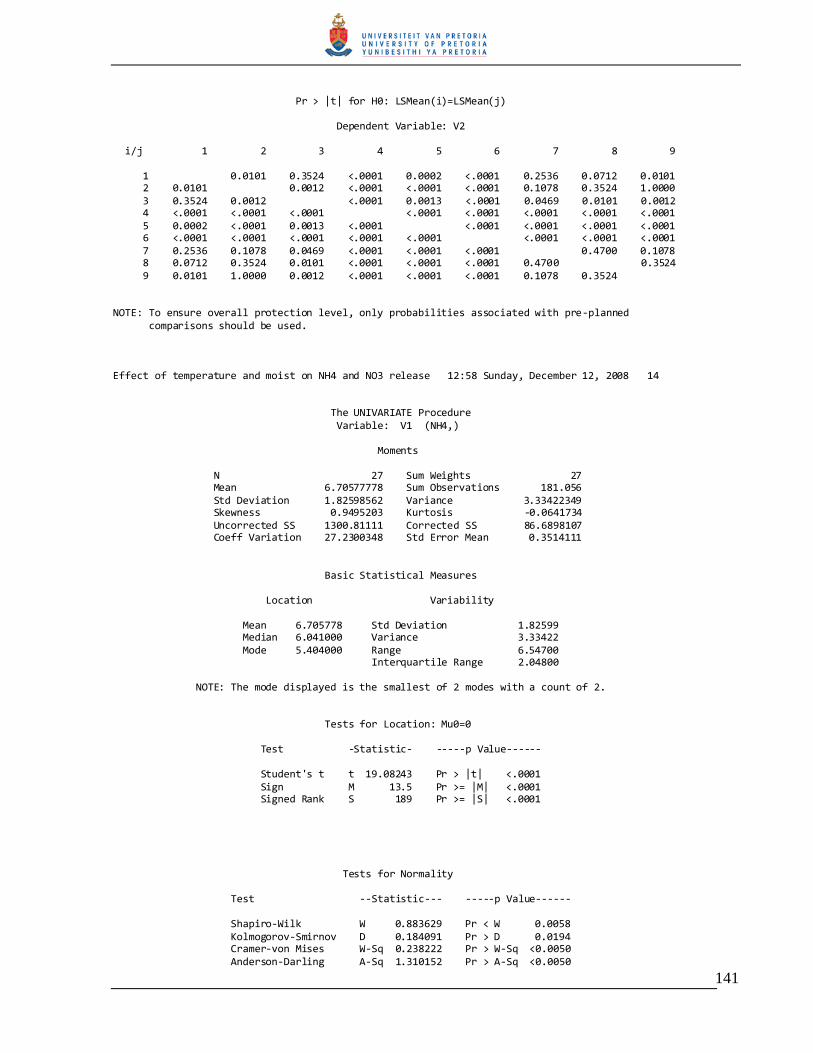
141
Pr > |t| for H0: LSMean(i)=LSMean(j) Dependent Variable: V2 i/j 1 2 3 4 5 6 7 8 9 1 0.0101 0.3524 <.0001 0.0002 <.0001 0.2536 0.0712 0.0101 2 0.0101 0.0012 <.0001 <.0001 <.0001 0.1078 0.3524 1.0000 3 0.3524 0.0012 <.0001 0.0013 <.0001 0.0469 0.0101 0.0012 4 <.0001 <.0001 <.0001 <.0001 <.0001 <.0001 <.0001 <.0001 5 0.0002 <.0001 0.0013 <.0001 <.0001 <.0001 <.0001 <.0001 6 <.0001 <.0001 <.0001 <.0001 <.0001 <.0001 <.0001 <.0001 7 0.2536 0.1078 0.0469 <.0001 <.0001 <.0001 0.4700 0.1078 8 0.0712 0.3524 0.0101 <.0001 <.0001 <.0001 0.4700 0.3524 9 0.0101 1.0000 0.0012 <.0001 <.0001 <.0001 0.1078 0.3524 NOTE: To ensure overall protection level, only probabilities associated with pre-planned comparisons should be used. Effect of temperature and moist on NH4 and NO3 release 12:58 Sunday, December 12, 2008 14 The UNIVARIATE Procedure Variable: V1 (NH4,) Moments N 27 Sum Weights 27 Mean 6.70577778 Sum Observations 181.056 Std Deviation 1.82598562 Variance 3.33422349 Skewness 0.9495203 Kurtosis -0.0641734 Uncorrected SS 1300.81111 Corrected SS 86.6898107 Coeff Variation 27.2300348 Std Error Mean 0.3514111 Basic Statistical Measures Location Variability Mean 6.705778 Std Deviation 1.82599 Median 6.041000 Variance 3.33422 Mode 5.404000 Range 6.54700 Interquartile Range 2.04800 NOTE: The mode displayed is the smallest of 2 modes with a count of 2. Tests for Location: Mu0=0 Test -Statistic- -----p Value------ Student's t t 19.08243 Pr > |t| <.0001 Sign M 13.5 Pr >= |M| <.0001 Signed Rank S 189 Pr >= |S| <.0001 Tests for Normality Test --Statistic--- -----p Value------ Shapiro-Wilk W 0.883629 Pr < W 0.0058 Kolmogorov-Smirnov D 0.184091 Pr > D 0.0194 Cramer-von Mises W-Sq 0.238222 Pr > W-Sq <0.0050 Anderson-Darling A-Sq 1.310152 Pr > A-Sq <0.0050
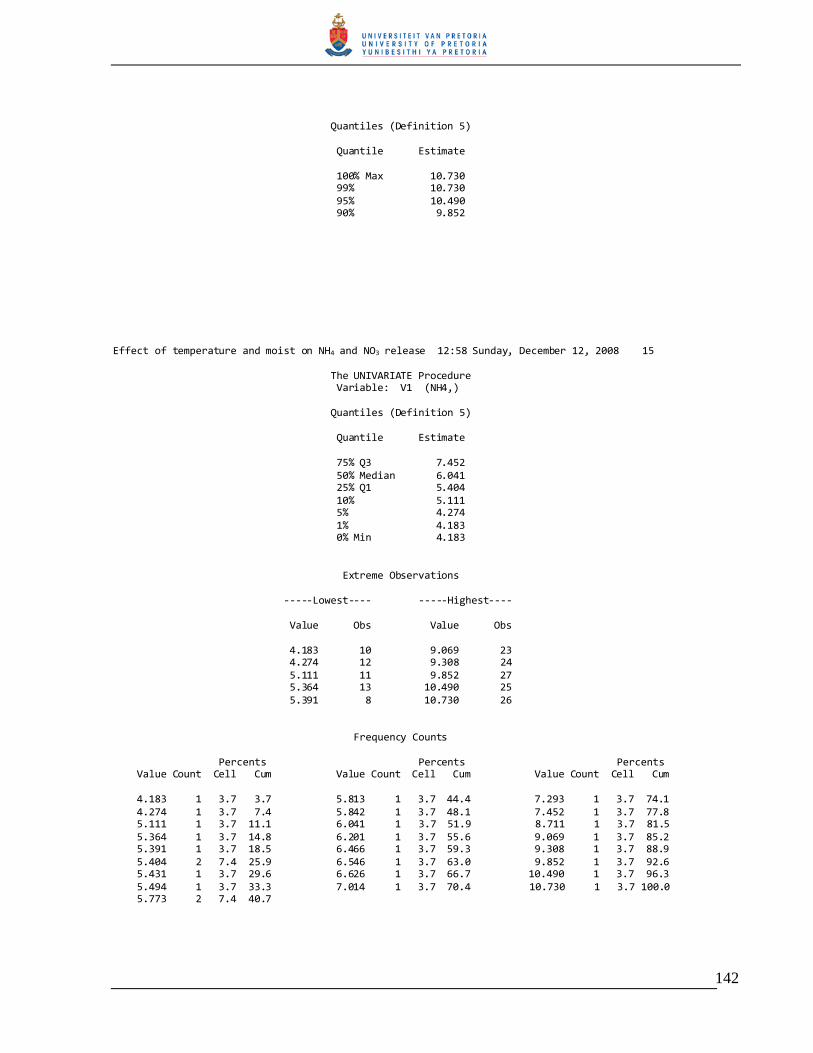
142
Quantiles (Definition 5) Quantile Estimate 100% Max 10.730 99% 10.730 95% 10.490 90% 9.852 Effect of temperature and moist on NH4 and NO3 release 12:58 Sunday, December 12, 2008 15 The UNIVARIATE Procedure Variable: V1 (NH4,) Quantiles (Definition 5) Quantile Estimate 75% Q3 7.452 50% Median 6.041 25% Q1 5.404 10% 5.111 5% 4.274 1% 4.183 0% Min 4.183 Extreme Observations -----Lowest---- -----Highest---- Value Obs Value Obs 4.183 10 9.069 23 4.274 12 9.308 24 5.111 11 9.852 27 5.364 13 10.490 25 5.391 8 10.730 26 Frequency Counts Percents Percents Percents Value Count Cell Cum Value Count Cell Cum Value Count Cell Cum 4.183 1 3.7 3.7 5.813 1 3.7 44.4 7.293 1 3.7 74.1 4.274 1 3.7 7.4 5.842 1 3.7 48.1 7.452 1 3.7 77.8 5.111 1 3.7 11.1 6.041 1 3.7 51.9 8.711 1 3.7 81.5 5.364 1 3.7 14.8 6.201 1 3.7 55.6 9.069 1 3.7 85.2 5.391 1 3.7 18.5 6.466 1 3.7 59.3 9.308 1 3.7 88.9 5.404 2 7.4 25.9 6.546 1 3.7 63.0 9.852 1 3.7 92.6 5.431 1 3.7 29.6 6.626 1 3.7 66.7 10.490 1 3.7 96.3 5.494 1 3.7 33.3 7.014 1 3.7 70.4 10.730 1 3.7 100.0 5.773 2 7.4 40.7

143
Effect of temperature and moist on NH4 and NO3 release 12:58 Sunday, December 12, 2008 16 The UNIVARIATE Procedure Variable: V1 (NH4,) Stem Leaf # Boxplot 10 57 2 0 9 139 3 | 8 7 1 | 7 035 3 +-----+ 6 02556 5 *--+--* 5 14444458888 11 +-----+ 4 23 2 | ----+----+----+----+ Normal Probability Plot 10.5+ * +*+++ | ** *+++++ | *++++ 7.5+ +++*** | +++***** | * **+*+*** ** 4.5+ * * +++++ +----+----+----+----+----+----+----+----+----+----+ -2 -1 0 +1 +2 Effect of temperature and moist on NH4 and NO3 release 12:58 Sunday, December 12, 2008 17 The UNIVARIATE Procedure Variable: V2 (NO3) Moments N 27 Sum Weights 27 Mean 0.39503704 Sum Observations 10.666 Std Deviation 0.36540752 Variance 0.13352265 Skewness 1.48548872 Kurtosis 1.09630973 Uncorrected SS 7.685054 Corrected SS 3.47158896 Coeff Variation 92.4995586 Std Error Mean 0.07032271 Basic Statistical Measures Location Variability Mean 0.395037 Std Deviation 0.36541 Median 0.225000 Variance 0.13352 Mode 0.265000 Range 1.26000 Interquartile Range 0.32400 Tests for Location: Mu0=0 Test -Statistic- -----p Value------ Student's t t 5.617489 Pr > |t| <.0001 Sign M 13.5 Pr >= |M| <.0001 Signed Rank S 189 Pr >= |S| <.0001
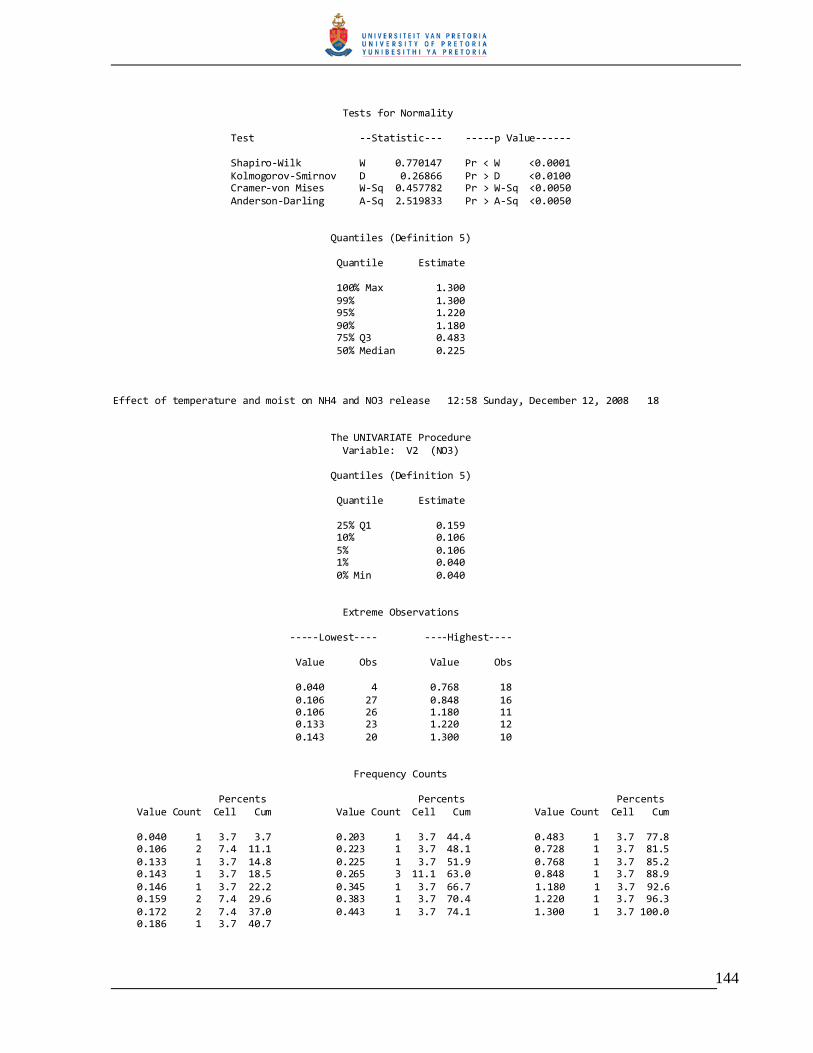
144
Tests for Normality Test --Statistic--- -----p Value------ Shapiro-Wilk W 0.770147 Pr < W <0.0001 Kolmogorov-Smirnov D 0.26866 Pr > D <0.0100 Cramer-von Mises W-Sq 0.457782 Pr > W-Sq <0.0050 Anderson-Darling A-Sq 2.519833 Pr > A-Sq <0.0050 Quantiles (Definition 5) Quantile Estimate 100% Max 1.300 99% 1.300 95% 1.220 90% 1.180 75% Q3 0.483 50% Median 0.225 Effect of temperature and moist on NH4 and NO3 release 12:58 Sunday, December 12, 2008 18 The UNIVARIATE Procedure Variable: V2 (NO3) Quantiles (Definition 5) Quantile Estimate 25% Q1 0.159 10% 0.106 5% 0.106 1% 0.040 0% Min 0.040 Extreme Observations -----Lowest---- ----Highest---- Value Obs Value Obs 0.040 4 0.768 18 0.106 27 0.848 16 0.106 26 1.180 11 0.133 23 1.220 12 0.143 20 1.300 10 Frequency Counts Percents Percents Percents Value Count Cell Cum Value Count Cell Cum Value Count Cell Cum 0.040 1 3.7 3.7 0.203 1 3.7 44.4 0.483 1 3.7 77.8 0.106 2 7.4 11.1 0.223 1 3.7 48.1 0.728 1 3.7 81.5 0.133 1 3.7 14.8 0.225 1 3.7 51.9 0.768 1 3.7 85.2 0.143 1 3.7 18.5 0.265 3 11.1 63.0 0.848 1 3.7 88.9 0.146 1 3.7 22.2 0.345 1 3.7 66.7 1.180 1 3.7 92.6 0.159 2 7.4 29.6 0.383 1 3.7 70.4 1.220 1 3.7 96.3 0.172 2 7.4 37.0 0.443 1 3.7 74.1 1.300 1 3.7 100.0 0.186 1 3.7 40.7
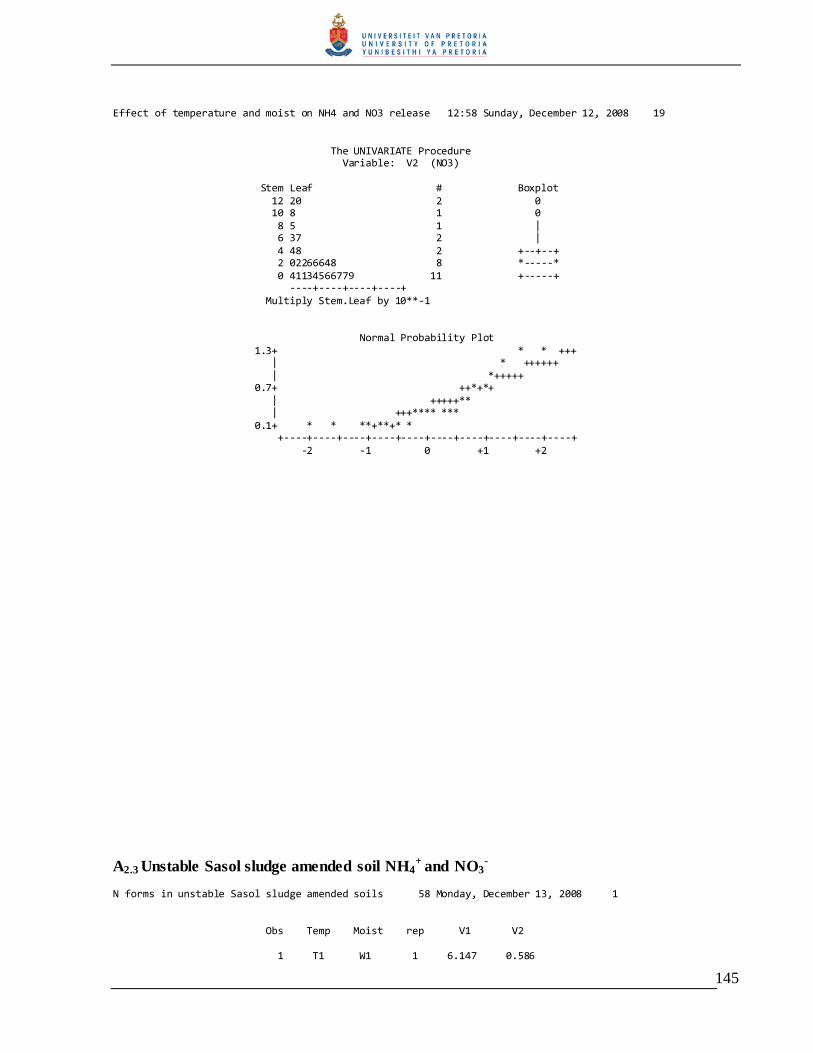
145
Effect of temperature and moist on NH4 and NO3 release 12:58 Sunday, December 12, 2008 19 The UNIVARIATE Procedure Variable: V2 (NO3) Stem Leaf # Boxplot 12 20 2 0 10 8 1 0 8 5 1 | 6 37 2 | 4 48 2 +--+--+ 2 02266648 8 *-----* 0 41134566779 11 +-----+ ----+----+----+----+ Multiply Stem.Leaf by 10**-1 Normal Probability Plot 1.3+ * * +++ | * ++++++ | *+++++ 0.7+ ++*+*+ | +++++** | +++**** *** 0.1+ * * **+**+* * +----+----+----+----+----+----+----+----+----+----+ -2 -1 0 +1 +2
A2.3 Unstable Sasol sludge amended soil NH4+ and NO3
- N forms in unstable Sasol sludge amended soils 58 Monday, December 13, 2008 1 Obs Temp Moist rep V1 V2 1 T1 W1 1 6.147 0.586
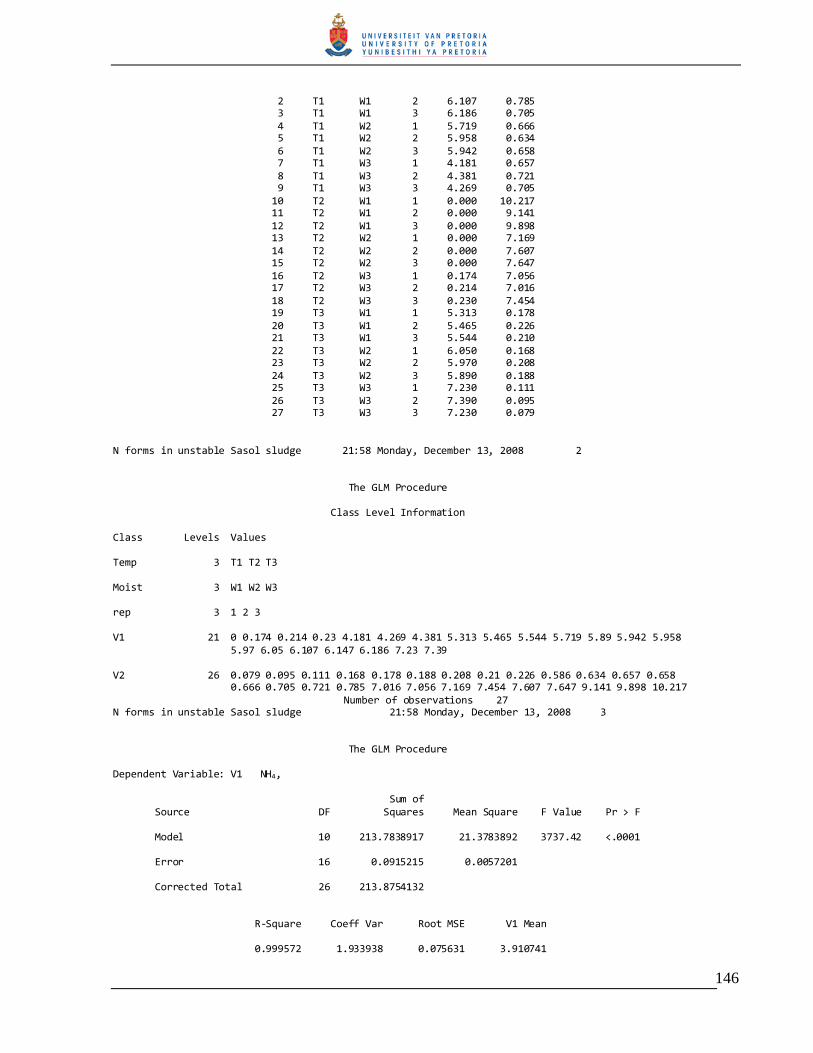
146
2 T1 W1 2 6.107 0.785 3 T1 W1 3 6.186 0.705 4 T1 W2 1 5.719 0.666 5 T1 W2 2 5.958 0.634 6 T1 W2 3 5.942 0.658 7 T1 W3 1 4.181 0.657 8 T1 W3 2 4.381 0.721 9 T1 W3 3 4.269 0.705 10 T2 W1 1 0.000 10.217 11 T2 W1 2 0.000 9.141 12 T2 W1 3 0.000 9.898 13 T2 W2 1 0.000 7.169 14 T2 W2 2 0.000 7.607 15 T2 W2 3 0.000 7.647 16 T2 W3 1 0.174 7.056 17 T2 W3 2 0.214 7.016 18 T2 W3 3 0.230 7.454 19 T3 W1 1 5.313 0.178 20 T3 W1 2 5.465 0.226 21 T3 W1 3 5.544 0.210 22 T3 W2 1 6.050 0.168 23 T3 W2 2 5.970 0.208 24 T3 W2 3 5.890 0.188 25 T3 W3 1 7.230 0.111 26 T3 W3 2 7.390 0.095 27 T3 W3 3 7.230 0.079 N forms in unstable Sasol sludge 21:58 Monday, December 13, 2008 2 The GLM Procedure Class Level Information Class Levels Values Temp 3 T1 T2 T3 Moist 3 W1 W2 W3 rep 3 1 2 3 V1 21 0 0.174 0.214 0.23 4.181 4.269 4.381 5.313 5.465 5.544 5.719 5.89 5.942 5.958 5.97 6.05 6.107 6.147 6.186 7.23 7.39 V2 26 0.079 0.095 0.111 0.168 0.178 0.188 0.208 0.21 0.226 0.586 0.634 0.657 0.658 0.666 0.705 0.721 0.785 7.016 7.056 7.169 7.454 7.607 7.647 9.141 9.898 10.217
Number of observations 27 N forms in unstable Sasol sludge 21:58 Monday, December 13, 2008 3 The GLM Procedure Dependent Variable: V1 NH4, Sum of Source DF Squares Mean Square F Value Pr > F Model 10 213.7838917 21.3783892 3737.42 <.0001 Error 16 0.0915215 0.0057201 Corrected Total 26 213.8754132 R-Square Coeff Var Root MSE V1 Mean 0.999572 1.933938 0.075631 3.910741

147
Source DF Type I SS Mean Square F Value Pr > F Temp 2 202.1543016 101.0771508 17670.5 <.0001 Moist 2 0.0344281 0.0172140 3.01 0.0777 Temp*Moist 4 11.5686655 2.8921664 505.62 <.0001 rep 2 0.0264965 0.0132483 2.32 0.1308 Source DF Type III SS Mean Square F Value Pr > F Temp 2 202.1543016 101.0771508 17670.5 <.0001 Moist 2 0.0344281 0.0172140 3.01 0.0777 Temp*Moist 4 11.5686655 2.8921664 505.62 <.0001 rep 2 0.0264965 0.0132483 2.32 0.1308 N forms in unstable Sasol sludge 21:58 Monday, December 13, 2008 4
The GLM Procedure
Dependent Variable: V2 NO3 Sum of Source DF Squares Mean Square F Value Pr > F Model 10 370.1365704 37.0136570 719.47 <.0001 Error 16 0.8231346 0.0514459 Corrected Total 26 370.9597050 R-Square Coeff Var Root MSE V2 Mean 0.997781 7.580685 0.226817 2.992037 Source DF Type I SS Mean Square F Value Pr > F Temp 2 358.1249639 179.0624819 3480.60 <.0001 Moist 2 4.2575299 2.1287649 41.38 <.0001 Temp*Moist 4 7.6830899 1.9207725 37.34 <.0001 rep 2 0.0709867 0.0354934 0.69 0.5159
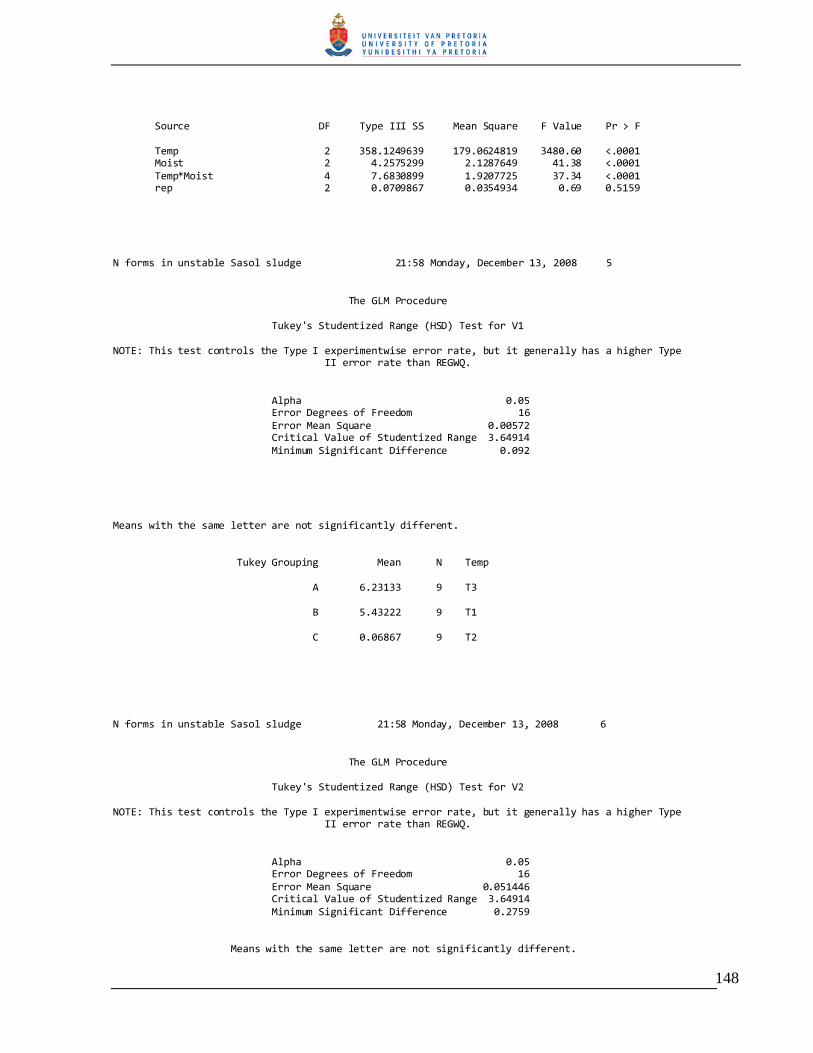
148
Source DF Type III SS Mean Square F Value Pr > F Temp 2 358.1249639 179.0624819 3480.60 <.0001 Moist 2 4.2575299 2.1287649 41.38 <.0001 Temp*Moist 4 7.6830899 1.9207725 37.34 <.0001 rep 2 0.0709867 0.0354934 0.69 0.5159 N forms in unstable Sasol sludge 21:58 Monday, December 13, 2008 5 The GLM Procedure Tukey's Studentized Range (HSD) Test for V1 NOTE: This test controls the Type I experimentwise error rate, but it generally has a higher Type II error rate than REGWQ. Alpha 0.05 Error Degrees of Freedom 16 Error Mean Square 0.00572 Critical Value of Studentized Range 3.64914 Minimum Significant Difference 0.092 Means with the same letter are not significantly different. Tukey Grouping Mean N Temp A 6.23133 9 T3 B 5.43222 9 T1 C 0.06867 9 T2 N forms in unstable Sasol sludge 21:58 Monday, December 13, 2008 6 The GLM Procedure Tukey's Studentized Range (HSD) Test for V2 NOTE: This test controls the Type I experimentwise error rate, but it generally has a higher Type II error rate than REGWQ. Alpha 0.05 Error Degrees of Freedom 16 Error Mean Square 0.051446 Critical Value of Studentized Range 3.64914 Minimum Significant Difference 0.2759 Means with the same letter are not significantly different.
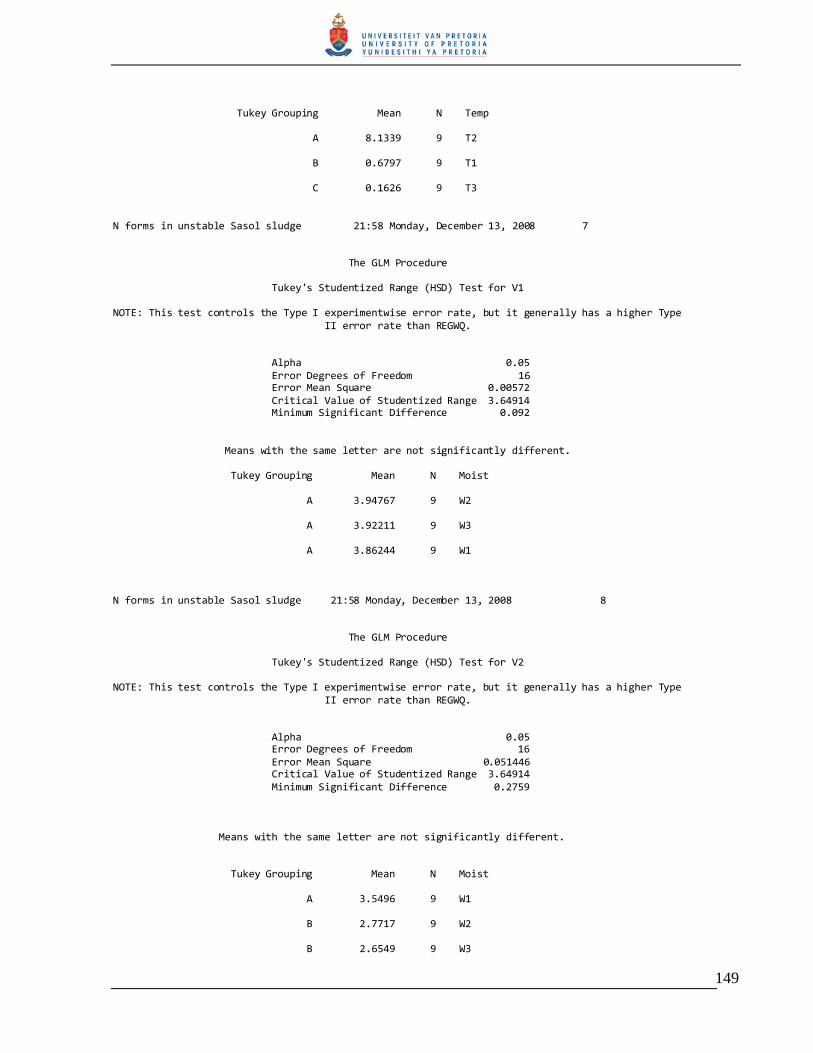
149
Tukey Grouping Mean N Temp A 8.1339 9 T2 B 0.6797 9 T1 C 0.1626 9 T3 N forms in unstable Sasol sludge 21:58 Monday, December 13, 2008 7 The GLM Procedure Tukey's Studentized Range (HSD) Test for V1 NOTE: This test controls the Type I experimentwise error rate, but it generally has a higher Type II error rate than REGWQ. Alpha 0.05 Error Degrees of Freedom 16 Error Mean Square 0.00572 Critical Value of Studentized Range 3.64914 Minimum Significant Difference 0.092 Means with the same letter are not significantly different. Tukey Grouping Mean N Moist A 3.94767 9 W2 A 3.92211 9 W3 A 3.86244 9 W1 N forms in unstable Sasol sludge 21:58 Monday, December 13, 2008 8 The GLM Procedure Tukey's Studentized Range (HSD) Test for V2 NOTE: This test controls the Type I experimentwise error rate, but it generally has a higher Type II error rate than REGWQ. Alpha 0.05 Error Degrees of Freedom 16 Error Mean Square 0.051446 Critical Value of Studentized Range 3.64914 Minimum Significant Difference 0.2759 Means with the same letter are not significantly different. Tukey Grouping Mean N Moist A 3.5496 9 W1 B 2.7717 9 W2 B 2.6549 9 W3
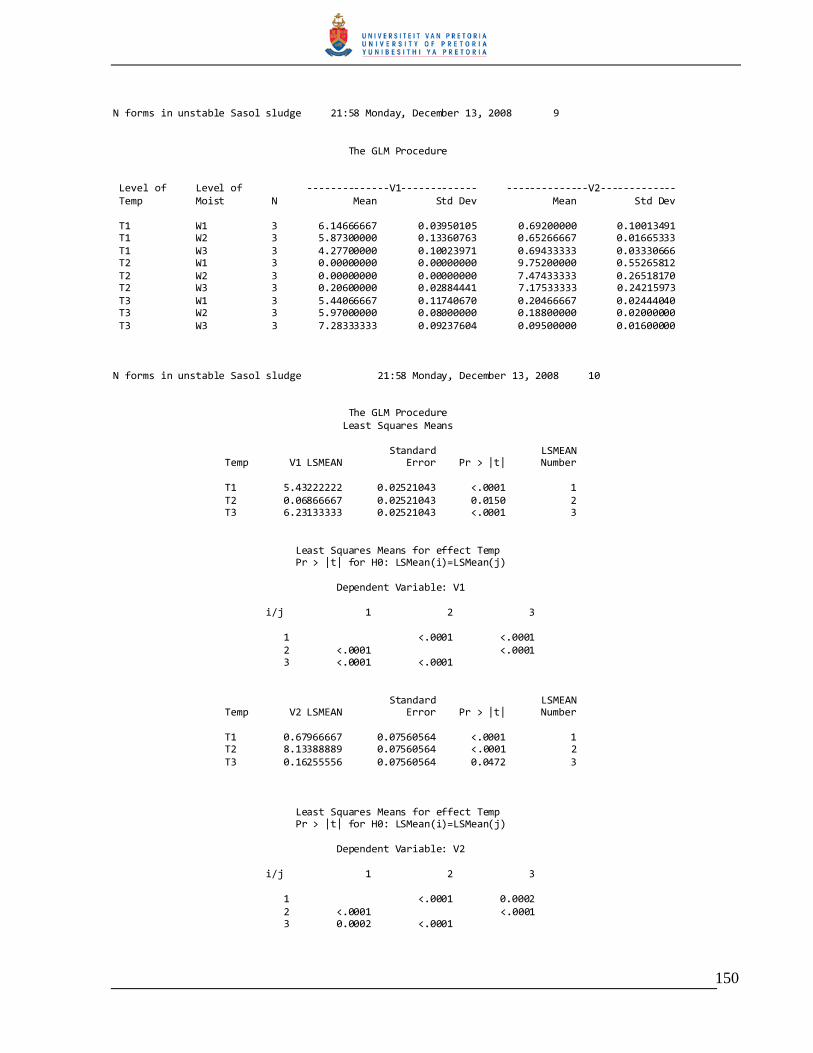
150
N forms in unstable Sasol sludge 21:58 Monday, December 13, 2008 9 The GLM Procedure Level of Level of --------------V1------------- --------------V2------------- Temp Moist N Mean Std Dev Mean Std Dev T1 W1 3 6.14666667 0.03950105 0.69200000 0.10013491 T1 W2 3 5.87300000 0.13360763 0.65266667 0.01665333 T1 W3 3 4.27700000 0.10023971 0.69433333 0.03330666 T2 W1 3 0.00000000 0.00000000 9.75200000 0.55265812 T2 W2 3 0.00000000 0.00000000 7.47433333 0.26518170 T2 W3 3 0.20600000 0.02884441 7.17533333 0.24215973 T3 W1 3 5.44066667 0.11740670 0.20466667 0.02444040 T3 W2 3 5.97000000 0.08000000 0.18800000 0.02000000 T3 W3 3 7.28333333 0.09237604 0.09500000 0.01600000 N forms in unstable Sasol sludge 21:58 Monday, December 13, 2008 10 The GLM Procedure Least Squares Means Standard LSMEAN Temp V1 LSMEAN Error Pr > |t| Number T1 5.43222222 0.02521043 <.0001 1 T2 0.06866667 0.02521043 0.0150 2 T3 6.23133333 0.02521043 <.0001 3 Least Squares Means for effect Temp Pr > |t| for H0: LSMean(i)=LSMean(j) Dependent Variable: V1 i/j 1 2 3 1 <.0001 <.0001 2 <.0001 <.0001 3 <.0001 <.0001 Standard LSMEAN Temp V2 LSMEAN Error Pr > |t| Number T1 0.67966667 0.07560564 <.0001 1 T2 8.13388889 0.07560564 <.0001 2 T3 0.16255556 0.07560564 0.0472 3 Least Squares Means for effect Temp Pr > |t| for H0: LSMean(i)=LSMean(j) Dependent Variable: V2 i/j 1 2 3 1 <.0001 0.0002 2 <.0001 <.0001 3 0.0002 <.0001

151
NOTE: To ensure overall protection level, only probabilities associated with pre-planned comparisons should be used. Standard LSMEAN Moist V1 LSMEAN Error Pr > |t| Number W1 3.86244444 0.02521043 <.0001 1 W2 3.94766667 0.02521043 <.0001 2 N forms in unstable Sasol sewage sludge 21:58 Monday, December 13, 2008 11 The GLM Procedure Least Squares Means Standard LSMEAN Moist V1 LSMEAN Error Pr > |t| Number W3 3.92211111 0.02521043 <.0001 3 Least Squares Means for effect Moist Pr > |t| for H0: LSMean(i)=LSMean(j) Dependent Variable: V1 i/j 1 2 3 1 0.0295 0.1137 2 0.0295 0.4838 3 0.1137 0.4838 Standard LSMEAN Moist V2 LSMEAN Error Pr > |t| Number W1 3.54955556 0.07560564 <.0001 1 W2 2.77166667 0.07560564 <.0001 2 W3 2.65488889 0.07560564 <.0001 3 Least Squares Means for effect Moist Pr > |t| for H0: LSMean(i)=LSMean(j) Dependent Variable: V2 i/j 1 2 3 1 <.0001 <.0001 2 <.0001 0.2909 3 <.0001 0.2909 NOTE: To ensure overall protection level, only probabilities associated with pre-planned comparisons should be used.
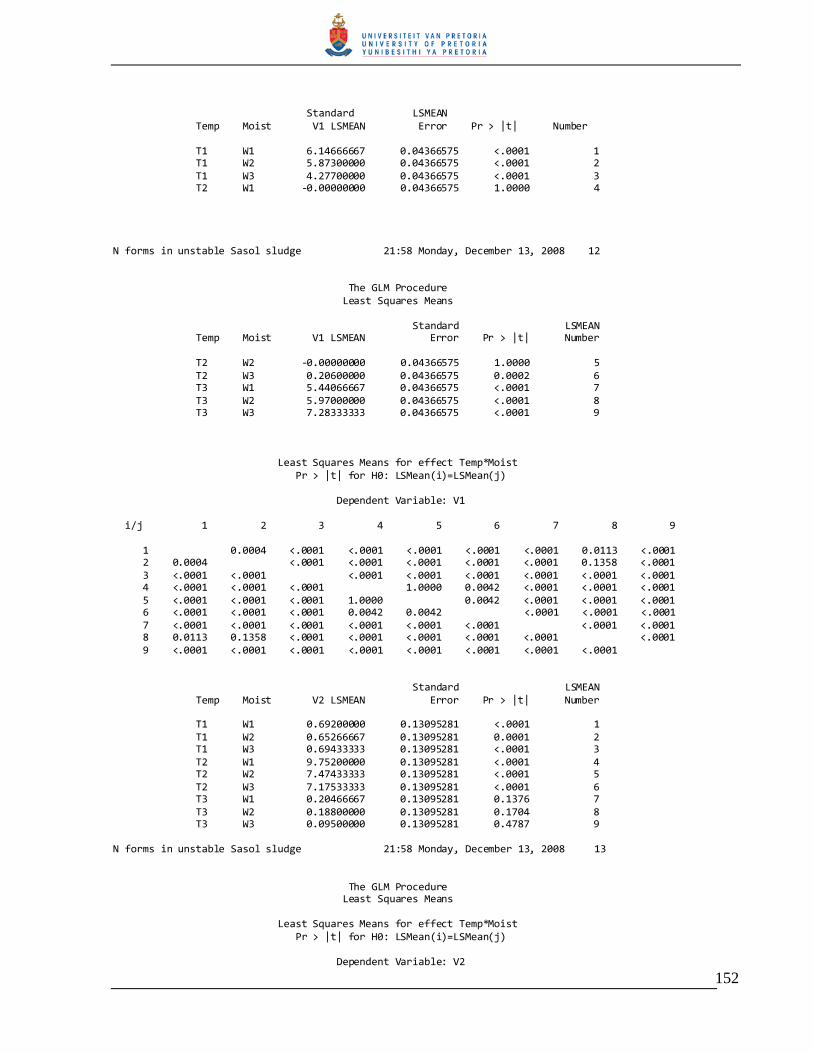
152
Standard LSMEAN Temp Moist V1 LSMEAN Error Pr > |t| Number T1 W1 6.14666667 0.04366575 <.0001 1 T1 W2 5.87300000 0.04366575 <.0001 2 T1 W3 4.27700000 0.04366575 <.0001 3 T2 W1 -0.00000000 0.04366575 1.0000 4 N forms in unstable Sasol sludge 21:58 Monday, December 13, 2008 12 The GLM Procedure Least Squares Means Standard LSMEAN Temp Moist V1 LSMEAN Error Pr > |t| Number T2 W2 -0.00000000 0.04366575 1.0000 5 T2 W3 0.20600000 0.04366575 0.0002 6 T3 W1 5.44066667 0.04366575 <.0001 7 T3 W2 5.97000000 0.04366575 <.0001 8 T3 W3 7.28333333 0.04366575 <.0001 9 Least Squares Means for effect Temp*Moist Pr > |t| for H0: LSMean(i)=LSMean(j) Dependent Variable: V1 i/j 1 2 3 4 5 6 7 8 9 1 0.0004 <.0001 <.0001 <.0001 <.0001 <.0001 0.0113 <.0001 2 0.0004 <.0001 <.0001 <.0001 <.0001 <.0001 0.1358 <.0001 3 <.0001 <.0001 <.0001 <.0001 <.0001 <.0001 <.0001 <.0001 4 <.0001 <.0001 <.0001 1.0000 0.0042 <.0001 <.0001 <.0001 5 <.0001 <.0001 <.0001 1.0000 0.0042 <.0001 <.0001 <.0001 6 <.0001 <.0001 <.0001 0.0042 0.0042 <.0001 <.0001 <.0001 7 <.0001 <.0001 <.0001 <.0001 <.0001 <.0001 <.0001 <.0001 8 0.0113 0.1358 <.0001 <.0001 <.0001 <.0001 <.0001 <.0001 9 <.0001 <.0001 <.0001 <.0001 <.0001 <.0001 <.0001 <.0001 Standard LSMEAN Temp Moist V2 LSMEAN Error Pr > |t| Number T1 W1 0.69200000 0.13095281 <.0001 1 T1 W2 0.65266667 0.13095281 0.0001 2 T1 W3 0.69433333 0.13095281 <.0001 3 T2 W1 9.75200000 0.13095281 <.0001 4 T2 W2 7.47433333 0.13095281 <.0001 5 T2 W3 7.17533333 0.13095281 <.0001 6 T3 W1 0.20466667 0.13095281 0.1376 7 T3 W2 0.18800000 0.13095281 0.1704 8 T3 W3 0.09500000 0.13095281 0.4787 9 N forms in unstable Sasol sludge 21:58 Monday, December 13, 2008 13 The GLM Procedure Least Squares Means Least Squares Means for effect Temp*Moist Pr > |t| for H0: LSMean(i)=LSMean(j) Dependent Variable: V2

153
i/j 1 2 3 4 5 6 7 8 9 1 0.8345 0.9901 <.0001 <.0001 <.0001 0.0181 0.0151 0.0053 2 0.8345 0.8248 <.0001 <.0001 <.0001 0.0278 0.0232 0.0083 3 0.9901 0.8248 <.0001 <.0001 <.0001 0.0177 0.0147 0.0052 4 <.0001 <.0001 <.0001 <.0001 <.0001 <.0001 <.0001 <.0001 5 <.0001 <.0001 <.0001 <.0001 0.1260 <.0001 <.0001 <.0001 6 <.0001 <.0001 <.0001 <.0001 0.1260 <.0001 <.0001 <.0001 7 0.0181 0.0278 0.0177 <.0001 <.0001 <.0001 0.9294 0.5620 8 0.0151 0.0232 0.0147 <.0001 <.0001 <.0001 0.9294 0.6224 9 0.0053 0.0083 0.0052 <.0001 <.0001 <.0001 0.5620 0.6224 NOTE: To ensure overall protection level, only probabilities associated with pre-planned comparisons should be used. N forms in unstable Sasol sludge 21:58 Monday, December 13, 2008 14 The UNIVARIATE Procedure Variable: V1 (NH4,) Moments N 27 Sum Weights 27 Mean 3.91074074 Sum Observations 105.59 Std Deviation 2.86809648 Variance 8.22597743 Skewness -0.5324572 Kurtosis -1.5540873 Uncorrected SS 626.810528 Corrected SS 213.875413 Coeff Variation 73.3389573 Std Error Mean 0.55196543 Basic Statistical Measures Location Variability Mean 3.910741 Std Deviation 2.86810 Median 5.465000 Variance 8.22598 Mode 0.000000 Range 7.39000 Interquartile Range 5.87600
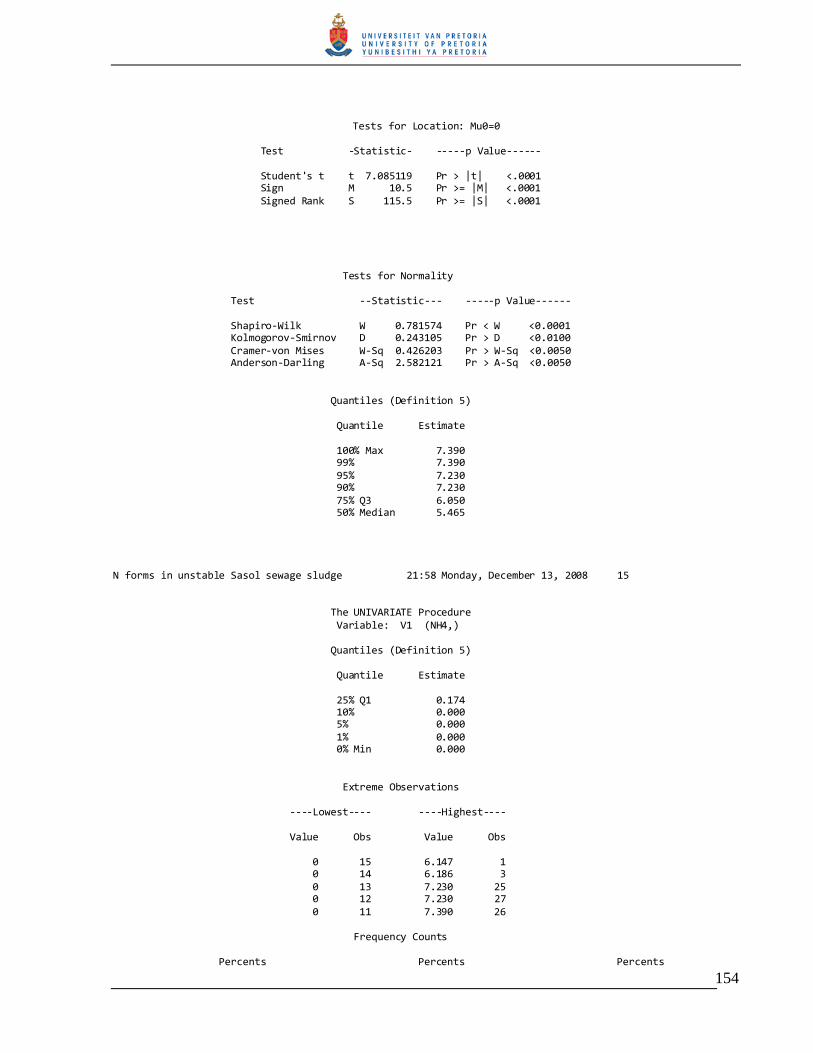
154
Tests for Location: Mu0=0 Test -Statistic- -----p Value------ Student's t t 7.085119 Pr > |t| <.0001 Sign M 10.5 Pr >= |M| <.0001 Signed Rank S 115.5 Pr >= |S| <.0001 Tests for Normality Test --Statistic--- -----p Value------ Shapiro-Wilk W 0.781574 Pr < W <0.0001 Kolmogorov-Smirnov D 0.243105 Pr > D <0.0100 Cramer-von Mises W-Sq 0.426203 Pr > W-Sq <0.0050 Anderson-Darling A-Sq 2.582121 Pr > A-Sq <0.0050 Quantiles (Definition 5) Quantile Estimate 100% Max 7.390 99% 7.390 95% 7.230 90% 7.230 75% Q3 6.050 50% Median 5.465 N forms in unstable Sasol sewage sludge 21:58 Monday, December 13, 2008 15 The UNIVARIATE Procedure Variable: V1 (NH4,) Quantiles (Definition 5) Quantile Estimate 25% Q1 0.174 10% 0.000 5% 0.000 1% 0.000 0% Min 0.000 Extreme Observations ----Lowest---- ----Highest---- Value Obs Value Obs 0 15 6.147 1 0 14 6.186 3 0 13 7.230 25 0 12 7.230 27 0 11 7.390 26 Frequency Counts Percents Percents Percents
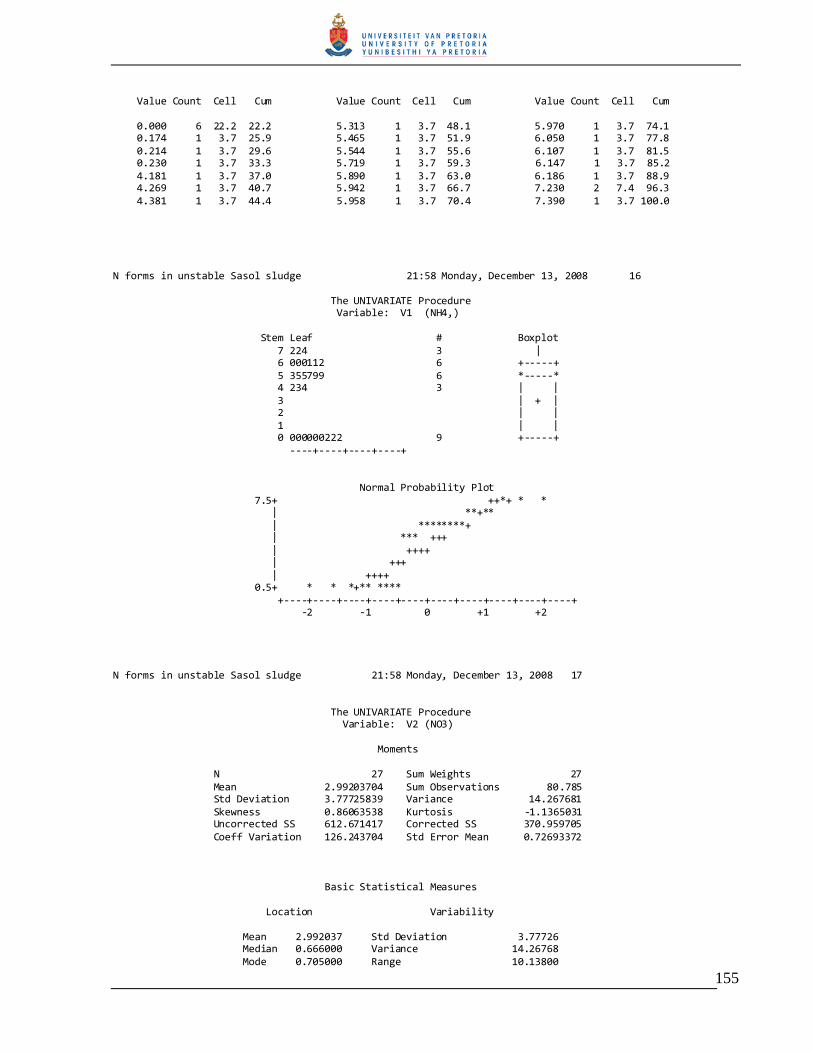
155
Value Count Cell Cum Value Count Cell Cum Value Count Cell Cum 0.000 6 22.2 22.2 5.313 1 3.7 48.1 5.970 1 3.7 74.1 0.174 1 3.7 25.9 5.465 1 3.7 51.9 6.050 1 3.7 77.8 0.214 1 3.7 29.6 5.544 1 3.7 55.6 6.107 1 3.7 81.5 0.230 1 3.7 33.3 5.719 1 3.7 59.3 6.147 1 3.7 85.2 4.181 1 3.7 37.0 5.890 1 3.7 63.0 6.186 1 3.7 88.9 4.269 1 3.7 40.7 5.942 1 3.7 66.7 7.230 2 7.4 96.3 4.381 1 3.7 44.4 5.958 1 3.7 70.4 7.390 1 3.7 100.0 N forms in unstable Sasol sludge 21:58 Monday, December 13, 2008 16 The UNIVARIATE Procedure Variable: V1 (NH4,) Stem Leaf # Boxplot 7 224 3 | 6 000112 6 +-----+ 5 355799 6 *-----* 4 234 3 | | 3 | + | 2 | | 1 | | 0 000000222 9 +-----+ ----+----+----+----+ Normal Probability Plot 7.5+ ++*+ * * | **+** | ********+ | *** +++ | ++++ | +++ | ++++ 0.5+ * * *+** **** +----+----+----+----+----+----+----+----+----+----+ -2 -1 0 +1 +2 N forms in unstable Sasol sludge 21:58 Monday, December 13, 2008 17 The UNIVARIATE Procedure Variable: V2 (NO3) Moments N 27 Sum Weights 27 Mean 2.99203704 Sum Observations 80.785 Std Deviation 3.77725839 Variance 14.267681 Skewness 0.86063538 Kurtosis -1.1365031 Uncorrected SS 612.671417 Corrected SS 370.959705 Coeff Variation 126.243704 Std Error Mean 0.72693372 Basic Statistical Measures Location Variability Mean 2.992037 Std Deviation 3.77726 Median 0.666000 Variance 14.26768 Mode 0.705000 Range 10.13800
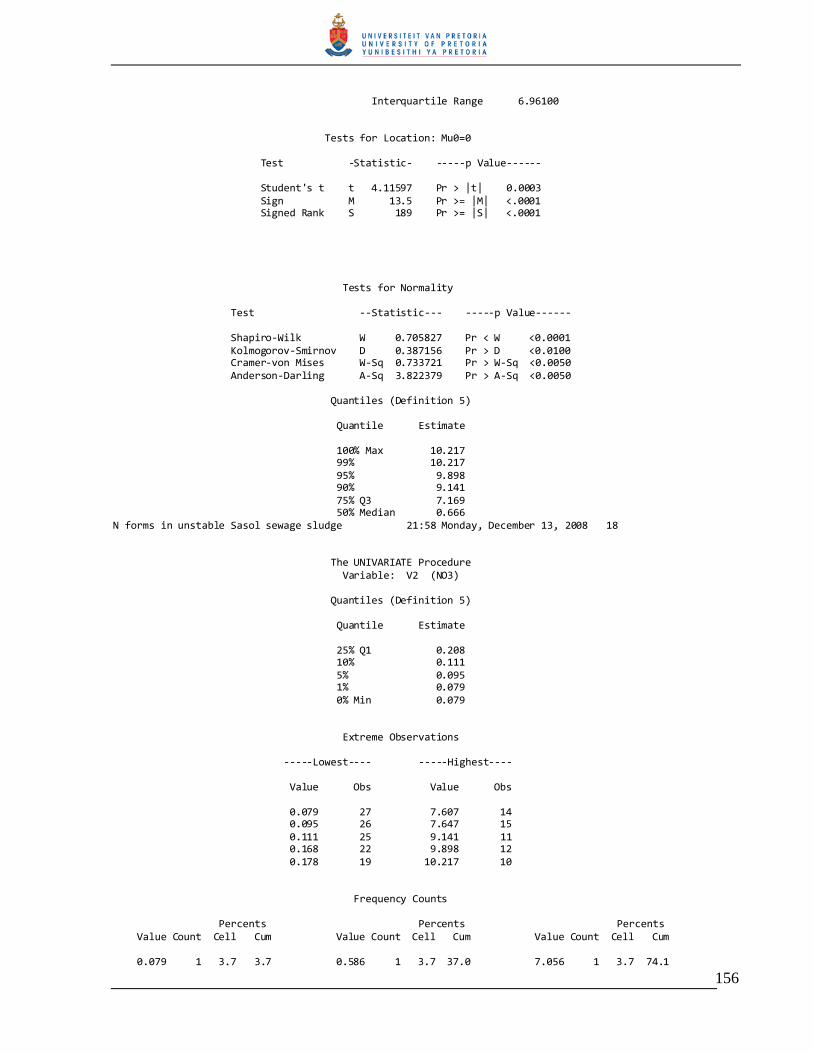
156
Interquartile Range 6.96100 Tests for Location: Mu0=0 Test -Statistic- -----p Value------ Student's t t 4.11597 Pr > |t| 0.0003 Sign M 13.5 Pr >= |M| <.0001 Signed Rank S 189 Pr >= |S| <.0001 Tests for Normality Test --Statistic--- -----p Value------ Shapiro-Wilk W 0.705827 Pr < W <0.0001 Kolmogorov-Smirnov D 0.387156 Pr > D <0.0100 Cramer-von Mises W-Sq 0.733721 Pr > W-Sq <0.0050 Anderson-Darling A-Sq 3.822379 Pr > A-Sq <0.0050 Quantiles (Definition 5) Quantile Estimate 100% Max 10.217 99% 10.217 95% 9.898 90% 9.141 75% Q3 7.169 50% Median 0.666 N forms in unstable Sasol sewage sludge 21:58 Monday, December 13, 2008 18 The UNIVARIATE Procedure Variable: V2 (NO3) Quantiles (Definition 5) Quantile Estimate 25% Q1 0.208 10% 0.111 5% 0.095 1% 0.079 0% Min 0.079 Extreme Observations -----Lowest---- -----Highest---- Value Obs Value Obs 0.079 27 7.607 14 0.095 26 7.647 15 0.111 25 9.141 11 0.168 22 9.898 12 0.178 19 10.217 10 Frequency Counts Percents Percents Percents Value Count Cell Cum Value Count Cell Cum Value Count Cell Cum 0.079 1 3.7 3.7 0.586 1 3.7 37.0 7.056 1 3.7 74.1
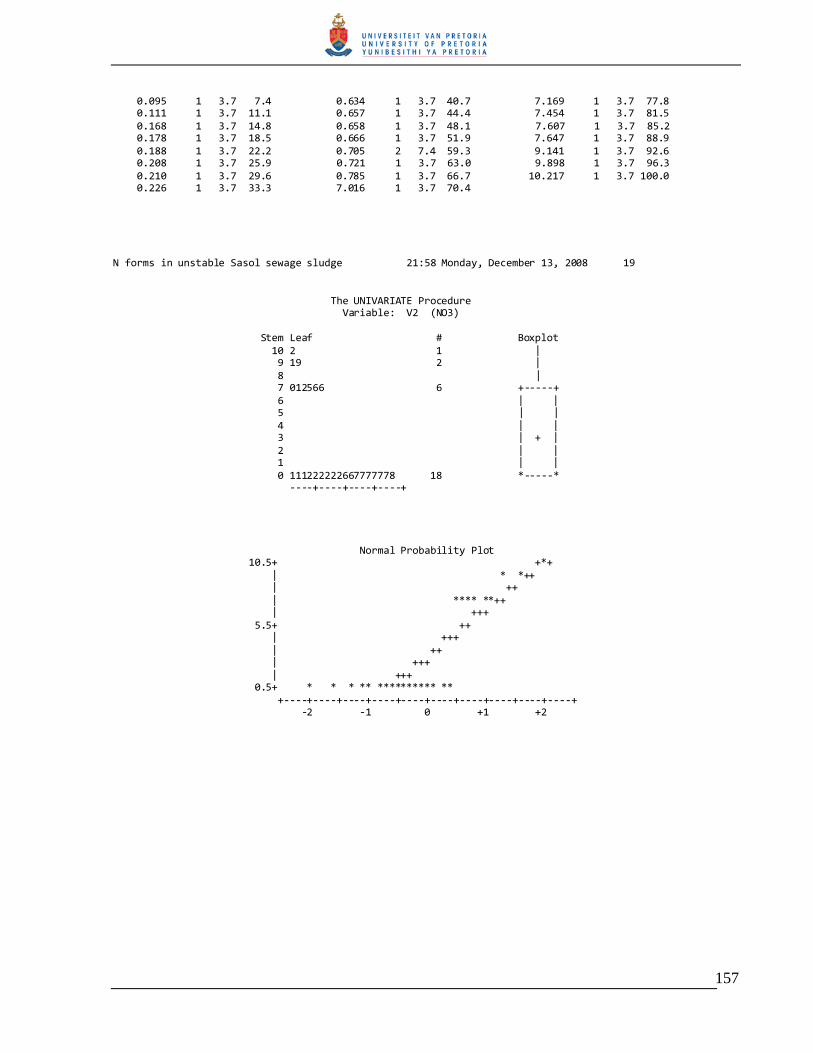
157
0.095 1 3.7 7.4 0.634 1 3.7 40.7 7.169 1 3.7 77.8 0.111 1 3.7 11.1 0.657 1 3.7 44.4 7.454 1 3.7 81.5 0.168 1 3.7 14.8 0.658 1 3.7 48.1 7.607 1 3.7 85.2 0.178 1 3.7 18.5 0.666 1 3.7 51.9 7.647 1 3.7 88.9 0.188 1 3.7 22.2 0.705 2 7.4 59.3 9.141 1 3.7 92.6 0.208 1 3.7 25.9 0.721 1 3.7 63.0 9.898 1 3.7 96.3 0.210 1 3.7 29.6 0.785 1 3.7 66.7 10.217 1 3.7 100.0 0.226 1 3.7 33.3 7.016 1 3.7 70.4 N forms in unstable Sasol sewage sludge 21:58 Monday, December 13, 2008 19 The UNIVARIATE Procedure Variable: V2 (NO3) Stem Leaf # Boxplot 10 2 1 | 9 19 2 | 8 | 7 012566 6 +-----+ 6 | | 5 | | 4 | | 3 | + | 2 | | 1 | | 0 111222222667777778 18 *-----* ----+----+----+----+ Normal Probability Plot 10.5+ +*+ | * *++ | ++ | **** **++ | +++ 5.5+ ++ | +++ | ++ | +++ | +++ 0.5+ * * * ** ********** ** +----+----+----+----+----+----+----+----+----+----+ -2 -1 0 +1 +2

158

159
A3. Statistical analysis for incubation time and water potential effect on net N release Effect of incubation time on net N release for stable ‘Vlakplaas’- at 45 o C 1 19:24 Thursday, November 25, 2008 Obs Days Mois Rep VI 1 1 W1 1 3.332 2 1 W1 2 3.173 3 1 W1 3 3.252 4 1 W2 1 3.002 5 1 W2 2 2.994 6 1 W2 3 2.998 7 1 W3 1 2.785 8 1 W3 2 2.753 9 1 W3 3 2.745 10 7 W1 1 3.141 11 7 W1 2 3.102 12 7 W1 3 3.087 13 7 W2 1 4.264 14 7 W2 2 3.390 15 7 W2 3 3.564 16 7 W3 1 3.411 17 7 W3 2 2.497 18 7 W3 3 2.791 19 14 W1 1 3.872 20 14 W1 2 3.991 21 14 W1 3 3.846 22 14 W2 1 3.784 23 14 W2 2 3.844 24 14 W2 3 3.825 25 14 W3 1 3.947 26 14 W3 2 3.804 27 14 W3 3 3.848 28 28 W1 1 2.898 29 28 W1 2 2.854 30 28 W1 3 2.963 31 28 W2 1 3.736 32 28 W2 2 3.780 33 28 W2 3 3.748 34 28 W3 1 3.448 35 28 W3 2 2.952 36 28 W3 3 3.259 37 56 W1 1 3.115 38 56 W1 2 2.996 39 56 W1 3 3.055 40 56 W2 1 2.958 41 56 W2 2 3.526 42 56 W2 3 2.906 43 56 W3 1 3.324 44 56 W3 2 3.249 45 56 W3 3 3.259 Effect of incubation time on net N release for stable ‘Vlakplaas’- at 45 o C 2 19:24 Thursday, November 25, 2008 The GLM Procedure Class Level Information Class Levels Values Days 5 1 14 28 56 7

160
Mois 3 W1 W2 W3 Rep 3 1 2 3 VI 44 2.497 2.745 2.753 2.785 2.791 2.854 2.898 2.906 2.952 2.958 2.963 2.994 2.996 2.998 3.002 3.055 3.087 3.102 3.115 3.141 3.173 3.249 3.252 3.259 3.324 3.332 3.39 3.411 3.448 3.526 3.564 3.736 3.748 3.78 3.784 3.804 3.825 3.844 3.846 3.848 3.872 3.947 3.991 4.264 Number of observations 45 Effect of incubation time on net N release for stable ‘Vlakplaas’- at 45 o C 3 19:24 Thursday, November 25, 2008 The GLM Procedure Dependent Variable: VI N03 Sum of Source DF Squares Mean Square F Value Pr > F Model 14 6.54535458 0.46752533 10.94 <.0001 Error 30 1.28249800 0.04274993 Corrected Total 44 7.82785258 R-Square Coeff Var Root MSE VI Mean 0.836162 6.241598 0.206761 3.312622 Source DF Type I SS Mean Square F Value Pr > F Days 4 3.84301658 0.96075414 22.47 <.0001 Mois 2 0.70371551 0.35185776 8.23 0.0014 Days*Mois 8 1.99862249 0.24982781 5.84 0.0002 Source DF Type III SS Mean Square F Value Pr > F Days 4 3.84301658 0.96075414 22.47 <.0001 Mois 2 0.70371551 0.35185776 8.23 0.0014 Days*Mois 8 1.99862249 0.24982781 5.84 0.0002 Effect of incubation time on net N release for stable ‘Vlakplaas’- at 45 o C 4 19:24 Thursday, November 25, 2008 The GLM Procedure Tukey's Studentized Range (HSD) Test for VI NOTE: This test controls the Type I experimentwise error rate, but it generally has a higher Type II error rate than REGWQ. Alpha 0.05 Error Degrees of Freedom 30 Error Mean Square 0.04275 Critical Value of Studentized Range 4.10208 Minimum Significant Difference 0.2827 Means with the same letter are not significantly different.
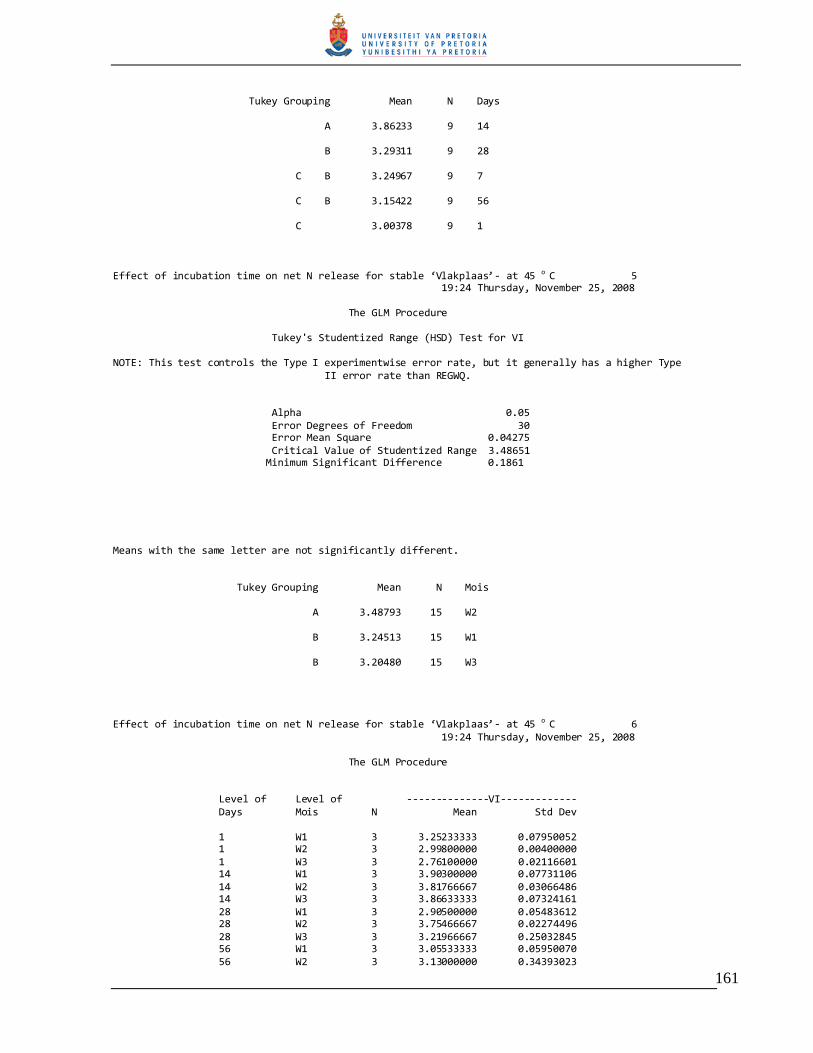
161
Tukey Grouping Mean N Days A 3.86233 9 14 B 3.29311 9 28 C B 3.24967 9 7 C B 3.15422 9 56 C 3.00378 9 1 Effect of incubation time on net N release for stable ‘Vlakplaas’- at 45 o C 5 19:24 Thursday, November 25, 2008 The GLM Procedure Tukey's Studentized Range (HSD) Test for VI NOTE: This test controls the Type I experimentwise error rate, but it generally has a higher Type II error rate than REGWQ. Alpha 0.05 Error Degrees of Freedom 30 Error Mean Square 0.04275 Critical Value of Studentized Range 3.48651 Minimum Significant Difference 0.1861 Means with the same letter are not significantly different. Tukey Grouping Mean N Mois A 3.48793 15 W2 B 3.24513 15 W1 B 3.20480 15 W3 Effect of incubation time on net N release for stable ‘Vlakplaas’- at 45 o C 6 19:24 Thursday, November 25, 2008 The GLM Procedure Level of Level of --------------VI------------- Days Mois N Mean Std Dev 1 W1 3 3.25233333 0.07950052 1 W2 3 2.99800000 0.00400000 1 W3 3 2.76100000 0.02116601 14 W1 3 3.90300000 0.07731106 14 W2 3 3.81766667 0.03066486 14 W3 3 3.86633333 0.07324161 28 W1 3 2.90500000 0.05483612 28 W2 3 3.75466667 0.02274496 28 W3 3 3.21966667 0.25032845 56 W1 3 3.05533333 0.05950070 56 W2 3 3.13000000 0.34393023
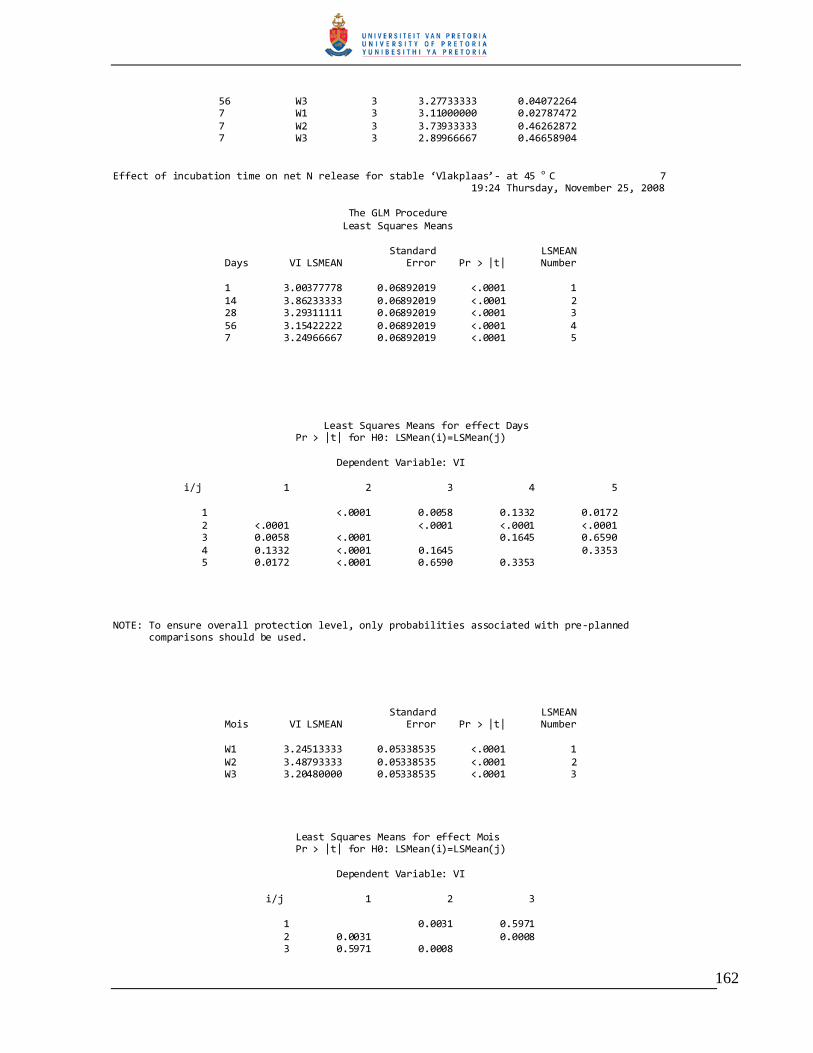
162
56 W3 3 3.27733333 0.04072264 7 W1 3 3.11000000 0.02787472 7 W2 3 3.73933333 0.46262872 7 W3 3 2.89966667 0.46658904 Effect of incubation time on net N release for stable ‘Vlakplaas’- at 45 o C 7 19:24 Thursday, November 25, 2008 The GLM Procedure Least Squares Means Standard LSMEAN Days VI LSMEAN Error Pr > |t| Number 1 3.00377778 0.06892019 <.0001 1 14 3.86233333 0.06892019 <.0001 2 28 3.29311111 0.06892019 <.0001 3 56 3.15422222 0.06892019 <.0001 4 7 3.24966667 0.06892019 <.0001 5
Least Squares Means for effect Days Pr > |t| for H0: LSMean(i)=LSMean(j) Dependent Variable: VI i/j 1 2 3 4 5 1 <.0001 0.0058 0.1332 0.0172 2 <.0001 <.0001 <.0001 <.0001 3 0.0058 <.0001 0.1645 0.6590 4 0.1332 <.0001 0.1645 0.3353 5 0.0172 <.0001 0.6590 0.3353 NOTE: To ensure overall protection level, only probabilities associated with pre-planned comparisons should be used. Standard LSMEAN Mois VI LSMEAN Error Pr > |t| Number W1 3.24513333 0.05338535 <.0001 1 W2 3.48793333 0.05338535 <.0001 2 W3 3.20480000 0.05338535 <.0001 3 Least Squares Means for effect Mois Pr > |t| for H0: LSMean(i)=LSMean(j) Dependent Variable: VI i/j 1 2 3 1 0.0031 0.5971 2 0.0031 0.0008 3 0.5971 0.0008

163
NOTE: To ensure overall protection level, only probabilities associated with pre-planned Effect of incubation time on net N release for stable ‘Vlakplaas’- at 45 o C 8 19:24 Thursday, November 25, 2008 The GLM Procedure Least Squares Means comparisons should be used. Standard LSMEAN Days Mois VI LSMEAN Error Pr > |t| Number 1 W1 3.25233333 0.11937327 <.0001 1 1 W2 2.99800000 0.11937327 <.0001 2 1 W3 2.76100000 0.11937327 <.0001 3 14 W1 3.90300000 0.11937327 <.0001 4 14 W2 3.81766667 0.11937327 <.0001 5 14 W3 3.86633333 0.11937327 <.0001 6 28 W1 2.90500000 0.11937327 <.0001 7 28 W2 3.75466667 0.11937327 <.0001 8 28 W3 3.21966667 0.11937327 <.0001 9 56 W1 3.05533333 0.11937327 <.0001 10 56 W2 3.13000000 0.11937327 <.0001 11 56 W3 3.27733333 0.11937327 <.0001 12 7 W1 3.11000000 0.11937327 <.0001 13 7 W2 3.73933333 0.11937327 <.0001 14 7 W3 2.89966667 0.11937327 <.0001 15 Least Squares Means for effect Days*Mois Pr > |t| for H0: LSMean(i)=LSMean(j) Dependent Variable: VI i/j 1 2 3 4 5 6 7 8 1 0.1424 0.0067 0.0006 0.0022 0.0010 0.0484 0.0057 2 0.1424 0.1706 <.0001 <.0001 <.0001 0.5858 0.0001 3 0.0067 0.1706 <.0001 <.0001 <.0001 0.4004 <.0001 4 0.0006 <.0001 <.0001 0.6169 0.8295 <.0001 0.3866 5 0.0022 <.0001 <.0001 0.6169 0.7751 <.0001 0.7116 6 0.0010 <.0001 <.0001 0.8295 0.7751 <.0001 0.5134 7 0.0484 0.5858 0.4004 <.0001 <.0001 <.0001 <.0001 8 0.0057 0.0001 <.0001 0.3866 0.7116 0.5134 <.0001 9 0.8479 0.1991 0.0108 0.0003 0.0013 0.0006 0.0721 0.0035 10 0.2524 0.7365 0.0915 <.0001 <.0001 <.0001 0.3803 0.0003 11 0.4743 0.4404 0.0368 <.0001 0.0003 0.0001 0.1926 0.0009 12 0.8833 0.1084 0.0046 0.0009 0.0032 0.0015 0.0352 0.0083 13 0.4058 0.5121 0.0474 <.0001 0.0002 0.0001 0.2341 0.0006 14 0.0072 0.0001 <.0001 0.3401 0.6460 0.4577 <.0001 0.9282 15 0.0453 0.5646 0.4179 <.0001 <.0001 <.0001 0.9750 <.0001
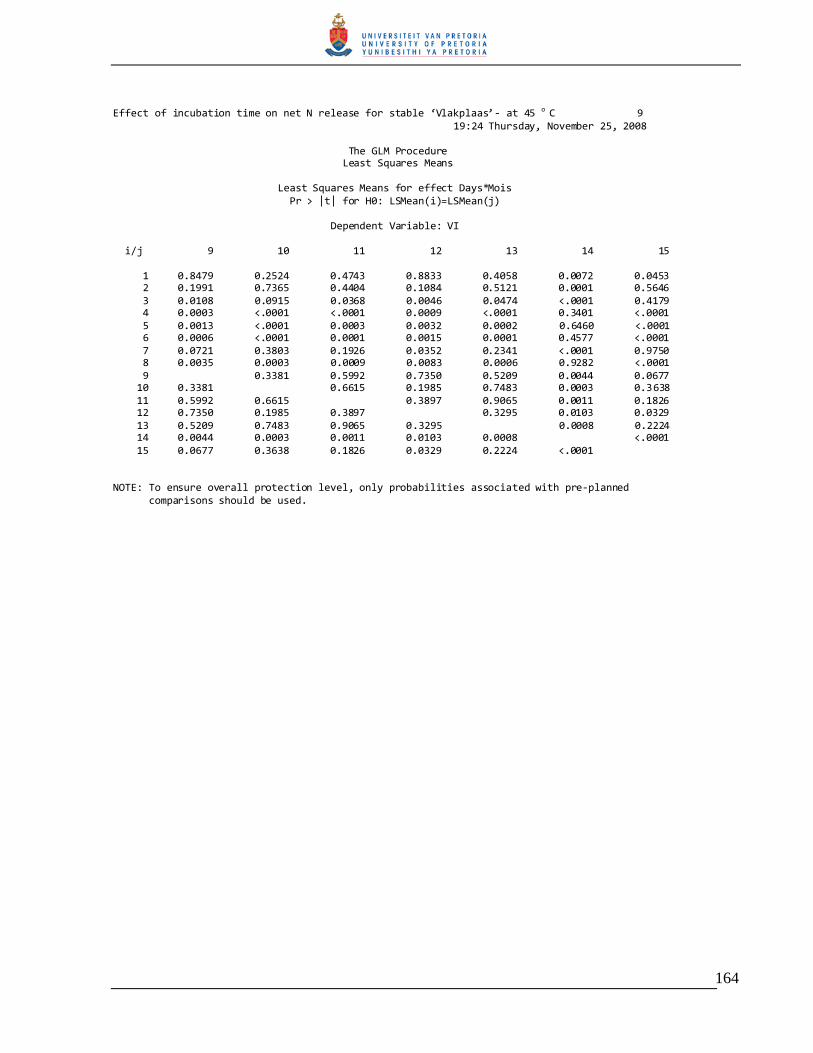
164
Effect of incubation time on net N release for stable ‘Vlakplaas’- at 45 o C 9 19:24 Thursday, November 25, 2008 The GLM Procedure Least Squares Means Least Squares Means for effect Days*Mois Pr > |t| for H0: LSMean(i)=LSMean(j) Dependent Variable: VI i/j 9 10 11 12 13 14 15 1 0.8479 0.2524 0.4743 0.8833 0.4058 0.0072 0.0453 2 0.1991 0.7365 0.4404 0.1084 0.5121 0.0001 0.5646 3 0.0108 0.0915 0.0368 0.0046 0.0474 <.0001 0.4179 4 0.0003 <.0001 <.0001 0.0009 <.0001 0.3401 <.0001 5 0.0013 <.0001 0.0003 0.0032 0.0002 0.6460 <.0001 6 0.0006 <.0001 0.0001 0.0015 0.0001 0.4577 <.0001 7 0.0721 0.3803 0.1926 0.0352 0.2341 <.0001 0.9750 8 0.0035 0.0003 0.0009 0.0083 0.0006 0.9282 <.0001 9 0.3381 0.5992 0.7350 0.5209 0.0044 0.0677 10 0.3381 0.6615 0.1985 0.7483 0.0003 0.3638 11 0.5992 0.6615 0.3897 0.9065 0.0011 0.1826 12 0.7350 0.1985 0.3897 0.3295 0.0103 0.0329 13 0.5209 0.7483 0.9065 0.3295 0.0008 0.2224 14 0.0044 0.0003 0.0011 0.0103 0.0008 <.0001 15 0.0677 0.3638 0.1826 0.0329 0.2224 <.0001 NOTE: To ensure overall protection level, only probabilities associated with pre-planned comparisons should be used.

165
Effect of incubation time on net N release for stable ‘Vlakplaas’- at 45 o C 10 19:24 Thursday, November 25, 2008 The UNIVARIATE Procedure Variable: VI (N03) Moments N 45 Sum Weights 45 Mean 3.31262222 Sum Observations 149.068 Std Deviation 0.42178874 Variance 0.17790574 Skewness 0.30701524 Kurtosis -0.8878836 Uncorrected SS 501.633822 Corrected SS 7.82785258 Coeff Variation 12.7327751 Std Error Mean 0.06287655 Basic Statistical Measures Location Variability Mean 3.312622 Std Deviation 0.42179 Median 3.252000 Variance 0.17791 Mode 3.259000 Range 1.76700 Interquartile Range 0.75400 Tests for Location: Mu0=0 Test -Statistic- -----p Value------ Student's t t 52.68454 Pr > |t| <.0001 Sign M 22.5 Pr >= |M| <.0001 Signed Rank S 517.5 Pr >= |S| <.0001 Tests for Normality Test --Statistic--- -----p Value------ Shapiro-Wilk W 0.952973 Pr < W 0.0659 Kolmogorov-Smirnov D 0.131144 Pr > D 0.0500 Cramer-von Mises W-Sq 0.150683 Pr > W-Sq 0.0228 Anderson-Darling A-Sq 0.907237 Pr > A-Sq 0.0203 Quantiles (Definition 5) Quantile Estimate 100% Max 4.264 99% 4.264 95% 3.947 90% 3.848 75% Q3 3.748 50% Median 3.252 Effect of incubation time on net N release for stable ‘Vlakplaas’- at 45 o C 11 19:24 Thursday, November 25, 2008 The UNIVARIATE Procedure Variable: VI (N03) Quantiles (Definition 5) Quantile Estimate 25% Q1 2.994
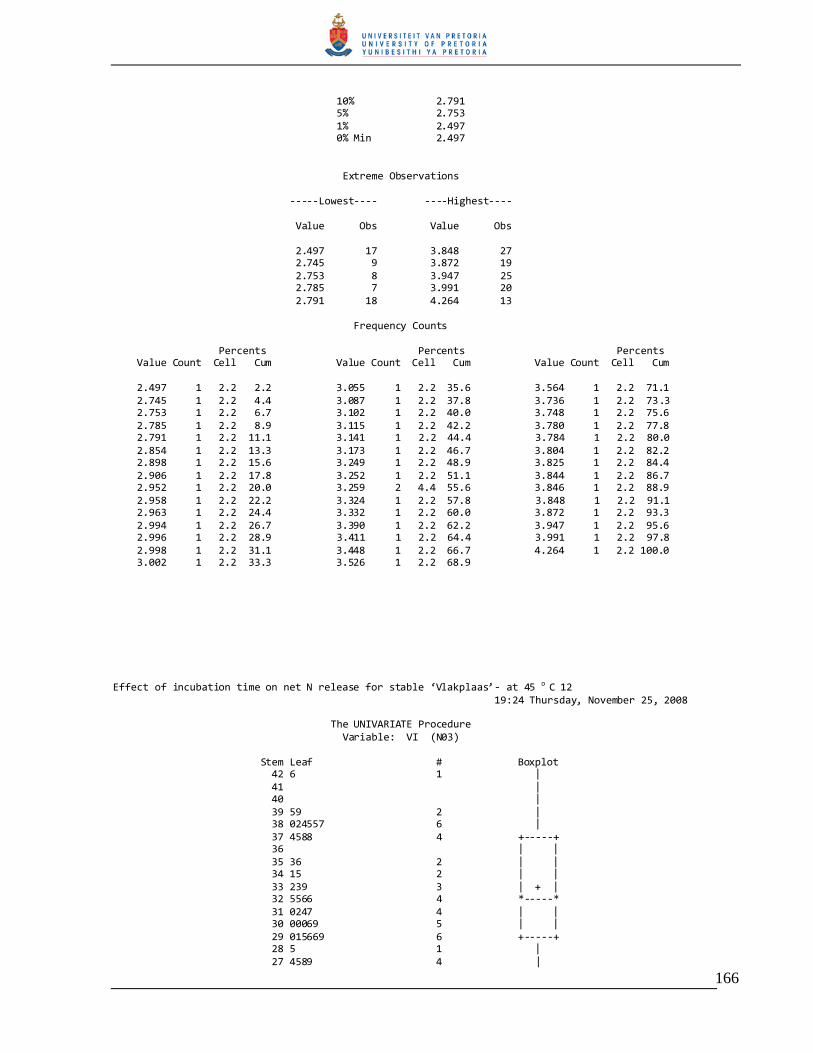
166
10% 2.791 5% 2.753 1% 2.497 0% Min 2.497 Extreme Observations -----Lowest---- ----Highest---- Value Obs Value Obs 2.497 17 3.848 27 2.745 9 3.872 19 2.753 8 3.947 25 2.785 7 3.991 20 2.791 18 4.264 13 Frequency Counts Percents Percents Percents Value Count Cell Cum Value Count Cell Cum Value Count Cell Cum 2.497 1 2.2 2.2 3.055 1 2.2 35.6 3.564 1 2.2 71.1 2.745 1 2.2 4.4 3.087 1 2.2 37.8 3.736 1 2.2 73.3 2.753 1 2.2 6.7 3.102 1 2.2 40.0 3.748 1 2.2 75.6 2.785 1 2.2 8.9 3.115 1 2.2 42.2 3.780 1 2.2 77.8 2.791 1 2.2 11.1 3.141 1 2.2 44.4 3.784 1 2.2 80.0 2.854 1 2.2 13.3 3.173 1 2.2 46.7 3.804 1 2.2 82.2 2.898 1 2.2 15.6 3.249 1 2.2 48.9 3.825 1 2.2 84.4 2.906 1 2.2 17.8 3.252 1 2.2 51.1 3.844 1 2.2 86.7 2.952 1 2.2 20.0 3.259 2 4.4 55.6 3.846 1 2.2 88.9 2.958 1 2.2 22.2 3.324 1 2.2 57.8 3.848 1 2.2 91.1 2.963 1 2.2 24.4 3.332 1 2.2 60.0 3.872 1 2.2 93.3 2.994 1 2.2 26.7 3.390 1 2.2 62.2 3.947 1 2.2 95.6 2.996 1 2.2 28.9 3.411 1 2.2 64.4 3.991 1 2.2 97.8 2.998 1 2.2 31.1 3.448 1 2.2 66.7 4.264 1 2.2 100.0 3.002 1 2.2 33.3 3.526 1 2.2 68.9 Effect of incubation time on net N release for stable ‘Vlakplaas’- at 45 o C 12 19:24 Thursday, November 25, 2008 The UNIVARIATE Procedure Variable: VI (N03) Stem Leaf # Boxplot 42 6 1 | 41 | 40 | 39 59 2 | 38 024557 6 | 37 4588 4 +-----+ 36 | | 35 36 2 | | 34 15 2 | | 33 239 3 | + | 32 5566 4 *-----* 31 0247 4 | | 30 00069 5 | | 29 015669 6 +-----+ 28 5 1 | 27 4589 4 |
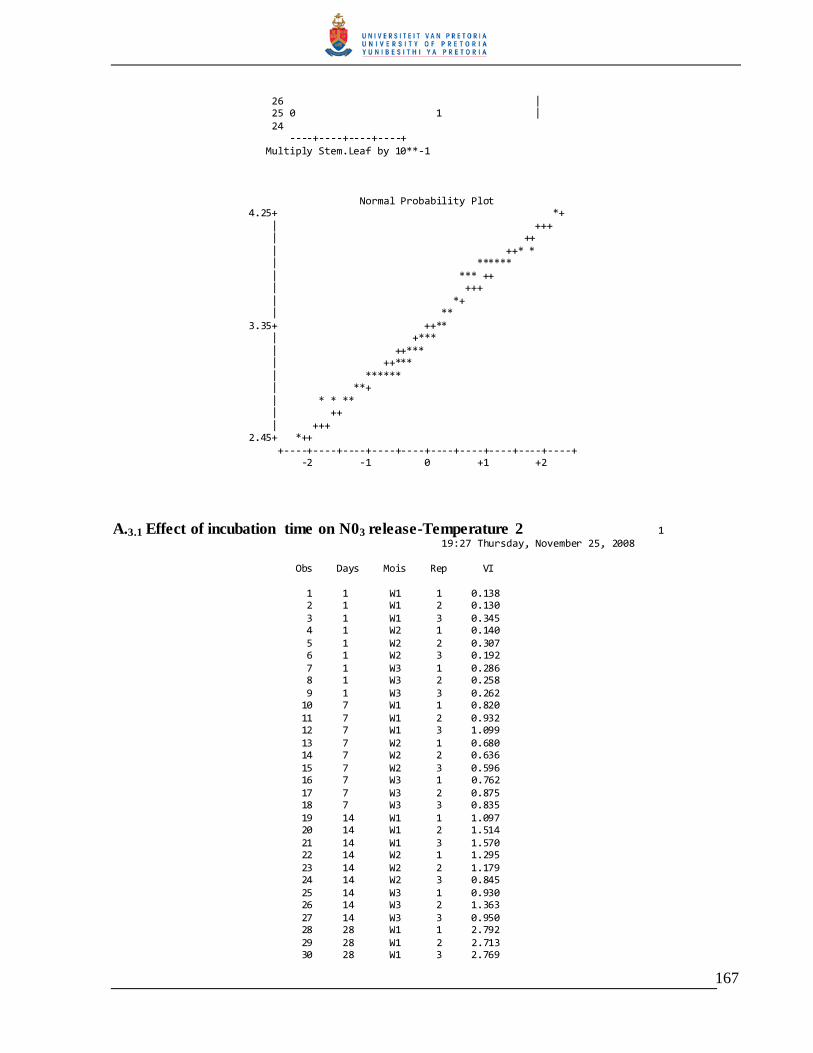
167
26 | 25 0 1 | 24 ----+----+----+----+ Multiply Stem.Leaf by 10**-1 Normal Probability Plot 4.25+ *+ | +++ | ++ | ++* * | ****** | *** ++ | +++ | *+ | ** 3.35+ ++** | +*** | ++*** | ++*** | ****** | **+ | * * ** | ++ | +++ 2.45+ *++ +----+----+----+----+----+----+----+----+----+----+ -2 -1 0 +1 +2
A.3.1 Effect of incubation time on N03 release-Temperature 2 1 19:27 Thursday, November 25, 2008 Obs Days Mois Rep VI 1 1 W1 1 0.138 2 1 W1 2 0.130 3 1 W1 3 0.345 4 1 W2 1 0.140 5 1 W2 2 0.307 6 1 W2 3 0.192 7 1 W3 1 0.286 8 1 W3 2 0.258 9 1 W3 3 0.262 10 7 W1 1 0.820 11 7 W1 2 0.932 12 7 W1 3 1.099 13 7 W2 1 0.680 14 7 W2 2 0.636 15 7 W2 3 0.596 16 7 W3 1 0.762 17 7 W3 2 0.875 18 7 W3 3 0.835 19 14 W1 1 1.097 20 14 W1 2 1.514 21 14 W1 3 1.570 22 14 W2 1 1.295 23 14 W2 2 1.179 24 14 W2 3 0.845 25 14 W3 1 0.930 26 14 W3 2 1.363 27 14 W3 3 0.950 28 28 W1 1 2.792 29 28 W1 2 2.713 30 28 W1 3 2.769
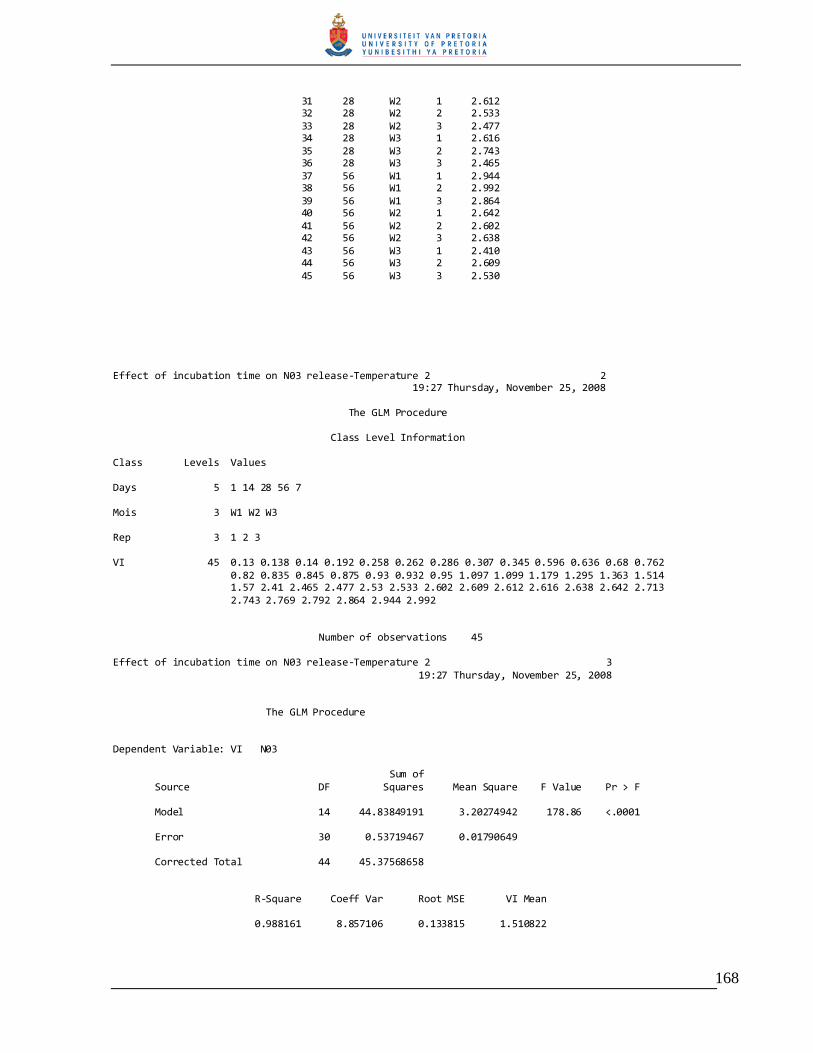
168
31 28 W2 1 2.612 32 28 W2 2 2.533 33 28 W2 3 2.477 34 28 W3 1 2.616 35 28 W3 2 2.743 36 28 W3 3 2.465 37 56 W1 1 2.944 38 56 W1 2 2.992 39 56 W1 3 2.864 40 56 W2 1 2.642 41 56 W2 2 2.602 42 56 W2 3 2.638 43 56 W3 1 2.410 44 56 W3 2 2.609 45 56 W3 3 2.530 Effect of incubation time on N03 release-Temperature 2 2 19:27 Thursday, November 25, 2008 The GLM Procedure Class Level Information Class Levels Values Days 5 1 14 28 56 7 Mois 3 W1 W2 W3 Rep 3 1 2 3 VI 45 0.13 0.138 0.14 0.192 0.258 0.262 0.286 0.307 0.345 0.596 0.636 0.68 0.762 0.82 0.835 0.845 0.875 0.93 0.932 0.95 1.097 1.099 1.179 1.295 1.363 1.514 1.57 2.41 2.465 2.477 2.53 2.533 2.602 2.609 2.612 2.616 2.638 2.642 2.713 2.743 2.769 2.792 2.864 2.944 2.992 Number of observations 45 Effect of incubation time on N03 release-Temperature 2 3 19:27 Thursday, November 25, 2008 The GLM Procedure Dependent Variable: VI N03 Sum of Source DF Squares Mean Square F Value Pr > F Model 14 44.83849191 3.20274942 178.86 <.0001 Error 30 0.53719467 0.01790649 Corrected Total 44 45.37568658 R-Square Coeff Var Root MSE VI Mean 0.988161 8.857106 0.133815 1.510822

169
Source DF Type I SS Mean Square F Value Pr > F Days 4 44.14732947 11.03683237 616.36 <.0001 Mois 2 0.43200111 0.21600056 12.06 0.0001 Days*Mois 8 0.25916133 0.03239517 1.81 0.1145 Source DF Type III SS Mean Square F Value Pr > F Days 4 44.14732947 11.03683237 616.36 <.0001 Mois 2 0.43200111 0.21600056 12.06 0.0001 Days*Mois 8 0.25916133 0.03239517 1.81 0.1145 Effect of incubation time on N03 release-Temperature 2 4 19:27 Thursday, November 25, 2008 The GLM Procedure Tukey's Studentized Range (HSD) Test for VI NOTE: This test controls the Type I experimentwise error rate, but it generally has a higher Type II error rate than REGWQ. Alpha 0.05 Error Degrees of Freedom 30 Error Mean Square 0.017906 Critical Value of Studentized Range 4.10208 Minimum Significant Difference 0.183 Means with the same letter are not significantly different. Tukey Grouping Mean N Days A 2.69233 9 56 A 2.63556 9 28 B 1.19367 9 14 C 0.80389 9 7 D 0.22867 9 1 Effect of incubation time on N03 release-Temperature 2 5
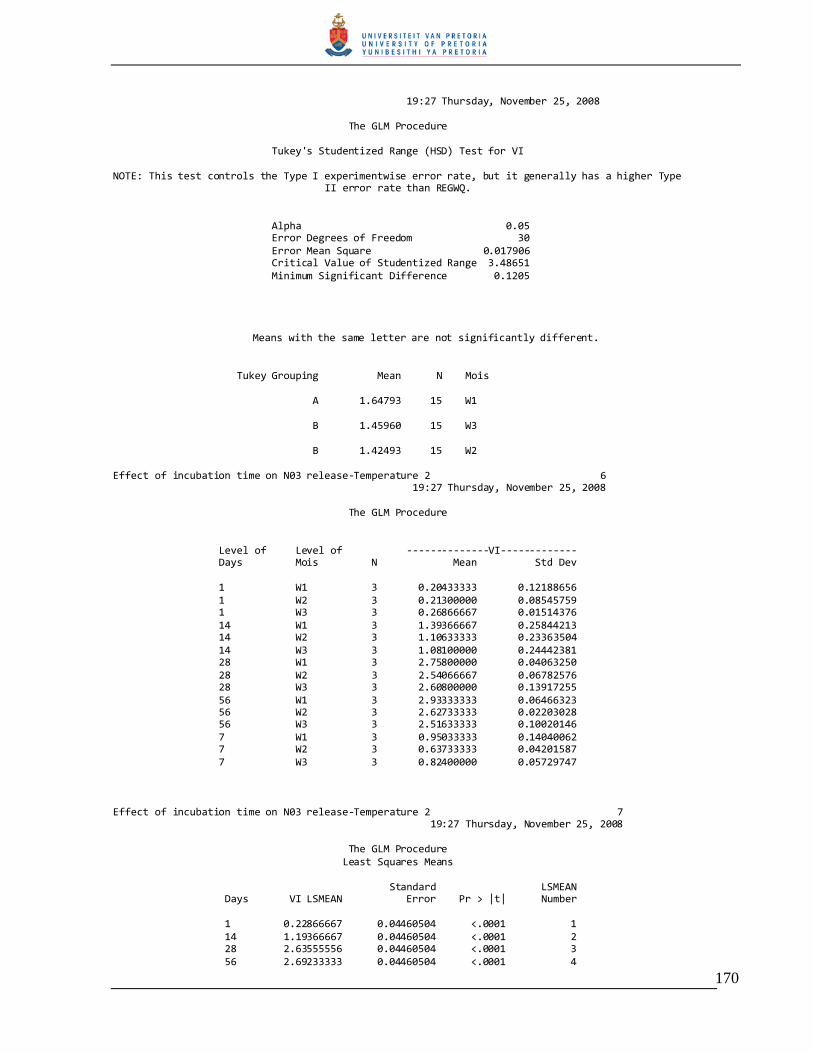
170
19:27 Thursday, November 25, 2008 The GLM Procedure Tukey's Studentized Range (HSD) Test for VI NOTE: This test controls the Type I experimentwise error rate, but it generally has a higher Type II error rate than REGWQ. Alpha 0.05 Error Degrees of Freedom 30 Error Mean Square 0.017906 Critical Value of Studentized Range 3.48651 Minimum Significant Difference 0.1205
Means with the same letter are not significantly different. Tukey Grouping Mean N Mois A 1.64793 15 W1 B 1.45960 15 W3 B 1.42493 15 W2 Effect of incubation time on N03 release-Temperature 2 6 19:27 Thursday, November 25, 2008 The GLM Procedure Level of Level of --------------VI------------- Days Mois N Mean Std Dev 1 W1 3 0.20433333 0.12188656 1 W2 3 0.21300000 0.08545759 1 W3 3 0.26866667 0.01514376 14 W1 3 1.39366667 0.25844213 14 W2 3 1.10633333 0.23363504 14 W3 3 1.08100000 0.24442381 28 W1 3 2.75800000 0.04063250 28 W2 3 2.54066667 0.06782576 28 W3 3 2.60800000 0.13917255 56 W1 3 2.93333333 0.06466323 56 W2 3 2.62733333 0.02203028 56 W3 3 2.51633333 0.10020146 7 W1 3 0.95033333 0.14040062 7 W2 3 0.63733333 0.04201587 7 W3 3 0.82400000 0.05729747 Effect of incubation time on N03 release-Temperature 2 7 19:27 Thursday, November 25, 2008 The GLM Procedure Least Squares Means Standard LSMEAN Days VI LSMEAN Error Pr > |t| Number 1 0.22866667 0.04460504 <.0001 1 14 1.19366667 0.04460504 <.0001 2 28 2.63555556 0.04460504 <.0001 3 56 2.69233333 0.04460504 <.0001 4
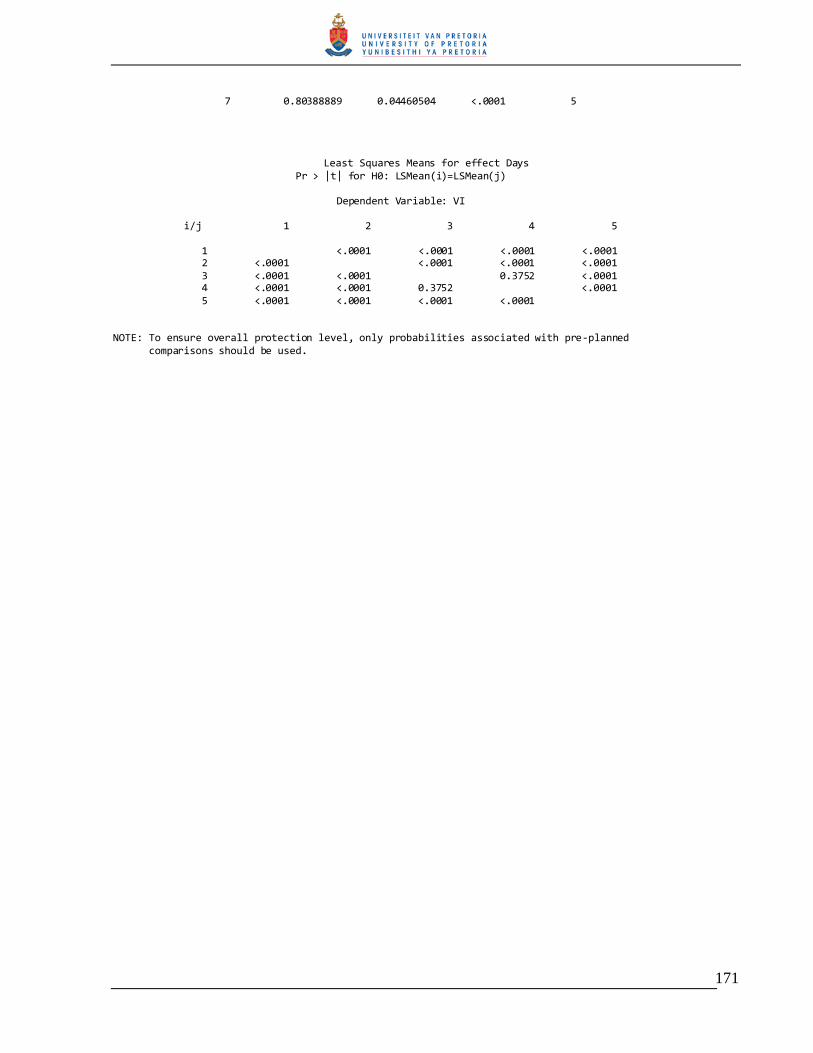
171
7 0.80388889 0.04460504 <.0001 5
Least Squares Means for effect Days Pr > |t| for H0: LSMean(i)=LSMean(j) Dependent Variable: VI i/j 1 2 3 4 5 1 <.0001 <.0001 <.0001 <.0001 2 <.0001 <.0001 <.0001 <.0001 3 <.0001 <.0001 0.3752 <.0001 4 <.0001 <.0001 0.3752 <.0001 5 <.0001 <.0001 <.0001 <.0001 NOTE: To ensure overall protection level, only probabilities associated with pre-planned comparisons should be used.

172
Standard LSMEAN Mois VI LSMEAN Error Pr > |t| Number W1 1.64793333 0.03455092 <.0001 1 W2 1.42493333 0.03455092 <.0001 2 W3 1.45960000 0.03455092 <.0001 3 Least Squares Means for effect Mois Pr > |t| for H0: LSMean(i)=LSMean(j) Dependent Variable: VI i/j 1 2 3 1 <.0001 0.0006 2 <.0001 0.4835 3 0.0006 0.4835 NOTE: To ensure overall protection level, only probabilities associated with pre-planned Effect of incubation time on N03 release-Temperature 2 8 19:27 Thursday, November 25, 2008 The GLM Procedure Least Squares Means comparisons should be used. Standard LSMEAN Days Mois VI LSMEAN Error Pr > |t| Number 1 W1 0.20433333 0.07725820 0.0129 1 1 W2 0.21300000 0.07725820 0.0098 2 1 W3 0.26866667 0.07725820 0.0016 3 14 W1 1.39366667 0.07725820 <.0001 4 14 W2 1.10633333 0.07725820 <.0001 5 14 W3 1.08100000 0.07725820 <.0001 6 28 W1 2.75800000 0.07725820 <.0001 7 28 W2 2.54066667 0.07725820 <.0001 8 28 W3 2.60800000 0.07725820 <.0001 9 56 W1 2.93333333 0.07725820 <.0001 10 56 W2 2.62733333 0.07725820 <.0001 11 56 W3 2.51633333 0.07725820 <.0001 12 7 W1 0.95033333 0.07725820 <.0001 13 7 W2 0.63733333 0.07725820 <.0001 14 7 W3 0.82400000 0.07725820 <.0001 15 Least Squares Means for effect Days*Mois Pr > |t| for H0: LSMean(i)=LSMean(j) Dependent Variable: VI i/j 1 2 3 4 5 6 7 8 1 0.9373 0.5604 <.0001 <.0001 <.0001 <.0001 <.0001 2 0.9373 0.6141 <.0001 <.0001 <.0001 <.0001 <.0001 3 0.5604 0.6141 <.0001 <.0001 <.0001 <.0001 <.0001 4 <.0001 <.0001 <.0001 0.0133 0.0076 <.0001 <.0001 5 <.0001 <.0001 <.0001 0.0133 0.8182 <.0001 <.0001
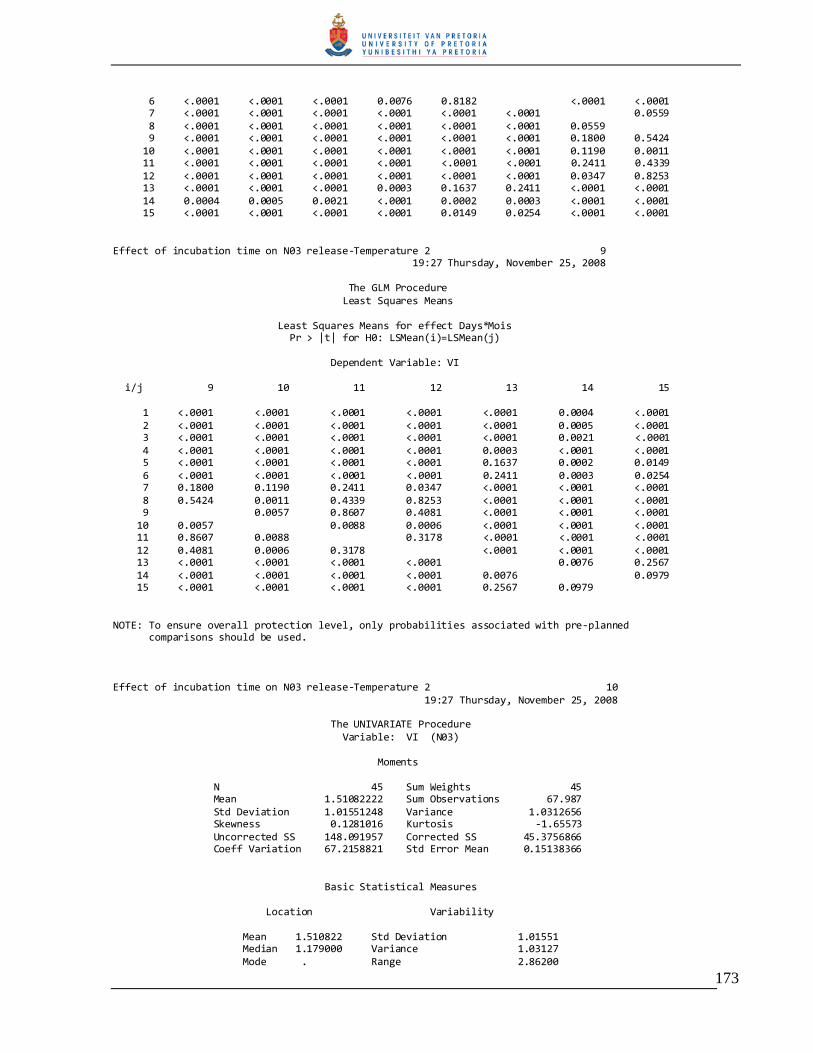
173
6 <.0001 <.0001 <.0001 0.0076 0.8182 <.0001 <.0001 7 <.0001 <.0001 <.0001 <.0001 <.0001 <.0001 0.0559 8 <.0001 <.0001 <.0001 <.0001 <.0001 <.0001 0.0559 9 <.0001 <.0001 <.0001 <.0001 <.0001 <.0001 0.1800 0.5424 10 <.0001 <.0001 <.0001 <.0001 <.0001 <.0001 0.1190 0.0011 11 <.0001 <.0001 <.0001 <.0001 <.0001 <.0001 0.2411 0.4339 12 <.0001 <.0001 <.0001 <.0001 <.0001 <.0001 0.0347 0.8253 13 <.0001 <.0001 <.0001 0.0003 0.1637 0.2411 <.0001 <.0001 14 0.0004 0.0005 0.0021 <.0001 0.0002 0.0003 <.0001 <.0001 15 <.0001 <.0001 <.0001 <.0001 0.0149 0.0254 <.0001 <.0001 Effect of incubation time on N03 release-Temperature 2 9 19:27 Thursday, November 25, 2008 The GLM Procedure Least Squares Means Least Squares Means for effect Days*Mois Pr > |t| for H0: LSMean(i)=LSMean(j) Dependent Variable: VI i/j 9 10 11 12 13 14 15 1 <.0001 <.0001 <.0001 <.0001 <.0001 0.0004 <.0001 2 <.0001 <.0001 <.0001 <.0001 <.0001 0.0005 <.0001 3 <.0001 <.0001 <.0001 <.0001 <.0001 0.0021 <.0001 4 <.0001 <.0001 <.0001 <.0001 0.0003 <.0001 <.0001 5 <.0001 <.0001 <.0001 <.0001 0.1637 0.0002 0.0149 6 <.0001 <.0001 <.0001 <.0001 0.2411 0.0003 0.0254 7 0.1800 0.1190 0.2411 0.0347 <.0001 <.0001 <.0001 8 0.5424 0.0011 0.4339 0.8253 <.0001 <.0001 <.0001 9 0.0057 0.8607 0.4081 <.0001 <.0001 <.0001 10 0.0057 0.0088 0.0006 <.0001 <.0001 <.0001 11 0.8607 0.0088 0.3178 <.0001 <.0001 <.0001 12 0.4081 0.0006 0.3178 <.0001 <.0001 <.0001 13 <.0001 <.0001 <.0001 <.0001 0.0076 0.2567 14 <.0001 <.0001 <.0001 <.0001 0.0076 0.0979 15 <.0001 <.0001 <.0001 <.0001 0.2567 0.0979 NOTE: To ensure overall protection level, only probabilities associated with pre-planned comparisons should be used. Effect of incubation time on N03 release-Temperature 2 10 19:27 Thursday, November 25, 2008 The UNIVARIATE Procedure Variable: VI (N03) Moments N 45 Sum Weights 45 Mean 1.51082222 Sum Observations 67.987 Std Deviation 1.01551248 Variance 1.0312656 Skewness 0.1281016 Kurtosis -1.65573 Uncorrected SS 148.091957 Corrected SS 45.3756866 Coeff Variation 67.2158821 Std Error Mean 0.15138366 Basic Statistical Measures Location Variability Mean 1.510822 Std Deviation 1.01551 Median 1.179000 Variance 1.03127 Mode . Range 2.86200
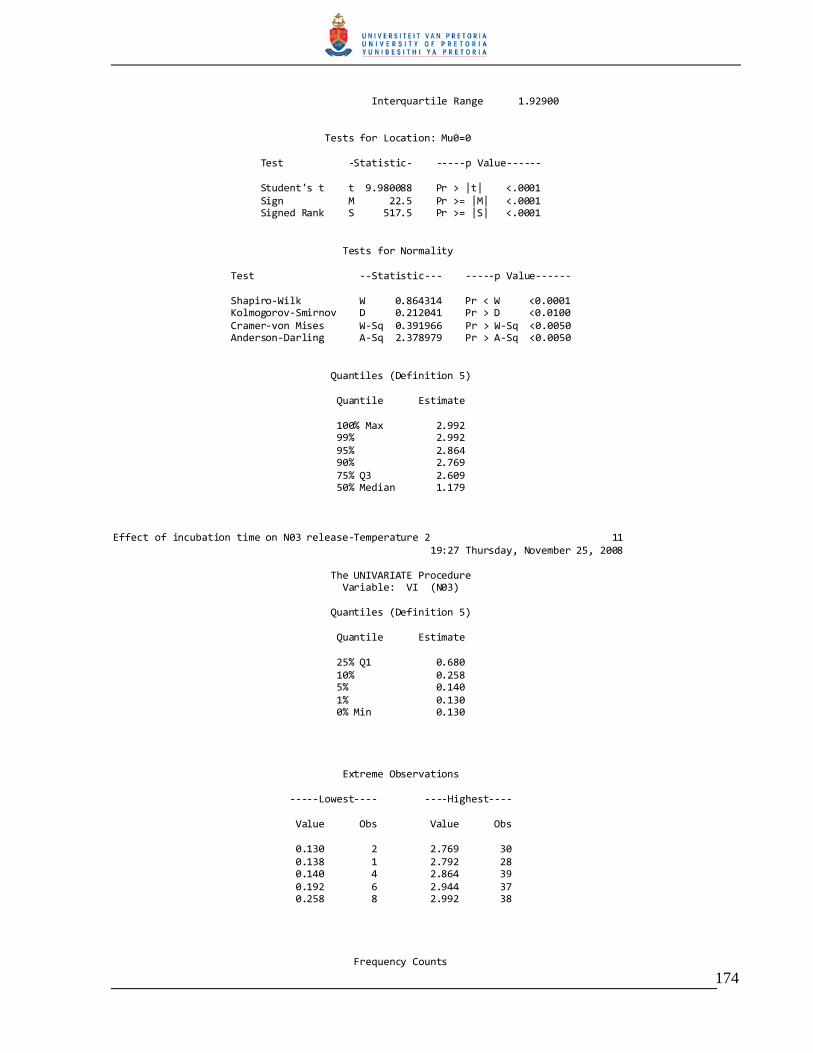
174
Interquartile Range 1.92900 Tests for Location: Mu0=0 Test -Statistic- -----p Value------ Student's t t 9.980088 Pr > |t| <.0001 Sign M 22.5 Pr >= |M| <.0001 Signed Rank S 517.5 Pr >= |S| <.0001 Tests for Normality Test --Statistic--- -----p Value------ Shapiro-Wilk W 0.864314 Pr < W <0.0001 Kolmogorov-Smirnov D 0.212041 Pr > D <0.0100 Cramer-von Mises W-Sq 0.391966 Pr > W-Sq <0.0050 Anderson-Darling A-Sq 2.378979 Pr > A-Sq <0.0050 Quantiles (Definition 5) Quantile Estimate 100% Max 2.992 99% 2.992 95% 2.864 90% 2.769 75% Q3 2.609 50% Median 1.179 Effect of incubation time on N03 release-Temperature 2 11 19:27 Thursday, November 25, 2008 The UNIVARIATE Procedure Variable: VI (N03) Quantiles (Definition 5) Quantile Estimate 25% Q1 0.680 10% 0.258 5% 0.140 1% 0.130 0% Min 0.130 Extreme Observations -----Lowest---- ----Highest---- Value Obs Value Obs 0.130 2 2.769 30 0.138 1 2.792 28 0.140 4 2.864 39 0.192 6 2.944 37 0.258 8 2.992 38 Frequency Counts

175
Percents Percents Percents Value Count Cell Cum Value Count Cell Cum Value Count Cell Cum 0.130 1 2.2 2.2 0.845 1 2.2 35.6 2.530 1 2.2 68.9 0.138 1 2.2 4.4 0.875 1 2.2 37.8 2.533 1 2.2 71.1 0.140 1 2.2 6.7 0.930 1 2.2 40.0 2.602 1 2.2 73.3 0.192 1 2.2 8.9 0.932 1 2.2 42.2 2.609 1 2.2 75.6 0.258 1 2.2 11.1 0.950 1 2.2 44.4 2.612 1 2.2 77.8 0.262 1 2.2 13.3 1.097 1 2.2 46.7 2.616 1 2.2 80.0 0.286 1 2.2 15.6 1.099 1 2.2 48.9 2.638 1 2.2 82.2 0.307 1 2.2 17.8 1.179 1 2.2 51.1 2.642 1 2.2 84.4 0.345 1 2.2 20.0 1.295 1 2.2 53.3 2.713 1 2.2 86.7 0.596 1 2.2 22.2 1.363 1 2.2 55.6 2.743 1 2.2 88.9 0.636 1 2.2 24.4 1.514 1 2.2 57.8 2.769 1 2.2 91.1 0.680 1 2.2 26.7 1.570 1 2.2 60.0 2.792 1 2.2 93.3 0.762 1 2.2 28.9 2.410 1 2.2 62.2 2.864 1 2.2 95.6 0.820 1 2.2 31.1 2.465 1 2.2 64.4 2.944 1 2.2 97.8 0.835 1 2.2 33.3 2.477 1 2.2 66.7 2.992 1 2.2 100.0 Effect of incubation time on N03 release-Temperature 2 12 19:27 Thursday, November 25, 2008 The UNIVARIATE Procedure Variable: VI (N03) Stem Leaf # Boxplot 28 649 3 | 26 0112441479 10 +-----+ 24 16833 5 | | 22 | | 20 | | 18 | | 16 | | 14 17 2 | + | 12 06 2 | | 10 008 3 *-----* 8 2448335 7 | | 6 0486 4 +-----+ 4 | 2 66914 5 | 0 3449 4 | ----+----+----+----+ Multiply Stem.Leaf by 10**-1 Normal Probability Plot 2.9+ ++ * * * | ********* | *** ++ | ++ | ++ | ++ | ++ 1.5+ ++ * | ++ * | ++ ** | +**** | +** | ++* | ***** 0.1+ * * * *+ +----+----+----+----+----+----+----+----+----+----+ -2 -1 0 +1 +2

176
Related Documents