1

Welcome message from author
This document is posted to help you gain knowledge. Please leave a comment to let me know what you think about it! Share it to your friends and learn new things together.
Transcript
1
2
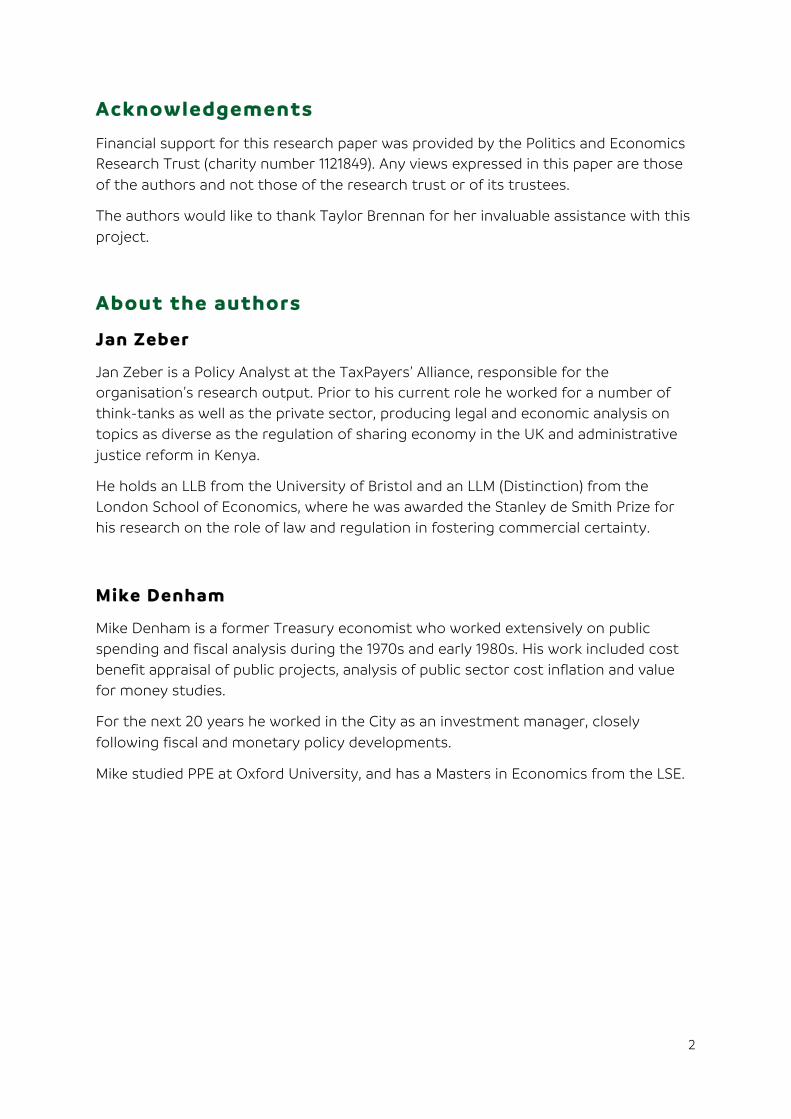
Acknowledgements
Financial support for this research paper was provided by the Politics and Economics Research Trust (charity number 1121849). Any views expressed in this paper are those
of the authors and not those of the research trust or of its trustees.
The authors would like to thank Taylor Brennan for her invaluable assistance with this
project.
About the authors
Jan Zeber
Jan Zeber is a Policy Analyst at the TaxPayers’ Alliance, responsible for the organisation’s research output. Prior to his current role he worked for a number of think-tanks as well as the private sector, producing legal and economic analysis on topics as diverse as the regulation of sharing economy in the UK and administrative
justice reform in Kenya.
He holds an LLB from the University of Bristol and an LLM (Distinction) from the London School of Economics, where he was awarded the Stanley de Smith Prize for his research on the role of law and regulation in fostering commercial certainty.
Mike Denham
Mike Denham is a former Treasury economist who worked extensively on public spending and fiscal analysis during the 1970s and early 1980s. His work included cost benefit appraisal of public projects, analysis of public sector cost inflation and value for money studies.
For the next 20 years he worked in the City as an investment manager, closely
following fiscal and monetary policy developments.
Mike studied PPE at Oxford University, and has a Masters in Economics from the LSE.

3
A taxing matter of inflation
“By a continuing process of inflation, governments can confiscate, secretly and unobserved, an
important part of the wealth of their citizens. By this method they not only confiscate, but they
confiscate arbitrarily; and, while the process impoverishes many, it actually enriches some.”
John Maynard Keynes, The Economic Consequences of Peace, 1919
“Inflation is the only form of taxation that can be levied without any legislation.”
Milton Friedman, A Monetary History of the United States, 1867-1960, 1963
“The Bank of England has long stressed that central bank policies are not the cause of low rates,
but responses to them. We are actors in a play written by others.”
Mark Carney, Arthur Burns Memorial Lecture, 2016
Key terms
Seigniorage
• There are a number of definitions of seigniorage, but for the purposes of this research note it is best understood as the amount of interest the government is
effectively able to avoid by issuing banknotes and coins. These are liabilities issued by
the state, but unlike the holders of gilts and bills, holders of notes and coins do not
receive interest.
Inflation tax
• Inflation tax is the amount the amount of money transferred from net creditors to
net debtors due to inflation.
• Inflation works as a tax on nominal assets and interest-bearing debt with a rate of
interest below the rate of inflation.
Key findings
• The total amount of seigniorage revenue in financial year 2016-2017 was £2.3 billion.
• Since 1980, the constant rise in the money supply has resulted in a historic
seigniorage revenue of £75.6 billion.
• The total amount of inflation tax raised in financial year 2016-2017 was £33.8 billion,
the highest since at least 1980 and 43 per cent higher than the previous peak of £24.4
billion in 2013.
• Since 1980, the inflation tax has yielded revenue of £479.7 billion.
4
Introduction
Is inflation a tax? At first glance, it may be tempting to conclude that it is not. It does not
appear anywhere on the statute books. Nobody is charged with collecting it. Yet just like a
tax, it is a transfer of wealth not based on free exchange.
The aim of this note is to estimate just how much money effectively changes hands in real
terms as a result of inflation. As of September 2017, UK inflation is growing at a rate of 2.8 per
cent as measured by CPIH, the new headline index used by the ONS.12
It is therefore a good time to consider how inflation affects governments, producers and
consumers. It is of course impossible to be completely in control of a market economy, and
the levers of monetary policy are in the hands of central bankers. But this does not mean that
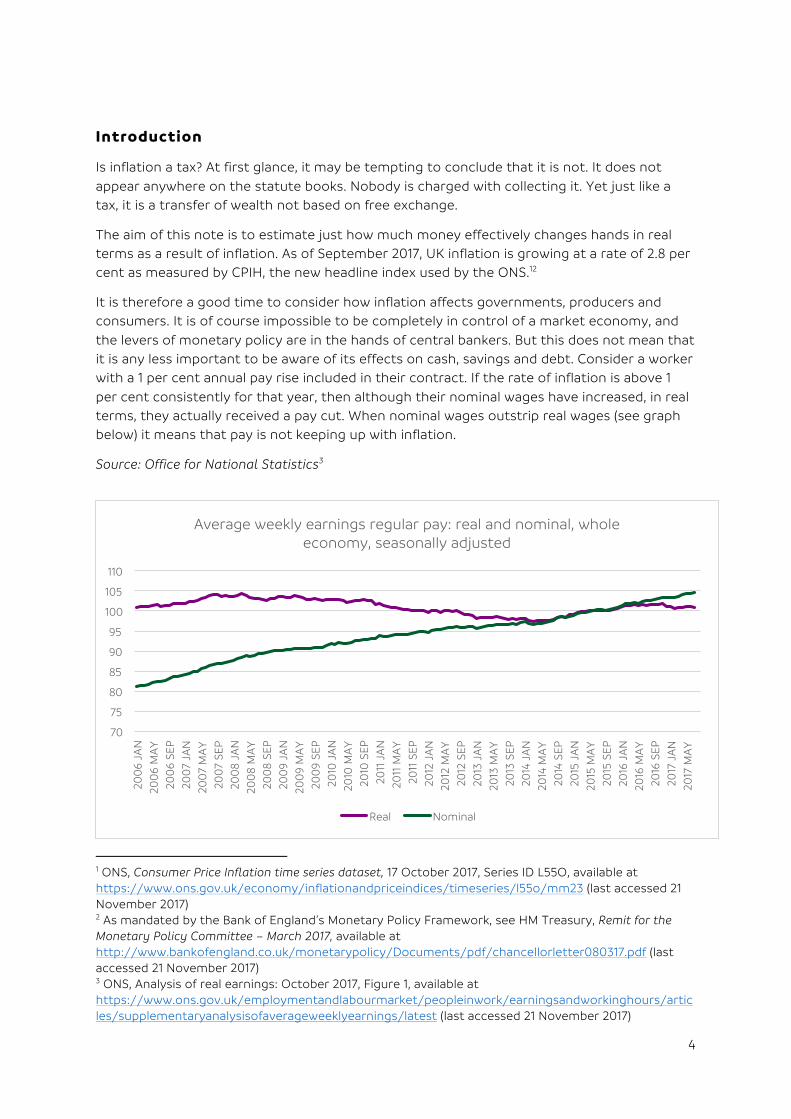
it is any less important to be aware of its effects on cash, savings and debt. Consider a worker
with a 1 per cent annual pay rise included in their contract. If the rate of inflation is above 1
per cent consistently for that year, then although their nominal wages have increased, in real
terms, they actually received a pay cut. When nominal wages outstrip real wages (see graph
below) it means that pay is not keeping up with inflation.
Source: Office for National Statistics3
1 ONS, Consumer Price Inflation time series dataset, 17 October 2017, Series ID L55O, available at https://www.ons.gov.uk/economy/inflationandpriceindices/timeseries/l55o/mm23 (last accessed 21 November 2017) 2 As mandated by the Bank of England’s Monetary Policy Framework, see HM Treasury, Remit for the Monetary Policy Committee – March 2017, available at http://www.bankofengland.co.uk/monetarypolicy/Documents/pdf/chancellorletter080317.pdf (last accessed 21 November 2017) 3 ONS, Analysis of real earnings: October 2017, Figure 1, available at https://www.ons.gov.uk/employmentandlabourmarket/peopleinwork/earningsandworkinghours/articles/supplementaryanalysisofaverageweeklyearnings/latest (last accessed 21 November 2017)
70
75
80
85
90
95
100
105
110
200
6 JA
N
200
6 M
AY
200
6 SE
P
200
7 JA
N
200
7 M
AY
200
7 SE
P
200
8 J
AN
200
8 M
AY
200
8 S
EP
200
9 JA
N
200
9 M
AY
200
9 SE
P
2010
JA
N
2010
MA
Y
2010
SE
P
2011
JA
N
2011
MA
Y
2011
SE
P
2012
JA
N
2012
MA
Y
2012
SE
P
2013
JA
N
2013
MA
Y
2013
SE
P
2014
JA
N
2014
MA
Y
2014
SE
P
2015
JA
N
2015
MA
Y
2015
SE
P
2016
JA
N
2016
MA
Y
2016
SE
P
2017
JA
N
2017
MA
Y
Average weekly earnings regular pay: real and nominal, whole economy, seasonally adjusted
Real Nominal
5
It is not the intention of this paper to argue that inflation is always bad or to advance
complex arguments for or against this or that monetary policy measure. Rather, it is a simple
exercise in, firstly, introducing the concept of inflation, and secondly, attempting to quantify
some of the effects it has on the distribution of wealth between net creditors (such as savers)
and net debtors (such as governments or those with large mortgages). As with any
calculation of this nature, the results are necessarily approximations stemming from
inevitable inaccuracies in the underlying data and/or lack of adjustments made for
inconsistencies in patterns of asset distribution.
What is inflation and how is it measured?
At most basic, inflation is a measure of how quickly prices increase. It is measured by
collecting data on 180,000 prices of 650 selected items grouped into a “basket of goods”.4 The
composition of the basket is updated every year to account not just for changes in price but
also in consumer habits, with some products added and some removed.
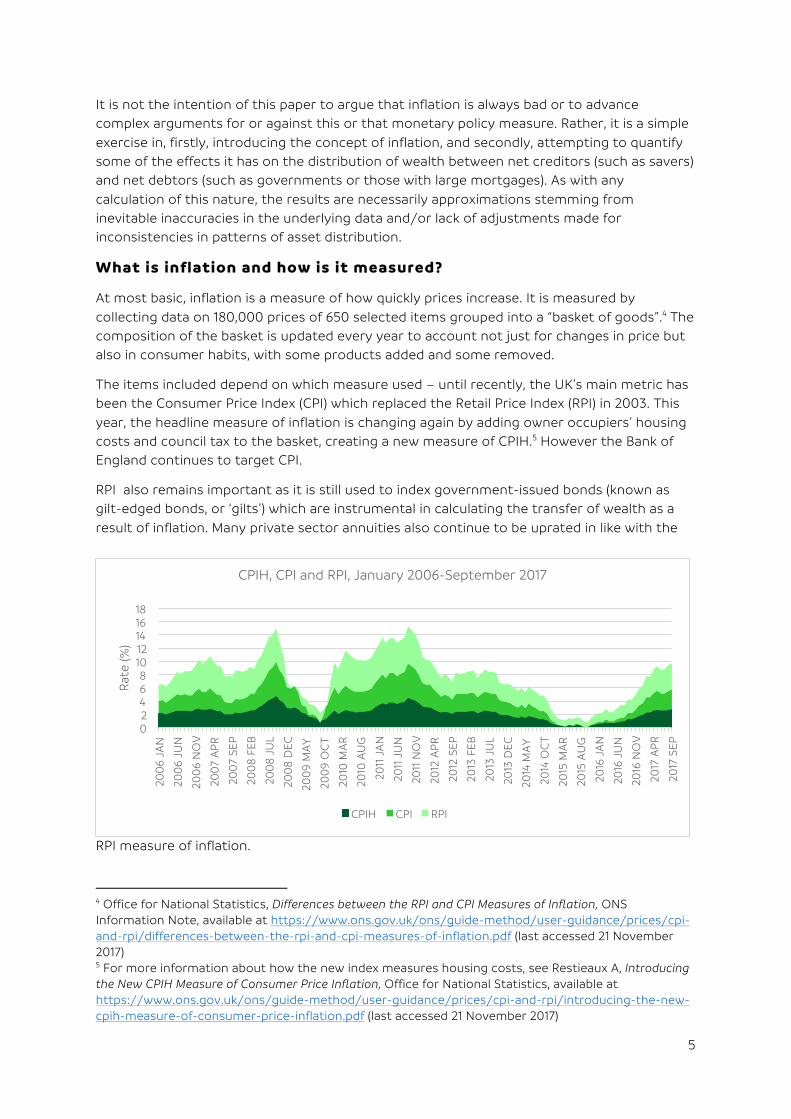
The items included depend on which measure used – until recently, the UK’s main metric has
been the Consumer Price Index (CPI) which replaced the Retail Price Index (RPI) in 2003. This
year, the headline measure of inflation is changing again by adding owner occupiers’ housing
costs and council tax to the basket, creating a new measure of CPIH.5 However the Bank of
England continues to target CPI.
RPI also remains important as it is still used to index government-issued bonds (known as
gilt-edged bonds, or ‘gilts’) which are instrumental in calculating the transfer of wealth as a
result of inflation. Many private sector annuities also continue to be uprated in like with the
RPI measure of inflation.
4 Office for National Statistics, Differences between the RPI and CPI Measures of Inflation, ONS Information Note, available at https://www.ons.gov.uk/ons/guide-method/user-guidance/prices/cpi-and-rpi/differences-between-the-rpi-and-cpi-measures-of-inflation.pdf (last accessed 21 November 2017) 5 For more information about how the new index measures housing costs, see Restieaux A, Introducing the New CPIH Measure of Consumer Price Inflation, Office for National Statistics, available at https://www.ons.gov.uk/ons/guide-method/user-guidance/prices/cpi-and-rpi/introducing-the-new-cpih-measure-of-consumer-price-inflation.pdf (last accessed 21 November 2017)
0 2 4 6 8
10 12 14 16 18
200
6 JA
N
200
6 JU
N
200
6 N
OV
200
7 A
PR
200
7 SE
P
200
8 F
EB
200
8 J
UL
200
8 D
EC
200
9 M
AY
200
9 O
CT
2010
MA
R
2010
AU
G
2011
JA
N
2011
JU
N
2011
NO
V
2012
AP
R
2012
SE
P
2013
FE
B
2013
JU
L
2013
DE
C
2014
MA
Y
2014
OC
T
2015
MA
R
2015
AU
G
2016
JA
N
2016
JU
N
2016
NO
V
2017
AP
R
2017
SE
P
Rat
e (%
)
CPIH, CPI and RPI, January 2006-September 2017
CPIH CPI RPI

6
Source: Office for National Statistics6
Another measure of price changes in an economy is the GDP price deflator. This differs
significantly from the three we have already discussed as it does not involve a basket of
goods.
It is calculated as follows:
𝐺𝐷𝑃 𝑝𝑟𝑖𝑐𝑒 𝑑𝑒𝑓𝑙𝑎𝑡𝑜𝑟 = 𝑛𝑜𝑚𝑖𝑛𝑎𝑙 𝐺𝐷𝑃𝑟𝑒𝑎𝑙 𝐺𝐷𝑃
×100
For the purposes of this note, the measure of inflation used in all calculations will be the GDP
Price Deflator.
Source: Office for National Statistics7
What causes inflation?
An in-depth consideration of the causes of inflation is beyond the scope of this paper,
however, it is worth distinguishing between three types of inflationary pressure.
Quantity theory of money
Perhaps the most widely known cause of inflation is the printing of additional money by
central banks. To be sure, most of the time adding extra currency into the monetary base will
be inflationary, prompting producers to raise prices. This is because ‘too much money is
6 ONS, UK consumer price inflation: September 2017, released 17 October 2017, available at https://www.ons.gov.uk/economy/inflationandpriceindices/bulletins/consumerpriceinflation/september2017 (last accessed 21 November 2017) 7 ONS, ‘GDP deflators at market prices, and money GDP September 2017 (Quarterly National Accounts, September 2017)’ available at https://www.gov.uk/government/statistics/gdp-deflators-at-market-prices-and-money-gdp-september-2017-quarterly-national-accounts-september-2017 (last accessed 21 November 2017)
0
5
10
15
20
25
30
1949
19
51
1953
19
55
1957
19
59
1961
19
63
1965
19
67
1969
19
71
1973
19
75
1977
19
79
198
1 19
83
198
5 19
87
198
9 19
91
1993
19
95
1997
19
99
200
1 20
03
200
5 20
07
200
9 20
11
2013
20
15
Gro
wth
Rat
e (%
)
Year
GDP deflator: year on year growth, seasonally adjusted

7
chasing too few goods.’8 Whilst the nominal value of the total stock of money in the economy
can be freely manipulated, its purchasing power – or ‘real’ value – cannot. This is known as
the ‘quantity theory of money’, mostly associated with ‘monetarism’ of Milton Friedman, a
school which viewed inflation as ‘always and everywhere a monetary phenomenon.’9 It can be
formally expressed as MV = PT, where M denotes money supply multiplied by V, which stands
velocity of circulation, or the amount of times money changes hands. This equals to P, price
level, multiplied by T, denoting volume of transactions.10 According to this theory, the two
variables are in direct correlation.
There are many historical examples where a dramatic increase in the money supply caused
prices to skyrocket, with 1920s Germany and modern-day Zimbabwe being perhaps the
starkest examples. By January 1923, one US dollar purchased 48,000 Reichmarks, which by
November that year had risen to four billion.11 In 2015, 100 trillion Zimbabwean dollars
commanded just 40 US cents.12
It is equally true that those are extreme examples of hyperinflation. Estimating how much
impact moderate increase in monetary base will have on the price level is much more difficult,
and there will be instances where even a significant increase in money supply may not have a
significant impact on the price level, because they fail to result in an increased demand for
money. This can happen when an economy is in recession because there is a drop in the
volume of transactions, which means prices are less likely to increase in an attempt to shore
up demand - this is known as the ‘liquidity trap’13 Another example where this might happen
is, ironically, when an economy is growing rapidly. If an increase in money supply is matched
by an increase in output, we will not have too much money chasing too few goods, as there
will be more goods. Clearly, there are a number of assumptions behind Friedman’s view which
will not always hold true – further analysis of when they will obtain is beyond the scope of
this paper.
Demand pull and cost push
Related but distinct is the idea that inflation is predominantly a function of demand, which
could be triggered by an increase in monetary base but could also be caused by factors
separate from the money supply, such as a sharp uptick in GDP or productivity. Either way, in
this case also, ‘too much money is chasing too few goods.’ By contrast, ‘cost-push’ inflation
relates to the rising price of inputs such as raw materials or labour while demand stays
constant. In essence, it is triggered by the supply side rather than the demand side. These
tend to be caused by things like government regulation, taxation, embargoes or natural
8 Friedman, M, A Monetary History of the United States, 1867-1960 (Princeton University Press, 2008) 9 Ibid 10 The development and formalization of this theory is attributed to Irving Fisher, for a good introduction see Humphrey, TM, ‘Fisher and Wicksell on the Quantity Theory’ (1997) Economic Quarterly 84(4) 71-90, available at https://www.richmondfed.org/-/media/richmondfedorg/publications/research/economic_quarterly/1997/fall/pdf/humphrey.pdf (last accessed 21 November 2017) 11 Unattributed, ‘Germany’s hyperinflation-phobia’ The Economist, 15 November 2013, available at https://www.economist.com/blogs/freeexchange/2013/11/economic-history-1 (last accessed 21 November 2017) 12 Unattributed, ‘Zimbabwe’s 100-trillion dollar note gains in value’ Wall Street Journal, 16 June 2017, available at http://www.wsj.com/video/zimbabwes-100-trillion-dollar-note-gains-in-value/E32B371E-2016-4BAC-9FDA-5CBE5DB7FE7C.html (last accessed 21 November 2017) 13 Keynes, JM, The General Theory of Employment, Interest and Money, chapter 15

8
disasters rather than by monetary factors. John Maynard Keynes was the first to make a
distinction between the two types, attacking Friedman’s view as too simplistic.
One way to understand the two views is to regard it as a debate about what constitutes
inflation. According to Monetarists, a supply-side triggered rise in prices should not be
regarded as inflation, because it is simply a sign of price signals reflecting supply and demand
balance. The extent to which it will affect those holding liquid currency will depend on the
proportion that the goods affected constitute their household expenditure, which will provide
an incentive to switch to an alternative good or set of goods. But this switch would not be
possible or at the very least less likely if prices rose as a result of an increase in the monetary
base, because the increase would be dispersed over all or most of the goods in an economy.
In the context of inflation tax, it is clear that not all forms of inflation could or should be
understood as a tax, in so far as we understand tax to mean a transfer of wealth from private
citizens to the government. But it is true that all forms of inflation create winners and losers.
Consider a frequent example of a trigger to cost-push inflation – a hypothetical decision by
OPEC to restrict oil production, causing the prices of petrol to rise, notching up inflation
indices where petrol and diesel feature prominently. Assuming it is not an oil exporter, the
government in this instance is not a winner since it derives no benefit from the higher prices.
It is also difficult to talk about a positive effect on net debtors, because despite higher prices,
the value of the currency stays the same!
What is the inflation tax?
There is no consensus on the question of whether or not inflation can be considered a tax,
despite a fairly frequent usage of the phrase “inflation tax.”
Seigniorage
A common use of the phrase ‘inflation tax’ refers to seigniorage, though they’re not quite the
same thing. Inflation tax is a broader definition. Seigniorage is a form of inflation tax, but the
latter can also include revenue from issuing interest bearing liabilities such as gilts. Even more
broadly, it is sometimes used to refer to any situation where as a result of inflation there is a
transfer from net creditors such as savers to net debtors such as the government.
Seigniorage is the technical term given specifically to the value created by governments in
the process of issuing non-interest bearing liabilities such as newly minted notes and coin, or
(until reforms to the monetary system introduced in 2006)14 accruals gained on reserves of
commercial bank deposits at the Bank of England.15
In order to calculate seigniorage for any given year, we first take the total monetary base for
that year, and then multiply it by the average rate of interest paid on total outstanding
interest-bearing debt for that year. To get to that, we divide the total debt interest paid in a
14 Bank of England, The implications of money market reform for data published in Monetary and Financial Statistics, June 2006, http://www.bankofengland.co.uk/statistics/Documents/ms/articles/artjun06.pdf (last accessed 21 November 2017) 15 Janssen, N, Publication of narrow money data: the implications of money market reform, http://www.bankofengland.co.uk/publications/Documents/quarterlybulletin/qb050304.pdf (last accessed 21 November 2017)

9
given year by the total outstanding stock of interest bearing debt. The table below gives a
time series of the above running from 1980:
Table 1: Seigniorage revenue and cumulative seigniorage revenue, 1980-2017
Year Monetary Base - M0
Narrow Money 16/Not
es and Coin (£bn) 17
Public Sector Net Debt
exc PSB
(£bn)18
CG debt interest
exc PSB inc BoE
(gross)(£bn)19
Average
interest rate
(%)
Seigniorage revenue
(£bn)
Cumulative
seigniorage revenue
(£bn)
1980 11.18 98.20 7.60 8 0.87 0.87
1981 11.95 113.80 9.20 8 0.97 1.83
1982 11.93 125.20 11.20 9 1.07 2.90
1983 12.56 132.50 12.10 9 1.15 4.05
1984 13.27 143.60 13.20 9 1.22 5.27
1985 14.00 157.00 14.70 9 1.31 6.58
1986 14.48 162.50 16.60 10 1.48 8.05
1987 15.12 167.80 17.20 10 1.55 9.60
1988 15.99 167.40 18.40 11 1.76 11.36
1989 17.00 153.70 19.00 12 2.10 13.46
1990 18.04 151.90 19.80 13 2.35 15.81
1991 18.49 151.10 19.50 13 2.39 18.20
1992 18.86 165.80 17.50 11 1.99 20.19
1993 19.77 201.90 18.40 9 1.80 21.99
1994 20.88 249.80 20.10 8 1.68 23.67
1995 22.37 290.00 22.80 8 1.76 25.43
16 Bank of England, Monthly average amount outstanding of total sterling M0 (in sterling millions) seasonally adjusted (discontinued April 2006), LPMAVAE, available at http://www.bankofengland.co.uk/boeapps/iadb/FromShowColumns.asp?Travel=NIxSSx&SearchText=LPMAVAE (last accessed 21 November 2017) 17 Bank of England, Monthly average amount outstanding of total sterling notes and coin in circulation, excluding backing assets for commercial banknote issue in Scotland and Northern Ireland total (in sterling millions) not seasonally adjusted, LPMAVAA, available at http://www.bankofengland.co.uk/boeapps/iadb/FromShowColumns.asp?Travel=NIxSSx&SearchText=LPMAVAA (last accessed 21 November 2017)18 Keep, M, ‘Government borrowing, debt and debt interest: historical statistics and forecasts’, House of Commons Library Briefing Paper Number 05745, 20 October 2017, available at http://researchbriefings.parliament.uk/ResearchBriefing/Summary/SN05745#fullreport (last accessed 21 November 2017) 19 Ibid

10
Year Monetary Base - M0
Narrow Money 16/Not
es and Coin (£bn) 17
Public Sector Net Debt
exc PSB
(£bn)18
CG debt interest
exc PSB inc BoE
(gross)(£bn)19
Average
interest rate
(%)
Seigniorage revenue
(£bn)
Cumulative
seigniorage revenue
(£bn)
1996 23.64 322.10 26.10 8 1.92 27.35
1997 25.12 347.00 27.60 8 2.00 29.35
1998 26.72 358.60 29.30 8 2.18 31.53
1999 28.19 357.80 28.80 8 2.27 33.80
2000 30.56 349.30 25.20 7 2.21 36.00
2001 33.11 316.70 26.20 8 2.74 38.74
2002 35.54 323.10 22.30 7 2.45 41.20
2003 37.88 356.20 20.90 6 2.22 43.42
2004 40.55 391.00 22.20 6 2.30 45.72
2005 42.62 446.50 24.80 6 2.37 48.09
200620 45.48 487.20 26.50 5 2.47 50.56
2007 45.72 523.60 28.80 6 2.51 53.08
2008 49.49 557.20 31.40 6 2.79 55.86
2009 53.01 768.30 31.70 4 2.19 58.05
2010 56.11 1011.90 31.80 3 1.76 59.82
2011 57.83 1157.60 46.80 4 2.34 62.15
2012 61.04 1253.10 49.80 4 2.43 64.58
2013 64.23 1363.60 49.00 4 2.31 66.89
2014 66.32 1464.40 48.80 3 2.21 69.10
2015 70.57 1554.70 45.40 3 2.06 71.16
2016 75.44 1602.60 45.10 3 2.12 73.28
2017 80.60 1726.90 48.70 3 2.27 75.55
Source: Office for National Statistics and the Bank of England
The following question may be asked: if the government is in a position to issue non-interest
bearing debt, why the need to issue interest-bearing products such as gilts at all if the
savings on debt interest payments are (as shown above) clearly substantial? The answer is
that the point at which the costs of issuing more and more non-interest bearing debt (i.e.
currency)21 outstrip benefits tends to come very quickly, with the main one being of course
the inflationary pressure resulting from a higher supply of money. It is true that “optimal
seigniorage” (i.e. the maximum amount raised at minimum cost) is possible to calculate for
20 The red line denotes when the 2006 money market reform was implemented and the definition of monetary base changed from M0 Narrow Money (notes, coin and Bank of England commercial bank deposits, also known as Bank of England Reserves) to the stock of notes and coin only, because commercial bank deposits at the Bank of England became interest-bearing and therefore less liquid. 21 It may be a little counter-intuitive at first to think of money in circulation as part of the government debt, and indeed, the practice of listing the monetary base under liabilities in the national accounts largely stems back to the times where anyone could exchange a bank note for a corresponding amount of gold. But every asset needs a corresponding liability. If the bank notes in circulation aren’t the liability of the public sector, whose liability are they?

11
every year.22 The consequences of going too far, however, are significant, as painfully
experienced by Zimbabwe, Venezuela and Weimar Germany.
How seigniorage revenue changes over time is a function of, firstly, the size of the monetary
base, and secondly, average rates of interest being paid on total interest-bearing debt:
Source: Office for National Statistics and the Bank of England
Inflation Tax
But seigniorage is only part of the story. Anyone in a position of a net debtor generally
benefits from inflation in the sense that the value of their liabilities shrinks relative to the
value of all other liabilities, such as everyday expenditure.
Suppose we lend someone £100, which at the time can purchase 100 units of goods. We have
an ‘asset’ in the form of creditorship of a £100 debt, whereas they have a ‘liability’ in the form
of being £100 pounds in debt. Now suppose that, a month later, that £100 can buy only 50
units of goods. Who lost and who gained? The creditor lost, because just like their stock of
liquid cash, their IOU of £100 has since diminished in value. But notice what happened to the
position of the debtor. The value of their debt has gone down, which means that their overall
position went up, assuming that prices and incomes have had time to adjust!
So let us think about the most significant net debtor in the UK – the British state. The table
below shows the increase in the government wealth as a result of inflation for every year
going back to 1980. The total outstanding stock of conventional (non-index linked) gilts, i.e.
the total amount owed by the government issued in fixed-interest debt, and the total
monetary base is multiplied by the rate of inflation as measured by the GDP price deflator.
In this paper, ‘monetary base’ is taken to mean ‘M0 Narrow Money’ until its discontinuation in
April 2006 as part of the Money Market Reform.23 After that period, figures for total stock of
22 See for example Mankiw, NG, ‘The optimal collection of seigniorage: theory and evidence’ (1987) Journal of Monetary Economics 20, 327-341, available at https://scholar.harvard.edu/mankiw/files/optimal_collection.pdf (last accessed 21 November 2017)23 Bank of England, Explanatory notes – M0, available at http://www.bankofengland.co.uk/statistics/Pages/iadb/notesiadb/m0.aspx (last accessed 21 November 2017)
0.00
0.50
1.00
1.50
2.00
2.50
3.00
1980 1982 1984 1986 1988 1990 1992 1994 1996 1998 2000 2002 2004 2006 2008 2010 2012 2014 2016
Seig
nio
rag
e (£
bn
)
Year
Seigniorage revenue, 1980-2017
12
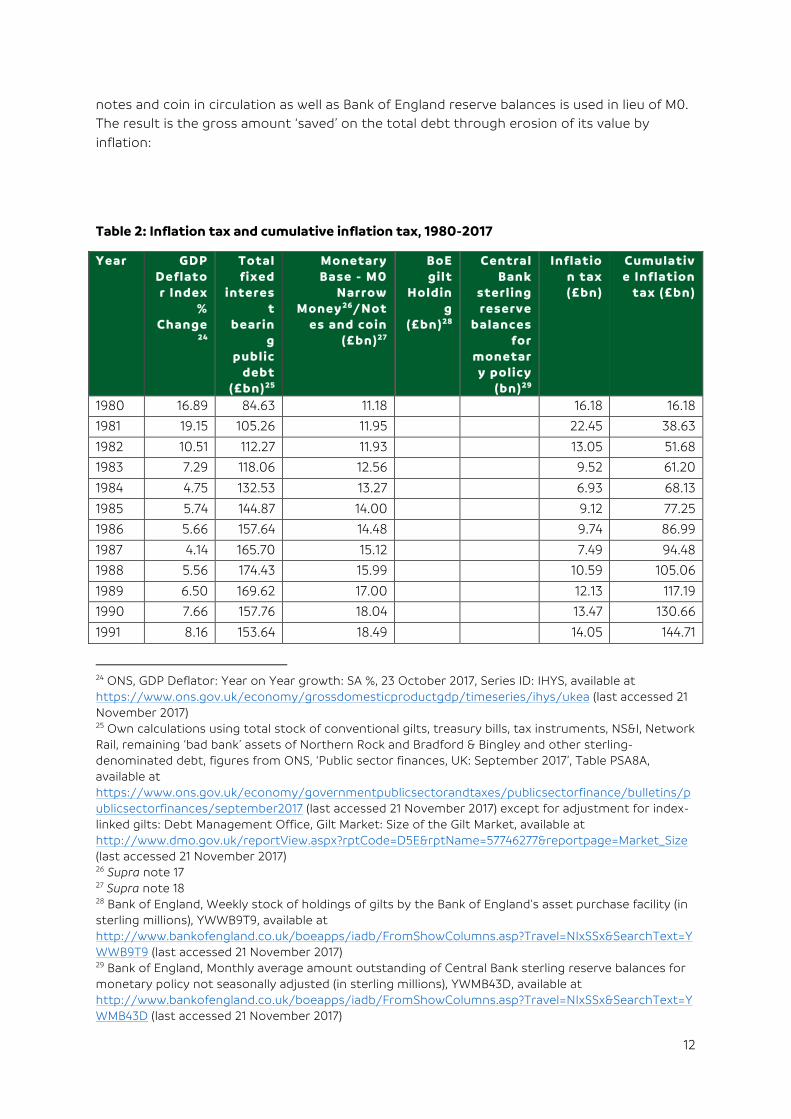
notes and coin in circulation as well as Bank of England reserve balances is used in lieu of M0.
The result is the gross amount ‘saved’ on the total debt through erosion of its value by
inflation:
Table 2: Inflation tax and cumulative inflation tax, 1980-2017
Year GDP Deflator Index
% Change
24
Total f ixed
interest
bearing
public debt
(£bn) 25
Monetary Base - M0
Narrow Money 26/Not
es and coin (£bn)27
BoE gilt
Holding
(£bn) 28
Central Bank
sterling reserve
balances for
monetary policy
(bn) 29
Inflation tax (£bn)
Cumulative Inflation
tax (£bn)
1980 16.89 84.63 11.18 16.18 16.18
1981 19.15 105.26 11.95 22.45 38.63
1982 10.51 112.27 11.93 13.05 51.68
1983 7.29 118.06 12.56 9.52 61.20
1984 4.75 132.53 13.27 6.93 68.13
1985 5.74 144.87 14.00 9.12 77.25
1986 5.66 157.64 14.48 9.74 86.99
1987 4.14 165.70 15.12 7.49 94.48
1988 5.56 174.43 15.99 10.59 105.06
1989 6.50 169.62 17.00 12.13 117.19
1990 7.66 157.76 18.04 13.47 130.66
1991 8.16 153.64 18.49 14.05 144.71
24 ONS, GDP Deflator: Year on Year growth: SA %, 23 October 2017, Series ID: IHYS, available at https://www.ons.gov.uk/economy/grossdomesticproductgdp/timeseries/ihys/ukea (last accessed 21 November 2017) 25 Own calculations using total stock of conventional gilts, treasury bills, tax instruments, NS&I, Network Rail, remaining ‘bad bank’ assets of Northern Rock and Bradford & Bingley and other sterling-denominated debt, figures from ONS, ‘Public sector finances, UK: September 2017’, Table PSA8A, available at https://www.ons.gov.uk/economy/governmentpublicsectorandtaxes/publicsectorfinance/bulletins/publicsectorfinances/september2017 (last accessed 21 November 2017) except for adjustment for index-linked gilts: Debt Management Office, Gilt Market: Size of the Gilt Market, available at http://www.dmo.gov.uk/reportView.aspx?rptCode=D5E&rptName=57746277&reportpage=Market_Size (last accessed 21 November 2017) 26 Supra note 17 27 Supra note 18 28 Bank of England, Weekly stock of holdings of gilts by the Bank of England's asset purchase facility (in sterling millions), YWWB9T9, available at http://www.bankofengland.co.uk/boeapps/iadb/FromShowColumns.asp?Travel=NIxSSx&SearchText=YWWB9T9 (last accessed 21 November 2017) 29 Bank of England, Monthly average amount outstanding of Central Bank sterling reserve balances for monetary policy not seasonally adjusted (in sterling millions), YWMB43D, available at http://www.bankofengland.co.uk/boeapps/iadb/FromShowColumns.asp?Travel=NIxSSx&SearchText=YWMB43D (last accessed 21 November 2017)

13
Year GDP Deflator Index
% Change
24
Total f ixed
interest
bearing
public debt
(£bn) 25
Monetary Base - M0
Narrow Money 26/Not
es and coin (£bn)27
BoE gilt
Holding
(£bn) 28
Central Bank
sterling reserve
balances for
monetary policy
(bn) 29
Inflation tax (£bn)
Cumulative Inflation
tax (£bn)
1992 5.72 163.42 18.86 10.43 155.13
1993 2.51 188.43 19.77 5.23 160.36
1994 2.34 230.36 20.88 5.88 166.24
1995 1.18 266.05 22.37 3.40 169.64
1996 3.04 281.72 23.64 9.28 178.92
1997 3.61 345.09 25.12 13.36 192.29
1998 0.74 346.03 26.72 2.76 195.05
1999 1.43 345.97 28.19 5.35 200.40
2000 0.44 344.91 30.56 1.65 202.05
2001 2.07 325.43 33.11 7.42 209.47
2002 1.23 335.69 35.54 4.57 214.04
2003 2.34 350.44 37.88 9.09 223.12
2004 2.19 402.04 40.55 9.69 232.82
2005 2.78 435.60 42.62 13.29 246.11
2006 2.61 474.38 45.4830 13.57 259.68
2007 3.13 498.96 45.72 16.334 17.56 277.24
2008 2.48 561.01 49.49 23.536 15.72 292.96
2009 2.60 772.24 53.01 18.99 50.064 22.26 315.23
2010 1.45 997.48 56.11 198.28 151.867 14.60 329.83
2011 1.83 1091.56 57.83 198.28 134.272 19.86 349.69
2012 1.44 1166.20 61.04 30.33 203.329 20.16 369.86
2013 2.08 1207.91 64.23 374.98 277.382 24.43 394.29
2014 1.71 1319.02 66.32 374.94 298.138 22.38 416.66
2015 1.45 1364.41 70.57 374.93 304.794 19.79 436.45
2016 0.67 1392.53 75.44 374.91 315.529 9.44 445.89
2017 2.26 1423.32 80.60 434.96 427.58 33.82 479.71
Source: Office for National Statistics, Bank of England, and Debt Management Office
The approximate amount of inflation tax for every year will vary according to two functions:
firstly, the total amount of outstanding national debt, and secondly, the rate of inflation. The
higher the debt or inflation, the higher the inflation tax.
The graph below shows how inflation tax amounts varied since 1980. We can see how during
the Thatcher years – a period of decreased borrowing and decreased inflation – there was a
sudden drop from the late 1970s-early 1980s peak, when inflation was considerable. We can
also see a varied but relatively steady climb from 2000 onwards as Tony Blair and Gordon
30 Supra note 17

14
Brown significantly increased borrowing. The sudden uptick in 2016-2017 was due to the Bank
of England re-starting its programme of quantitative easing.31
What is the effect of inflation on debt interest?
Another way in which inflation has an adverse effect on savers and creditors is the repression
of returns on interest-bearing debt, which has particularly adverse effects during periods of
low interest rates:
Source: Office for National Statistics
The rate of interest on non-indexed debt instruments does not fully reflect reality during
prolonged periods of inflation, because the real value of interest earned over a year must be
adjusted for inflation.
31Khan,M,‘BankofEnglandhasmoreQEsuccess’FinancialTimes,17August2016,availableathttps://www.ft.com/content/06047643-5b16-3221-86f0-d79347dde777(lastaccessed21November2017)
0
5
10
15
20
25
30
35
40
198
0
198
2
198
4
198
6
198
8
1990
1992
1994
1996
1998
200
0
200
2
200
4
200
6
200
8
2010
2012
2014
2016
Infl
atio
n t
ax (£
bn
)
Year
Inflation tax (£bn)
0
1
2
3
4
5
6
7
02-
Jan
-04
02-
Jul-
04
02-
Jan
-05
02-
Jul-
05
02-
Jan
-06
02-
Jul-
06
02-
Jan
-07
02-
Jul-
07
02-
Jan
-08
02-
Jul-
08
02-
Jan
-09
02-
Jul-
09
02-
Jan
-10
02-
Jul-
10
02-
Jan
-11
02-
Jul-
11
02-
Jan
-12
02-
Jul-
12
02-
Jan
-13
02-
Jul-
13
02-
Jan
-14
02-
Jul-
14
02-
Jan
-15
02-
Jul-
15
02-
Jan
-16
02-
Jul-
16
02-
Jan
-17
02-
Jul-
17
Ban
k o
f E
ng
lan
d B
ase
Rat
e (%
)
Year
Historical Bank of England bank rate

15
Take a theoretical 1-year bond with a principal of £100 pounds and a non-indexed annual
coupon of 5 per cent. This means that at maturity we will have earned £5. Now suppose that
during that year, inflation ran at on average 3 per cent. This means that although we have
ended up with £105, prices rose by 3 per cent, therefore that £105 is 3 per cent less valuable,
making it 102 in present prices. Or, what we would have ended up with a bond paying 2 per
cent coupon, which is the real interest rate. Calculating it is easy – simply take away the rate
of inflation from the nominal coupon: 5 per cent – 3 per cent = 2 per cent.
What is the optimal level of inflation?
Gold
It is widely accepted that inflation is a natural phenomenon in a market economy and some
growth in prices is inevitable. The disagreement lies in what should be done about.
Arguments against the “debasing of currency” centre around the belief that inflation should
always be kept close to zero, because eroding the value of currency held by citizens in good
faith is akin to theft. In the past, currencies were pegged to reserves of real wealth such as
gold. The inscription of ‘I promise to pay the bearer on demand the sum of five/ten/twenty
pounds’ dates precisely from this period, when anyone could exchange the banknote for the
amount of gold equal to the note’s nominal value.
Constraining the money supply in this way meant that there was no risk of hyperinflation
since increasing it sharply is impossible without corresponding reserves of gold. The value of
currency managed this way tended to be stable, but perhaps most importantly, it meant that
the government could not raise seignorige or inflation tax at the expense of their citizens.
“We have gold because we cannot trust governments” declared US President Herbert Hoover
in 1933. That same year, the Emergency Banking Act of 1933 was passed by Congress, placing
restrictions on public ownership of gold and effectively pushing the United States off the gold
standard. It was a response to one of the most troubling aspects of the 1930s Great
Depression – a nationwide run on the banks and a rush to convert them into the thing
thought the last bastion of value, namely gold.
Post-gold
Today, there are no countries on the gold standard, and inflation is commonly accepted as a
price worth paying for having control over monetary policy. The demise of the gold standard
can be largely attributed to its inflexibilities in an increasingly complex global economy.32
Consider for example the relationship between GDP growth and the amount of currency in
circulation. It is difficult for an economy to grow with a fixed money supply, because growth
generates demand for money, which means countries hoard gold to be able to grow in the
future.
Similarly, on the flipside, the gold standard means that during a downturn we cannot use
stimulus such as quantitative easing, which proved instrumental in the aftermath of the Great
Recession.33 Indeed, it was the world’s insistence of sticking to the gold standard that “the
32 Gunn, D, ‘The Gold Standard is Bad Economics’ (JSTOR Daily, 30 November 2015) https://daily.jstor.org/gold-standard-bad-economics/ (last accessed 21 November 2017) 33 Worstall, T, ‘Sorry Ted Cruz, The Gold Standard Really Isn't A Good Idea’ Forbes, 14 November 2015 https://www.forbes.com/sites/timworstall/2015/11/14/sorry-ted-cruz-the-gold-standard-really-isnt-a-good-idea-just-no/#54eedf7c45cc (last accessed 21 November 2017)
16
most important barrier to actions that would have arrested or reversed the decline.”34
Expansionary monetary policy can also ease unemployment in the short run and artificially
boost domestic demand, which could mean avoiding a downturn brought about by a drop in
consumer confidence. In other words, by temporarily distorting price signals to make it
appear as if things are better than they actually are.
This may sound alarming, but this means there is a chance of avoiding the distortion of price
signals the other way, when the market panics and brings about its own downfall – by
assuming things are terrible, market actors behave as if things were terrible, which means
that things are terrible, given the market is simply the product of collective behaviour of its
actors!
Not to mention that, looking at historical data, it does not actually guarantee stable prices at
all.35 Loose monetary policy has become the staple of almost all post-great recession
economies.36 Rock-bottom interest rates ensure high demand for credit even in tough
economic conditions which – it is hoped – will overcome the ‘paradox of thrift’ during a
downturn which tends to exacerbate a recession.
Inflation Jargon Buster:
Inflation – a measure of how quickly prices rise in a given economy, measured by tracking
the prices of a representative basket of goods. When we say “inflation is at 2 per cent”, it
means that at this specific moment in time prices are 2 per cent higher than in the same
month in the previous year.
Monetary policy – actions taken by a central bank to influence the amount of money in
circulation in a given economy. They include measures such as modifying the interest rate on
overnight loans to commercial banks (which is what is meant by ‘the interest rates’, or the
Bank of England Base Rate) or trading government-issued bonds.
Nominal/cash terms – when we say that a given figure is expressed in ‘nominal terms’ or
‘cash terms’ we mean that it is not adjusted for inflation.
Real terms – when we say that a given figure is expressed in ‘real terms’ or ‘current prices’,
we mean that it is adjusted for inflation.
Monetary Policy Committee – an internal Bank of England committee responsible for
setting the bank rate. The MPC is made of nine members: the governor, the three deputy
governors for monetary policy, financial stability and markets & banking, the bank's chief
economist and four external members appointed directly by the chancellor.
Hawk – someone weary of the risks of inflation, tends to lean on the side of higher interest
rates and keeping inflation in check. Famous hawks include Milton Friedman, Ted Cruz and
34 Eichengreen, B, Temin, P, ‘The Gold Standard and the Great Depression’ (2000) Contemporary European History, 9(2) 183-207, available at https://www.jstor.org/stable/20081742?mag=gold-standard-bad-economics&seq=1#page_scan_tab_contents (last accessed 21 November 2017) 35 O’Brien, M, ‘Why the Gold Standard Is the World's Worst Economic Idea, in 2 Charts’ The Atlantic, 26 August 2012 https://www.theatlantic.com/business/archive/2012/08/why-the-gold-standard-is-the-worlds-worst-economic-idea-in-2-charts/261552/ (last accessed 21 November 2017) 36 Unattributed, ‘Global monetary policy is not tightening as expected’, The Economist, 1 June 2017, available at https://www.economist.com/news/finance-and-economics/21722868-quiescent-inflation-means-low-interest-rates-are-still-only-game-town-global (last accessed 21 November 2017)

17
Wolfgang Schäuble, former German finance minister instrumental in formulating the Greek
rescue package.
Dove – someone more relaxed about inflation, tends to favour lower interest rates and sees
the benefits of low, managed inflation. Famous doves include John Maynard Keynes, Paul
Krugman and Ben Bernanke, who was the chairman of the Federal Reserve during the 2008
financial crisis.
Loose/Expansionary Monetary Policy – a monetary policy which aims at expanding the
money supply and stimulate economic activity, for example by purchasing government bonds
on the open market, or increasing the rate of interest charged on overnight loans to
commercial banks, which decreases demand for them.
Tight/Contractionary Monetary Policy – a monetary policy which aims at reducing the
money supply in order to reduce the risk of inflation, for example by selling government
bonds on the open market, or decreasing the rate of interest charged on overnight loans to
commercial banks, which increases demand for them.
Bank rate – what is generally referred to as ‘the interest rate’, the Bank of England bank
rate is the interest rate the Bank of England pays on reserves held by commercial banks at
the Bank of England.
RPI – the Retail Prices Index is one of the ‘baskets of goods’ used to track inflation. It was the
official measure of UK inflation until 2003 when it was replaced by the CPI due to consistent
overestimation of inflation as compared to other indices. However, it remains the measure
used for index-linked gilts, despite a review in 2015 urging the government to stop using it.
CPI – the Consumer Price Index is one of the ‘baskets of goods’ used to track inflation. It was
the official measure of UK inflation from 2003 to 2017, when it was replaced by CPIH due to
the fact it excluded the owner occupiers’ housing costs and council tax.
CPIH – CPI updated to take into account owner occupiers’ housing costs and council tax.
Gilts – UK government bonds. The primary means through which governments borrow
money.
Indexing/index-linking – pegging a variable, usually an interest rate, to a given measure
of inflation. For example, the interest rate of an index-linked bond will go up and down with
the inflation index its tracking, hence insuring the returns against the adverse effects of
inflation.
Monetary base –the total amount of currency in circulation in a given economy.
Related Documents