73 ECB Monthly Bulletin February 2011 1 INTRODUCTION Expectations are at the core of contemporary macroeconomic theory and play a key role in modern central banking practice. 1 Monetary policy involves anticipating future developments, monitoring and shaping private sector inflation expectations over the cycle, and providing a long-term nominal anchor for the economy. To this end, central banks must constantly form a view of the economic outlook in the medium term, taking into account the significant, long-lasting impact of their decisions on expectations. The maintenance of price stability in many countries in the last two decades is partly due to the full recognition of the pivotal role of expectations in macroeconomic behaviour and monetary policy conduct. While price stability is the best contribution that monetary policy can make to sustainable economic growth, job creation and welfare, 2 the credibility of the monetary authority to consistently deliver stable prices is built and preserved over time. Such credibility is key to the process by which agents form expectations of future price developments and thus to the price formation mechanism itself. Central banks must constantly monitor the general public’s perceptions about their commitment to maintaining price stability as a proxy for the likelihood that they will indeed accomplish their objective. In this respect, the anchoring of longer-term inflation expectations is a crucial indicator of a central bank’s credibility. It is also a precondition for effective monetary policy conduct and, ultimately, for central banks’ success in maintaining price stability. In particular, when inflation is boosted by temporary shocks, monitoring expectations is key to assessing the risk that such temporary shocks may lead to longer-lasting effects on inflation via their impact on domestic price and wage setting. Ensuring that inflation expectations remain well-anchored, particularly in the medium to long run, is of key interest A broad-based analysis can be found in the article entitled 1 “Expectations and the conduct of monetary policy” in the May 2009 issue of the Monthly Bulletin. For instance, when inflation increases, it becomes more difficult 2 for private agents to disentangle changes in relative prices (knowledge of which is needed to allocate resources efficiently and enhance overall productivity in the economy) from changes in the general level of prices. High and unexpected inflation also inevitably leads to arbitrary redistribution of wealth and income. Moreover, it exerts a negative impact on capital accumulation and thus on long-run productivity, owing to the non-indexation of the tax system and higher interest rates. See the article entitled “Price stability and growth” in the May 2008 issue of the Monthly Bulletin for further discussion. Inflation expectations are used by the ECB to gain an insight into the private sector’s assessment of the outlook for future inflation and to evaluate perceptions about the credibility of monetary policy, as part of a set of indicators. They are important for indicating the confidence of the public in the ability of the central bank to deliver on its price stability mandate. Inflation expectations cannot be observed directly, but approximate measures can be derived indirectly from financial markets and by surveying professional forecasters. An analysis of the main factors influencing the various available measures in the euro area shows that temporary shocks to volatile components of inflation, such as those related to commodity prices, tend to affect short-term expectations, while longer-term measures of inflation expectations have been broadly insensitive to the propagation of temporary shocks. The fact that longer-term expectations have remained well-anchored at levels consistent with the ECB’s definition of price stability demonstrates the credibility earned by the ECB as a central bank with price stability as a clear objective. The stability of inflation expectations has been particularly remarkable during the past three years, which have been challenging for monetary policy given the major shocks that have hit the euro area and the global economy. Well- anchored expectations have contributed to enhancing the effectiveness of monetary policy and will assist the ongoing economic recovery. ARTICLES INFLATION EXPECTATIONS IN THE EURO AREA: A REVIEW OF RECENT DEVELOPMENTS

Welcome message from author
This document is posted to help you gain knowledge. Please leave a comment to let me know what you think about it! Share it to your friends and learn new things together.
Transcript
73ECB
Monthly Bulletin
February 2011
1 INTRODUCTION
Expectations are at the core of contemporary
macroeconomic theory and play a key
role in modern central banking practice.1
Monetary policy involves anticipating future
developments, monitoring and shaping private
sector infl ation expectations over the cycle,
and providing a long-term nominal anchor
for the economy. To this end, central banks
must constantly form a view of the economic
outlook in the medium term, taking into account
the signifi cant, long-lasting impact of their
decisions on expectations. The maintenance
of price stability in many countries in the
last two decades is partly due to the full
recognition of the pivotal role of expectations
in macroeconomic behaviour and monetary
policy conduct.
While price stability is the best contribution that
monetary policy can make to sustainable
economic growth, job creation and welfare,2 the
credibility of the monetary authority to
consistently deliver stable prices is built and
preserved over time. Such credibility is key to
the process by which agents form expectations
of future price developments and thus to the
price formation mechanism itself. Central banks
must constantly monitor the general public’s
perceptions about their commitment to
maintaining price stability as a proxy for the
likelihood that they will indeed accomplish their
objective. In this respect, the anchoring of
longer-term infl ation expectations is a crucial
indicator of a central bank’s credibility. It is also
a precondition for effective monetary policy
conduct and, ultimately, for central banks’
success in maintaining price stability.
In particular, when infl ation is boosted by
temporary shocks, monitoring expectations is
key to assessing the risk that such temporary
shocks may lead to longer-lasting effects on
infl ation via their impact on domestic price
and wage setting. Ensuring that infl ation
expectations remain well-anchored, particularly
in the medium to long run, is of key interest
A broad-based analysis can be found in the article entitled 1
“Expectations and the conduct of monetary policy” in the
May 2009 issue of the Monthly Bulletin.
For instance, when infl ation increases, it becomes more diffi cult 2
for private agents to disentangle changes in relative prices
(knowledge of which is needed to allocate resources effi ciently
and enhance overall productivity in the economy) from changes
in the general level of prices. High and unexpected infl ation also
inevitably leads to arbitrary redistribution of wealth and income.
Moreover, it exerts a negative impact on capital accumulation
and thus on long-run productivity, owing to the non-indexation
of the tax system and higher interest rates. See the article entitled
“Price stability and growth” in the May 2008 issue of the
Monthly Bulletin for further discussion.
Infl ation expectations are used by the ECB to gain an insight into the private sector’s assessment of the outlook for future infl ation and to evaluate perceptions about the credibility of monetary policy, as part of a set of indicators. They are important for indicating the confi dence of the public in the ability of the central bank to deliver on its price stability mandate. Infl ation expectations cannot be observed directly, but approximate measures can be derived indirectly from fi nancial markets and by surveying professional forecasters. An analysis of the main factors infl uencing the various available measures in the euro area shows that temporary shocks to volatile components of infl ation, such as those related to commodity prices, tend to affect short-term expectations, while longer-term measures of infl ation expectations have been broadly insensitive to the propagation of temporary shocks. The fact that longer-term expectations have remained well-anchored at levels consistent with the ECB’s defi nition of price stability demonstrates the credibility earned by the ECB as a central bank with price stability as a clear objective. The stability of infl ation expectations has been particularly remarkable during the past three years, which have been challenging for monetary policy given the major shocks that have hit the euro area and the global economy. Well-anchored expectations have contributed to enhancing the effectiveness of monetary policy and will assist the ongoing economic recovery.
ART ICLES
INFLATION EXPECTATIONS IN THE EURO AREA: A REVIEW OF RECENT DEVELOPMENTS

74ECB
Monthly Bulletin
February 2011
to policy-makers. For these reasons, infl ation
expectations are of great importance for the
conduct of monetary policy and are closely
monitored by the ECB.
In the last 10-15 years, it has become standard
among central banks to communicate a
quantifi ed objective for price stability as part of
their monetary policy strategy. Available studies
clearly indicate that the announcement of an
explicit price stability objective contributes to
anchoring infl ation expectations. In 1998 the
Governing Council of the ECB defi ned price
stability for the euro area as a year-on-year
HICP infl ation rate of below 2%. Following a
thorough evaluation of the strategy in 2003,
the Governing Council further clarifi ed that
it aimed to maintain euro area infl ation rates
“below, but close to, 2%” over the medium
term. This defi nition has provided a very precise
guide for markets and has clearly acted as a
focal point for infl ation expectations in the
euro area.
Beyond the quantitative defi nition of
price stability, the successful anchoring of
longer-term infl ation expectations also depends
on the commitment of the monetary authority
to fulfi lling its mandate. The credibility of the
ECB’s commitment to fulfi lling its mandate is
deeply rooted in the institutional framework
of EMU. The Treaty clearly establishes that
monetary policy in the euro area is conducted
by an independent central bank, which has been
assigned the primary objective of maintaining
price stability.
The credible commitment of the Governing
Council to delivering price stability by
implementing consistent and systematic policy
action has helped to keep medium and longer-
term infl ation expectations fi rmly anchored,
even in the wake of large, adverse shocks during
the fi nancial crisis.
Against this background, this article discusses
recent developments in infl ation expectations
in the euro area (the table below provides an
overview of the main available measures).
It compares market and survey-based
indicators, both at the short and medium to
longer-term horizons, and explores how these
Summary of the main available measures of euro area inflation expectations
Agents Frequency Start Horizons
Survey-based measuresEuropean Commission
consumer survey
Consumers Monthly 1985 12 months ahead (asks for direction of change)
ECB Survey of Professional
Forecasters (SPF)
Financial and
non-fi nancial
institutions
Quarterly 1999 Point forecasts and probability distributions:
- Current, next, calendar year after next
(rolling one and two years ahead)
- Five years ahead
Consensus Economics Financial and
non-fi nancial
institutions
Monthly (short term)
and biannual
(medium to
longer term)
1990 Point forecasts
- Current and next calendar years
- Three, four, fi ve and six to ten years ahead
Euro Zone Barometer
(MJEconomics)
Financial and
non-fi nancial
institutions
Monthly (short term)
and quarterly
(medium to
longer term)
2002 Point forecasts
- Current and next calendar years
- Two, three and four years ahead
World Economic Survey
(IFO)
International and
national institutions
Quarterly 1991 - Six months ahead (asks for direction of change)
- Current calendar year
Financial market indicatorsBreak-even infl ation rates Financial market
participants
Intra-day 2004 At present, three to about 30 years ahead
Infl ation-linked swap rates Financial market
participants
Intra-day 2003 One to 30 years ahead
Note: Break-even infl ation rates are estimated from February 2004.

75ECB
Monthly Bulletin
February 2011
ARTICLES
Inflation expectations
in the euro area:
a review of recent
developments
are formed, focusing in particular on how
measures at different horizons respond to
different information. The article also refl ects
on the behaviour of the various available
measures during the past three years, which
have been challenging for monetary policy,
as infl ation initially rose on the back of the
strong commodity price increases recorded in
international markets, before falling sharply in
the wake of the global economic and fi nancial
crisis which intensifi ed with the default of
Lehman Brothers in the autumn of 2008.
The article is organised as follows. Survey-based
indicators of infl ation expectations are discussed
in Section 2, while Section 3 presents the
indicators extracted from fi nancial markets and
looks into their infl uences. Section 4 analyses
the behaviour of these indicators in recent years,
and Section 5 offers some conclusions.
2 SURVEY INDICATORS OF INFLATION
EXPECTATIONS
Various survey-based measures of infl ation
expectations are available, but those followed
most closely by the ECB stretch beyond
12 months, such as the ECB Survey of
Professional Forecasters (SPF), as well as those
of Consensus Economics and the Euro Zone
Barometer.3
Each of these surveys provides point forecasts
of infl ation expectations at various horizons,
covering both the short and medium to longer
term. In the SPF, however, respondents are also
requested to provide a quantitative assessment
of uncertainty surrounding the reported point
forecasts. This assessment of uncertainty is
refl ected in the reported probability distributions
of future infl ation outcomes falling within given
ranges. Furthermore, SPF respondents are invited
to comment on the factors underlying their
forecasts and the reasons behind the revisions,
with respect to the previous SPF round.4
The information available from the SPF
allows the computation of various measures
of uncertainty surrounding the outlook.
For example, the probability distribution
provides information on the level of uncertainty
surrounding the point forecast. It can be used to
evaluate the probability of an infl ation outcome
above or below a certain threshold. Furthermore,
the probability distribution may be used to assess
the balance of risks associated with the point
forecast. In addition, the standard deviation of
the point forecasts of all respondents, commonly
referred to as “disagreement”, refl ects the extent
to which forecasters disagree with one another.
Generally speaking, medium-term expectations
are most relevant for monetary policy, since
they help in assessing the reaction of agents to
different shocks in prices, as well as indicating
the transient or more persistent nature of the
shocks, as perceived by the private sector. The
longer the horizon of expectations, the more
they refl ect the level of credibility accorded to
monetary policy by economic agents as regards
a central bank’s commitment to achieving price
stability. Other surveys of infl ation expectations,
such as the European Commission’s consumer
survey 5 and the IFO World Economic Survey,
only ask about expectations for very short
A new survey of infl ation expectations was launched by 3
J.P. Morgan Securities Ltd in July 2009. The survey is conducted
three times a year and asks for expectations of developments
in near-term core infl ation, as well as views on medium-term
infl ation (defi ned as average headline infl ation between two
and fi ve years ahead) relative to the respective central bank’s
objective. The respondents are fi nancial market participants,
and the survey covers expectations for the euro area, the United
States, the United Kingdom, Japan and Australia.
See the box entitled “Results of the ECB Survey of Professional 4
Forecasters for the fi rst quarter of 2011” in this issue of the
Monthly Bulletin for more technical details on the ECB SPF
and for information on the latest release. See also the box
entitled “The forecasting performance of expert surveys” in the
January 2011 issue of the Monthly Bulletin for an assessment of
the forecast accuracy of expert surveys.
The European Commission’s consumer survey is conducted at 5
the national level, and the results for the euro area are compiled
by aggregating country data. It is qualitative in nature, in that
consumers are asked to indicate whether they expect infl ation to
rise, fall or remain unchanged. The results are summarised using
the so-called “balance statistic”, which shows the difference
between the percentage of consumers thinking that consumer
prices will increase and the percentage of consumers stating that
prices will decrease or remain unchanged.
76ECB
Monthly Bulletin
February 2011
periods ahead and are therefore more likely to
be affected by temporary shocks. They are
therefore a less relevant measure for the purpose
of monetary policy. Indeed, a cross-correlation
analysis between the European Commission
survey and actual infl ation reveals that the
highest correlation occurs at the same time or
for lags of up to seven months, depending on the
horizon considered, suggesting that this
particular indicator of expectations contains
information about horizons that are much shorter
than the 12-month horizon to which the survey
question refers.6
FREQUENCY OF UPDATES AND FORECASTING
TECHNIQUES
Understanding the way in which survey
indicators of infl ation expectations are formed
is not easy, as they are based on heterogeneous
panels of forecasters who typically employ
complex and varied forecasting tools based
on different information sets. However, some
indications of the factors likely to be infl uencing
such measures of expectations can be drawn
from the ad-hoc questionnaire that was
conducted by the ECB in the autumn of 2008 in
order to learn more about how SPF respondents
make their forecasts.7
The ad-hoc questionnaire asked SPF respondents
to clarify the role of expert judgement and
the use of formal econometric models in the
forecasts. The answers revealed that models are
used extensively to produce the forecasts, but
that expert judgement is added by the majority
of respondents on top of the model-based
forecasts. Furthermore, most respondents replied
that their probability distribution is reported
on the basis of judgement, with only one-fi fth
of the respondents generating the probability
distribution from a model.
The ad-hoc questionnaire also revealed that
the respondents use a wide variety of models
to produce their forecasts. Time series models
are used most when producing infl ation
forecasts. Traditional macro models based
on supply and demand are also commonly
used, particularly for medium and longer-term
horizons. The majority of respondents reported
that forecasts are updated according to a
regular calendar: half of the respondents update
their forecasts quarterly and around one-third
monthly. Many also update their forecasts
following data releases or in the wake of
signifi cant shocks.
According to the comments that respondents
provide in the regular SPF with their infl ation
forecasts, the main factors infl uencing short
and medium-term infl ation views include:
developments in commodity and oil prices, the
euro exchange rate (mostly against the dollar),
measures of economic slack (such as the output
gap, capacity utilisation and the unemployment
rate) and wage growth. In addition, changes in
indirect taxes and administered prices have been
increasingly quoted as factors infl uencing the
infl ation outlook in recent rounds. Although these
factors directly refer to the SPF, they are likely to
broadly apply to other surveys of forecasters,
given the large size of the SPF panel and its mix
of fi nancial and non-fi nancial institutions.8
See also the article entitled “Measures of infl ation expectations 6
in the euro area” in the July 2006 issue of the Monthly Bulletin.
See the document: “A summary of the results from the special 7
questionnaire for participants of the ECB Survey of Professional
Forecasters (SPF)”, available on the ECB website at:
http://www.ecb.europa.eu/stats/prices/indic/forecast/html/index.
en.html.
The current SPF panel consists of almost 80 respondents 8
from various European Union countries and, despite notable
changes in the composition of the panel over time, 30 of them
have been members from the very beginning. The respondents
are professional forecasters from the fi nancial (55%) and non-
fi nancial (45%) sectors.

77ECB
Monthly Bulletin
February 2011
ARTICLES
Inflation expectations
in the euro area:
a review of recent
developments
3 FINANCIAL MARKET INDICATORS
OF INFLATION EXPECTATIONS
For a long time, surveys were the main source
of information on private sector infl ation
expectations for central banks, whereas the
use of fi nancial instruments required strong
assumptions to extract infl ation expectations,
which made them less suitable for regular
monitoring purposes. Over recent years,
however, the strong development of markets
for infl ation-linked instruments, notably
infl ation-linked bonds, but also derivatives,
such as infl ation-linked swaps, as well as
infl ation caps and fl oors, to name but a few,9
has signifi cantly facilitated the calculation of
infl ation expectations embodied in fi nancial
asset prices. This section provides some
examples of the information provided by
infl ation-linked fi nancial instruments.
MONITORING SHORT-TERM INFLATION
EXPECTATIONS USING INFLATION-LINKED SWAPS
Infl ation-linked swaps are an outstanding source
of information about private sector infl ation
expectations, particularly for short-term
horizons. An infl ation-linked swap is a contract,
which involves an exchange of a fi xed payment
(the so-called “fi xed leg” of the swap) for
realised infl ation over a predetermined horizon.
Thus, through the construction of the contract,
the fi xed swap rate provides a direct reading of
the market’s expected infl ation rate. They are
available daily over a wide range of horizons.
An alternative fi nancial market indicator
is the break-even infl ation rate, which is
calculated as the yield spread between nominal
and infl ation-linked bonds. In contrast,
infl ation-linked swaps: (i) do not require the
estimation of nominal and real term structures,
thereby avoiding problems related to the
limited number of bonds at short maturities;
(ii) are less prone to liquidity distortions
resulting from turbulence in fi nancial markets
than break-even infl ation rates; (iii) are
less affected by HICP seasonality than
break-even infl ation rates, and are therefore more
suitable for monitoring infl ation expectations at
short horizons.10
Infl ation-linked swaps, as with all market-
based indicators of infl ation expectations, may
include an infl ation risk premium component to
compensate investors for the risks surrounding
infl ation expectations over the forecast horizon.
Available euro area evidence suggests that
such a premium increases with maturity, but
remains very limited in size and variability at
the horizons considered.11
In the specifi c case of the euro area, the
infl ation-linked swap market has grown rapidly
since 2003, refl ecting the increasing demand for
infl ation-linked instruments and the relatively
limited supply of index-linked bonds in the euro
area.12 Indeed, the euro area is currently
likely to be the most developed market for
infl ation-linked swaps in the world, which
makes its information particularly suitable for
monitoring developments in infl ation
expectations, most notably for short and
medium-term horizons.
Given the fact that they have only recently been
developed, there is little empirical evidence on
the factors infl uencing infl ation-linked swaps.
To determine whether, when and by how much
infl ation-linked swaps are linked to monetary,
real economy, price and fi nancial factors, or a
combination of any of them, a large set of
For an overview, see the article “Extracting information from 9
fi nancial asset prices” in the November 2004 issue of the
Monthly Bulletin.
Break-even infl ation rates can be adjusted for seasonal effects, 10
but these are generally more diffi cult to remove at short horizons.
See Ejsing, J., García, J. A. and Werner, T. (2007), “The term
structure of euro area break-even infl ation rates: the impact of
seasonality”, Working Paper Series, No 830, ECB.
See Garcia, J. A. and Werner, T. (2010): “Infl ation risks and 11
infl ation risk premia”, Working Paper Series, No 1162, ECB.
For an overview and some international comparison, see Garcia, 12
J. A. and Van Rixtel, A. (2007), “Infl ation-linked bonds from
a central bank perspective”, Occasional Paper Series, No 62,
ECB, and references therein.

78ECB
Monthly Bulletin
February 2011
potential explanatory factors is evaluated using
Bayesian model selection techniques.13
Specifi cally, 28 directly observable economic
and fi nancial variables usually used to analyse
developments in fi nancial indicators of infl ation
expectations are considered. To provide an
intuitive description of the main factors
infl uencing the developments in infl ation-linked
swaps, Chart 1 shows the contribution of the
factors most important to the dynamics of the
infl ation-linked swap rate at the two-year
horizon, based on a linear regression model.
The choice of such a horizon is motivated by
data availability, but qualitatively similar results
hold for other maturities.14
Two insights are particularly noteworthy. First,
infl ation-linked swaps suggest that there was
a signifi cant rise in infl ation expectations at
short-to-medium horizons over the fi rst half
of 2008, an increase that was sharply reversed
following the intensifi cation of the fi nancial
crisis in the autumn of 2008.
Second, the sharp downward revision to infl ation
expectations was largely motivated not only
by the decline in oil prices, but also the sharp
deterioration in confi dence indicators, as well
as by fi nancial factors (such as the rise in stock
market volatility as captured by the VIX index).
Moreover, these factors, together with moderate
growth in monetary aggregates, are also the
main explanation for infl ation expectations
remaining subdued since early 2009.
MONITORING LONG-TERM INFLATION
EXPECTATIONS
Beyond helping to monitor developments in
short-term infl ation expectations, infl ation-linked
instruments provide crucial information
on longer-term infl ation expectations. The
remarkable development of the infl ation-linked
bond market in the euro area since 2004 has
contributed to improving the reliability of the
estimated break-even infl ation rates based
To investigate the link between infl ation expectations and their 13
potential determinants, we assume: ILSt = aILSt-1 + bXt + et,
where ILSt denotes the infl ation expectation measure (swap)
and Xt represents the set of factors listed below. The potential
explanatory factors considered are: (i) monetary factors
(M1 and M3 growth); (ii) commodity prices and exchange rates (raw materials excluding energy, oil prices in USD, effective euro
exchange rate, NEER); (iii) price and cost indicators (level and
volatility of headline HICP and HICPex, as well as that of PPI,
and wage growth); (iv) economic activity indicators (industrial
production, unemployment rate); (v) confi dence indicators
(European Commission industrial and consumer confi dence, PMI);
(vi) fi nancial variables (US and euro area term spread, US-euro
area ten-year bond differential, bond market volatility, 12-month
return in the S&P500 and the Euro 50 indices, stock volatility,
VIX and VStoxx ); (vii) external environment (CPI, industrial
production, non-farm payroll data and capacity utilisation
in the United States). For details on data transformation, see
Ciccarelli, M. and Garcia, J.A. (2009), “What drives euro area
break-even infl ation rates?”, Working Paper Series, No 996,
ECB. To estimate the model coeffi cients and select the factors,
the “stochastic search variable selection approach” is used
(see George, E. and McCulloch, R. (1993), “Variable selection
via Gibbs sampling”, Journal of the American Statistical Association, Vol. 88, No 423, pp. 881- 889).
Note that, owing to the heterogeneity of the measurement units 14
of the factors, all variables shown in the chart are standardised.
Chart 1 Determinants of inflation-linked swaps
(annual percentage changes; percentage points; monthly data)
-4
-3
-2
-1
0
1
2
3
-4
-3
-2
-1
0
1
2
3
residual
others
VIX
US term spread
euro area term spread
PMI
industrial production
oil price
M3 growth rate
M1 growth rate
US capacity utilisation
I/L swap rate two years ahead
2003 2004 2005 2006 2007 2008 2009
Source: ECB calculations based on the methodology introduced in Ciccarelli and Garcia (2009).Note: This chart shows the decomposition of infl ation expectations as the sum of the contributions of the explanatory factors and the residual term. All variables are standardised. Historical values of the endogenous variable are interpreted as a departure from a baseline or reference path. The bars in the chart therefore refl ect the departure of infl ation expectations from their sample mean explained by the departure of each explanatory variable from its respective reference path (i.e. the sample mean). Contributions are based on the posterior means.

79ECB
Monthly Bulletin
February 2011
ARTICLES
Inflation expectations
in the euro area:
a review of recent
developments
on the yield spread between nominal and
infl ation-linked bonds.15 Indeed, using bond
market data allows all the information on
nominal and real term structures to be exploited.
The extraction of long-term infl ation
expectations from fi nancial instruments is,
however, further complicated by the presence of
the infl ation risk premia requested by investors
as compensation for the risks surrounding
baseline infl ation expectations. Moreover,
during the recent fi nancial crisis, the presence
of strong and time-varying liquidity distortions
in the bond market has added diffi culties to the
interpretation of developments in long-term
(forward) break-even infl ation rates.
Monitoring long-term break-even infl ation rates
therefore requires a rich specifi cation of the term
structure. Euro area break-even infl ation
rates and infl ation risk premia can be estimated
using term structure models. In order to better
identify the infl ation risk premia, in line with
recent term structure literature, infl ation-linked
bond yields are employed to pin down real
yields, and survey infl ation expectations from
the ECB’s SPF also help to identify expected
infl ation.16 Based on that modelling approach,
Chart 2 shows the decomposition of long-term
forward break-even infl ation rates by means of a
no-arbitrage term structure model incorporating
infl ation-linked bond yields and long-term
survey infl ation expectations.17 The chart
illustrates some of the key features of long-term
infl ation expectations (and related premia) in the
euro area. First, investors’ long-term infl ation
expectations are fi rmly anchored at levels
consistent with price stability. Importantly,
they have remained so since the intensifi cation
of the fi nancial turbulence.18 Second, the infl ation
risk premium is, in contrast, far more volatile,
accounting for a signifi cant proportion of the
volatility in long-term break-even infl ation rates.
On average, the long-term infl ation risk premium
has been around 40 basis points, but it declined
signifi cantly over the summer of 2010, possibly
refl ecting lower perceived infl ation risks among
investors amid increasing concerns of a
slowdown in the global economy in the second
half of the year. Again, it is important to note
that the level of long-term infl ation expectations
was, in contrast, broadly unchanged during that
period. In any case, although signifi cant care is
taken in the specifi cation of the term structure
model used here, modelling bond markets
during the fi nancial crisis period poses
signifi cant challenges, which should be taken
into account.
See Garcia, J. A. and van Rixtel, A. (2007), “Infl ation-linked 15
bonds from a central bank perspective”, Occasional Paper Series, No 62, ECB, and references therein for an overview and
international comparison.
For model details, see Garcia, J. A. and Werner, T. (2010), 16
“Infl ation risks and infl ation risk premia”, Working Paper Series,
No 1162, ECB.
In line with recent literature, the model includes measurement 17
errors for all the variables, thereby allowing for a correction
for liquidity and other potential distortions in bond markets
during the fi nancial crisis, which is crucial in order to provide
a thorough assessment of developments in break-even infl ation
rates, infl ation expectations and the infl ation risk premia.
See Box 4 entitled “An assessment of recent developments 18
in long-term forward break-even infl ation rates”, in the
December 2009 issue of the Monthly Bulletin.
Chart 2 Decomposition of long-term forward break-even inflation rates, based on a term structure model
(annual percentage changes; percentage points)
0.00
0.25
0.50
0.75
1.00
0.5
1.0
1.5
2.0
2.5
3.01.25
2004 2005 2006 2007 2008 2009 2010
inflation risk premium (left-hand scale)
five-year forward five-year-ahead break-even
inflation rate (right-hand scale)
long-term inflation expectations – six to ten years
ahead (right-hand scale)
Sources: Reuters and ECB calculations.Note: Long-term forward break-even infl ation rates and components are for the fi ve-year forward fi ve-year-ahead horizon. For term structure model details, see Garcia and Werner (2010).
80ECB
Monthly Bulletin
February 2011
4 DEVELOPMENTS IN EXPECTATIONS IN RECENT
YEARS
Measures of infl ation expectations are used by
the ECB to gain an insight into the expectations
of the private sector, to cross-check its own
assessment of the outlook for future infl ation
and as part of a set of indicators used to evaluate
the perceived credibility of its monetary
policy. Clearly, all the existing measures have
shortcomings and are imperfect gauges of the
“true”, unobserved infl ation expectations of the
private sector. For example, measures derived
from fi nancial instruments, which are based
on market trades and are available in real time
for a wide range of maturities, may be affected
by unobservable, time-varying risk premia.
By contrast, survey-based measures, although
not distorted by unobservable risk premia,
are not necessarily linked to actual economic
behaviour and may be more backward-looking.
This is because individual forecasts may
only be updated at fi xed intervals and the
collection and compilation of such forecasts
inevitably takes some time. A comprehensive
assessment of these limitations and the
comparative strengths and weaknesses of
both types of measure supports a combined
analysis, whereby all available measures
are used jointly and the conclusions from
all types of indicator are reciprocally
cross-checked.
In this regard, it is important to look at how the
various measures of infl ation expectations have
behaved in recent years, taking into account the
unusual volatility in actual infl ation rates caused
by a combination of commodity price shocks and
the impact of the fi nancial crisis. In particular, it
is instructive to focus on summer 2008, when
infl ation temporarily rose on account of strong
increases in commodity prices in global markets
and their pass-through to consumer prices, as
well as on autumn 2008, when the fi nancial
crisis intensifi ed in the months immediately
after the demise of Lehman Brothers in the
United States.
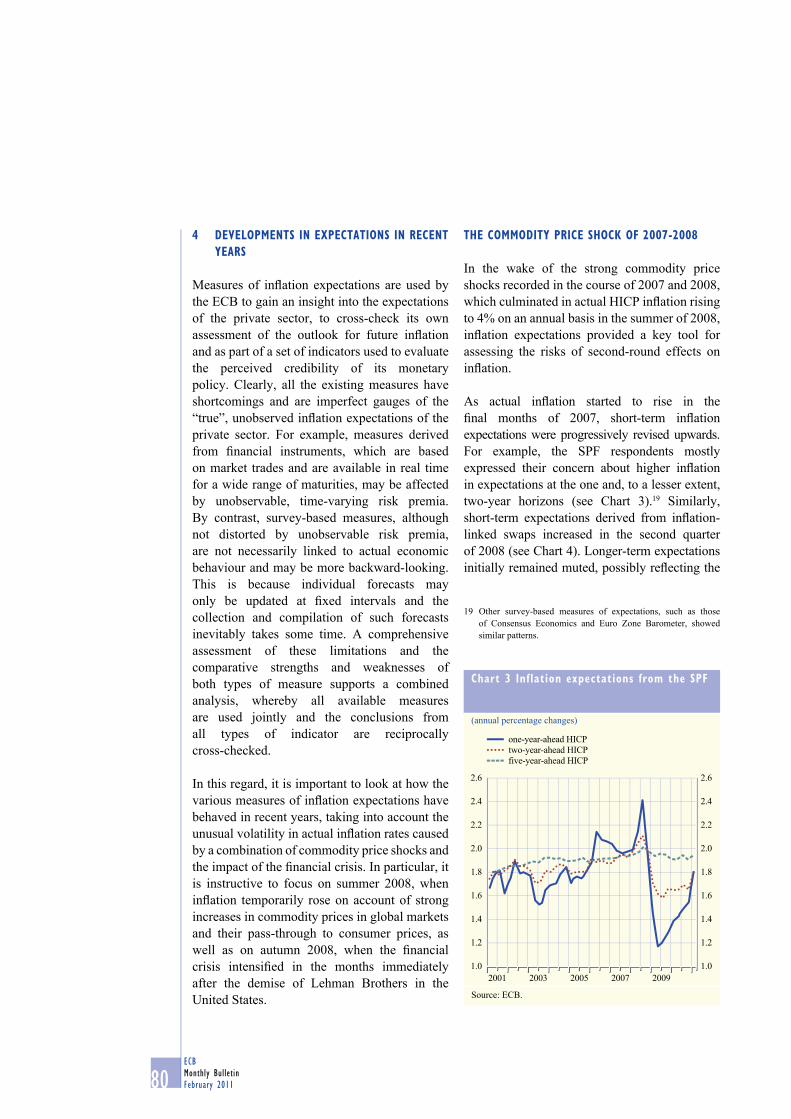
THE COMMODITY PRICE SHOCK OF 2007-2008
In the wake of the strong commodity price
shocks recorded in the course of 2007 and 2008,
which culminated in actual HICP infl ation rising
to 4% on an annual basis in the summer of 2008,
infl ation expectations provided a key tool for
assessing the risks of second-round effects on
infl ation.
As actual infl ation started to rise in the
fi nal months of 2007, short-term infl ation
expectations were progressively revised upwards.
For example, the SPF respondents mostly
expressed their concern about higher infl ation
in expectations at the one and, to a lesser extent,
two-year horizons (see Chart 3).19 Similarly,
short-term expectations derived from infl ation-
linked swaps increased in the second quarter
of 2008 (see Chart 4). Longer-term expectations
initially remained muted, possibly refl ecting the
Other survey-based measures of expectations, such as those 19
of Consensus Economics and Euro Zone Barometer, showed
similar patterns.
Chart 3 Inflation expectations from the SPF
(annual percentage changes)
1.0
1.2
1.4
1.6
1.8
2.0
2.2
2.4
2.6
1.0
1.2
1.4
1.6
1.8
2.0
2.2
2.4
2.6
2001 2003 2005 2007 2009
two-year-ahead HICP
five-year-ahead HICP
one-year-ahead HICP
Source: ECB.

81ECB
Monthly Bulletin
February 2011
ARTICLES
Inflation expectations
in the euro area:
a review of recent
developments
perceived transitory nature of the commodity
price shock, as well as the fact that the ECB
was expected to react to the higher infl ation,
but started to rise in the summer of 2008
(see Charts 3 and 4).
Market concerns about infl ation were also
refl ected in the aggregate probability distribution
available from the SPF. In the two SPF rounds
conducted in July and October 2008, when the
latest available data for the euro area annual
infl ation rate showed 4.0% for June and 3.6%
for September, the forecasters assigned
signifi cantly higher probability to a longer-term
infl ation outcome of at or above 2%
(see Chart 5). The rising level of long-term
infl ation expectations in the SPF, and the higher
probability assigned by respondents to outcomes
above the ECB’s defi nition of price stability,
were two further elements supporting the overall
assessment that led to the monetary policy
decision to increase interest rates in July 2008.20
Thereafter, following the ECB’s interest rate
increase and the intensifi cation of the fi nancial
crisis, the concerns about higher longer-term
infl ation subsided quickly. Short-term infl ation
expectations, particularly those derived from
fi nancial instruments, fell quickly (see Chart 4).
INFLATION EXPECTATIONS DURING THE CRISIS
The period immediately after the demise of
Lehman Brothers in the United States in
September 2008 provides another case study for
the usefulness of indicators of infl ation
expectations. As the international economy
experienced one of the worst recessions in
generations, market concerns about both
infl ation and defl ation emerged. On the one
hand, as demand and output fell sharply, and
unemployment went up, spare capacity rose and
downward pressures on infl ation emerged.
This, in turn, triggered fears of a sustained
According to the editorial of the July 2008 Monthly Bulletin: 20
“The Governing Council’s decision [to increase interest rates]
was taken to prevent broadly based second-round effects and
to counteract the increasing upside risks to price stability
over the medium term”. “The Governing Council emphasises
that […] it is its strong determination to keep medium and
long-term infl ation expectations fi rmly anchored in line with
price stability.”
Chart 4 Forward inflation-linked swap rates in the euro area
(annual percentage changes)
0.5
0.0
1.0
1.5
2.0
2.5
3.0
3.5
0.0
0.5
1.0
1.5
2.0
2.5
3.0
3.5
2006 2007 2008 2009 2010
one-year rate one year ahead
one-year rate two years ahead
five-year rate five years ahead
Sources: ICAP and Reuters.
Chart 5 Probability of longer-term inflation outcome within given intervals
(as a percentage)
0
10
20
30
40
50
60
70
10
20
30
40
50
60
70
0
2001 2002 2004 2006 2008 20102003 2005 2007 2009
at 2% or above
1.0% to 1.9%
below 1%
Source: ECB.Note: Information from the aggregate probability distribution.
82ECB
Monthly Bulletin
February 2011
period of defl ation ahead.21 On the other hand,
strong recessionary forces elicited an
unprecedented response in both monetary and
fi scal policies, which led some observers to
argue that infl ation was the main threat.
According to this view, abundant liquidity,
combined with high fi scal defi cits, would trigger
infl ation once a recovery was under way if
policy-makers were unable or unwilling to
reverse the policy stimulus in time. Infl ation
expectations provide an important tool for
assessing the balance of risks, particularly in an
environment subject to upward and downward
pressures on price stability.
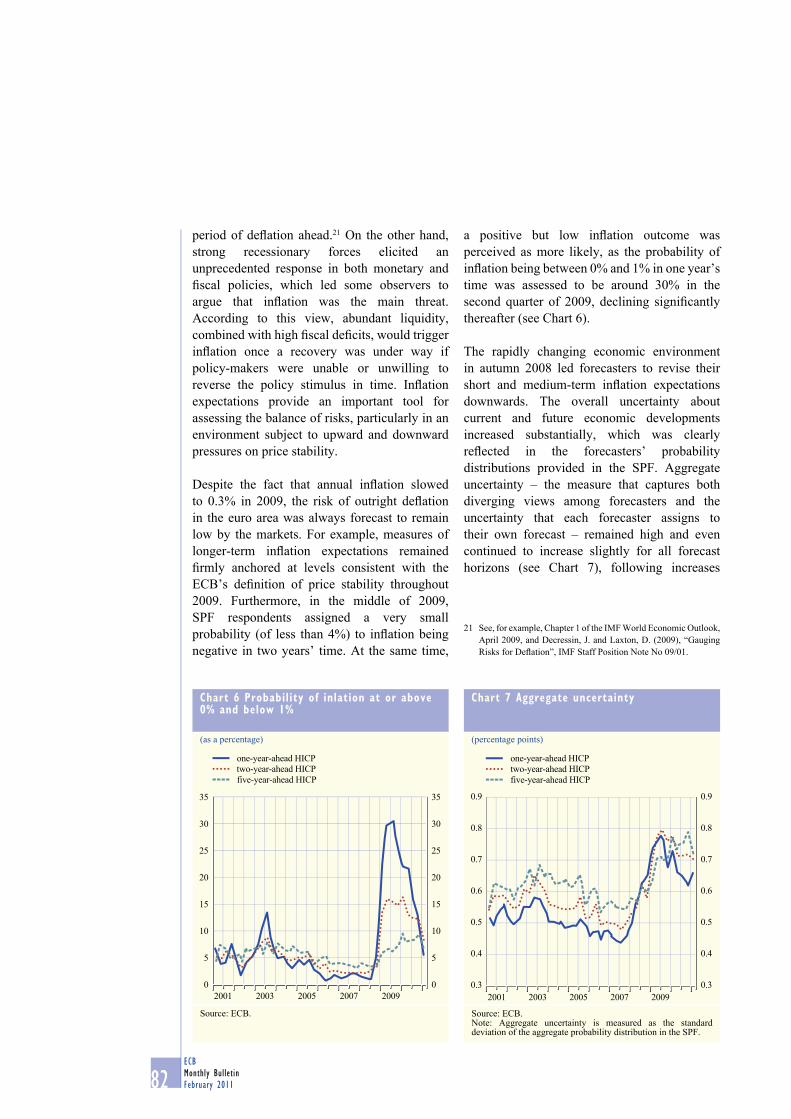
Despite the fact that annual infl ation slowed
to 0.3% in 2009, the risk of outright defl ation
in the euro area was always forecast to remain
low by the markets. For example, measures of
longer-term infl ation expectations remained
fi rmly anchored at levels consistent with the
ECB’s defi nition of price stability throughout
2009. Furthermore, in the middle of 2009,
SPF respondents assigned a very small
probability (of less than 4%) to infl ation being
negative in two years’ time. At the same time,
a positive but low infl ation outcome was
perceived as more likely, as the probability of
infl ation being between 0% and 1% in one year’s
time was assessed to be around 30% in the
second quarter of 2009, declining signifi cantly
thereafter (see Chart 6).
The rapidly changing economic environment
in autumn 2008 led forecasters to revise their
short and medium-term infl ation expectations
downwards. The overall uncertainty about
current and future economic developments
increased substantially, which was clearly
refl ected in the forecasters’ probability
distributions provided in the SPF. Aggregate
uncertainty – the measure that captures both
diverging views among forecasters and the
uncertainty that each forecaster assigns to
their own forecast – remained high and even
continued to increase slightly for all forecast
horizons (see Chart 7), following increases
See, for example, Chapter 1 of the IMF World Economic Outlook, 21
April 2009, and Decressin, J. and Laxton, D. (2009), “Gauging
Risks for Defl ation”, IMF Staff Position Note No 09/01.
Chart 6 Probability of inlation at or above 0% and below 1%
(as a percentage)
0
5
10
15
20
25
30
35
20092007200520032001
0
5
10
15
20
25
30
35
two-year-ahead HICP
five-year-ahead HICP
one-year-ahead HICP
Source: ECB.
Chart 7 Aggregate uncertainty
(percentage points)
0.3
0.4
0.5
0.6
0.7
0.8
0.9
0.3
0.4
0.5
0.6
0.7
0.8
0.9
20092007200520032001
two-year-ahead HICP
one-year-ahead HICP
five-year-ahead HICP
Source: ECB.Note: Aggregate uncertainty is measured as the standard deviation of the aggregate probability distribution in the SPF.

83ECB
Monthly Bulletin
February 2011
ARTICLES
Inflation expectations
in the euro area:
a review of recent
developments
during 2008 which were associated with the oil
and food prices shocks.22 However, this feature
was not specifi c to infl ation or, indeed, the
SPF: similar increases in uncertainty were also
observed within the SPF for real GDP growth
and unemployment, as well as in other private
sector surveys.23 Although there are some signs
of a decline in uncertainty since the beginning
of 2010, it still remains higher than before the
crisis.
Turning to fi nancial indicators, expectations
extracted from fi nancial instruments suggested
greater risks of defl ation over the short term
during the fi nancial crisis than survey-based
indicators. Beyond the baseline scenario
portrayed by the infl ation-linked swap rates
discussed in the previous section, additional
information can be obtained by looking at
probability distributions for infl ation outcomes
calculated from traded infl ation options
(caps and fl oors) over the one-year horizon.24
Chart 8 shows bands with the probability
of various infl ation outcomes at a one-year
horizon. Infl ation options also suggest a very
strong shift in infl ation expectations in late 2008.
The upward trend in actual and expected
infl ation in the fi rst half of 2008 was also
accompanied by a rise in uncertainty and upside
risks. The intensifi cation of the crisis in the
autumn of 2008 triggered a further increase in
infl ation uncertainty, as well as a substantial
increase in the probability of defl ation. Since
2009 these defl ation risks have diminished,
while infl ation uncertainty has remained
considerably higher than before the crisis, as
For example, the standard deviation of euro area infl ation 22
forecasts for the year 2009 within the Consensus Economics
panel – another measure of uncertainty among forecasters –
increased substantially in autumn 2008 to peak in December at
unprecedented levels, twice as high as the fi ve-year average of
the standard deviation at this forecasting horizon. For a detailed
discussion of measures of uncertainty that can be derived
from the SPF, see the box entitled “Measuring perceptions of
macroeconomic uncertainty” in the January 2010 issue of the
Monthly Bulletin.
For a discussion of developments regarding uncertainty, 23
including information from the Consensus Economics forecasts,
see the box entitled “Uncertainty and the economic prospects for
the euro area” in the August 2009 issue of the Monthly Bulletin.
The derivation of the implied infl ation densities is based on a 24
spline interpolation of the implied volatilities extracted from the
infl ation caps and fl oors, based on the Black-Scholes approach.
For an application of this methodology, see Kruse, S. (2010),
“On the Pricing of Infl ation-Indexed Options”, European Actuarial Journal, forthcoming.
Chart 8 Probability bands of various inflation outcomes in one year derived from euro area inflation options
(annual percentage changes)
-8
-6
-4
-2
0
2
4
6
8
-8
-6
-4
-2
0
2
4
6
8
Mar. Sep. Mar. Sep. Mar. Sep.2008 2009 2010
25% to 75% quantiles
15% to 85% quantiles
5% to 95% quantiles
1 year inflation swap rate
Sources: Bloomberg and ECB calculations.
Chart 9 Longer-term inflation expectations from various sources
(annual percentage changes)
1.5
1.6
1.7
1.8
1.9
2.0
2.1
2.2
2.3
1.41.4
1.5
1.6
1.7
1.8
1.9
2.0
2.1
2.2
2.3
SPF (five years ahead)
Euro Zone Barometer (four years ahead)
Consensus Economics (six to ten years ahead)
2001 2003 2005 2007 2009 2011
Sources: Consensus Economics, ECB and Euro Zone Barometer.

84ECB
Monthly Bulletin
February 2011
indicated by the fact that the confi dence interval
surrounding the median infl ation expectations
in Chart 8 is still wide.
During these turbulent times, longer-
term infl ation expectations have remained
well anchored (see Chart 9): the mean and
median of the point forecasts of the SPF have
fl uctuated between 1.9% and 2.0% in the
last two years. Longer-term forecasts from
Consensus Economics and the Euro Zone
Barometer have been slightly more volatile.
However, owing to the smaller number of
respondents for these two surveys than for the
SPF, their average results are more sensitive
to outliers. Market-based measures declined
by less than 1 percentage point at the end of
2008. As pointed out in Section 3, this decline
was mostly due to declining risk premia, while
market participants’ longer-term infl ation
expectations remained broadly stable throughout
the fi nancial crisis. The broad stability of
longer-term infl ation expectations suggests that
monetary policy credibility was not seriously
affected during the crisis. The box below
looks at developments in infl ation expectations
for other selected economies outside the
euro area.
Box
RECENT INTERNATIONAL DEVELOPMENTS IN INFLATION EXPECTATIONS
This box reviews developments in fi nancial and survey-based indicators of infl ation expectations,
similar to those presented in the main text, for other advanced economies outside the euro
area, in particular the United States and the United Kingdom. Overall, the comparison points
to similar developments in infl ation expectations among advanced economies, with long-term
expectations remaining well anchored overall, although country-specifi c temporary shocks have
tended to result in some degree of divergence in the dynamics of short to medium-term infl ation
expectations.
Infl ation expectations during the crisis
With the intensifi cation of the international
fi nancial and economic crisis in 2008, the sharp
drop in output at the global level resulted in
downward pressures on global infl ation. In this
context, medium to longer-term break-even
infl ation rates and infl ation swap rates are
useful indicators for interpreting the signifi cant
decline in infl ation expectations in comparison
to the euro area (see Charts A and B). Indeed,
the decline in US and UK break-even infl ation
rates was more pronounced than that observed
in the euro area. However, market-based
infl ation expectations have also become much
more volatile and have been infl uenced by
liquidity premia, as well as technical factors.
While short-term survey-based indicators also
showed similar patterns, the declines were
more short-lived. In contrast, survey-based
Chart A Five-year forward five-year-ahead break-even inflation rates
(annual percentage changes)
1.5
1.7
1.9
2.1
2.3
2.5
2.7
2.9
3.1
3.3
3.5
3.7
1.5
1.7
1.9
2.1
2.3
2.5
2.7
2.9
3.1
3.3
3.5
3.7
euro area
United States
United Kingdom
2007 2008 2009 2010
Sources: Reuters, ECB, Federal Reserve Board staff calculations and Bank of England.
85ECB
Monthly Bulletin
February 2011
ARTICLES
Inflation expectations
in the euro area:
a review of recent
developments
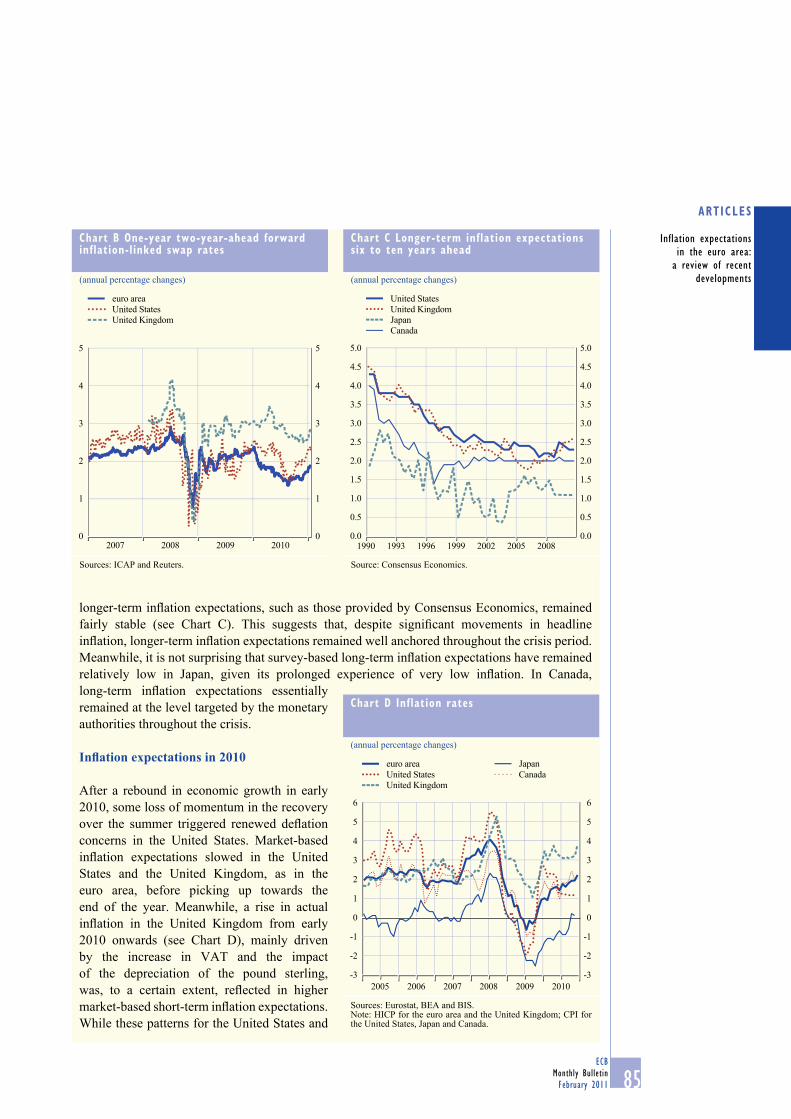
longer-term infl ation expectations, such as those provided by Consensus Economics, remained
fairly stable (see Chart C). This suggests that, despite signifi cant movements in headline
infl ation, longer-term infl ation expectations remained well anchored throughout the crisis period.
Meanwhile, it is not surprising that survey-based long-term infl ation expectations have remained
relatively low in Japan, given its prolonged experience of very low infl ation. In Canada,
long-term infl ation expectations essentially
remained at the level targeted by the monetary
authorities throughout the crisis.
Infl ation expectations in 2010
After a rebound in economic growth in early
2010, some loss of momentum in the recovery
over the summer triggered renewed defl ation
concerns in the United States. Market-based
infl ation expectations slowed in the United
States and the United Kingdom, as in the
euro area, before picking up towards the
end of the year. Meanwhile, a rise in actual
infl ation in the United Kingdom from early
2010 onwards (see Chart D), mainly driven
by the increase in VAT and the impact
of the depreciation of the pound sterling,
was, to a certain extent, refl ected in higher
market-based short-term infl ation expectations.
While these patterns for the United States and
Chart B One-year two-year-ahead forward inflation-linked swap rates
(annual percentage changes)
0
1
2
3
4
5
0
1
2
3
4
5
euro area
United States
United Kingdom
20102007 2008 2009
Sources: ICAP and Reuters.
Chart C Longer-term inflation expectations six to ten years ahead
(annual percentage changes)
0.0
0.5
1.0
1.5
2.0
2.5
3.0
3.5
4.0
4.5
5.0
0.0
0.5
1.0
1.5
2.0
2.5
3.0
3.5
4.0
4.5
5.0
United States
United Kingdom
Japan
Canada
1990 1993 1996 1999 2002 2005 2008
Source: Consensus Economics.
Chart D Inflation rates
(annual percentage changes)
-3
-2
-1
0
1
2
3
4
5
6
-3
-2
-1
0
1
2
3
4
5
6
20102005 2006 2007 2008 2009
euro area
United States
United Kingdom
Japan
Canada
Sources: Eurostat, BEA and BIS. Note: HICP for the euro area and the United Kingdom; CPI for the United States, Japan and Canada.

86ECB
Monthly Bulletin
February 2011
5 CONCLUSIONS
Infl ation expectations are used by the ECB
to gain an insight into the private sector’s
assessment of the outlook for future infl ation
and as part of a set of indicators used to evaluate
the credibility of monetary policy. They are
important for indicating the confi dence of the
public in the ability of the ECB to deliver on its
price stability mandate. Several measures are
available in the euro area, some derived from
surveys and others extracted from fi nancial
markets, covering both the short and medium
to longer-term horizons. An analysis of the
main factors infl uencing the various available
measures of expectations in the euro area
shows that measures at different horizons tend
to respond to different information: temporary
shocks to volatile components tend to be more
prominent in the short term, while longer-term
expectations are broadly insensitive to economic
news. The fact that longer-term expectations
have remained well anchored at levels close
to 2% during the past three years, which have
been relatively challenging for monetary policy
given the massive shocks that have hit the
euro area and the global economy, has offered
comfort for the conduct of monetary policy and
demonstrates the credibility earned by the ECB
as a price stability-oriented central bank.
However, there is no room for complacency,
as measures of uncertainty and disagreement
derived from survey-based expectations, for
example, have increased in the immediate
aftermath of the fi nancial crisis and have not yet
returned to their previous levels; furthermore,
infl ation risk premia embedded in asset prices
have remained non-negligible.
Looking ahead, it is paramount that monetary
policy continues to deliver price stability and
remains credible in ensuring price stability
over time. If investors and economic agents
are reassured that infl ation will remain stable
in the future as a result of credible monetary
policy, infl ation expectations will remain well
anchored and investors will demand lower
infl ation risk premia, which, in turn, will foster
stronger growth in the euro area. This is the best
contribution that monetary policy can offer to
promoting balanced growth and higher standards
of living in the euro area.
the United Kingdom were also partly evident in survey-based indicators, such as the Consensus
Economics forecast (see Chart C), long-term infl ation expectations remained within their
historical range, suggesting that infl ation expectations remained well anchored. Other survey-
based indicators support this view.1
Overall, analysing developments in indicators of infl ation expectations during the crisis
and the summer of 2010 illustrates the advantages of combining information from both
surveys and fi nancial markets, where available, to assess those developments, not only in the
euro area, but also in other advanced economies. To sum up, trends in infl ation expectations
among advanced economies have been broadly similar to those observed in the euro area in
recent years, with long-term expectations remaining well anchored. However, country-specifi c
temporary shocks lead to diverging dynamics of short to medium-term infl ation expectations.
1 For the United States, for example, the University of Michigan measure of consumers’ long-term infl ation expectations (fi ve to
10 years ahead) fell to 2.7% in September 2010, but rebounded to 2.8% in December. Ten-year-ahead infl ation expectations in the SPF
and expected average infl ation for the next 10 years in the Livingston survey stood at 2.2% and 2.5% in November and December,
respectively. All three indicators were close to their historical averages.
Related Documents


