Federal Reserve Bank of New York Staff Reports Inflation Expectations and Behavior: Do Survey Respondents Act on Their Beliefs? Olivier Armantier Wändi Bruine de Bruin Giorgio Topa Wilbert van der Klaauw Basit Zafar Staff Report no. 509 August 2011 This paper presents preliminary findings and is being distributed to economists and other interested readers solely to stimulate discussion and elicit comments. The views expressed in this paper are those of the authors and are not necessarily reflective of views at the Federal Reserve Bank of New York or the Federal Reserve System. Any errors or omissions are the responsibility of the authors.

Welcome message from author
This document is posted to help you gain knowledge. Please leave a comment to let me know what you think about it! Share it to your friends and learn new things together.
Transcript


‐4%
‐3%
‐2%
‐1%
0%
1%
2%
3%
4%
5%
6%
7%
8%
9%
10%
11%
12%
0 1 2 3 4 5 6 7 8 9 10
Reported Inflation Expectation
Switching Point
Figure C5: Choices and Predictions"Inflation" * "Increasing"
Average Prediction Survey 1 (N1=160) Average Prediction Survey 2 (N2=165)
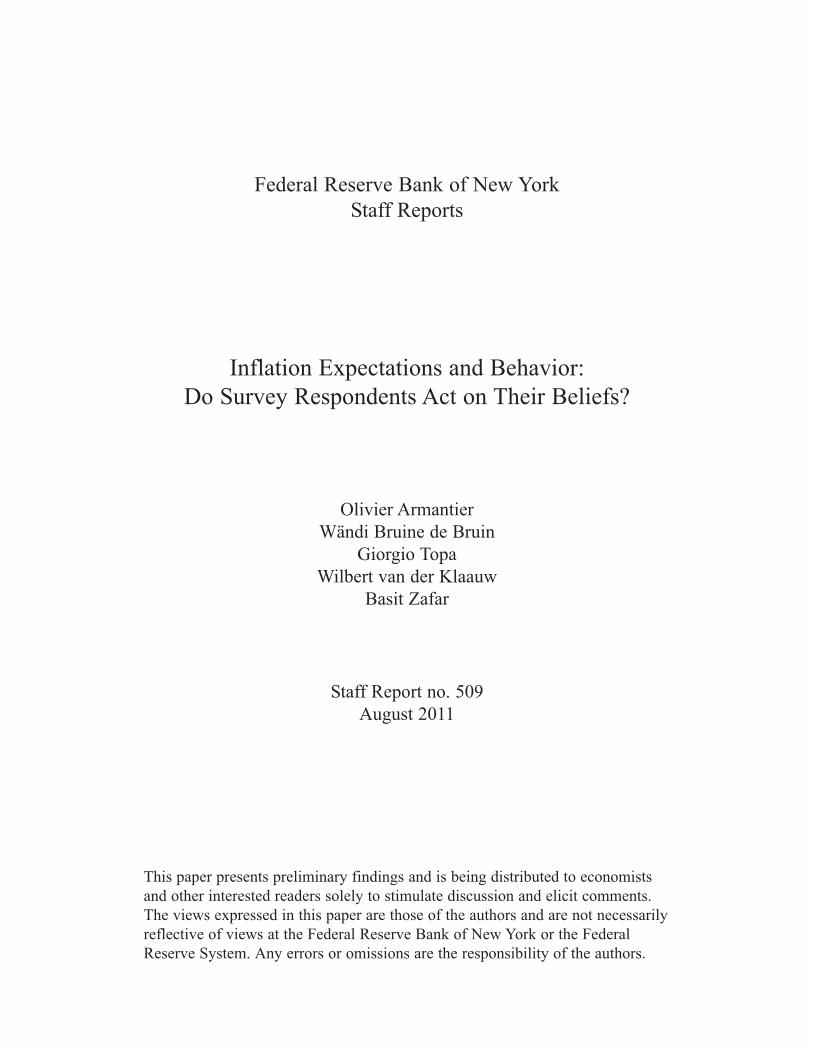
‐4%
‐3%
‐2%
‐1%
0%
1%
2%
3%
4%
5%
6%
7%
8%
9%
10%
11%
12%
0 1 2 3 4 5 6 7 8 9 10
Rep
orted
Inflation Expectation
Number of "A" choices
Choices and Predictions"Inflation" * "Decreasing"
Average Prediction Survey 1 (N1=149) Average Prediction Survey 2 (N2=152)

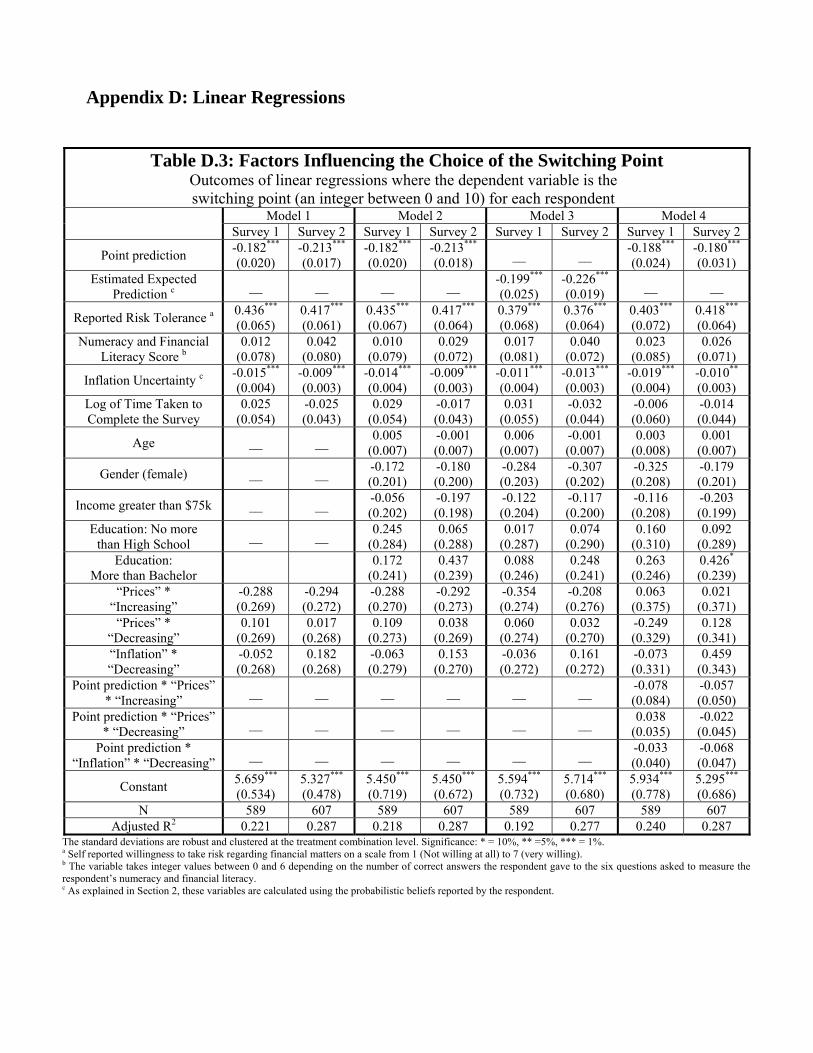
Appendix D: Linear Regressions
Table D.3: Factors Influencing the Choice of the Switching Point Outcomes of linear regressions where the dependent variable is the switching point (an integer between 0 and 10) for each respondent
Model 1 Model 2 Model 3 Model 4
Survey 1 Survey 2 Survey 1 Survey 2 Survey 1 Survey 2 Survey 1 Survey 2
Point prediction -0.182*** (0.020)
-0.213*** (0.017)
-0.182*** (0.020)
-0.213*** (0.018)
__ __ -0.188*** (0.024)
-0.180*** (0.031)
Estimated Expected Prediction c
__ __ __ __ -0.199*** (0.025)
-0.226*** (0.019)
__ __
Reported Risk Tolerance a 0.436*** (0.065)
0.417*** (0.061)
0.435*** (0.067)
0.417*** (0.064)
0.379*** (0.068)
0.376*** (0.064)
0.403*** (0.072)
0.418*** (0.064)
Numeracy and Financial Literacy Score b
0.012 (0.078)
0.042 (0.080)
0.010 (0.079)
0.029 (0.072)
0.017 (0.081)
0.040 (0.072)
0.023 (0.085)
0.026 (0.071)
Inflation Uncertainty c -0.015*** (0.004)
-0.009*** (0.003)
-0.014*** (0.004)
-0.009*** (0.003)
-0.011*** (0.004)
-0.013*** (0.003)
-0.019*** (0.004)
-0.010** (0.003)
Log of Time Taken to Complete the Survey
0.025 (0.054)
-0.025 (0.043)
0.029 (0.054)
-0.017 (0.043)
0.031 (0.055)
-0.032 (0.044)
-0.006 (0.060)
-0.014 (0.044)
Age __ __ 0.005
(0.007) -0.001 (0.007)
0.006 (0.007)
-0.001 (0.007)
0.003 (0.008)
0.001 (0.007)
Gender (female) __ __ -0.172 (0.201)
-0.180 (0.200)
-0.284 (0.203)
-0.307 (0.202)
-0.325 (0.208)
-0.179 (0.201)
Income greater than $75k __ __ -0.056 (0.202)
-0.197 (0.198)
-0.122 (0.204)
-0.117 (0.200)
-0.116 (0.208)
-0.203 (0.199)
Education: No more than High School
__ __ 0.245
(0.284) 0.065
(0.288) 0.017
(0.287) 0.074
(0.290) 0.160
(0.310) 0.092
(0.289) Education:
More than Bachelor
0.172 (0.241)
0.437 (0.239)
0.088 (0.246)
0.248 (0.241)
0.263 (0.246)
0.426* (0.239)
“Prices” * “Increasing”
-0.288 (0.269)
-0.294 (0.272)
-0.288 (0.270)
-0.292 (0.273)
-0.354 (0.274)
-0.208 (0.276)
0.063 (0.375)
0.021 (0.371)
“Prices” * “Decreasing”
0.101 (0.269)
0.017 (0.268)
0.109 (0.273)
0.038 (0.269)
0.060 (0.274)
0.032 (0.270)
-0.249 (0.329)
0.128 (0.341)
“Inflation” * “Decreasing”
-0.052 (0.268)
0.182 (0.268)
-0.063 (0.279)
0.153 (0.270)
-0.036 (0.272)
0.161 (0.272)
-0.073 (0.331)
0.459 (0.343)
Point prediction * “Prices” * “Increasing”
__ __ __ __ __ __ -0.078 (0.084)
-0.057 (0.050)
Point prediction * “Prices” * “Decreasing”
__ __ __ __ __ __ 0.038
(0.035) -0.022 (0.045)
Point prediction * “Inflation” * “Decreasing”
__ __ __ __ __ __ -0.033 (0.040)
-0.068 (0.047)
Constant 5.659*** (0.534)
5.327*** (0.478)
5.450*** (0.719)
5.450*** (0.672)
5.594*** (0.732)
5.714*** (0.680)
5.934*** (0.778)
5.295*** (0.686)
N 589 607 589 607 589 607 589 607 Adjusted R2 0.221 0.287 0.218 0.287 0.192 0.277 0.240 0.287
The standard deviations are robust and clustered at the treatment combination level. Significance: * = 10%, ** =5%, *** = 1%. a Self reported willingness to take risk regarding financial matters on a scale from 1 (Not willing at all) to 7 (very willing). b The variable takes integer values between 0 and 6 depending on the number of correct answers the respondent gave to the six questions asked to measure the respondent’s numeracy and financial literacy. c As explained in Section 2, these variables are calculated using the probabilistic beliefs reported by the respondent.

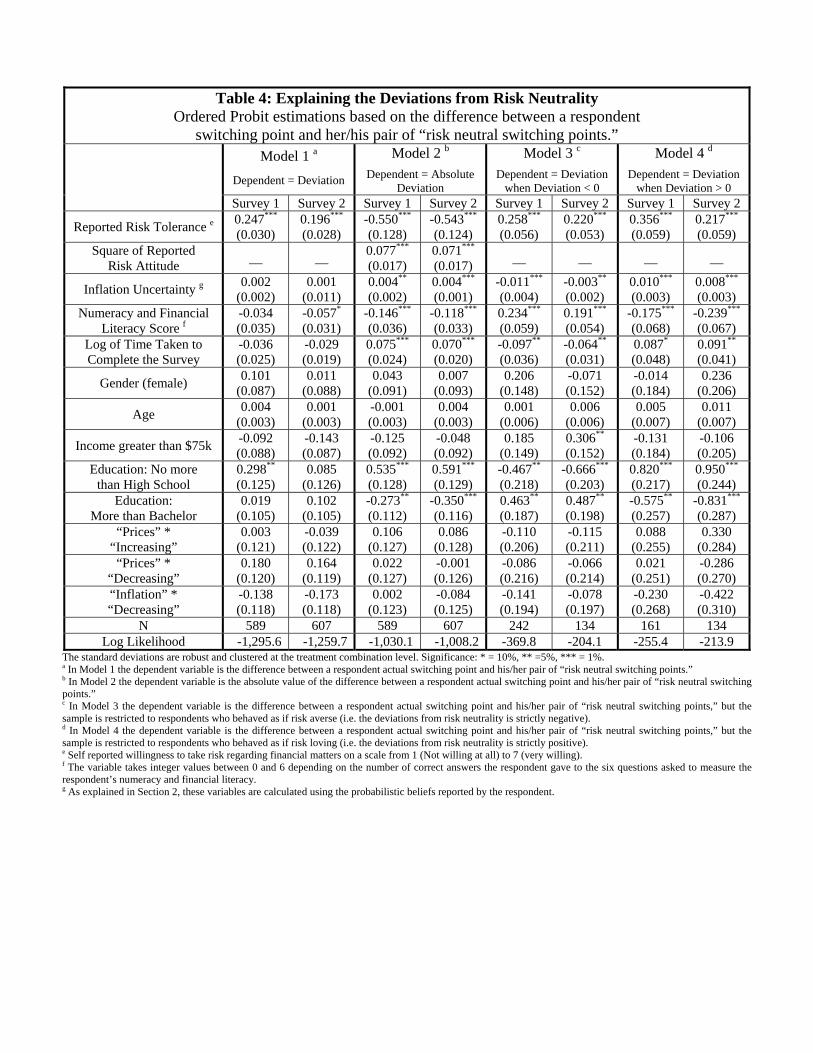
Table D.4: Explaining the Deviations from Risk Neutrality Linear regressions based on the difference between a respondent
switching point and her/his pair of “risk neutral switching points.”
Model 1 a
Dependent = Deviation
Model 2 b
Dependent = Absolute Deviation
Model 3 c
Dependent = Deviation when Deviation < 0
Model 4 d
Dependent = Deviation when Deviation > 0
Survey 1 Survey 2 Survey 1 Survey 2 Survey 1 Survey 2 Survey 1 Survey 2
Reported Risk Tolerance e 0.651*** (0.074)
0.497*** (0.069)
-1.029*** (0.221)
-1.086*** (0.213)
0.361*** (0.073)
0.335*** (0.816)
0.495*** (0.080)
0.294*** (0.081)
Square of Reported Risk Attitude
__ __ 0.146*** (0.029)
0.143*** (0.030)
__ __ __ __
Inflation Uncertainty g 0.015*** (0.004)
-0.001 (0.003)
0.008*** (0.003)
0.008*** (0.002)
-0.016*** (0.005)
-0.007** (0.003)
0.014*** (0.005)
0.011*** (0.004)
Numeracy and Financial Literacy Score f
-0.085 (0.088)
-0.115 (0.077)
-0.262*** (0.062)
-0.239*** (0.056)
0.307*** (0.080)
0.346*** (0.086)
-0.212** (0.099)
-0.322*** (0.092)
Log of Time Taken to Complete the Survey
-0.072 (0.060)
-0.071* (0.047)
0.139*** (0.043)
0.130*** (0.034)
-0.119** (0.049)
-0.102** (0.050)
0.131** (0.073)
0.107* (0.057)
Gender (female) 0.271
(0.220) 0.052
(0.217) 0.074
(0.156) 0.009
(0.175) 0.161
(0.201) -0.004 (0.241)
0.121 (0.268)
0.241 (0.286)
Age 0.009
(0.008) -0.001 (0.008)
-0.001 (0.006)
0.004 (0.003)
0.001 (0.008)
-0.007 (0.009)
0.007 (0.010)
0.013 (0.010)
Income greater than $75k -0.201 (0.222)
-0.295 (0.215)
-0.246 (0.175)
-0.097 (0.157)
0.273 (0.205)
0.458** (0.242)
-0.142 (0.268)
-0.217 (0.285)
Education: No more than High School
0.805** (0.312)
0.250 (0.311)
1.120*** (0.222)
1.217*** (0.226)
-0.705** (0.310)
-1.013*** (0.332)
1.236*** (0.317)
1.249*** (0.344)
Education: More than Bachelor
-0.008 (0.266)
0.251 (0.258)
-0.477** (0.189)
-0.588*** (0.189)
0.593** (0.250)
0.851** (0.305)
-0.819** (0.357)
-0.990*** (0.368)
“Prices” * “Increasing”
0.009 (0.308)
-0.140 (0.301)
0.240 (0.217)
0.213 (0.218)
0.078 (0.282)
-0.210 (0.332)
0.218 (0.372)
0.431 (0.396)
“Prices” * “Decreasing”
0.425 (0.306)
0.322 (0.295)
0.086 (0.216)
0.059 (0.214)
0.033 (0.297)
-0.102 (0.340)
0.190 (0.363)
-0.344 (0.375)
“Inflation” * “Decreasing”
-0.282 (0.287)
-0.427 (0.292)
-0.049 (0.210)
-0.077 (0.212)
0.292 (0.263)
-0.009 (0.313)
-0.168 (0.386)
-0.523 (0.429)
Constant -2.768*** (0.787)
1.121 (0.718)
4.012*** (0.654)
3.391*** (0.595)
-5.016*** (0.747)
-4.694 (0.836)
0.868 (0.910)
1.632 (0.791)
N 589 607 589 607 242 134 161 134 Adjusted R2 0.140 0.083 0.172 0.204 0.252 0.270 0.331 0.309
The standard deviations are robust and clustered at the treatment combination level. Significance: * = 10%, ** =5%, *** = 1%. a In Model 1 the dependent variable is the difference between a respondent actual switching point and his/her pair of “risk neutral switching points.” b In Model 2 the dependent variable is the absolute value of the difference between a respondent actual switching point and his/her pair of “risk neutral switching points.” c In Model 3 the dependent variable is the difference between a respondent actual switching point and his/her pair of “risk neutral switching points,” but the sample is restricted to respondents who behaved as if risk averse (i.e. the deviations from risk neutrality is strictly negative). d In Model 4 the dependent variable is the difference between a respondent actual switching point and his/her pair of “risk neutral switching points,” but the sample is restricted to respondents who behaved as if risk loving (i.e. the deviations from risk neutrality is strictly positive). e Self reported willingness to take risk regarding financial matters on a scale from 1 (Not willing at all) to 7 (very willing). f The variable takes integer values between 0 and 6 depending on the number of correct answers the respondent gave to the six questions asked to measure the respondent’s numeracy and financial literacy. g As explained in Section 2, these variables are calculated using the probabilistic beliefs reported by the respondent.
Related Documents