Inflation, Demand for Liquidity, and Welfare Shutao Cao C´ esaire A. Meh Jos´ e-V´ ıctor R´ ıos-Rull Yaz Terajima Bank of Canada Bank of Canada University of Minnesota Bank of Canada Mpls Fed, CAERP Sixty Years Since Baumol-Tobin: A Celebration Conference New York University Preliminary September 26, 2012 The views expressed are those of the authors and not of the Bank of Canada, the Federal Reserve Bank of Minneapolis or the Federal Reserve System.

Welcome message from author
This document is posted to help you gain knowledge. Please leave a comment to let me know what you think about it! Share it to your friends and learn new things together.
Transcript

Inflation, Demand for Liquidity, and Welfare
Shutao Cao Cesaire A. Meh Jose-Vıctor Rıos-Rull Yaz Terajima
Bank of Canada Bank of Canada University of Minnesota Bank of CanadaMpls Fed, CAERP
Sixty Years Since Baumol-Tobin: A Celebration Conference
New York University
Preliminary
September 26, 2012
The views expressed are those of the authors and not of the Bank of Canada, the
Federal Reserve Bank of Minneapolis or the Federal Reserve System.

Motivation
Inflation affects relative prices of holding different types of assets andhence welfare.
Most previous studies use representative-agent models and aggregateevidence to measure the cost.
I Dotsey and Ireland (1996), Lucas (2000), among others.
Heterogeneous behavior and micro evidence can be important.
Shutao Cao, Cesaire A. Meh, Jose-Vıctor Rıos-Rull, Yaz Terajima New York University
Inflation, Demand for Liquidity, and Welfare September 26, 2012 2/42

Motivation
Recent work on welfare cost of inflation take into accountheterogeneity.
I Welfare cost varies considerably across households: Mulligan and
Sala-i-Martin (2000), Doepke and Schneider (2006), Meh and Terajima (2008),
Erosa and Ventura (2002), Chiu and Molico (2008)
I Aggregate welfare effects can differ when heterogeneity is considered
Not much done in the literature:
I Money holding for transaction purpose varies with age.
This is important because
I Welfare cost of inflation will differ across age groups
I Potential nonlinear effects of inflation when aggregated
Shutao Cao, Cesaire A. Meh, Jose-Vıctor Rıos-Rull, Yaz Terajima New York University
Inflation, Demand for Liquidity, and Welfare September 26, 2012 3/42

Other literature
Lucas (2000) points out an importance of using micro data toestimate the gains/costs of inflation.
Mulligan and Sala-i-Martin (2000) and Attanasio et al. (2002) usemicro data to estimate the welfare cost of inflation.
Dotsey and Ireland (1996) analyze a general equilibrium model ofmoney demand with an intermediation cost of credit transactiontechnology.
Erosa and Venture (2002) incorporates heterogeneity over householdincome.
Chui and Molico (2010) uses a search model of demand for money.
Heer and Maussner (2012) analyze the effects of inflation ondistributions of both income and wealth.
Heer et al. (2007) document that the money-age profile ishump-shaped and money is weakly correlated with income andwealth.
Ragot (2010) documents that the distribution of money acrosshouseholds is more similar to that of financial assets than ofconsumption.
Shutao Cao, Cesaire A. Meh, Jose-Vıctor Rıos-Rull, Yaz Terajima New York University
Inflation, Demand for Liquidity, and Welfare September 26, 2012 4/42

What we do
1 Ask welfare implications of inflation by
I building an OLG model where money and credit are used fortransaction; and
I calibrating model to capture age, cohort and time effects onmoney-consumption ratios.
2 Document money-consumption ratios, i.e., liquidity demand formoney
I People are very different between ages and between social classes overmoney holdings and wealth
3 Use data to disentangle age, cohort and time effects
Shutao Cao, Cesaire A. Meh, Jose-Vıctor Rıos-Rull, Yaz Terajima New York University
Inflation, Demand for Liquidity, and Welfare September 26, 2012 5/42

Findings
Money-consumption ratio is higher for older and poor households.
I 5 times higher for old households (aged 76-85) relative to that foryoung (aged 26-35)
I 2 times higher for poor households relative to that for rich households
These effects do not disappear once we control for cohort and timeeffects.
Age-specific transaction cost captures age profile of money holding.
Aggregate welfare effects when inflation ↑ from 1.92% to 10%,
I Aggregate consumption decreases by 0.83%.
Distributional effects are summarize as follows,
I To be added
Shutao Cao, Cesaire A. Meh, Jose-Vıctor Rıos-Rull, Yaz Terajima New York University
Inflation, Demand for Liquidity, and Welfare September 26, 2012 6/42

Data: Two Household Surveys
Our main data sources are two household surveys (repeatedcross-section)
Canadian Financial Monitor (CFM), 1999-2010, by Ipsos Reid
I “money” holdings information available for all years
I consumption information available only for 2008-2010
Survey of Household Spending (SHS), 1999-2009, by StatisticsCanada
I no information on money holdings
I consumption information available for all years
Money: checking account and some savings accounts (fortransactions)
Consumption: durables (excluding housing), non-durables, and service
Shutao Cao, Cesaire A. Meh, Jose-Vıctor Rıos-Rull, Yaz Terajima New York University
Inflation, Demand for Liquidity, and Welfare September 26, 2012 7/42

Data: Combining CFM and SHS
To separate out age, cohort and time effects, we need data onmoney-con ratios over a longer period than 2008-2010 from CFM.
Obtain a 11-year series by combining CFM and SHS, followingBethencourt and Rıos-Rull (2009):
1 From 2008-2010 CFM, calculate a joint distribution (in quintile) ofhouseholds over money and consumption.
2 For each year over 1999-2009, calculate average money holdings ofhouseholds in each quintile from CFM and average consumption ineach quintile from SHS.
3 Holding fixed the joint distribution from Step (1), assign the averagemoney holdings and consumption in the respective quintile in each yearover 1999-2009.
4 For each year and each consumption quintile, calculate averagemoney-consumption ratios over money quintile using the marginaldistribution from Step (1) as weights.
Shutao Cao, Cesaire A. Meh, Jose-Vıctor Rıos-Rull, Yaz Terajima New York University
Inflation, Demand for Liquidity, and Welfare September 26, 2012 8/42

Data: Joint distribution of Money and Consumption
CFM 2008-2010 contain household-level information regarding moneyand consumption. Hence, we can construct a joint distribution ofhouseholds over money and consumption:
w.1 w.2 w.3 w.4 w.5
5th w51 w52 w53 w54 w55 w5.
Money 4th w41 w42 w43 w44 w45 w4.
Quintile 3rh w31 w32 w33 w34 w35 w3.
2nd w21 w22 w23 w24 w25 w2.
1st w11 w12 w13 w14 w15 w1.
1st 2nd 3rd 4th 5th Marginal
Consumption Distribution
Quintile
Marginal Dist.
Shutao Cao, Cesaire A. Meh, Jose-Vıctor Rıos-Rull, Yaz Terajima New York University
Inflation, Demand for Liquidity, and Welfare September 26, 2012 9/42

Data: Joint distribution of Money and Consumption
For each year over the 1999-2007 period,
I CFM has information on money, {w1., ...,w5.}, andI we can calculate average money holdings in each quintile.
I SHS has information on consumption, {w.1, ...,w.5}, andI we can calculate average consumption in each quintile.
Use these information to approximate money-consumption ratios ineach consumption quintile.
Shutao Cao, Cesaire A. Meh, Jose-Vıctor Rıos-Rull, Yaz Terajima New York University
Inflation, Demand for Liquidity, and Welfare September 26, 2012 10/42

Data: Combining CFM and SHS
Do this for six age groups:
I Aged 26-35, 36-45, 46-55, 56-65, 66-75 and 76-85.
Shutao Cao, Cesaire A. Meh, Jose-Vıctor Rıos-Rull, Yaz Terajima New York University
Inflation, Demand for Liquidity, and Welfare September 26, 2012 11/42

Money-Consumption Ratio by Consumption
Money-consumption ratio declines as consumption increases.
Shutao Cao, Cesaire A. Meh, Jose-Vıctor Rıos-Rull, Yaz Terajima New York University
Inflation, Demand for Liquidity, and Welfare September 26, 2012 12/42

Money-Consumption Ratio by Consumption
0.0
0.1
0.1
0.2
0.2
0.3
0.3
0.4
0.4
0.5
0.3 0.6 0.9 1.2 2.0
Mo
ne
y-C
on
sum
pti
on
Rat
io
Consumption
Shutao Cao, Cesaire A. Meh, Jose-Vıctor Rıos-Rull, Yaz Terajima New York University
Inflation, Demand for Liquidity, and Welfare September 26, 2012 13/42

Money-Consumption Ratio by Consumption and Age
Money-consumption ratio rises with household age.
Shutao Cao, Cesaire A. Meh, Jose-Vıctor Rıos-Rull, Yaz Terajima New York University
Inflation, Demand for Liquidity, and Welfare September 26, 2012 14/42

Money-Consumption Ratio by Consumption and Age
0.5 1 1.5 2 2.50
0.2
0.4
0.6
0.8
1
Consumption
Money−consumption ratio, CFM 2008−2010
age<3536−4546−5556−6566−7576−85
Shutao Cao, Cesaire A. Meh, Jose-Vıctor Rıos-Rull, Yaz Terajima New York University
Inflation, Demand for Liquidity, and Welfare September 26, 2012 15/42

Money-Consumption Ratio by Cohort
Money-consumption ratio declines for newer cohorts.
I Older cohorts have higher money-consumption ratios givenconsumption.
Shutao Cao, Cesaire A. Meh, Jose-Vıctor Rıos-Rull, Yaz Terajima New York University
Inflation, Demand for Liquidity, and Welfare September 26, 2012 16/42

Money-Consumption Ratio by Cohort
0.0500
0.1000
0.1500
0.2000
0.2500
0.3000
0.3500
0.4000
0.4500
25-29 30-34 35-39 40-44 45-49 50-54 55-59 60-64 65-69 70-74 75-79 80-84
Mo
ne
y-C
on
sum
pti
on
Rat
io
Age
Data
Shutao Cao, Cesaire A. Meh, Jose-Vıctor Rıos-Rull, Yaz Terajima New York University
Inflation, Demand for Liquidity, and Welfare September 26, 2012 17/42

Money-Consumption Ratio Over Time
Aggregate money-consumption ratios change over time with themacroeconomic environment.
Shutao Cao, Cesaire A. Meh, Jose-Vıctor Rıos-Rull, Yaz Terajima New York University
Inflation, Demand for Liquidity, and Welfare September 26, 2012 18/42

Money-Consumption Ratio Over Time
consumpreal moneyreal
1.20
1.30
1.40
1.50
1.60
1.70
1.80
1.90
2.00
1999 2000 2001 2002 2003 2004 2005 2006 2007 2008 2009
Ave
rage
Mo
ne
y-C
on
sum
pti
on
Rat
io
Year
Shutao Cao, Cesaire A. Meh, Jose-Vıctor Rıos-Rull, Yaz Terajima New York University
Inflation, Demand for Liquidity, and Welfare September 26, 2012 19/42

Money and Consumption Over Time2004
2500
3000
3500
4000
4500
5000
5500
6000
6500
1999 2000 2001 2002 2003 2004 2005 2006 2007 2008 2009
$
Year
consumpreal moneyreal
Shutao Cao, Cesaire A. Meh, Jose-Vıctor Rıos-Rull, Yaz Terajima New York University
Inflation, Demand for Liquidity, and Welfare September 26, 2012 20/42

Empirical Analysis on Money-Consumption Ratios by Age,Cohort and Time
It is difficult to separate out these three effects.
Our identification strategy and assumptions are:
I Three effects are independent
I Cohort effects are assumed to be exponential with respect to thedifferences in birth year (µ∆birth year/10)
I Time effects are time-specific (λtime)
I Age effects are age-specific (αage)
Estimate µ, λt and αi using annual data on money-consumptionratios from 1999 to 2009, with six 10-year age groups.
Shutao Cao, Cesaire A. Meh, Jose-Vıctor Rıos-Rull, Yaz Terajima New York University
Inflation, Demand for Liquidity, and Welfare September 26, 2012 21/42
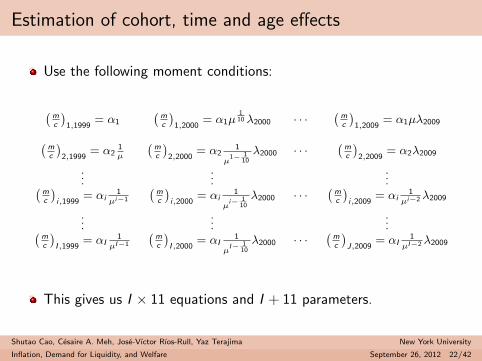
Estimation of cohort, time and age effects
Use the following moment conditions:
(mc
)1,1999
= α1
(mc
)1,2000
= α1µ1
10 λ2000 · · ·(
mc
)1,2009
= α1µλ2009(mc
)2,1999
= α21µ
(mc
)2,2000
= α21
µ1− 1
10λ2000 · · ·
(mc
)2,2009
= α2λ2009
......
...(mc
)i,1999
= αi1
µi−1
(mc
)i,2000
= αi1
µi− 1
10λ2000 · · ·
(mc
)i,2009
= αi1
µi−2 λ2009
......
...(mc
)I ,1999
= αI1
µI−1
(mc
)I ,2000
= αI1
µI− 1
10λ2000 · · ·
(mc
)J,2009
= αI1
µI−2 λ2009
This gives us I × 11 equations and I + 11 parameters.
Shutao Cao, Cesaire A. Meh, Jose-Vıctor Rıos-Rull, Yaz Terajima New York University
Inflation, Demand for Liquidity, and Welfare September 26, 2012 22/42

Estimation of cohort, time and age effects
Additional assumptions we make are:
Cohort effects reduce the demand for money over time: µ ∈ (0, 1)
Shutao Cao, Cesaire A. Meh, Jose-Vıctor Rıos-Rull, Yaz Terajima New York University
Inflation, Demand for Liquidity, and Welfare September 26, 2012 23/42

Estimation results
α1 α2 α3 α4 α5 α6 µ0.091 0.109 0.123 0.175 0.297 0.498 0.994
(0.001) (0.001) 0.002) (0.002) (0.003) (0.007) (0.864)
λ00 λ01 λ02 λ03 λ04 λ05 λ06 λ07 λ08 λ090.96 0.86 0.72 0.96 0.95 0.93 1.02 0.93 0.77 0.67
(0.014) (0.013) (0.013) (0.014) (0.015) (0.016) (0.015) (0.015) (0.013) (0.007)
λ99 ≡ 1 by normalization
Use the estimates to calibrate the following model.
For calibration, the averages over λ99 − λ04 and λ05 − λ09 are used asthe time effects since the model period is 10 years.
Shutao Cao, Cesaire A. Meh, Jose-Vıctor Rıos-Rull, Yaz Terajima New York University
Inflation, Demand for Liquidity, and Welfare September 26, 2012 24/42

We build on Erosa and Ventura (2002)
Seminal work on distribution of welfare cost of inflation:
An infinitely-lived agent model with costly credit transaction.
Study distribution of welfare cost over income.
But abstract from life-cycle effects of inflation which is our focus.
Shutao Cao, Cesaire A. Meh, Jose-Vıctor Rıos-Rull, Yaz Terajima New York University
Inflation, Demand for Liquidity, and Welfare September 26, 2012 25/42

Model
Build an OLG model
Consumption can be purchased with money and costly credit
Agents live for I = 7 periods
Agents differ in income profile (J = 5 exogenous income groups)
Focus on transaction demand for money, and abstract from otherroles of money such as hedging for liquidity risks
Exogenous labour endowments and supply
Shutao Cao, Cesaire A. Meh, Jose-Vıctor Rıos-Rull, Yaz Terajima New York University
Inflation, Demand for Liquidity, and Welfare September 26, 2012 26/42

Household’s problem
max{cij ,sij ,mi+1,j ,ai+1,j}
I∑i=1
βi−1c1−σij
1− σs.t.
cij(1− sij) ≤ mij ;
cij + w ·∫ sij
0
γj(x)dx︸ ︷︷ ︸transaction cost
+ai+1,j + (1 + π)mi+1,j ≤
[1 + r(1− τa)]aij + mij + (1− τz)w zij ;
a1,j = 0, m1,j = m
Shutao Cao, Cesaire A. Meh, Jose-Vıctor Rıos-Rull, Yaz Terajima New York University
Inflation, Demand for Liquidity, and Welfare September 26, 2012 27/42

Government Budget Constraint and Inflation
• Government budget constraint (G–exogenous government spending):
G = πM/P + τl w L + τa r A
• All money is held by households.
I ,J∑i=1,j=1
µij mi+1,j = M/P
• There is a constant inflation rate.
Mt+1 = (1 + π) Mt
Shutao Cao, Cesaire A. Meh, Jose-Vıctor Rıos-Rull, Yaz Terajima New York University
Inflation, Demand for Liquidity, and Welfare September 26, 2012 28/42

Transaction technology
γi (x) = γi ηti ·(
x
1− x
)θi
Fixed cost with respect to consumption and variable with respect tomoney-credit ratios
Age effects: γi and θi
Cohort effects (new): we assume cohort effects (ηti ) on transactioncosts to vary with cohort (indexed by ti )
Use data to discipline γi , θi , ηti
Shutao Cao, Cesaire A. Meh, Jose-Vıctor Rıos-Rull, Yaz Terajima New York University
Inflation, Demand for Liquidity, and Welfare September 26, 2012 29/42

Calibration strategy
Household money demand for consumption (mij
cij) are different in age
(i), income (j) and time (t).
Assume that time effects are driven by macroeconomic parameterssuch as tax rates, inflation and interest rates.
Our focus will be on matching money-consumption ratios andconsumption from the model to those in the data.
I Data: (mijt
cijt) = fijt(αi , µ, λt) and cijt
I Model: (mijt
cijt) = 1
1+[Rtcijt/(wγiηti)]
1/θiand cijt
Dynamically calibrate along a transition where macroeconomicparameters are changing.
Use τzt to balance the government budget.
Shutao Cao, Cesaire A. Meh, Jose-Vıctor Rıos-Rull, Yaz Terajima New York University
Inflation, Demand for Liquidity, and Welfare September 26, 2012 30/42

Dimension of calibration
Household groups:
I Age, I = 7 (We will not target i = 1 HHs for calibration as theirportfolio is fixed by assumption.)
I Income (and consumption class), J = 5
I Total 35 groups (30 groups without i = 1 HHs)
Time periods: 2 periods, 1999 and 2009
Shutao Cao, Cesaire A. Meh, Jose-Vıctor Rıos-Rull, Yaz Terajima New York University
Inflation, Demand for Liquidity, and Welfare September 26, 2012 31/42

Calibration: Data
2 periods x 35 household labour income, {zdataijt }
I ,J,Ti=1,j=1,t=1
2 periods x 30 household consumption, {cdataijt }
I ,J,Ti=2,j=1,t=1
2 periods x 30 household money-consumption ratios,
{mdataijt
cdataijt
}I ,J,Ti=2,j=1,t=1
I Out of these, estimate 6 αdatai ’s (age), µdata (cohort) and λdata (time)
2 periods x 5 aggregate moments: πdatat , rdata
t , Rtdata
, τdataat and Gdata
t
Shutao Cao, Cesaire A. Meh, Jose-Vıctor Rıos-Rull, Yaz Terajima New York University
Inflation, Demand for Liquidity, and Welfare September 26, 2012 32/42

Calibration: List of parameters
35 household labour endowments, {zij}I ,Ji=1,j=1
30 discount factors, {βij}I ,Ji=2,j=1
12 age-dependent credit-transaction cost parameters: 6 γi ’s and 6θi ’s
6 cohort-effects parameter, {ηti}t7ti =t2
, ti is the birth year fori = 2, ..., 7
10 aggregate parameters: πt , rt , Rt , τat and Gt
Shutao Cao, Cesaire A. Meh, Jose-Vıctor Rıos-Rull, Yaz Terajima New York University
Inflation, Demand for Liquidity, and Welfare September 26, 2012 33/42

Calibration WITHOUT solving the model: Parameters andmoments
35 labour endowments: {zij}I ,Ji=1,j=1 = 1T {z
dataijt }
I ,J,Ti=1,j=1,t=1
10 agg. parameters: πt = πdatat , rt = rdata
t , Rt = Rtdata
, τat = τdataat ,
and Gt = Gdatat for t = 1, 2
Shutao Cao, Cesaire A. Meh, Jose-Vıctor Rıos-Rull, Yaz Terajima New York University
Inflation, Demand for Liquidity, and Welfare September 26, 2012 34/42

Calibration WITH solving the model: Parameters
30 discount factors, {βij}I ,Ji=2,j=1
12 age-dependent credit-transaction cost parameters: 6 γi ’s and 6θi ’s
6 cohort-effects parameter, {ηti}t7ti =t2
, ti is the birth year fori = 2, ..., 7, and set ηt1 = ηt2 = 1,
2 periods of τzt , wt
Shutao Cao, Cesaire A. Meh, Jose-Vıctor Rıos-Rull, Yaz Terajima New York University
Inflation, Demand for Liquidity, and Welfare September 26, 2012 35/42
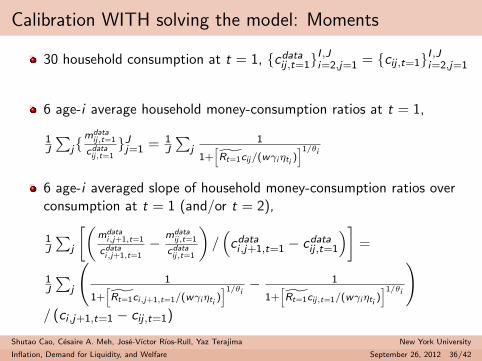
Calibration WITH solving the model: Moments
30 household consumption at t = 1, {cdataij ,t=1}
I ,Ji=2,j=1 = {cij ,t=1}I ,Ji=2,j=1
6 age-i average household money-consumption ratios at t = 1,
1J
∑j{
mdataij,t=1
cdataij,t=1
}Jj=1 = 1J
∑j
1
1+[Rt=1cij/(wγiηti
)]1/θi
6 age-i averaged slope of household money-consumption ratios overconsumption at t = 1 (and/or t = 2),
1J
∑j
[(mdata
i,j+1,t=1
cdatai,j+1,t=1
− mdataij,t=1
cdataij,t=1
)/(cdatai ,j+1,t=1 − cdata
ij ,t=1
)]=
1J
∑j
(1
1+[Rt=1ci,j+1,t=1/(wγiηti
)]1/θi− 1
1+[Rt=1cij,t=1/(wγiηti
)]1/θi
)/ (ci ,j+1,t=1 − cij ,t=1)
Shutao Cao, Cesaire A. Meh, Jose-Vıctor Rıos-Rull, Yaz Terajima New York University
Inflation, Demand for Liquidity, and Welfare September 26, 2012 36/42

Calibration WITH solving the model: Moments
6 ratios of averaged money-consumption ratios over income; for i = 2to 7
1µ·λ =
∑Jj=1
1
1+[Rt=1cij,t=1/(wt=1γiηti)]
1/θi∑Jj=1
1
1+[Rt=2cij,t=2/(wt=2γiηti +1)]1/θi
2 periods of government budget equations,
Gdatat = πdata
t Mt + τdataa rdata
t At + τztwtZdatat
2 periods of labour demand: wt = fL(Kt , Lt)
Shutao Cao, Cesaire A. Meh, Jose-Vıctor Rıos-Rull, Yaz Terajima New York University
Inflation, Demand for Liquidity, and Welfare September 26, 2012 37/42

Calibration results
Parameter Value Target Data Model
γ2 0.0013 15
∑j
(mc
)2,j
0.1457 0.1315
γ3 0.0020 15
∑j
(mc
)3,j
0.1754 0.1595
γ4 0.0041 15
∑j
(mc
)4,j
0.2324 0.2093
γ5 0.0040 15
∑j
(mc
)5,j
0.2888 0.2662
γ6 0.0060 15
∑j
(mc
)6,j
0.4127 0.3817
γ7 0.0083 15
∑j
(mc
)7,j
0.6087 0.6675
θ2 1.7790 14
∑j ∆(
mc
)2,j
-0.1031 -0.0959
θ3 1.6838 14
∑j ∆(
mc
)3,j
-0.1223 -0.1174
θ4 1.4857 14
∑j ∆(
mc
)4,j
-0.1932 -0.1871
θ5 1.4816 14
∑j ∆(
mc
)5,j
-0.2544 -0.2700
θ6 1.3309 14
∑j ∆(
mc
)6,j
-0.4581 -0.4693
θ7 1.2800 14
∑j ∆(
mc
)7,j
-0.9254 -0.9988
Shutao Cao, Cesaire A. Meh, Jose-Vıctor Rıos-Rull, Yaz Terajima New York University
Inflation, Demand for Liquidity, and Welfare September 26, 2012 38/42

Calibration results
Parameter Value Target Data Model
η2 0.6783 λ9904µ·λ0509
1.0580 0.9610
η3 0.4629 λ9904µ·λ0509
1.0580 0.9669
η4 0.3230 λ9904µ·λ0509
1.0580 0.9621
η5 0.2244 λ9904µ·λ0509
1.0580 0.9542
η6 0.1513 λ9904µ·λ0509
1.0580 0.9572
η7 0.1138 λ9904µ·λ0509
1.0580 0.9577
βi,1 0.9552,...,0.7833 ci,1 0.3827,...,0.2573 0.3684,...,0.2319βi,2 0.9308,...,0.7617 ci,2 0.6828,...,0.4632 0.6605,...,0.4171βi,3 0.9221,...,0.7628 ci,3 0.9368,...,0.6779 0.9133,...,0.6130βi,4 0.9175,...,0.7660 ci,4 1.2710,...,1.0054 1.2723,...,0.9070βi,5 0.9548,...,0.8082 ci,5 2.0730,...,1.7970 2.0619,...,1.8499
Shutao Cao, Cesaire A. Meh, Jose-Vıctor Rıos-Rull, Yaz Terajima New York University
Inflation, Demand for Liquidity, and Welfare September 26, 2012 39/42

Calibration results - Money-consumption ratios
0 0.5 1 1.5 2 2.50
0.2
0.4
0.6
0.8
1
1.2
1.4
Consumption
age=30age=40age=50age=60age=70age=80
Shutao Cao, Cesaire A. Meh, Jose-Vıctor Rıos-Rull, Yaz Terajima New York University
Inflation, Demand for Liquidity, and Welfare September 26, 2012 40/42
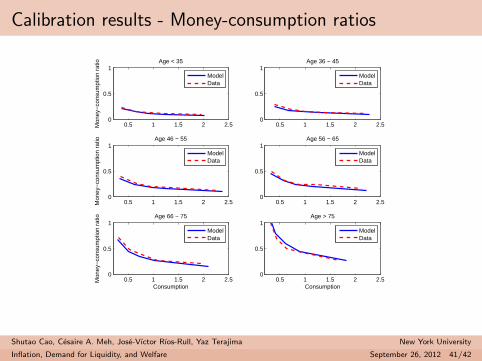
Calibration results - Money-consumption ratios
0.5 1 1.5 2 2.50
0.5
1
Mon
ey−
cons
umpt
ion
ratio Age < 35
ModelData
0.5 1 1.5 2 2.50
0.5
1Age 36 − 45
ModelData
0.5 1 1.5 2 2.50
0.5
1
Mon
ey−
cons
umpt
ion
ratio Age 46 − 55
ModelData
0.5 1 1.5 2 2.50
0.5
1Age 56 − 65
ModelData
0.5 1 1.5 2 2.50
0.5
1
Consumption
Mon
ey−
cons
umpt
ion
ratio Age 66 − 75
ModelData
0.5 1 1.5 2 2.50
0.5
1
Consumption
Age > 75
ModelData
Shutao Cao, Cesaire A. Meh, Jose-Vıctor Rıos-Rull, Yaz Terajima New York University
Inflation, Demand for Liquidity, and Welfare September 26, 2012 41/42

Results – to be added
Shutao Cao, Cesaire A. Meh, Jose-Vıctor Rıos-Rull, Yaz Terajima New York University
Inflation, Demand for Liquidity, and Welfare September 26, 2012 42/42
Related Documents