ASEAN Economic Bulletin 180 Vol. 26, No. 2, August 2009 ASEAN Economic Bulletin Vol. 26, No. 2 (2009), pp. 180–93 ISSN 0217-4472 print / ISSN 1793-2831 electronic © 2009 ISEAS DOI: 10.1355/ae26-2d Inflation and Economic Growth in Malaysia A Threshold Regression Approach Qaiser Munir, Kasim Mansur and Fumitaka Furuoka This paper examines the issue of the existence of threshold effects in the relationship between inflation rate and growth rate of GDP in the context of Malaysia, using new endogenous threshold autoregressive (TAR) models proposed by Hansen (2000) for estimation and inference. The empirical analysis uses annual data from Malaysia for the period 1970–2005. A specific question addressed in this study was: What is the threshold inflation rate for Malaysia? The findings clearly suggest that one inflation threshold value (i.e., structural break point) exists for Malaysia; and this implies a non-linear relationship between inflation and growth. The estimated threshold regression model suggests 3.89 per cent as the threshold value of inflation rate above which inflation significantly retards growth rate of GDP. In addition, below the threshold level, there is a statistically significant positive relationship between inflation rate and growth. If Bank Negara (Central Bank of Malaysia) pays more attention to the inflation phenomena, then substantial gains can be achieved in low-inflation environment while conducting the new monetary policy. Keywords: Inflation rate, economic growth, threshold model, structural break, Malaysia. I. Introduction The conventional view in macroeconomics holds that low inflation is a necessary condition for fostering economic growth. Although the debate about the precise relationship between inflation and growth remains open, the question of the existence and nature of the link between inflation and economic growth has been the subject of considerable interest and debate. Different schools of thought offer different evidence on this relationship. For example, structuralists believe that inflation is essential for economic growth, whereas the monetarists see inflation as detrimental to economic growth (Mallik and Chowdhury 2001, p. 123). In a seminal paper, Tobin (1965) introduces money into a Solow- Swan model as an asset alternative to capital. In this context, inflation increases the opportunity cost of money holdings and thus favours capital accumulation and hence growth. Conversely, in endogenous growth models, the effects of inflation

Welcome message from author
This document is posted to help you gain knowledge. Please leave a comment to let me know what you think about it! Share it to your friends and learn new things together.
Transcript
ASEAN Economic Bu l l e t in 180 Vo l . 26 , No . 2 , Augus t 2009
ASEAN Economic Bulletin Vol. 26, No. 2 (2009), pp. 180–93 ISSN 0217-4472 print / ISSN 1793-2831 electronic
© 2009 ISEAS
DOI: 10.1355/ae26-2d
Inflation and Economic Growthin Malaysia
A Threshold Regression Approach
Qaiser Munir, Kasim Mansur and Fumitaka Furuoka
This paper examines the issue of the existence of threshold effects in the relationship betweeninflation rate and growth rate of GDP in the context of Malaysia, using new endogenousthreshold autoregressive (TAR) models proposed by Hansen (2000) for estimation andinference. The empirical analysis uses annual data from Malaysia for the period 1970–2005.A specific question addressed in this study was: What is the threshold inflation rate forMalaysia? The findings clearly suggest that one inflation threshold value (i.e., structuralbreak point) exists for Malaysia; and this implies a non-linear relationship between inflationand growth. The estimated threshold regression model suggests 3.89 per cent as the thresholdvalue of inflation rate above which inflation significantly retards growth rate of GDP. Inaddition, below the threshold level, there is a statistically significant positive relationshipbetween inflation rate and growth. If Bank Negara (Central Bank of Malaysia) pays moreattention to the inflation phenomena, then substantial gains can be achieved in low-inflationenvironment while conducting the new monetary policy.
Keywords: Inflation rate, economic growth, threshold model, structural break, Malaysia.
I. Introduction
The conventional view in macroeconomics holdsthat low inflation is a necessary condition forfostering economic growth. Although the debateabout the precise relationship between inflationand growth remains open, the question of theexistence and nature of the link between inflationand economic growth has been the subject ofconsiderable interest and debate. Different schoolsof thought offer different evidence on this
relationship. For example, structuralists believethat inflation is essential for economic growth,whereas the monetarists see inflation asdetrimental to economic growth (Mallik andChowdhury 2001, p. 123). In a seminal paper,Tobin (1965) introduces money into a Solow-Swan model as an asset alternative to capital. Inthis context, inflation increases the opportunitycost of money holdings and thus favours capitalaccumulation and hence growth. Conversely, inendogenous growth models, the effects of inflation
04 Munir 8/26/09, 2:49 PM180

ASEAN Economic Bu l l e t in 181 Vo l . 26 , No . 2 , Augus t 2009
are explained in the works of Gomme (1993) andJones and Manuelli (1995). For example, wheremoney is introduced in the budget constraint in amodel of human capital accumulation, an increasein the rate of inflation negatively affects bothconsumption and labour supply leading to a lowergrowth rate. De Gregorio (1993) shows thatinflation may have relevant effects onaccumulation of physical capital. In his model,money is a means of reducing transaction costsboth for consumers and firms, a higher inflationrate induces agents to reduce their moneyholdings, thus increasing the transaction costs andgenerating negative effects on investment andgrowth. Earlier empirical works generallyaccepted the view that there exists a negativerelationship between inflation and economicgrowth (Barro 1991; Fischer 1993; Bullard andKeating 1995).
If inflation is indeed detrimental to economicactivity and growth, it readily follows thatpolicy-makers should aim at a low rate ofinflation. But how low should inflation be orshould it be 0 per cent? In other words, at whatlevel of inflation does the relationship betweeninflation and growth become negative? Theanswer to this question obviously depends uponthe nature and structure of the economy and willvary from country to country. Recent studiesspecifically test for non-linearity in therelationship between inflation and economicgrowth. That is, at lower rates of inflation, therelationship is insignificant or positive, butat higher levels, inflation has a significantlynegative effect on economic growth. If such anon-linear relationship exists between inflationand growth, then it should be possible to estimatethe threshold level (structural break point) atwhich the sign of the relationship between thetwo variables would switch. This is mainlyachieved either by defining a priori thethresholds for different levels of inflation rate inad hoc manners (Fischer 1993; Barro 1995;Bruno and Easterly 1998), or by using a splineregression technique to directly estimate thethreshold rate of inflation (Sarel 1996; Ghosh andPhillips 1998).
For example, the seminal work by Fischer(1993) examined the possibility of non-linearitiesin the relationship between inflation and economicgrowth in panel of ninety-three countries. Usingboth cross-section and panel data for a sample thatincludes both developing and industrializedcountries, results from this study suggest anegative relationship between inflation andgrowth. Interestingly, by using break points of15 per cent and 40 per cent in spline regression,Fisher showed not only the presence of non-linearities in the relationship between inflation andgrowth, but also that the strength of thisrelationship weakens for inflation rates above40 per cent.
Sarel (1996) used a panel data of eighty-sevencountries during the period 1970–90 and tested astructural break in the relationship betweeninflation and growth and found evidence of asignificant structural break at an annual inflationrate of 8 per cent — implying below that rate,inflation does not have a significant effect ongrowth, or it may even show a marginally positiveeffect. Above that level, the effect is negative,statistically significant and extremely strong.
Bruno and Easterly (1998) examined thedeterminants of economic growth using annualconsumer price index (CPI) inflation of twenty-sixcountries which experienced inflation crisesduring the period 1961–92. In their empiricalanalysis, inflation rate of 40 per cent and over isconsidered as the threshold level for an inflationcrisis. They found inconsistent or somewhatinconclusive relationship between inflation andeconomic growth below this threshold level whencountries with high inflation crises were excludedfrom the sample.
Khan and Senhadji (2001) used an unbalancedpanel data with 140 countries covering the period1960–98 to estimate the threshold levels forindustrial and developing countries. Using thenon-linear least squares (NLLS) estimationmethod, Khan and Senhadji (2001) estimated thatthe threshold levels for industrial countries anddeveloping countries were at 1–3 per cent and11–12 per cent respectively. The negativeand significant relationship between inflation
04 Munir 8/26/09, 2:49 PM181

ASEAN Economic Bu l l e t in 182 Vo l . 26 , No . 2 , Augus t 2009
and growth, for inflation rates above the thresholdlevel, is quite robust with respect to the estimationmethod.
Most recent economists have chosen to analysethe relationship between inflation and growth byexploiting time series variation in the data. Forinstance, Mubarik (2005) estimated the thresholdlevel of inflation for Pakistan using an annual dataset from the period 1973–2000. His estimation ofthe threshold model suggests that an inflation ratebeyond 9 per cent is detrimental for the economicgrowth of Pakistan. This, in turn, suggests that aninflation rate below the estimated level of 9 percent is favourable for the economic growth. Onthe contrary, Hussain (2005) found no thresholdlevel of inflation for Pakistan by using the data setfrom the period 1973–2005. He suggests thattargeting inflation exceeding a range of 4–6 percent will be a deterrent to economic growth.Previously, Singh and Kalirajan (2003)specifically addressed the issue of existence of thethreshold effect by using annual data from Indiafor the period 1971–98. They also suggest thatthere is no threshold level of inflation for India;however, their findings clearly suggest that anincrease in inflation from any level has negativeeffect on economic growth.
Lee and Wong (2005) estimated the thresholdlevels of inflation for Taiwan and Japan usingquarterly data set from the period 1965–2002 forTaiwan and 1970–2001 for Japan. Their estimationof the threshold models suggest that an inflationrate beyond 7.25 per cent is detrimental for theeconomic growth of Taiwan. On the other hand,they found two threshold levels for Japan, whichare 2.52 per cent and 9.66 per cent. This suggeststhat inflation rate below the estimated level of9.66 per cent is favourable to economic growthand beyond this threshold value it is harmful forthe economic growth.
The purpose of this paper is to re-examine therelationship between inflation rate and economicgrowth, and it attempts to estimate precisethreshold levels by using annual data for Malaysiaover the period 1970–2005. Particularly, thequestions that are addressed in this paper are:(1) Is there any threshold level of inflation in the
case of Malaysia above which inflation affectsgrowth rate of GDP differently? (2) Is such astructural break statistically significant? Thispaper employs relatively new econometricmethods for threshold estimation and inference, asproposed by Hansen (1996; 2000).
The remainder of this paper proceeds asfollows. Section II provides information about thehistorical trends of inflation and economic growthin Malaysia. Section III presents econometrictechniques to find the precise threshold levels forinflation rate, describes the data, and presents thesummary statistics. Section IV provides theestimation results and discussions. Lastly, sectionV offers some concluding remarks and proposespossible extensions for future research on thetopic.
II. Historical Trends of Inflation andEconomic Growth in Malaysia
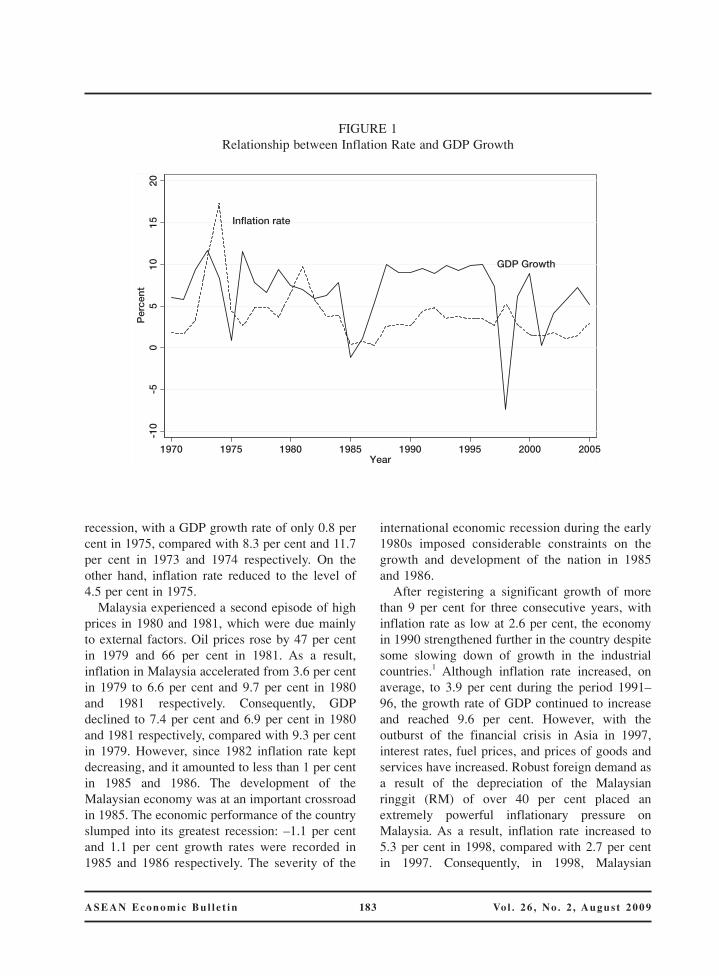
Low inflation and sustainable GDP growth hasbeen one of the main features of the Malaysianeconomy in the last two decades. Despite itsrobust economic growth in the 1980s and 1990s,Malaysia’s inflation rate had been relatively lowby international standards. Even after the severeAsian financial crisis (1997 and 1998) and sharpdepreciation of the ringgit in 1997–98, Malaysia’sinflation rate has been contained at a relativelylow level (see Figure 1).
In the early 1970s, Malaysia experienced asingle-digit episode of inflation at only 2 per centwhile the growth rate of GDP was approximately7 per cent. The GDP growth rate remained thesame during the second half of the 1970s whileinflation rate gradually increased to 4 per cent.The sharp oil price increase in 1973 and 1974 wasthe principal reason for the escalation of worldinflation in 1973–74. Consequently, consumerprices in Malaysia began to rise and inflation hadreached a double-digit level of 10.56 per cent bythe end of 1973. In 1974, the surge in oil price byover 230 per cent added strong fuel to inflation,and the inflation rate in Malaysia increased to itsrecord high of 17.32 per cent. A year later, theMalaysian economy slumped into its great
04 Munir 8/26/09, 2:49 PM182
ASEAN Economic Bu l l e t in 183 Vo l . 26 , No . 2 , Augus t 2009
recession, with a GDP growth rate of only 0.8 percent in 1975, compared with 8.3 per cent and 11.7per cent in 1973 and 1974 respectively. On theother hand, inflation rate reduced to the level of4.5 per cent in 1975.
Malaysia experienced a second episode of highprices in 1980 and 1981, which were due mainlyto external factors. Oil prices rose by 47 per centin 1979 and 66 per cent in 1981. As a result,inflation in Malaysia accelerated from 3.6 per centin 1979 to 6.6 per cent and 9.7 per cent in 1980and 1981 respectively. Consequently, GDPdeclined to 7.4 per cent and 6.9 per cent in 1980and 1981 respectively, compared with 9.3 per centin 1979. However, since 1982 inflation rate keptdecreasing, and it amounted to less than 1 per centin 1985 and 1986. The development of theMalaysian economy was at an important crossroadin 1985. The economic performance of the countryslumped into its greatest recession: –1.1 per centand 1.1 per cent growth rates were recorded in1985 and 1986 respectively. The severity of the
international economic recession during the early1980s imposed considerable constraints on thegrowth and development of the nation in 1985and 1986.
After registering a significant growth of morethan 9 per cent for three consecutive years, withinflation rate as low at 2.6 per cent, the economyin 1990 strengthened further in the country despitesome slowing down of growth in the industrialcountries.1 Although inflation rate increased, onaverage, to 3.9 per cent during the period 1991–96, the growth rate of GDP continued to increaseand reached 9.6 per cent. However, with theoutburst of the financial crisis in Asia in 1997,interest rates, fuel prices, and prices of goods andservices have increased. Robust foreign demand asa result of the depreciation of the Malaysianringgit (RM) of over 40 per cent placed anextremely powerful inflationary pressure onMalaysia. As a result, inflation rate increased to5.3 per cent in 1998, compared with 2.7 per centin 1997. Consequently, in 1998, Malaysian
FIGURE 1Relationship between Inflation Rate and GDP Growth
Inflation rate
GDP Growth
-10
-50
510
1520
Per
cent
1970 1975 1980 1985 1990 1995 2000 2005Year
04 Munir 8/26/09, 2:49 PM183

ASEAN Economic Bu l l e t in 184 Vo l . 26 , No . 2 , Augus t 2009
economy experienced a sharp decline in thegrowth rate of GDP from positive growth rate tonegative, at –7.4 per cent, compared with 7.3 percent in 1997. Between 2000 and 2005, inflationrate stabilized and remained approximately around1.7 per cent with relatively low growth rate ofGDP of only 5.2 per cent.
Generally, Malaysian inflation rate is controlledby the government. Malaysia exhibits an ex-ceptional feature in terms of inflationaryexperiences; the economy had experienced high(1973–74, 1980–81) and low (1985–87) regimesof inflation, and was able to contain a low andstable inflation during the high economic growthperiod of 1988–96. The achievement of thisrelatively low inflation during the high economicgrowth regime was attributed to the effective andconsistent policy mix adopted by the Malaysiangovernment (Cheng and Tan 2003, p. 423). Chengand Tan (2003, p. 423) indicate that, besidesdomestic factors, which include private con-sumption, government expenditure, interest rateand money supply, external factors, such asincreased fuel prices, also have a significant
influence on Malaysian inflation resulting in anegative impact on growth. In order to test thethreshold effect of inflation, Figure 2 provides amore direct view of the inflation–growthassociation by plotting the average GDP growthrate against average inflation rate. This analysisis done by reducing the whole sample ofobservations into six observations, according tothe degree of inflation rate; by calculating averageinflation rate and corresponding average growthrate of GDP within each range of inflation rate(i.e., inflation rate ≤ 1 per cent, 1 per cent< inflation rate ≤ 2 per cent, and so on). This data-reductioning procedure makes two key features ofthe data immediately apparent. First, it is clearlyevident from Figure 2, that there is a non-linearrelationship between inflation rate and growth rateof GDP. Second, this non-linearity shows positiverelationship between inflation and growth up to4 per cent level (approximately); and beyond thatlevel there is negative relationship. The initialconclusion drawn from this analysis is that thethreshold value is around 4 per cent. However,in the subsequent section, we employ new
FIGURE 2Average GDP Growth and Inflation Rate
Average GDP Growth
02
46
810
GD
P G
row
th
.5 1 1.5 2 2.5 3 3.5 4 4.5 5 5.5 6 6.5Inflation Rate
04 Munir 8/26/09, 2:49 PM184
ASEAN Economic Bu l l e t in 185 Vo l . 26 , No . 2 , Augus t 2009
econometric techniques that provide appropriateprocedures for estimation and inference forthreshold effects.
III. Model Specification and Data
In this section, we present the data set used in thisstudy with the descriptive statistics and correlationmatrix of the variables. Further, we describebriefly the econometric methodology of thethreshold estimation proposed by Hansen (2000).2
III.1 Data Description and Source
To carry out an estimation procedure of therelationship between inflation and economicgrowth we employ annual data covering theperiod 1970–2005. The data is extracted from theWorld Bank’s World Development Indicators(2007 CD-ROM). In order to maintain anacceptable degree of freedom and to avoidpotential multicollinearity problem, we includeonly those variables which are frequently used inthe growth regression.3 The variables used in theestimations are the following:
• GDP Growth Rate (GDPGR). This is thedependent variable used in the regressions. Theeconomic growth rate represented by the annualpercentage growth rate of GDP at market pricesbased on constant local currency.
• Inflation Rate (INFRATE). Inflation raterepresented by the annual percentage growthrate of consumer price index (CPI) with 2000 as
the base year. This is the main explanatory andthreshold variable used in the regressions.
• Financial Depth (M2/GR). Following King andLevine (1993a, b), we used this explanatoryvariable as the index of financial depth in acountry. This is constructed as an averageannual percentage growth rate in money andquasi money to the GDP. Money and quasimoney comprise the sum of currency outsidebanks, demand deposits other than those of thecentral government, and the time, savings, andforeign currency deposits of resident sectorsother than the central government. Thisdefinition is frequently called broad money(M2).
• Gross Capital Formation (GCFGR). Thisvariable is used as a proxy of physical capitalaccumulation. This is the annual percentagegrowth rate of gross capital formation (formerlygross domestic investment). It consists ofoutlays on additions to the fixed assets of theeconomy plus net changes in the level ofinventories.
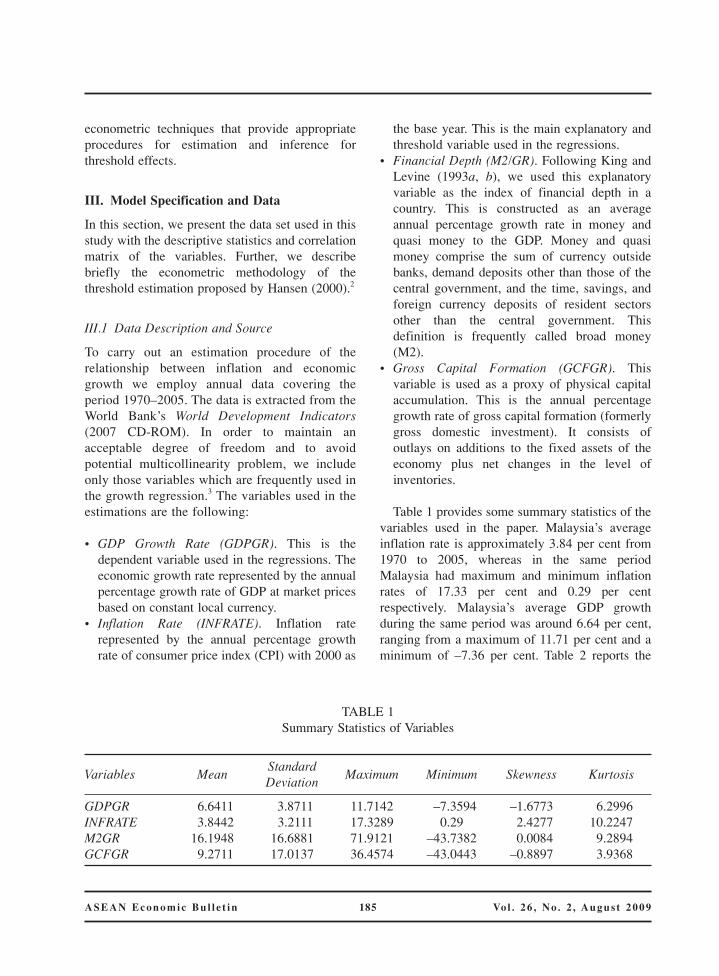
Table 1 provides some summary statistics of thevariables used in the paper. Malaysia’s averageinflation rate is approximately 3.84 per cent from1970 to 2005, whereas in the same periodMalaysia had maximum and minimum inflationrates of 17.33 per cent and 0.29 per centrespectively. Malaysia’s average GDP growthduring the same period was around 6.64 per cent,ranging from a maximum of 11.71 per cent and aminimum of –7.36 per cent. Table 2 reports the
TABLE 1Summary Statistics of Variables
Variables MeanStandard
Maximum Minimum Skewness KurtosisDeviation
GDPGR 6.6411 3.8711 11.7142 –7.3594 –1.6773 6.2996INFRATE 3.8442 3.2111 17.3289 0.29 2.4277 10.2247M2GR 16.1948 16.6881 71.9121 –43.7382 0.0084 9.2894GCFGR 9.2711 17.0137 36.4574 –43.0443 –0.8897 3.9368
04 Munir 8/26/09, 2:49 PM185
ASEAN Economic Bu l l e t in 186 Vo l . 26 , No . 2 , Augus t 2009
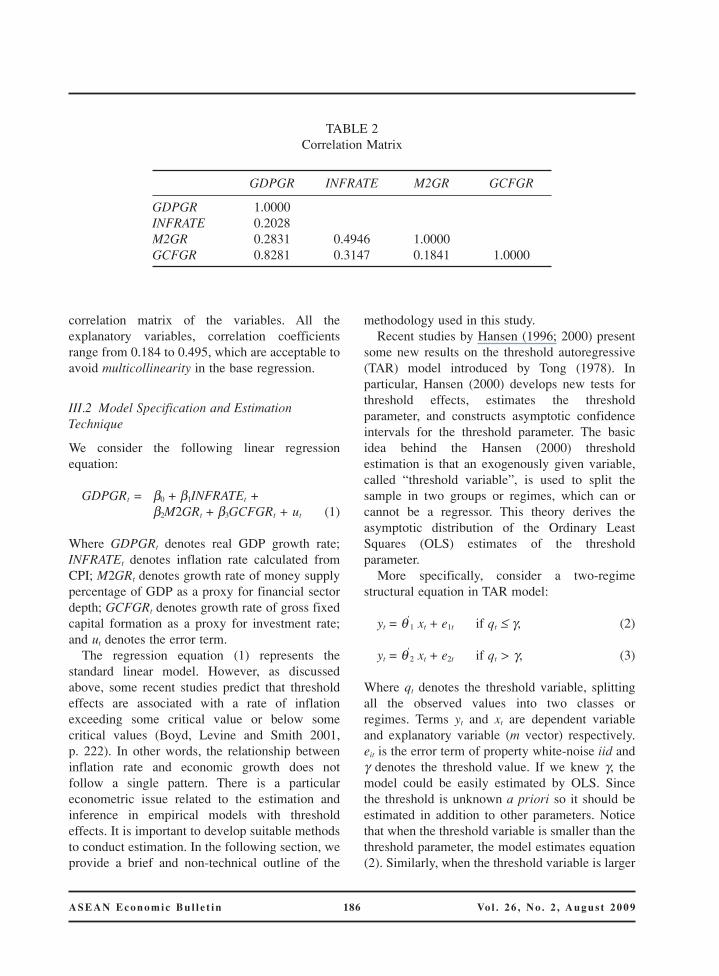
correlation matrix of the variables. All theexplanatory variables, correlation coefficientsrange from 0.184 to 0.495, which are acceptable toavoid multicollinearity in the base regression.
III.2 Model Specification and EstimationTechnique
We consider the following linear regressionequation:
GDPGRt = β0 + β1INFRATEt +β2M2GRt + β3GCFGRt + ut (1)
Where GDPGRt denotes real GDP growth rate;INFRATEt denotes inflation rate calculated fromCPI; M2GRt denotes growth rate of money supplypercentage of GDP as a proxy for financial sectordepth; GCFGRt denotes growth rate of gross fixedcapital formation as a proxy for investment rate;and ut denotes the error term.
The regression equation (1) represents thestandard linear model. However, as discussedabove, some recent studies predict that thresholdeffects are associated with a rate of inflationexceeding some critical value or below somecritical values (Boyd, Levine and Smith 2001,p. 222). In other words, the relationship betweeninflation rate and economic growth does notfollow a single pattern. There is a particulareconometric issue related to the estimation andinference in empirical models with thresholdeffects. It is important to develop suitable methodsto conduct estimation. In the following section, weprovide a brief and non-technical outline of the
methodology used in this study.Recent studies by Hansen (1996; 2000) present
some new results on the threshold autoregressive(TAR) model introduced by Tong (1978). Inparticular, Hansen (2000) develops new tests forthreshold effects, estimates the thresholdparameter, and constructs asymptotic confidenceintervals for the threshold parameter. The basicidea behind the Hansen (2000) thresholdestimation is that an exogenously given variable,called “threshold variable”, is used to split thesample in two groups or regimes, which can orcannot be a regressor. This theory derives theasymptotic distribution of the Ordinary LeastSquares (OLS) estimates of the thresholdparameter.
More specifically, consider a two-regimestructural equation in TAR model:
yt = θ’1 xt + e1t if qt ≤ γ, (2)
yt = θ’2 xt + e2t if qt > γ, (3)
Where qt denotes the threshold variable, splittingall the observed values into two classes orregimes. Terms yt and xt are dependent variableand explanatory variable (m vector) respectively.eit is the error term of property white-noise iid andγ denotes the threshold value. If we knew γ, themodel could be easily estimated by OLS. Sincethe threshold is unknown a priori so it should beestimated in addition to other parameters. Noticethat when the threshold variable is smaller than thethreshold parameter, the model estimates equation(2). Similarly, when the threshold variable is larger
TABLE 2Correlation Matrix
GDPGR INFRATE M2GR GCFGR
GDPGR 1.0000INFRATE 0.2028M2GR 0.2831 0.4946 1.0000GCFGR 0.8281 0.3147 0.1841 1.0000
04 Munir 8/26/09, 2:49 PM186
ASEAN Economic Bu l l e t in 187 Vo l . 26 , No . 2 , Augus t 2009
than the threshold parameter, the model estimatesequation (3).
Defining a binary variable dt (γ) = {qt ≤ γ}where {·} is the indicator function, with d = 1 ifqt ≤ γ occurs or d = 0 otherwise, and settingxt(γ) = xtdt(γ), then equations (2) and (3) can berewritten as a single equation:
yt = θ’xt + δ ’xt(γ) + et (4)
Where, θ = θ2, δ = θ1 – θ2, and θ, δ , γ are theregression parameters to be estimated. Theresidual sum of squares as a result of estimatingthe regression parameters can be written asS1(γ) = êt(γ)êt(γ). Hansen (2000, p. 577)recommend estimating γ by least squarestechnique. The easiest way to implement thisprocedure is through minimization of the sum ofsquared residuals as a function of expectedthreshold value. Hence, we can write the optimum
threshold value as γ̂ = arg min S1(γ). Conditional
on γ̂ , the regression equation is linear in θ and δ ’,
yielding the conditional OLS estimates of θˆ(γ) and
ˆ ( )σ γ by regression of dependent variable on
explanatory variables.Following the foregoing procedure, linear
equation (1) can be expressed as a non-linearequation under a two-regime TAR model asfollows:
GDPGRt = (β10 + β11INFRATEt + β12M2GRt
+ β13GCFGRt) d[qt ≤ γ ] +(β20 + β21INFRATEt + β22M2GRt
+ β23GCFGRt) d[qt > γ ] + e*t (5)
In the estimation of model (5), the optimalthreshold value is determined by obtaining thethreshold value that minimizes the residual sum ofsquares (RSS). Since the main objective of thispaper is to investigate the inflationary thresholdeffects in the relationship between inflation rateand economic growth in Malaysia, the annualgrowth rate of inflation is employed as thethreshold variable in the analysis.
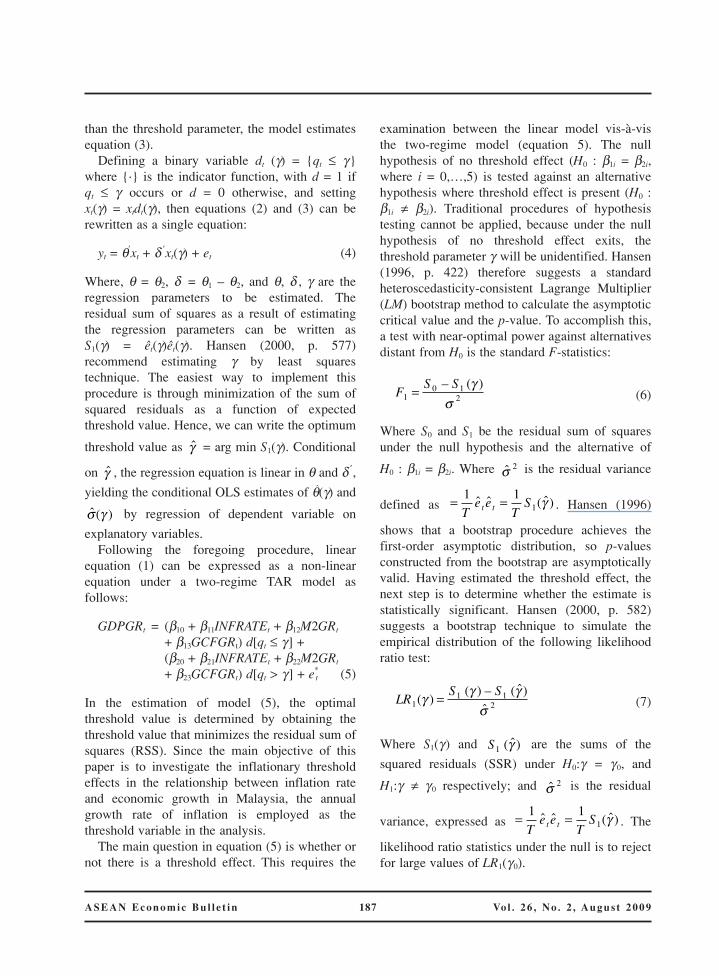
The main question in equation (5) is whether ornot there is a threshold effect. This requires the
examination between the linear model vis-à-visthe two-regime model (equation 5). The nullhypothesis of no threshold effect (H0 : β1i = β2i,where i = 0,…,5) is tested against an alternativehypothesis where threshold effect is present (H0 :β1i ≠ β2i). Traditional procedures of hypothesistesting cannot be applied, because under the nullhypothesis of no threshold effect exits, thethreshold parameter γ will be unidentified. Hansen(1996, p. 422) therefore suggests a standardheteroscedasticity-consistent Lagrange Multiplier(LM) bootstrap method to calculate the asymptoticcritical value and the p-value. To accomplish this,a test with near-optimal power against alternativesdistant from H0 is the standard F-statistics:
FS S
10 1
2= – ( )γσ
(6)
Where S0 and S1 be the residual sum of squaresunder the null hypothesis and the alternative of
H0 : β1i = β2i. Where σ̂ 2 is the residual variance
defined as = =1 11T
e eT
St tˆ ˆ ( ˆ)γ . Hansen (1996)
shows that a bootstrap procedure achieves thefirst-order asymptotic distribution, so p-valuesconstructed from the bootstrap are asymptoticallyvalid. Having estimated the threshold effect, thenext step is to determine whether the estimate isstatistically significant. Hansen (2000, p. 582)suggests a bootstrap technique to simulate theempirical distribution of the following likelihoodratio test:
LRS S
11 1
2( )( ) – ( ˆ)
ˆγ γ γ
σ= (7)
Where S1(γ ) and S1 ( ˆ)γ are the sums of the
squared residuals (SSR) under H0:γ = γ 0, and
H1:γ ≠ γ 0 respectively; and σ̂ 2 is the residual
variance, expressed as = =1 11T
e eT
St tˆ ˆ ( ˆ)γ . The
likelihood ratio statistics under the null is to rejectfor large values of LR1(γ 0).
04 Munir 8/26/09, 2:49 PM187

ASEAN Economic Bu l l e t in 188 Vo l . 26 , No . 2 , Augus t 2009
In addition, Hansen (2000, p. 584) showed thatthe asymptotic distribution of the likelihoodratio statistics LR1(γ 0) is not normally distributed.The author computed valid asymptoticconfidence intervals about the estimated thresholdvalues by using their no-rejection region,
c( ) – ln( – – )α α= 2 1 1 , where α is a given
asymptotic level; and the no-rejection region ofthe confidence level is 1 – α. i.e., if LR1 (γ 0) ≤c(α) then the null hypothesis of H0:γ = γ 0 cannotbe rejected. In order to examine more than onethreshold value, foregoing procedures are applieduntil the null hypothesis can no longer be rejected.
IV. The Empirical Results
Prior to presenting the results, it is important toconsider whether the variables under considerationare stationary. We test for stationarity to ensurethat the variables used in the regressions are notsubject to spurious correlation. The AugmentedDickey-Fuller (ADF) and the Phillips-Perron (PP)units root tests are used to investigate thestationary status of each variable. These tests areapplied to the level variables. The results arepresented in Table 3. The estimation results showthat the null hypothesis of unit root is rejected at
the 1 per cent level of significance in both tests,except INFRATE. In the ADF test, INFRATE isonly significant at 10 per cent when the time trendnot included. However, when PP test is applied,INFRATE become significant at 5 per cent levels.Therefore, generally results imply that theunderlying variables show stationary process.
IV.1 Test Statistics for Existence ofThreshold Effects
Table 4 presents the test results for the thresholdeffects with the annual growth rate of inflationemployed as the threshold variable. The results ofthe threshold test and asymptotic p-values in ourendogenous threshold analysis are obtainedthrough 1,000 bootstrap replications to correct thestandard errors of the estimates.
We first need to examine the existence of athreshold effect. The value of F1 statistics is 25.74with bootstrap p-value 0.02. Therefore, F1 teststrongly rejects the null hypothesis that there is nothreshold at the 5 per cent significant level,suggesting one threshold at least. The estimatedoptimal threshold value is equal to 3.897 per centwhich divides our sample in two groups (lowinflation and high inflation groups) according tothis variable. We further employ the F test to
TABLE 3Results of Unit Root tests with ADF and PP
Variables
Augmented Dickey-Fuller (ADF) Phillips-Perron (PP)
Constant without Constant with Constant without Constant withlinear trend linear trend linear trend linear trend
GDPGR –4.8255*** (0) –4.9291*** (0) –4.8381*** (1) –4.9373*** (1)INFRATE –2.9096* (8) –3.1010 (8) –3.2877** (3) –3.6829** (12)M2GR –4.6277*** (1) –5.4196*** (1) –4.8861*** (0) –5.2862*** (5)GCFGR –5.4663*** (0) –5.5278*** (0) –5.4664*** (2) –5.5223*** (3)
NOTES: Figures within parentheses indicate lag lengths. Lag length for ADF tests have been decided on thebasis of Akaike Information Criterion (AIC) (Akaike 1974). Maximum Bandwidth for PP tests have beendecided on the basis of Newey-West (1994). The ADF and PP tests are based on the null hypothesis of unitroots. ***, **, and * indicate significant at 1 per cent, 5 per cent, and 10 per cent levels respectively, based onthe critical t statistics as computed by MacKinnon (1996).
04 Munir 8/26/09, 2:49 PM188
ASEAN Economic Bu l l e t in 189 Vo l . 26 , No . 2 , Augus t 2009
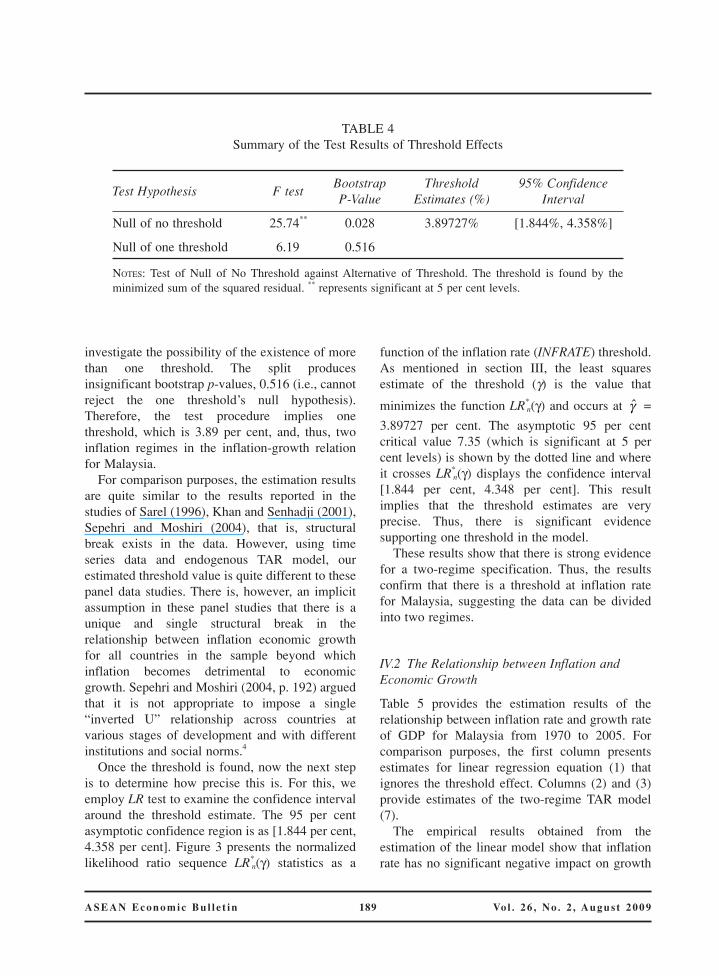
investigate the possibility of the existence of morethan one threshold. The split producesinsignificant bootstrap p-values, 0.516 (i.e., cannotreject the one threshold’s null hypothesis).Therefore, the test procedure implies onethreshold, which is 3.89 per cent, and, thus, twoinflation regimes in the inflation-growth relationfor Malaysia.
For comparison purposes, the estimation resultsare quite similar to the results reported in thestudies of Sarel (1996), Khan and Senhadji (2001),Sepehri and Moshiri (2004), that is, structuralbreak exists in the data. However, using timeseries data and endogenous TAR model, ourestimated threshold value is quite different to thesepanel data studies. There is, however, an implicitassumption in these panel studies that there is aunique and single structural break in therelationship between inflation economic growthfor all countries in the sample beyond whichinflation becomes detrimental to economicgrowth. Sepehri and Moshiri (2004, p. 192) arguedthat it is not appropriate to impose a single“inverted U” relationship across countries atvarious stages of development and with differentinstitutions and social norms.4
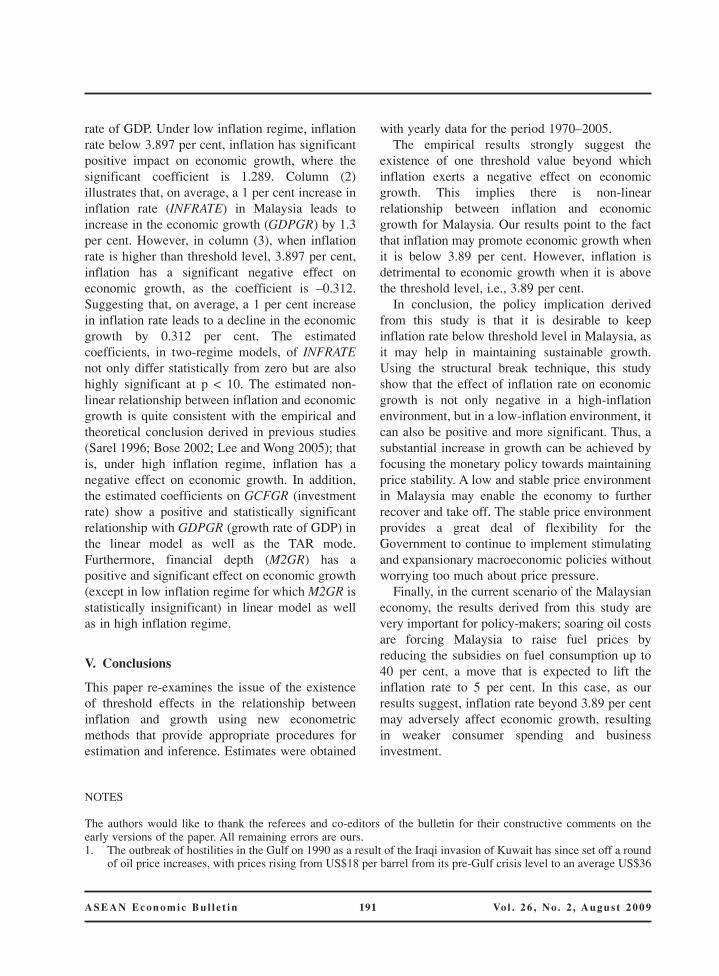
Once the threshold is found, now the next stepis to determine how precise this is. For this, weemploy LR test to examine the confidence intervalaround the threshold estimate. The 95 per centasymptotic confidence region is as [1.844 per cent,4.358 per cent]. Figure 3 presents the normalizedlikelihood ratio sequence LR*
n(γ) statistics as a
function of the inflation rate (INFRATE) threshold.As mentioned in section III, the least squaresestimate of the threshold (γ) is the value that
minimizes the function LR*n(γ) and occurs at γ̂ =
3.89727 per cent. The asymptotic 95 per centcritical value 7.35 (which is significant at 5 percent levels) is shown by the dotted line and whereit crosses LR*
n(γ) displays the confidence interval[1.844 per cent, 4.348 per cent]. This resultimplies that the threshold estimates are veryprecise. Thus, there is significant evidencesupporting one threshold in the model.
These results show that there is strong evidencefor a two-regime specification. Thus, the resultsconfirm that there is a threshold at inflation ratefor Malaysia, suggesting the data can be dividedinto two regimes.
IV.2 The Relationship between Inflation andEconomic Growth
Table 5 provides the estimation results of therelationship between inflation rate and growth rateof GDP for Malaysia from 1970 to 2005. Forcomparison purposes, the first column presentsestimates for linear regression equation (1) thatignores the threshold effect. Columns (2) and (3)provide estimates of the two-regime TAR model(7).
The empirical results obtained from theestimation of the linear model show that inflationrate has no significant negative impact on growth
TABLE 4Summary of the Test Results of Threshold Effects
Test Hypothesis F testBootstrap Threshold 95% ConfidenceP-Value Estimates (%) Interval
Null of no threshold 25.74** 0.028 3.89727% [1.844%, 4.358%]
Null of one threshold 6.19 0.516
NOTES: Test of Null of No Threshold against Alternative of Threshold. The threshold is found by theminimized sum of the squared residual. ** represents significant at 5 per cent levels.
04 Munir 8/26/09, 2:49 PM189

ASEAN Economic Bu l l e t in 190 Vo l . 26 , No . 2 , Augus t 2009
FIGURE 3First Sample Split: Confidence Interval Constructions for Threshold
TABLE 5Regression Results of Inflation Rate and GDP Growth (1970–2005)
VariablesLinear Model Threshold Model
(OLS without threshold) Regime 1 ≤ 3.89727% Regime 2 > 3.89727%
Constant 4.8681*** 2.5966** 4.1971***
–0.5751 –0.9507 –0.7046INFRATE –0.2001 1.2896*** –0.3129**
–0.1354 –0.3813 –0.1029M2GR 0.0488* 0.0104 0.0787***
–0.0244 –0.0194 –0.0076GCFGR 0.1915*** 0.1249*** 0.2076***
–0.0296 –0.0336 –0.0157
Observations 36 25 11R2 0.723 0.716 0.947
NOTES: The dependent variable is growth rate of GDP from 1970 to 2005. Standard errors in parentheses are Whitecorrected for heteroscedasticity. The estimation results correspond to trimming percentage of 15 per cent. ***, **, and *
represent significant at 1 per cent, 5 per cent, and 10 per cent levels respectively.
04 Munir 8/26/09, 2:49 PM190
ASEAN Economic Bu l l e t in 191 Vo l . 26 , No . 2 , Augus t 2009
rate of GDP. Under low inflation regime, inflationrate below 3.897 per cent, inflation has significantpositive impact on economic growth, where thesignificant coefficient is 1.289. Column (2)illustrates that, on average, a 1 per cent increase ininflation rate (INFRATE) in Malaysia leads toincrease in the economic growth (GDPGR) by 1.3per cent. However, in column (3), when inflationrate is higher than threshold level, 3.897 per cent,inflation has a significant negative effect oneconomic growth, as the coefficient is –0.312.Suggesting that, on average, a 1 per cent increasein inflation rate leads to a decline in the economicgrowth by 0.312 per cent. The estimatedcoefficients, in two-regime models, of INFRATEnot only differ statistically from zero but are alsohighly significant at p < 10. The estimated non-linear relationship between inflation and economicgrowth is quite consistent with the empirical andtheoretical conclusion derived in previous studies(Sarel 1996; Bose 2002; Lee and Wong 2005); thatis, under high inflation regime, inflation has anegative effect on economic growth. In addition,the estimated coefficients on GCFGR (investmentrate) show a positive and statistically significantrelationship with GDPGR (growth rate of GDP) inthe linear model as well as the TAR mode.Furthermore, financial depth (M2GR) has apositive and significant effect on economic growth(except in low inflation regime for which M2GR isstatistically insignificant) in linear model as wellas in high inflation regime.
V. Conclusions
This paper re-examines the issue of the existenceof threshold effects in the relationship betweeninflation and growth using new econometricmethods that provide appropriate procedures forestimation and inference. Estimates were obtained
with yearly data for the period 1970–2005.The empirical results strongly suggest the
existence of one threshold value beyond whichinflation exerts a negative effect on economicgrowth. This implies there is non-linearrelationship between inflation and economicgrowth for Malaysia. Our results point to the factthat inflation may promote economic growth whenit is below 3.89 per cent. However, inflation isdetrimental to economic growth when it is abovethe threshold level, i.e., 3.89 per cent.
In conclusion, the policy implication derivedfrom this study is that it is desirable to keepinflation rate below threshold level in Malaysia, asit may help in maintaining sustainable growth.Using the structural break technique, this studyshow that the effect of inflation rate on economicgrowth is not only negative in a high-inflationenvironment, but in a low-inflation environment, itcan also be positive and more significant. Thus, asubstantial increase in growth can be achieved byfocusing the monetary policy towards maintainingprice stability. A low and stable price environmentin Malaysia may enable the economy to furtherrecover and take off. The stable price environmentprovides a great deal of flexibility for theGovernment to continue to implement stimulatingand expansionary macroeconomic policies withoutworrying too much about price pressure.
Finally, in the current scenario of the Malaysianeconomy, the results derived from this study arevery important for policy-makers; soaring oil costsare forcing Malaysia to raise fuel prices byreducing the subsidies on fuel consumption up to40 per cent, a move that is expected to lift theinflation rate to 5 per cent. In this case, as ourresults suggest, inflation rate beyond 3.89 per centmay adversely affect economic growth, resultingin weaker consumer spending and businessinvestment.
NOTES
The authors would like to thank the referees and co-editors of the bulletin for their constructive comments on theearly versions of the paper. All remaining errors are ours.1. The outbreak of hostilities in the Gulf on 1990 as a result of the Iraqi invasion of Kuwait has since set off a round
of oil price increases, with prices rising from US$18 per barrel from its pre-Gulf crisis level to an average US$36
04 Munir 8/26/09, 2:49 PM191

ASEAN Economic Bu l l e t in 192 Vo l . 26 , No . 2 , Augus t 2009
in October 1990. The immediate impact of the third oil crisis in 1990 has been an increase of inflationarypressure in both the industrial and developing countries (Ministry of Finance Malaysia 1990).
2. Hansen (2000) presents a statistical estimation theory for threshold estimation in cross-section regressioncontext; however, it can also be employed in time series analysis.
3. Other potential explanatory variables, population growth, foreign direct investment, trade openness, and exportsof goods and services, etc., are found insignificant in the regression. Furthermore, the proxies for human capitalvariables, secondary school enrollment rate, the average years of secondary schooling of the total population,etc., are important explanatory variables in the growth model. However, in the existing datasets for education,such as World Development Indicators, Barro-Lee, such variable is not available for annual basis from 1970 to2005. Therefore, we restrict to very few variables in the sample dataset.
4. Temple (2000) warns against the risk of pooling together countries with very different inflation dynamics, as fewextremely high values may well derive the overall results.
REFERENCES
Barro, R. J. “Economic Growth in a Cross Section of Countries”. Quarterly Journal of Economics 106, no. 2 (1991):407–43.
———. “Inflation and Economic Growth”. National Bureau of Economic Research (NBER) Working Paper No. 5326(1995).
Bose, B. “Inflation, the Credit Market, and Economic Growth”. Oxford Economic Paper 54, no. 3 (2002): 412–34.Boyd, J., R. Levine. and B. Smith. “The Impact of Inflation on Financial Sector Performance”. Journal of Monetary
Economics 47, no. 21 (2001): 221–48.Bruno, M. and W. Easterly, W. “Inflation Crises and Long-Run Growth”. Journal of Monetary Economics 41, no. 1
(1998): 3–26.Bullard, J. and D. Keating. “The Long-Run Relationship between Inflation and Output in Postwar Economies”.
Journal of Monetary Economics 36, no. 3 (1995): 477–96.Cheng, M. Y. and H. B. Tan. “Inflation in Malaysia”. International Journal of Social Economics 29, no. 5 (2000):
411–25.De Gregorio, J. “Inflation, Taxation and Long Run Growth”. Journal of Monetary Economics 31, no. 3 (1993): 271–
98.Dickey, D. and W. Fuller. “Distribution of the Estimators for Autoregressive Time Series with a Unit Root”. Journal
of the American Statistical Association 74, no. 366 (1979): 427–31.Dickey, D. and W. Fuller. “Likelihood Ratio Tests for Autoregressive Time Series with a Unit Root”. Econometrica
49, no. 4 (1981): 1057–72.Fischer, S. “The Role of Macroeconomic Factors in Growth”. Journal of Monetary Economics 32, no. 3 (1993): 485–
12.Ghosh, A. and S. Phillips. “Warning: Inflation May Be Harmful to Your Growth”. IMF Staff Papers 45, no. 4 (1998):
672–710.Gomme, P. “Money and Growth Revisited: Measuring the Costs of Inflation in an Endogenous Growth Model”.
Journal of Monetary Economics 32, no. 1 (1993), pp. 51–77.Hansen, B. “Inference when a Nuisance Parameters Is not Identified under the Null Hypothesis”. Econometrica 64,
no. 2 (1996): 413–30.———. “Sample Splitting and Threshold Estimation”. Econometrica 68, no. 3 (2000): 575–603.Hussain, M. “Inflation and Growth: Estimation of Threshold Point for Pakistan”. Pakistan Business Review, October
(2005): 1–15.Jones, L. E. and R. E. Manuelli. “Growth and the Effects of Inflation”. Journal of Economic Dynamics and Control
19, no. 8 (1995): 1405–28Khan, M. S. and A. S. Senhadji. “Threshold Effects in the Relationship between Inflation and Growth”. IMF Staff
Papers 48, no. 1 (2001): 1–21.King, R. G. and R. Levine. “Finance and Growth: Schumpeter Might Be Right”. Quarterly Journal of Economics
108, no. 3 (1993a): 717–37.———. “Finance, Entrepreneurship, and Growth: Theory and Evidence”. Journal of Monetary Economics 32, no. 3
(1993b): 513–42.
04 Munir 8/26/09, 2:49 PM192

ASEAN Economic Bu l l e t in 193 Vo l . 26 , No . 2 , Augus t 2009
Lee, C. C. and S. Y. Wong. “Inflationary Threshold Effects in the Relationship between Financial Development andEconomic Growth: Evidence from Taiwan and Japan”. Journal of Economic Development 30, no. 1 (2005): 49–69.
MacKinnon, J. G. “Numerical Distribution Functions for Unit Root and Cointegration tests”. Journal of AppliedEconometrics 11, no. 6 (1996): 601–18.
Mallik, G. and A. Chowdhury. “Inflation and Economic Growth: Evidence from South Asian Countries”. AsianPacific Development Journal 8, no. 1 (2001): 123–35.
Ministry of Finance Malaysia. Economic Report. Kuala Lumpur: National Printers, 1990.Mubarik, Y. A. “Inflation and Growth: An Estimate of the Threshold Level of Inflation in Pakistan”. State Bank of
Pakistan — Research Bulletin 1, no. 1 (2005): 35–44.Phillips, P. C. B. and P. Perron. “Testing for a Unit Root in Time Series Regression”. Biometrika 75, no. 2 (1988):
335–46.Sarel, M. “Nonlinear Effects of Inflation on Economic Growth”. IMF Staff Papers 43, no. 1 (March 1996): 199–215.Sepehri, A. and S. Moshiri. “Inflation-Growth Profiles Across Countries: Evidence from Developing and Developed
Countries”. International Review of Applied Economics 18, no. 2 (2004): 191–207.Singh, K. and K. Kaliappa. “The Inflation-Growth Nexus in India: An Empirical Analysis”. Journal of Policy
Modeling 25, no. 4 (2003): 377–96.Temple, J. “Inflation and Growth: Stories Short and Tall”. Journal of Economic Surveys 14, no. 4 (2000): 395–426.Tobin, J. “Money and Economic growth”. Econometrica 33 (1965): 671–84.Tong, H. “On the Threshold Mode”. In Pattern Recognition and Signal Processing, edited by C. H. Chen, pp. 101–41.
Amsterdam: Sijthoff and Noordhoff, 1978.
Qaiser Munir is Lecturer at the School of Business and Economics, Universiti Malaysia Sabah, Malaysia.
Kasim Mansur is Associate Professor at the School of Business and Economics, Universiti Malaysia Sabah,Malaysia.
Fumitaka Furuoka is Associate Professor at the School of Business and Economics, Universiti Malaysia Sabah,Malaysia.
04 Munir 8/26/09, 2:49 PM193

Related Documents


