Inferring consistent functional interaction patterns from natural stimulus FMRI data Jiehuan Sun a, e, 1 , Xintao Hu b, 1 , Xiu Huang a , Yang Liu a, c , Kaiming Li b, d , Xiang Li d , Junwei Han b , Lei Guo b , Tianming Liu d, ⁎, Jing Zhang a, ⁎ a Department of Statistics, Yale University, CT, USA b School of Automation, Northwestern Polytechnic University, China c Department of Computing, The Hong Kong Polytechnic University, HK, China d Department of Computer Science and Bioimaging Research Center, The University of Georgia, Athens, GA, USA e Department of Biostatistics, Bloomberg School of Public Health, Johns Hopkins University, Baltimore, MD, USA abstract article info Article history: Accepted 13 January 2012 Available online 14 March 2012 Keywords: Natural stimulus fMRI DTI Functional interaction There has been increasing interest in how the human brain responds to natural stimulus such as video watching in the neuroimaging field. Along this direction, this paper presents our effort in inferring consistent and repro- ducible functional interaction patterns under natural stimulus of video watching among known functional brain regions identified by task-based fMRI. Then, we applied and compared four statistical approaches, in- cluding Bayesian network modeling with searching algorithms: greedy equivalence search (GES), Peter and Clark (PC) analysis, independent multiple greedy equivalence search (IMaGES), and the commonly used Granger causality analysis (GCA), to infer consistent and reproducible functional interaction patterns among these brain regions. It is interesting that a number of reliable and consistent functional interaction pat- terns were identified by the GES, PC and IMaGES algorithms in different participating subjects when they watched multiple video shots of the same semantic category. These interaction patterns are meaningful given current neuroscience knowledge and are reasonably reproducible across different brains and video shots. In particular, these consistent functional interaction patterns are supported by structural connections derived from diffusion tensor imaging (DTI) data, suggesting the structural underpinnings of consistent func- tional interactions. Our work demonstrates that specific consistent patterns of functional interactions among relevant brain regions might reflect the brain's fundamental mechanisms of online processing and compre- hension of video messages. © 2012 Elsevier Inc. All rights reserved. Introduction FMRI leverages the coupling between neural activity and hemo- dynamics in the human brain to obtain non-invasive measurement of brain activity (Logothetis, 2008; Friston, 2009). In the past few decades, fMRI has revolutionized how we study the function of the human brain (Fox and Raichle, 2007; Logothetis, 2008; Friston, 2009). Specifically, task-based fMRI has been widely used as a benchmark approach to localize functionally-specialized brain re- gions (Logothetis, 2008; Friston, 2009). Therefore, thousands of fMRI tasks have been reported in the literature to map those functionally-specialized brain regions (e.g., Laird et al., 2009). Re- cently, resting state fMRI has been increasingly used in the literature to map resting brain regions based on the premise that correlations between resting state fMRI time series originate from coherency in the underlying neural activation patterns of brain regions and reflect functional connectivity (e.g., Fox and Raichle, 2007; Cohen et al., 2008; van den Heuvel et al., 2008). In comparison, natural stimulus fMRI (Bartels and Zeki, 2004, 2005; Golland et al., 2007; Hasson et al., 2010) is relatively less studied due to more complexity and var- iability during fMRI experiment design and imaging sessions. Never- theless, the advantage of natural stimulus fMRI under movie watching is that the human subjects are naturally engaged in the perception and cognition of the multimedia streams. This is more in an uncontrolled natural environment, which is well suited to study the functional interactions and dynamics among brain regions in response to multimedia stimuli. In the neuroimaging field, there have been increasing interests in investigating how the human brain responds to the natural stimulus such as image/video watching and in studying if consistent response patterns exist across individuals (Bartels and Zeki, 2004, 2005; Golland et al., 2007; Kay et al., 2008; Hasson et al., 2010; Haxby, 2010; Said et al., 2010; Nishimoto et al., 2011). Notably, a recent work in Hasson et al. (2004) demonstrated the effectiveness of applying natural stimulus fMRI in understanding the dynamics of cognitive systems during movie watching, and showed that different brains' fMRI-derived re- sponses to the same movie could be similar. A recent review article NeuroImage 61 (2012) 987–999 ⁎ Corresponding authors. E-mail addresses: [email protected] (T. Liu), [email protected] (J. Zhang). 1 Co-first authors. 1053-8119/$ – see front matter © 2012 Elsevier Inc. All rights reserved. doi:10.1016/j.neuroimage.2012.01.142 Contents lists available at SciVerse ScienceDirect NeuroImage journal homepage: www.elsevier.com/locate/ynimg

Welcome message from author
This document is posted to help you gain knowledge. Please leave a comment to let me know what you think about it! Share it to your friends and learn new things together.
Transcript

NeuroImage 61 (2012) 987–999
Contents lists available at SciVerse ScienceDirect
NeuroImage
j ourna l homepage: www.e lsev ie r .com/ locate /yn img
Inferring consistent functional interaction patterns from natural stimulus FMRI data
Jiehuan Sun a,e,1, Xintao Hu b,1, Xiu Huang a, Yang Liu a,c, Kaiming Li b,d, Xiang Li d, Junwei Han b, Lei Guo b,Tianming Liu d,⁎, Jing Zhang a,⁎a Department of Statistics, Yale University, CT, USAb School of Automation, Northwestern Polytechnic University, Chinac Department of Computing, The Hong Kong Polytechnic University, HK, Chinad Department of Computer Science and Bioimaging Research Center, The University of Georgia, Athens, GA, USAe Department of Biostatistics, Bloomberg School of Public Health, Johns Hopkins University, Baltimore, MD, USA
⁎ Corresponding authors.E-mail addresses: [email protected] (T. Liu), jing.zhang
1 Co-first authors.
1053-8119/$ – see front matter © 2012 Elsevier Inc. Alldoi:10.1016/j.neuroimage.2012.01.142
a b s t r a c t
a r t i c l e i n f oArticle history:Accepted 13 January 2012Available online 14 March 2012
Keywords:Natural stimulus fMRIDTIFunctional interaction
There has been increasing interest in how the human brain responds to natural stimulus such as video watching inthe neuroimaging field. Along this direction, this paper presents our effort in inferring consistent and repro-ducible functional interaction patterns under natural stimulus of video watching among known functionalbrain regions identified by task-based fMRI. Then, we applied and compared four statistical approaches, in-cluding Bayesian network modeling with searching algorithms: greedy equivalence search (GES), Peter andClark (PC) analysis, independent multiple greedy equivalence search (IMaGES), and the commonly usedGranger causality analysis (GCA), to infer consistent and reproducible functional interaction patternsamong these brain regions. It is interesting that a number of reliable and consistent functional interaction pat-terns were identified by the GES, PC and IMaGES algorithms in different participating subjects when theywatched multiple video shots of the same semantic category. These interaction patterns are meaningfulgiven current neuroscience knowledge and are reasonably reproducible across different brains and videoshots. In particular, these consistent functional interaction patterns are supported by structural connectionsderived from diffusion tensor imaging (DTI) data, suggesting the structural underpinnings of consistent func-tional interactions. Our work demonstrates that specific consistent patterns of functional interactions amongrelevant brain regions might reflect the brain's fundamental mechanisms of online processing and compre-hension of video messages.
© 2012 Elsevier Inc. All rights reserved.
Introduction
FMRI leverages the coupling between neural activity and hemo-dynamics in the human brain to obtain non-invasive measurementof brain activity (Logothetis, 2008; Friston, 2009). In the past fewdecades, fMRI has revolutionized how we study the function of thehuman brain (Fox and Raichle, 2007; Logothetis, 2008; Friston,2009). Specifically, task-based fMRI has been widely used as abenchmark approach to localize functionally-specialized brain re-gions (Logothetis, 2008; Friston, 2009). Therefore, thousands offMRI tasks have been reported in the literature to map thosefunctionally-specialized brain regions (e.g., Laird et al., 2009). Re-cently, resting state fMRI has been increasingly used in the literatureto map resting brain regions based on the premise that correlationsbetween resting state fMRI time series originate from coherency inthe underlying neural activation patterns of brain regions and reflect
[email protected] (J. Zhang).
rights reserved.
functional connectivity (e.g., Fox and Raichle, 2007; Cohen et al.,2008; van den Heuvel et al., 2008). In comparison, natural stimulusfMRI (Bartels and Zeki, 2004, 2005; Golland et al., 2007; Hasson etal., 2010) is relatively less studied due to more complexity and var-iability during fMRI experiment design and imaging sessions. Never-theless, the advantage of natural stimulus fMRI under moviewatching is that the human subjects are naturally engaged in theperception and cognition of the multimedia streams. This is morein an uncontrolled natural environment, which is well suited tostudy the functional interactions and dynamics among brain regionsin response to multimedia stimuli. In the neuroimaging field, therehave been increasing interests in investigating how the human brainresponds to the natural stimulus such as image/video watching andin studying if consistent response patterns exist across individuals(Bartels and Zeki, 2004, 2005; Golland et al., 2007; Kay et al.,2008; Hasson et al., 2010; Haxby, 2010; Said et al., 2010;Nishimoto et al., 2011). Notably, a recent work in Hasson et al.(2004) demonstrated the effectiveness of applying natural stimulusfMRI in understanding the dynamics of cognitive systems duringmovie watching, and showed that different brains' fMRI-derived re-sponses to the same movie could be similar. A recent review article
988 J. Sun et al. / NeuroImage 61 (2012) 987–999
on natural stimulus fMRI and the reliability of brain activity duringnatural stimulation is provided in Hasson et al. (2010).
In addition to using video/image stimulus to study the brain'sfunction (e.g., Bartels and Zeki, 2004, 2005; Golland et al., 2007;Hasson et al., 2010; Haxby, 2010; Said et al., 2010; Nishimoto etal., 2011), there has been increasing effort from the video/image con-tent analysis field in applying brain imaging techniques as neuro-monitoring tools to extract high-level semantics features, thus guidingand facilitating video/image analysis (e.g., Wang et al., 2009; Hu etal., 2010; Ji et al., 2011; Hu et al., 2012). For instance, in Wang etal. (2009), an electroencephalography (EEG)-based brain-machineinterface was developed to guide image annotation and retrievaltask. In this work, the rapid serial visual presentation (RSVP) para-digm (Gerson et al., 2006) was used for the presentation of imagesto a subject. Then, the recorded EEG signals were mapped as an “in-terest score” that meant to reflect how much of a user's attentionwas directed toward an image. Finally, the interest scores assignedto training images helped to propagate the labels to retrieve rele-vant images from a larger pool based on a graph pattern miningsubsystem, and promising results were achieved (Wang et al.,2009) in contrast to the approach of using visual image representa-tion alone. Recently, several studies took the advantage of fMRI toadvance human semantics understanding and/or video/image analy-sis (Walther et al., 2009; Hu et al., 2010; Ji et al., 2011; Hu et al.,2012). The authors in Walther et al. (2009) studied a network ofspecific brain regions of interests (ROIs) that affects the human abil-ity of discriminating visual scenes and demonstrated that brain ac-tivity from some ROIs can guide the selection of interesting imageframes. The studies in Hu et al. (2010) and Hu et al. (2012) demon-strated that functional brain connectivity patterns derived from rel-evant networks can be used as high-level semantics features toguide the selection of low-level features for the purpose of videoshot classification. The authors in Ji et al. (2011) extracted meaningfulfeatures from natural stimulus fMRI data to conduct video representa-tion and retrieval in the brain imaging space, and demonstratedpromising results.
It is clear that there has been growing interest from both brain imag-ing and image/video analysis fields in applying natural stimulus brainimaging of image/video watching to study the brain function (Bartelsand Zeki, 2004, 2005; Golland et al., 2007; Hasson et al., 2010), or toguide video/image content representation and analysis (Wang et al.,2009; Hu et al., 2010; Ji et al., 2011; Hu et al., 2012). In the field, peo-ple have to rely on consistent and reproducible patterns, e.g., func-tional or effective connectivities (Murre and Goebel, 1996; Friston etal., 2003; Storkey et al., 2007; van de Ven et al., 2008; Chai et al.,2009), to infer meaningful information from natural stimulus fMRIdata based on existing neuroscience knowledge (Hasson et al., 2004,2010; Hu et al., 2010, 2012). Along this direction, this paper presentsour effort in inferring consistent and reproducible functional interac-tion patterns among known functional brain regions under naturalstimulus of movie watching. Given the substantial variability of struc-tural localization of functionally-specialized brain regions, we usedextensive task-based fMRI studies to identify brain regions involvedin working memory, motor, visual and auditory regions in younghealthy participants. Then, the same group of participants underwentnatural stimulus fMRI while watching video clips selected from theTRECVID dataset (http://trecvid.nist.gov/), which is an internationalconsortium providing benchmark video data for content-basedvideo retrieval. At this stage, the video clips are semantically catego-rized into sports, weather report, and commercial advertisementthat were defined by the large-scale concept ontology for multimedia(LSCOM) group (http://www.lscom.org/). Afterwards, the naturalstimulus fMRI BOLD signals are extracted from the mapped functionalbrain regions in each individual subject for the purpose of computa-tional modeling of functional interaction patterns. In particular, weapplied and compared four statistical approaches, including Bayesian
network modeling with searching algorithms: greedy equivalencesearch (GES) (Meek, 1997), Peter and Clark (PC) analysis (Spirtesand Glymour, 1991), independent multiple greedy equivalencesearch (IMaGES) (Ramsey et al., 2010), and the popularly used Grang-er causality analysis (GCA) (Granger, 1969), to infer consistent and re-producible functional interaction patterns among the above-mentionedbrain regions based on the extracted natural stimulus fMRI BOLD signals.It is interesting that we found a number of reliable and consistentfunctional interaction patterns by the GES, PC and IMaGES algorithmsin different subjects when they watched the same category of videoclips, that is, one of sports, weather report, or commercial advertise-ment. These interaction patterns are meaningful given current neuro-science knowledge and are reasonably reproducible across differentbrains. In particular, the functionally strong interaction patterns aresupported by structural connection patterns derived from tractogra-phy (Behrens et al., 2003) result of diffusion tensor imaging (DTI)data, suggesting the structural substrates of consistent functionalinteractions.
From computational and statistical perspectives, our experimentalresults suggest that Bayesian network modeling approach is more re-liable and meaningful than the widely used GCA for the application ofmodeling functional interactions in natural stimulus fMRI data for thefollowing reasons. Bayesian network methods consider all the ROIsfor inference simultaneously and thus has lower false positive rate.GCA takes into account the temporal lag information of the time seriesfMRI data, which makes its inference less accurate due to the influenceof the relatively low temporal resolution of MRI data, the influence ofthe intervention of hemodynamics on the fMRI signals (Roebroeck etal., 2005), and the influence of complex temporal dynamics of effectiveconnectivity. In comparison, Bayesian network methods do not relyon the temporal information of fMRI signals and thus tend to bemore robust.
Materials and methods
Overview
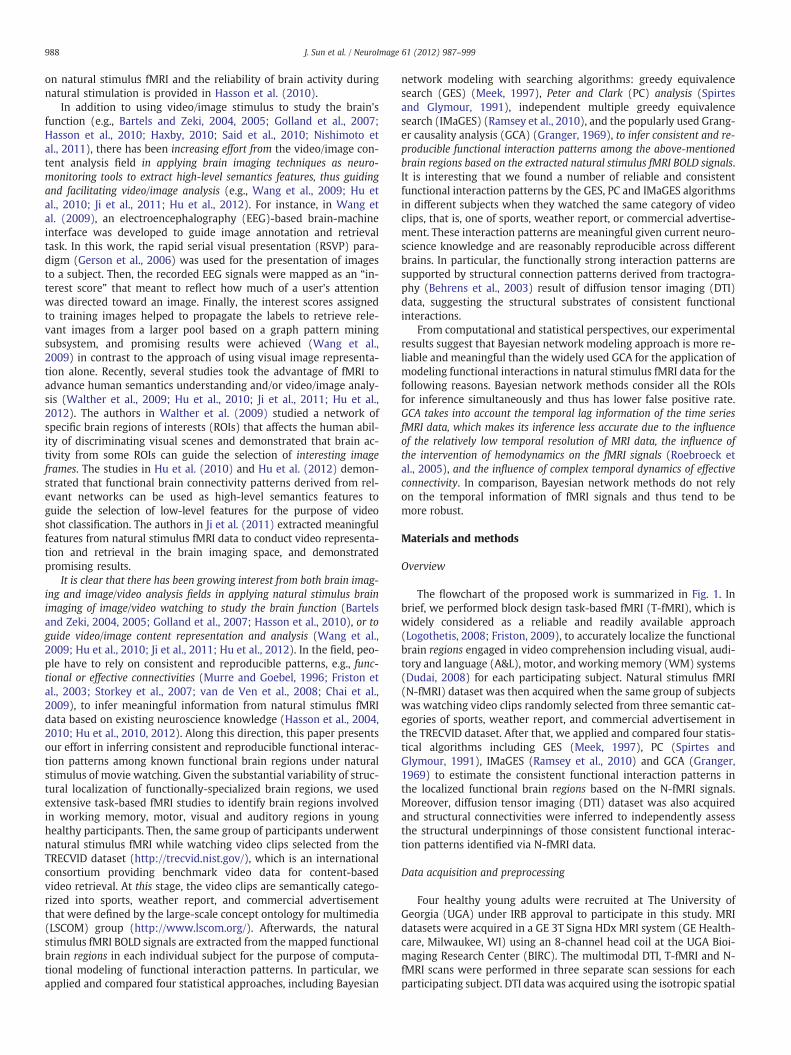
The flowchart of the proposed work is summarized in Fig. 1. Inbrief, we performed block design task-based fMRI (T-fMRI), which iswidely considered as a reliable and readily available approach(Logothetis, 2008; Friston, 2009), to accurately localize the functionalbrain regions engaged in video comprehension including visual, audi-tory and language (A&L), motor, and workingmemory (WM) systems(Dudai, 2008) for each participating subject. Natural stimulus fMRI(N-fMRI) dataset was then acquired when the same group of subjectswas watching video clips randomly selected from three semantic cat-egories of sports, weather report, and commercial advertisement inthe TRECVID dataset. After that, we applied and compared four statis-tical algorithms including GES (Meek, 1997), PC (Spirtes andGlymour, 1991), IMaGES (Ramsey et al., 2010) and GCA (Granger,1969) to estimate the consistent functional interaction patterns inthe localized functional brain regions based on the N-fMRI signals.Moreover, diffusion tensor imaging (DTI) dataset was also acquiredand structural connectivities were inferred to independently assessthe structural underpinnings of those consistent functional interac-tion patterns identified via N-fMRI data.
Data acquisition and preprocessing
Four healthy young adults were recruited at The University ofGeorgia (UGA) under IRB approval to participate in this study. MRIdatasets were acquired in a GE 3T Signa HDx MRI system (GE Health-care, Milwaukee, WI) using an 8-channel head coil at the UGA Bioi-maging Research Center (BIRC). The multimodal DTI, T-fMRI and N-fMRI scans were performed in three separate scan sessions for eachparticipating subject. DTI data was acquired using the isotropic spatial
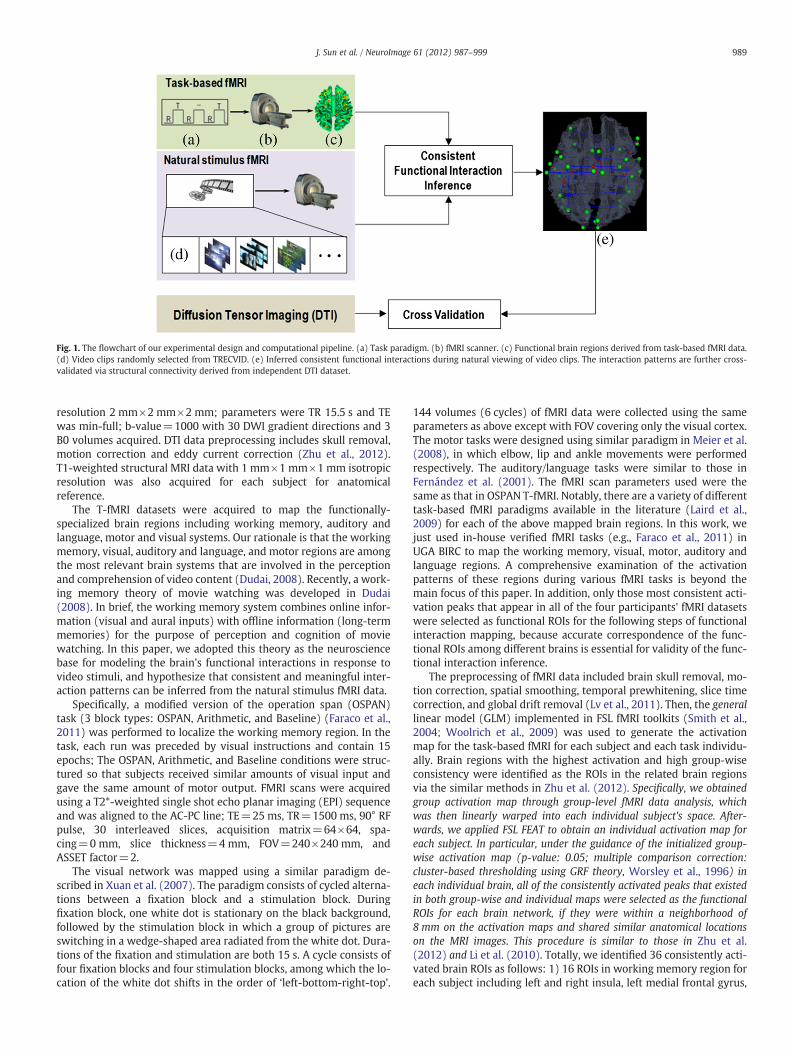
Fig. 1. The flowchart of our experimental design and computational pipeline. (a) Task paradigm. (b) fMRI scanner. (c) Functional brain regions derived from task-based fMRI data.(d) Video clips randomly selected from TRECVID. (e) Inferred consistent functional interactions during natural viewing of video clips. The interaction patterns are further cross-validated via structural connectivity derived from independent DTI dataset.
989J. Sun et al. / NeuroImage 61 (2012) 987–999
resolution 2 mm×2 mm×2 mm; parameters were TR 15.5 s and TEwas min-full; b-value=1000 with 30 DWI gradient directions and 3B0 volumes acquired. DTI data preprocessing includes skull removal,motion correction and eddy current correction (Zhu et al., 2012).T1-weighted structural MRI data with 1 mm×1 mm×1 mm isotropicresolution was also acquired for each subject for anatomicalreference.
The T-fMRI datasets were acquired to map the functionally-specialized brain regions including working memory, auditory andlanguage, motor and visual systems. Our rationale is that the workingmemory, visual, auditory and language, and motor regions are amongthe most relevant brain systems that are involved in the perceptionand comprehension of video content (Dudai, 2008). Recently, a work-ing memory theory of movie watching was developed in Dudai(2008). In brief, the working memory system combines online infor-mation (visual and aural inputs) with offline information (long-termmemories) for the purpose of perception and cognition of moviewatching. In this paper, we adopted this theory as the neurosciencebase for modeling the brain's functional interactions in response tovideo stimuli, and hypothesize that consistent and meaningful inter-action patterns can be inferred from the natural stimulus fMRI data.
Specifically, a modified version of the operation span (OSPAN)task (3 block types: OSPAN, Arithmetic, and Baseline) (Faraco et al.,2011) was performed to localize the working memory region. In thetask, each run was preceded by visual instructions and contain 15epochs; The OSPAN, Arithmetic, and Baseline conditions were struc-tured so that subjects received similar amounts of visual input andgave the same amount of motor output. FMRI scans were acquiredusing a T2*-weighted single shot echo planar imaging (EPI) sequenceand was aligned to the AC-PC line; TE=25 ms, TR=1500 ms, 90° RFpulse, 30 interleaved slices, acquisition matrix=64×64, spa-cing=0 mm, slice thickness=4 mm, FOV=240×240 mm, andASSET factor=2.
The visual network was mapped using a similar paradigm de-scribed in Xuan et al. (2007). The paradigm consists of cycled alterna-tions between a fixation block and a stimulation block. Duringfixation block, one white dot is stationary on the black background,followed by the stimulation block in which a group of pictures areswitching in a wedge-shaped area radiated from the white dot. Dura-tions of the fixation and stimulation are both 15 s. A cycle consists offour fixation blocks and four stimulation blocks, among which the lo-cation of the white dot shifts in the order of ‘left-bottom-right-top’.
144 volumes (6 cycles) of fMRI data were collected using the sameparameters as above except with FOV covering only the visual cortex.The motor tasks were designed using similar paradigm in Meier et al.(2008), in which elbow, lip and ankle movements were performedrespectively. The auditory/language tasks were similar to those inFernández et al. (2001). The fMRI scan parameters used were thesame as that in OSPAN T-fMRI. Notably, there are a variety of differenttask-based fMRI paradigms available in the literature (Laird et al.,2009) for each of the above mapped brain regions. In this work, wejust used in-house verified fMRI tasks (e.g., Faraco et al., 2011) inUGA BIRC to map the working memory, visual, motor, auditory andlanguage regions. A comprehensive examination of the activationpatterns of these regions during various fMRI tasks is beyond themain focus of this paper. In addition, only those most consistent acti-vation peaks that appear in all of the four participants' fMRI datasetswere selected as functional ROIs for the following steps of functionalinteraction mapping, because accurate correspondence of the func-tional ROIs among different brains is essential for validity of the func-tional interaction inference.
The preprocessing of fMRI data included brain skull removal, mo-tion correction, spatial smoothing, temporal prewhitening, slice timecorrection, and global drift removal (Lv et al., 2011). Then, the generallinear model (GLM) implemented in FSL fMRI toolkits (Smith et al.,2004; Woolrich et al., 2009) was used to generate the activationmap for the task-based fMRI for each subject and each task individu-ally. Brain regions with the highest activation and high group-wiseconsistency were identified as the ROIs in the related brain regionsvia the similar methods in Zhu et al. (2012). Specifically, we obtainedgroup activation map through group-level fMRI data analysis, whichwas then linearly warped into each individual subject's space. After-wards, we applied FSL FEAT to obtain an individual activation map foreach subject. In particular, under the guidance of the initialized group-wise activation map (p-value: 0.05; multiple comparison correction:cluster-based thresholding using GRF theory, Worsley et al., 1996) ineach individual brain, all of the consistently activated peaks that existedin both group-wise and individual maps were selected as the functionalROIs for each brain network, if they were within a neighborhood of8 mm on the activation maps and shared similar anatomical locationson the MRI images. This procedure is similar to those in Zhu et al.(2012) and Li et al. (2010). Totally, we identified 36 consistently acti-vated brain ROIs as follows: 1) 16 ROIs in working memory region foreach subject including left and right insula, left medial frontal gyrus,

Table 1The list of nodes in the identified functional brain regions.
Working memory Auditory and language
1 Left insula 1 Left Heschl's gyrus2 Right insula 2 Right Heschl's gyrus3 Left medial frontal gyrus 3 Left Wernicke's area4 Left precentral gyrus 4 Right Wernicke's area5 Right precentral gyrus 5 Left Broca's area6 Left paracingulate gyrus 6 Right Broca's area7 Right paracingulate gyrus8 Left superior frontal gyrus Visual9 Right superior frontal gyrus 1 Left primary visual cortex10 Left supramarginal gyrus 2 Right primary visual cortex11 Right supramarginal gyrus 3 Left secondary visual cortex12 Left occipital pole 4 Right secondary visual cortex13 Right frontal pole 5 Left middle temporal14 Right lateral occipital gyrus 6 Right middle temporal15 Left precuneus 7 Left medial superior temporal cortex16 Right precuneus 8 Right medial superior temporal cortexMotor1 Left primary motor cortex 4 Right primary motor cortex2 Left supplementary motor area 5 Right supplementary motor area3 Left premotor cortex 6 Right premotor cortex
990 J. Sun et al. / NeuroImage 61 (2012) 987–999
left and right precentral gyrus, left and right paracingulate gyrus, leftand right superior frontal gyrus, left and right supramarginal gyrus,left occipital pole, right frontal pole, right lateral occipital gyrus, leftand right precuneus; 2) 6 ROIs in auditory/language region includedHeschl's gyrus, Wernicke's area and Broca's area on both brain hemi-spheres; 3) 6 ROIs in motor regions that are activated in response toelbow, lip and ankle movements; 4) 8 ROIs in the visual region in-cluded the primary visual cortex (V1), the secondary visual cortex(V2), the middle temporal cortex (MT) and the middle superior tem-poral cortex (MST) on both brain hemispheres. Fig. 2 gives an illustra-tion of the identified brain ROIs and regions for a subject. The namesof these 36 ROIs are listed in Table 1.
To perform natural stimulus fMRI, we randomly selected 51shots that are in the semantic categories of sports, weather reportand commercial advertisement (20 sports, 19 weather reports and12 commercial advertisements, respectively) from the TRECVID da-tabase and composed them into 8 clips. Each clip is about 11 minlong. Fig. 3 shows screenshot examples of those video clips ineach category. These clips were presented to the four subjects dur-ing N-fMRI scan via MRI-compatible goggles. Around 480 brainfMRI volumes were collected in each natural stimulus fMRI session,and the scan parameters were as follows: 30 axial slices, matrixsize 64×64, 4 mm slice thickness, 220 mm FOV, TR=1.5 s,TE=25 ms, ASSET=2. The strict synchronization between movieviewing and fMRI scan was achieved via the E-prime software(Schneider et al., 2002).
Statistical methods for functional interaction inference
In general, we use graph nodes to represent brain ROIs and inferthe functional interactions among graph nodes based on the N-fMRIBOLD signals extracted for these ROIs. In the literature, directedgraphs are commonly adopted to represent functional connectivity,among brain regions (Friston et al., 2003). Here, directed graphs are
Fig. 2. Illustration of the identified brain ROIs and regions via task-based fMRI. It isnoted that the cortical surface used in this rendering was the white matter/gray matterboundary. Thus some of the ROIs in this figure are slightly outside the cortical surface.
used to model functional interactions. This methodology provides candi-date models that, under certain additional assumptions, imply functionalinteraction relationships. The assumptions (Neapolitan, 2004) includedirected acyclic graph and the Markov condition. Specifically, eachgraph is comprised of a set of nodes (each represents a ROI here)and a set of edges. If there exists a directed edge going from node ito node j, Ni→Nj, then the Nj is called the child of Ni and thus Ni isthe parent of Nj. For a sequence of nodes (N1,N2,…,Nk), if there existsa directed edge between Ni and Ni+1, for each i=1,2,…,k−1, thenthe sequence of nodes is called a path. Here, k represents the totalnumber of ROIs we used in the computation, and thus each node rep-resents one ROI in the following paragraphs.
Specifically, we used three different search algorithms, GES(Meek, 1997) and PC, which are two methods for searching Bayes-ian network structure, and an extended version of GES (IMaGES)(Ramsey et al., 2010) for the following functional interaction infer-ence. Intuitively, Bayesian network posits a joint probability distri-bution on nodes of a directed graph so that it could representprobabilistic relations among those nodes. The directed graphs inBayesian networks methods we used here are confined to acyclicgraphs, i.e., directed acyclic graph (DAG), which could satisfy the causalcondition (Glymour, 2003; Spirtes et al., 2000), and thus Markov
Fig. 3. Illustration of selected video clips from TRECVID 2005. 8 clips composed of 51video shots were used as the natural stimuli.
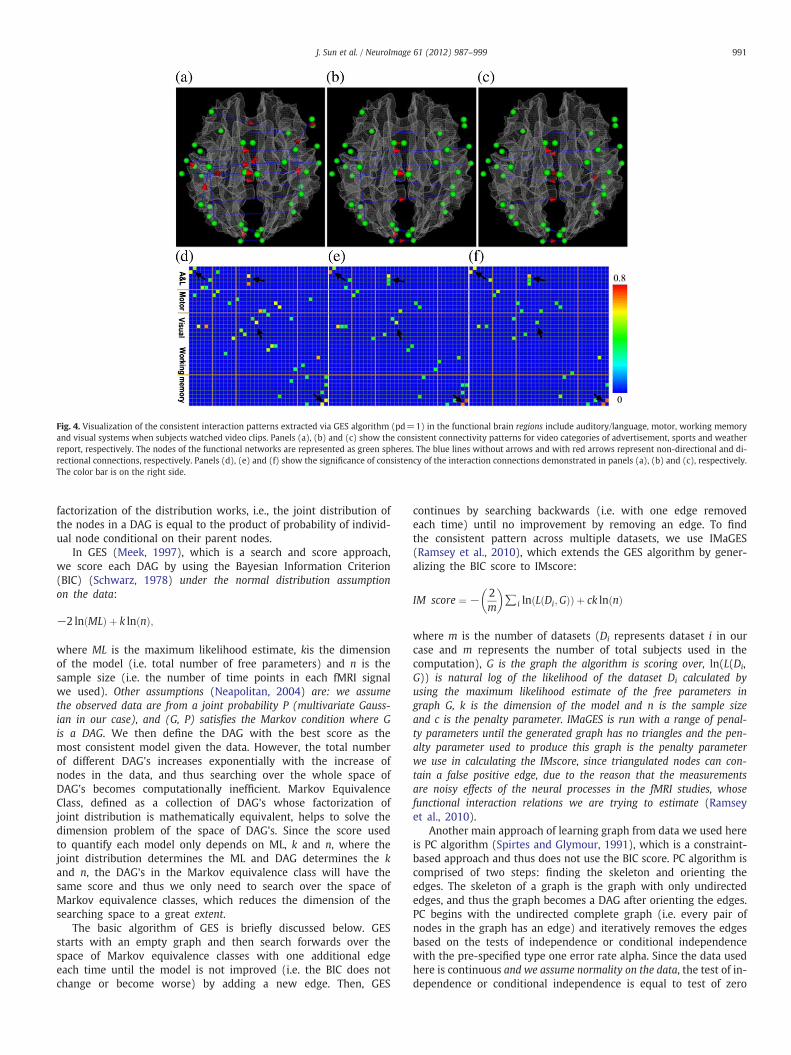
Fig. 4. Visualization of the consistent interaction patterns extracted via GES algorithm (pd=1) in the functional brain regions include auditory/language, motor, working memoryand visual systems when subjects watched video clips. Panels (a), (b) and (c) show the consistent connectivity patterns for video categories of advertisement, sports and weatherreport, respectively. The nodes of the functional networks are represented as green spheres. The blue lines without arrows and with red arrows represent non-directional and di-rectional connections, respectively. Panels (d), (e) and (f) show the significance of consistency of the interaction connections demonstrated in panels (a), (b) and (c), respectively.The color bar is on the right side.
991J. Sun et al. / NeuroImage 61 (2012) 987–999
factorization of the distribution works, i.e., the joint distribution ofthe nodes in a DAG is equal to the product of probability of individ-ual node conditional on their parent nodes.
In GES (Meek, 1997), which is a search and score approach,we score each DAG by using the Bayesian Information Criterion(BIC) (Schwarz, 1978) under the normal distribution assumptionon the data:
−2 ln MLð Þ þ k ln nð Þ;
where ML is the maximum likelihood estimate, kis the dimensionof the model (i.e. total number of free parameters) and n is thesample size (i.e. the number of time points in each fMRI signalwe used). Other assumptions (Neapolitan, 2004) are: we assumethe observed data are from a joint probability P (multivariate Gauss-ian in our case), and (G, P) satisfies the Markov condition where Gis a DAG. We then define the DAG with the best score as themost consistent model given the data. However, the total numberof different DAG's increases exponentially with the increase ofnodes in the data, and thus searching over the whole space ofDAG's becomes computationally inefficient. Markov EquivalenceClass, defined as a collection of DAG's whose factorization ofjoint distribution is mathematically equivalent, helps to solve thedimension problem of the space of DAG's. Since the score usedto quantify each model only depends on ML, k and n, where thejoint distribution determines the ML and DAG determines the kand n, the DAG's in the Markov equivalence class will have thesame score and thus we only need to search over the space ofMarkov equivalence classes, which reduces the dimension of thesearching space to a great extent.
The basic algorithm of GES is briefly discussed below. GESstarts with an empty graph and then search forwards over thespace of Markov equivalence classes with one additional edgeeach time until the model is not improved (i.e. the BIC does notchange or become worse) by adding a new edge. Then, GES
continues by searching backwards (i.e. with one edge removedeach time) until no improvement by removing an edge. To findthe consistent pattern across multiple datasets, we use IMaGES(Ramsey et al., 2010), which extends the GES algorithm by gener-alizing the BIC score to IMscore:
IM score ¼ − 2m
� �∑i ln L Di;Gð Þð Þ þ ck ln nð Þ
where m is the number of datasets (Di represents dataset i in ourcase and m represents the number of total subjects used in thecomputation), G is the graph the algorithm is scoring over, ln(L(Di,G)) is natural log of the likelihood of the dataset Di calculated byusing the maximum likelihood estimate of the free parameters ingraph G, k is the dimension of the model and n is the sample sizeand c is the penalty parameter. IMaGES is run with a range of penal-ty parameters until the generated graph has no triangles and the pen-alty parameter used to produce this graph is the penalty parameterwe use in calculating the IMscore, since triangulated nodes can con-tain a false positive edge, due to the reason that the measurementsare noisy effects of the neural processes in the fMRI studies, whosefunctional interaction relations we are trying to estimate (Ramseyet al., 2010).
Another main approach of learning graph from data we used hereis PC algorithm (Spirtes and Glymour, 1991), which is a constraint-based approach and thus does not use the BIC score. PC algorithm iscomprised of two steps: finding the skeleton and orienting theedges. The skeleton of a graph is the graph with only undirectededges, and thus the graph becomes a DAG after orienting the edges.PC begins with the undirected complete graph (i.e. every pair ofnodes in the graph has an edge) and iteratively removes the edgesbased on the tests of independence or conditional independencewith the pre-specified type one error rate alpha. Since the data usedhere is continuous and we assume normality on the data, the test of in-dependence or conditional independence is equal to test of zero

992 J. Sun et al. / NeuroImage 61 (2012) 987–999
correlation or zero partial correlation respectively. Remove the edgebetween node N1 and node N2, if the tests of conditional indepen-dence of N1 and N2 conditional on all subsets of V with cardinality ofn fail to reject the null hypothesis until the cardinality of V is lessthan n, where n is increased by 1 each time unless the cardinality ofV is less than n or one test rejects the null hypothesis, and V is theset of nodes that satisfy two conditions (1. There exists an edge be-tween the node and N1 or N2; 2. The node is on the path betweenN1 and N2). After finding the skeleton of the graph, orientation ofthe undirected edges in the graph will be conducted. For each tripleof nodes (N1, N2, N3) with N1 adjacent to N2 (i.e. there exists anedge between N1 and N2) and N2 adjacent to N3 but no edge existingbetween N2 and N3, the edge in N1–N2–N3 should be orientated asN1→N2←N3, if and only if N1 and N3 are dependent on all subsetscontaining N2 of V (V is obtained in the same way as above, exceptit is based on the skeleton obtained in the first step).
For comparison purpose, we applied Granger causality analysis(GCA) on the same dataset to infer the causalities among brainROIs. Proposed by Clive Granger in 1969 (Granger, 1969), GCA in-vestigates the causality from time series X to time series Y (in thisstudy, the fMRI data from each pair of ROIs), and has been appliedin brain imaging field in recent years (e.g., Roebroeck et al., 2005).Briefly, GCA first performs auto-regression of X with its P-orderlagged values:
Xt ¼Xpi¼1
aiXt−i þ e1t
to obtain the prediction errors e1, which is a P×1 vector. Then itadds the lagged values of time series Y into the regression to getprediction errors e2, which is also a P×1 vector:
Xt ¼Xpi¼1
aiXt−i þXpi¼1
biYt−i þ e2t
As the new regression term Y has been added, the change of pre-diction error from e1 to e2 could indicate the Granger-causal influ-ence from Y to X, and an F-statistics is constructed accordingly:
FY→X ¼ var e1ð Þ− var e2ð Þvar e2ð Þ
When there is no causality caused by Y to X, the value of F will ap-proach zero since the additional Y terms will not influence the expla-nation power. While if the value is greater than the given threshold,we will reject the null hypothesis and add that Granger-causal edgeto the result DAG. The Granger causality from X to Y could beobtained similarly. By repeating the pairwise analysis for all theROIs, we could obtain the final DAG representing the Granger-causalconnectivity of the whole brain.
In this paper, we used the TETRAD software (http://www.phil.cmu.edu/projects/tetrad/) to apply the GES, IMaGES and PC algorithms.Also, it is worth noting that there are undirected edges in the outputgraphs generated by GES, IMaGES and PC, which do not exist in theGCA model. The undirected edge (N1−N2) is the hypothesis that N1
causes N2 (N1→N2) or N2 causes N1 (N1←N2), but the algorithms can-not determine which is better.
Results
Based on the datasets in Data acquisition and preprocessing sec-tion and statistical methods in Statistical methods for functionalinteraction inference section, we performed four experiments todemonstrate that consistent and meaningful functional interactionpatterns can be inferred from natural stimulus fMRI data undermovie watching. In the PC algorithm, we used the type one error 0.01as the threshold. In the GES algorithm, we use the penalty parameter
c=1. These are the meanings of PC=0.01 and GES=1 labels in the fol-lowing sections.
Consistent functional interaction patterns for three video categories
The identified functional connectivity patterns using the GES algo-rithm are shown in Fig. 4. In each scanned TRECVID video category,we estimated the functional interactions for all of the video clips for4 subjects. In total, we performed 80, 76 and 48 estimations forsport, weather report and commercial advertisement, respectively.The number of the occurrence of a given interaction connection wascounted for each video category separately. In each video category,the consistency of an interaction connection between any possibleROI pair was measured as the ratio between the number of occur-rence and the total number of estimations in this video category.Fig. 4 shows the interaction connections with consistency above0.35. In Figs. 4(a), (b) and (c) show the consistent interaction pat-terns for video categories of advertisement, sports and weather re-port, respectively. The nodes in the functional brain regions arerepresented by green spheres. The blue lines without arrows andwith red arrows represent non-directional and directional interactionconnections, respectively. In Figs. 4(d), (e) and (f) show the consis-tency (measured by the percentage of occurrences of a specific edgeover all scanned video shots among all of the 4 subjects) of the interac-tions demonstrated in Figs. 4(a), (b) and (c), respectively.
It is interesting that for each video category, the GES method canidentify reasonably consistent and meaningful interaction patterns.For instance, the workingmemory region has more functional interac-tions in the advertisement video category, meaning that video contentin this category might need more online information processing dur-ing the video watching. This result is consistent with the working mem-ory theory of movie watching proposed in Dudai (2008), that is, theworking memory system is responsible for online information processingfor the perception and cognition of movie watching. Examination of thevideos of three categories (see supplemental example video at:http://www.cs.uga.edu/~tliu/TRECVID/positive_commercial_7.mpg)suggests that advertisement videos indeed have more complex con-tent, more rapidly changing shots, and thus demand more online in-formation processing. In contrast, the weather report videos (seesupplemental example video at: http://www.cs.uga.edu/~tliu/TRECVID/positive_weather_5.mpg) contain simpler content, haveless motion and video shot changes, and therefore demand less onlineinformation processing. Hence, the results in Figs. 4a–f are reasonableconsidering that working memory system is the brain hub for onlineinformation processing that interacts with online visual and auditoryinformation processing (Dudai, 2008). Also, it is reasonable to observethat functional interactions with the visual regions are stronger in adver-tisement and sports (see supplemental example video at: http://www.cs.uga.edu/~tliu/TRECVID/positive_sport_9.mpg) videos than those inweather report videos, as the weather report video contains much lessmotion. Finally, quite a few interaction items are consistent and repro-ducible in multiple categories of videos, such as those highlighted bycorresponding black arrows in Figs. 4d–f, and their consistencies arequite high (e.g., in orange or yellow colors). This result suggests thatthese common interaction patterns might be fundamental for onlineprocessing and comprehension of three different types of video mes-sages. We performed additional statistical analysis of the GES outputs.Specifically, we calculated the within-video variation and between-video variation. The ratio of within-video variation over between-videovariation is approximately 13.5 and this ratio is quite consistent acrossvideo categories.
Similarly, the identified consistent functional interaction patternsusing PC algorithm is shown in Fig. 5. The definition of consistencyof the identified functional interaction patterns is the same as thatin Fig. 4. Also, only those interaction connections with consistencyabove 0.35 are shown in Fig. 5. It is interesting that most of consistent
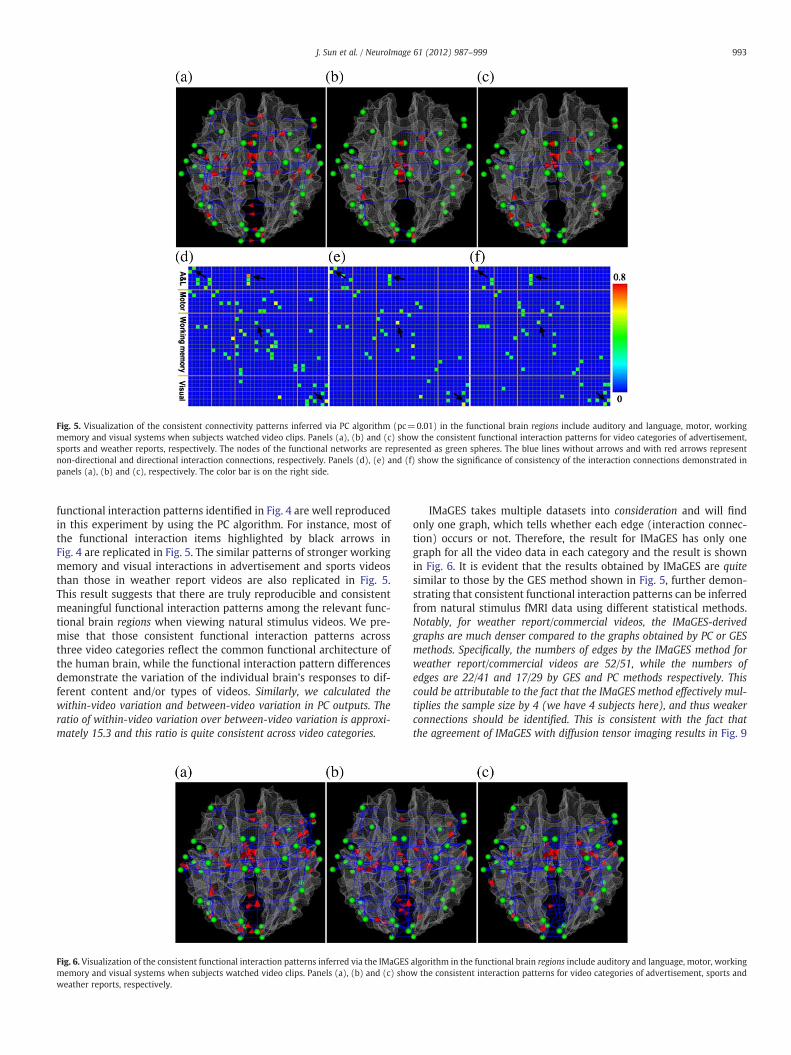
Fig. 5. Visualization of the consistent connectivity patterns inferred via PC algorithm (pc=0.01) in the functional brain regions include auditory and language, motor, workingmemory and visual systems when subjects watched video clips. Panels (a), (b) and (c) show the consistent functional interaction patterns for video categories of advertisement,sports and weather reports, respectively. The nodes of the functional networks are represented as green spheres. The blue lines without arrows and with red arrows representnon-directional and directional interaction connections, respectively. Panels (d), (e) and (f) show the significance of consistency of the interaction connections demonstrated inpanels (a), (b) and (c), respectively. The color bar is on the right side.
993J. Sun et al. / NeuroImage 61 (2012) 987–999
functional interaction patterns identified in Fig. 4 are well reproducedin this experiment by using the PC algorithm. For instance, most ofthe functional interaction items highlighted by black arrows inFig. 4 are replicated in Fig. 5. The similar patterns of stronger workingmemory and visual interactions in advertisement and sports videosthan those in weather report videos are also replicated in Fig. 5.This result suggests that there are truly reproducible and consistentmeaningful functional interaction patterns among the relevant func-tional brain regions when viewing natural stimulus videos. We pre-mise that those consistent functional interaction patterns acrossthree video categories reflect the common functional architecture ofthe human brain, while the functional interaction pattern differencesdemonstrate the variation of the individual brain's responses to dif-ferent content and/or types of videos. Similarly, we calculated thewithin-video variation and between-video variation in PC outputs. Theratio of within-video variation over between-video variation is approxi-mately 15.3 and this ratio is quite consistent across video categories.
Fig. 6. Visualization of the consistent functional interaction patterns inferred via the IMaGESmemory and visual systems when subjects watched video clips. Panels (a), (b) and (c) showeather reports, respectively.
IMaGES takes multiple datasets into consideration and will findonly one graph, which tells whether each edge (interaction connec-tion) occurs or not. Therefore, the result for IMaGES has only onegraph for all the video data in each category and the result is shownin Fig. 6. It is evident that the results obtained by IMaGES are quitesimilar to those by the GES method shown in Fig. 5, further demon-strating that consistent functional interaction patterns can be inferredfrom natural stimulus fMRI data using different statistical methods.Notably, for weather report/commercial videos, the IMaGES-derivedgraphs are much denser compared to the graphs obtained by PC or GESmethods. Specifically, the numbers of edges by the IMaGES method forweather report/commercial videos are 52/51, while the numbers ofedges are 22/41 and 17/29 by GES and PC methods respectively. Thiscould be attributable to the fact that the IMaGES method effectively mul-tiplies the sample size by 4 (we have 4 subjects here), and thus weakerconnections should be identified. This is consistent with the fact thatthe agreement of IMaGES with diffusion tensor imaging results in Fig. 9
algorithm in the functional brain regions include auditory and language, motor, workingw the consistent interaction patterns for video categories of advertisement, sports and

Fig. 7. Visualization of the consistent interaction patterns inferred via GCA in the functional brain networks include auditory/language, motor, working memory and visual systemswhen subjects watched video clips. Panels (a), (b) and (c) show the consistent interaction patterns for video categories of advertisement, sports and weather report, respectively.Panels (d), (e) and (f) show the significance of consistency of the interaction connections demonstrated in panels (a), (b) and (c), respectively. Specifically, we first used a thresholdto remove those inconsistent edges (p-value>0.01). That is, the blue cells in panels d–f represent inconsistent edges. Then, we visualized the frequency of occurrence in the panels d–f forthose consistent edges. The color of frequency of edge occurrence is color-coded by the color bar on the right.
994 J. Sun et al. / NeuroImage 61 (2012) 987–999
is much better at the lower threshold (50) for structural connections.Also, the similar functional interaction patterns for three categoriesof videos revealed in Figs. 4–5 are replicated here via the IMaGESalgorithm.
Comparison with GCA
To compare the GES, PC and IMaGES algorithms with GCA, Fig. 7shows the consistent functional interaction patterns obtained byGCA for three video categories respectively. It is apparent that theresults inferred by GCA are quite different compared to those byGES, PC and IMaGES algorithms. Actually, the results by GES andPC algorithms are much more consistent within and across videocategories, and Fig. 8 provides quantitative comparisons of the sig-nificance of functional interaction consistence among GCA, GES andPC algorithms. It is evident that the GES and PC algorithms providemore consistent results than the GCA method, in particular for thesports and weather report video categories. Specifically, for eachvideo category in each subject, we conducted GCA, GES and PC re-spectively. Then, for each algorithm and each video category, wesummarized the proportion of all the interaction connections thatappear in each subject over all the subjects, and selected the inter-action connections whose proportion is higher than 35%, which isthe same as those used in Figs. 4–5. As we can see from the histo-grams (particularly Figs. 8b and c), GES and PC algorithms producemore consistent interaction connections than that of GCA, e.g.,most of the histogram bins with higher consistency have green(GES) and blue (PC) bars. It is noted that for the commercialvideo category, all of GES, PC and GCA produced many more inter-action connections (Fig. 8a), and the GCA method produced evenmore connections than GES and PC methods. Our interpretation isthat there are more rapidly changing shots in the commercialvideos, and the GES and PC methods tend to be more conservativein inferring the interaction patterns as they consider all the ROIsfor inference simultaneously. Since the GCA method only considers
a pair of two ROIs and does not consider the whole network, thismethod tends to have more false positives. Another possibility isthat the length of fMRI scan data for the commercial video catego-ry is 64% larger than the other two video categories on average,and the multiple testing problem in the identification of significantcausality in GCA could produce more false positives from the com-mercial video category. The above interpretations will be furtherverified by independent, external evaluation via DTI data inStructural connectivity between functionally interacting brainregions section.
In addition to the above pairwise GCA analyses between functionalROIs, in this paper, we also applied the conditional Granger Causal-ity Analysis among those ROIs in our datasets, to examine possiblemultivariate relationships. We used the toolbox implemented bySeth in MATLAB (Seth, 2010) to perform the conditional GCA anal-ysis. Our results showed that very few consistent edges could bedetected by conditional GCA. For instance, 4 subjects watched atotal of 30 weather video shots, and only one specific connectionwas detected by the conditional Granger Causality Analysis 1time for all the 30 video shots.
Also, the functional interaction patterns inferred by GES, PC andIMaGES algorithms have better structural connectivity support,which will be shown in Fig. 9. Based on the above results, we hypoth-esize that GES, PC and IMaGES algorithms outperform GCA in the ap-plication of inferring consistent functional interaction patterns duringnatural stimulus fMRI of video watching. From computational per-spective, our interpretations are as follows. GCA makes the inferenceof causality based on the temporal lags between time series fMRI data,which possibly makes its inference less accurate due to the relativelylow temporal resolution of fMRI, the influence of the intervention of tem-poral hemodynamics on the fMRI signals (Roebroeck et al., 2005), andthe complex temporal dynamics of effective connectivity between fMRIsignals (Li et al., 2011). In comparison, Bayesian network methods do

995J. Sun et al. / NeuroImage 61 (2012) 987–999
not rely on the precise temporal lag information and thus tend to bemore robust.
Structural connectivity between functionally interacting brain regions
It is believed that the functional role of the cortical region of thehuman brain has its structural underpinnings (Passingham et al.,2002). In this paper, we measured the structural connectivity derivedfrom DTI data to evaluate the structural substrate of consistent func-tional interactions identified from natural stimulus fMRI data by theproposed methods. Specifically, the stochastic DTI tractography algo-rithm (Behrens et al., 2003) implemented in FSL (Smith et al., 2004;Woolrich et al., 2009) was adopted to derive the structural connectiv-ity from the DTI data for each subject individually. By specifying aseed ROI and a terminate ROI, the stochastic fiber tracking resultedin a volume image, in which the intensity of the voxel indicates theprobability of the fibers penetrating the corresponding voxel.Fig. 9(a) shows an exemplar joint visualization of the cortical surfaceand the volume rendering of the resulted probability map. The aboveprocedure was repeated for all possible ROI pairs in the identifiedthirty-six brain regions via task-based fMRI in Data acquisition andpreprocessing section. Denote the probability volume for ROI pair Riand Rj as Iij and the structural connectivity matrix of the identifiedfunctional brain region as C. After applying a predefined threshold Ton Iij, the existence of structural connection between Ri and Rj was de-termined by a connectedness analysis described in (Shapiro, 1992).That is, C(i, j)=1 when they were connected, otherwise C(i, j)=0.We varied T from 0.01 to 1 with the step length of 0.01, resulted in100 times of voting for each element in C. The element with highernumber of votes indicates the stronger direct structural connectionbetween the corresponding ROI pair.
The measured structural connectivity derived from DTI datausing the above-mentioned stochastic fiber tracking is shown inFig. 9b for a randomly selected subject. A threshold is applied onthe structural connectivity matrix to remove the non-significant el-ements. The consistency between the structural connections andthe inferred functional interactions is measured by the ratio of thefunctional connections with direct structural connection against allthe identified consistent functional interactions. The ratios for GCA,PC, GES and IMaGES methods are summarized in Figs. 9c–d, inwhich (c) and (d) correspond to different structural connectivitythresholds of 50 and 70, respectively. It can be seen that the numberof identified consistent functional interactions associated with struc-tural connections is much higher in PC, GES and IMaGES comparedwith that in GCA. This result suggests that the functional interac-tions inferred by PC, GES and IMaGES can achieve more structuralconnectivity support from independent DTI data. Considering thatstructural connection is closely correlated with functional connectivity(Honey et al., 2009), our results here indicate the superiority of theproposed Bayesian methods for functional interaction inference in nat-ural stimulus fMRI. This experiment of validation using structuralconnectivity was repeated for other 3 subjects and similar resultswere obtained.
Consistency of inferred functional interaction patterns across three videocategories
To showcase the consistency of the inferred functional interac-tion patterns across different videos and different subjects, we ex-
Fig. 8. Quantitative comparison of GES, PC, and GCA methods. (a)–(c): histograms osignificances of consistency of the interaction connections obtained by three methodof GES (green bars), PC (blue bars) and GCA (pink bars) for three video categories, respectively. It is noted that the three histograms have different scales on the y-axis.
fs-
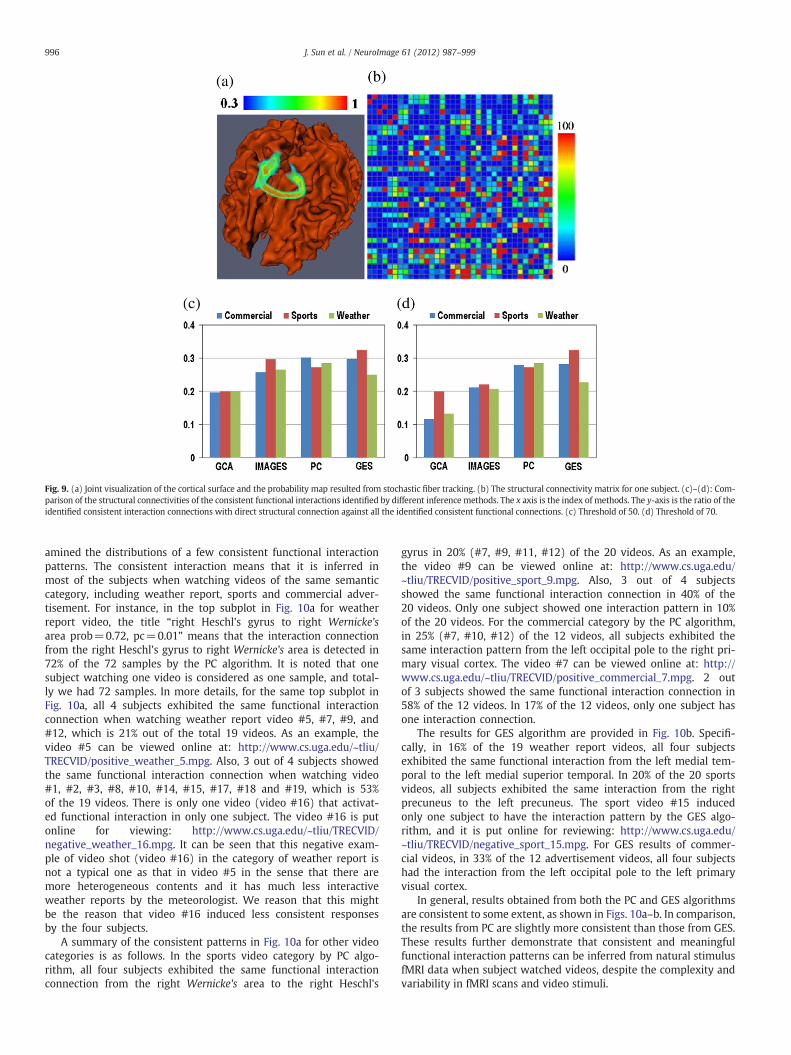
Fig. 9. (a) Joint visualization of the cortical surface and the probability map resulted from stochastic fiber tracking. (b) The structural connectivity matrix for one subject. (c)–(d): Com-parison of the structural connectivities of the consistent functional interactions identified by different inference methods. The x axis is the index of methods. The y-axis is the ratio of theidentified consistent interaction connections with direct structural connection against all the identified consistent functional connections. (c) Threshold of 50. (d) Threshold of 70.
996 J. Sun et al. / NeuroImage 61 (2012) 987–999
amined the distributions of a few consistent functional interactionpatterns. The consistent interaction means that it is inferred inmost of the subjects when watching videos of the same semanticcategory, including weather report, sports and commercial adver-tisement. For instance, in the top subplot in Fig. 10a for weatherreport video, the title “right Heschl's gyrus to right Wernicke'sarea prob=0.72, pc=0.01” means that the interaction connectionfrom the right Heschl's gyrus to right Wernicke's area is detected in72% of the 72 samples by the PC algorithm. It is noted that onesubject watching one video is considered as one sample, and total-ly we had 72 samples. In more details, for the same top subplot inFig. 10a, all 4 subjects exhibited the same functional interactionconnection when watching weather report video #5, #7, #9, and#12, which is 21% out of the total 19 videos. As an example, thevideo #5 can be viewed online at: http://www.cs.uga.edu/~tliu/TRECVID/positive_weather_5.mpg. Also, 3 out of 4 subjects showedthe same functional interaction connection when watching video#1, #2, #3, #8, #10, #14, #15, #17, #18 and #19, which is 53%of the 19 videos. There is only one video (video #16) that activat-ed functional interaction in only one subject. The video #16 is putonline for viewing: http://www.cs.uga.edu/~tliu/TRECVID/negative_weather_16.mpg. It can be seen that this negative exam-ple of video shot (video #16) in the category of weather report isnot a typical one as that in video #5 in the sense that there aremore heterogeneous contents and it has much less interactiveweather reports by the meteorologist. We reason that this mightbe the reason that video #16 induced less consistent responsesby the four subjects.
A summary of the consistent patterns in Fig. 10a for other videocategories is as follows. In the sports video category by PC algo-rithm, all four subjects exhibited the same functional interactionconnection from the right Wernicke's area to the right Heschl's
gyrus in 20% (#7, #9, #11, #12) of the 20 videos. As an example,the video #9 can be viewed online at: http://www.cs.uga.edu/~tliu/TRECVID/positive_sport_9.mpg. Also, 3 out of 4 subjectsshowed the same functional interaction connection in 40% of the20 videos. Only one subject showed one interaction pattern in 10%of the 20 videos. For the commercial category by the PC algorithm,in 25% (#7, #10, #12) of the 12 videos, all subjects exhibited thesame interaction pattern from the left occipital pole to the right pri-mary visual cortex. The video #7 can be viewed online at: http://www.cs.uga.edu/~tliu/TRECVID/positive_commercial_7.mpg. 2 outof 3 subjects showed the same functional interaction connection in58% of the 12 videos. In 17% of the 12 videos, only one subject hasone interaction connection.
The results for GES algorithm are provided in Fig. 10b. Specifi-cally, in 16% of the 19 weather report videos, all four subjectsexhibited the same functional interaction from the left medial tem-poral to the left medial superior temporal. In 20% of the 20 sportsvideos, all subjects exhibited the same interaction from the rightprecuneus to the left precuneus. The sport video #15 inducedonly one subject to have the interaction pattern by the GES algo-rithm, and it is put online for reviewing: http://www.cs.uga.edu/~tliu/TRECVID/negative_sport_15.mpg. For GES results of commer-cial videos, in 33% of the 12 advertisement videos, all four subjectshad the interaction from the left occipital pole to the left primaryvisual cortex.
In general, results obtained from both the PC and GES algorithmsare consistent to some extent, as shown in Figs. 10a–b. In comparison,the results from PC are slightly more consistent than those from GES.These results further demonstrate that consistent and meaningfulfunctional interaction patterns can be inferred from natural stimulusfMRI data when subject watched videos, despite the complexity andvariability in fMRI scans and video stimuli.

Fig. 10. The distributions of the most consistent interaction connections in each video category from the results of both PC (a) and GES (b) algorithms. For each subplot, the hor-izontal axis represents the index of video shots for each semantic category. The name of video category is at the bottom of each subplot, The ROIs' names for the interaction pair,probability of the occurrence of the interaction patter, and threshold used are at the top of the subplot. The black arrows represent the interaction directionality. Four subjects arerepresented by the colors of red, blue, green and orange, respectively. The horizontal axis stands for binary decision of existence (1) or non-existence (0). It is noted that for thevideo category of commercial advertisement, we only have datasets from three subjects. The label pc=0.01 means that the PC algorithm is run under the type one error 0.01 andthe label GES=1 means that we used the penalty parameter c=1.
997J. Sun et al. / NeuroImage 61 (2012) 987–999
Discussion and conclusion
Inferring meaningful information from natural stimulus fMRI datahas been a challenging problem due to the complexity and variabilityduring fMRI designs and scans and in natural video stimuli. In thiswork, we demonstrated that consistent and meaningful functional in-teraction patterns can be identified among relevant brain regionsfrom different brains when they watched different videos shots ofthe same semantic category. These reproducible and consistent func-tional interaction patterns are consistent with current neuroscienceknowledge, and might suggest the possible existence of a commonfunctional brain mechanism that is responsible for video messagecomprehension. For example, the results in Figs. 4–7 demonstratedthat the working memory system plays a key role in online informationprocessing for the perception and cognition of movie watching. This re-sult is in agreement with the existing working memory theory of moviewatching proposed in Dudai (2008). As another example, the inferredfunctional interaction patterns among the visual regions are reasonable,e.g., the interactions are stronger in advertisement and sports videosthan those in weather report videos. Our structural connectivity analysisresults from independent DTI data (Fig. 9) suggest the possible structuralunderpinnings of such consistent functional interaction patterns, as ithas been reported that there is close relationship between structuraland functional connectivities (Honey et al., 2009). Our extensive quan-titative comparison results demonstrated that the PC and GES algo-rithms outperform the traditionally used GCA method. Ourinterpretation is that Bayesian network methods consider all theROIs for inference simultaneously and do not rely on the temporal in-formation of noisy fMRI signals.
It should be noted that the directed graphs in Bayesian networksmethods used here are confined to acyclic graphs. Our rationale isthat this constraint could satisfy the causal condition (Glymour,2003; Spirtes et al., 2000) such that Markov factorization of the dis-tribution works, i.e., the joint distribution of the nodes in an acyclicgraphs is equal to the product of probability of individual node
conditional on their parent nodes. Though this constraint facilitatedthe identification of the consistent functional interaction patterns inthis paper, its possible limitations should be examined in the future,e.g., on complete sub-graphs of structurally-connected brain regions.Also, acyclic Bayes nets are a special case of graphical causal models,which include cyclic graphs, the linear versions of which satisfy ageneralization of the Markov property, and for which there are searchalgorithms (Richardson et al., 1997), e.g., algorithms that were ap-plied to fMRI data recently (Ramsey et al., 2011).
In the future, we plan to perform larger scale natural stimulusfMRI scans with more subjects and more categories of videoshots so that we can test and potentially replicated the findingsin this paper in larger samples. Also, additional brain regionssuch as attention and emotion systems that might have importantroles in video perception and cognition will be added into thefunctional interaction pattern analysis. Certainly, these additionalfunctional networks have to be mapped via task-based fMRI to en-sure accurate localization of the relevant brain regions. Also, moremethods for inferring functional network structures (Smith et al.,2011) will be compared in the future, and controls for multiple com-parisons (Li and Wang, 2009) should be considered. In the long-run,it would be very helpful to look into the functional interaction pat-terns among large-scale brain regions that cover the whole brainincluding both cortical and subcortical regions. However, accom-plishment of such a goal entails quantitative representation of acommon structural and functional human brain architecture inthe future. We envision that large-scale inference of consistentfunctional interaction patterns from natural stimulus fMRI can pro-vide fundamental insight into the functional architecture andworking mechanism of the brain, because the brain is naturally en-gaged in the perception and cognition of the video streams underan uncontrolled environment.
At the same time, the inferred consistent functional interactionpatterns from fMRI data reflect the brain's responses to naturalstimuli of video to a certain extent. In the future, it might be useful

998 J. Sun et al. / NeuroImage 61 (2012) 987–999
to apply those consistent functional interaction patterns to guidethe selection of low-level video features (Hu et al., 2010; Ji et al.,2011; Hu et al., 2012) and the construction of computationalmodels that are predictive of brain's responses. This fMRI-guidedvideo content representation could potentially significantly bridgethe semantic gaps in video analysis and retrieval field for years(Ji et al., 2012). Therefore, in summary, inference of consistentand meaningful functional interaction patterns from natural stimu-lus fMRI of video watching can only not contribute to the under-standing of human brain function, but also advance digital videorepresentation and analysis for human-centered video manage-ment and retrieval in the future.
Acknowledgments
T Liu was supported by the NIH Career Award (NIH EB 006878),NIH R01 HL087923-03S2 and The University of Georgia start-up re-search funding. J Zhang was supported by start-up funding fromYale University. X Hu was supported by the National Natural ScienceFoundation of China (61103061) and the Postdoctoral Foundation ofChina (20110490174). Y Liu was supported by Seessel PostdoctoralFellowship from Yale University. The computation was done withthe help from the Yale University Biomedical High Performance Com-puting Center, which was supported by the NIH grant RR19895. XHuang was supported by the China Scholarship Council-Yale WorldScholars Program. We would like to thank the anonymous reviewersfor their constructive comments that have significantly helped to im-prove this paper.
References
Bartels, Andreas, Zeki, Semir, 2004. Functional brain mapping during free viewing ofnatural scenes. Hum. Brain Mapp. 21, 75–85.
Bartels, Andreas, Zeki, Semir, 2005. Brain dynamics during natural viewing conditions—a new guide for mapping connectivity in vivo. NeuroImage 24, 339–349.
Behrens, T.E.J., Woolrich, M.W., Jenkinson, M., Johansen-Berg, H., Nunes, R.G., Clare, S.,Matthews, P.M., Brady, J.M., Smith, S.M., 2003. Characterization and propagation ofuncertainty in diffusion-weighted MR imaging. Magn. Reson. Med. 50, 1077–1088.
Chai, B., Walther, D.B., Beck, D.M., Fei-Fei, L., 2009. Exploring Functional Connectivity ofthe Human Brain using Multivariate Information Analysis. NIPS.
Cohen, Alexander L., Fair, Damien A., Dosenbach, Nico U.F., Miezin, Francis M., Dierker,Donna, Van Essen, David C., Schlaggar, Bradley L., Petersen, Steven E., 2008. Defin-ing functional areas in individual human brains using resting functional connectiv-ity MRI. NeuroImage 41 (1), 45–57.
Dudai, Y., 2008. Enslaving central executives: toward a brain theory of cinema. Projec-tions 2 (2), 12–24.
Faraco, C.C., Unsworth, N., Lagnely, J., Terry, D., Li, K., Zhang, D., Liu, T., Miller, L.S., 2011.Complex span tasks and hippocampal recruitment during working memory. Neu-roImage 55 (2), 773–787 (15).
Fernández, G., de Greiff, A., von Oertzen, J., Reuber, M., Lun, S., Klaver, P., Ruhlmann,J., Reul, J., Elger, C.E., 2001. Language mapping in less than 15 minutes: real-timefunctional MRI during routine clinical investigation. NeuroImage 14 (3),585–594.
Fox, M.D., Raichle, M.E., 2007. Spontaneous fluctuations in brain activity observed withfunctional magnetic resonance imaging. Nat. Rev. Neurosci. 8, 700–711.
Friston, K.J., 2009. Modalities, modes, and models in functional neuroimaging. Science326, 399–403.
Friston, K.J., Harrison, L., Penny, W., 2003. Dynamic causal modeling. NeuroImage 19,1273–1302.
Gerson, A.D., Parra, L.C., Sajda, P., 2006. Cortically coupled computer vision for rapidimage search. IEEE Trans. Neural. Syst. Rehabil. Eng. 14 (2), 174–179.
Glymour, C., 2003. The Mind's Arrows: Bayes Nets and Graphical Causal Models in Psy-chology. MIT Press, New York.
Golland, Y., Bentin, S., Gelbard, H., Benjamini, Y., Heller, R., Nir, Y., Hasson, U., Malach,R., 2007. Extrinsic and intrinsic systems in the posterior cortex of the humanbrain revealed during natural sensory stimulation. Cereb. Cortex 17 (4), 766–777(Apr).
Granger, C.W.J., 1969. Investigating causal relations by econometric models and cross-spectral methods. Econometrica 37, 414.
Hasson, U., Nir, Y., Levy, I., Fuhrmann, G., Malach, R., 2004. Intersubject synchronizationof cortical activity during natural vision. Science 303, 1634–1640.
Hasson, U., Malach, R., Heeger, D.J., 2010. Reliability of cortical activity during naturalstimulation. Trends Cogn. Sci. 14, 40–48.
Haxby, J.V., 2010. Multivariate analysis of fMRI data: high-dimension spaces for neuraland cognitive representations. In: Hanson, S.J., Bunzl, M. (Eds.), Foundational Is-sues of Neuroimaging. MIT Press, Boston, pp. 55–68.
Honey, C.J., Sporns, O., Cammoun, L., Gigandet, X., Thiran, J.P., Meuli, R., Hagmann, P.,2009. Predicting human resting-state functional connectivity from structural con-nectivity. PNAS 106 (6), 2035–2040.
Hu, X., Deng, F., Li, K., Zhang, T., Chen, H., Jiang, X., Lv, J., Zhu, D., Faraco, C., Zhang, D.,Mesbah, A., Han, J., Hua, X., Xie, L., Miller, S., Guo, L., Liu, T., 2010. Bridging low-level features and high-level semantics via fMRI brain imaging for video classifica-tion. Proceedings of the international conference on Multimedia. ACM, Firenze,Italy, pp. 451–460.
Hu, X., Li, K., Han, J., Hua, X., Guo, L., Liu, T., 2012. Bridging the semantic gap via func-tional brain imaging. IEEE Trans. Multimed. 14 (2), 314–325.
Ji, Xiang, Han, Junwei, Hu, Xintao, Li, Kaiming, Deng, Fan, Fang, Jun, Guo, Lei, Liu,Tianming, 2011. Retrieving video shots in semantic brain imaging space usingmanifold-ranking. Proceeding of 18th IEEE International Conference on Image Pro-cessing (ICIP). Brussels, pp. 352–355. Belgium, September 11–14, 2011.
Kay, K.N., Naselaris, T., Prenger, R.J., Gallant, J.L., 2008. Identifying natural images fromhuman brain activity. Nature 452, 352–355.
Laird, A.R., Eickhoff, S.B., Kurth, F., Fox, P.M., Uecker, A.M., Turner, J.A., Robinson, J.L.,Lancaster, J.L., Fox, P.T., 2009. ALE meta-analysis workflows via the brainmap data-base: progress towards a probabilistic functional brain atlas. Front. Neuroinfor-matics 3, 23.
Li, Junning, Wang, Z. Jane, 2009. Controlling the false discovery rate of the association/causality structure Learned with the PC algorithm. J. Mach. Learn. Res. 10, 475–514(Feb).
Li, K., Guo, L., Faraco, C., Zhu, D., Deng, D., Zhang, T., Jiang, X., Zhang, D., Chen, H., Hu, H.,L., Miller, S., Liu, T., 2010. Individualized ROI optimization via maximization ofgroup-wise consistency of structural and functional profiles. Adv. Neural Info.Proc. Syst. 23.
Li, Xiang, Lim, Chuwoo, Li, Kaiming, Guo, Lei, Liu, Tianming, 2011. Fiber-centeredGranger causality analysis. Med. Image Comput. Comput. Assist. Interv. 14 (Pt 2),251–259.
Logothetis, Nikos K., 2008. What we can do and what we cannot do with fMRI. Nature453, 869–878.
Lv, Jinglei, Guo, Lei, Hu, Xintao, Li, Kaiming, Liu, Tianming, 2011. Activated fibers: fiber-centered activation detection in task-based fMRI. Information processing in medi-cal imaging (IPMI), volume 6801/2011, pp. 574–587.
Meek, C., 1997. Graphical Models: Selecting Causal and Statistical Models. CarnegieMellon University, Pittsburgh, PA.
Meier, J.D., et al., 2008. Complex organization of human primary motor cortex: a high-resolution fMRI study. J. Neurophysiol. 100, 1800–1812.
Murre, J., Goebel, R., 1996. Connectionist models. In: Dijkstra, T., De Smedt, K. (Eds.),Computational Psycholinguistics. Taylor & Francis, London, pp. 49–81.
Neapolitan, Richard E., 2004. Learning Bayesian Networks. Prentice Hall.Nishimoto, Shinji, Vu, An T., Naselaris, Thomas, Benjamini, Yuval, Yu, Bin, Gallant, Jack
L., 2011. Reconstructing visual experiences from brain activity evoked by naturalmovies. Curr. Biol. 21 (19), 1641–1646 (22 September).
Passingham, R.E., Stephan, K.E., Kotter, R., 2002. The anatomical basis of functional lo-calization in the cortex. Nat. Rev. Neurosci. 3, 606–616.
Ramsey, J.D., Hanson, S.J., Hanson, C., Halchenko, Y.O., Poldrack, R.A., Glymour, C., 2010.Six problems for causal inference from fMRI. NeuroImage 49, 1545–1558.
Ramsey, J.D., Hanson, S.J., Glymour, C., 2011. Multi-subject search correctly identifiescausal connections and most causal directions in the DCM models of the Smith etal. simulation study. NeuroImage 58 (3), 838–848 (1 October).
Richardson, T.S., Spirtes, P., Glymour, C., 1997. A note on cyclic graphs and dynamicalfeedback systems. Proceedings of Artificial Intelligence and Statistics.
Roebroeck, A., Formisano, E., Goebel, R., 2005. Mapping directed influence over thebrain using Granger causality and fMRI. NeuroImage 25, 230–242.
Said, C.P., Moore, C.D., Engell, A.D., Todorov, A., Haxby, J.V., 2010. Distributed represen-tations of dynamic facial expressions in the superior temporal sulcus. J. Vis. 10,1–12.
Schneider, W., Eschman, A., Zuccolotto, A., 2002. E-Prime Reference Guide. PsychologySoftware Tools, Inc., Pittsburgh.
Schwarz, G., 1978. Estimating the dimension of a model. Ann. Stat. 6, 461–464.Seth, A.K., 2010. A MATLAB toolbox for Granger causal connectivity analysis. J. Neu-
rosci. Methods 186 (2), 262–273.Shapiro, R.M.H.a.L.G., 1992. Computer and Robot Vision. Addison-Wesley.Smith, S.M., Jenkinson, M., Woolrich, M.W., Beckmann, C.F., Behrens, T.E.J., Johansen-
Berg, H., Bannister, P.R., De Luca, M., Drobnjak, I., Flitney, D.E., Niazy, R.K.,Saunders, J., Vickers, J., Zhang, Y.Y., De Stefano, N., Brady, J.M., Matthews, P.M.,2004. Advances in functional and structural MR image analysis and implementa-tion as FSL. NeuroImage 23, S208–S219.
Smith, Stephen M., Miller, Karla L., Salimi-Khorshidi, Gholamrez, Webster, Matthew,Beckmann, Christian F., Nichols, Thomas E., Ramsey, Joseph D., Woolrich, MarkW., 2011. Network modelling methods for FMRI. NeuroImage 54, 875–891.
Spirtes, P., Glymour, C., 1991. An algorithm for fast recovery of sparse causal graphs.Soc. Sci. Comput. Rev. 9, 62–72.
Spirtes, P., Glymour, C., Scheines, R., 2000. Causation, Prediction and Search, 2nd ed.MIT Press, Cambridge, MA.
Storkey, Amos J., Simonotto, Enrico, Whalley, Heather, Lawrie, Stephen, Murray,Lawrence, McGonigle, David, 2007. Learning Structural Equation Models for fMRI.NIPS.
van de Ven, V., Bledowski, C., Prvulovic, D., Goebel, R., Formisano, E., Di Salle, F.,Linden, D.E., Esposito, F., 2008. Visual target modulation of functional connec-tivity networks revealed by self-organizing group ICA. Hum. Brain Mapp. 29,1450–1461.
van den Heuvel, Martijn, Mandl, Rene, Hulshoff Pol, Hilleke, 2008. Normalized cutgroup clustering of resting-state fMRI data. PLoS One 3 (4), e2001.

999J. Sun et al. / NeuroImage 61 (2012) 987–999
Walther, D., Caddigan, E., Fei-Fei, L., Beck, Diane M., 2009. Natural scene categoriesrevealed in distributed patterns of activity in the human brain. J. Neurosci. 29(34), 10573–10581.
Wang, Jun, Pohlmeyer, Eric, Hanna, Barbara, Jiang, Yu-Gang, Sajda, Paul, Chang,Shih-Fu, 2009. Brain state decoding for rapid image retrieval. ACM Multimed.945–954.
Woolrich, M.W., Jbabdi, S., Patenaude, B., Chappell, M., Makni, S., Behrens, T.,Beckmann, C., Jenkinson, M., Smith, S.M., 2009. Bayesian analysis of neuroimagingdata in FSL. NeuroImage 45, S173–S186.
Worsley, K.J., Marrett, S., Neelin, P., Vandal, A.C., Friston, K.J., Evans, A.C., 1996. A unifiedstatistical approach for determining significant voxels in images of cerebral activa-tion. Hum. Brain Mapp. 4, 58–73.
Xuan, B., Zhang, D., He, S., Chen, X., 2007. Larger stimuli are judged to last longer. J. Vis.7 (10), 1–5 (2).
Zhu, Dajiang, Li, Kaiming, Faraco, Carlos, Deng, Fan, Zhang, Degang, Jiang, Xi, Chen,Hanbo, Guo, Lei, Miller, Stephen, Liu, Tianming, 2012. Optimization of functionalbrain ROIs via maximization of consistency of structural connectivity profiles. Neu-roImage 59 (2), 1382–1393 (16).
Related Documents