METHODOLOGY ARTICLE Open Access Inference of sparse combinatorial-control networks from gene-expression data: a message passing approach Marc Bailly-Bechet 1,2 , Alfredo Braunstein 2,3 , Andrea Pagnani 4* , Martin Weigt 4 , Riccardo Zecchina 2,3 Abstract Background: Transcriptional gene regulation is one of the most important mechanisms in controlling many essential cellular processes, including cell development, cell-cycle control, and the cellular response to variations in environmental conditions. Genes are regulated by transcription factors and other genes/proteins via a complex interconnection network. Such regulatory links may be predicted using microarray expression data, but most regulation models suppose transcription factor independence, which leads to spurious links when many genes have highly correlated expression levels. Results: We propose a new algorithm to infer combinatorial control networks from gene-expression data. Based on a simple model of combinatorial gene regulation, it includes a message-passing approach which avoids explicit sampling over putative gene-regulatory networks. This algorithm is shown to recover the structure of a simple artificial cell-cycle network model for baker’s yeast. It is then applied to a large-scale yeast gene expression dataset in order to identify combinatorial regulations, and to a data set of direct medical interest, namely the Pleiotropic Drug Resistance (PDR) network. Conclusions: The algorithm we designed is able to recover biologically meaningful interactions, as shown by recent experimental results [1]. Moreover, new cases of combinatorial control are predicted, showing how simple models taking this phenomenon into account can lead to informative predictions and allow to extract more putative regulatory interactions from microarray databases. Background Transcriptional gene regulation is one of the key mechanisms in living cells; the control of gene expres- sion is crucial in processes as cell development, cell- cycle regulation, and response to external stimuli [2-5]. While the number of sequenced genomes is growing rapidly, it becomes more and more important to study genetic information on a higher level, i.e. to understand genes in their interdependence and to capture relations between regulatory genes, e.g. transcription factors (TF) or signaling proteins, and regulated genes via the recon- struction of gene-regulatory networks (GRN). Direct experimental approaches to understand gene regulation are money and time consuming. Therefore genome-scale regulatory networks are only known for E. coli [6] and for baker’s yeast, S. cerevisiae [7,8]. For higher organisms, the knowledge is restricted to inten- sively studied small functional modules, see e.g. [9,10]. Some characteristic features of these GRN are: • Directionality: Regulatory control is directed from regulators to regulated genes. • Sparsity: Each single gene is controlled by a limited number of other genes, which is small compared to the total gene content (and also to the total number of TFs) of an organism. • Combinatorial control: The expression of a gene may depend on the joint activity of various regula- tory proteins. The last item is crucial, and it is the topic of very active and diversified research [11-15]. One example of combina- torial control in yeast is the case of transcription factors * Correspondence: [email protected] 4 ISI Foundation Viale Settimio Severo 65, Villa Gualino, I-10133 Torino, Italy Bailly-Bechet et al. BMC Bioinformatics 2010, 11:355 http://www.biomedcentral.com/1471-2105/11/355 © 2010 Bailly-Bechet et al; licensee BioMed Central Ltd. This is an Open Access article distributed under the terms of the Creative Commons Attribution License (http://creativecommons.org/licenses/by/2.0), which permits unrestricted use, distribution, and reproduction in any medium, provided the original work is properly cited.

Welcome message from author
This document is posted to help you gain knowledge. Please leave a comment to let me know what you think about it! Share it to your friends and learn new things together.
Transcript

METHODOLOGY ARTICLE Open Access
Inference of sparse combinatorial-controlnetworks from gene-expression data: a messagepassing approachMarc Bailly-Bechet1,2, Alfredo Braunstein2,3, Andrea Pagnani4*, Martin Weigt4, Riccardo Zecchina2,3
Abstract
Background: Transcriptional gene regulation is one of the most important mechanisms in controlling manyessential cellular processes, including cell development, cell-cycle control, and the cellular response to variations inenvironmental conditions. Genes are regulated by transcription factors and other genes/proteins via a complexinterconnection network. Such regulatory links may be predicted using microarray expression data, but mostregulation models suppose transcription factor independence, which leads to spurious links when many geneshave highly correlated expression levels.
Results: We propose a new algorithm to infer combinatorial control networks from gene-expression data. Basedon a simple model of combinatorial gene regulation, it includes a message-passing approach which avoids explicitsampling over putative gene-regulatory networks. This algorithm is shown to recover the structure of a simpleartificial cell-cycle network model for baker’s yeast. It is then applied to a large-scale yeast gene expression datasetin order to identify combinatorial regulations, and to a data set of direct medical interest, namely the PleiotropicDrug Resistance (PDR) network.
Conclusions: The algorithm we designed is able to recover biologically meaningful interactions, as shown byrecent experimental results [1]. Moreover, new cases of combinatorial control are predicted, showing how simplemodels taking this phenomenon into account can lead to informative predictions and allow to extract moreputative regulatory interactions from microarray databases.
BackgroundTranscriptional gene regulation is one of the keymechanisms in living cells; the control of gene expres-sion is crucial in processes as cell development, cell-cycle regulation, and response to external stimuli [2-5].While the number of sequenced genomes is growingrapidly, it becomes more and more important to studygenetic information on a higher level, i.e. to understandgenes in their interdependence and to capture relationsbetween regulatory genes, e.g. transcription factors (TF)or signaling proteins, and regulated genes via the recon-struction of gene-regulatory networks (GRN).Direct experimental approaches to understand gene
regulation are money and time consuming. Thereforegenome-scale regulatory networks are only known for
E. coli [6] and for baker’s yeast, S. cerevisiae [7,8]. Forhigher organisms, the knowledge is restricted to inten-sively studied small functional modules, see e.g. [9,10].Some characteristic features of these GRN are:
• Directionality: Regulatory control is directed fromregulators to regulated genes.• Sparsity: Each single gene is controlled by a limitednumber of other genes, which is small compared tothe total gene content (and also to the total numberof TFs) of an organism.• Combinatorial control: The expression of a genemay depend on the joint activity of various regula-tory proteins.
The last item is crucial, and it is the topic of very activeand diversified research [11-15]. One example of combina-torial control in yeast is the case of transcription factors* Correspondence: [email protected]
4ISI Foundation Viale Settimio Severo 65, Villa Gualino, I-10133 Torino, Italy
Bailly-Bechet et al. BMC Bioinformatics 2010, 11:355http://www.biomedcentral.com/1471-2105/11/355
© 2010 Bailly-Bechet et al; licensee BioMed Central Ltd. This is an Open Access article distributed under the terms of the CreativeCommons Attribution License (http://creativecommons.org/licenses/by/2.0), which permits unrestricted use, distribution, andreproduction in any medium, provided the original work is properly cited.

Yrr1 and Yrm1, which compete for occupancy of the samepromoter sequence [16]. Many other types of combinedcontrol exist, such as the formation of hetero- or homo-dimers by TFs, or their post-translational modification byother proteins, which can entirely change their targets[17]. On the other hand, the hypothesis of sparsity hasbeen experimentally checked in well-studied organisms,where it has been observed that the number of TFs is lowcompared to the total number of genes.It is tempting to ask in how far GRN can be recon-
structed from gene-expression data. After the advent ofthe first generation of gene-expression microarrays, morethan a decade ago [18], we face an growing number ofnew high-throughput technologies capable of monitoringsimultaneous concentrations of thousands of cellularcomponents, in particular of mRNAs. The improvedquality of new generations of microarrays, the decreaseof their cost, and the amount of experiments accumu-lated so far call for the development of large-scale meth-ods of data analysis. Different approaches to modelinghave been proposed (see [19] for a recent review), from acoarse-grained description of co-regulated genes [20],classification methods [21,22], to Boolean descriptionswhere genes are described in terms of logical switcheswith only on/off states of activity [23] (and in particular[24] for the problem of inference of boolean networks),or considering more realistic systems of differential equa-tions describing the kinetic details [25]. Also for GRNreconstruction, approaches from different origins havebeen proposed: system control theory [26-29], Bayesianinference [30-33], information theory [34-36].Many limitations of the existing algorithms arise
directly from the quantity and quality of data:Microarrays are noisy averages over cell populations,
and the number of available arrays is normally muchsmaller than the number of probes measured in eacharray. Moreover, microarrays measure mRNA but notactive protein concentrations (which, for TFs, are theimportant parameters). Both may be uncorrelated in thecell [37]. But as proteomics data are even sparser thanmicroarray data, this is not an easy-to-solve problem,and many modeling approaches use mRNA concentra-tion alone. Another problem is the existence of combi-natorial control in gene regulation: Predicting suchcases is a NP-complete problem, and has thereforeeluded many approaches due to computational complex-ity, although some recent and interesting progress hasbeen achieved in [33].In this paper we introduce a novel algorithmic strat-
egy, based on message-passing techniques, to infer theregulatory network of an organism based solely on gen-ome-wide expression data, that specifically focuses oncombinatorial control. Our methodology is probabilisticand distributed, allowing for a fast exploration of the
space of networks. We apply the algorithm to threeyeast networks: (i) To test the efficiency of the algo-rithm, we first reconstruct an in-silico regulatory net-work for cell-cycle control from artificially generateddata [38]. (ii) We propose a large-scale reconstruction ofthe yeast regulatory network, using the classic Gaschmicroarray dataset [4], and analyze evidence for combi-natorial control. (iii) We use yeast expression data fromthe SMD database [39] to recover the regulations affect-ing genes involved in pleiotropic drug resistance (PDR).This network is now under intense scrutiny because ofthe more and more common nosocomial infections byCandida yeasts [40], which are able to resist to drugs byexporting them out of the cell. These resistancemechanisms are genetically regulated by the PDR net-work, which we aim to reconstruct. An detailed descrip-tion of the algorithm is given in the Methods section.An implementation in C can be downloaded at [41].
Results and DiscussionReconstructing an in-silico yeast cell-cycle networkBefore coming to biological data, we test our approachon the network model of Tang et al. [38] for cell cycleregulation in S. cerevisiae. The cell cycle is regulated bycyclins/CDK complexes, which sequentially activate andinhibit each other, creating a periodicity which is theclock of the cell. Recently sequential waves of transcrip-tional activation independent of cyclins activation havebeen discovered [42,43], but they are not taken intoaccount in the model. It anyway serves as an ideal start-ing point for the the performance analysis of our analysis,since the data generating network is explicitly known andcan be compared to our inferred regulatory interactions.In the model of [38], the regulatory network consists
of N = 11 genes/proteins, which are described by a bin-
ary state vector S t tNt Ns s= ∈( , ) { , }1 0 1 . Interactions
are encoded into a coupling matrix J∧ true
with entries
J j i
∧
→ ∈ −true
{ , , }1 0 1 in total the model of [38] contains 15
activating and 19 repressing links. The definition of thenetwork model is completed by the dynamical rule
s f Jit
it+ =
∧1 ( , )true
s (1)
with
f J
J s
J s
s J
it
j i jt
j
j i jt
j
it
j
( , )∧
=
>
<
→
→
→
∑∑
true
true
true
if
if
if
s
1 0
0 0
ii jt
jstrue =
⎧
⎨
⎪⎪⎪
⎩
⎪⎪⎪ ∑ 0.
(2)
Bailly-Bechet et al. BMC Bioinformatics 2010, 11:355http://www.biomedcentral.com/1471-2105/11/355
Page 2 of 12
Our aim here is to infer the regulatory links of thisnetwork model based on the different state vectors st.The above in-silico dynamics shows 7 fixed points, i.e.stationary states of the dynamics. Each fixed point canbe characterized by the size of its basin of attraction, i.e.by the number of initial random initial conditions thatend on it. Tang et al. argue that the fixed point with thelargest basin of attraction can be identified with the G1phase of the cell cycle. If one perturbs the stationary G1state by flipping the Cln3 cyclin to its active value, thenetwork passes trough 13 different states before reach-ing again G1. The authors of [38] argue that this trajec-tory robustly reproduces various aspects of the yeast cellcycle.We test our algorithm on two different data sets: (i)
the 13 states obtained by first flipping the Cln3 cyclin tothe active value, and letting the system evolve until sta-tionarity as described before, (ii) a larger dataset con-taining the configurations of data set (i) and additionallythe trajectories obtained by evolving all configurationsat Hamming distance 1 away from G1 (70 differentstates). In Additional File 1 we include both data setstogether with the links of the network.In order to deal with time series, Eq. (9) for the prior
probability distribution is transformed intoP st t( | , )0
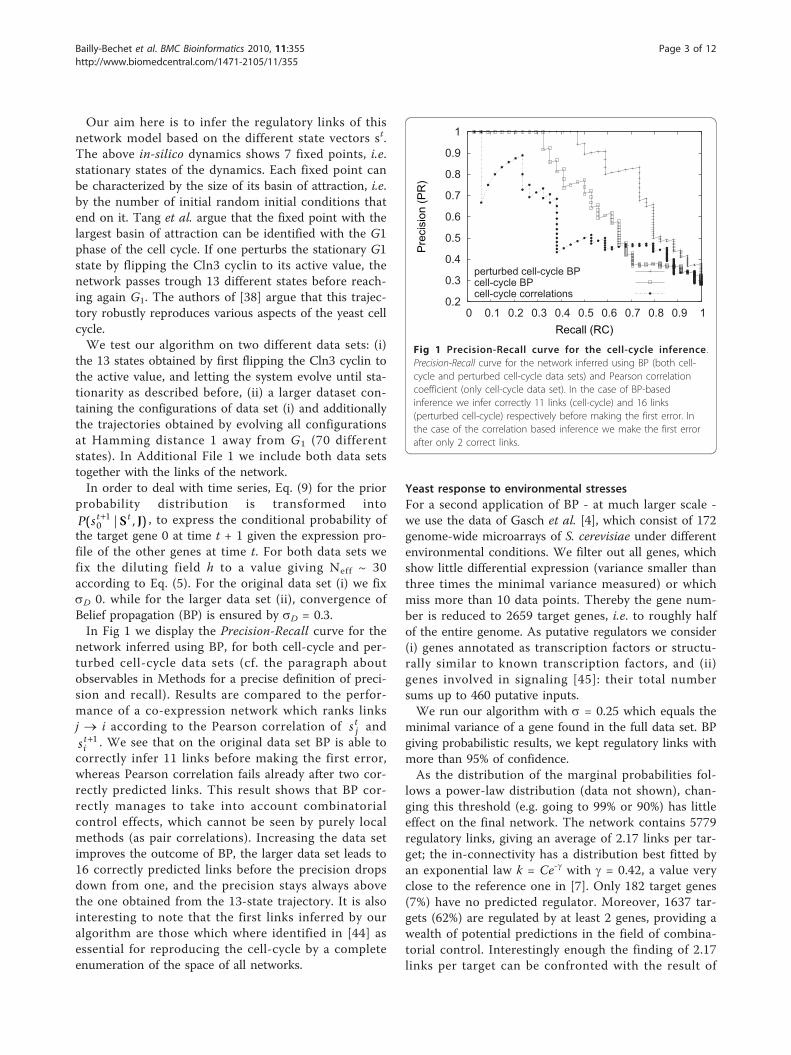
1+ S J , to express the conditional probability ofthe target gene 0 at time t + 1 given the expression pro-file of the other genes at time t. For both data sets wefix the diluting field h to a value giving Neff ~ 30according to Eq. (5). For the original data set (i) we fixsD 0. while for the larger data set (ii), convergence ofBelief propagation (BP) is ensured by sD = 0.3.In Fig 1 we display the Precision-Recall curve for the
network inferred using BP, for both cell-cycle and per-turbed cell-cycle data sets (cf. the paragraph aboutobservables in Methods for a precise definition of preci-sion and recall). Results are compared to the perfor-mance of a co-expression network which ranks linksj ® i according to the Pearson correlation of s j
t andsi
t+1 . We see that on the original data set BP is able tocorrectly infer 11 links before making the first error,whereas Pearson correlation fails already after two cor-rectly predicted links. This result shows that BP cor-rectly manages to take into account combinatorialcontrol effects, which cannot be seen by purely localmethods (as pair correlations). Increasing the data setimproves the outcome of BP, the larger data set leads to16 correctly predicted links before the precision dropsdown from one, and the precision stays always abovethe one obtained from the 13-state trajectory. It is alsointeresting to note that the first links inferred by ouralgorithm are those which where identified in [44] asessential for reproducing the cell-cycle by a completeenumeration of the space of all networks.
Yeast response to environmental stressesFor a second application of BP - at much larger scale -we use the data of Gasch et al. [4], which consist of 172genome-wide microarrays of S. cerevisiae under differentenvironmental conditions. We filter out all genes, whichshow little differential expression (variance smaller thanthree times the minimal variance measured) or whichmiss more than 10 data points. Thereby the gene num-ber is reduced to 2659 target genes, i.e. to roughly halfof the entire genome. As putative regulators we consider(i) genes annotated as transcription factors or structu-rally similar to known transcription factors, and (ii)genes involved in signaling [45]: their total numbersums up to 460 putative inputs.We run our algorithm with s = 0.25 which equals the
minimal variance of a gene found in the full data set. BPgiving probabilistic results, we kept regulatory links withmore than 95% of confidence.As the distribution of the marginal probabilities fol-
lows a power-law distribution (data not shown), chan-ging this threshold (e.g. going to 99% or 90%) has littleeffect on the final network. The network contains 5779regulatory links, giving an average of 2.17 links per tar-get; the in-connectivity has a distribution best fitted byan exponential law k = Ce-g with g = 0.42, a value veryclose to the reference one in [7]. Only 182 target genes(7%) have no predicted regulator. Moreover, 1637 tar-gets (62%) are regulated by at least 2 genes, providing awealth of potential predictions in the field of combina-torial control. Interestingly enough the finding of 2.17links per target can be confronted with the result of
0.2
0.3
0.4
0.5
0.6
0.7
0.8
0.9
1
0 0.1 0.2 0.3 0.4 0.5 0.6 0.7 0.8 0.9 1
Pre
cisi
on (P
R)
Recall (RC)
perturbed cell-cycle BPcell-cycle BPcell-cycle correlations
Fig 1 Precision-Recall curve for the cell-cycle inference.Precision-Recall curve for the network inferred using BP (both cell-cycle and perturbed cell-cycle data sets) and Pearson correlationcoefficient (only cell-cycle data set). In the case of BP-basedinference we infer correctly 11 links (cell-cycle) and 16 links(perturbed cell-cycle) respectively before making the first error. Inthe case of the correlation based inference we make the first errorafter only 2 correct links.
Bailly-Bechet et al. BMC Bioinformatics 2010, 11:355http://www.biomedcentral.com/1471-2105/11/355
Page 3 of 12

Balaji et. al. [46], based on a review of Chip-chip experi-ments, reporting a comparable average value of 2.9regulators per target.Combinatorial controlIn order to assess the relevance of the inferred network,we compare it first to a network based on pairwise cor-relations of expression data (co-expression network),which was constructed to have the same number oflinks as the BP network. Selected links are those ofhighest absolute value of the Pearson correlationbetween all input-output gene pairs. This is clearly anoversimplified model, but it allows to grasp the signifi-cant features of our model.One advantage of our algorithm is the explicit infer-
ence of combinatorial control mechanisms by multipletranscription factors. Indeed, the number of genes withmultiple regulators inferred using our methodology is1637, while it is only 612 in the case of the pairwise-cor-relation network. The average number of regulators perregulated gene (i.e. genes with at least one inferred regu-lator) in our BP case is 2.33, and has to be compared to2.9 from the work of Balaji et al. [46], and 6.17 for theco-expression network. It is interesting to note that BPresults are is closer to the experimental network ascompared to the co-expression one. This feature showshow, for the vast majority of target genes, our algorithmis able to describe the behavior of the gene by combin-ing few putative regulators.Another way of investigating combinatorial control is
to compare expression profiles of different regulators.Regulators having highly correlated expression profilescarry similar information to the target gene, whereasregulators having diverse profiles can be used to trans-mit much more information. This is directly incorpo-rated in our model: The sparsity term introduced inEq. 5 reduces the effect of potential regulators whoseexpression profiles are highly correlated. As a limitingexample let us consider two input genes with identicalexpression profiles, regulating one target gene. The spar-sity term will select randomly only one of the two, andidentify it as a regulator. In more realistic cases, no twogenes shows exactly the same expression, and only themost explanatory gene will be chosen as a regulator outof a set of highly correlated potential TFs.To quantify the independent information carried by
each regulator we compute, as a simple measure, oneminus the Pearson correlation coefficient between anytwo regulators of common target genes, see Fig 2. Onecan see that the information content is much higherusing our methodology than simply co-expression,because the latter tends to discover redundant infor-mation as displayed in the example of Fig 3 for thetarget gene YDR518W. This specific example alsoshows that secondary regulators found by BP tend to
correct discrepancies between the first regulator andthe target gene.Comparison to experimental TF binding dataIn order to further investigate the significance of the BPinferred network, we compare it to the experimentallyverified network presented by Balaji et al. [46], as char-acterized by 158 TFs, 4411 target genes, and 12974 reg-ulatory links between them. After filtering out geneswith low variance in the expression data set, the set ofanalyzed genes consists of 1919 targets, and 132 TFs.The number of experimentally verified links betweenthese genes reduces consequently to 5533. Again we runBP with s = 0.25, which equals the minimal variance ofa gene found in the full data set, and we keep regulatorylinks with more than 90% of confidence. The resultingnetwork has 6914 directed edges. Since these edgesdescribe logical implications between gene expressionlevels, it is not clear in how far they reflect physicalbinding between the TF related to the input gene, andthe promoter sequence of the target gene. It is easy toimagine that co-regulated genes are discovered as pre-dicting each other, or secondary targets in regulatorycascades are recognized as direct targets.In fact, the overlap with the experimentally verified
network is only 206 edges (the resulting network is pro-vided in Additional File 1). In order to give a statisticalassessment of this number, we compare it to the overlapwith a null model: We scramble the links in the BP net-work randomly preserving the in-degree of the inferrednetwork. The overlap with the null model is 176 ± 5.3edges, implying a z-score of 5.5, and a p-value of 1.18 ×10⁻⁸ (under the hypothesis that the distribution of
0
0.5
1
1.5
2
2.5
3
3.5
4
4.5
0 0.1 0.2 0.3 0.4 0.5 0.6 0.7 0.8 0.9 1
PD
F
Statistical independence
PearsonBP
Fig 2 Statistical independence Probability distribution. Plot ofthe statistical independence probability distribution (i.e. 1-|Pearsoncorrelation coefficient|) between pairs of TF regulatingcombinatorially the same target. Red curve: Co-expression network.Blue curve: BP network. Note that the statistical independence ismuch higher between TF inferred by BP, showing higherinformation content in combinatorial control.
Bailly-Bechet et al. BMC Bioinformatics 2010, 11:355http://www.biomedcentral.com/1471-2105/11/355
Page 4 of 12

overlaps is Gaussian with mean and variance given bythe null-model).To check the effect of an increased number of experi-
ments, we downloaded 1013 microarrays from the Stan-ford Microarray Database (SMD) [47]. Now 2614 targetgenes and 157 regulatory genes pass the statistical test,and the coverage of the experimental network increasesto 7635 links. With respect to Gasch’s data set, we use a6-fold higher number of arrays coming from differentexperiments, so we run BP at a higher noise value s =1.5. The resulting BP network has 16176 edges (aroundthree times the number of edges inferred with Gaschdataset alone). The overlap with the experimentally veri-fied network is 406 edges (the resulting network is pro-vided in Additional File 1). The overlap with the null-model is 314 ± 7.9 edges. Thus we find a z-score of11.6, and a p-value of 1.6 × 10⁻³¹. As a comparison, wedecided to analyze the same data set and the same setof 157 potential transcription factor with the ARACNesoftware [35]. To obtain statistically similar networks weset the data processing inequality threshold (a tunableparameter for controlling the overall number of edges inthe network) to 0.10: the resulting network has 19775directed edges (note that ARACNe produces undirected
links). The overlap with the experimentally verified net-work is of 480 edges (data in Addition Files). The over-lap with the null-mode is 424 ± 9.8 edges, with az-score of 5.7 and a p-value of 3.0 × 10⁻⁹.The sensible increase of statistical significance with
respect to the results using Gasch’s data is encouraging:It indicates in quantitative form, that larger microarraynumbers would allow for extracting substantially moreinformation about regulatory processes from geneexpression data.
Inference of the PDR networkWe finally apply our algorithm to a small dataset, totackle an issue of direct medical relevance: drug resis-tance among yeasts. S. cerevisiae is able to resist manydrugs, using an ensemble of genes connected in the“pleiotropic drug resistance” network. The basicmechanism is that these genes, regulated by the masterregulator PDR1, can export a broad range of substancesout of the cell - drugs included. This general feature hasbeen discovered in many organisms, and is considered ageneric and robust mechanism of drug resistance, frombacteria to yeasts [48]. The precise regulations acting inthis network are yet unknown, even if numerous works
Fig 3 An example of combinatorial control. Example for combinatorial control. Top: Three top inputs found by BP, with the predictioncompared to the real output. The left bars are training, the right test data. Bottom: Three most Pearson-correlated genes and correspondingprediction. Over- (under-) expression is depicted in red (blue).
Bailly-Bechet et al. BMC Bioinformatics 2010, 11:355http://www.biomedcentral.com/1471-2105/11/355
Page 5 of 12

have already uncovered a part of them [49-52]. Here wepropose to look for combinatorial regulations in thisnetwork, in order to better understand how transcrip-tion factors dedicated to drug resistance collaborate toensure cell survival in harsh conditions - that is, in thepresence of drugs. We run our algorithm on 40 genesknown to be involved in PDR processes as targets -selection was based on literature -, and use all 157 tran-scription factors annotated in the database YEASTRACT[53] as potential regulators. The expression data consistof 912 microarrays from SMD [47]. Due to its smallsize, the statistical properties of the inferred network(see Fig 4) are quite different from the global one : 265links were inferred at 95% confidence, giving a highaverage of 6.65 regulators per regulated gene. All targetgenes had at least one regulator; in fact only one had asingle regulator (the GIS1 ® STB5 couple).Again, as a comparison, we decided to analyze the
same data set ARACNe. To obtain statistically similarnetworks, we set the data processing inequality to 0.10:
247 links were inferred (note that ARACNe producesundirected links). Both networks are provided in Addi-tional File 1. As a first observation we note that 13 outof the 40 target gene appear not regulated in the ARA-CNe network. We can conclude that, at least in thiscase, ARACNe seems to produce links which are moreconcentrated to a smaller target number, with an in-degree of 9.14 ± 6.6 TF/regulated target (to be con-fronted with the BP results of 6.625 ± 3.6).Compared to the latest version of YEASTRACT, we
find the following numbers of overlapping links: 16 inour case (if we consider the TF ® target direction), and28 if the direction is not taken into account. ARACNe,which produces an undirected network, has only 22 over-lapping links. We also compared our findings with thenetwork presented in the work of Balaji et al. [46]: in theBP case we match 8 directed edges and 15 undirectedones, whereas ARACNe matches 9 undirected links.Moreover, a closer look to some predicted cases of
combinatorial control gives interesting insights into the
Fig 4 The PDR network inferred. The PDR regulatory network inferred by BP, comprising 157 TF and 40 targets. Targets are shown in grey.
Bailly-Bechet et al. BMC Bioinformatics 2010, 11:355http://www.biomedcentral.com/1471-2105/11/355
Page 6 of 12

biology of drug resistance. In particular, we find RPN4, atranscriptional regulator of the proteasome, regulated byboth PDR3 and YAP1. This interaction between drugresistance and the proteasome was already hinted inprevious works concerning global stress resistance [54],and was recently proved experimentally [1]. This case isnot found when running ARACNe on the same dataset,emphasizing the need for specially designed algorithmsin order to uncover new cases of combinatorial control.Another interesting case of combinatorial regulationpredicted in this analysis is the cross regulation of YAP1and RAS1 by PDR1, PDR3 and RPN4. This complexregulation could therefore link drug resistance and pro-teasome regulation to the processes of cell aging andproliferation, regulated by RAS1. However, to our bestknowledge there is no experimental evidence of thislink, which is to be confirmed.
ConclusionsIn this work, we have presented an effcient method forgenome-wide inference of regulatory networks, particu-larly designed to take into account cases of genetic com-binatorial control. The method, based on messagepassing, was tested on a small in-silico model for thecell-cycle regulation in yeast, and then applied to both alarge-scale and a small-scale dataset. The test shows theaccuracy of the method in case of informative data, andthe applications predict meaningful network structures.One relevant feature of our algorithm is its capability
of unveiling patterns of combinatorial control. Even ifthe model of gene-regulation we used (linear superposi-tion of inputs, followed by a non-linear function) is verysimple, it allows for regulators which account only forpart of the target expression, and which may be cor-rected for by other regulators under other conditions,cf. Fig 3.From the algorithmic point of view, our methodology
allows to explore combinatorially the full space of reg-ulatory networks while keeping the computational timeshort. The flexibility of the approach allows for inte-grating other type of data: to give an example, infor-mation about putative transcription factor binding sitesin the regulatory region of an output gene can beeasily integrated via a transcription-factor dependentdiluting field h.Finally, our method can be generalized to tackle a
variety of issues in the field of gene regulation inference.One possibility is to try to discover new regulators, by acorrective methodology, starting with a known regula-tory network and looking for the most relevant regula-tions to be added to this network. Another possibility isto use the information of combinatorial control in con-junction with the nature of the expression data toexplain which conditions allow which combinatorial
controls, opening the door to a wealth of genetic experi-ments and to a better understanding of the complexityof gene regulation.
MethodsData encodingGene expression data are encoded into a (N + 1) × Minput matrix of entries xi
, with i = 0.1,..., N and μ =1,..., M, where M is the number of experiments (arrays),N + 1 is the number of genes. The value xi
is a realnumber that quantifies the level of expression of gene iin sample μ; more precisely, xi
is the i log-ratio of theactual expression of the gene i and the expression of thesame gene in a reference condition. A negative (positive)value indicates the under- (over-)expression of gene ii sample μ with respect to the reference. Here we usethe vectorial notation x ≡ ={ } , ,x i Ni 0 to indicateexpression pattern μ.The task is the reconstruction of a network model
which may explain these data. Using a statistical-physicsanalogy, starting from some snapshots of the micro-scopic state of a system one tries to infer the energyfunction (Hamiltonian) governing its behavior. Note thatdue to the directed nature of gene networks this taskcan be formally factorized over regulated genes: we canask first, which genes have a regulatory influence ongene 0, and how they interact combinatorially. Then weask the same question for the regulators of gene 1, 2,...,N. To further simplify the possible influence other genescan have on target gene 0, we aim at a ternary classifica-tion of the influence of a gene i on 0:
J
i
i→ =−
0
1
0
if gene represses the expression of gene 0,
if genne does not regulate gene 0,
if gene activates the ex
i
i1 ppression of gene 0.
⎧⎨⎪
⎩⎪
This classification scheme is clearly an oversimplifica-tion with respect to biological reality, where a wholerange of positive and negative interaction strengths isexpected. On the other hand, given the peculiar restric-tion posed by the limited number of available expressionpatterns, having a simple but meaningful model reducesthe risk of overfitting and produces results which areeasier to interpret. Our algorithm can be easily extendedto include more than three values for the Ji®0; in mostcases we have analyzed this generalization does notincrease the predictive power.
A minimal deterministic model of gene regulationAs a minimal functional model, we assume that a genebecomes over-expressed if the joint influence of itsregulators is above some threshold -τ, and it isrepressed if the joint influence is below -τ. Hence,indicating the sign function by sign(·), and introducing
Bailly-Bechet et al. BMC Bioinformatics 2010, 11:355http://www.biomedcentral.com/1471-2105/11/355
Page 7 of 12

d x Ji ii
NJ = →=∑ 01
, we expect
sign sign sign( ) ( )x J x di i
i
N
0 0
1
= +⎛
⎝⎜⎜
⎞
⎠⎟⎟
≡ +→=∑ J (3)
to hold for as many expression patterns μ = 1,..., M aspossible. In this sense, each pattern poses a constrainton the coupling vector J = (J1®0,..., JN®0), and the pro-blem of finding a good candidate vector J can be under-stood as an instance of a constraint satisfaction problem.A cost function for this problem counts the number oferrors made in Equation (3),
0 0
1
( ) ( ( )),J J= − +=
∑Θ x dM
(4)
with Θ being the Heaviside step function. Obviouslythreshold functions form only a restricted functionspace. Functions like a XOR (or real-valued generaliza-tions of it) are not implementable in this way. However,due to the before-mentioned problems with data quan-tity and quality and the risk of overfitting we mustrestrict our model to a class of functions which is biolo-gically reasonable but does not depend on too manyparameters.The simplest prior biological knowledge we can
include at this point is the sparsity of regulatory net-works. In this sense, we are looking for coupling vectorsJ which are as sparse as possible, i.e. which contain asfew as possible non-zero elements. The number of theseentries is counted by
N Ji
i
M
eff ( ) | |,J = →=∑ 0
1
(5)
and will be incorporated into the cost function,
( ) ( ) ( )J J J= +0hN eff (6)
with h acting as a parameter controlling the relativeimportance of the two contributions: A small h willfavor couplings of low ℋ0, a high h will force couplingsto be sparse at the cost of possibly not satisfying somepattern constraints. We introduce a formal inverse tem-perature b and the corresponding Gibbs distribution
P hNGibbs eff( ) exp( ),J ∝ − −0 (7)
with h h= . At the end we are interested in the low-b case where the Gibbs distribution concentrates inlow-cost configurations.
A minimal stochastic model of gene regulationThe previous deterministic scheme is appealing for itssimplicity but does not take into account the noise pre-sent in real data. We will assume first that the actualexpression value of gene 0 is given as the sum of themeasured value x0
and a Gaussian noise h of zeromean and variance s2:
sign sign( ) ( ).x d0 + = +J (8)
Denoting a centered Gaussian of variance s2 by 0, ( ) , we can write the probability of measuring agiven value x0
for variable 0 as
P x d x d
x d
( | , ) ( ) [( )( )]
( )
0 0
12
02
x
erfc
J
J
J∝ + +
= −+
∞
∞
∫ Θ
⎛
⎝
⎜⎜⎜
⎞
⎠
⎟⎟⎟.
(9)
For s ® 0 we go back to the deterministic model (3),s > 0 smoothes the Heaviside function into a sigmoidalfunction. The noise level that we estimate from data isencoded in the value of s.
Bayesian InferenceWe turn (9) into a probabilistic Bayesian framework[55]. Assuming statistical independence of xμ for μ =1,..., N, Bayes theorem allows to write the posteriorprobability of a coupling vector J:
P P x d PN
M
( |{ } ) ( | ) ( ), ,J JJx
=
=
∝ ∏1 0
1
(10)
As a prior for the coupling we use the distribution P(J) ∝ exp{-hNeff(J)} favoring (sparse) connections withsmall Neff. Unsurprisingly, for s ® 0 one recovers Equa-tion (7).From this point of view the choice of the prior is ana-
logous L1 regularization method [56], but on a discretevector of elements in {±1, 0}, i.e. in a case where the L1
regularization is equivalent to the L0 one.
Belief PropagationThe belief propagation (BP) algorithm is exact on tree-like graphical models, but it has been extensively usedas an heuristic procedure to solve problems defined onsparse graphs [57,58]. Recently, the same approach hasbeen shown to be a good approximation also for pro-blems with dense graph structure [59-61]. BP is an itera-tive algorithm for estimating marginal probability
Bailly-Bechet et al. BMC Bioinformatics 2010, 11:355http://www.biomedcentral.com/1471-2105/11/355
Page 8 of 12

distributions. It works by locally exchanging messages,until global consistence is achieved. The messages sentbetween variable nodes i (couplings) and function nodesμ (constraints) are:
• The probability rμ®i(Ji®0) that constraint μ forcesvariable i to assume value Ji ® 0.• The probability Pi®μ(Ji®0) that variable i takesvalue Ji®0 in the absence of constraint μ.
The BP equations establish an approximate relationbetween these messages,
P J e Ji ih J
i ii
→ →−
→ →≠
∝ → ∏
( ) ( ),| |0 0
0(11)
→ → → →≠
∝→ ≠
∑ ∏i i
J
N
j j
j i
J P x J
j j i
( ) ( | ,. ) ( ).{ }|
0 0 0
0
x J (12)
Proportionality constants are easily determined bynormalization. The algorithm starts from randomly initi-alized messages and stops when convergence is reached.Our convergence criterion requires the differencebetween all message at time t and the correspondingones at time t - 1 to be less than a pre-defined threshold(10-8 in our simulations). Upon convergence marginalprobability distributions are given by
P J e Ji ih J
i i
Mi( ) ( ).| |
→−
→ →=
∝ ∏0 0
1
(13)
From the point of view of algorithmic complexity,Eq. (12) still contains a sum over (3N) terms, so thedirect implementation of BP is not feasible for largesystems. This problem can be solved approximately:Eq. (12) can be understood as the average ofP x( | ,. )0
x J over N - 1 independent random variables{Jj®0|j ≠ i}, with P x( | ,. )0
x J depending on the cou-pling vector only via the sum J xj jj →∑ 0
. For a suffi-ciently large system we can use the central limittheorem and approximate the exponential sum by asingle Gaussian integration,
→ → →−∞
∞∝ +
→ →∫i i h i iJ dy y P x y J xi i
( ) ( ) ( | ),0 0 0 Δ (14)
With
h x Ji j j j
j i
→ → →≠
= ⟨ ⟩∑ 0 (15)
Δ
→ → → → →≠
= ⟨ ⟩ − ⟨ ⟩∑i j j j j j
j i
x J J20
20
22
( ). (16)
The notation ⟨·⟩j®μ stands for the average overPj®μ(Jj®0).Of course the central limit theorem is meant to be
valid in the limit of N ® ∞. In practice the Gaussianapproximation produces the same results as the exactcomputation of Eq. (12) already for N ~ 10 (where theexact computation is clearly feasible).
Computational complexityBy means of the Gaussian approximation, the complex-ity of Eq. (12) is reduced from (3N) to (N), andthat of the overall iteration to (MN). The apparentcomplexity (MN2) of updating M N messages in time (N) can be reduced to (MN). by a simple trick:The sums in Eqs. (16) can be calculated over all j oncefor each μ, so only the contribution of i has to beremoved in the update of rμ®i for each i. This allows tomake the single update step in constant time. A preciseestimate of the overall complexity of the algorithmwould require to control the scaling of the number ofiterations needed for convergence. A theoretical analysisof BP convergence times in a general setting remainselusive. Some recent progress for the simpler matchingproblem can be found in [62]. In all the simulations pre-sented in this work, convergence is always reached inless then 50 iterations.It would be interesting to compare the efficiency of
our algorithm with the computational strategy proposedin [33], based on a Monte Carlo Markov Chain(MCMC) sampler over the model space. In our experi-ence, however, MCMC methods have in general someintrinsically associated problems, mainly due to the factthat the convergence (or mixing) time is hard to assessand often is exponential.
ObservablesMarginals - We do not aim at constructing a singlehigh-scoring coupling vector J like in a max-likelihoodapproach. Depending on the shape of the probabilityspace, this vector might be very different from the oneactually generating the data. We are instead interestedin characterizing the ensemble of all high-scoring vec-tors, or more precisely in the marginal probabilitiesP J Pi i J j j i
( ) ( |{ }){ }|
→ =→ ≠
∑00
J x , which tell us how fre-
quently the coupling from i to 0 takes value Ji®0. Wecan therefore base a global ranking of all potential cou-plings i ® 0 on the probabilities 1 - Pi(Ji®0 = 0) ofbeing non-zero.
Bailly-Bechet et al. BMC Bioinformatics 2010, 11:355http://www.biomedcentral.com/1471-2105/11/355
Page 9 of 12
When dealing with an artificial data set generated by aknown coupling vector Jtrue, we can measure the simi-larity of our inference result J with the true coupling.To this aim we define
J J
J J
i i
i i
→ →
→ →
= =
≠ =0 0
0 0
0 0
0 0
true
true
true negative (TN),
fal
, :
, : sse negative (FN),
false positive (FP),trueJ J
J
i i
i
→ →= ≠0 00 0, :
→→ →≠ ≠0 00 0true true positive (TP)., :J i
(17)
The objective of inference is predicting a fraction ofall couplings with high precision, i.e. to have an as highas possible number of TP with a low number of FP. Thequality of the inference can be accounted for by con-fronting recall (or sensitivity) RC = NTP /(NTP + NFN)and precision (or specificity) PR = NTP /(NTP + NFP).The recall describes the fraction of all existing non-zerocouplings which are recovered by the algorithm, whereasthe precision tells us the fraction of all predicted linksbeing actually present in the data generator.Entropy - An interesting quantity to measure is the
entropy, i.e. the logarithm of the number of high-scoringcoupling vectors compatible with our data set. WithinBP, it can be approximated by the Bethe-entropy
S S M Si
i
NM
= − −==∑∑
( )111
(18)
where Sμ = -∑J Pμ(J) ln Pμ(J), and Si = -∑Ji Pi(Ji) ln Pi(Ji), and Pμ(J) is defined as
P P x P Ji i
i
( ) ( | ,. ) ( ),J J∝ → →∏0 0x (19)
i.e. it takes into account the contribution of a singleconstraint to the probability distribution of J.
Parameter fixing and zero-entropy criterionThe diluting field h is the conjugate variable of the num-ber of effective link N Jeff ( )
, so we can equivalently fix
one of the two quantities. One can decide to fix the num-ber of effective links, and thus the size of the searchedgene signature, and to choose h accordingly. To find thecorrect value of h we apply a cooling procedure where,after each interaction of the BP equations step, weincrease (resp. decrease) h depending on whether theeffective number of link is higher (resp. lower) than thedesired value. Since the true number of relevant genes isan unknown quantity, the chosen value for N Jeff ( )
, itself
is a free parameter. In practice, in the cooling procedureof the h field, we monitor the value of the entropy andwe stop the iteration when as soon as it becomes lower
then zero, i.e. at the point where we are able to restrictthe of the number of possible solution to our problem toa sub-exponential number (remember that the entropyhere indicates the logarithm of the number of solutions).Upon a further increase of h the entropy becomes nega-tive, and no zero energy solution is found at that value ofthe dilution parameter h.In all our simulations we have taken the limit b ® ∞.
Additional material
Additional file 1: All files are in additional file 1.
AcknowledgementsThis work was partially funded by Microsoft TCI. The authors want to thankM. Vergassola, F. Devaux, and G. Lelandais, who helped a lot in theinterpretation of the PDR results.
Author details1Université Lyon 1; CNRS UMR 5558, Laboratoire de Biométrie et BiologieEvolutive, F-69622, Villeurbanne, France. 2Politecnico di Torino, C.so Ducadegli Abruzzi 24, I-10129 Torino, Italy. 3Human Genetics Foundation, ViaNizza 230, I-10126 Torino, Italy. 4ISI Foundation Viale Settimio Severo 65, VillaGualino, I-10133 Torino, Italy.
Authors’ contributionsAll authors equally contributed to this work. All authors read and approvedthe final manuscript.
Received: 30 October 2009 Accepted: 29 June 2010Published: 29 June 2010
References1. Salin H, Fardeau V, Piccini E, Lelandais G, Tanty V, Lemoine S, Jacq C,
Devaux F: Structure and properties of transcriptional networks drivingselenite stress response in yeasts. BMC Genomics 2008, 9:333.
2. DeRisi JL, Iyer VR, Brown PO: Exploring the Metabolic and Genetic Controlof Gene Expression on a Genomic Scale. Science 1997, 278(5338):680-686[http://www.sciencemag.org/cgi/content/abstract/278/5338/680].
3. Spellman PT, Sherlock G, Zhang MQ, Iyer VR, Anders K, Eisen MB, Brown PO,Botstein D, Futcher B: Comprehensive Identification of Cell Cycle-regulated Genes of the Yeast Saccharomyces cerevisiae by MicroarrayHybridization. Mol Biol Cell 1998, 9(12):3273-3297 [http://www.molbiolcell.org/cgi/content/abstract/9/12/3273].
4. Gasch A, et al: Genomic Expression Programs in the Response of YeastCells to Environmental Changes. Mol Biol Cell 2000, 11(12):4241-4257[http://www.molbiolcell.org/cgi/content/abstract/11/12/4241].
5. Causton HC, Ren B, Koh SS, Harbison CT, Kanin E, Jennings EG, Lee TI,True HL, Lander ES, Young RA: Remodeling of Yeast Genome Expressionin Response to Environmental Changes. Mol Biol Cell 2001, 12(2):323-337[http://www.molbiolcell.org/cgi/content/abstract/12/2/323].
6. Shen-Orr S, Milo R, Mangan S, Alon U: Network motifs in thetranscriptional regulation network of Escherichia coli. Nat Genet 2002,31:64-68.
7. Guelzim N, Bottani S, Bourgine P, Kepes F: Topological and causalstructure of the yeast transcriptional regulatory network. Nat Genet 2002,31:60-63.
8. Milo R, Shen-Orr S, Itzkovitz S, Kashtan N, Chklovskii D, Alon U: NetworkMotifs: Simple Building Blocks of Complex Networks. Science 2002,298(5594):824-827 [http://www.sciencemag.org/cgi/content/abstract/298/5594/824].
9. Davidson EH, et al: A Genomic Regulatory Network for Development.Science 2002, 295(5560):1669-1678 [http://www.sciencemag.org/cgi/content/abstract/295/5560/1669].
Bailly-Bechet et al. BMC Bioinformatics 2010, 11:355http://www.biomedcentral.com/1471-2105/11/355
Page 10 of 12

10. Albert R, Othmer H: The topology of the regulatory interactions predictsthe expression pattern of the segment polarity genes in Drosophilamelanogaster. Journal of Theoretical Biology 2003, 223:1-18.
11. Aguilar D, Oliva B: Topological comparison of methods for predictingtranscriptional cooperativity in yeast. BMC Genomics 2008, 9:137.
12. Banerjee N, Zhang MQ: Identifying cooperativity among transcriptionfactors controlling the cell cycle in yeast. Nucleic Acids Res 2003,31(23):7024-7031.
13. Chang YH, Wang YC, Chen BS: Identification of transcription factorcooperativity via stochastic system model. Bioinformatics 2006,22(18):2276-2282.
14. Nagamine N, Kawada Y, Sakakibara Y: Identifying cooperativetranscriptional regulations using protein-protein interactions. NucleicAcids Res 2005, 33(15):4828-4837.
15. Tsai HK, Lu HHS, Li WH: Statistical methods for identifying yeast cell cycletranscription factors. Proc Natl Acad Sci USA 2005, 102(38):13532-13537.
16. Lucau-Danila A, Delaveau T, Lelandais G, Devaux F, Jacq C: Competitivepromoter occupancy by two yeast paralogous transcription factorscontrolling the multidrug resistance phenomenon. J Biol Chem 2003,278(52):52641-52650.
17. Benayoun BA, Veitia RA: A post-translational modification code fortranscription factors: sorting through a sea of signals. Trends Cell Biol2009, 19(5):189-197.
18. Schena M, Shalon D, Davis RW, Brown PO: Quantitative Monitoring ofGene Expression Patterns with a Complementary DNA Microarray.Science 1995, 270(5235):467-470 [http://www.sciencemag.org/cgi/content/abstract/270/5235/467].
19. Li H, Xuan J, Wang Y, Zhan M: Inferring regulatory networks. Front Biosci2008, 13:263-275.
20. Eisen MB, Spellman PT, Brown PO, Botstein D: Cluster analysis and displayof genome-wide expression patterns. Proceedings of the National Academyof Sciences 1998, 95(25):14863-14868 [http://www.pnas.org/cgi/content/abstract/95/25/14863].
21. Ernst J, Beg QK, Kay KA, Balázsi G, Oltvai ZN, Bar-Joseph Z: A semi-supervised method for predicting transcription factor-gene interactionsin Escherichia coli. PLoS Comput Biol 2008, 4(3):e1000044.
22. Mordelet F, Vert JP: SIRENE: supervised inference of regulatory networks.Bioinformatics 2008, 24(16):i76-82 [http://bioinformatics.oxfordjournals.org/cgi/content/abstract/24/16/i76].
23. Liang S, Fuhrman S, Somogyi R: Reveal, a general reverse engineeringalgorithm for inference of genetic network architectures. PacificSymposium on Biocomputing 1998, 3:18-29.
24. Liu W, Lähdesmäki H, Dougherty E, Shmulevich I: Inference of BooleanNetworks Using Sensitivity Regularization. EURASIP Journal onBioinformatics and Systems Biology 2008, 2008.
25. Arkin A, Ross J, McAdams HH: Stochastic Kinetic Analysis ofDevelopmental Pathway Bifurcation in Phage lambda-InfectedEscherichia coli Cells. Genetics 1998, 149(4):1633-1648 [http://www.genetics.org/cgi/content/abstract/149/4/1633].
26. D’Haeseleer P, Liang S, Somogyi R: Genetic network inference: from co-expression clustering to reverse engineering. Bioinformatics 2000,16(8):707-726 [http://bioinformatics.oxfordjournals.org/cgi/content/abstract/16/8/707].
27. Yeung MKS, Tegner J, Collins JJ: Reverse engineering gene networksusing singular value decomposition and robust regression. Proceedings ofthe National Academy of Sciences 2002, 99(9):6163-6168 [http://www.pnas.org/cgi/content/abstract/99/9/6163].
28. Gardner TS, di Bernardo D, Lorenz D, Collins JJ: Inferring Genetic Networksand Identifying Compound Mode of Action via Expression Profiling.Science 2003, 301(5629):102-105 [http://www.sciencemag.org/cgi/content/abstract/301/5629/102].
29. Tegner J, Yeung MKS, Hasty J, Collins JJ: Reverse engineering genenetworks: Integrating genetic perturbations with dynamical modeling.Proceedings of the National Academy of Sciences 2003, 100(10):5944-5949[http://www.pnas.org/cgi/content/abstract/100/10/5944].
30. Hartemink A, Gifford D, Jaakkola T, Young R: Using graphical models andgenomic expression data to statistically validate models of geneticregulatory networks. Pacific Symposium on Biocomputing 2001, 6:422-433.
31. Pe’er D, Regev A, Elidan G, Friedman N: Inferring subnetworks fromperturbed expression profiles. Bioinformatics 2001, 17(suppl-1):S215-224
[http://bioinformatics.oxfordjournals.org/cgi/content/abstract/17/suppl_1/S215].
32. Wang K, Nemenman I, Banerjee N, Margolin A, Califano A: Genome-widediscovery of modulators of transcriptional interactions in human Blymphocytes. Research in Computational Molecular Biology Springer Berlin/Heidelberg 2006, 3909:348-362, [doi:10.1007/11732990].
33. Mukherjee S, Pelech S, Neve RM, Kuo WL, Ziyad S, Spellman PT, Gray JW,Speed TP: Sparse combinatorial inference with an application in cancerbiology. Bioinformatics 2009, 25(2):265-271 [http://bioinformatics.oxfordjournals.org/cgi/content/abstract/25/2/265].
34. Basso K, Margolin AA, Stolovitzky G, Klein U, Dalla-Favera R, Califano A:Reverse engineering of regulatory networks in human B cells. Nat Genet2005, 37(4):382-390.
35. Margolin A, Nemenman I, Basso K, Wiggins C, Stolovitzky G, Favera R,Califano A: ARACNE: An Algorithm for the Reconstruction of GeneRegulatory Networks in a Mammalian Cellular Context. BMCBioinformatics 2006, 7(Suppl 1):S7.
36. Santhanam N, Wainwright M: Information-theoretic limits of selectingbinary graphical models in high dimensions. Tech rep, Arxiv preprint 2008.
37. Gygi SP, Rochon Y, Franza BR, Aebersold R: Correlation between proteinand mRNA abundance in yeast. Mol Cell Biol 1999, 19(3):1720-1730.
38. Li F, Long T, Lu Y, Ouyang Q, Tang C: The yeast cell-cycle network isrobustly designed. Proceedings of the National Academy of Sciences 2004,101(14):4781-4786 [http://www.pnas.org/cgi/content/abstract/101/14/4781].
39. Sherlock G, Hernandez-Boussard T, Kasarskis A, Binkley G, Matese JC,Dwight SS, Kaloper M, Weng S, Jin H, Ball CA, Eisen MB, Spellman PT,Brown PO, Botstein D, Cherry JM: The Stanford Microarray Database.Nucleic Acids Res 2001, 29:152-155.
40. Trofa D, Gàcser A, Nosanchuk JD: Candida parapsilosis, an emergingfungal pathogen. Clin Microbiol Rev 2008, 21(4):606-625.
41. Diluted Perceptron Algorithm. [http://www.polito.it/cmp/code/dilperc].42. Kovacs LAS, Orlando DA, Haase SB: Transcription networks and cyclin/
CDKs: the yin and yang of cell cycle oscillators. Cell Cycle 2008,7(17):2626-2629.
43. Orlando DA, Lin CY, Bernard A, Wang JY, Socolar JES, Iversen ES,Hartemink AJ, Haase SB: Global control of cell-cycle transcription bycoupled CDK and network oscillators. Nature 2008, 453(7197):944-947.
44. Lau KY, Ganguli S, Tang C: Function constrains network architecture anddynamics: A case study on the yeast cell cycle Boolean network. PhysicalReview E (Statistical, Nonlinear, and Soft Matter Physics) 2007, 75(5):051907[http://link.aps.org/abstract/PRE/v75/e051907].
45. Segal E, Shapira M, Regev A, Pe’er D, Botstein D, Koller D, Friedman N:Module networks: identifying regulatory modules and their condition-specific regulators from gene expression data. Nat Genet 2003,34(2):166-176.
46. Balaji S, Madan Babu M, Lakshminarayan M, Luscombe N, Aravind L:Comprehensive Analysis of Combinatorial Regulation using theTranscriptional Regulatory Network of Yeast. J Mol Biol 2006, 360:213-227.
47. Stanford Microarray Database. [http://smd.stanford.edu/].48. Tal N, Schuldiner S: A coordinated network of transporters with
overlapping specificities provides a robust survival strategy. Proc NatlAcad Sci USA 2009, 106(22):9051-9056.
49. Banerjee D, Lelandais G, Shukla S, Mukhopadhyay G, Jacq C, Devaux F,Prasad R: Responses of pathogenic and nonpathogenic yeast species tosteroids reveal the functioning and evolution of multidrug resistancetranscriptional networks. Eukaryot Cell 2008, 7:68-77.
50. Crom SL, Devaux F, Marc P, Zhang X, Moye-Rowley WS, Jacq C: Newinsights into the pleiotropic drug resistance network from genome-widecharacterization of the YRR1 transcription factor regulation system. MolCell Biol 2002, 22(8):2642-2649.
51. Fardeau V, Lelandais G, Oldfield A, Salin H, Lemoine S, Garcia M, Tanty V,Crom SL, Jacq C, Devaux F: The central role of PDR1 in the foundation ofyeast drug resistance. J Biol Chem 2007, 282(7):5063-5074.
52. Hikkel I, Lucau-Danila A, Delaveau T, Marc P, Devaux F, Jacq C: A generalstrategy to uncover transcription factor properties identifies a newregulator of drug resistance in yeast. J Biol Chem 2003,278(13):11427-11432.
53. Teixeira MC, Monteiro P, Jain P, Tenreiro S, Fernandes AR, Mira NP,Alenquer M, Freitas AT, Oliveira AL, Sá-Correia I: The YEASTRACT database:a tool for the analysis of transcription regulatory associations in
Bailly-Bechet et al. BMC Bioinformatics 2010, 11:355http://www.biomedcentral.com/1471-2105/11/355
Page 11 of 12

Saccharomyces cerevisiae. Nucleic Acids Res 2006, , 34 Database:D446-D451.
54. Wolf DH, Hilt W: The proteasome: a proteolytic nanomachine of cellregulation and waste disposal. Biochim Biophys Acta 2004, 1695(1-3):19-31.
55. Mackay DJC: Information Theory, Inference & Learning Algorithms CambridgeUniversity Press 2002 [http://www.inference.phy.cam.ac.uk/mackay/itila/book.html].
56. Tibshirani R: Regression Shrinkage and Selection via the Lasso. Journal ofthe Royal Statistical Society (Series B) 1996, 58:267-288.
57. Yedidia JS, Freeman W, Weiss Y: Generalized belief propagation. Advancesin Neural Information Processing Systems (NIPS) 13, Denver, CO press M 2001,772-778.
58. Kschischang FR, Frey BJ, Loeliger HA: Factor graphs and the sum-productalgorithm. Information Theory, IEEE Transactions on 2001, 47(2):498-519[http://ieeexplore.ieee.org/xpls/abs_all.jsp?arnumber=910572].
59. Kabashima Y: A CDMA multiuser detection algorithm on the basis ofbelief propagation. Journal of Physics A: Mathematical and General 2003,36(43):11111-11121.
60. Braunstein A, Zecchina R: Learning by message-passing in networks ofdiscrete synapses. Phys Rev Lett 2005, 96:030201.
61. Pagnani A, Tria F, Weigt M: Classification and sparse-signature extractionfrom gene-expression data. Journal of Statistical Mechanics: Theory andExperiment 2009, 2009(05):P05001 [http://stacks.iop.org/1742-5468/2009/P05001], (22pp).
62. Bayati M, Borgs C, Chayes J, Zecchina R: On the exactness of the cavitymethod for weighted b-matchings on arbitrary graphs and its relationto linear programs. Journal of Statistical Mechanics: Theory and Experiment2008, 2008(06):L06001 [http://stacks.iop.org/1742-5468/2008/L06001],(10pp).
doi:10.1186/1471-2105-11-355Cite this article as: Bailly-Bechet et al.: Inference of sparse combinatorial-control networks from gene-expression data: a message passingapproach. BMC Bioinformatics 2010 11:355.
Submit your next manuscript to BioMed Centraland take full advantage of:
• Convenient online submission
• Thorough peer review
• No space constraints or color figure charges
• Immediate publication on acceptance
• Inclusion in PubMed, CAS, Scopus and Google Scholar
• Research which is freely available for redistribution
Submit your manuscript at www.biomedcentral.com/submit
Bailly-Bechet et al. BMC Bioinformatics 2010, 11:355http://www.biomedcentral.com/1471-2105/11/355
Page 12 of 12
Related Documents